Embed Size (px)
Citation preview

1
Dollery, Brian and Worthington, Andrew (1996) THE EMPIRICAL ANALYSIS OF
FISCAL ILLUSION. Journal of Economic Surveys 10(3):pp. 261-297.
Copyright Blackwell Publishing
THE EMPIRICAL ANALYSIS OF FISCAL ILLUSION
BRIAN E. DOLLERY
ANDREW C. WORTHINGTON
Department of Economics
University of New England
Armidale NSW 2351, Australia
Abstract. This paper examines the empirical analysis of the five main hypotheses subsumed under the
generic term fiscal illusion. After placing these hypotheses within a common theoretical framework, the
paper attempts to evaluate empirical research into the revenue-complexity hypothesis, the revenue-
elasticity hypothesis, the flypaper effect, renter illusion, and debt illusion.
Keywords. Revenue-complexity; revenue-elasticity; flypaper effect; renter illusion; debt illusion; fiscal
illusion.
1. Introduction
The 1990s have been characterised by an international trend towards greater accountability in
government. All levels of government in a number of countries are now obliged to display
transparency in policy formulation and implementation, which includes the full and frank disclosure
of financial transactions. This focus on accountability means that governments must present a clear
and readily accessible account of all revenue-raising and expenditure decisions. In many countries,
and especially those with a federal system of government, this has also led to a reexamination of the
financial relationships between the federal, state and local jurisdictions. The hypothesised ability of
governments to obscure the real costs of public sector activity through fiscal illusion has once again
emerged as a key question in the analysis of government spending and taxing.
The concept of fiscal illusion revolves around the proposition that the true costs and benefits of
government may be consistently misconstrued by the citizenry of a given fiscal jurisdiction. The
origins of this argument can be traced back at least as far as J.R. McCullock and J.S. Mill. For
instance, in his A Treatise on the Practical Influence of Taxation and the Funding System
McCulloch developed several of the principles underlying the modern analysis of fiscal illusion.
Thus he contended that direct taxation involved less fiscal illusion than indirect taxation since direct
taxation imposes a more obvious burden on taxpayers. Similarly, McCulloch argued that taxpayers
misperceived not only the costs of government activity but also its benefits. J. S. Mill followed a
2
similar line in his Principles of Political Economy, although he placed much more emphasis on the
resultant bias in government expenditure. But perhaps the dominant influence in the development
of the theory of fiscal illusion was Puviani (1967). Although his approach has been criticised for
being too general it did serve as the basis for the subsequent works of both Buchanan (1967) and
Wagner (1976). In its present form the theory of fiscal illusion owes much to Downs (1957) work
on the economic theory of politics. Downs (1957, p. 148) argued that:
[I]t is rational for every individual to minimise his investment in political information, in spite
of the fact that most citizens might benefit substantially if the whole electorate were well
informed. As a result, democratic political systems are bound to operate at less than
maximum efficiency.
The empirical analysis of fiscal illusion has been directed almost exclusively at the revenue side of
the fiscal equation with a corresponding neglect of the benefits of public sector activity. This
asymmetry does not necessarily reflect the increased importance of government expenditure relative
to government output. As Goetz (1977, p. 177) has argued the reasons for this are somewhat more
mundane:
It is not that the issue of over or undervaluation of the benefits of public goods is not a
trenchant one. Quite the contrary. In the last analysis, however, assessments of the relative
values of goods are intrinsically subjective and highly personal... there is little hope for
establishing the truth or falsity of J. K. Galbraith's contention that the preference of
Americans for automobiles over public goods is symptomatic of illusion.
In any event, the empirical analysis of fiscal illusion has either taken the form of what Oates (1988,
p.68) describes as ad hoc expenditure studies, like Wagner (1976), Breeden and Hunter (1985),
Feenburg and Rosen (1987), Misiolek and Elder (1988), or work employing demand functions for
public goods such as Bergstrom and Goodnam (1973), Wildasin (1989), Hayes (1989) and Crane
(1990). In both the expenditure and demand approaches a measure of budgetary size or budgetary
growth is regressed against various socio-economic variables aimed at capturing those determinants
present in the absence of fiscal illusion. An indicator or proxy for the relevant illusionary variable
is then added, so that a significant directional coefficient indicates the presence of fiscal illusion.
The model itself typically takes the form E = αX + βF + u, where E is a measure of budgetary size,
X is a vector of explanatory variables in the absence of fiscal illusion, F is a vector of variables
intended to measure fiscal illusion, and u is the error term (Oates, 1988, p.68).
Within this general approach, the empirical study of fiscal illusion has proceeded in five distinctive
directions, each of which seeks to account for the putative existence of fiscal illusion. The present
paper attempts to review the literature in question within a common theoretical framework.
The paper itself has been sub-divided into seven main areas. Section 2 seeks to locate the five
major empirical approaches within the analytical context provided by Wagner (1976). Sections 3,
4, 5, 6 and 7 examine in detail the empirical work on the revenue-complexity, revenue-elasticity,

3
the flypaper effect, the renter illusion, and fiscal illusion hypotheses respectively. The paper ends
with some brief concluding remarks in section 8.
4
2. A Common Theoretical Framework
The five specific hypotheses underlying the empirical analysis of fiscal illusion can be illustrated in
terms of a simple diagram developed by Wagner (1976, p.54) which is shown in Figure 1 below.
Each of these hypotheses has attempted to model a process in which fiscal illusion causes citizens
to underestimate the tax-price of a public good and so result in an oversupply of that good. In
Figure 1, X2 and P2 represent the tax-price and desired output of the public good in the absence of
fiscal illusion, and the area 0P2aX2 the public budget (expenditure or revenue). This is consistent
with the socio-economic vector aX. With the introduction of fiscal illusion the perceived tax-price
falls to P1, desired output expands to X1 and the perceived budget is OP1cX1. However, the actual
budget is 0P2dX1 since the actual tax-price is still P2. Empirical tests of fiscal illusion aim to
evaluate the significance of the area X2adX1, the excess budget/revenue/expenditure attributable to
the illusion vector βF.
X X X/t 1 2 0
P/X
P
P
1
2 a
b c
d
MC = AC
D
FIGURE 1. Modelling Fiscal Illusion
The first hypothesis is revenue-complexity where the misperception of the tax-price results from
fragmentation of the revenue system. Studies by Wagner (1976), Pommerehne and Schneider
(1978), Baker (1983) and Breeden and Hunter (1985) have sought to measure this effect. In terms
of Figure 1, the increasing complexity of the revenue system, or a fall in its level of simplicity,
should cause a move in the perceived price of the public good down the vertical axis. An extremely
simple revenue structure on the other hand would be associated with the actual price P2. Movement
down the vertical axis is linked with higher levels of illusion and, as a result, more public goods.
The second genre of work focuses on revenue-elasticity where growth in the level of public activity
is associated with income elastic forms of taxation. Oates (1975), Craig and Heins (1980), Hunter
and Scott (1987) and Misiolek and Elder (1988) have examined revenue-elasticity empirically.
Figure 1 would show the y-axis as being associated with the level of income elasticity of the
revenue structure. The higher the level of dependence on income-elastic revenue devices, or the
lesser the proportion of revenue from inelastic sources, the higher the level of illusion, and the
5
higher the level of expenditure. The third type of approach is the flypaper effect, where lump-sum
grants and public utility profits exert a stimulatory effect on expenditures. Contributions by
DiLorenzo (1982b), Winer (1983), Logan (1986) and Grossman (1990) fall into this category.
Figure 1 would show the vertical axis as being associated with the level of dependence on grants or
public utility profits. All other things being equal, the higher the level of dependence on grants and
public utility profits, or the lower the proportion of revenue from other sources, the higher the level
of illusion, and therefore expenditure. The fourth area centres on renter illusion, where fiscal
illusion is related to the level of property ownership in a fiscal jurisdiction. Bergstrom and
Goodman (1973) and Martinez-Vazquez (1983) provide examples of this kind of work. The
vertical axis in Figure 1 would then illustrate the proportion of owner-occupiers in a given
jurisdiction. The lower the proportion of owners, or the higher the level of renters, the higher the
degree of fiscal illusion, and the higher the level of public good provision. Finally, the situation
where debt provides illusionary effects has been investigated. Oates (1972), Epple and Schipper
(1981) and Dalamagas (1993) have undertaken empirical work in this area. Figure 1 would show
that as a jurisdiction increasingly relied on debt, or as the proportion of revenue from taxes falls, the
level of fiscal illusion would increase, and as a result the level of public good expenditure would
also increase. Empirical work on each of these five hypotheses will now be examined in more
detail.
3. Revenue-Complexity Hypothesis
The first source of fiscal illusion to be examined derives from revenue structure complexity.
Initially defined by Buchanan in 1967, the roots of the revenue-complexity hypothesis apparently
date to the work of Puviani in 1903. Buchanan (1967, p. 135) has argued that "...to the extent that
the total tax load on an individual can be fragmented so that he confronts numerous small levies
rather than a few significant ones, illusionary effects may be created". Thus it is increasingly
difficult for the tax-payer to identify the tax-price of public sector activities and more likely that
total tax liability of public output is underestimated. Moreover, even if the tax-payer can identify
the various tax sources, the marginal costs of procuring full information may quickly outweigh any
marginal benefits. Consequently, the revenue complexity hypothesis predicts the more complex the
revenue system, the larger will be the level of public expenditure ceteris paribus.
The seminal study of the revenue-complexity hypothesis was undertaken by Wagner in 1976.
Wagner argued that a fiscal system was characterised by the composition and predilection of fiscal
extraction devices (FEDs). Wagner proposed that as a revenue-raising system became more
complex, the FEDs diversified, spatially, temporally, and in terms of obtrusiveness (Wagner, 1976,
p. 51). The rationale for such behaviour was to mask the extent of revenues transferred from
taxpayers to the fiscus. As a result of diversification, Wagner (1976) posited that the formation of
perceptual hypothesises and the securement of data become so demanding that it raises the marginal
6
cost of inquiry significantly. Moreover, since the marginal benefit of forming an accurate
hypothesis on a fiscal variable is less in collective choice than market choice, Wagner asserted that
an increase in revenue-complexity would ceteris paribus increase the level of public expenditure.
Wagner (1976) approached the empirical analysis of fiscal illusion by regressing total current
expenditure against various socio-economic demand variables and a measure of revenue structure
simplicity - the Herfindahl index of concentration. The Herfindahl index CRS (complexity of
revenue system) is CRS j = ( REV i ) 2
i = 1
n , so that REVij represents the i-th tax instrument's revenue share
of the total revenue amount of the j-th jurisdiction. Moreover (0 < CRS _ 1). A complex revenue
system would be associated with a relatively low CRS whilst a simple revenue system would have
an index approaching 1. At the extremes a revenue system characterised by four equal FEDs would
have an index of 0.25 whilst one with a singular FED would have an index of 1. The selection of
the Herfindahl index as a measure of revenue simplicity was to become one of Wagner's most
enduring contributions, since virtually all subsequent studies of the revenue-complexity model have
employed this index as a measure of the illusion variable (Oates, 1988, p. 69). Wagner's analysis of
local government expenditure was likewise instrumental in focusing later studies on local public
goods. In Wagner's analysis the expected sign of the revenue-complexity variable was negative and
significant. Indeed, Wagner (1976, p. 57) used the results to propose that an adjustment of the
revenue system to an extreme level of simplicity would entail a fall in expenditures of 33.06%!
Despite the apparent success of Wagner's analysis in identifying fiscal illusion as a result of
revenue-complexity, subsequent studies and Wagner himself acknowledged some serious
deficiencies (Wagner, 1976; Oates, 1988; Munley and Greene, 1978; Misiolek and Elder, 1988).
Firstly, the selected measure of revenue-complexity, the Herfindahl index, failed to take into
account the perceived visibility of revenue classes. Oates (1988, p. 70), for example, noted that
charges and fees for government services emphasised the cost of these goods and services more
than equivalent exise taxes. The possibility that Wagner's regression equation may have well been
misspecified (and hence biased) prompted subsequent studies to include "visibility" weightings
(see, for example, Clotfelter, 1976; Pommerehne and Schneider, 1978; Breeden and Hunter, 1985;
Henrekson, 1988; Misiolek and Elder, 1988). Secondly, whilst Wagner incorporated qualitative
measures of population (for example, percentages below the poverty line and proportion urbanised)
the lack of population quantity as an independent variable, or the use of per capita expenditures,
opened the model to significant bias via equation misspecification. Munley and Greene (1978) (see
Table 1) using identical data to Wagner, found that the misspecified equation incorporated
substantial heteroskedasticity, and that the use of the generalised least squares (GLS) procedure
resulted in revenue structure being no longer significant. They also found that Wagner's use of
published data had unnecessarily restricted the measure of revenue-complexity (Wagner's four
revenue categories as against Munley and Greene's nine). After modifying the equation for either
population or per capita measures, revenue structure, whilst still negative, was insignificant, which
7
may indicate that Wagner's results were somewhat fragile. Subsequent analysis by Misiolek and
Elder (1988) yielded similar results.
Despite the damning evidence provided by Clotfelter (1976), Munley and Greene (1978), and
Misiolek and Elder (1988), four post-Wagnerian studies provided support for the revenue-
complexity hypothesis. Pommerehne and Schneider (1978) analysed Swiss municipalities and
found that weighting of the revenue-complexity index by visibility significantly improved the
explanatory power of Wagner's basic model. The study also indicated that the fiscal distortion
indicated in the revenue-complexity hypothesis was more likely to be pronounced in indirect as
against direct democracies. Baker (1983) used US state data on a per capita basis, and found that
revenue-complexity was significant and negative in terms of fiscal change. After an analysis of data
drawn from thirty-seven U.S. cities, Breeden and Hunter (1985) concluded that relatively narrowly-
based taxation systems yield less revenue than relatively diffuse and broadly-based taxation
systems. Finally, a British study by Cullis and Jones (1987, p. 226) provided evidence for
widespread ignorance regarding revenues without establishing the existence of fiscal illusion per se.
Whilst the empirical studies on average tend to offer considerable support for the revenue-
complexity hypothesis, critics have argued that the basic assumptions of the model are seriously
flawed. Put differently, there are accusations that either the assumed causal linkage between
revenue-complexity and revenue levels is incorrect, or that alternative hypotheses exist (other than
fiscal illusion) for revenue-complexity and the growth of government (Wagner, 1976; Breeden and
Hunter, 1985; Borcherding, 1985; Anderson, Wallace and Warner, 1986; Oates, 1988; Misiolek and
Elder, 1988). Political agents may well be subject to considerations of both budget maximisation
and burden minimisation, determining fiscal structure in light of their own self-interest and that of
their constituents (Wagner, 1976, p. 58). This may throw doubt on the traditional motivations for
revenue-diversification. Oates (1988, p. 71) approached the question slightly differently by arguing
that two competing hypotheses existed; revenue-complexity and what he termed revenue-
diversification. He postulated that in order to prevent producer and consumer mobility across
jurisdictional borders on the basis of tax inducements, officials will introduce new sources of
revenue rather than increase existing tax rates. Accordingly, jurisdictions with relatively high levels
of spending are associated with more diversified revenue systems, rather than the causal
relationship of diversified revenue systems and expenditure offered by the fiscal illusion literature.
Oates suggests that past studies are therefore compromised on the basis of simultaneous equation
bias (estimates will be biased and inconsistent, tests of hypothesis on parameters will be invalid).
Misiolek and Elder (1988, p. 233) approached the question of causality by arguing that a conflict
existed between fiscal illusion (tax diversification resulting from inaccurate or incomplete
information) and fiscal stress (tax diversification as a result of the need for revenue stabilisation).
They regarded the revenue simplicity measure utilised in past studies of fiscal illusion as a measure
of risk-reducing revenue diversification (Misiolek and Elder, 1988, p. 233). In their empirical
analysis of forty-eight US states, Misiolek and Elder found little evidence in favour of fiscal illusion
8
but some support for the fiscal stress argument that revenue variability may affect the size of
government.
TABLE 1.
Summary of major studies of the revenue-complexity hypothesis
Author(s) Data
(a)
Estimation
technique
(b)
Dependent
Variable (c)
Measure of
Fiscal Illusion
Employed (d)
Other Independent Variables
(d)
Major
Findings
Wagner
(1976)
50 US
cities
Cross-
sectional
1970
OLS Total current
expenditure
(Herfindahl)
revenue-
complexity.
Total personal income,
intergovernmental revenue,
percentage of population
below poverty line, av. salary
of city employees, local
expenditure as a percentage
of total, population density.
Simplicity of
revenue
structure
significantly
negative.
Clotfelter
(1976)
50 US
states
Cross-
sectional
1970
TSLS Per capita
expenditure
and per
capita
revenue.
Ratio of direct
to indirect
taxes.
Wage rate, income,
population, public tertiary
education enrolment ratio,
various measures of
education revenue simplicity.
Simplicity of
revenue
structure
negative
though
insignificant.
Pommerehne
and
Schneider
(1978)
110 Swiss
cities
Cross-
sectional
1970
OLS Per capita
expenditures
(Herfindahl)
revenue-
complexity
with different
visibility
weightings.
Income, tax-price,
population.
Simplicity of
revenue
significantly
negative
depending on
weighting of
visibility.
Munley and
Greene
(1978)
50 US
cities
Cross-
sectional
1970
OLS/GLS Total current
expenditure
Per capita
expenditures.
(Herfindahl)
revenue-
complexity,
(Herfindahl)
revenue-
complexity,
Total personal income,
intergovernmental revenue,
percentage of population
below poverty line, average
salary of city employees,
local expenditure as a
percentage of total, city
population as a percentage of
total area, population
density.
Total personal income per
capita, intergovernmental
revenue per capita,
percentage of population
below poverty line, average
salary of city employees,
local expenditure as a
percentage of total, city
population as a percentage of
total area, population
density, population.
Model
(Wagner)
prone to bias
on the basis
of equation
specification.
Revenue
structure
simplicity
negative
though
insignificant.
Baker (1983) 50 US
states
Cross-
sectional
1975
OLS Voter tax
cost
(Herfindahl)
revenue-
complexity,
Per capita: income, mineral
shipments, motel receipts,
manufacturing value added,
debt lagged one year,
percentage of males with
education < 12 years, tax
structure elasticity measure
(mean for average income
return).
Simplicity of
revenue
structure
negative and
significant.

9
Author(s) Data
(a)
Estimation
technique
(b)
Dependent
Variable (c)
Measure of
Fiscal Illusion
Employed (d)
Other Independent Variables
(d)
Major
Findings
Breeden and
Hunter
(1985)
37 US
cities
Cross-
sectional
1975
OLS Per capita
total city
revenue
Measure of
breadth of
revenue
system
(number of
different
instruments).
Per capita income, per
capita federal revenue, per
capita state revenue,
dummies for dependence on
general stales taxes, select
sales taxes, license fees,
charges, property taxes, city
area.
Simplicity
measure
negative and
significant,
breadth of
revenue
system
positive and
significant.
Cullis and
Jones
(1987)
UK survey
1981
Descriptive
statistics
Visibility of
central
government
revenue
sources.
Not applicable Various UK revenue
classifications.
Significant
illusion in
terms of
identifying
revenue
sources.
Henrekson
(1988)
Sweden
Time-
series
1950-1984
OLS Government
consumption,
investment
and transfer
expenditures.
(Herfindahl)
revenue-
complexity,
ratio of direct
to indirect
taxes.
Urban population, GDP,
non-labour force population
as a proportion of total, ratio
of median to mean income,
ratio of net exports to GDP,
proportion of unionised to
non-unionised labour,
inflation.
Simplicity of
revenue
structure in-
significantly
positive.
Misiolek and
Elder
(1988)
50 US
states
Cross-
sectional
1984
OLS (log-
linear)
Real tax
revenues per
capita, real
state-local
expenditures
per capita.
(Herfindahl)
revenue-
complexity,
(Oates)
income
elasticity,
visible tax
concentration
ratio.
Per capita personal income,
population, average monthly
salary of state-local
employees, dummy for state
expenditure limit, tax export
measure, variability of taxes
over period, variance of
income over period, state
share of state-local
expenditures.
Measures of
revenue
structure
simplicity
and visibility
insignificant.
Martinez-
Vazquez,
Harwood,
Larkins
(1992)
US survey
data
1991
Desciptive
statistics
Various
questions on
withholding
vs. lump-sum
taxation
Not applicable Effect of withholding on tax
compliance.
No evidence
of fiscal
illusion in
terms of
income tax
complexity.
Heyndels
and
Smolders
(1994)
302
Flemish
municipal-
ities Cross-
sectional
1990
OLS (log-
linear)
Total
expenditure.
(Herfindahl)
revenue-
complexity,
(Oates)
income
elasticity ,
percentage
non-owner
occupied,
grant income
divided by
total income.
Population, median voter tax
share, median voter total
disposable income.
Complexity
of revenue
system has a
positive and
significant
impact on
expenditures.

10
Author(s) Data
(a)
Estimation
technique
(b)
Dependent
Variable (c)
Measure of
Fiscal Illusion
Employed (d)
Other Independent Variables
(d)
Major
Findings
Worthington
(1994)
46
Austral-
ian LGAs
Cross-
sectional
1991
OLS TSLS
(linear and
log-linear)
Total and per
capita
expenditure.
Proportion
owner-
occupied,
(Herfindahl)
revenue-
complexity,
dummies for
grant and
utility
reliance,
indirectness of
revenue
system.
Rateable area, rateable
roads, median voter tax
price, median voter income,
population, proportion of
population over 65 years.
Complexity
of revenue
system
positive and
significant
impact on
expenditures.
Revenue
system
determined
exogenously
to level of
expenditure.
Dollery and
Worthington
(1995a)
7
Australian
states.
Pooled
time-series,
cross-
sectional
(1982-
1992)
OLS and
GLS
(linear and
log-linear)
Total
expenditure
and total
expenditure
net of grants
and transfers.
(Herfindahl)
revenue-
complexity,
(Oates)
income
elasticity, ratio
of direct to
indirect taxes,
dummy
variables for
reliance on
grant income.
Population, median voter
income, proportion of
poulation under 19 years,
proportion of population
over 65 years, population
density, dummies for large
and small states.
Complexity
of revenue
system
positive and
significant
impact on
expenditures.
(a) Singular dates represent cross-sectional studies, intervals time series. Where two dates are given, different years for some cross-
sectional variables have been used. (b) OLS/GLS/TSLS - Ordinary Least Squares, Generalised Least Squares and Two-Stage Least
Squares respectively. (c) More than one dependent variable indicates alternative equations have been evaluated. (d) Italicised
independent variables indicate significant t-values at 90% or more.
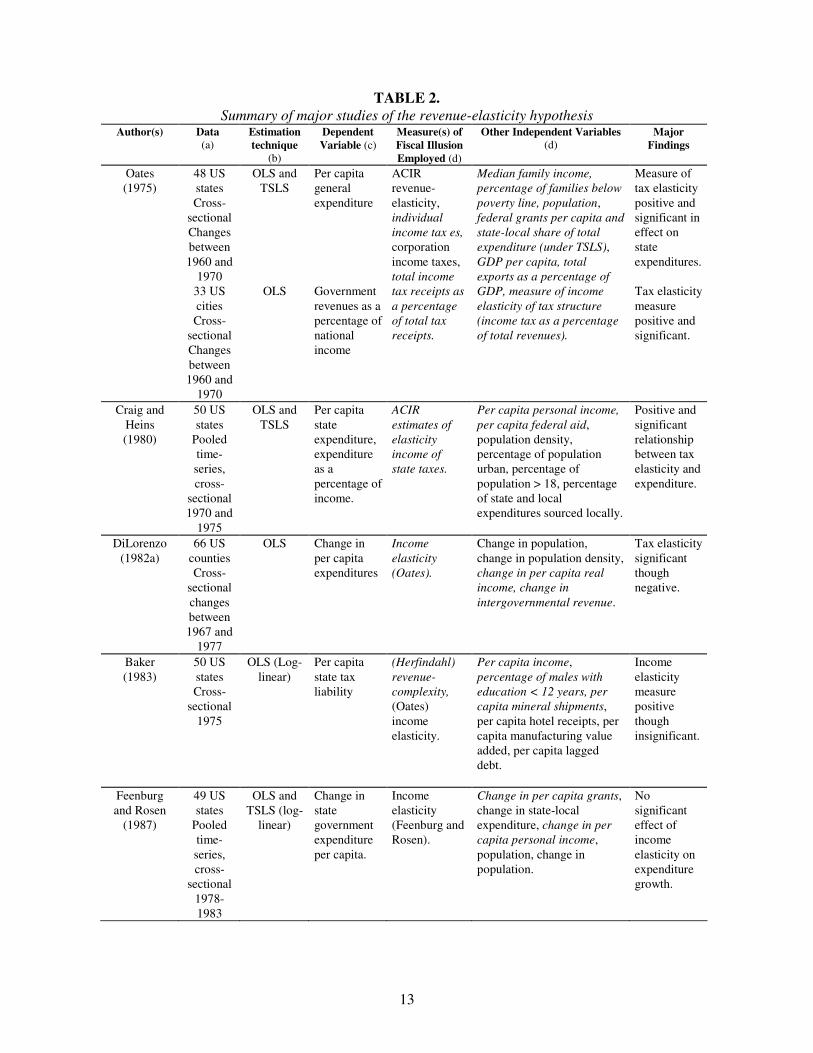
4. Revenue-Elasticity Hypothesis
The second form of fiscal illusion derives from the income elasticity of the revenue system. In this
approach, revenue systems characterised by a high degree of income elasticity will attract larger
increments in general income, and this increase will be "automatically" funnelled into increased
expenditure. In other words, a clear deterministic relationship exists between the "automatic"
increases in revenue found under an income elastic revenue structure and increased expenditure
ceteris paribus. But as Oates (1975, p. 141) has caustically observed:
But why should people care about the income elasticity of the tax structure? What the
proposition under study seems to imply is that people will not object to increases in public
expenditure if they can be funded with no increase in tax rates (that is, from increments to
revenues resulting solely from growth in income), but they will not support an expanded
public budget if it requires a rise in tax rates. This suggests what people care about is not
their tax bill, but rather their tax rate. Viewed this way, the hypothesis simply is not
consistent with our conventional description of rational behaviour; it implies that consumer-
taxpayers are subject to a kind of 'fiscal illusion' (original emphasis).
11
The first major study of the revenue-elasticity hypothesis was undertaken by Oates in 1975. The
study began by regressing US state expenditures against various socio-economic variables, along
with a measure of the income elasticity of the revenue structure (see Table 2). The hypothesis held
that in addition to the determinants of growth in expenditure indicated by the various socio-
economic variables, the income elasticity of the tax structure would exert a positive influence
(Oates, 1975, p. 146). The process was repeated in an almost identical form for a selection of
thirty-three US cities, and in a slightly modified model for a selection of fifty-seven countries. The
results prompted Oates (1975, p. 156) to conclude that tax elasticity seems to be positively related
to the growth of the public expenditure.
Despite the apparent "success" of these empirical studies, Oates himself was loathe to
unambiguously accept the findings. In fact he suggested that the analysis had been compromised in
several ways. Firstly, in common with many studies of fiscal illusion, some of the socio-economic
variables were presumed to be endogenous, notably grant-matching state and federal funds. This
problem was rectified in the Oates analysis by the use of a two-stage least squares regression and
the addition of variables associated with the level of intergovernmental grants. The procedure
caused the the income-elasticity variable to lose a substantial amount of explanatory power (Oates,
1975, p. 156). Secondly, Oates (1975) had analysed state and city data over a period associated
with rapid budgetary growth, which he believed may have exaggerated the significance of the
revenue-elasticity hypothesis. He posited that in the long-run the income elastcity of the tax system
will probably not have a significant impact on the growth of the public sector. Thirdly, Oates
observed that the proxies he had used for the income elasticity of the revenue systems were far from
satisfactory. In particular, governmental estimates were suitable for single years only, and measures
using the proportion of income tax revenue to total revenues provided only a reasonable
approximation. Despite this Oates' (1975) approximation was employed by DiLorenzo (1982a),
Baker (1983), Misiolek and Elder (1988), Heyndels and Smolders (1994) and Dollery and
Worthington (1995a), whilst the ACIR (Advisory Commission on Intergovernmental Relations)
elasticity estimates were used by Craig and Heins (1980). Finally, Oates (1975, p. 143) admitted
that he was uncomfortable with the notion of revenue-elasticity being "a hypothesis founded solely
on irrational behaviour". Put differently, the fiscal illusion hypothesis held that tax rates not tax
bills would dominate taxpayer perceptions, even in the presence of full information. Oates reasoned
more compelling and acceptable evidence must exist. He argued inter alia fiscal illusion may
depend in some way on the political mechanism and could thus still be consistent with rational
individual behaviour (Oates, 1975, p. 143). Such a conclusion he felt could be supported by either
the transaction cost theory of Wagner (1976) or the rational taxpayer ignorance theory proposed by
Downs (1957). Wagner (1976) proposed that the habitual behaviour of legislators in selecting an
income elastic revenue system was more efficient than the frequent and costly adjustments
associated with continual reexaminations. But in the sense that it does not rely on imperfect
information or misperceptions it cannot be regarded as mutually exclusive of the theory of fiscal
12
illusion (Oates, 1988, p. 75). Downs (1957, p. 147) argued that ignorance (not irrationality) of the
public budget was a highly rational response to the facts of political life in a large democracy.
Subsequent studies have provided mixed support for the revenue-elasticity hypothesis (see Table 2).
Craig and Heins (1980) found a positive and significant relationship, but accepted that their
empirical observations were supported by US state moves to install legislative limits on expenditure
as a proportion of income. DiLorenzo (1982a) in an analysis of sixty-six county jurisdictions found
that revenue elasticity was negative and insignificant as a determinant to expenditure, a result in his
estimation influenced by the presence of Tiebout mobility. Tiebout mobility infers that at the local
level, expenditure and tax differentials will affect the choice of residential location ceteris paribus.
The migration of taxpayers away from more income elastic local areas (with their higher tax bills)
would reduce the demand for expenditure growth, thereby underestimating the expansionary effect
of income elastic revenue structures (Craig and Heins, 1980; DiLorenzo, 1982a). Baker (1983)
found little support for the revenue-elasticity hypothesis when examined in conjunction with the
revenue-complexity hypothesis, and Feenburg and Rosen (1987, p. 200) concluded that there is no
evidence that income elastic tax structures generate higher rates of growth in the public sector. In an
alternative approach to the question of tax structures Hunter and Scott (1987), and later Greene and
Hawley (1991) found that the probability of a tax rate cut increased when US states had more
income elastic revenue systems. This questioned the revenue-elasticity hypothesis that elastic
structures were exploited by political agents to gain higher levels of expenditure. It should be noted
that Feenburg and Rosen (1987), Hunter and Scott (1987) and Greene and Hawley (1991) share a
proxy for revenue-elasticity different to that employed by Oates (1975). Using a sample of 25 000
Federal Income Tax returns, Feenburg and Rosen (1987), and later Greene and Hawley (1991),
estimated state personal income and sales tax liabilities for each unit, and then calculated the
elasticities of the income and sales tax systems assuming an increase in income of one percent.
Hunter and Scott (1986; 1987), on the other hand used a Gini coefficient assuming equal
distribution of income across income levels to construct their measure of system progressivity.
Finally, Misiolek and Elder (1988, p. 242) found that tax elasticity was significant only when the
dependent variable was tax revenue.
The main problem surrounding past empirical studies of the revenue-elasticity hypothesis appears to
be that researchers, whilst reluctant to dismiss the intuitive appeal of the model, are frustrated by
the lack of a suitable measure of income elasticity. It is also apparent that whilst alternative
explanations for revenue elasticity are not mutually exclusive, in the case of transactions costs and
illusion it may not be possible to conclude that on the basis of the revenue elasticty hypothesis
alone that this represents a distinct form of fiscal illusion (Oates, 1988, p. 76).
13
TABLE 2.
Summary of major studies of the revenue-elasticity hypothesis Author(s) Data
(a)
Estimation
technique
(b)
Dependent
Variable (c)
Measure(s) of
Fiscal Illusion
Employed (d)
Other Independent Variables
(d)
Major
Findings
Oates
(1975)
48 US
states
Cross-
sectional
Changes
between
1960 and
1970
33 US
cities
Cross-
sectional
Changes
between
1960 and
1970
OLS and
TSLS
OLS
Per capita
general
expenditure
Government
revenues as a
percentage of
national
income
ACIR
revenue-
elasticity,
individual
income tax es,
corporation
income taxes,
total income
tax receipts as
a percentage
of total tax
receipts.
Median family income,
percentage of families below
poverty line, population,
federal grants per capita and
state-local share of total
expenditure (under TSLS),
GDP per capita, total
exports as a percentage of
GDP, measure of income
elasticity of tax structure
(income tax as a percentage
of total revenues).
Measure of
tax elasticity
positive and
significant in
effect on
state
expenditures.
Tax elasticity
measure
positive and
significant.
Craig and
Heins
(1980)
50 US
states
Pooled
time-
series,
cross-
sectional
1970 and
1975
OLS and
TSLS
Per capita
state
expenditure,
expenditure
as a
percentage of
income.
ACIR
estimates of
elasticity
income of
state taxes.
Per capita personal income,
per capita federal aid,
population density,
percentage of population
urban, percentage of
population > 18, percentage
of state and local
expenditures sourced locally.
Positive and
significant
relationship
between tax
elasticity and
expenditure.
DiLorenzo
(1982a)
66 US
counties
Cross-
sectional
changes
between
1967 and
1977
OLS Change in
per capita
expenditures
Income
elasticity
(Oates).
Change in population,
change in population density,
change in per capita real
income, change in
intergovernmental revenue.
Tax elasticity
significant
though
negative.
Baker
(1983)
50 US
states
Cross-
sectional
1975
OLS (Log-
linear)
Per capita
state tax
liability
(Herfindahl)
revenue-
complexity,
(Oates)
income
elasticity.
Per capita income,
percentage of males with
education < 12 years, per
capita mineral shipments,
per capita hotel receipts, per
capita manufacturing value
added, per capita lagged
debt.
Income
elasticity
measure
positive
though
insignificant.
Feenburg
and Rosen
(1987)
49 US
states
Pooled
time-
series,
cross-
sectional
1978-
1983
OLS and
TSLS (log-
linear)
Change in
state
government
expenditure
per capita.
Income
elasticity
(Feenburg and
Rosen).
Change in per capita grants,
change in state-local
expenditure, change in per
capita personal income,
population, change in
population.
No
significant
effect of
income
elasticity on
expenditure
growth.

14
Author(s) Data
(a)
Estimation
technique
(b)
Dependent
Variable (c)
Measure(s) of
Fiscal Illusion
Employed (d)
Other Independent Variables
(d)
Major
Findings
Hunter and
Scott
(1987)
40 US
states
Pooled
time-
series,
cross-
sectional
1976-
1983
Logit Dummy
variable if
the state
decreased
income taxes
during the
year.
Measure of
progressivity
of state
income tax.
Proportional change; in GNP
deflator, state income, state
revenues, population.
States with a
higher
degree of
income
elasticity
have a higher
probability
of cutting tax
rates.
Misiolek and
Elder
(1988)
50 US
states
Cross-
sectional
Changes
between
1967 and
1984.
OLS (log-
linear)
Real tax
revenues per
capita, real
state-local
expenditures
per capita.
Income
elasticity
(Oates),
(Herfindahl)
revenue-
complexity,
visible tax
concentration
ratio.
Per capita personal income,
population, average monthly
salary of state-local
employees, dummy for state
expenditure limit, tax export
measure, variability of taxes
over period, variance of
income over period, State
share of state-local
expenditures.
Tax elasticity
positive and
significant in
tax revenues
only.
Greene and
Hawley
(1991)
40 US
states
Pooled
time-
series,
cross-
sectional
Unlagged
1977-83
lagged
1978-84
Logit Discrete
variable for
tax code
change
Income
elasticity
(Feenburg and
Rosen).
Change in GNP deflator,
rate of change in nominal
income, change in revenue,
revenue at beginning of year,
rate of population change.
Highly
income
elastic tax
structures
will cut rates
to prevent
over-
expansion
(as for
Hunter and
Scott).
Heyndels
and
Smolders
(1994)
302
Flemish
municipal-
ities Cross-
sectional
1990
OLS (log-
linear)
Total
expenditure.
(Herfindahl )
revenue-
complexity,
(Oates)
income
elasticity ,
percentage of
non-owner
occupied
residences,
grant income
equivalent
divided by
total income.
Population, median voter tax
share, median voter total
disposable income.
No empirical
support for
revenue-
elasticty
hypothesis.
Dollery and
Worthington
(1995a)
7
Australian
states.
Pooled
time-series,
cross-
sectional
(1982-
1992)
OLS and
GLS
(linear and
log-linear)
Total
expenditure
and total
expenditure
net of grants
and transfers.
(Herfindahl)
revenue-
complexity,
(Oates)
income
elasticity, ratio
of direct to
indirect taxes,
dummy
variables for
reliance on
grant income.
Population, median voter
income, proportion of
poulation under 19 years,
proportion of population
over 65 years, population
density, dummies for large
and small states.
No empirical
support for
revenue-
elasticty
hypothesis.
15
(a) Singular dates represent cross-sectional studies, intervals time series. Where two dates are given, different years for some cross-
sectional variables have been used. (b) OLS/GLS/TSLS - Ordinary Least Squares, Generalised Least Squares and Two-Stage Least
Squares respectively. (c) More than one dependent variable indicates alternative equations have been evaluated. (d) Italicised
independent variables indicate significant t-values at 90% or more.
5. The "Flypaper Effect" of Grants and Utility Profits
5.1 The Flypaper Effect
A further form of fiscal illusion is the flypaper effect, which holds that a tendency exists for
categorical lump-sum grants to increase public expenditure by more than an equivalent increase in
income from other sources (Dougan and Kenyon, 1988, p. 159). The term "flypaper effect" itself is
attributed by Courant, Gramlich and Rubinfeld (1979) and Marshall (1989) to Arthur Okun's
observation that "money sticks where it hits". First modelled by Courant, Gramlich and Rubinfeld
(1979) and Oates (1979), the theory holds that budget-maximising political agents (politicians and
bureaucrats) conceal the lump-sum nature of grant revenues. Instead of the income being returned to
tax-payers, either directly via a rebate or a indirectly via a reduction in tax contributions, the grant is
used to expand the public budget. This is accomplished by political agents fostering an illusion that
in addition to actual average tax rates falling, there has been a reduction in the marginal tax-price of
the public good. As a result the electorate is willing to support a higher level of spending at the
recipient level than they would have if the fiscal parameters were correctly perceived.
Three distinct groups of researchers have investigated the issue of the flypaper effect empirically.
Firstly, some have incorporated grant distortions into studies directed at other forms of fiscal
illusion, such as the revenue-complexity or elasticity hypotheses. These include Oates (1975),
Wagner (1976), Goetz (1977), Munley and Greene (1978), Craig and Heines (1980), DiLorenzo
(1982b) and Breeden and Hunter (1985). In general, the results have indicated that
intergovernmental grants are an important determinant of the level of public good expenditure. The
second and third groups are those that have directed their studies to the question of the flypaper
effect directly. The first of these are writers in the vein of Courant, Gramlich and Rubinfeld (1979)
and Oates (1979) who argued that grants reduce the average price of recipient public goods, and that
voters base their allocative decisions on this price, rather than the actual marginal tax-price. The
second group includes Winer (1983) and Logan (1986) who have observed that grants cause voters
to view their tax-burden as being transferred to other jurisdictions. Regardless of this distinction,
both groups view grants as reducing the perceived marginal cost of the public good, and thereby
biasing public expenditure upwards. These approaches are discussed below.
Winer (1983, p. 127) began his study by observing that "...there is an obvious temptation for
politicians to foster the belief that the cost of public services will fall disproportionately on
someone else". In so doing he provided the rationale for the analysis of a federal system in which
spending and taxation decisions are separated, and accordingly may have a systematic and biased
effect on the level of expenditures. A federal structure is prone to fiscal illusion of this form,
16
regardless of whether the voter is aware or unaware of aid, or of the status of the local government
(donor or recipient). If the voter is unaware of aid s/he may perceive a reduction in costs because of
a higher portion of government spending in financing expenditures. If the voter is aware of aid,
illusion may still prevail since the voter may well be unaware of their own provincial status (grantor
tax share > local tax share) or that all communities in some sense finance a portion of aid to other
provinces (intergovernmental-complexity) (Logan, 1986, p. 1310). Utilising Canadian provincial
data, Winer (1983, p. 127) reasoned that since federal taxation is levied nationally, federal grants-
in-aid may induce a belief among a recipient provinces voters that public services are being
financed by non-residents. As a result grants, and especially unconditional grants, reduce the tax-
price of provincial public goods and may well bias expenditures upward. This may be the case even
if it were not possible to shift the taxation burden externally. As shown in Table 3, Winer's analysis
regressed net provincial expenditures against provincial income, federal grants and interprovincial
grants. He also included dummies for the different categories of recipient and donor provinces.
Winer found that the results indicated that the grant system did increase expenditureand that the
elasticity of grants with respect to expenditure for "poor" jurisdictions (recipient) is roughly twice
as large as for "rich" jurisidictions (donor).
Logan (1986), and later Hammes and Wills (1987), modified Winer's (1983) "partial equilibrium"
approach by incorporating the effect of fiscal illusion on the grantor governments tax-price as well
as that of the recipient. Logan based his analysis on the fact that although voters were subject to
incomplete information they were still rational, and that they were faced with the perception that
federal taxes were rising but services were not, and that state taxes were falling but services were
not (Logan, 1986, p. 1306). From this he surmised that the contrasting effects of misperceived tax-
prices would mean an upward bias of recipient expenditures, and a downward bias of donor
expenditures exclusive of grants. As shown in Table 3, Logan (1986) regressed per capita federal
non-aid expenditure against per capita measures of income, federal aid, state expenditure and
unemployment for a US national time-series. The results indicated that a negative relationship did
indeed exist between the level of federal expenditures on aid, and the level of federal non-aid
expenditures; proof that modification of tax-prices occurred at the donor level (Logan, 1986, p.
1317). Such results imply that tax-prices were modified in the opposite direction for recipient
expenditures, supporting the fiscal illusion hypothesis (O'Brien and Shieh, 1990, p. 201). Hammes
and Wills (1987) used an identical analysis for Canadian data, and arrived at a similar conclusion.
In terms of the approach of Courant, Gramlich and Rubinfeld (1979) and Oates (1979), Grossman
(1990) and Marshall (1991) are more recent examples. Grossman approached the question of
flypaper illusion by arguing that the degree of illusion encompassed in grants was a function of the
level of indirectness. A federal grant, for example, would be more indirect or remote than a state
grant in terms of local government finance, and as a result induce a higher level of local
expenditures (Grossman, 1990, p. 314). Grossman (1990) regressed expenditures for local
government areas against various socio-economic variables and categories of grants, both federal
17
and state, conditional and unconditional. The results bolstered earlier studies (Courant, Gramlich
and Rubinfeld, 1979; Oates, 1979) in supporting the stimulatory effects of grants. Employing a
somewhat different methodology, Marshall (1989; 1991) used an exogenous illusion variable,
namely tax-windfalls, to analyse the flypaper illusionary hypothesis. Using a set of socio-economic
indicators (including the windfall) and a level of state expenditures, Marshall (1991, p. 1343) found
no systematic effect of the tax windfalls on the level of state expenditure.
Despite strong empirical support for the flypaper effect, several alternative hypotheses have been
developed. Romer and Rosenthal (1979) show that where the public budgetary agenda is
dominated by political agents, the outcome may be determined by threat tactics. In this manner an
upward bias in expenditures need not imply any systematic illusion such as the flypaper effect.
Dougan and Kenyon (1988) offer an explanation of the flypaper effect being the result of lobbying
by local pressure groups. As a result the stimulative effect of grants need not be the outcome of a
widespread tax-price illusion but rather the alteration of the relative wealth positions of various
pressure groups (Dougan and Kenyon, 1988, p. 169). Oates (1988) has utilised both the works of
Romer and Rosenthal (1979) and Dougan and Kenyon (1988) to argue that normal political
budgetary processes may fulfil the theoretical role of fiscal illusion in biasing expenditures
upwards, and that the stimulatory effect of grants is incorrectly identified as being the result of
flypaper illusion.
5.2 Utility Profits
An illusion closely related to that of the intergovernmental grants based flypaper effect is the public
utility profit illusion. First described by Puviani (1903), this approach recognises that utility or
public domain profits are used in internal subsidisation to reduce the perceived tax-price of public
good expenditure (Buchanan, 1967, p. 131). The result is similar to the flypaper effect in that
income, whether from grants or profits, that reduces the average tax-price is misperceived to
decrease the more economically relevant marginal tax-price, thereby expanding the level of
expenditure. The only difference is that grants are exogenous rather than endogenous to local
government ownership, in comparison with to utility profits.
The only study directed at the disjunction between costs and benefits caused by utility profits has
been undertaken by DiLorenzo (1982b). Using reduced form expenditure equations similar to
Wagner (1976) and Munley and Greene (1978), DiLorenzo (see Table 3) regressed per capita
expenditures, inclusive and exclusive of utility profits, against various socio-economic variables
and a dummy variable for internal subsidisation. The results for the sample of New York state
municipalities indicated that public utility profits did indeed bias expenditures upwards by reducing
the perceived marginal tax-price, thereby supporting the fiscal illusion hypothesis (DiLorenzo,
1982b, p. 249). This result held for both expenditures in total and for that regression where only
"own" revenues (exclusive of utility profits) were tested. However, despite the support offered by

18
DiLorenzo's (1982b) analysis, the model may be questioned in a similar manner to that of the
flypaper effect.

19
TABLE 3.
Summary of major studies of the "flypaper" effect Author(s) Data
(a)
Estimation
technique
(b)
Dependent
Variable (c)
Measure(s) of
Fiscal Illusion
Employed (d)
Other Independent Variables
(d)
Major
Findings
DiLorenzo
(1982b)
116 New
York
municipal
ities
Cross-
sectional
1976
OLS Per capita
total
expenditure
and
expenditures
exclusive of
utility profits
(Herfindahl)
revenue-
complexity,
dummy
variable for
municipalities
practising
internal
subsidisation
(utility
profits).
Population, per capita
income, percentage non-
white income,
intergovernmental income,
average monthly wage.
Positive and
significant
value for
utility
profits.
Internal
subsidisation
(utility
profits)
increases the
level of
expenditure.
Winer
(1983)
10
Canadian
provinces
, pooled
time-
series,
cross-
sectional.
1952/53-
1969/70
TSLS Net
provincial
expenditure
Not applicable Per capita income (+ lagged
income), federal grants
(+lagged grants), grants to
other provinces (+lagged
other grants), dummies for
population and provincial
groups (donor and recipient).
Expenditure
separation
reduces
perceived
tax-prices
and increases
expenditures.
Grant
elasticity
higher in
recipient
provinces.
Logan
(1986)
US
national
Time-
series
1947-
1983
OLS (linear
and non-
linear)
Per capita
federal direct
non-aid
expenditure
Not applicable Per capita income, per
capita total federal aid to
state and local expenditure,
per capita total state and
local expenditure,
unemployment rate, dummy
for war.
Grants
process
modifies
perceived
tax-prices of
recipient and
donor
expenditure.
Hammes and
Wills
(1987)
Canada
national
Time-
series
1962-
1984
OLS (log-
linear and
nonlinear)
Real per
capita federal
non-aid
expenditures,
real per
capita
recipient
government
expenditures.
Not applicable Perceived price of grantor
(federal) expenditures,per
capita income, perceived
price of recipient (provincial
and local) expenditures.
Results
similar to
that of Logan
(1986).
Alternative
support for
hypothesis of
"fly-paper
effect"
Marshall
(1989; 1991)
50 US
states
Cross-
sectional
1986
TSLS Expenditure
per capita
Change in
per capita
expenditures.
Estimated per
capita tax
windfall.
Per capita income, per capita
intergovernmental revenue,
price of public goods
(employee salaries),
population, state share of
final expenditure on public
goods, percentage urban
population, population
density.
Per capita tax windfall.
Windfall
revenue
exerts a
positive
though
insignificant
effect on
expenditure.

20
Author(s) Data
(a)
Estimation
technique
(b)
Dependent
Variable (c)
Measure(s) of
Fiscal Illusion
Employed (d)
Other Independent Variables
(d)
Major
Findings
Grossman
(1990)
136
Virginian
localities
Cross-
sectional
1982 and
1983
TSLS Three
expenditure
categories;
education,
public safety
and general
government
admin.
Federal and
state
unconditional
grants, state
unconditional
grants, federal
+ state
categorical
grants.
Median household income,
tax price (local) share,
percentage urban
population, percentage
black.
Uncondition-
al grants are
positive and
significant in
increasing
the level of
expenditure.
Stewart
(1993)
Australia
National
time-
series
1949-
1992.
OLS Total state
and local
government
outlays.
Not applicable National income, total net
aid to all state and local
governments, unemployment
rate.
Increase in
grants
associated
with fall in
own-purpose
expenditures.
Heyndels
and
Smolders
(1994)
302
Flemish
municipal-
ities Cross-
sectional
1990
OLS (log-
linear)
Total
expenditure.
(Herfindahl)
revenue-
complexity,
(Oates)
income
elasticity ,
percentage
non-owner
occupied,
grant income
divided by
total income.
Population, median voter tax
share, median voter total
disposable income.
Positive and
significant
impact of
grants on
expenditure.
Dollery and
Worthington
(1995a)
7
Australian
states.
Pooled
time-series,
cross-
sectional
(1982-
1992)
OLS and
GLS (linear
and log-
linear)
Total
expenditure
and total
expenditure
net of grants
and transfers.
(Herfindahl)
revenue-
complexity,
(Oates)
income
elasticity, ratio
of direct to
indirect taxes,
dummy
variables for
reliance on
grant income.
Population, median voter
income, proportion of
poulation under 19 years,
proportion of population
over 65 years, population
density, dummies for large
and small states.
Strong
empirical
support for
the
"flypaper"
effect.
Dollery and
Worthington
(1995b)
Australia
National
time-
series
1981-
1992
OLS (linear
and log-
linear)
Per capita
federal non-
grant
expenditures.
Not applicable Perceived price of grantor
expenditures, per capita
national income, perceived
price of recipient
expenditures, per capita
state and local expenditures,
unemployment rate.
Support for
"flypaper"
effect at
grantor level.
(a) Singular dates represent cross-sectional studies, intervals time series. Where two dates are given, different years for some cross-
sectional variables have been used. (b) OLS/GLS/TSLS - Ordinary Least Squares, Generalised Least Squares and Two-Stage Least
Squares respectively. (c) More than one dependent variable indicates alternative equations have been evaluated. (d) Italicised
independent variables indicate significant t-values at 90% or more.
6. Renter Illusion
21
A fourth type of fiscal illusion that has received attention in the empirical literature is renter
illusion. In this approach, an increase in a jurisdiction's proportion of renters will ceteris paribus
increase the level of expenditures. The presumption is that since the primary revenue of local
governments is the property tax, only those voters directly levied (owners) will correctly perceive
the tax-price of the local public good. Whilst we could expect that higher property taxes will be
passed onto renters via higher rents, the illusionary hypothesis argues that a disjunction exists
between a rental voter's perception of the level of public good services and the level of rents paid.
Even if the illusionary influence is not perfect, so long as the actual tax-price is underestimated,
rental voters will support higher levels of public expenditure and would therefore bias expenditures
upwards. The ability of this group to increase the level of expenditure would then depend on the
number of voters involved.
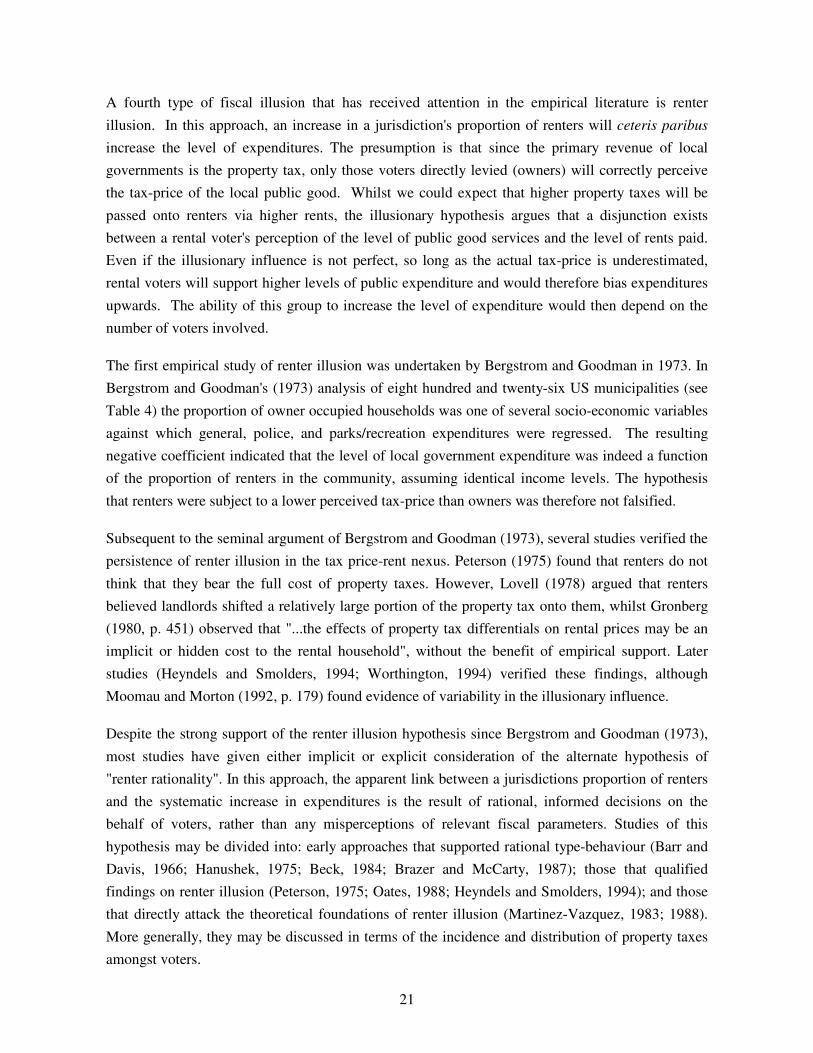
The first empirical study of renter illusion was undertaken by Bergstrom and Goodman in 1973. In
Bergstrom and Goodman's (1973) analysis of eight hundred and twenty-six US municipalities (see
Table 4) the proportion of owner occupied households was one of several socio-economic variables
against which general, police, and parks/recreation expenditures were regressed. The resulting
negative coefficient indicated that the level of local government expenditure was indeed a function
of the proportion of renters in the community, assuming identical income levels. The hypothesis
that renters were subject to a lower perceived tax-price than owners was therefore not falsified.
Subsequent to the seminal argument of Bergstrom and Goodman (1973), several studies verified the
persistence of renter illusion in the tax price-rent nexus. Peterson (1975) found that renters do not
think that they bear the full cost of property taxes. However, Lovell (1978) argued that renters
believed landlords shifted a relatively large portion of the property tax onto them, whilst Gronberg
(1980, p. 451) observed that "...the effects of property tax differentials on rental prices may be an
implicit or hidden cost to the rental household", without the benefit of empirical support. Later
studies (Heyndels and Smolders, 1994; Worthington, 1994) verified these findings, although
Moomau and Morton (1992, p. 179) found evidence of variability in the illusionary influence.
Despite the strong support of the renter illusion hypothesis since Bergstrom and Goodman (1973),
most studies have given either implicit or explicit consideration of the alternate hypothesis of
"renter rationality". In this approach, the apparent link between a jurisdictions proportion of renters
and the systematic increase in expenditures is the result of rational, informed decisions on the
behalf of voters, rather than any misperceptions of relevant fiscal parameters. Studies of this
hypothesis may be divided into: early approaches that supported rational type-behaviour (Barr and
Davis, 1966; Hanushek, 1975; Beck, 1984; Brazer and McCarty, 1987); those that qualified
findings on renter illusion (Peterson, 1975; Oates, 1988; Heyndels and Smolders, 1994); and those
that directly attack the theoretical foundations of renter illusion (Martinez-Vazquez, 1983; 1988).
More generally, they may be discussed in terms of the incidence and distribution of property taxes
amongst voters.

22
First, Barr and Davis (1966) argued that the market for rental properties would be unaffected by
modifications in property tax. Given that the supply of such properties was fixed in the short run,
and the demand for rental property did not depend on the tax rate, they proposed inter alia that the
property tax change would not be passed on to renters. Barr and Davis (1966, p. 152) added that
"...in addition, the long run is indeed long in terms of tax shifting since sufficient time must be
allowed for the tax to prevent what would have otherwise been a non-negligible addition to the
stock of rental properties". The absence of effective shifting of property taxes onto renters, in both
the short and long run, will ensure a lower tax price for renters, and voter outcomes consistent with
rational decisions.
Following Barr and Davis (1966), the issue of property tax-rent shifting has received some attention
in the literature. Oates (1988) proposed certain circumstances where the burden of tax-expenditure
increases would be shifted onto tenants as against owners; more specifically, "if the higher revenues
are associated with improved local services, then the tax-expenditure increase should translate into
a higher demand for rental housing...that will drive up rents" (Oates, 1988, p. 72). However, Oates
noted where tax differentials do not reflect service differentials and where long leases existed there
is a reduction in the present discounted value of any tax increase; the burden of tax may thus remain
on the lessor. Peterson (1975) and Hanushek (1975) have also addressed the issue of tax-shifting,
and more particularly in the case of the former, the role of time lags in rental contracts. Whilst
much empirical work remains to be done, there does appear to be some evidence that renters may
have significantly lower tax-prices than owner occupants.
Second, a somewhat related renter rationality argument has been proposed by Martinez-Vazquez
(1983). Quite apart from the plausible arguments that renters differ from owner-occupiers in terms
of both income (for instance, since renters have lower incomes they benefit from the progressive
incidence of fiscal budgets) and general preference for public goods (for example, renters tend to
have more school-age children) Martinez-Vazquez (1983, p. 244) proposed that the voting
behaviour of renters will vary because they have a lower level of housing consumption expenditure,
holding income constant. Since property taxes are often levied in proportion to the consumption of
housing, any increase in expenditure on publicly-provided goods will entail larger net benefits to
renters than homeowners of the same income level. If we assume that renters vote rationally,
increases in expenditure will be the result of such considerations, not renter illusion. In fact, such an
outcome will be enhanced where renters have stronger preferences for the public good or where full
tax shifting has not occurred. Accordingly, the lower the level of housing consumption expenditure
or income for renters compared to owner-occupiers, and the higher the level of benefits of the
former, the more likely voter outcomes are consistent with rational behaviour. Martinez-Vazquez
(1983) tested the alternative hypothesis using data from a 1974 St Louis expenditure referendum.
As shown in Table 4, the initial model regressed the number of "yes" votes favouring a higher level
of expenditure against the percentage of renters and median income. The coefficient for the
proportion of renters was positive and significant, prima facie evidence of renter illusion

23
(Martinez-Vazquez, 1983, p. 241). However, when the net benefits of the higher levels of
expenditure were regressed against the percentage of renters and the median income, the results
indicated that renters had voted rationally. Accordingly, whilst "the possibility of a certain degree of
fiscal illusion in renter's behaviour cannot be excluded...[the present argument] provides sufficient
bases to question the predominance, if not the validity, of the fiscal illusion hypothesis in
explaining renters' behaviour" (Martinez-Vazquez, 1983, p. 244).
TABLE 4.
Summary of major studies of renter illusion Author(s) Data
(a)
Estimation
technique
(b)
Dependent
Variable (c)
Measure(s) of
Fiscal Illusion
Employed (d)
Other Independent Variables
(d)
Major
Findings
Barr and
Davis
(1966)
64 Penn-
sylvanian
municipal
areas
Cross-
sectional
1959
OLS Per capita
general,
highway,
judicial and
other
expenditures.
Percentage of
electorate
owning
property.
Per capita assessed property
value.
Property
holding an
important
determinant
of
expenditure
decisions.
Bergstrom
and
Goodman
(1973)
826 US
municipal
areas
Cross-
sectional
1962
OLS (log-
linear)
Total
expenditures
on police,
parks and
total
excluding
education
and welfare.
Percentage of
municipal
housing owner
occupied.
Number of households, tax
share of median voter,
median income, measure of
the crowding of the public
good, percentage population
change, percentage non-
white, of population > 65,
population density.
Negative and
significant
coefficient
between
percentage
owner
occupied and
the level of
general
expenditures.
Hanushek
(1975)
140
Cleveland
precincts
Cross-
sectional
1960
OLS Probability
of voter
turnout,
probability of
voting in
favour of
expenditure
increase.
Percent homes
owner-
occupied.
Median income, value of
owner-occupied dwelling,
gross rent, ethnic
breakdown, educational
level, age level.
Homeowners
tend to vote
more readily
against
increases in
public
expenditure.
Peterson
(1975)
School
districts in
California
Michigan
N. Jersey
N. York
Kansas
Cross-
sectional
1968-71
OLS
(log-log)
Desired
school
spending per
pupil.
Percentage of
adult renters
in school
district.
Dummy
variable for
renter status.
Household income, property
tax base value divided by
property value per pupil,
state aid per pupil, number
of school children in
household.
The rental
population of
an area is
associated
with the
demand for
higher public
service
levels.
Lovell
(1978)
136
Connect-
icut towns
Cross-
sectional
1970
OLS, GLS
(linear and
log-linear)
Educational
expenditure
per pupil.
Proportion of
homes owner-
occupied in
town.
Percentage of population in
poverty, median family
income, skewness of income
distribution, property per
pupil, median school years,
enrolments, percentage of
Democrat voters.
Expenditures
negatively
related to the
level of
owner
occupied
housing.

24
Gronberg
(1980)
83
Chicago
localities
Cross-
sectional
1970
OLS, TSLS Total
municipal
expenditures.
Percentage
owner
occupied in
local area.
Labour force participation
rate, percentage of non-
whites, per capita assessed
value of property, median
voter income, median voter
tax share.
Proportion of
owner
occupied
negatively
related to
level of
expenditures.
25
Author(s) Data
(a)
Estimation
technique
(b)
Dependent
Variable (c)
Measure of
Fiscal Illusion
Employed (d)
Other Independent Variables
(d)
Major
Findings
Martinez-
Vazquez
(1983)
Sundry
St Louis
precincts
Cross-
sectional
1974
OLS "Yes" votes
on increased
expenditures
in police,
fire, parks,
highway,
library.
Net benefits
of increased
expenditures.
Percentage of
renters in
precinct.
Median income.
Higher
proportion of
"yes" votes
attributable
to high rates
of renter
occupation.
Results also
suggest that
"yes" votes
on the behalf
of renters are
rational
rather than
illusionary.
Beck
(1984)
219
California
municipal
areas
Cross-
sectional
1971-74
NLLS Per capita
total
expenditure.
Percent of
owner-
occupied
housing.
Per capita grant aid, tax
base per household, per
capita sales tax revenue,
median family income,
percentage non-white,
percentage over 65 years,
population, Gini coefficient.
Demand for
municipal
services is a
nonmono-
tonic
function of
income, with
minimum
varying
across
communities.
Brazer and
McCarty
(1987)
600
Connec-
ticut New
Jersey
Virginia
districts
Cross-
sectional
1981-82
OLS
(log-linear)
School
expenditure
per pupil.
Municipal
expenditure
per capita.
Proportion of
owner-
occupiers.
Tax price, state and federal
aid, proportion aged,
education, poverty ratio,
enrolment rates, population
growth and density,
nonresident and resident
pupils, urbanisation.
Coefficient
on owner-
occupier
negative and
significant.
Schokkaert
(1987)
2404
persons in
Purrs,
Belgium
1986
Logit Probability
of favouring
increase in
expenditure.
Dummy
variable for
home-
ownership.
Dummy variables for age,
unemployment, urban status,
job description, sports
activity; measures of age,
education, sex, income, tax.
Homeowners
appear more
favourable to
increases in
expenditure.
Schwab and
Zampelli
(1987)
73
Maryland
cities and
counties
Cross-
sectional
1978
NLLS Per capita
police
expenditure.
Proportion of
owner-
occupiers.
Per capita income, price,
grants, percentage non-
white, unemployed, high
school graduates.
No
relationship
between
percentage of
homeowners
and police
expenditure.
Moomau and
Morton
(1992)
428 New
Orleans
precincts
Cross-
sectional
1982
Logit Probability
of voting in
favour of
change in
property tax.
Percentage of
renter and
homeowner
households.
Income, rental contract
value, percentage white,
percentage black, homestead
exemption value.
The higher
the value of
rent the more
likely renters
will perceive
the tax
burden.

26
Author(s) Data
(a)
Estimation
technique
(b)
Dependent
Variable (c)
Measure of
Fiscal Illusion
Employed (d)
Other Independent Variables
(d)
Major
Findings
Heyndels and
Smolders
(1994)
302
Flemish
municipal
areas
Cross-
sectional
1990
OLS
(log-linear)
Total
expenditure.
(Herfindahl)
revenue-
complexity,
(Oates)
income
elasticity ,
percentage
non-owner
occupied,
grant income
divided by
total income.
Population, median voter tax
share, median voter total
disposable income, measure
of revenue-complexity,
income elasticity measure,
grant income equivalent
divided by total income.
No
relationship
between
occupancy
status and
expenditure
outcomes.
Carroll and
Yinger
(1994)
147
Boston
towns
Cross-
sectional
1980
OLS,
2SLS, Box-
Cox.
Median rents,
index of
public
service
quality, tax
rate.
Fraction of
rental housing
units.
Rental characteristics,
population density, distance
to CBD/highway, population
growth rate.
Property tax
increases are
exactly off-
set by
increases in
rents.
Provides
support for
renter
rationality.
Worthington
(1994)
46
Austral-
ian LGAs
Cross-
sectional
1991
OLS TSLS
(linear and
log-linear)
Total and per
capita
expenditure.
Proportion
owner-
occupied,
(Herfindahl)
revenue-
complexity,
dummies for
grant and
utility
reliance,
indirectness of
revenue
system.
Rateable area and roads,
median voter tax price,
income, population,
proportion of population
over 65 years, measure of
revenue-complexity,
dummies for grant and utility
reliance, ndirectness of
revenue system.
Proportion
owner-
occupied and
expenditure
negatively
related.
a) Singular dates represent cross-sectional studies - where two dates are given, different years for some cross-sectional variables
have been used. b) OLS/GLS/TSLS/NLLS - Ordinary Least Squares, Generalised Least Squares, Two-Stage Least Squares and
Non-Linear Least Squares respectively. c) More than one dependent variable indicates alternative equations have been evaluated.
d) Italicised independent variables indicate significant t-values at 90% or more.
7. Debt Illusion
The final form of fiscal illusion is debt illusion. Here voters are more aware of the costs of public
sector programs if they are paid for through current taxation rather than public-sector borrowing.
Generally, this results from imperfect information available to individuals on the time path of the
future benefits or costs of governmental activity. Accordingly, "the excess of the present value of
perceived future net benefits over the present value of actual net future benefits represents an
illusionary addition to wealth which can affect real consumption and investment decisions" (Floyd
and Hynes, 1978, p. 381). The general presumption is that since a price differential exists between
the perceived tax-price of debt based expenditure and that of taxation, reliance on debt will ceteris
27
paribus imply a larger expenditure on the public good. Buchanan (1967; 1982) proposed two types
of debt-illusion. The first a "Vickrey-type" decision illusion where an individuals subjective
assessment of debt on future tax liabilities was undervalued; and the "Puviani-type" behavioural
distinction where the subjective assessment of the diminution of the value of assets are not treated
in the same manner as a lump-sum taxation payment. Buchanan (1967, p. 161) maintains that for
both of these approaches subjective criteria dominate at the time of the selection of debt, with the
objective costs only recognised in subsequent time-periods.
One of the first approaches to the question of debt in governmental finance was undertaken by
Puviani (1967). Puviani (1967) accepted the basic Ricardian proposition that the payment of an
annual tax in perpetuity and a lump-sum extraordinary capital payment were in some sense
equivalent (Buchanan, 1967; 1982; Buchanan and Roback, 1987)). However, Puviani (1967) argued
that individual taxpayers do not make allocative decisions on this premise. In fact, individuals will
not be indifferent to the selection of debt or taxation in violation of Ricardian equivalence, so that
future tax liabilities are undervalued because of the issue of "control" (Buchanan, 1967, p. 132).
Thus "...the individual retains control over a capital value which, even though fully offset by the
liability stemming from the capitalised value of future taxes, remains desirable" (Buchanan, 1967,
p. 132). An alternative to Puviani's (1967) and Buchanan's (1967; 1982) approach is that proposed
by Floyd and Hynes (1978). Here an individual's decisions on future tax and debt liabilities are
based on two sources of information: firstly, information derived from the current political process,
like policy platforms; and secondly, analysis of past trends in government expenditure and taxation
(Floyd and Hynes). Floyd and Hynes argue that unless marked (and predictable) changes occur in
the current political profile, decisions are likely to be (rationally) based upon past behaviour, and
therefore debt illusion is inclined to arise when the past trends do not accurately predict future
outcomes. In both approaches an illusionary effect is created when rational individuals prefer debt
to current taxation due to imperfect information.
Given that a fiscal illusion exists when taxpayers underestimate the present discounted value of
future tax liabilities under debt finance, it becomes necessary to identify the feedback of debt
related choices. In general, since assets and not individuals are taxed at the local level (though not
necessarily at that of the state), the empirical question becomes one of the efficacy of community
debts capitalisation into individual asset values (Yinger, 1982). The presumption is that the
preference for debt exists under illusion because of perceived tax-price advantage; that is,
undercapitalisation, even though under "Ricardian equivalence" no differential exists. Since debt
based programs have a lower perceived tax-price, higher levels of expenditure will be demanded,
and the debt illusion will have succeeded in biasing expenditures upwards.
The issue of debt capitalisation suggested a possible test for the existence of debt illusion to writers
such as Daly (1969) and Oates (1969). As Oates (1988, pp. 76-77) has observed:
28
Consider two otherwise identical communities that undertake identical capital projects. One
community, call it A, finances the project out of current revenues, while community B
chooses to employ bond finance so as to spread out the payments for the project over future
years. At the end of the current year, the sole differences between a "typical resident" of A
and B will be that the latter will have a future tax liability whose present discounted value
equals the recent differential tax payment by the resident of A. In a world of mobile
consumers, this future tax liability associated with residing in community B will become
capitalised into lower property values in B ...other things being equal, we should find, that if
there is a debt illusion, that the future tax liabilities associated with the debt are not fully
capitalised into local property values.
Earlier Oates (1969) undertook a somewhat more holistic approach to local government finance
than that required for the issue of debt illusion, which nevertheless does throw light on the issue of
empirical analysis (see Table 5). Using a sample of municipalities, Oates (1969, p. 958) attempted
to observe the impact of local expenditure programs and property taxes on property values.
Regressing housing values against various socio-economic determinates and municipal tax rates and
expenditures, Oates (1969, p. 965) found that housing values are negatively related to tax rates and
positively related to expenditures. Oates (1969) essentially undertook this analysis as an empirical
test of Tiebout mobility. He used the results to argue that consumers will select a community (at
least in terms of housing value) by maximising net benefit, taking into account the positive effect of
higher expenditure levels and the detrimental effect of higher tax-prices. Such outcomes have
persistently been verified in the numerous housing capitalisation studies that followed. (See
Chaudry-Shah (1985) for a survey of these cross and intra-jurisdictional fiscal impacts). However,
these studies do not provide an adequate test of the debt illusion hypothesis. In general, this is
because they are concerned with the capitalisation of expenditure financed solely by current
taxation, not with the differentials that may exist between identical communities that finance
expenditure with either debt or current taxation.
A study more closely related to debt illusion was undertaken by Epple and Schipper (1981). In this
approach (see Table 5) a cross-sectional study regressed median home values against a standard set
of socio-economic variables and a proxy for estimated unfunded pension liabilities. The
hypothesised value for the unfunded service requirement was unitary and negative indicating that
municipal residents expected pension obligations to be funded from local taxes. If full
capitalisation of the liability was found, then the presumption would be that debt illusion did not
exist and that the tax-price of debt funded expenditure was accurately perceived. The results failed
to support the hypothesis of no capitalisation. However, Epple and Schipper (1981, p. 170) noted
that further work was required, whilst Inman (1981) observed that the expected differential between
estimated (underestimated) and actual unfunded pension liabilities was crucial to any examination.
Subsequently, Inman (1982, pp. 69-70) reexamined the issue of pension funding, finding that the
continued controversy on the correct estimation of capitalisation models, and the lack of consistent
and independent measures of unfunded liabilities, was a significant reason why only Epple and
Schipper (1981) had addressed this issue.
29
Finally, in an international analysis Dalamagas (1993) investigated the conflicting views of the
traditional Keynesian approaches to the stimulatory effect of debt financed tax-cuts compared with
that of Ricardian equivalence where tax and debt finance are equivalent, and therefore tax-cuts are
inconsequential. Regressing the level of private sector consumption against tax revenue,
government debt/deficit and inflation, Dalamagas found that the substitution of debt for taxes is
misinterpreted as a net addition to wealth and private per capita consumption expenditures rise.
However, the relevance of the Dalamagas (1992; 1993) analysis to the present study is limited. This
is because unlike the majority of fiscal illusion studies, Dalamagas (1992; 1993) is concerned with
the impact of debt illusion on private consumption and not on public expenditure.
TABLE 5.
Summary of major studies of debt illusion Author(s) Data
(a)
Estimation
technique
(b)
Dependent
Variable(s)
(c)
Measure(s) of
Fiscal Illusion
Employed (d)
Other Independent Variables
(d)
Major
Findings
Oates (1969)
53 New
Jersey
municipal
ities
Cross-
sectional
1961 and
1963.
OLS (log-
linear) and
TSLS
Median
residential
home value
Degree of
capitalisation.
Effective tax-rate (average
1956-60), distance to urban
centre (Manhattan), median
number of rooms,
percentage of houses built
since 1950, median family
income, percentage of
families with lower level
income.
Taxes and
expenditures
are
capitalised
into housing
values.
Epple and
Schipper
(1981)
130
Pennsylva
nian
municipal
-ities and
57
Pittsburgh
municipal
-ities.
Cross-
sectional
1976
OLS (log-
linear)
Median
value of
residential
property.
Degree of
capitalisation
School expenditures per
capita, effective tax rate,
unfunded service cost/
market value of property,
median income, travel time
to CBD, proportion of homes
lacking some or all plumbing
facilities.
Unfunded
service costs
(proxy for
debt) either
insignificant-
ly positive or
excessively
negative
(greater than
1) indicating
over
capitalisation
Dalamagas
(1992)
Dalamagas
(1993)
52
countries
Pooled
time-
series,
cross-
sectional
1978/79-
1987/88
51
countries
Cross-
sectional
based on
10 year
averages
1980-
1989
OLS
OLS
Real per
capita
private
consumption.
Real per
capita
private
consumption.
Consumption
expenditures
relative to
debt levels.
Consumption
expenditures
relative to
debt levels.
GDP and lagged GDP,
Government expenditure and
lagged government
expenditure, budget deficit
and lagged deficit.
Ratio of taxes, deficit to
GDP, inflation, dummies
(debt/GDP) for debted
(>46%), intermediate (35% -
45%) and solvent countries
(<35%).
The
subsitution
of debt for
taxes causes
a revision in
private
consumption
decisions.
Debt illusion
absent in
high debt-
GDP ratio
countries,
present in
low debt-
GDP ratio
countries.

30
a) Singular dates represent cross-sectional studies - where two dates are given, different years for some cross-sectional variables
have been used. b) OLS/GLS/TSLS/NLLS - Ordinary Least Squares, Generalised Least Squares, Two-Stage Least Squares and
Non-Linear Least Squares respectively. c) More than one dependent variable indicates alternative equations have been evaluated.d)
Italicised independent variables indicate significant t-values at 90% or more.
31
7. Concluding Remarks
In summarising past empirical studies of fiscal illusion several dominant themes emerge. The first
is that, in general, results have been mixed. Whilst many studies have found unqualified support for
a particular hypothesis, others have found the implications for fiscal illusion inconclusive. This is
in part attributable to the diversity of data and models employed. In addition, the heterogeneity of
results also applies across the different manifestations of fiscal illusion. Moreover, significant
attention has been directed to the issues of revenue-complexity, revenue-elasticity and renter
illusion, whereas few resources have been deployed to other forms of fiscal illusion, particularly
debt illusion. Even more noticeable is the failure of most empirical studies to incorporate more
than one illusionary hypothesis and few studies have analysed more than two (Wagner, 1976;
DiLorenzo, 1982a, 1982b; Martinez-Vazquez, 1988; Grossman, 1990; Worthington, 1994; Dollery
and Worthington, 1995a; 1995b). Secondly, the ability to find empirical support for the fiscal
illusion hypothesis is persistently qualified by alternative hypotheses and the endogeneity of some
variables. Whilst some of these issues may be addressed by careful econometric analysis, it may
not be possible to resolve fully the psychological black box in which decisions under incomplete
and partial information are undertaken. Finally, the body of theory concerning fiscal illusion is
incomplete. Issues such as the derivation of suitable proxies for illusionary variables and the
usefulness of these variables remain contentious. It may well be that the assumptions used in past
approaches to fiscal illusion lack the theoretical rigour required for empirical analysis.
Acknowledgements
We would like to thank two anonymous referees and the editor for helpful comments on an earlier
version of the paper. We would also like to acknowledge our debt to the following persons:
Professor Dennis Epple of Northwestern University; Professor Peter Forsyth of the University of
New England; Professor Robert Inman of the University of Pennsylvania; and Professor Louise
Marshall of the University of Maryland. This paper is based on an M.Ec. dissertation written by
Andrew Worthington (1994) and supervised by Brian Dollery.
References
Anderson, W, Wallace, M.S. and Warner, J.T. (1986) Government Spending and Taxation: What
Causes What? Southern Economic Journal 52, 630-639.
Baker, S.H. (1983) The Determinants of Median Voter Tax Liability: An Empirical Test of the
Fiscal Illusion Hypothesis. Public Finance Quarterly 11, 95-108.
Barr, J.L. and Davis, O.A. (1966) An Elementary Political and Economic Theory of the
Expenditures of Local Governments. The Southern Economic Journal 33, 149-165.

32
______. (1966) An Elementary Political and Economic Theory of the Expenditures of Local
Governments. The Southern Economic Journal 33, 149-165.
Beck, J.H. (1984) Nonmonotonic Demand for Municipal Services: Variation Among Communities.
National Tax Journal 37, 55-68.
Bergstrom, T.C. and Goodman, R.P. (1973) Private Demands for Public Goods. American
Economic Review 63, 280-296.
Brazer, H.E. and McCarty, T.A. (1987) Interaction Between Demand for Education and for
Municipal Services. National Tax Journal 40, 555-566.
Breeden, C.H. and Hunter, W.J. (1985) Tax Revenue and Tax Structure. Public Finance Quarterly
13, 216-224.
Buchanan, J.M. (1967) The Fiscal Illusion. In Public Finance in Democratic Process: Fiscal
Institutions and Individual Choice. Chapel Hill: University of North Carolina Press.
______. (1982) Public Debt, Cost Theory and the Fiscal Illusion. In J.M. Ferguson (ed) Public Debt
and Future Generations. Chapel Hill: University of North Carolina Press.
______. and Roback, J. (1987) The Incidence and Effects of Public Debt in the Absence of Fiscal
Illusion. Public Finance Quarterly 15, 5-25.
Carroll, R.J. and Yinger, J. (1994) Is the Property Tax a Benefit Tax? The Case of Rental Housing.
National Tax Journal 47, 295-316
Clotfelter, C.T. (1976) Public Spending for Higher Education: An Empirical Test of Two
Hypotheses. Public Finance 31, 177-195.
Courant, P. Gramlich, E. and Rubinfeld, D. (1979) The Stimulative Effects of Intergovernmental
Grants: Or Why Money Sticks Where it Hits. In P. Mieszowski and W. Oakland (ed) Fiscal
Federalism and Grants-in-Aid. Washington D.C: The Urban Institute.
Craig, E.D. and Heins, A.J. (1980) The Effect of Tax Elasticity on Public Spending. Public Choice
33, 267-275.
Crane, R. (1990) Price Specification and the Demand for Public Goods. Journal of Public
Economics 43, 93-106.
Cullis, J.G. and Jones, P.R. (1987) Fiscal Illusion and Excessive Budgets: Some Indirect Evidence.
Public Finance Quarterly 15, 219-228.
Dalamagas, B.A. (1992) How Rival are the Ricardian Equivalence Proposition and the Fiscal Policy
Potency View? Scottish Journal of Political Economy 39, 457-476.
______. (1993) Fiscal Illusion and the Level of Indebtedness: An International Comparison. South
African Journal of Economics 61, 45-58.
33
Daly, G.G. (1969) The Burden of the Debt and Future Generations in Local Finance. Southern
Economic Journal 36, 44-51.
DiLorenzo, T.J. (1982a) Tax Elasticity and the Growth of Local Public Expenditure. Public
Finance Quarterly 10, 385-392.
______. (1982b) Utility Profits, Fiscal Illusion and Local Public Expenditures. Public Choice 38,
243-252.
Dollery, B.E. and Worthington, A.C. (1995a) State Expenditure and Fiscal Illusion in Australia: A
Test of the Revenue Complexity, Revenue Elasticity and Flypaper Hypotheses. Economic
Analysis and Policy (forthcoming).
______. and Worthington, A.C. (1995b) Federal Expenditure and Fiscal Illusion: An Australian
Test of the Flypaper Hypothesis. Publius: The Journal of Federalism (forthcoming).
Dougan, W.R. and Kenyon, D.A. (1988) Pressure Groups and Public Expenditures: The Flypaper
Effect Reconsidered. Economic Inquiry 26, 159-170.
Downs, A. (1957) An Economic Theory of Political Action in a Democracy. Journal of Political
Economy 65, 135-150.
Epple, D. and Schipper, K. (1981) Municipal Pension Funding: A Theory and Some Evidence.
Public Choice 37, 141-172.
Feenburg, D.R. and Rosen, H.S. (1987) Tax Structure and Public Sector Growth. Journal of Public
Economics 32, 185-201.
Floyd, J.E. and Hynes, J.A. (1978) Debt Illusion and Imperfect Information. European Economic
Review 11, 379-386.
Goetz, C.J. (1977) Fiscal Illusion in State and Local Finance. In T.E Borcherding (ed) Budgets and
Bureaucrats: The Sources of Government Growth. Durham: Duke University Press.
Greene, K.V. and Hawley, B.K. (1991) Personal Income Taxes, Elasticities and Fiscal Illusion.
Public Choice 72, 101-109.
Gronberg, T.J. (1980) The Interaction of Markets in Housing and Local Public Goods: A
Simultaneous Equations Approach. Southern Economic Journal 46, 445-455.
Grossman, P.J. (1990) The Impact of Federal and State Grants on Local Government Spending: A
Test of the Fiscal Illusion Hypothesis. Public Finance Quarterly 18, 313-327.
Hames, D.L. and Wills, D.T. (1987) Fiscal Illusion and the Grantor Government in Canada.
Economic Inquiry 25, 707-713.
Hamilton, B.W. (1983) The Flypaper Effect and Other Anomalies. Journal of Public Economics
22, 347-361.
34
Hanushek, E.A. (1975) The Demand for Local Public Services: An Exploratory Analysis. Chapter
in J.E. Jackson (ed) Public Needs and Private Behaviour in Metropolitan Areas. Cambridge
(Mass): Ballinger.
Hayes, K.J. (1989) A Specification Test for Choosing the 'Right' Public-Good Price. Journal of
Business and Economic Statistics 7, 267-273.
Henrekson, M. (1988) Swedish Goverment Growth: A Disequilibrium Analysis. In J. Lybeck and
M.Henrekson (ed) Explaining the Growth of Government. Amsterdam: North-Holland.
Heyndels, B. and Smolders, C. (1994) Fiscal Illusion at the Local Level: Empirical Evidence for the
Flemish Municipalities. Public Choice 80, 325-338.
Hunter, W.J. and Scott, C.E. (1986) Interstate Differences in Individual Income Taxes. Public
Finance Quarterly 14, 69-85.
______. and Scott, C.E. (1987) Statutory Changes in State Income Taxes: An Indirect Test of
Fiscal Illusion. Public Choice 53, 41-51.
Inman, R.P. (1981) Municipal Pension Funding: A Theory and Some Evidence: A Comment.
Public Choice 37, 179-187.
______. (1982) Public Employee Pensions and the Local Labor Budget. Journal of Public
Economics 19, 49-71.
Logan, R.R. (1986) Fiscal Illusion and the Grantor Government. Journal of Political Economy 44,
1304-1318.
______. and O'Brien, J.P. (1989) Fiscal Illusion, Budget Maximisers and Dynamic Equilibrium.
Public Choice 63, 222-235.
Lovell, M.C. (1978) Spending for Education: The Exercise of Public Choice. The Review of
Economics and Statistics 60, 487-495.
Marshall, L. (1989) Fiscal Illusion in Public Finance: A Theoretical and Empirical Study. PhD
Dissertation - University of Maryland.
______. (1991) New Evidence on Fiscal Illusion: The 1986 Tax Windfalls. American Economic
Review 81, 1336-1345.
Martinez-Vazquez, J. (1983) Renter's Illusion or Savvy? Public Finance Quarterly 11, 237-247.
______. and Sjoquist, D.L. (1988) Property Tax Financing, Renting and the Level of Local
Expenditures. Southern Economic Journal 85, 39-46.
______. Harwood, G.B. and Larkins E.R. (1992) Withholding Position and Income Tax
Compliance: Some Experimental Evidence. Public Finance Quarterly 20, 152-174.
McCulloch, J.R. (1975) A Treatise on the Practical Influence of Taxation and the Funding System.
Original Edition 1845, Reprint D.P. O'Brien (ed), Edinburgh: Scottish Academic Press.
35
Mill, J.S. (1973) Principles of Political Economy. Longman, Green and Co. Original Edition 1848,
New Edition 1909, Reprint New Jersey: Augustus M. Kelley, Clifton.
Misolek, W.S. and Elder, H.W. (1988) Tax Structure and the Size of Government: An Empirical
Analysis of the Fiscal Illusion and Fiscal Stress Arguments. Public Choice 57, 233-245.
Moomau, P.H. and Morton, R.B. (1992) Revealed Preferences for Property Taxes: An Empirical
Study of Perceived Tax Incidence. The Review of Economics and Statistics 74, 176-179.
Munley, V.G. and Greene, K.V. (1978) Fiscal Illusion, The Nature of Public Goods and Equation
Specification. Public Choice 33, 95-100.
O'Brien, J.P and Shieh, Y.N. (1990) Utility Functions and Fiscal Illusion from Grants. National Tax
Journal 43, 201-205.
Oates, W.E. (1969) The Effects of Property Taxes and Local Public Spending on Property Values:
An Empirical Study of Tax Capitalisation and the Tiebout Hypothesis. Journal of Political
Economy 77, 957-971.
______. (1972) Fiscal Federalism. New York: Harcourt Brace Jovanovich.
______. (1975) Automatic Increases in Tax Revenues - The Effect on the Size of the Public Budget.
In W.E Oates (ed) Financing the New Federalism: Revenue Sharing Conditional Grants and
Taxation. Baltimore: John Hopkins University Press.
______. (1979) Lump-sum Intergovernmental Grants have Price Effects. In P. Mieszkowski and W.
Oakland (ed) Fiscal Federalism and Grants-in-Aid. Washington D.C:The Urban Institute.
______. (1988) On the Nature and Measurement of Fiscal Illusion: A Survey. In G. Brennan, B.S.
Grewel and P. Groenwegen (ed) Taxation and Fiscal Federalism: Essays in Honour of Russell
Mathews. Sydney: ANU Press.
Peterson, G. (1975) Voter Demand for Public School Expenditures. Chapter in J.E. Jackson (ed)
Public Needs and Private Behaviour in Metropolitan Areas. Cambridge (Mass), Ballinger.
Pommerehne, W.W. (1978) Institutional Approaches to Public Expenditure: Empirical Evidence
from Swiss Cities. Journal of Public Economics 9, 255-280.
______. and Schneider, F. (1978) Fiscal Illusion, Political Institutions and Local Public Spending.
Kyklos 31, 381-408.
Puviani, A. (1967) Teoria della Illusione Finanziaria, Remo Sandon, Milan, 1903. Partially
translated and edited by J.M Buchanan in 'The Fiscal Illusion'. Chapter in Public Finance in
Democratic Process: Fiscal Institutions and Individual Choice. Chapel Hill: University of
North Carolina Press.
Romer, T. and Rosenthal, H. (1979) The Elusive Median Voter. Journal of Public Economics 12,
143-170.

36
Schokkaert, E. (1987) Preferences and Demand for Local Public Spending. Journal of Public
Economics 34, 175-188.
Schwab, R.M. and Oates, W.E. (1991) Community Composition and the Provision of Local Public
Goods: A Normative Analysis. Journal of Public Economics 44, 217-237.
______. and Zampelli, E.M. (1987) Disentangling the Demand Function from the Production
Function for Local Public Services: The Case of Public Safety. Journal of Urban Economics
33, 245-260.
Stewart, M.F. (1993) Fiscal Illusion (The Flypaper Effect) and Government Spending in Australia.
Paper presented at November 1993 PhD Conference in Economics and Business, University of
Western Australia.
Wagner, R.E. (1976) Revenue Structure, Fiscal Illusion and Budgetary Choice. Public Choice 25,
45-61.
______. (1977) Revenue Structure, Fiscal Illusion and Budgetary Choice: Reply. Public Choice
29, 131-132.
Wildasin, D.E. (1989) Demand Estimation for Public Goods: Distortionary Taxation and Other
Sources of Bias. Regional Science and Urban Economics 19, 353-379.
Wilson, J.D. (1985) Optimal Property Taxation in the Presence of Interregional Capital Mobility.
Journal of Urban Economics 17, 73-89.
Winer, S.L. (1983) Some Evidence on the Effect of the Separation of Spending and Taxing
Decisions. Journal of Political Economy 91, 126-140.
Worthington, A.C. (1994) The Nature and Extent of Fiscal Illusion in Australia. M.Ec.
Dissertation - University of New England.
Yinger, J. (1982) Capitalisation and the Theory of Local Public Finance. Journal of Political
Economy 90, 917-943.