Embed Size (px)
Citation preview
Bad Jobs, Good Jobs, No Jobs?The Employment Experience of theMexican American Second GenerationRoger Waldinger, Nelson Lim and David Cort
Concern with the prospects and experience of the ‘new’ second generation now stands
at the top of the immigration research agenda in the United States. In contrast to the
past, many immigrant offspring appear to be rapidly heading upward, exemplified by
the large number of Chinese, Korean, Indian and other Asian-origin students enrolled
in the nation’s leading universities, some the children of workers, others the
descendants of immigrants who moved straight into the middle class. On the other
hand, knowledgeable observers tell us that the offspring of today’s poorly educated
immigrants are likely to experience a very different fate. In their view, post-industrial
America is an inhospitable place for low-skilled immigrants and their offspring, as the
latter are likely not to be integrated into the mainstream but acculturated into the
ways and lifestyles of their underclass neighbours. We advance an alternative
perspective, not captured by these two opposing views: namely, that the children of
recent immigrants will follow in the footsteps of the offspring of Italian or Polish labour
migrants of the turn of the last century, gaining incorporation into working-class
America. Using samples of the Current Population Survey (CPS), we evaluate these
hypotheses, comparing job holding and job quality patterns among the descendants of
immigrants and their native counterparts.
Keywords: Second Generation; Assimilation; Mexican Americans; Children of
Immigrants; Underclass
Roger Waldinger is Professor of Sociology at the University of California Los Angeles; Nelson Lim is Professor of
Public Policy and Social Scientist, RAND Corporation, Santa Monica, California. David Cort is a Graduate
student in Sociology, University of California, Los Angeles. Correspondence to: Prof. R. Waldinger, Dept of
Sociology, UCLA, Haines Hall 264, Box 951551, Los Angeles, CA 90095-1551, USA. E-mail:
ISSN 1369-183X print/ISSN 1469-9451 online/07/01001-35 # 2007 Taylor & Francis
DOI: 10.1080/13691830601043471
Journal of Ethnic and Migration Studies
Vol. 33, No. 1, January 2007, pp. 1�35
Introduction
Research on the ‘new’ second generation in the United States has begun on a note of
inflected pessimism, and understandably so. While low-skilled immigrants are
moving to the US in large numbers, they are entering an economy that provides
little reward for workers of modest schooling, regardless of ethnic stripes. The
liabilities associated with foreign birth exercise a further penalty, adding to the
difficulties that derive from low schooling as such. Although the migration process
connects immigrants to employers, the social ties that generate attachment seem less
able to produce the skill acquisition needed for occupational mobility. Of the various
US-bound migration streams, by far the largest, coming from Mexico, is also the
most poorly schooled. Consequently, Mexican newcomers make up a working poor,
with limited access to jobs beyond the low-wage sector. Given these circumstances,
can we expect that their US-born and -raised children will find progress?
The sociological literature provides two answers to this question. Proponents of the
hypothesis of ‘segmented assimilation’ contend that a sizeable portion of today’s
Mexican American second generation may be a ‘rainbow underclass’ in the making,
stumbling beneath the ranks of the lower working class in which their parents have
established themselves. Alternatively, the more conventional perspective posits
assimilation, defined as a ‘decline in an ethnic difference’, and characterised by
steady movement into the social and economic ‘mainstream’. We advance an
alternative perspective, not captured by these two opposing views. We suggest that
the children of recent immigrants will follow the offspring of the Italian or Polish
labour migrants of the turn of the last century, gaining incorporation into working-
class America. In this paper we evaluate these three hypotheses, comparing
employment profiles of descendants of immigrants with their native counterparts.
Our key data source is the Current Population Survey.
Three Hypotheses
Segmented Assimilation
The hypothesis of segmented assimilation, coined by Alejandro Portes and Min Zhou
in 1993 and codified by Portes and Rumbaut in their 2001 book, Legacies, contends
that the children of low-skilled immigrants, visibly identifiable and entering a mainly
white society still not cured of its racist afflictions, are likely to get stalled in their
search for progress. While immigrant working-class parents arrive willing to do the
jobs rejected by natives, the children want more; not clear is whether the children’s
careers can live up to ‘their US-acquired aspirations’ (Portes and Zhou 1993: 85).
The conundrum of the contemporary second generation is heightened by the
continuing transformation of the US economy. Though low-skilled jobs persist,
occupational segmentation has ‘reduced the opportunities for incremental upward
mobility through well-paid, blue-collar positions’ (Portes and Rumbaut 2001: 59).
The advent of the ‘hourglass economy’*with opportunities bulging at high and low
2 R. Waldinger, N. Lim & D. Cort
levels, and a truncated tier of middle-range jobs*confronts the immigrant children
with a cruel choice: either acquire the college and other advanced degrees needed to
move into the professional/managerial elite, or else accept the same menial jobs to
which the first generation was consigned. However, the children’s experience of
growing up as stigmatised strangers, exposed to the ‘adversarial culture’ of native-
born minorities, may lead them to act in ways that imperil school success.
Consequently, the children of working-class immigrants are at risk of ‘downward
assimilation’, a path that would take them from their parents’ modest starting
position and drop them into ‘a new rainbow underclass . . . at the bottom of society’
(Portes and Rumbaut 2001: 45).
The children of today’s working-class immigrants are exceedingly diverse in their
national origins. But Portes and his associates tell us that there is one crucial case, at
once standing out from all others and exemplifying the theoretical claims that the
hypothesis of segmented assimilation seeks to advance: the Mexicans. As noted in the
concluding chapter of Legacies, ‘Mexican immigrants represent the textbook example
of theoretically anticipated effects of low immigrant human capital combined with a
negative context of reception’ (Portes and Rumbaut 2001: 277; emphasis in the
original).
Reviewing the book’s findings on the offspring of Mexican immigrants, Portes and
Rumbaut write that the ‘cumulative results clearly point to a difficult process of
adaptation and to the likelihood of downward assimilation . . .’ and insist that these
results warrant special attention, ‘given the size of the Mexican immigrant population
and its all but certain continuing growth in future years’ (2001: 279). As further
pointed out by Lopez and Stanton-Salazar, the authors of a chapter on Mexican
Americans in Ethnicities, a companion volume to Legacies, the Mexican case is of
‘unique importance’, especially in California and the South-West, where Mexicans are
‘by far the largest minority and are rapidly becoming the single-largest ethnic
group . . .’ (Lopez and Stanton-Salazar 2001: 58�9).
Conventional Assimilation
By contrast, researchers beginning from the standpoint of conventional assimilation
theory frame the matter in far more optimistic terms. Alba and Nee’s instantly
influential book, Remaking the American Mainstream (2003), highlights the changes
that facilitate progress, even for those immigrants and immigrant descendants who
begin with substantial disadvantages. On the one hand, racism, and its associated
ways of thinking and feeling, has lost legitimacy; on the other hand, discrimination
on the basis of racial or ethnic origins has been prohibited, to very significant effect.
Most significant is the change in the ‘formal rules of state organizations’ (Alba and Nee
2003: 53; italics in the original), ‘the institutional mechanisms extending civil rights
to minorities and women have increased the cost of discrimination . . . in non-trivial
ways’ (2003: 57). This new perspective does not imply that all groups will move ahead
in lockstep fashion and at the same rate. But it does suggest that downward mobility
Journal of Ethnic and Migration Studies 3
is not the likely fate for the offspring of immigrant garment workers and dishwashers,
or at least in the great majority.
As so many immigrant offspring grow up in families where the parents possess
high levels of human capital and have attained middle-class jobs and lifestyles,
proponents of conventional and segmented assimilation converge on at least one
point: ‘the real issue . . . concerns the US-born generations from groups dominated
by traditional labor migrants, such as Mexicans and Dominicans’ (Alba and Nee
2003: 246). However, the advocates of the conventional approach go on to frame the
matter in optimistic terms. According to Alba, Farley and Nee (Alba and Nee 2003;
Farley and Alba 2002), the fact that the parents begin at the very bottom of the
occupational ladder makes upward*not downward*mobility the more probable
outcome. Analysing data from the Current Population Survey, Farley and Alba (2002)
show that second-generation persons originating in labour migrant groups do not
possess the educational attainment of native-born whites; however, their schooling
performance represents significant advance as compared to the first generation. The
same holds for occupational attainment, where sizeable growth in white-collar
employment among the offspring of labour migrants points to a major departure
from the parental pattern, even though progress pales when compared to the
offspring of Asian immigrants. Writing about Mexican and other less-advantaged
second-generation groups, Alba and Nee contend that ‘a summary index of labor
market position given by mean occupational score would show that the distance from
the labor market situation of the immigrant generation is greater than that from the
white majority’ (2003: 245). While Alba and Nee do worry about the prospects for the
children of undocumented Mexican immigrants and note that ‘some of the children
of labor migrants may stall in terms of their socioeconomic attainment’ (2003: 275;
emphasis added), they conclude that ‘the socioeconomic advance in the second
generation is quite broad for the children of low-wage laborers . . .’ (2003: 277).
Thus, the experience of second-generation Mexicans provides the crucial bench-
mark for assessing the competing claims of conventional and segmented assimilation
theory. However, the contrast between these two perspectives may not be fully
helpful, yielding too polarised and simplistic an opposition, especially as the scenarios
of downward assimilation into ‘the underclass’ or steady advance into ‘the
mainstream’ hardly exhaust the possibilities.
Working-Class Incorporation
As argued in earlier research (Perlmann and Waldinger 1997), the Mexican American
second generation is likely to bear at least a passing resemblance to the Italian or
Polish offspring of the labour migrants of the turn of the last century. In that case, a
third hypothesis seems worthy of consideration. We propose that, while a working-
class (and not an underclass) future represents the more likely outcome for today’s
Mexican American second generation, the historical incorporation of Mexican
immigrants as stigmatised labour migrants yields a distinctive legacy, namely the
4 R. Waldinger, N. Lim & D. Cort
funnelling of the second generation to jobs of lower quality than would be obtained
on the basis of skills and experience alone.
This alternative hypothesis of ‘working-class incorporation’ builds on two
literatures, one bearing on the specific group in question, the second on the
intersection of ethnicity and labour-market structure. On the one hand, the historical
research on Mexican Americans shows that the ‘second generation’ of interest to
turn-of-the-twenty-first-century researchers represents nothing new. By the early
1930s, Emory Bogardus, based at the University of Southern California, had
identified ‘delinquency’ as a phenomenon particularly common to immigrant
children of Mexican descent (Bogardus 1929; 1934). Throughout the 1920s and
1930s, Bogardus launched his students on a set of projects focusing on consumption
patterns, parent�child relations and Americanisation among the offspring of
Mexican immigrants in Los Angeles. Though largely unpublished, these studies
have recently been analysed by historians (Monroy 1999): their portrait, of a second
generation transformed by the lure of mass consumption, chafing at the restrictions
imposed by their hierarchical parents, and bitterly resentful of the experience of
discrimination, proves strikingly similar to the picture drawn by the contemporary
advocates of segmented assimilation.
While conflict with authorities has been an enduring feature of Mexican American
life, starting with the zoot suiters of the 1940s and continuing on to the present,
earlier research chose not to frame the issue in the terms emphasised by the
contemporary proponents of segmented assimilation. In their pioneering volume,
The Mexican-American People (1970), for example, Grebler, Moore and Guzman
sought to explain the sources of the barriers that kept the descendants of Mexican
immigrants from moving ahead as did their Italian American counterparts, whom
they resembled in so many ways. While emphasising the inadequacies of the
conventional assimilation approach, Grebler et al. argued that the difficulties
encountered by Mexican Americans involved their much greater confinement to
the ranks of the working class, not ‘downward assimilation’ into some other class at
yet a lower level. Similar themes were sounded by subsequent scholars: Moore and
Pinderhughes’ (1993) effort to assess the relevance of the underclass hypothesis for
Latinos concluded that the sources of Latino poverty had far more to do with the
problems of the working poor, as opposed to the difficulties experienced by those for
whom ‘work has disappeared’. Likewise, Vilma Ortiz’ (1996) study of the Mexican
experience in Los Angeles underscored the persistent disadvantage endured by the
region’s Mexican Americans, all the while pointing out that the native-born
population had evolved into a group that was of distinctly working-class character.
On the other hand, the large literature on labour market segmentation (Doeringer
and Piore 1971) and ethnic networks (Massey et al. 1987), enclaves (Portes and Bach
1985) and niches (Waldinger 1996) suggests that the labour market may not be the
seamless ‘mainstream’ in which ethnicity plays little or no structuring role, as
suggested by assimilation theory. While the contemporary literature provides little
support for the earlier view of sharp demarcation between labour market segments,
Journal of Ethnic and Migration Studies 5
there is ample evidence that job characteristics co-vary. As Tilly and Tilly argue (1998;
see also Jencks et al. 1988), well-paying jobs offer opportunities for on-the-job
training and less onerous supervision, whereas low pay is correlated with frequent
supervision, work repetitiveness and perceived risk of job loss. Similarly, Kalleberg
et al. (2000) have recently suggested that ‘bad’ jobs can be distinguished from ‘good’
jobs precisely because the different components contributing to job quality cluster
together.
Likewise, one need not insist on insuperable barriers between labour market
sectors to note that easy movement from one cluster of jobs to another is likely to be
impeded. Different segments develop their own institutional practices: as Tilly (1998)
has argued, categories interior to organisations get connected to such exterior
categories as race, ethnicity and nativity; these linkages are particularly durable at the
lower end of the labour market, where workers rely heavily on personal networks to
find jobs (Holzer 1996). They are also common to the jobs on which migrants
converge, leading newcomers to concentrate in jobs where others of their kind have
already become established. While the first generation may start at the bottom, long-
standing migrations extend their reach and penetration. Consequently, veteran
immigrants may enjoy greater influence over hiring decisions, and greater access to
supervisory and skilled jobs, generating resources that can in turn affect second-
generation job options (Waldinger and Lichter 2003). Moreover, as persons sharing
common traits often respond to a similar situation in like ways, the second
generation is likely to seek or select a common set of jobs where their resources are
best rewarded. Insofar as the second generation is embedded in a cluster of
interlocking organisations, networks and activities, all of which link them to in-group
associates, commonalities of this sort will shape their aspirations and careers (for a
historical example, see Morawska 1985).
If connections to co-ethnics channel second-generation options, the decisions and
views of outsiders might also circumscribe those possibilities. Employers may view
the descendants of labour migrants through a particularly negative lens. Whereas the
parents are preferred as the right workers for the wrong jobs (see Moss and Tilly 2001:
116�19), the offspring may be perceived as too Americanised, and therefore no
longer appropriate for the undesirable tasks on which the foreign-born converge. At
the same time, the immigrants’ children may suffer from the shadow cast by the
stigma associated with their parents’ jobs: as labour migrants are often viewed as
‘hard-working, but dumb’ or ‘dependable, but unambitious’, that stereotype might
impede the immigrants’ offspring in their search for jobs where ambition and non-
manual skills are more highly valued. Finally, Tilly’s (1998) concept of ‘opportunity
hoarding’ reminds us that ethnic networks have a dual effect, serving as sources of
opportunity for insiders, but causes of closure for outsiders; consequently, second-
generation Mexicans may find access to jobs dominated by other groups (for
example, African Americans deeply embedded in the public sector) to be impeded.
While the children of Mexican-born immigrants are therefore unlikely to be stuck
at the very bottom, progress beyond the status experienced by the parental generation
6 R. Waldinger, N. Lim & D. Cort
may falter well short of parity relative to dominant groups. From this perspective,
therefore, the likely scenario entails continuity with the past, namely movement into
the ranks of the working and lower-middle class. To the extent that Mexican
immigrants continue to occupy the bottom-most rung, moreover, that presence will
yield a persistent shadow effect, yielding a negative influence on the ways in which the
children of immigrants are seen.
In sum, the literature points to three competing hypotheses regarding the labour
market experience of second-generation Mexican American workers:
. Hypothesis 1: Segmented assimilation predicts downward assimilation into an
underclass.
. Hypothesis 2: Conventional assimilation forecasts a process of individualistic
mobility into the mainstream.
. Hypothesis 3: Working-class incorporation projects second-generation progress
beyond the first generation, combined with continued, structured inequality
relative to dominants.
The three-way comparison, however, yields two analytical focal points: job holding
and job quality. Job holding provides the litmus test of the relevant claims made by the
hypothesis of segmented assimilation: the prediction that the children of working-
class immigrants will undergo downward assimilation into the underclass entails
detachment from the world of work, whereas the two alternative hypotheses both
assume that the high job-holding rates characteristic of the first generation persist to
the second. By contrast, job quality among employed workers provides the key to
adjudicating the contrast between the hypotheses of conventional assimilation and
working-class incorporation. We now systematically pursue these contrasts, first
discussing indicators, variables and data, and then moving on to the analysis.
Data, Variables and Method
Data
This paper uses data collected as part of the March demographic files of the Current
Population Survey (CPS), a monthly survey of a national probability sample of
approximately 60,000 households, conducted by the US Bureau of the Census. Since
1994, questions about place of birth and parents’ place of birth are a permanent
feature of each month’s survey, making the CPS the only large-scale dataset capable of
identifying foreign-born, US-born of foreign parentage, and US-born of US-born
parentage subgroups within the larger population.1 As compared to the Census, the
CPS has the further advantage of collecting information on aspects of non-monetary
compensation relevant to assessing job quality, as well as attributes of the work
environment (such as organisational size) likely to affect compensation, whether of
the monetary or the non-monetary sort.
Journal of Ethnic and Migration Studies 7
Though the CPS universe is far smaller than the Census, one can combine surveys
from subsequent years to build up a sample of very respectable size; this paper makes
particular use of a combined sample concatenating observations from the 2001 and
2003 Current Population Surveys. The CPS retains respondents for just under a 20-
month period, interviewing individuals for four consecutive months, dropping them
from the sample for the next eight months, and then re-interviewing them for
another four consecutive months, after which time they are dropped from the sample
completely. Consequently, surveys separated by a two-year interval contain no
overlapping cases. As the CPS is a household survey, it is limited to the non-
institutional population, excluding prisoners, students in dormitories, and the
military.
In this paper, we restrict our purview to men aged 25�64. The literature is focused
on differences across generations. However, as we have earlier shown (see Waldinger
and Feliciano 2004), there are significant differences within generations by gender;
further, these differences change from one generation to the next. In addition, factors
affecting the employment and wages of women systematically vary from those
impinging on men, requiring different models. As the discussion necessarily
involves numerous inter-ethnic comparisons as well as contrasts across a series of
dependent variables, consideration of gender adds layers of complication that
extend beyond the confines of a single paper; we plan to address this matter in
separate work.
Considerations related to both substance and the specifics of the case in hand lead
us to restrict the discussion to adults. Working-class men typically experience a
protracted transition from school to work (see Osterman 1980), with a greater
tendency toward punctuated spells of work and non-work than undergone by more
educated men at comparably early stages of adulthood. Consequently, the differences
of interest are those that remain after the ‘settling down’ process has been completed.
While concern with the contemporary second generation would often lead one to
focus on younger adults*as many of the migrations are of such recent vintage that
the population of second-generation adults is relatively small and very youthful*the
distinctive nature and history of Mexican migration to the United States makes adults
the appropriate category for analysis. Though migration from Mexico has swelled
over the past 50 years, it is of long-standing nature, originating well before mid-
century, not in the 1960s or later, as is true for most other groups. Moreover, the
process of change, at least up until recently, has been continuous: the migrations have
mainly emanated from central Mexico; they have converged on the US South-West;
and the reception context has been consistently unfriendly. The large size and
continuous nature of Mexican migration also produce reasonably large sample sizes,
with 791 second-generation Mexican men and 1,583 third-generation-plus Mexican
men represented among the 74,832 prime-aged men found when combining the 2001
and 2003 Current Population Surveys.
8 R. Waldinger, N. Lim & D. Cort
Inter-Group Comparisons
The article focuses on contrasts across the following groups:
. First generation: foreign-born Mexicans. As widely noted, time in the United States
exercises a strong impact on immigrant attainment. Consequently, foreign-born
Mexicans are disaggregated into three categories based on period of arrival:
k 1970s or earlier;
k 1980s;
k 1990s or later.
. Second generation: native-born Mexicans of foreign parentage.
. Third generation-plus:
k native-born Mexicans of native parentage;
k native-born, non-hispanic whites of native parentage;
k native-born, non-hispanic blacks of native-born parentage.
As denoted by its label, the ‘third-generation-plus’ grouping is heterogeneous,
including persons whose ancestry in the United States may date back three or more
generations. Although we identify three generations of Mexican origin, all references
to whites or blacks only extend to third-generation-plus members of those
populations. All other persons are retained in all analyses, but grouped into a
residual category (‘all others’), as they are not the focus of interest. First- and second-
generation whites and blacks have been grouped into this ‘all other’ category. Sample
sizes for each group, in unweighted and weighted form, can be found in Table 1.
As with other similar studies (Farley and Alba 2002; Grogger and Trejo 2002), the
contrasts between Mexican-origin generations developed in this paper are cross-
sectional: neither directly nor indirectly do they match parents with children who
may have entered the labour market at an earlier period of time. The disadvantages of
this approach are well known, principally pertaining to any impact of changes in
migrant selectivity or to inter-generational shifts in ethnic persistence.2 On the other
hand, as argued by Grogger and Trejo (2002), the cross-sectional approach holds the
social and economic environment constant. By contrast, a longitudinal approach
might conflate those shifts due to changed conditions*affecting all generations
(whether positively, such as a decline in discrimination against Mexican Americans,
or negatively, such as an increase in inequality)*with those that are due to strictly
generational factors. Potential biases affecting second-/third-generation contrasts are
mitigated by the long-term stability in the social images and social structure of
Mexican Americans (as argued by Lopez and Stanton-Salazar 2001), which implies
that the standing of the self-identified, third-plus generation will affect the options
available to the second generation. Controlling for year of migration and focusing on
outcomes among the more settled migrants provide a reasonable proxy for the
Mexican immigrants from whom today’s second generation are likely to be
descended. Last, and most importantly, the substantive questions pursued emphasise
Journal of Ethnic and Migration Studies 9
the contrasts, in job-holding and job-quality patterns, between second-generation
Mexicans and third-generation-plus blacks and whites.
Dependent Variables
In assessing the hypothesis that the Mexican American second generation might
experience ‘downward assimilation’, we need to remember that the Mexican first
generation is concentrated in jobs that lie at the very bottom of the labour market.
From that standpoint, ‘downward’ really means out of the labour market, a statement
consistent with the view that an ‘underclass’ emerges ‘when work disappears’ (Wilson
1996).
Job Holding
Following Jencks (1992), we focus on three indicators of labour force attachment as
measures of job holding. The numbering of these, and the subsequent two indicators
of job quality, will be followed in the paper’s analysis and findings.
1. Employment*a dichotomous category separating those people with a job from
those who are either out of work or looking for a job as well as those who are out
of the labour force altogether during the survey week. This indicator alone,
however, is likely to be too restrictive. If low-skilled workers experience high levels
of frictional unemployment, a snapshot taken at any one point in time is likely to
miss a recent, previous experience of employment.
2. Weeks worked*average weeks of work employed in the previous year for all those
with at least one week of employment during that period, a continuous variable
ranging from 1 to 52. As opposed to workers caught in the secondary labour
market, where they churn from one job to another with a high frequency, persons
in an ‘underclass’ would experience long-term joblessness. Thus, to capture the
population with the weakest attachment to the labour market, we examine
differences in:
3. Chronic unemployment*a dichotomous variable distinguishing men with no
employment record during the previous year from those with one week of work or
more during the previous year. This variable is coded one if the person is
chronically unemployed, otherwise zero.
When predicting labour force attachment on each of these three indicators, the
universe includes all men in the sample.
Job Quality
In assessing the hypothesis that Mexican American second-generation workers either
move into a seamless ‘mainstream’ or experience persistent ethnic inequality, we
build on work by Kalleberg et al. (2000) to identify two indicators of job quality:
10 R. Waldinger, N. Lim & D. Cort
4. Low wages*as Kalleberg and his collaborators note, ‘wages are a fundamental
dimension of job quality’. We define low-wage jobs as those at the bottom fifth of
the earnings distribution. The earnings distribution is based on the earnings for
men. Employed men with wages in the bottom quintile are coded as one; all other
employed men are coded zero. When predicting low wages, the universe includes
men with non-zero wage or salary earnings in the prior year (2000 or 2002). The
self-employed are excluded because the CPS only collects data on wages and
salaries for the incorporated self-employed only, whereas most self-employed are
unincorporated.
5. Receipt of benefits*a dichotomous variable, distinguishing employed men
without benefits from those with at least one benefit. As noted by Kalleberg
et al. (2000) as well as other researchers (e.g. Farber 1997; Tilly 1997), fringe
benefits*most notably pensions and health insurance*comprise a crucial
dimension of job quality. In the United States, health and pension benefits are
largely provided by employers. From the 1940s to the 1970s, the proportion of the
workforce covered by employment-based fringe benefits expanded; as the growth
was circumscribed, often limited to larger organisations and collectivities, the
distinction between ‘bad’ and ‘good’ jobs closely mapped to the availability of
benefits, as argued by the earlier segmentationist scholars. Over the past 25 years,
trends have moved in the opposite direction, as rising healthcare costs and the
prospect of expanded liabilities for long-lived retired workers have led firms to cut
back on the provision of fringes. Notwithstanding, larger organisations as well as
public employers continue to be the most likely to provide fringe benefits. As Alba
and Nee’s revised account of assimilation places so much emphasis on
institutional factors, a focus on access to benefits could shed light on the potential
role of ethnicity in structuring what Alba and Nee (2003) describe as ‘the
mainstream’.
Information on both health benefits and pension provision is collected in the
Current Population Survey. Respondents are asked whether the employer provides a
pension plan for any of the employers; those answering yes are then asked whether
they are covered in the plan. Respondents are also asked whether they received health
insurance, and if so, whether coverage extended to other family members and to what
extent payments were made by the employer.
When predicting benefits, the universe includes employed men, in either public or
private sectors. The self-employed are again excluded, because they are much less
likely than the employed to enjoy any form of fringe benefit. As whites are also much
more likely to be found in self-employment than any of the other groups, the
confounding effects of self-employment on benefits yield a downward effect on any
estimate of the ‘white effect’ among the employed.
Journal of Ethnic and Migration Studies 11
Independent Variables
In estimating the factors affecting job holding, we work with a simple model,
implying that outcome disparities reflect differences in background characteristics.
Based on this model, we use a standard set of independent variables, including group
membership; potential work experience (age minus years of schooling minus 6);
education; married; children present in the household; veteran status; disability
status; and metropolitan status. The group memberships are coded as a set of dummy
variables (1�/in a specific group, 0�/other); native whites of native parentage
comprise the reference category in all of the analyses. Education is represented by the
five dummy variables of elementary; some high school; some college; college;
graduate degree; high school completion is the reference category. The remaining
variables are all dummies, coded so that 1 equals yes (e.g. married).
Benefits are affected by organisational characteristics: larger employers, and
especially those in the public sector, are at once more likely to employ a formalised
personnel system that diminishes the impact of discrimination and to provide both
pension and health benefits. Following Kalleberg et al. (2000), our models estimating
wages and benefits add a set of variables pertaining to organisational characteristics:
we include a dummy variable for sector (coded 1 if the job is found in the public
sector, 0 if in the private sector) and then five dummy variables identifying employer
size (fewer than 10; 10�24; 25�99; 100�499; 500�999; 1000 or more represents the
omitted category).
Groups’ Differences
The patterns of groups’ differences in independent variables are displayed in Tables
1�3 and can be described in the following summary. Though whites have the highest
levels of education, the difference between the foreign-born and all the native-born
groups is the most salient contrast: primary schooling is the modal category among
the immigrants, as opposed to high school completion among all other groups. The
disparity between the foreign-born and native-born Mexican-origin groups deserves
underscoring: while the hypothesis of segmented assimilation predicts ‘downward
assimilation’, the educational advantage displayed by the immigrant offspring should
imply a corresponding advantage in the labour market, not slippage into a ‘world
without work’. Note, however, that the comparison between second-generation and
third-generation-plus Mexican Americans shows no comparable upgrading, with the
former more likely to have achieved some college education or more.
Levels of experience are lowest among the most recently arrived immigrants and
among second-generation Mexicans. Marital rates are highest among the longest-
settled immigrants and lowest among African Americans. The proportion with
children under 18 is highest among the immigrants of the 1980s and lowest among
African Americans. Veterans of military service comprise just over a fifth of the whites
and blacks and a slightly smaller proportion among the native-born Mexican-origin
12 R. Waldinger, N. Lim & D. Cort
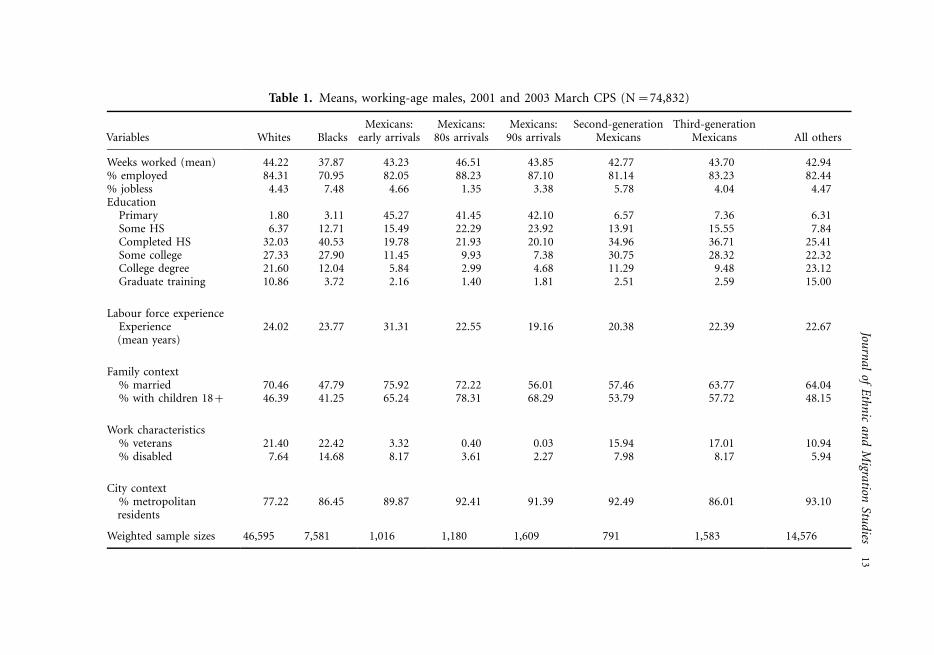
Table 1. Means, working-age males, 2001 and 2003 March CPS (N�/74,832)
Variables Whites BlacksMexicans:
early arrivalsMexicans:
80s arrivalsMexicans:
90s arrivalsSecond-generation
MexicansThird-generation
Mexicans All others
Weeks worked (mean) 44.22 37.87 43.23 46.51 43.85 42.77 43.70 42.94% employed 84.31 70.95 82.05 88.23 87.10 81.14 83.23 82.44% jobless 4.43 7.48 4.66 1.35 3.38 5.78 4.04 4.47Education
Primary 1.80 3.11 45.27 41.45 42.10 6.57 7.36 6.31Some HS 6.37 12.71 15.49 22.29 23.92 13.91 15.55 7.84Completed HS 32.03 40.53 19.78 21.93 20.10 34.96 36.71 25.41Some college 27.33 27.90 11.45 9.93 7.38 30.75 28.32 22.32College degree 21.60 12.04 5.84 2.99 4.68 11.29 9.48 23.12Graduate training 10.86 3.72 2.16 1.40 1.81 2.51 2.59 15.00
Labour force experienceExperience(mean years)
24.02 23.77 31.31 22.55 19.16 20.38 22.39 22.67
Family context% married 70.46 47.79 75.92 72.22 56.01 57.46 63.77 64.04% with children 18�/ 46.39 41.25 65.24 78.31 68.29 53.79 57.72 48.15
Work characteristics% veterans 21.40 22.42 3.32 0.40 0.03 15.94 17.01 10.94% disabled 7.64 14.68 8.17 3.61 2.27 7.98 8.17 5.94
City context% metropolitanresidents
77.22 86.45 89.87 92.41 91.39 92.49 86.01 93.10
Weighted sample sizes 46,595 7,581 1,016 1,180 1,609 791 1,583 14,576
Journ
al
ofE
thn
ica
nd
Migra
tionS
tud
ies1
3
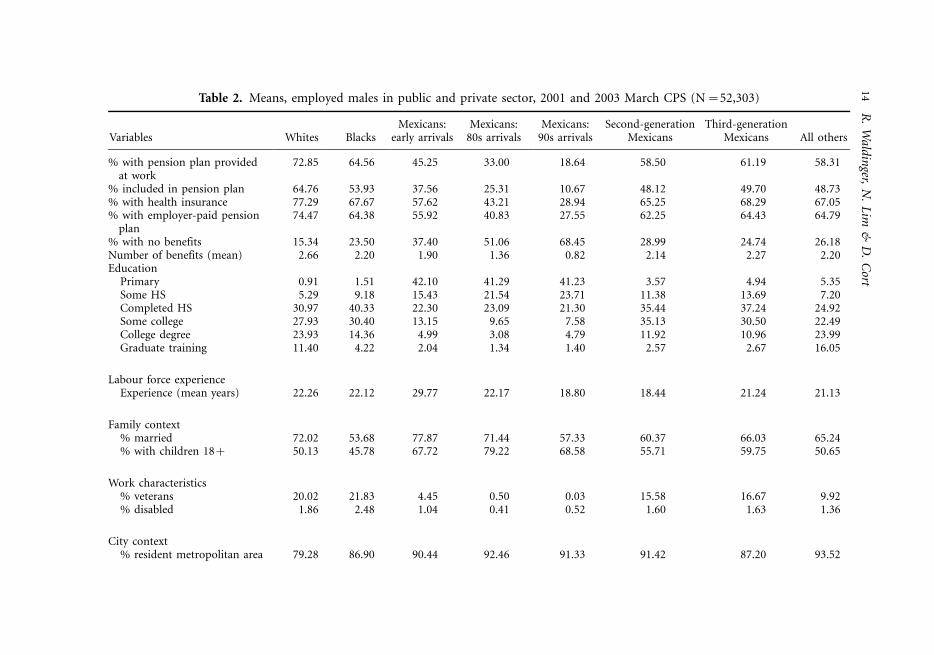
Table 2. Means, employed males in public and private sector, 2001 and 2003 March CPS (N�/52,303)
Variables Whites BlacksMexicans:
early arrivalsMexicans:
80s arrivalsMexicans:
90s arrivalsSecond-generation
MexicansThird-generation
Mexicans All others
% with pension plan providedat work
72.85 64.56 45.25 33.00 18.64 58.50 61.19 58.31
% included in pension plan 64.76 53.93 37.56 25.31 10.67 48.12 49.70 48.73% with health insurance 77.29 67.67 57.62 43.21 28.94 65.25 68.29 67.05% with employer-paid pension
plan74.47 64.38 55.92 40.83 27.55 62.25 64.43 64.79
% with no benefits 15.34 23.50 37.40 51.06 68.45 28.99 24.74 26.18Number of benefits (mean) 2.66 2.20 1.90 1.36 0.82 2.14 2.27 2.20Education
Primary 0.91 1.51 42.10 41.29 41.23 3.57 4.94 5.35Some HS 5.29 9.18 15.43 21.54 23.71 11.38 13.69 7.20Completed HS 30.97 40.33 22.30 23.09 21.30 35.44 37.24 24.92Some college 27.93 30.40 13.15 9.65 7.58 35.13 30.50 22.49College degree 23.93 14.36 4.99 3.08 4.79 11.92 10.96 23.99Graduate training 11.40 4.22 2.04 1.34 1.40 2.57 2.67 16.05
Labour force experienceExperience (mean years) 22.26 22.12 29.77 22.17 18.80 18.44 21.24 21.13
Family context% married 72.02 53.68 77.87 71.44 57.33 60.37 66.03 65.24% with children 18�/ 50.13 45.78 67.72 79.22 68.58 55.71 59.75 50.65
Work characteristics% veterans 20.02 21.83 4.45 0.50 0.03 15.58 16.67 9.92% disabled 1.86 2.48 1.04 0.41 0.52 1.60 1.63 1.36
City context% resident metropolitan area 79.28 86.90 90.44 92.46 91.33 91.42 87.20 93.52
14
R.
Wa
ldin
ger,N
.L
im&
D.
Cort
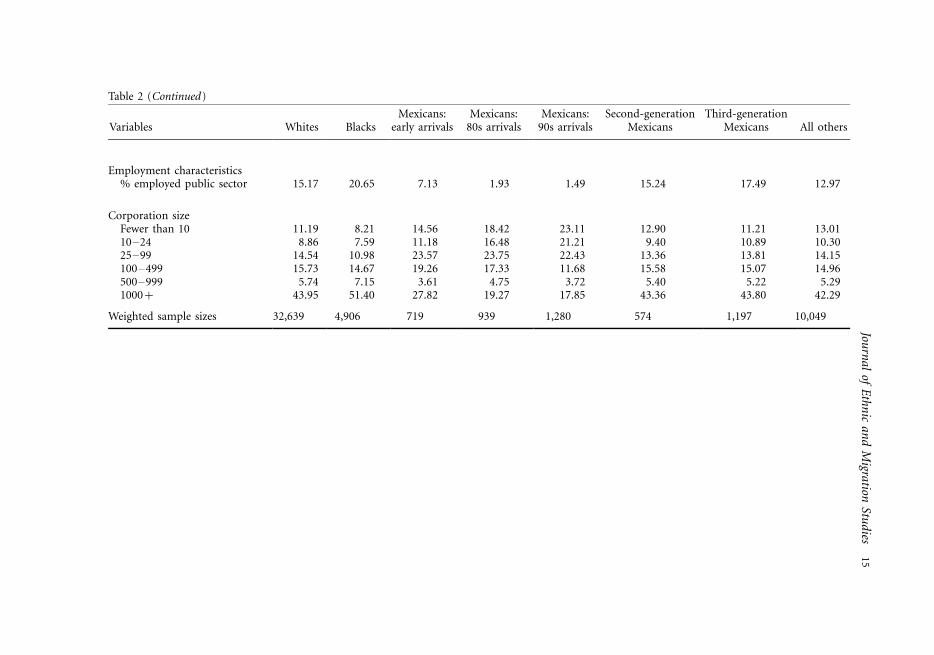
Table 2 (Continued )
Variables Whites BlacksMexicans:
early arrivalsMexicans:
80s arrivalsMexicans:
90s arrivalsSecond-generation
MexicansThird-generation
Mexicans All others
Employment characteristics% employed public sector 15.17 20.65 7.13 1.93 1.49 15.24 17.49 12.97
Corporation sizeFewer than 10 11.19 8.21 14.56 18.42 23.11 12.90 11.21 13.0110�24 8.86 7.59 11.18 16.48 21.21 9.40 10.89 10.3025�99 14.54 10.98 23.57 23.75 22.43 13.36 13.81 14.15100�499 15.73 14.67 19.26 17.33 11.68 15.58 15.07 14.96500�999 5.74 7.15 3.61 4.75 3.72 5.40 5.22 5.291000�/ 43.95 51.40 27.82 19.27 17.85 43.36 43.80 42.29
Weighted sample sizes 32,639 4,906 719 939 1,280 574 1,197 10,049
Journ
al
ofE
thn
ica
nd
Migra
tionS
tud
ies1
5
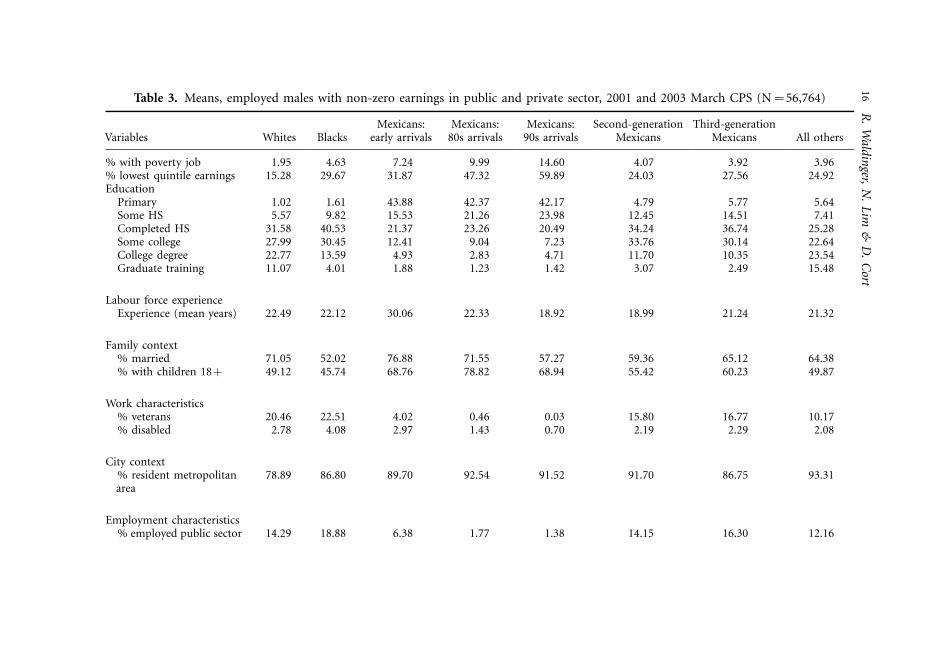
Table 3. Means, employed males with non-zero earnings in public and private sector, 2001 and 2003 March CPS (N�/56,764)
Variables Whites BlacksMexicans:
early arrivalsMexicans:
80s arrivalsMexicans:
90s arrivalsSecond-generation
MexicansThird-generation
Mexicans All others
% with poverty job 1.95 4.63 7.24 9.99 14.60 4.07 3.92 3.96% lowest quintile earnings 15.28 29.67 31.87 47.32 59.89 24.03 27.56 24.92Education
Primary 1.02 1.61 43.88 42.37 42.17 4.79 5.77 5.64Some HS 5.57 9.82 15.53 21.26 23.98 12.45 14.51 7.41Completed HS 31.58 40.53 21.37 23.26 20.49 34.24 36.74 25.28Some college 27.99 30.45 12.41 9.04 7.23 33.76 30.14 22.64College degree 22.77 13.59 4.93 2.83 4.71 11.70 10.35 23.54Graduate training 11.07 4.01 1.88 1.23 1.42 3.07 2.49 15.48
Labour force experienceExperience (mean years) 22.49 22.12 30.06 22.33 18.92 18.99 21.24 21.32
Family context% married 71.05 52.02 76.88 71.55 57.27 59.36 65.12 64.38% with children 18�/ 49.12 45.74 68.76 78.82 68.94 55.42 60.23 49.87
Work characteristics% veterans 20.46 22.51 4.02 0.46 0.03 15.80 16.77 10.17% disabled 2.78 4.08 2.97 1.43 0.70 2.19 2.29 2.08
City context% resident metropolitanarea
78.89 86.80 89.70 92.54 91.52 91.70 86.75 93.31
Employment characteristics% employed public sector 14.29 18.88 6.38 1.77 1.38 14.15 16.30 12.16
16
R.
Wa
ldin
ger,N
.L
im&
D.
Cort
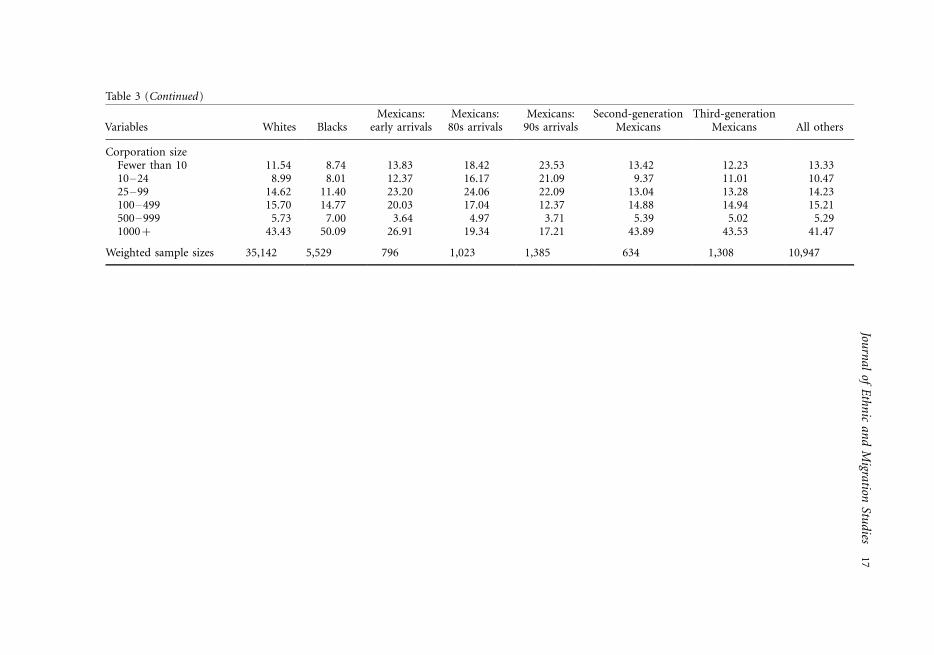
Table 3 (Continued )
Variables Whites BlacksMexicans:
early arrivalsMexicans:
80s arrivalsMexicans:
90s arrivalsSecond-generation
MexicansThird-generation
Mexicans All others
Corporation sizeFewer than 10 11.54 8.74 13.83 18.42 23.53 13.42 12.23 13.3310�24 8.99 8.01 12.37 16.17 21.09 9.37 11.01 10.4725�99 14.62 11.40 23.20 24.06 22.09 13.04 13.28 14.23100�499 15.70 14.77 20.03 17.04 12.37 14.88 14.94 15.21500�999 5.73 7.00 3.64 4.97 3.71 5.39 5.02 5.291000�/ 43.43 50.09 26.91 19.34 17.21 43.89 43.53 41.47
Weighted sample sizes 35,142 5,529 796 1,023 1,385 634 1,308 10,947
Journ
al
ofE
thn
ica
nd
Migra
tionS
tud
ies1
7
groups; among the immigrants, only a tiny fraction of the most settled group reports
prior military service, with virtually no veterans to be found among those who
arrived in the 1980s or after. Roughly 15 per cent of all African American men report
that they are disabled, a fraction twice as high as that found among any other group.
By contrast, fewer than 3 per cent of employed African Americans report that they are
disabled, a proportion still higher (though only slightly) than among the other
groups. Among the employed, differences in public sector employment largely fall out
around the foreign/native divide, with all three immigrant cohorts enjoying little if
any access to government jobs. Blacks are the most likely to work in the public sector,
though over-representation is quite slight relative to the other native-born groups.
Similarly, variations in distribution across employer size�classes principally reflect
foreign/native differences, with the newest arrivals the most likely to work for small
and the least likely to work for large organisations. In this respect, the comparison
between the foreign-born and the native-born Mexican-origin groups suggests that
the latter have moved out of immigrant enclaves and niches, and into the economic
mainstream. Table 1 presents means and standard deviations for all men, by group;
Table 2 presents means and standard deviations for all men with non-zero wage and
salary earnings in the year prior to the survey, again by group; and Table 3 presents
means and standard deviations for all employed men in public or private sectors, by
group.
Method
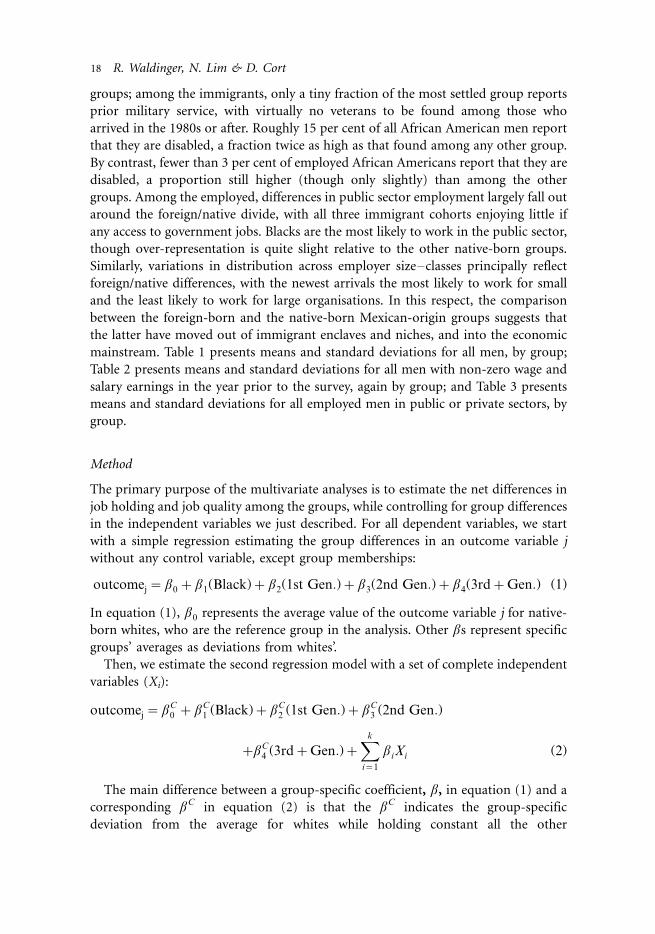
The primary purpose of the multivariate analyses is to estimate the net differences in
job holding and job quality among the groups, while controlling for group differences
in the independent variables we just described. For all dependent variables, we start
with a simple regression estimating the group differences in an outcome variable j
without any control variable, except group memberships:
outcomej�b0�b1(Black)�b2(1st Gen:)�b3(2nd Gen:)�b4(3rd�Gen:) (1)
In equation (1), b0 represents the average value of the outcome variable j for native-
born whites, who are the reference group in the analysis. Other /bs represent specific
groups’ averages as deviations from whites’.
Then, we estimate the second regression model with a set of complete independent
variables (Xi):
outcomej�bC0 �bC
1 (Black)�bC2 (1st Gen:)�bC
3 (2nd Gen:)
�bC4 (3rd�Gen:)�
Xk
i�1
biXi (2)
The main difference between a group-specific coefficient, b, in equation (1) and a
corresponding bC in equation (2) is that the bC indicates the group-specific
deviation from the average for whites while holding constant all the other
18 R. Waldinger, N. Lim & D. Cort
independent variables. In both equations, the intercept (/b0;bC0 ) reflects the average
level of the outcome for whites.
We determined whether the additional control variables (Xi) contribute to the
overall fit of the regression model using the likelihood-ratio test (Stata 2003) and the
Bayesian information criterion (BIC) statistics (for a recent review of BIC and other
similar statistics, see Weakliem 2004). In addition, we also tested whether each group-
specific coefficient (/b;bC) is statistically different as compared to any of the other
groups using the Wald statistics (Stata 2003). Results are reported along with
regression results.
Since the CPS employs multi-stage clustered sampling, we use regression
procedures specifically designed for complex survey data available from Stata
(2003). These regression procedures use pseudo-maximum-likelihood methods that
compute proper standard errors for estimated coefficients. We use survey regression
analogues of ordinary least-square regression for continuous outcomes and logistic
regression for binary outcomes.
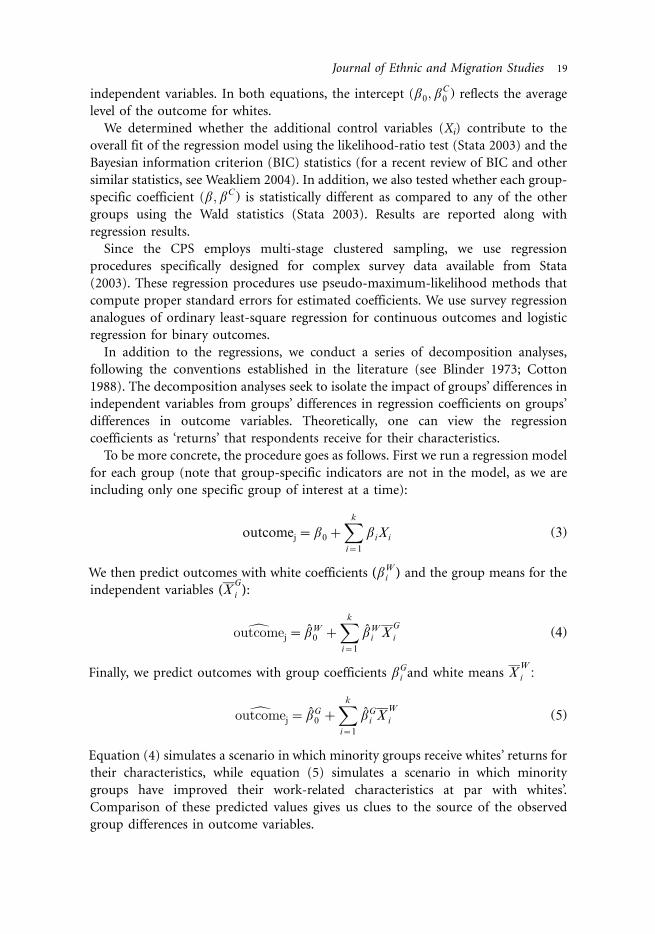
In addition to the regressions, we conduct a series of decomposition analyses,
following the conventions established in the literature (see Blinder 1973; Cotton
1988). The decomposition analyses seek to isolate the impact of groups’ differences in
independent variables from groups’ differences in regression coefficients on groups’
differences in outcome variables. Theoretically, one can view the regression
coefficients as ‘returns’ that respondents receive for their characteristics.
To be more concrete, the procedure goes as follows. First we run a regression model
for each group (note that group-specific indicators are not in the model, as we are
including only one specific group of interest at a time):
outcomej�b0�Xk
i�1
biXi (3)
We then predict outcomes with white coefficients (/bWi ) and the group means for the
independent variables (/XG
i ):
doutcomej� b̂W0 �
Xk
i�1
b̂Wi X
G
i (4)
Finally, we predict outcomes with group coefficients bGi and white means X
W
i :
doutcomej� b̂G0 �
Xk
i�1
b̂Gi X
W
i (5)
Equation (4) simulates a scenario in which minority groups receive whites’ returns for
their characteristics, while equation (5) simulates a scenario in which minority
groups have improved their work-related characteristics at par with whites’.
Comparison of these predicted values gives us clues to the source of the observed
group differences in outcome variables.
Journal of Ethnic and Migration Studies 19
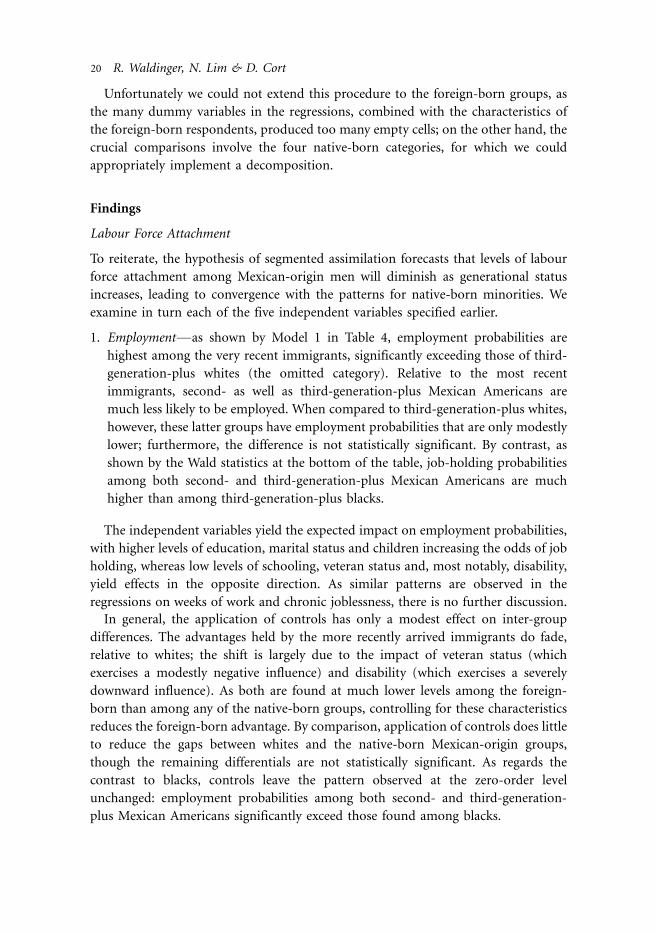
Unfortunately we could not extend this procedure to the foreign-born groups, as
the many dummy variables in the regressions, combined with the characteristics of
the foreign-born respondents, produced too many empty cells; on the other hand, the
crucial comparisons involve the four native-born categories, for which we could
appropriately implement a decomposition.
Findings
Labour Force Attachment
To reiterate, the hypothesis of segmented assimilation forecasts that levels of labour
force attachment among Mexican-origin men will diminish as generational status
increases, leading to convergence with the patterns for native-born minorities. We
examine in turn each of the five independent variables specified earlier.
1. Employment*as shown by Model 1 in Table 4, employment probabilities are
highest among the very recent immigrants, significantly exceeding those of third-
generation-plus whites (the omitted category). Relative to the most recent
immigrants, second- as well as third-generation-plus Mexican Americans are
much less likely to be employed. When compared to third-generation-plus whites,
however, these latter groups have employment probabilities that are only modestly
lower; furthermore, the difference is not statistically significant. By contrast, as
shown by the Wald statistics at the bottom of the table, job-holding probabilities
among both second- and third-generation-plus Mexican Americans are much
higher than among third-generation-plus blacks.
The independent variables yield the expected impact on employment probabilities,
with higher levels of education, marital status and children increasing the odds of job
holding, whereas low levels of schooling, veteran status and, most notably, disability,
yield effects in the opposite direction. As similar patterns are observed in the
regressions on weeks of work and chronic joblessness, there is no further discussion.
In general, the application of controls has only a modest effect on inter-group
differences. The advantages held by the more recently arrived immigrants do fade,
relative to whites; the shift is largely due to the impact of veteran status (which
exercises a modestly negative influence) and disability (which exercises a severely
downward influence). As both are found at much lower levels among the foreign-
born than among any of the native-born groups, controlling for these characteristics
reduces the foreign-born advantage. By comparison, application of controls does little
to reduce the gaps between whites and the native-born Mexican-origin groups,
though the remaining differentials are not statistically significant. As regards the
contrast to blacks, controls leave the pattern observed at the zero-order level
unchanged: employment probabilities among both second- and third-generation-
plus Mexican Americans significantly exceed those found among blacks.
20 R. Waldinger, N. Lim & D. Cort
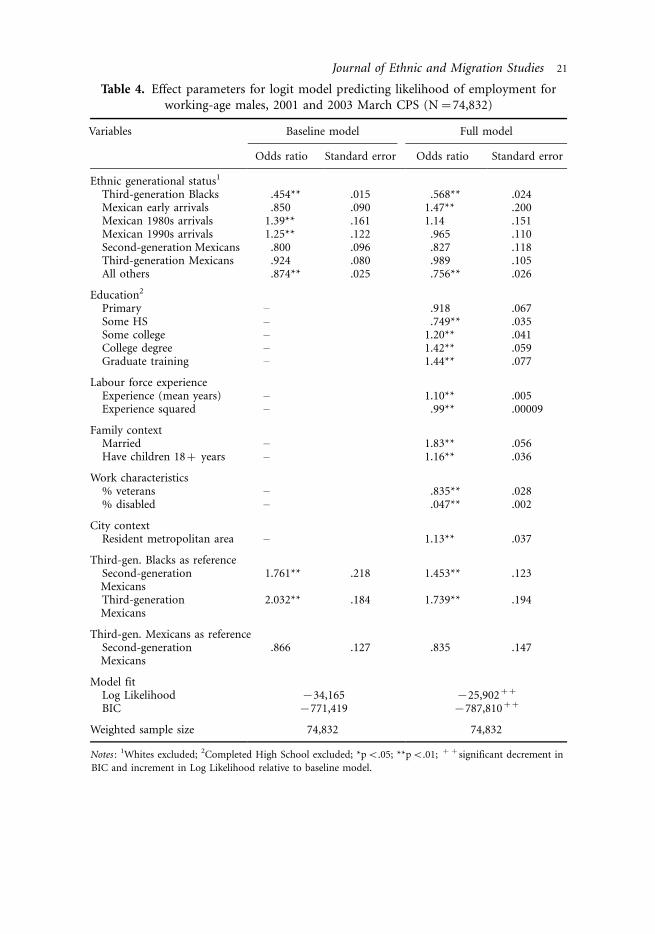
Table 4. Effect parameters for logit model predicting likelihood of employment for
working-age males, 2001 and 2003 March CPS (N�/74,832)
Variables Baseline model Full model
Odds ratio Standard error Odds ratio Standard error
Ethnic generational status1
Third-generation Blacks .454** .015 .568** .024Mexican early arrivals .850 .090 1.47** .200Mexican 1980s arrivals 1.39** .161 1.14 .151Mexican 1990s arrivals 1.25** .122 .965 .110Second-generation Mexicans .800 .096 .827 .118Third-generation Mexicans .924 .080 .989 .105All others .874** .025 .756** .026
Education2
Primary � .918 .067Some HS � .749** .035Some college � 1.20** .041College degree � 1.42** .059Graduate training � 1.44** .077
Labour force experienceExperience (mean years) � 1.10** .005Experience squared � .99** .00009
Family contextMarried � 1.83** .056Have children 18�/ years � 1.16** .036
Work characteristics% veterans � .835** .028% disabled � .047** .002
City contextResident metropolitan area � 1.13** .037
Third-gen. Blacks as referenceSecond-generationMexicans
1.761** .218 1.453** .123
Third-generationMexicans
2.032** .184 1.739** .194
Third-gen. Mexicans as referenceSecond-generationMexicans
.866 .127 .835 .147
Model fitLog Likelihood �/34,165 �/25,902��
BIC �/771,419 �/787,810��
Weighted sample size 74,832 74,832
Notes : 1Whites excluded; 2Completed High School excluded; *pB/.05; **pB/.01; ��significant decrement in
BIC and increment in Log Likelihood relative to baseline model.
Journal of Ethnic and Migration Studies 21
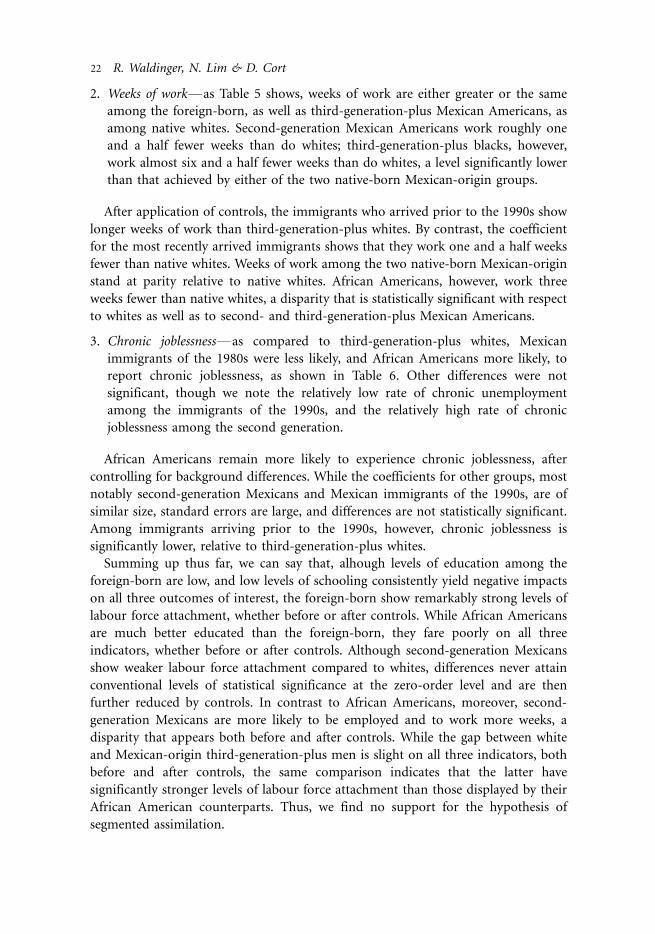
2. Weeks of work*as Table 5 shows, weeks of work are either greater or the same
among the foreign-born, as well as third-generation-plus Mexican Americans, as
among native whites. Second-generation Mexican Americans work roughly one
and a half fewer weeks than do whites; third-generation-plus blacks, however,
work almost six and a half fewer weeks than do whites, a level significantly lower
than that achieved by either of the two native-born Mexican-origin groups.
After application of controls, the immigrants who arrived prior to the 1990s show
longer weeks of work than third-generation-plus whites. By contrast, the coefficient
for the most recently arrived immigrants shows that they work one and a half weeks
fewer than native whites. Weeks of work among the two native-born Mexican-origin
stand at parity relative to native whites. African Americans, however, work three
weeks fewer than native whites, a disparity that is statistically significant with respect
to whites as well as to second- and third-generation-plus Mexican Americans.
3. Chronic joblessness*as compared to third-generation-plus whites, Mexican
immigrants of the 1980s were less likely, and African Americans more likely, to
report chronic joblessness, as shown in Table 6. Other differences were not
significant, though we note the relatively low rate of chronic unemployment
among the immigrants of the 1990s, and the relatively high rate of chronic
joblessness among the second generation.
African Americans remain more likely to experience chronic joblessness, after
controlling for background differences. While the coefficients for other groups, most
notably second-generation Mexicans and Mexican immigrants of the 1990s, are of
similar size, standard errors are large, and differences are not statistically significant.
Among immigrants arriving prior to the 1990s, however, chronic joblessness is
significantly lower, relative to third-generation-plus whites.
Summing up thus far, we can say that, alhough levels of education among the
foreign-born are low, and low levels of schooling consistently yield negative impacts
on all three outcomes of interest, the foreign-born show remarkably strong levels of
labour force attachment, whether before or after controls. While African Americans
are much better educated than the foreign-born, they fare poorly on all three
indicators, whether before or after controls. Although second-generation Mexicans
show weaker labour force attachment compared to whites, differences never attain
conventional levels of statistical significance at the zero-order level and are then
further reduced by controls. In contrast to African Americans, moreover, second-
generation Mexicans are more likely to be employed and to work more weeks, a
disparity that appears both before and after controls. While the gap between white
and Mexican-origin third-generation-plus men is slight on all three indicators, both
before and after controls, the same comparison indicates that the latter have
significantly stronger levels of labour force attachment than those displayed by their
African American counterparts. Thus, we find no support for the hypothesis of
segmented assimilation.
22 R. Waldinger, N. Lim & D. Cort
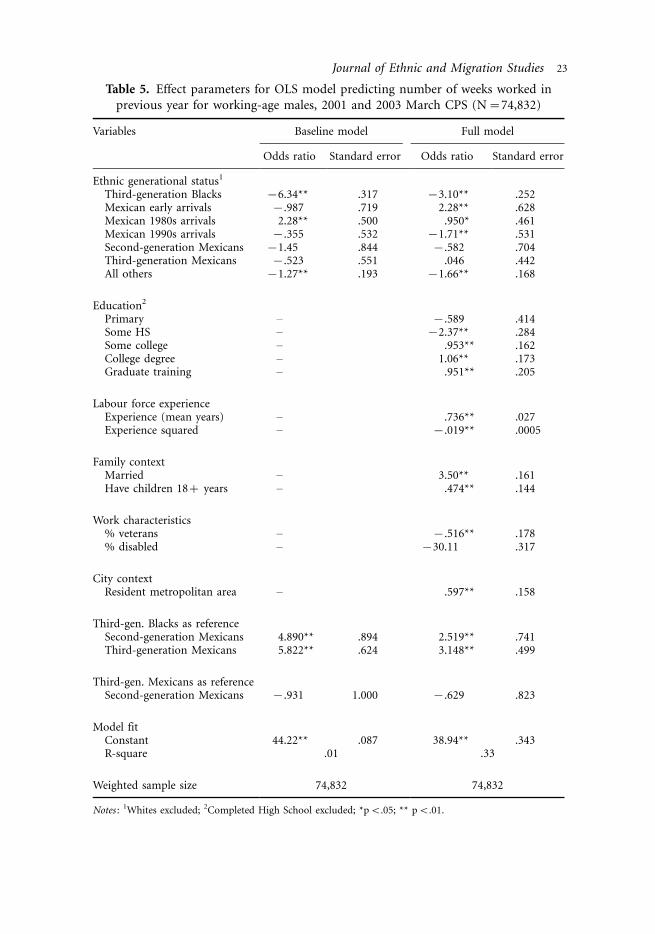
Table 5. Effect parameters for OLS model predicting number of weeks worked in
previous year for working-age males, 2001 and 2003 March CPS (N�/74,832)
Variables Baseline model Full model
Odds ratio Standard error Odds ratio Standard error
Ethnic generational status1
Third-generation Blacks �/6.34** .317 �/3.10** .252Mexican early arrivals �/.987 .719 2.28** .628Mexican 1980s arrivals 2.28** .500 .950* .461Mexican 1990s arrivals �/.355 .532 �/1.71** .531Second-generation Mexicans �/1.45 .844 �/.582 .704Third-generation Mexicans �/.523 .551 .046 .442All others �/1.27** .193 �/1.66** .168
Education2
Primary � �/.589 .414Some HS � �/2.37** .284Some college � .953** .162College degree � 1.06** .173Graduate training � .951** .205
Labour force experienceExperience (mean years) � .736** .027Experience squared � �/.019** .0005
Family contextMarried � 3.50** .161Have children 18�/ years � .474** .144
Work characteristics% veterans � �/.516** .178% disabled � �/30.11 .317
City contextResident metropolitan area � .597** .158
Third-gen. Blacks as referenceSecond-generation Mexicans 4.890** .894 2.519** .741Third-generation Mexicans 5.822** .624 3.148** .499
Third-gen. Mexicans as referenceSecond-generation Mexicans �/.931 1.000 �/.629 .823
Model fitConstant 44.22** .087 38.94** .343R-square .01 .33
Weighted sample size 74,832 74,832
Notes : 1Whites excluded; 2Completed High School excluded; *pB/.05; ** pB/.01.
Journal of Ethnic and Migration Studies 23

Table 6. Effect parameters for logit model predicting chronic joblessness in previous year
for working-age males, 2001 and 2003 March CPS (N�/74,832)
Variables Baseline model Full model
Odds ratio Standard error Odds ratio Standard error
Ethnic generational status1
Third-generation Blacks 1.74** .101 1.20** .083Mexican early arrivals 1.05 .217 .739 .176Mexican 1980s arrivals .296** .089 .426** .149Mexican 1990s arrivals .754 .127 1.30 .242Second-generation Mexicans 1.32 .275 1.32 .308Third-generation Mexicans .909 .155 .865 .154All others 1.00 .051 1.15** .067
Education2
Primary � .905 .097Some HS � 1.17* .085Some college � .813** .046College degree � .862* .062Graduate training � .747** .072
Labour force experienceExperience (mean years) � .951** .008Experience squared � 1.00** .0001
Family contextMarried � .736** .036Have children 18�/ years � .655** .035
Work characteristics% veterans � 1.15** .061% disabled � 9.48** .473
City contextResident metropolitan area � 1.09 .059
Third-gen. Blacks as referenceSecond-generation Mexicans .759 .161 1.092 .263Third-generation Mexicans .521** .092 .715 .134
Third-gen. Mexicans as referenceSecond-generation Mexicans 1.456 .387 1.526 .445
Model fitLog Likelihood �/14,061 �/11,241��
BIC �/811,627 �/817,132��
Weighted sample size 74,832 74,832
Notes : 1Whites excluded; 2Completed High School excluded; *pB/.05; **pB/.01; ��significant decrement in
BIC and increment in Log Likelihood relative to baseline model.
24 R. Waldinger, N. Lim & D. Cort
Job Quality
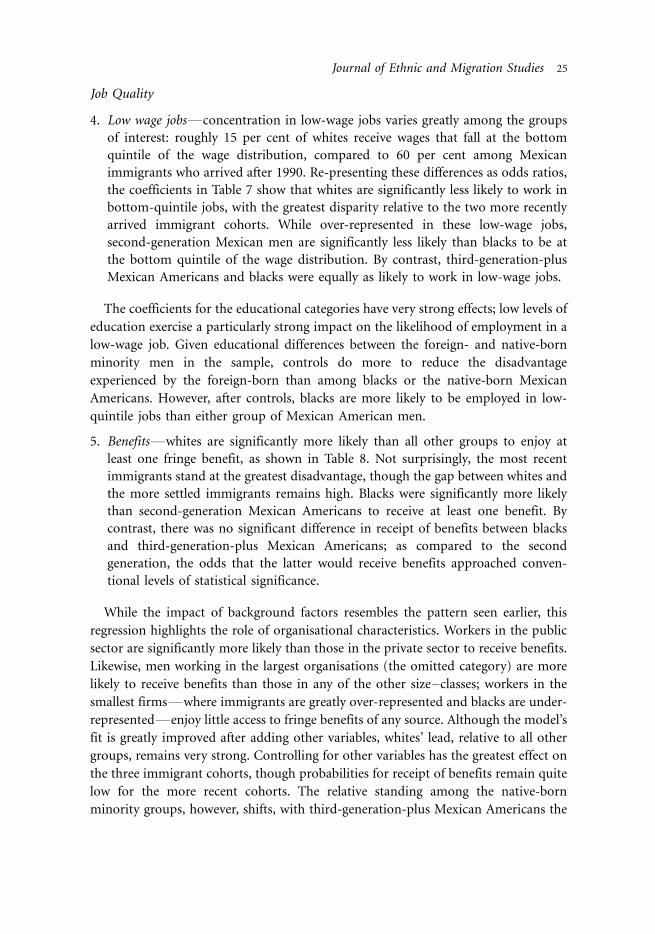
4. Low wage jobs*concentration in low-wage jobs varies greatly among the groups
of interest: roughly 15 per cent of whites receive wages that fall at the bottom
quintile of the wage distribution, compared to 60 per cent among Mexican
immigrants who arrived after 1990. Re-presenting these differences as odds ratios,
the coefficients in Table 7 show that whites are significantly less likely to work in
bottom-quintile jobs, with the greatest disparity relative to the two more recently
arrived immigrant cohorts. While over-represented in these low-wage jobs,
second-generation Mexican men are significantly less likely than blacks to be at
the bottom quintile of the wage distribution. By contrast, third-generation-plus
Mexican Americans and blacks were equally as likely to work in low-wage jobs.
The coefficients for the educational categories have very strong effects; low levels of
education exercise a particularly strong impact on the likelihood of employment in a
low-wage job. Given educational differences between the foreign- and native-born
minority men in the sample, controls do more to reduce the disadvantage
experienced by the foreign-born than among blacks or the native-born Mexican
Americans. However, after controls, blacks are more likely to be employed in low-
quintile jobs than either group of Mexican American men.
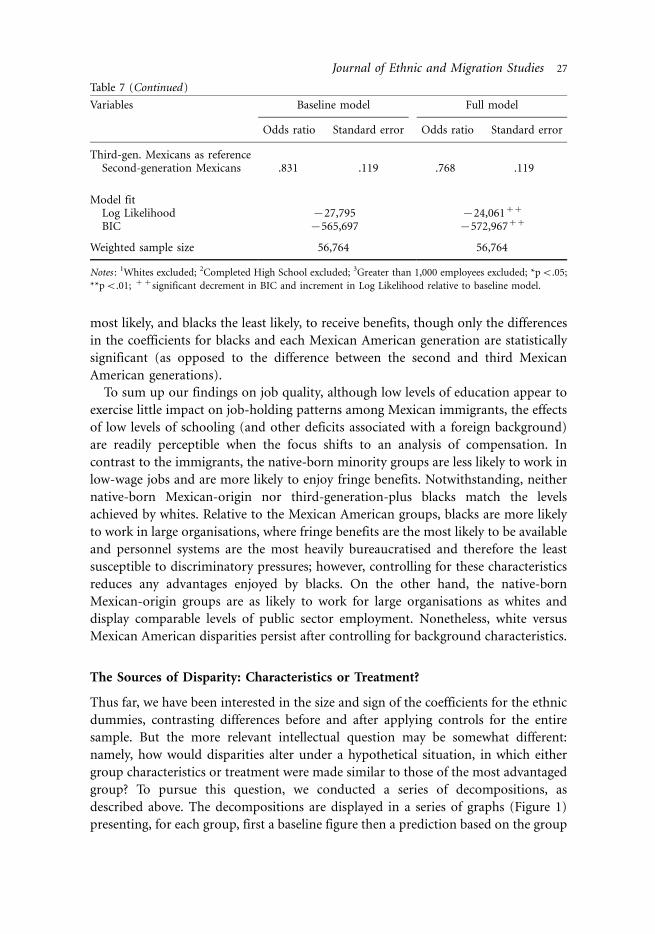
5. Benefits*whites are significantly more likely than all other groups to enjoy at
least one fringe benefit, as shown in Table 8. Not surprisingly, the most recent
immigrants stand at the greatest disadvantage, though the gap between whites and
the more settled immigrants remains high. Blacks were significantly more likely
than second-generation Mexican Americans to receive at least one benefit. By
contrast, there was no significant difference in receipt of benefits between blacks
and third-generation-plus Mexican Americans; as compared to the second
generation, the odds that the latter would receive benefits approached conven-
tional levels of statistical significance.
While the impact of background factors resembles the pattern seen earlier, this
regression highlights the role of organisational characteristics. Workers in the public
sector are significantly more likely than those in the private sector to receive benefits.
Likewise, men working in the largest organisations (the omitted category) are more
likely to receive benefits than those in any of the other size�classes; workers in the
smallest firms*where immigrants are greatly over-represented and blacks are under-
represented*enjoy little access to fringe benefits of any source. Although the model’s
fit is greatly improved after adding other variables, whites’ lead, relative to all other
groups, remains very strong. Controlling for other variables has the greatest effect on
the three immigrant cohorts, though probabilities for receipt of benefits remain quite
low for the more recent cohorts. The relative standing among the native-born
minority groups, however, shifts, with third-generation-plus Mexican Americans the
Journal of Ethnic and Migration Studies 25
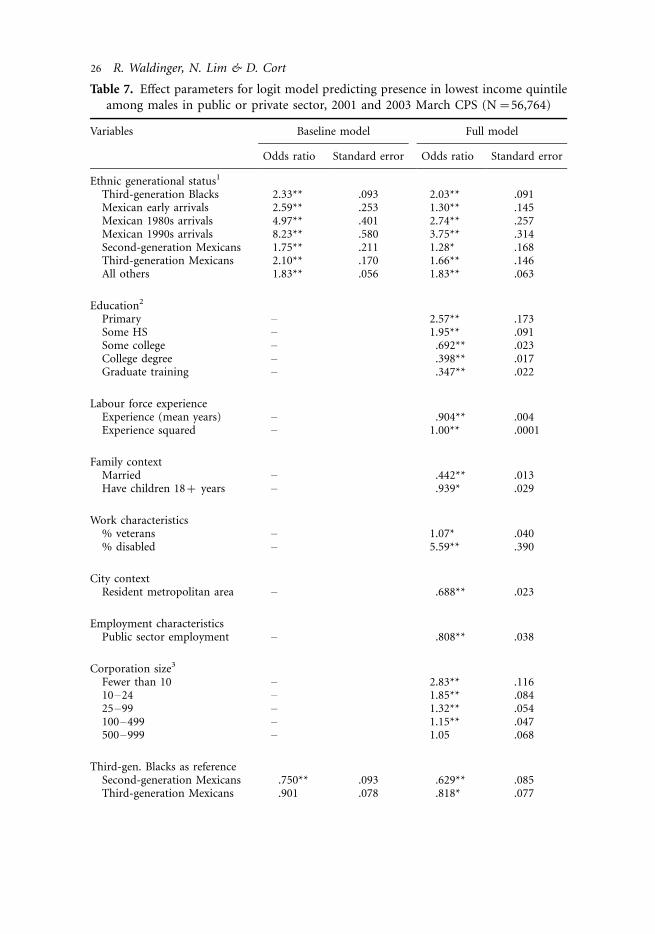
Table 7. Effect parameters for logit model predicting presence in lowest income quintile
among males in public or private sector, 2001 and 2003 March CPS (N�/56,764)
Variables Baseline model Full model
Odds ratio Standard error Odds ratio Standard error
Ethnic generational status1
Third-generation Blacks 2.33** .093 2.03** .091Mexican early arrivals 2.59** .253 1.30** .145Mexican 1980s arrivals 4.97** .401 2.74** .257Mexican 1990s arrivals 8.23** .580 3.75** .314Second-generation Mexicans 1.75** .211 1.28* .168Third-generation Mexicans 2.10** .170 1.66** .146All others 1.83** .056 1.83** .063
Education2
Primary � 2.57** .173Some HS � 1.95** .091Some college � .692** .023College degree � .398** .017Graduate training � .347** .022
Labour force experienceExperience (mean years) � .904** .004Experience squared � 1.00** .0001
Family contextMarried � .442** .013Have children 18�/ years � .939* .029
Work characteristics% veterans � 1.07* .040% disabled � 5.59** .390
City contextResident metropolitan area � .688** .023
Employment characteristicsPublic sector employment � .808** .038
Corporation size3
Fewer than 10 � 2.83** .11610�24 � 1.85** .08425�99 � 1.32** .054100�499 � 1.15** .047500�999 � 1.05 .068
Third-gen. Blacks as referenceSecond-generation Mexicans .750** .093 .629** .085Third-generation Mexicans .901 .078 .818* .077
26 R. Waldinger, N. Lim & D. Cort
most likely, and blacks the least likely, to receive benefits, though only the differences
in the coefficients for blacks and each Mexican American generation are statistically
significant (as opposed to the difference between the second and third Mexican
American generations).
To sum up our findings on job quality, although low levels of education appear to
exercise little impact on job-holding patterns among Mexican immigrants, the effects
of low levels of schooling (and other deficits associated with a foreign background)
are readily perceptible when the focus shifts to an analysis of compensation. In
contrast to the immigrants, the native-born minority groups are less likely to work in
low-wage jobs and are more likely to enjoy fringe benefits. Notwithstanding, neither
native-born Mexican-origin nor third-generation-plus blacks match the levels
achieved by whites. Relative to the Mexican American groups, blacks are more likely
to work in large organisations, where fringe benefits are the most likely to be available
and personnel systems are the most heavily bureaucratised and therefore the least
susceptible to discriminatory pressures; however, controlling for these characteristics
reduces any advantages enjoyed by blacks. On the other hand, the native-born
Mexican-origin groups are as likely to work for large organisations as whites and
display comparable levels of public sector employment. Nonetheless, white versus
Mexican American disparities persist after controlling for background characteristics.
The Sources of Disparity: Characteristics or Treatment?
Thus far, we have been interested in the size and sign of the coefficients for the ethnic
dummies, contrasting differences before and after applying controls for the entire
sample. But the more relevant intellectual question may be somewhat different:
namely, how would disparities alter under a hypothetical situation, in which either
group characteristics or treatment were made similar to those of the most advantaged
group? To pursue this question, we conducted a series of decompositions, as
described above. The decompositions are displayed in a series of graphs (Figure 1)
presenting, for each group, first a baseline figure then a prediction based on the group
Table 7 (Continued )
Variables Baseline model Full model
Odds ratio Standard error Odds ratio Standard error
Third-gen. Mexicans as referenceSecond-generation Mexicans .831 .119 .768 .119
Model fitLog Likelihood �/27,795 �/24,061��
BIC �/565,697 �/572,967��
Weighted sample size 56,764 56,764
Notes : 1Whites excluded; 2Completed High School excluded; 3Greater than 1,000 employees excluded; *pB/.05;
**pB/.01; ��significant decrement in BIC and increment in Log Likelihood relative to baseline model.
Journal of Ethnic and Migration Studies 27
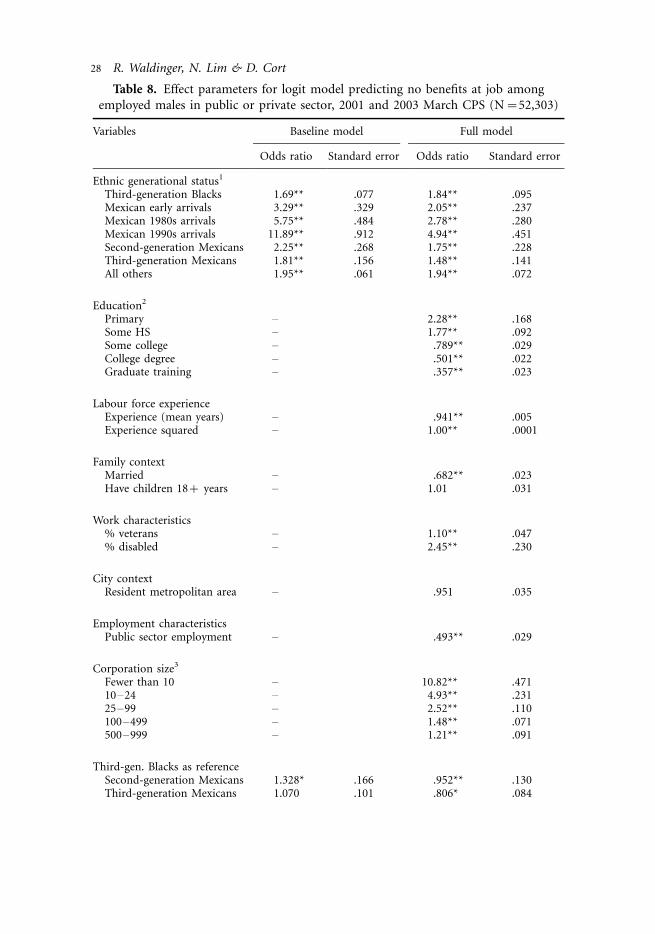
Table 8. Effect parameters for logit model predicting no benefits at job among
employed males in public or private sector, 2001 and 2003 March CPS (N�/52,303)
Variables Baseline model Full model
Odds ratio Standard error Odds ratio Standard error
Ethnic generational status1
Third-generation Blacks 1.69** .077 1.84** .095Mexican early arrivals 3.29** .329 2.05** .237Mexican 1980s arrivals 5.75** .484 2.78** .280Mexican 1990s arrivals 11.89** .912 4.94** .451Second-generation Mexicans 2.25** .268 1.75** .228Third-generation Mexicans 1.81** .156 1.48** .141All others 1.95** .061 1.94** .072
Education2
Primary � 2.28** .168Some HS � 1.77** .092Some college � .789** .029College degree � .501** .022Graduate training � .357** .023
Labour force experienceExperience (mean years) � .941** .005Experience squared � 1.00** .0001
Family contextMarried � .682** .023Have children 18�/ years � 1.01 .031
Work characteristics% veterans � 1.10** .047% disabled � 2.45** .230
City contextResident metropolitan area � .951 .035
Employment characteristicsPublic sector employment � .493** .029
Corporation size3
Fewer than 10 � 10.82** .47110�24 � 4.93** .23125�99 � 2.52** .110100�499 � 1.48** .071500�999 � 1.21** .091
Third-gen. Blacks as referenceSecond-generation Mexicans 1.328* .166 .952** .130Third-generation Mexicans 1.070 .101 .806* .084
28 R. Waldinger, N. Lim & D. Cort
mean (applying white coefficients), and then a prediction based on the white mean
(applying group coefficients). Outcomes are all graphed relative to the white mean,
which appears as a horizontal line. We have allowed scales to vary, given the
underlying differences in the variables of interest, for example employment*which
engages the great majority of men in all groups*as opposed to chronic
joblessness*which affects only a small proportion of any of the groups. Note that
group bars surpassing the white mean do not necessarily imply positive outcomes:
e.g., a higher proportion reporting chronic joblessness or employment in jobs with
lowest-quintile earnings denotes disadvantage. Consequently, substantive interpreta-
tion needs to be keyed to the variable in question.
Either hypothetical reduces the size of the disparity relative to third-generation-
plus whites, for every group, and for each of the dependent variables. For example,
giving each group white coefficients, but leaving their own means unchanged,
increases employment rates, producing convergence with whites among blacks and
second-generation Mexicans, and pushing third-generation-plus Mexicans above the
white mean. Assigning white means, but applying group coefficients, however, has an
even greater positive effect, propelling all groups slightly above the white mean. The
hypotheticals yield their greatest impact on blacks, an unsurprising result in light of
the underlying black/white disparity.
On the other hand, the impact of the hypotheticals varies among the groups. Both
hypotheticals leave third-generation-plus Mexicans outperforming whites on each
dimension. Among second-generation Mexicans, outcomes are advantaged, relative
to whites, when white means are assigned but group coefficients are applied; the
hypothetical applying white coefficients to second-generation Mexicans means,
however, leaves second-generation Mexicans with slightly lower levels of employment
and slightly fewer weeks worked than whites. Hypothetically assigning white means to
blacks, however, has the least consistently positive effect: assuming that blacks now
possess the characteristics of whites but receive the same treatment leaves them with
fewer weeks worked, a higher proportion in jobs at the lowest quintile, and a lower
proportion with at least one benefit.
Table 8 (Continued)
Variables Baseline model Full model
Odds ratio Standard error Odds ratio Standard error
Third-gen. Mexicans as referenceSecond-generation Mexicans 1.241 .181 1.181 .187
Model fitLog Likelihood �/25,381 �/20,837��
BIC �/517,411 �/526,305��
Weighted sample size 52,303 52,303
Notes : 1Whites excluded; 2Completed High School excluded; 3Greater than 1,000 employees excluded; *pB/.05;
**pB/.01; ��significant decrement in BIC and increment in Log Likelihood relative to baseline model.
Journal of Ethnic and Migration Studies 29
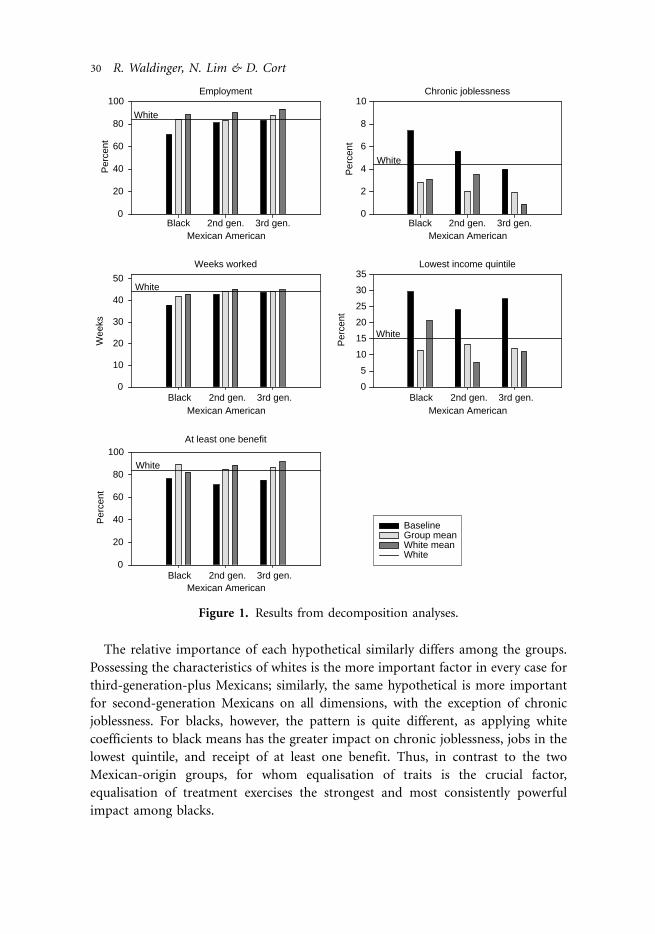
The relative importance of each hypothetical similarly differs among the groups.
Possessing the characteristics of whites is the more important factor in every case for
third-generation-plus Mexicans; similarly, the same hypothetical is more important
for second-generation Mexicans on all dimensions, with the exception of chronic
joblessness. For blacks, however, the pattern is quite different, as applying white
coefficients to black means has the greater impact on chronic joblessness, jobs in the
lowest quintile, and receipt of at least one benefit. Thus, in contrast to the two
Mexican-origin groups, for whom equalisation of traits is the crucial factor,
equalisation of treatment exercises the strongest and most consistently powerful
impact among blacks.
Chronic joblessness
Black 2nd gen. 3rd gen.
Per
cent
Per
cent
Per
cent
0
2
4
6
8
10Employment
Black 2nd gen. 3rd gen.0
20
40
60
80
100
Mexican American
White
Mexican American
White
Lowest income quintile
Black 2nd gen. 3rd gen.0
5
10
15
20
25
30
35
BaselineGroup meanWhite meanWhite
Mexican American
White
Weeks worked
Black 2nd gen. 3rd gen.
Wee
ks
0
10
20
30
40
50
At least one benefit
Black 2nd gen. 3rd gen.
Per
cent
0
20
40
60
80
100
Mexican American
Mexican American
White
White
Figure 1. Results from decomposition analyses.
30 R. Waldinger, N. Lim & D. Cort
Conclusion
As argued by the proponents of segmented assimilation themselves, the offspring of
Mexican immigrants provide the litmus test for the view that the children of
working-class immigrants are at risk of ‘downward assimilation’. But no support for
this hypothesis can be found in the empirical evidence reviewed above. Defining the
‘underclass’ as those for whom ‘work disappears’, we have focused on three indicators
of labour force attachment: employment, weeks of work and chronic joblessness.
Although second- and third-generation-plus Mexicans never attain the levels of
labour force attachment demonstrated by whites, the disparities are modest, fail to
attain statistical significance, and are further reduced by the application of
conventional demographic controls. By contrast, labour force attachment among
third-generation-plus blacks compares unfavourably with that of whites across all
three indicators*a contrast that persists both before and after controls. In
comparison to blacks, second-generation Mexicans display higher levels of labour
force attachment on two indicators, and third-generation-plus Mexicans display
higher levels of labour force attachment on all three indicators, both before and after
controls.
Our examination of job quality indicators provides support for the most basic of
conventional assimilation claims: namely, that immigrant children, born in the
United States, do better than the foreign-born themselves. On the other hand, an
outcome of this sort is hardly a surprise, given the very low levels of schooling of
immigrants from Mexico and the bottom-level positions they occupy in the labour
market. As noted earlier, and underscored again here, the levels of schooling attained
by Mexican immigrant offspring involve a sizeable advance relative to the first
generation; not surprisingly, the quality of the jobs secured by offspring also shifts for
the better.
More impressively, perhaps, the evidence suggests that the immigrant offspring
have gone from the margins of the economy into its mainstream, at least as
conceptualised by Alba and Nee (2003). If not quite at the level of third-generation-
plus whites, the proportion of second-generation Mexicans working in the public
sector stands just above the grand mean*in stark contrast to the situation of the
foreign-born. Likewise, the share of Mexican immigrant offspring working in the
largest organisations puts them six percentage points above the national mean,
whereas the immigrants are over-represented among employers of the very smallest
sort.
But if Mexican Americans have moved from marginal to ‘mainstream’ employers, it
is not clear that they have succeeded in shifting from ‘bad’ to ‘good’ jobs. Relative to
whites, second-generation Mexicans are far more likely to be working in jobs that fall
at the low end of the earnings distribution. Furthermore, they are less likely to receive
fringe benefits of any sort. While controlling for background characteristics that might
depress receipt of fringes*most notably experience and education*diminishes the
disparity, it still leaves Mexican immigrant offspring lagging behind whites.
Journal of Ethnic and Migration Studies 31
As the decompositions show, those lags are principally related to differences in
characteristics, a finding consistent with previous research employing a similar
technique (Trejo 1997), and more supportive of the conventional, rather than the
segmented, assimilation approach. Treatment, however, matters, since assigning white
coefficients to the Mexican-origin groups, while leaving group means unchanged,
substantially reduces ethnic disparities. While the hypotheticals do suggest that the
Mexican-origin groups would receive better jobs were they to possess the skills (and
other relevant attributes) of native whites, the prospects for narrowing that gap are at
best uncertain, as disparities in educational attainment between whites and Mexican
Americans seem to be deeply entrenched (Grogger and Trejo 2002). While college
completion has a strongly positive effect on all of the outcomes reviewed in this
paper, second- and third-generation-plus Mexican Americans complete college at far
lower levels than whites, with the most recent evidence on young Mexican American
adults pointing to a persistent college completion gap (Fry 2004).
The findings for African American men are no less relevant for the assimilation
approach, and its underlying claims regarding the ‘mainstream’. Not only do
treatment effects matter more than characteristics, but they matter more for the
allocation of benefits and access to better-paid jobs*precisely those outcomes that
are the most likely to be affected by the institutional factors emphasised by
assimilation theory, as revised by Alba and Nee (2003).
Though the results reported in this paper are at odds with the claims of
assimilation theory, whether in its conventional or its segmented form, they should
not surprise. The contention that Mexican immigrant offspring would assimilate
downward into a ‘rainbow underclass’ always warranted scepticism. Today’s
immigrants from Mexico, as noted by Douglas Massey and his collaborators, ‘may
be poor in financial resources, but they are wealthy in social capital, which they can
readily convert into jobs and earnings in the United States’ (Massey et al. 1987).
Consequently, many Mexican immigrant offspring grow up in communities that are
often poor, but are also deeply embedded in local labour markets, providing the
connections, information and role models needed to keep the second generation
firmly attached to work.
On the other hand, there are also good reasons for caution regarding the optimistic
scenario forecast by the proponents of conventional assimilation. While immigrant
offspring may abandon the ethnic enclaves and niches of the first generation for the
economic mainstream, the latter is hardly an undifferentiated category. Not only do
personnel practices within the mainstream vary widely (consider, for example, the
contrasts between Wal-Mart, General Motors and municipal government), but job
characteristics tend to cluster together. Moreover, the evolution of the American
economy is such that ‘good’ jobs, at least as defined here, are increasingly likely to
elude workers who have not completed college*such as the Mexican immigrant
offspring whom we have studied in this paper.
By contrast, the prospects for ‘working-class incorporation’ seem the most realistic.
Contrary to the proponents of segmented assimilation, the situation of the
32 R. Waldinger, N. Lim & D. Cort
contemporary second generation is not sui generis. An ‘oppositional culture’ may
indeed characterise some of today’s second-generation youth. However, as we have
previously noted (Perlmann and Waldinger 1997), it also bears a striking similarity to
the subcultures of the European-American ethnic working-class of a generation or
two ago, which never prevented transitions from rebellious adolescence to work. But
if a historical perspective implies that strong attachment to work is likely to persist
from first to second generations, it can also suggest that changes in the quality of jobs
may be difficult to secure. As in the past, the ethnic connections of the parental
generation may help lubricate entry into the world of work, but are unlikely to reach
far up the organisation. Moreover, the shadow of the first generation may not be that
easy to escape. Just as immigration from Mexico is of long-standing vintage, so too
are employers’ stereotypes: now, as earlier in the century (see Deverell 2004; Monroy
1999), the immigrants are seen as the right workers for the wrong jobs. Should
employers retain these negative views, all the while restructuring workplaces in ways
that circumscribe access to ‘good’ jobs, the immigrant offspring of Mexican
immigrants may run into trouble, as they seek to gain the acceptance from the
‘‘’mainstream’ required for moving ahead.
Acknowledgements
Grateful thanks to the Russell Sage Foundation and to the University of California,
Institute of Labor and Employment, for grants supporting this research; responsi-
bility for the results reported herein is that of the authors alone.
Notes
[1] Since 1994, the Current Population Survey has often been used for studies of the second
generation. We note that the CPS shares many of the shortcomings that afflict other similar
sources of official data used for the study of immigration: in particular, it does not ask about
legal status. However, this lacuna is likely to be of limited importance for the purposes at
hand, which entail studying those children of immigrants who are born in the United States,
and for whom US citizenship is a birthright status. While an unauthorised legal status may
affect the foreign-born, the huge rise in legal admissions from Mexico and, more
importantly, adjustments among Mexicans already residing in the United States imply
that the migrants of earlier vintage found in the sample represent a largely legalised
population.
[2] If migrant selectivity is diminishing, as is likely to be true among Mexican immigrants (e.g.
Borjas 1994), cross-sectional comparisons between first and second generations may yield
upwardly biased indicators of inter-generational change, as the contemporary second
generation are the offspring of an earlier, and possibly more selective group than the most
recent cohorts. By contrast, cross-sectional comparisons between second and third
generations may yield downward biases, due to differences in the ways in which these
populations are identified. Whereas the second generation is identified genealogically, using
information about parent’s birthplace, the third-plus generation is identified psycho-socially,
using information regarding ethnic identity. While current knowledge does not tell us
whether retention of Mexican ethnic identity varies by social class or ethnicity of marital
Journal of Ethnic and Migration Studies 33
partner, research on other groups (e.g. Alba 1990) suggests that social mobility and
intermarriage decrease the likelihood of continued affiliation.
References
Alba, R. (1990) Ethnic Identity: The Emergence of the European-Americans. New Haven: Yale
University Press.
Alba, R. and Nee, V. (2003) Remaking the American Mainstream: Assimilation and Contemporary
Immigration. Cambridge: Harvard University Press.
Blinder, A.S. (1973) ‘Wage discrimination: reduced form and structural estimates’, Journal of
Human Resources, 8(4): 436�55.
Bogardus, E. (1929) ‘Second generation Mexicans’, Sociology and Social Research, 13(1): 276�83.
Bogardus, E. (1934) The Mexican in the United States. Los Angeles: University of Southern
California Press.
Borjas, G.J. (1994) ‘The economics of immigration’, Journal of Economic Literature, 32(4): 1667�717.
Cotton, J. (1988) ‘On the decomposition of wage differentials’, Review of Economics and Statistics,
70(2): 236�43.
Deverell, W. (2004) Whitewashed Adobe: The Rise of Los Angeles and the Remaking of its Mexican
Past. Berkeley: University of California Press.
Doeringer, P.B. and Piore, M.J. (1971) Internal Labor Markets and Manpower Analysis. Lexington,
MA: Heath Lexington Books.
Farber, H.S. (1997) ‘Job creation in the United States: good jobs or bad?’ Princeton NJ: Princeton
University, Industrial Relations Section, Working Paper No. 285.
Farley, R. and Alba, R. (2002) ‘The new second generation in the United States’, International
Migration Review, 36(2): 669�701.
Fry, R. (2004) Latino Youth Finishing College: The Role Of Selective Pathways. Report of the Pew
Hispanic Center, online at http://pewhispanic.org/files/reports/30.pdf, accessed 4 May 2005.
Grebler, L., Moore, J.W. and Guzman, R.C., with Berlant, J.L. and others (1970) The Mexican-
American People, the Nation’s Second Largest Minority. New York: Free Press.
Grogger, J. and Trejo, S.J. (2002) Falling Behind or Moving Up? The Intergenerational Progress of
Mexican Americans. Report of the Public Policy Institute of California, online at http://
www.ppic.org/content/pubs/R_502JGR.pdf, accessed 5 May 2005.
Holzer, H. (1996) What Employers Want: Job Prospects for Less-Educated Workers. New York: Russell
Sage Foundation.
Jencks, C. (1992) Rethinking Social Policy: Race, Poverty, and the Underclass. Cambridge, Mass:
Harvard University Press.
Jencks, C., Perman, L. and Rainwater, L. (1988) ‘What is a good job? A new measure of labor-
market success’, American Journal of Sociology, 93(6): 1322�57.
Kalleberg, A., Reskin, B. and Hudson, K. (2000) ‘Bad jobs in America: standard and nonstandard
employment relations and job quality in the United States’, American Sociological Review,
65(2): 256�78.
Lopez, D. and Stanton-Salazar, R. (2001) ‘The new Mexican second generation’, in Rumbaut, R. and
Portes, A. (eds) Ethnicities: Children of Immigrants in America. Berkeley: University of
California Press, 57�90.
Massey, D., Durand, J., Alarcon, R. and Gonzalez, H. (1987) Return to Aztlan. Berkeley: University
of California Press.
Monroy, D. (1999) Rebirth: Mexican Los Angeles from the Great Migration to the Great Depression.
Berkeley: University of California Press.
Moore, J. and Pinderhughes, R. (eds) (1993) In the Barrios: Latinos and the Underclass Debate. New
York: Russell Sage Foundation.
34 R. Waldinger, N. Lim & D. Cort
Morawska, E. (1985) For Bread with Butter. New York: Cambridge University Press.
Moss, P. and Tilly, C. (2001) Stories Employers Tell: Race, Skill, and Hiring in America. New York:
Russell Sage Foundation.
Ortiz, V. (1996) ‘The Mexican-origin population: permanent working-class or emerging middle-
class?’, in Waldinger, R. and Bozorgmehr, M. (eds) Ethnic Los Angeles. New York: Russell Sage,
247�78.
Osterman, P. (1980) Getting Started: The Youth Labor Market. Cambridge, MA: MIT Press.
Perlmann, J. and Waldinger, R. (1997) ‘Second generation decline? Immigrant children past and
present: a reconsideration’, International Migration Review, 31(4): 893�922.
Portes, A. and Bach, R. (1985) Latin Journey. Berkeley, CA: University of California Press.
Portes, A. and Rumbaut, R. (2001) Legacies: The Story of the Immigrant Second Generation. Berkeley:
University of California Press.
Portes, A. and Zhou, M. (1993) ‘The new second generation: segmented assimilation and its
variants among post-1965 immigrant youth’, Annals of the American Academy of Political and
Social Science, 530: 74�96.
Stata (2003) Reference Manual, Release 8. College Station Texas: Stata Press.
Tilly, C. (1997) ‘Arresting the decline of good jobs in the USA’, Industrial Relations Journal, 28(4):
269�74.
Tilly, C. (1998) Durable Inequality. Berkeley, Ca: University of California Press.
Tilly, C. and Tilly, C. (1998) Work under Capitalism: New Perspectives in Sociology. Boulder, Co:
Westview Press.
Trejo, S. (1997) ‘Why do Mexican Americans earn low wages?’, Journal of Political Economy, 105(6):
1235�68.
Waldinger, R. (1996) Still the Promised City? African Americans and New Immigrants in
Postindustrial New York. Cambridge, Ma: Harvard University Press.
Waldinger, R. and Feliciano, C. (2004) ‘Will the new second generation experience ‘‘downward
assimilation’’? Segmented assimilation re-assessed’, Ethnic and Racial Studies, 27(3): 376�402.
Waldinger, R. and Lichter, M. (2003) How the Other Half Works: Immigration and the Social
Organization of Labor. Berkeley, Ca: University of California Press.
Weakliem, D.L. (2004) ‘Introduction to the Special Issue on Model Selection’, Sociological Methods
and Research, 33(2): 167�87.
Wilson, W.J. (1996) When Work Disappears: The World of the New Urban Poor. New York: Knopf.
Journal of Ethnic and Migration Studies 35