Embed Size (px)
Citation preview
The Employment Impact of Autonomous Vehicles
Office of the Chief Economist Economics and Statistics Administration Page 1
Executive Summary
The expected introduction of autonomous, or “self-driving,” vehicles (AVs) promises to have a potentially profound impact on labor demand. This paper explores this potential effect by identifying the occupations most likely to be directly affected by the business adoption of autonomous vehicles.
In 2015, 15.5 million U.S. workers were employed in occupations that could be affected (to varying degrees) by the introduction of automated vehicles. This represents about one in nine workers.
We divide these occupations into “motor vehicle operators” and “other on-the-job drivers.” Motor vehicle operators are occupations for which driving vehicles to transport persons and goods is a primary activity. In 2015, there were 3.8 million workers in these occupations. These workers were predominately male, older, less educated, and compensated less than the typical worker. Motor vehicle operator jobs are most concentrated in the transportation and warehousing sector.
Other on-the-job drivers use roadway motor vehicles to deliver services or to travel to work sites, such as first responders, construction trades, repair and installation, and personal home care aides. In 2015, there were 11.7 million workers in these occupations and they are mostly concentrated in construction, administrative and waste management, health care, and government. Other-on-the-job drivers may be more likely to benefit from greater productivity and better working conditions offered by AVs than motor vehicle operator occupations.
U.S. Department of Commerce
Economics and Statistics Administration Office of the Chief Economist
The Employment Impact of Autonomous Vehicles
By David Beede,
Regina Powers, and
Cassandra Ingram
ESA Issue Brief #05-17
August 11, 2017

The Employment Impact of Autonomous Vehicles
Office of the Chief Economist Economics and Statistics Administration Page 2
Introduction
The expected introduction of autonomous vehicles, “self-driving” vehicles that can sense their surroundings and guide themselves without human intervention, promises to have a potentially profound impact on transportation. These vehicles offer many possible benefits to society, such as improved safety, a less burdensome travel experience, energy conservation, and reduced air pollution; and they have the potential to change many aspects of the economy, including land use patterns as well as the medical, legal, and insurance industries (Clements and Kockelman 2017). It appears that AVs will be technologically feasible at some point in the near future, and despite several challenging issues, the eventual use of them on roads is becoming more likely. In September 2016, the U.S. Department of Transportation and the National Highway Traffic Safety Administration (NHTSA) published policy guidelines for AVs, recognizing their potential as “the greatest personal transportation revolution since the popularization of the personal automobile nearly a century ago” (NHTSA 2016).
Box 1 summarizes the various stages in the evolution of vehicles from those with no automation to those that are fully autonomous. The worldwide number of advanced driver-assistance systems (ADAS), such as backup cameras and adaptive cruise control, increased from 90 million to 140 million units between 2014 and 2016. Consumers have indicated a willingness to pay $500-$2,500 per vehicle for ADAS. Sensor technologies are rapidly advancing to provide sophisticated information to vehicle operating systems about the surrounding environment, such as road conditions and the location of other nearby vehicles. However, slower progress has been made in developing software that can mimic human driver decision-making, so that fully autonomous vehicles may not be introduced for another ten or more years (Heineke, et al. 2017).
While much attention has focused on how AVs will impact personal mobility, they could also transform the way many businesses provide goods and services. For businesses, AVs could represent a capital investment in a labor-saving technology, with the potential to substitute for the labor currently tasked with driving. On the other hand, AVs, by improving safety or reducing travel time, may provide functions that are complementary to functions of workers in these businesses, ultimately boosting the demand for them (Autor 2015).
Previous research on automation and changes in employment suggests that the impact on labor will depend on characteristics of the services provided by the workers, such as the degree to which an occupation consists of a series of routine tasks (Frey and Osborne 2013). Therefore, although new technologies such as AVs have the potential to eliminate jobs, they can also increase demand for some tasks and perhaps lead to demand for entirely new tasks, some of which may require new skills (Bessen 2015; Autor, Levy, and Murnane 2003; Levy and Murnane 2013).
This research attempts to identify the occupations and industries that may be most directly affected by autonomous vehicles and to use available data to examine the current characteristics of these jobs and the workers who do them.1 Most previous research about workers potentially affected by AVs has
1 In our analysis, we focus on the current use of conventional motor vehicles and human drivers to provide goods and services. This approach considers only existing jobs. Although the proliferation of autonomous vehicles may be associated with the emergence of new jobs, such as occupations involving the production, maintenance, repair and monitoring of autonomous vehicles, we do not consider those here.

The Employment Impact of Autonomous Vehicles
Office of the Chief Economist Economics and Statistics Administration Page 3
focused narrowly on occupations that are classified simply as motor vehicle operators.2 Below, we extend this analysis to include the many other occupations for which driving is an important, though not the primary, job activity. To simplify the analysis, we focus on workers impacted by the adoption of AVs used on roadways, such as automobiles, buses, and trucks. We consider these vehicles as distinct from specialized vehicles used in more isolated worksite environments such as construction sites, warehouses, mines, and shipyards—for example, forklifts and tractors. Specialized vehicles are customized to particular work environments, so the technological, cost, and regulatory factors that affect their adoption will likely be very different from the factors that affect the adoption of vehicles for use on open roads.
We begin by noting the industry sectors that currently rely on motor vehicles to produce services as an indication of the potential business market for AVs. We then identify driving-related occupations and the work activities associated with these occupations. Next, we examine the characteristics of these on-the-job drivers, including employment by industry, non-driving work activities, required knowledge and skills, driving-related injuries and fatalities, and economic and demographic characteristics. We also compare the characteristics of workers in driving related occupations to the characteristics of the overall workforce. These comparisons are used to help inform our understanding of driving-related jobs and the workers who do them.
2 One exception is Miller 2015. However, we use different specification criteria for identifying occupations, resulting in a broader group of occupations that involve driving.

The Employment Impact of Autonomous Vehicles
Office of the Chief Economist Economics and Statistics Administration Page 4
Box 1. Autonomous Vehicle Technology Is Speeding Forward
Source: Heineke, et al. 2017 and SAE 2014.
Current Motor Vehicle Use by Industry: A Baseline
In 2016, business investments in new motor vehicles totaled $327.5 billion, representing a little over half of total domestic final sales of new autos and trucks.3 Several industry sectors rely relatively heavily on motor vehicles to deliver goods and services to consumers, and these are the industries that potentially would be most likely to adopt AVs. To identify these sectors, we use Bureau of Economic Analysis (BEA) data on the value of capital stocks and investments in private non-residential fixed assets for motor vehicles, which includes data on light trucks (including sport utility vehicles); other trucks, buses, and truck trailers; and autos.
Table 1 highlights the value of motor vehicle equipment by motor vehicle type and by major industry sector, as well as a few subsectors of interest. The value of motor vehicle equipment stocks totaled close to $760 billion, or 11.9 percent of total equipment stocks for all industry sectors. Trucks represented about three-quarters of the total value of motor vehicle equipment stocks, and the auto
3 Bureau of Economic Analysis, National Income and Products Account, Motor Vehicle Output, Table 7.2.5B.
Level of Automation Status
0. No automation
Humans perform all driving functions, but may be helped by warning
systems
1. Driver assistance
Night vision
Blind-spot detection
Surround-view parking
2. Partial automation
Steering
Acceleration
Braking in highway conditions
Avoiding or mitigating collision impacts
3. Conditional automation (systems request human intervention under
difficult roadway and environmental conditions)
Cameras
Radar
Light detection and ranging (lidar)
4. High automation (system attempts to deal with difficult conditions even
when requests for human intervention are ignored)
5. Full automation (under all roadway and environmental conditions that
human drivers can handle, using artificial intelligence)
Perhaps in ten or more
years
Most cars
Now in $20K cars
Now in luxury cars
Perhaps in five years

The Employment Impact of Autonomous Vehicles
Office of the Chief Economist Economics and Statistics Administration Page 5
share was about one-quarter. Industries such as Construction and Transportation and Warehousing rely heavily on motor vehicles, as motor vehicles account for 29.8 and 23.0 percent of total equipment stocks in these industries, respectively.
The capital stocks of the Finance and Insurance and the Real Estate and Rental and Leasing sectors have very high motor vehicle shares, but these shares include vehicles leased out for use by households and other businesses.4 U.S. accounting rules on the treatment of leased assets, including motor vehicles, make it impossible to distinguish the value of vehicles used for the operations of businesses in the Finance and Insurance and Real Estate and Rental Leasing sectors (if any) from the value of vehicles leased to households and operating leases held by businesses in other sectors.5 Therefore, the estimates reported in Table 1 for the Finance and Insurance and the Real Estate and Rental and Leasing sectors likely overstate the value of motor vehicle stocks used by businesses in those sectors and understate the value of motor vehicle stocks used in other sectors.
These data indicate that businesses invest significantly in motor vehicles, suggesting that the potential demand for AVs among businesses could be sizeable. Next, we identify the jobs that would likely be affected by business adoption of AVs.
4 For example, General Motors Financial Company (GMFC), Inc. is a wholly-owned captive finance subsidiary of General Motors Company (GMC). GMFC offers automobile leasing services among other automobile financing products. Despite being wholly-owned by a vehicle manufacturer, data on GFMC’s activities would be classified in a separate industry (NAICS 522220, Sales Financing) from that of GMC for two reasons. First, GMFC’s business activities are different from those of GMC, and second, its establishments (consisting of leased credit centers, collections, and customer service centers in various locations in the US and abroad) are located separately from those of GMC. As of December 31, 2016, the net value of leased vehicles, on GFMC’s balance sheet accounted for 99.1 percent of the net value of company’s physical capital assets (leases were valued at $34.5 billion, while other property and equipment were valued at about $0.3 billion). See General Motors Financial Company, Inc. (2017). 5 Motor vehicle leases for periods shorter than the useful life of the asset (“operating leases”) are not currently required to be reported as assets (and liabilities) on the lessee’s balance sheet. New rules will require both capital and operating leases to be recognized on the balance sheet for publicly-held companies in fiscal years beginning after December 15, 2019 (Financial Accounting Standards Board 2016).

The Employment Impact of Autonomous Vehicles
Office of the Chief Economist Economics and Statistics Administration Page 6
Table 1: Value and Total Share of Motor Vehicles by Industry, 2015
Note: Motor vehicles include light trucks (including utility vehicles); other trucks, buses and truck trailers; and autos. Source: Bureau of Economic Analysis, Current-Cost Net Capital Stock of Private Nonresidential Fixed Assets for 2015.
Roadway Driving Occupations in the United States
There is no dataset specifically designed to identify workers that operate or travel in motor vehicles on roadways, which is the focus of our analysis of business adoption of AVs.6 The best available data for
6 We evaluated whether we could use the American Time Use Survey data collected by the Bureau of Labor Statistics and the American Community Survey collected by the Census Bureau, to identify the relevant set of workers, but neither survey adequately identifies on-the-job driving as distinct from commuting.
Industry Sector
Value of Light
Trucks
(including Utility
Vehicles)
Value of Other
Trucks, Buses
and Truck
Trailers
Value of
Autos
Total Value of
Motor
Vehicles
Equipment
Motor Vehicles
Share of Total
Equipment
Capital Stock for
Each Industry
PercentAll Industries 335,620 211,183 212,274 759,077 11.9
Finance and insurance 108,877 10,317 107,221 226,415 40.7
Credit intermediation and related activities 105,720 9,784 105,522 221,026 46.8
Real estate and rental and leasing 72,712 24,514 52,087 149,313 30.9
Construction 34,543 13,406 11,431 59,380 29.8
Transportation and warehousing 10,647 116,486 3,111 130,244 23.0
Truck transportation 5,225 98,890 874 104,989 79.4
Transit and ground passenger transportation 2,111 10,999 1,252 14,362 75.1
Administrative and waste management services 9,057 8,945 2,570 20,572 16.6
Wholesale trade 23,356 8,144 8,619 40,119 15.6
Other services, except government 6,621 1,123 2,989 10,733 12.4
Agriculture, forestry, fishing, and hunting 18,828 6,246 3,830 28,904 8.5
Retail trade 12,166 5,527 3,740 21,433 7.7
Professional, scientific, and technical services 7,207 855 3,515 11,577 6.7
Management of companies and enterprises 1,684 206 901 2,791 5.8
Arts, entertainment, and recreation 897 1,634 219 2,750 5.2
Mining 4,616 4,654 1,159 10,429 5.0
Educational services 1,070 70 566 1,706 3.2
Accommodation and food services 2,203 148 962 3,313 2.6
Manufacturing 13,639 6,659 5,416 25,714 1.9
Health care and social assistance 4,157 591 1,997 6,745 1.6
Social assistance 1,569 449 516 2,534 21.2
Information 1,907 313 1,370 3,590 0.7
Utilities 1,433 1,345 571 3,349 0.6
(Millions of Dollars)

The Employment Impact of Autonomous Vehicles
Office of the Chief Economist Economics and Statistics Administration Page 7
this purpose is from the Occupational Information Network (O*NET) that includes attributes of occupations such as work activities, work context, and the use of tools and technology.7 O*NET data on work activities provides an average score, on a scale of 1 to 5, of the “importance” of 41 generalized work activities, one of which is “Operating Vehicles or Equipment.”8 Some occupations may involve one or more detailed work activities that fall within the generalized work activity “Operating Vehicles or Equipment” (such detailed work activities are not scored for importance). Furthermore, O*NET data include scores for each occupation for how frequently work is performed in enclosed vehicles (e.g., automobiles) and open vehicles (e.g., tractors). Finally, O*NET data on “tools and technology” identify occupations that use motor vehicles as a tool. While none of these variables alone fully captures occupations that involve driving, together they provide a reasonable list of those occupations that currently use roadway motor vehicles on the job and that therefore would be more likely to use AVs.
To identify roadway driving occupations, we start by using the O*NET to flag those that perform at least one of the following detailed work activities that fall within “Operating Vehicles or Equipment:”
1. Drive vehicles to transport individuals or equipment.
2. Travel to work sites to perform installation, repair or maintenance work.
3. Drive vehicles to transport patrons.
4. Drive trucks or truck-mounted equipment.
5. Drive trucks or other vehicles to or at work sites.
6. Drive passenger vehicles.
7. Operate vehicles or material-moving equipment.
Because in our study we focus on occupations that use roadway vehicles, we aim to exclude occupations that primarily operate off-road vehicles or worksite materials-moving vehicles. Therefore, we also impose the additional restriction that occupations with activities 4-7 are included in our analysis only if they are also identified by O*NET as using motor vehicles as a tool and if they spend more time in enclosed vehicles than in open vehicles. Moreover, for occupations with activity 7, which can involve operating equipment, as opposed to driving vehicles on roadways, we further require that the occupation has a high importance score for generalized activity of “Operating Vehicles or Equipment.” Finally, we include occupations with high importance scores for operating vehicles or equipment and
7 Depending on the topic, O*NET data is based on surveying samples of either occupational experts or a broad range of workers from each occupation. However, relatively small survey samples can sometimes lead to noisy or inconclusive results in identifying driving-related occupations. For more information, see https://www.O*NETonline.org/, https://www.O*NETcenter.org/overview.html. Furthermore, while O*NET’s “substantive scope and sampling are impressive…there are also significant gaps and duplication in content. Underlying constructs, item wording, and response options are often vague or overly complex” (Handel 2016). 8The O*NET questionnaire asks respondents to rate the importance of an activity on a scale of 1 to 5, where 1 is “not important,” 2 is “somewhat important,” 3 is “important,” 4 is “very important,” and 5 is “extremely important.” O*NET converts this scale to a standardized score that ranges between 0 and 100, which is averaged across respondents for each occupation. The standardized score is the ratio of the difference between the actual score and the lowest possible score to the largest possible difference. For example, a score of 3 is standardized to 100 x [3-1]/[5-1] = 50. Thus, an average score of 80 indicates that the average importance score of the selected activity was 4.2, or “very important” to the performance of the job.

The Employment Impact of Autonomous Vehicles
Office of the Chief Economist Economics and Statistics Administration Page 8
more time spent in enclosed vehicles even if they are not among the occupations for which O*NET provides data on the seven detailed worked activities listed above.
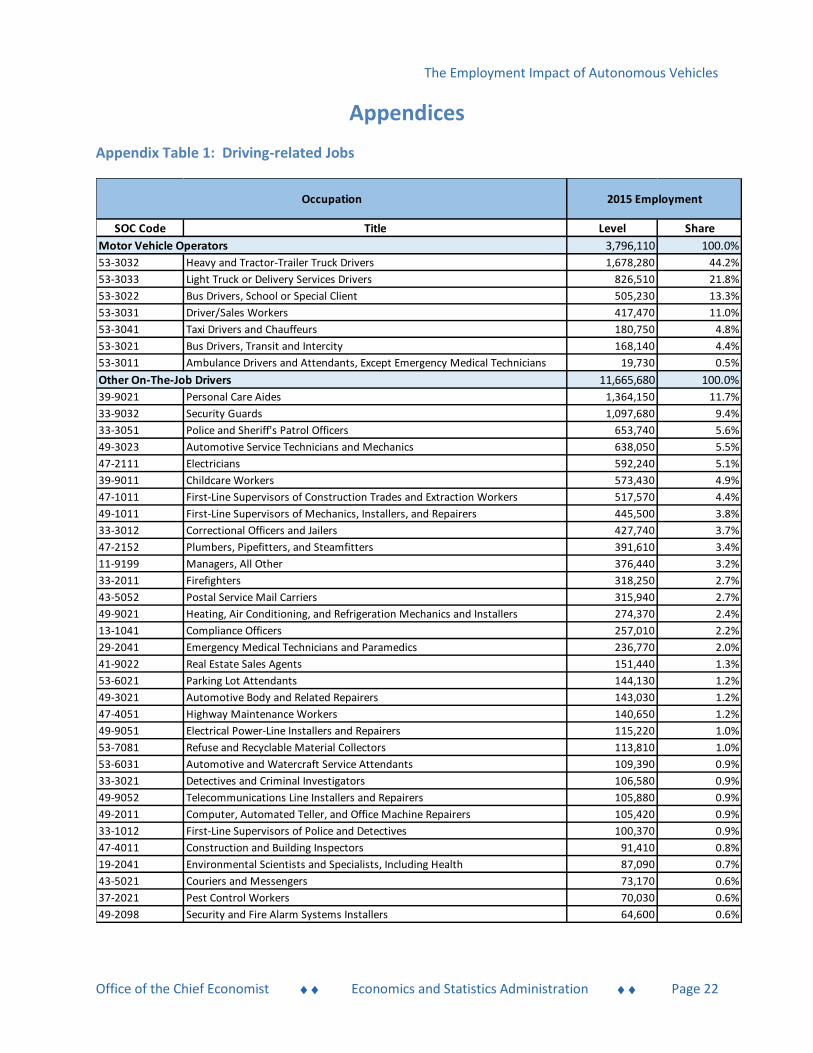
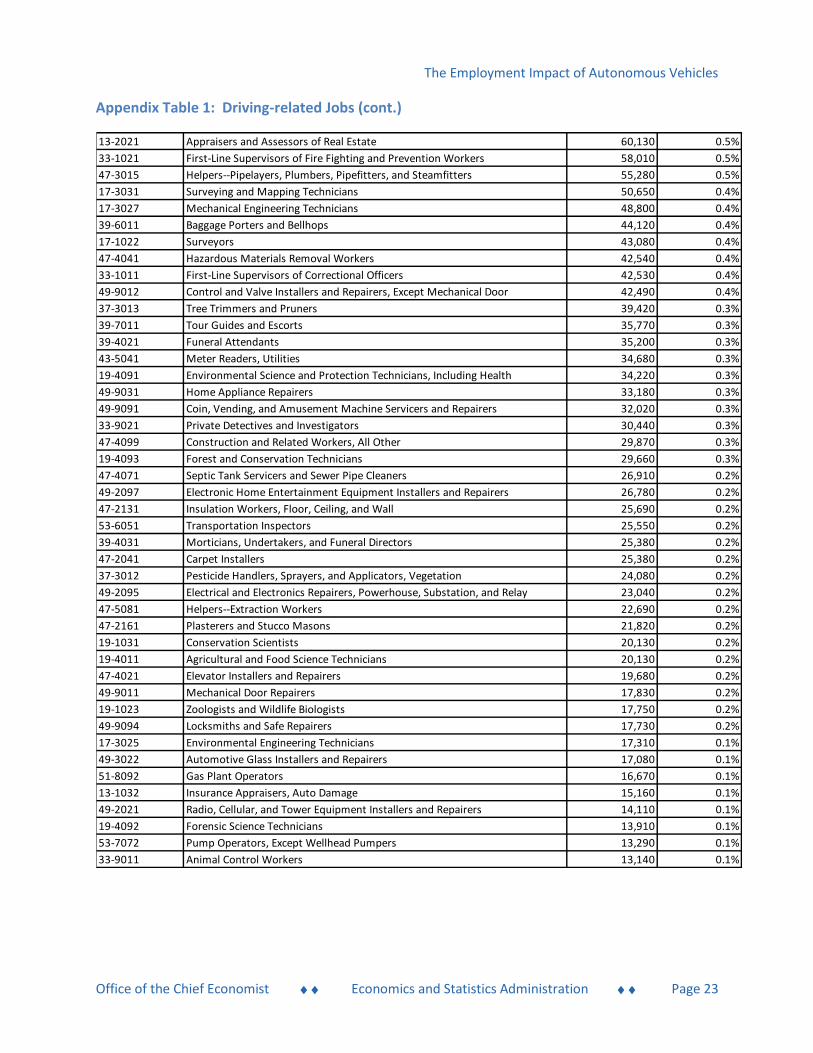
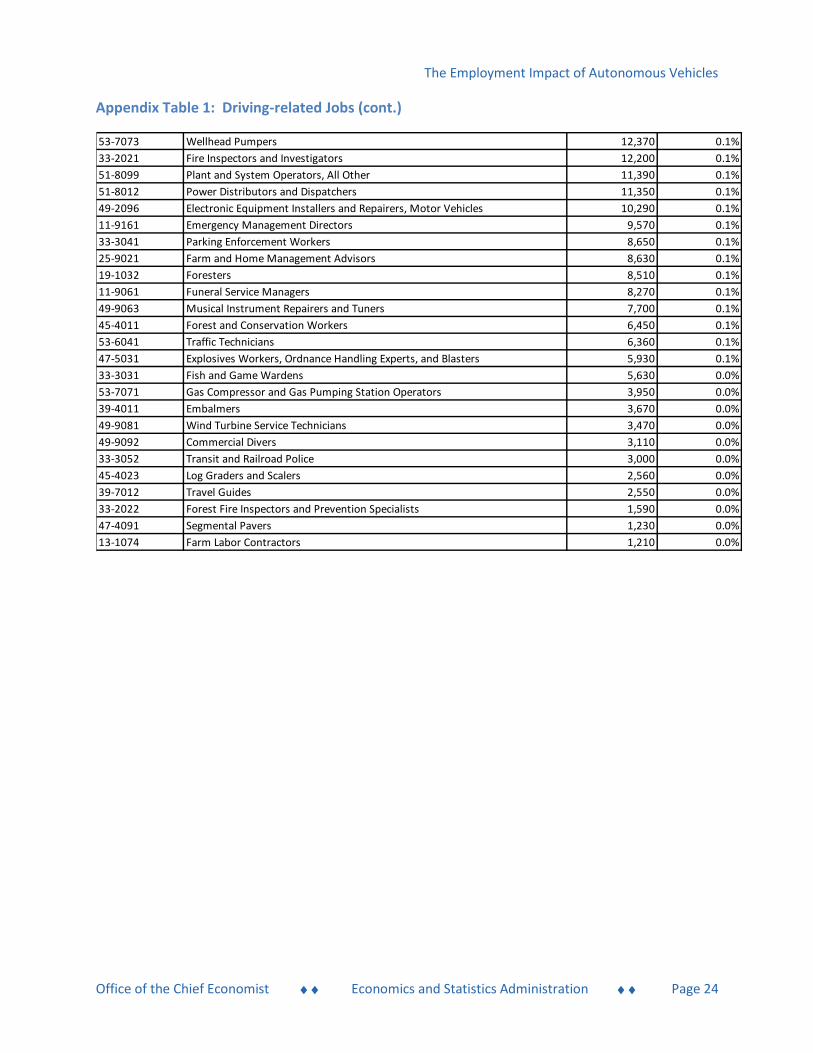
Using this methodology (see Figure 1), we identify 119 roadway vehicle driving occupations in the O*NET classification system, and we match these to 108 occupations in the 2010 Standard Occupational Classification (SOC). Appendix Table 1 shows the full list of 108 driving-related occupations and the number of workers employed in each occupation, as measured by the 2015 Occupational Employment Statistics (OES).9 While it is possible to generate a slightly different list of occupations by adjusting these selection criteria, the list of occupations provides a sensible estimate of jobs that involve driving, capturing a broader set of occupations than other studies (e.g. Miller 2015, which identified 89 driving-related occupations).
Our results are also broadly consistent with recent analysis by the Bureau of Labor Statistics of its new Occupational Requirements Survey (ORS) data. BLS published ORS data on driving requirements for 163 detailed (i.e., at the six-digit SOC level) occupations in 2016,10 finding that driving is “required” by some share of workers in 87 detailed occupations. However, estimates from the limited ORS sample suggest that about 30 percent of workers are required to drive on the job, which represents many more workers than shown in Appendix Table 1.11 Because ORS data on additional detailed occupations is not yet available, it is not possible to fully compare the results of these findings to ours (which use data on a larger number of detailed occupations and incorporate information about the “importance” of driving rather than whether any driving at all is “required”). Still, the initial ORS findings suggest that our results may represent a conservative estimate of the number of workers affected by business adoption of AVs.
We divide our list of 108 occupations into two categories to distinguish occupations that are primarily engaged in driving from other occupations for which driving is an important, though not a primary, activity in the delivery of goods and services:
9 The Bureau of Labor Statistics developed the SOC as a way for Federal statistical agencies to collect and disseminate data about workers by occupational category. O*NET uses an expanded version of the SOC called the “O*NET-SOC Taxonomy” that divides the 840 SOC occupations into 940 more detailed occupations. Thus, since we needed the relevant set of SOC-based occupations to do the rest of our analysis, and due to these differences between the O*NET’s classification and the SOC classification, our list of 119 O*Net occupations resulted in 108 occupations as classified by SOC. See https://www.bls.gov/soc/ for more details about the 2010 SOC and National Center for O*NET Development 2010 for more details on the O*NET-SOC Taxonomy. We included the entire SOC occupation if any of the O*NET-SOC Taxonomy occupations within the corresponding SOC occupation met the requirements described above. Note that we did not include SOC occupation 53-3099, “Motor Vehicle Operators, All Other” in our vehicle operator category because O*NET does not include the “all other” occupations listed in the SOC. To identify total employment and employment by industry, we used occupational employment data from the 2015 Occupational Employment Survey of the Bureau of Labor Statistics (see https://www.bls.gov/oes/ for more details), which included data on 813 occupations out of 840 occupations in the 2010 SOC. 10 BLS is phasing in collection of ORS data and by 2018 will publish data on driving requirements for a larger set of detailed occupations. 11Bureau of Labor Statistics, U.S. Department of Labor, The Economics Daily, “30 percent of civilian jobs require some driving in 2016” https://www.bls.gov/opub/ted/2017/30-percent-of-civilian-jobs-require-some-driving-in-2016.htm

The Employment Impact of Autonomous Vehicles
Office of the Chief Economist Economics and Statistics Administration Page 9
Motor Vehicle Operators, consisting of seven occupations within the 53-3000 “Motor Vehicle Operator” SOC group, including drivers of automobiles, trucks, buses, trains, and ambulances, and driver/salespersons (e.g., pizza deliverers).
Other on-the-Job Drivers, which captures the remaining occupations that meet the other criteria described above. These include occupations that deliver services at multiple locations, such as first responders, home health care aides, real estate agents, and equipment installers and repairers.
Figure 1. Driving-related Occupations
As shown in Figure 2, in 2015, there were 15.5 million jobs (11.3 percent of total occupational employment, or about one in nine workers) in driving-related occupations. There are about three times as many other on-the-job drivers as motor vehicle operators, suggesting that the impacts of AVs could extend well beyond the narrow group of workers whose occupation title includes “drivers.”
Initial analysis of employment in driving-related occupations by industry shows that, not surprisingly, vehicle operator jobs are most concentrated in the transportation and warehousing (“transport”) sector, while other on-the-job driving occupations are spread throughout industries, led by government, health care, construction, and administrative and waste management (see Figure 3).

The Employment Impact of Autonomous Vehicles
Office of the Chief Economist Economics and Statistics Administration Page 10
Figure 2. Employment in Driving-related Occupations
Note: Percentages are share of total occupational employment. Source: Bureau of Labor Statistics, Occupational Employment Statistics, 2015.
Figure 3. Driving-related Jobs by Industry
Source:
Bureau of Labor Statistics, Occupational Employment Statistics, 2015.
Motor Vehicle Operators
3.796 million(2.8%)
Other On-the-Job Drivers
11.666 million(8.5%)
All Others
121.544 million (88.7%)
0 20 40 60 80 100 120
Millions of Jobs
0
500
1000
1500
2000
2500
3000
Thou
sand
s of
Job
s Motor Vehicle OperatorsOther On-The-Job Drivers

The Employment Impact of Autonomous Vehicles
Office of the Chief Economist Economics and Statistics Administration Page 11
Work Output of Driving Occupations
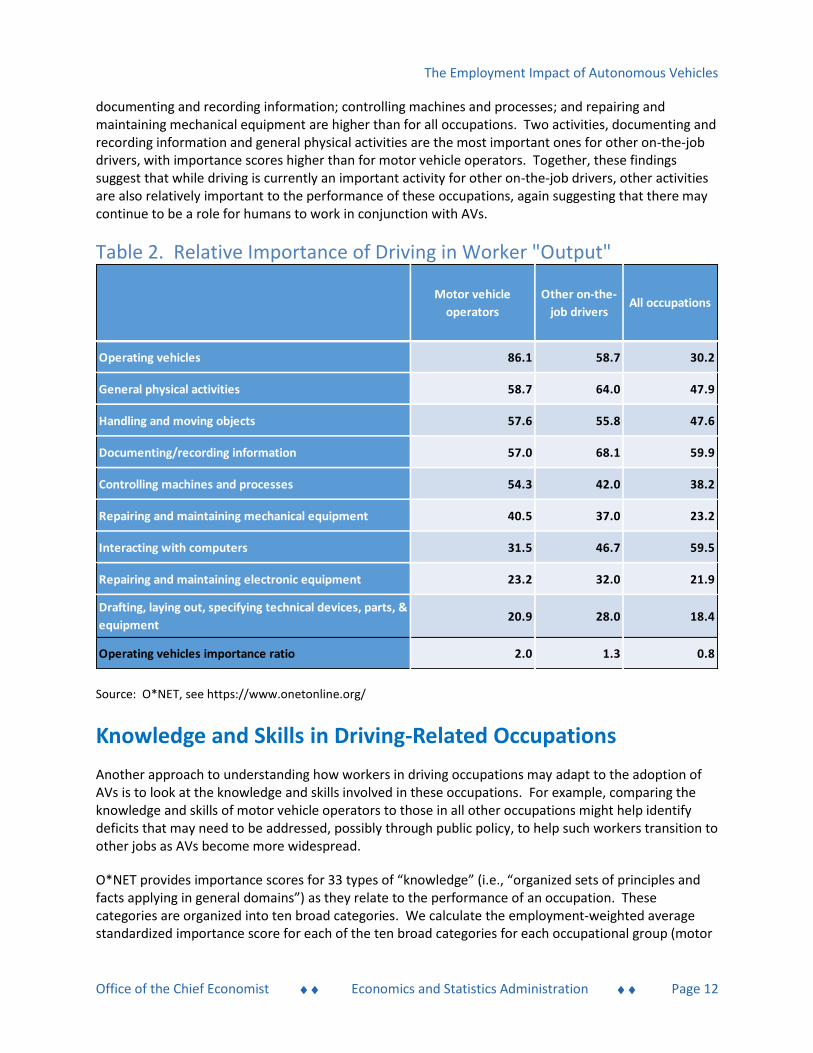
When considering the potential impact of AVs on driving-related occupations, it is important to recognize that such occupations can involve activities other than operating motor vehicles. If those in driving-related occupations performed no work other than operating motor vehicles, then the AVs would be more likely to displace those workers as pure substitutes. Therefore, to examine the extent to which driving-related occupations involve work aside from operating vehicles, we consider the importance scores of the nine categories of activities included in “worker output” as classified by O*NET,12 one of which is “operating vehicles and equipment.”13 Table 2 shows the average standardized “importance” score of each category of output within each occupational group, weighted by employment in each occupation.14
Motor Vehicle Operators
For motor vehicle operators, the average importance score for operating vehicles is 86.1, much higher than the importance of other activities. While “handling and moving objects” and “performing general physical activities” are also relatively more important for motor vehicle operators than across all occupations, so are other activities that presumably require a relatively higher skill level, such as “controlling machines and processes” (other than vehicle operation) and “repair and maintenance of mechanical equipment.” Thus, while the introduction of AVs could diminish the most important work output activity of motor vehicle operators, these workers engage in other activities that are relatively important in the performance of their occupation and that may continue to be performed by some humans in conjunction with AV use.
Other On-The-Job Drivers
For other on-the-job drivers, the importance of operating vehicles, at 58.7, is much lower than for motor vehicle operators but is still considerably greater than for all occupations. As is the case for motor vehicle operators, the importance of general physical activities; handling and moving objects;
12 Although these activities could be considered dimensions of labor’s input into the production process, O*NET refers to them as work output. In O*NET terminology, “Work Output” is defined as “What physical activities are performed, what equipment and vehicles are operated/controlled, and what complex/technical activities are accomplished as job outputs?” (See https://www.O*NETonline.org/find/descriptor/browse/Work_Activities/.) 13 These output measures are listed and defined in detail in Appendix Table 2. 14 As a check on our classification strategy, for each occupational group that we identified, we also calculate an “importance ratio” as the importance score for operating vehicles relative to the average importance score for all other types of worker output. For motor vehicle operators, the average importance score for operating vehicles is 86.1, while the average importance score for all other output categories is 43.0, yielding a ratio of 2.0. Thus, the introduction of autonomous vehicles could diminish what is by far the most important activity of motor vehicle operators. For other on-the-job drivers, the importance of operating vehicles, at 58.7, is closer to the average importance of all other work activities, 46.7, yielding a ratio of 1.3. Given the heterogeneity of these two groups of driver occupations, some activities may be more important in some industries. Appendix Figure 1 shows that the relative importance of driving for motor vehicle drivers varies depending on the industry, ranging from 2.9 in educational services to 1.8 in several other industries. Similarly, the importance of driving for other on-the-job drivers range from 2.0 in the transportation sector (on par with vehicle operators in that sector) to 1.0 in management and in professional services.
The Employment Impact of Autonomous Vehicles
Office of the Chief Economist Economics and Statistics Administration Page 12
documenting and recording information; controlling machines and processes; and repairing and maintaining mechanical equipment are higher than for all occupations. Two activities, documenting and recording information and general physical activities are the most important ones for other on-the-job drivers, with importance scores higher than for motor vehicle operators. Together, these findings suggest that while driving is currently an important activity for other on-the-job drivers, other activities are also relatively important to the performance of these occupations, again suggesting that there may continue to be a role for humans to work in conjunction with AVs.
Table 2. Relative Importance of Driving in Worker "Output"
Source: O*NET, see https://www.onetonline.org/
Knowledge and Skills in Driving-Related Occupations
Another approach to understanding how workers in driving occupations may adapt to the adoption of AVs is to look at the knowledge and skills involved in these occupations. For example, comparing the knowledge and skills of motor vehicle operators to those in all other occupations might help identify deficits that may need to be addressed, possibly through public policy, to help such workers transition to other jobs as AVs become more widespread.
O*NET provides importance scores for 33 types of “knowledge” (i.e., “organized sets of principles and facts applying in general domains”) as they relate to the performance of an occupation. These categories are organized into ten broad categories. We calculate the employment-weighted average standardized importance score for each of the ten broad categories for each occupational group (motor
Operating vehicles 86.1 58.7 30.2
General physical activities 58.7 64.0 47.9
Handling and moving objects 57.6 55.8 47.6
Documenting/recording information 57.0 68.1 59.9
Controlling machines and processes 54.3 42.0 38.2
Repairing and maintaining mechanical equipment 40.5 37.0 23.2
Interacting with computers 31.5 46.7 59.5
Repairing and maintaining electronic equipment 23.2 32.0 21.9
Drafting, laying out, specifying technical devices, parts, &
equipment20.9 28.0 18.4
Operating vehicles importance ratio 2.0 1.3 0.8
Motor vehicle
operatorsAll occupations
Other on-the-
job drivers

The Employment Impact of Autonomous Vehicles
Office of the Chief Economist Economics and Statistics Administration Page 13
vehicle drivers, other on-the-job drivers, and all occupations.) As shown in Figure 4,15 knowledge of transportation (“knowledge of principles and methods for moving people or goods by air, rail, sea, or road, including the relative costs and benefits”) is clearly the most important category of knowledge for motor vehicle operators, followed by law and public safety. The scores for these two categories are higher than for all other occupations, but for all other categories of knowledge these scores are similar to or lower than those of all occupations. For other on-the-job drivers, transportation and law and public safety are also the most important knowledge categories, though the importance of knowledge of transportation is quite a bit lower for this category of workers than it is for motor vehicle operators.
Figure 4: Importance Scores: Knowledge
Source: Author calculations of average importance scores by occupation, using O*NET data on Knowledge required for each occupation, weighted by employment for each occupation, using Occupational Employment Statistics, 2015.
O*NET also provides importance scores for 25 “cross-functional skills”, i.e., “developed capacities that facilitate performance of activities that occur across jobs,” organized into six broad categories. We calculate the employment-weighted average importance score for each of the broad skills categories for each occupational group.16 As Figure 5 shows, although the average importance scores for each skill
15 The O*NET knowledge categories and subcategories are listed in Appendix Table 3. To obtain the average importance scores for the ten knowledge categories that we report in Figure 5, we calculate the average score for the knowledge types within each broad knowledge category, and then take an OES-employment-weighted average of each category score across all occupations within each of our three occupational groups, 16 The O*NET cross-functional skill categories and subcategories are listed in Appendix Table 4. To obtain the average importance scores for the seven skills categories that we report in Figure 6, we calculate the average score for the skills within each broad skills category, and then take an OES-employment-weighted average of each category score across all occupations within each of our three occupational groups,
18.8
22.0
21.9
25.4
24.2
28.6
44.0
39.5
36.9
26.6
21.7
19.5
22.0
34.7
28.3
32.4
49.5
39.8
52.0
39.2
11.2
15.7
16.7
19.3
21.0
28.2
36.3
37.1
50.3
72.4
0 10 20 30 40 50 60 70 80
Health Services
Manufacturing andProduction
Arts and Humanities
Engineering andTechnology
Math and Science
Communications
Education andTraining
Business andManagement
Law and Public Safety
Transportation
Motor Vehicle Operators
Other On The Job Drivers
All Occupations

The Employment Impact of Autonomous Vehicles
Office of the Chief Economist Economics and Statistics Administration Page 14
category are different for each occupational group, the ranking of these skills in terms of importance is consistent across motor vehicle operators, other on-the-job drivers, and all occupations. Still, except for technical skills, which relate to operation of machines or technological systems, motor vehicle operators have lower importance scores for all cross-functional skill categories compared to both other on-the-job drivers and to all occupations. Other on-the-job drivers more closely resemble overall occupations in terms of the importance of cross functional skills, although on-the-job drivers also show a higher importance for technical skills relative to all occupations.
The findings of this section show that motor vehicle operators have higher knowledge importance scores for only a couple of categories compared to all occupations, and except for technical skills, substantially lower cross-functional skill importance scores than all occupations. In contrast, other-on-the-job drivers have higher knowledge and skills importance scores in many categories compared with motor vehicle operators. These findings suggest that motor vehicle operators may have less of a knowledge and skills base that could be transferable to other jobs, while other on-the-job drivers are likely to be more adaptable since they are more similar to all occupations in terms of knowledge and skills and less specialized in transportation knowledge than motor vehicle operators.
Figure 5. Importance Scores: Cross Functional Skills
Source: Author calculations of average importance scores by occupation, using O*NET data on Cross Functional Skills
required for each occupation, weighted by employment for each occupation, using Occupational Employment Statistics,
2015.

The Employment Impact of Autonomous Vehicles
Office of the Chief Economist Economics and Statistics Administration Page 15
Driving-Related Injuries and Fatalities
We also analyzed data from the Census of Fatal Occupational Injuries and the Survey of Occupational Injuries and Illnesses to present information on the risks involved in using roadway vehicles for driving-related occupations and across all occupations. Table 3 shows that the fatality rate (per 100,000 full-time equivalent workers) for motor vehicle operators from on-the-job roadway incidents involving motor vehicles is ten times the rate for all workers, and the numbers of roadway motor vehicle occupational injuries resulting in lost work time per 100,000 full-time equivalent workers is 8.7 times as large as that of all workers.
Given that driving-related fatalities and injuries are notably higher for motor vehicles operators than for other on-the-job drivers, which in turn show higher fatality and injury rates than the overall average, these data help validate our occupational classification (i.e., the more driving done on the job, the greater the risk of fatalities and injuries) and also point to the potential safety benefits of AVs.
Table 3. On-the-job Injuries and Fatalities Involving Roadway Vehicles
Note: Rates are per 100,000 FTEs Source: Authors’ calculations, and 2011-2015 Census of Fatal Occupational Injuries and 2011-2015 Survey of Occupational Injuries and Illnesses.
Demographic Characteristics of Workers in Driving-Related Occupations
We use data from the Occupational Employment Statistics survey, American Community Survey, and Current Population Survey Annual Social and Economic Supplement to understand better the economic and demographic characteristics for workers in both categories of driving-related occupations, as well as across all occupations. Comparing the characteristics of each occupational group helps to paint a profile
Motor vehicle
operators
Other on-the-job
drivers
All
occupations
Risk of driving fatalities 16.1 2.2 1.6
Risk of driving injuries 479.5 125.5 55.5

The Employment Impact of Autonomous Vehicles
Office of the Chief Economist Economics and Statistics Administration Page 16
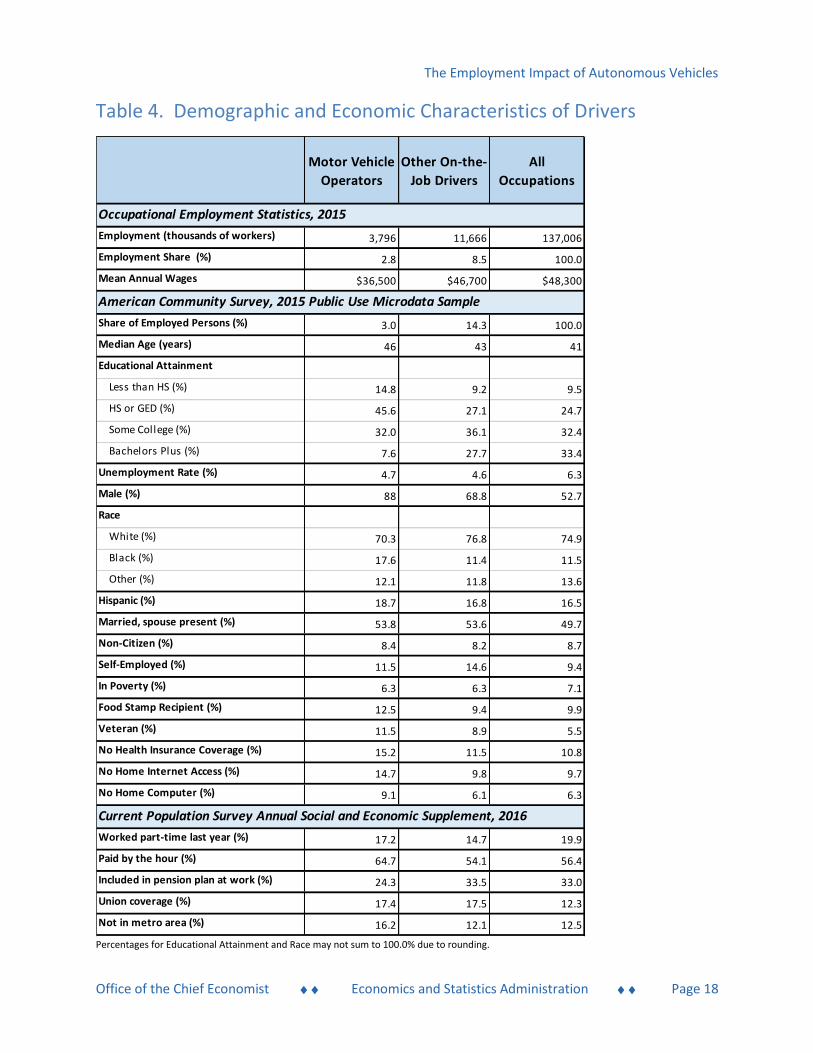
of workers that could be most affected by the business adoption of AVs. Table 4 summarizes the data on worker characteristics, which are discussed below. 17
Motor Vehicle Operators
In 2015, the 3.8 million motor vehicle operators accounted for a little less than three percent of workers across all occupations. Workers in vehicle operator occupations are compensated less than the overall workforce; the mean annual wage of motor vehicle operators was about $36,500, about 25 percent lower than the mean wage of $48,300 for all occupations. In addition:
A particularly striking observation was that motor vehicle operators are predominately male (88.0 percent, compared to about 52.7 percent of workers overall).
Only 7.6 percent of motor vehicle operators had a bachelor’s degree or higher.
45.6 percent of motor vehicle operators had only a high school diploma, compared to 24.7 percent of workers overall.
Motor vehicle operators also were:
less likely to be covered by employer-sponsored health plans. About 15.2 percent were without coverage compared to about 10.8 percent for all workers.
less likely to have pension plans. Only about one in four were covered compared to about one-third of all workers.
more likely to be paid by the hour, less likely to live in a metropolitan area, and more likely to be self-employed.
However, there was a considerable amount of heterogeneity in the characteristics of motor vehicle operators across the occupations that make up this category. For example, taxi drivers on average earn much less than other motor vehicle operators (about $26,000, compared to $33,000 for bus drivers
17 The American Community Survey (ACS) and Current Population Survey (CPS) data is based on the Census Bureau’s occupational classification, which is less detailed than the 2010 Standard Occupational Classification (SOC) system on which the SOC-O*NET taxonomy is based. In other words, some Census occupation codes are comprised of multiple SOC codes. This is less of a problem for motor vehicle operators because the four Census occupation codes for this group of workers comprises the seven SOC codes for motor vehicle operators (the two SOC bus driver codes and the three SOC truck driver codes were each combined into one Census occupation code for all bus drivers and one for all truck drivers). However, some of the SOC codes for other on-the-job drivers are combined with other non-driving SOC codes in the Census occupation classifications. To deal with this in the ACS and CPS data, if workers had a Census occupation code that is comprised of at least one of the SOC codes we identified them as other on-the-job drivers. Therefore, the percent of workers identified in the ACS data as being other on-the-job drivers is higher (14.3 percent) than that based on the OES data (8.5 percent). As a sensitivity check, we used OES employment data to weight the estimates based on the share of employment in driving-related occupations within each Census occupation code. The results were essentially the same as those shown in Table 4 and Appendix Table 5.

The Employment Impact of Autonomous Vehicles
Office of the Chief Economist Economics and Statistics Administration Page 17
and $38,000 for truck drivers). Bus drivers tend to be older, and less educated than other motor vehicle drivers, but they are much more likely to be unionized and female. See Appendix Table 5 for details.
There is even heterogeneity among bus drivers, with transit and intercity drivers earning on average about one-third more than school bus or other bus drivers, and among truck drivers, with heavy/tractor-trailer drivers earning $42,500 on average while driver/sales workers (including food delivery workers) earn much less, about $28,000. See Appendix Table 6 for details.
The Employment Impact of Autonomous Vehicles
Office of the Chief Economist Economics and Statistics Administration Page 18
Table 4. Demographic and Economic Characteristics of Drivers
Percentages for Educational Attainment and Race may not sum to 100.0% due to rounding.
Motor Vehicle
Operators
Other On-the-
Job Drivers
All
Occupations
Employment (thousands of workers) 3,796 11,666 137,006
Employment Share (%) 2.8 8.5 100.0
Mean Annual Wages $36,500 $46,700 $48,300
Share of Employed Persons (%) 3.0 14.3 100.0
Median Age (years) 46 43 41
Educational Attainment
Less than HS (%) 14.8 9.2 9.5
HS or GED (%) 45.6 27.1 24.7
Some College (%) 32.0 36.1 32.4
Bachelors Plus (%) 7.6 27.7 33.4
Unemployment Rate (%) 4.7 4.6 6.3
Male (%) 88 68.8 52.7
Race
White (%) 70.3 76.8 74.9
Black (%) 17.6 11.4 11.5
Other (%) 12.1 11.8 13.6
Hispanic (%) 18.7 16.8 16.5
Married, spouse present (%) 53.8 53.6 49.7
Non-Citizen (%) 8.4 8.2 8.7
Self-Employed (%) 11.5 14.6 9.4
In Poverty (%) 6.3 6.3 7.1
Food Stamp Recipient (%) 12.5 9.4 9.9
Veteran (%) 11.5 8.9 5.5
No Health Insurance Coverage (%) 15.2 11.5 10.8
No Home Internet Access (%) 14.7 9.8 9.7
No Home Computer (%) 9.1 6.1 6.3
Worked part-time last year (%) 17.2 14.7 19.9
Paid by the hour (%) 64.7 54.1 56.4
Included in pension plan at work (%) 24.3 33.5 33.0
Union coverage (%) 17.4 17.5 12.3
Not in metro area (%) 16.2 12.1 12.5
Occupational Employment Statistics, 2015
American Community Survey, 2015 Public Use Microdata Sample
Current Population Survey Annual Social and Economic Supplement, 2016

The Employment Impact of Autonomous Vehicles
Office of the Chief Economist Economics and Statistics Administration Page 19
Other On-The-Job Drivers
In 2015 there were 11.7 million other on-the-job drivers, representing 8.5 percent of workers in all occupations. On average, these workers earned slightly less than workers across all occupations ($46,700 compared to $48,300). These other on-the-job drivers are also slightly older, with a median age of 43 years compared to a median of 41 years across all workers.
In addition, other on-the-job drivers are:
much more likely than motor vehicle operators to have a college degree (27.7 percent versus 7.6 percent) though less likely than all workers to have a college degree (33.4 percent).
much more likely to be veterans compared to workers overall, but less likely compared to motor vehicle operators (8.9 percent of other on-the-job drivers are veterans, compared to 5.5 percent of all workers and 11.5 percent of motor vehicle operators).
male dominated, though less so than for motor vehicle drivers; about 68.8 percent of the workers in the on-the-job driver occupations are male. This is compared to about 52.7 percent of workers overall being male.
Conclusion
Although AV technology has developed rapidly in recent years, the consensus is that widespread adoption of vehicles that are “fully” automated is likely to take several more years. When this occurs, AVs may be increasingly adopted by businesses that currently use motor vehicles and human drivers as part of their production process. This paper uses the available data on the activities of various occupations to explore which ones are most related to driving and which, therefore, are more likely to be affected by the future use of AVs by businesses. This analysis provides not only a baseline indication of the activities of those jobs but also the characteristics of the workers who do them, and shows that the adoption of AVs has the potential to impact a sizable share of jobs in the economy. The extent to which AVs could eliminate certain occupations, resulting in job loss, while changing the mix of tasks involved in other occupations, is still not clear.
Nevertheless, several important findings of this report may help inform regarding the labor market impacts of the business adoption of AVs. First, our findings suggest that workers in some driving occupations might have difficulty finding alternative employment. Workers in motor vehicle operator jobs are older, less educated, and for the most part have fewer transferable skills than other workers, especially the kinds of skills required for non-routine cognitive tasks.
Second, in contrast to the workers in the occupations we classify as motor vehicle operators, other on-the-job drivers, of which there are about triple the number of motor vehicle operators, have a more diversified set of work activities, knowledge, and skills. For this group, although driving is an important work activity, it is only one of many important work activities, many of which already require the kinds
The Employment Impact of Autonomous Vehicles
Office of the Chief Economist Economics and Statistics Administration Page 20
of non-routine cognitive skills that are becoming increasingly in demand in our economy. Such workers are likely to be able to adapt to the widespread adoption of AVs.
As AVs are adopted by businesses, continued tracking of the number of motor vehicle operators and other driving-related jobs, as well as tracking of the work activities, skills and knowledge required in these occupations, will help indicate the extent to which AV technology will serve to substitute for labor by eliminating particular jobs or to complement labor by changing the importance of other work activities performed by those workers.
References
Autor, D.H. (2015). Why Are There Still So Many Jobs? The History and Future of Workplace Automation. Journal of Economic Perspectives, 29(3), 3-30.
Autor, D., Levy, F., & Murnane, R.J. (2003). The Skill Content of Recent Technical Change: An Empirical
Investigation. Quarterly Journal of Economics, 118(4), 1279-1334. Bessen, J. (2015). Toil and Technology. International Monetary Fund Finance and Development, 52(1),
16-19. Bureau of Labor Statistics, U.S. Department of Labor, The Economics Daily, 30 percent of civilian jobs
require some driving in 2016 (https://www.bls.gov/opub/ted/2017/30-percent-of-civilian-jobs-require-some-driving-in-2016.htm)
Clements, L. and Kockelman, K. (2017). Economic Effects of Automated Vehicles. Transportation
Research Board Annual Meeting, January 2017 and forthcoming in Transportation Research Record. (http://www.caee.utexas.edu/prof/kockelman/public_html/TRB17EconomicEffectsofAVs.pdf)
Financial Accounting Standards Board (2016). FASB In Focus. “Accounting Standards Update No. 2016-02, Leases (Topic 842).” (http://tinyurl.com/ydgw8fbx.)
Frey, C.B. & Osborne, M.A. (2017). The Future of Employment: How Susceptible Are Jobs to Computerisation? Technological Forecasting and Social Change, 114, 254-280.
General Motors Financial Company, Inc. (2017). Form 10-K, dated February 7, 2017. (http://tinyurl.com/y735ljdr.)
Handel, Michael J. (2016). “The O*NET Content Model: Strengths and Limitations. Journal of Labour
Market Research, 49:157–176. Heineke, Kersten, Philipp Kampshoff, Armen Mkrtchyan, and Emily Shao. “Self-Driving Car Technology:
When will the Robots Hit the Road?” May 2017.
The Employment Impact of Autonomous Vehicles
Office of the Chief Economist Economics and Statistics Administration Page 21
(http://www.mckinsey.com/industries/automotive-and-assembly/our-insights/self-driving-car-technology-when-will-the-robots-hit-the-road).
Levy, F. & Murnane, R.J. (2013). Dancing with Robots: Human Skills for Computerized Work. Washington,
DC: Third Way Foundation.
McKinsey Global Institute (2017). A Future That Works: Automation, Employment, and Productivity.
Miller, J. (2015) Autonomous Vehicles: Implications for Employment Demand. The Bridge, 45(3), 5-11.
National Center for O*NET Development. (2010). Updating the O*NET®-SOC Taxonomy: Incorporating the 2010 SOC Structure. Summary and Implementation. (https://www.onetcenter.org/dl_files/Taxonomy2010_Summary.pdf.)
National Highway Traffic Safety Administration (2016). Federal Automated Vehicles Policy: A Voluntary Approach to Accelerating the Next Revolution in Roadway Safety. (https://icsw.nhtsa.gov/nhtsa/av/).
SAE International (2014). “Automated Driving: Levels of Driving Automation are Defined in New SAE International Standard J3016. (https://www.sae.org/misc/pdfs/automated_driving.pdf).
Acknowledgments
The authors would like to thank, from the Economics and Statistics Administration, U.S. Department of Commerce: Ellen Hughes-Cromwick, former Chief Economist; Rob Rubinovitz, Deputy Chief Economist; Sabrina Montes, Section Chief. The authors would also like to thank Jon D. Samuels of the Bureau of Economic Analysis and participants of the 2017 Society of Government Economists annual conference and the 2017 Industry Studies Association annual conference for helpful comments. Any errors in the report are solely the authors’ responsibility.
The Employment Impact of Autonomous Vehicles
Office of the Chief Economist Economics and Statistics Administration Page 22
Appendices
Appendix Table 1: Driving-related Jobs
SOC Code Title Level Share
3,796,110 100.0%
53-3032 Heavy and Tractor-Trailer Truck Drivers 1,678,280 44.2%
53-3033 Light Truck or Delivery Services Drivers 826,510 21.8%
53-3022 Bus Drivers, School or Special Client 505,230 13.3%
53-3031 Driver/Sales Workers 417,470 11.0%
53-3041 Taxi Drivers and Chauffeurs 180,750 4.8%
53-3021 Bus Drivers, Transit and Intercity 168,140 4.4%
53-3011 Ambulance Drivers and Attendants, Except Emergency Medical Technicians 19,730 0.5%
11,665,680 100.0%
39-9021 Personal Care Aides 1,364,150 11.7%
33-9032 Security Guards 1,097,680 9.4%
33-3051 Police and Sheriff's Patrol Officers 653,740 5.6%
49-3023 Automotive Service Technicians and Mechanics 638,050 5.5%
47-2111 Electricians 592,240 5.1%
39-9011 Childcare Workers 573,430 4.9%
47-1011 First-Line Supervisors of Construction Trades and Extraction Workers 517,570 4.4%
49-1011 First-Line Supervisors of Mechanics, Installers, and Repairers 445,500 3.8%
33-3012 Correctional Officers and Jailers 427,740 3.7%
47-2152 Plumbers, Pipefitters, and Steamfitters 391,610 3.4%
11-9199 Managers, All Other 376,440 3.2%
33-2011 Firefighters 318,250 2.7%
43-5052 Postal Service Mail Carriers 315,940 2.7%
49-9021 Heating, Air Conditioning, and Refrigeration Mechanics and Installers 274,370 2.4%
13-1041 Compliance Officers 257,010 2.2%
29-2041 Emergency Medical Technicians and Paramedics 236,770 2.0%
41-9022 Real Estate Sales Agents 151,440 1.3%
53-6021 Parking Lot Attendants 144,130 1.2%
49-3021 Automotive Body and Related Repairers 143,030 1.2%
47-4051 Highway Maintenance Workers 140,650 1.2%
49-9051 Electrical Power-Line Installers and Repairers 115,220 1.0%
53-7081 Refuse and Recyclable Material Collectors 113,810 1.0%
53-6031 Automotive and Watercraft Service Attendants 109,390 0.9%
33-3021 Detectives and Criminal Investigators 106,580 0.9%
49-9052 Telecommunications Line Installers and Repairers 105,880 0.9%
49-2011 Computer, Automated Teller, and Office Machine Repairers 105,420 0.9%
33-1012 First-Line Supervisors of Police and Detectives 100,370 0.9%
47-4011 Construction and Building Inspectors 91,410 0.8%
19-2041 Environmental Scientists and Specialists, Including Health 87,090 0.7%
43-5021 Couriers and Messengers 73,170 0.6%
37-2021 Pest Control Workers 70,030 0.6%
49-2098 Security and Fire Alarm Systems Installers 64,600 0.6%
Occupation 2015 Employment
Motor Vehicle Operators
Other On-The-Job Drivers
The Employment Impact of Autonomous Vehicles
Office of the Chief Economist Economics and Statistics Administration Page 23
Appendix Table 1: Driving-related Jobs (cont.)
13-2021 Appraisers and Assessors of Real Estate 60,130 0.5%
33-1021 First-Line Supervisors of Fire Fighting and Prevention Workers 58,010 0.5%
47-3015 Helpers--Pipelayers, Plumbers, Pipefitters, and Steamfitters 55,280 0.5%
17-3031 Surveying and Mapping Technicians 50,650 0.4%
17-3027 Mechanical Engineering Technicians 48,800 0.4%
39-6011 Baggage Porters and Bellhops 44,120 0.4%
17-1022 Surveyors 43,080 0.4%
47-4041 Hazardous Materials Removal Workers 42,540 0.4%
33-1011 First-Line Supervisors of Correctional Officers 42,530 0.4%
49-9012 Control and Valve Installers and Repairers, Except Mechanical Door 42,490 0.4%
37-3013 Tree Trimmers and Pruners 39,420 0.3%
39-7011 Tour Guides and Escorts 35,770 0.3%
39-4021 Funeral Attendants 35,200 0.3%
43-5041 Meter Readers, Utilities 34,680 0.3%
19-4091 Environmental Science and Protection Technicians, Including Health 34,220 0.3%
49-9031 Home Appliance Repairers 33,180 0.3%
49-9091 Coin, Vending, and Amusement Machine Servicers and Repairers 32,020 0.3%
33-9021 Private Detectives and Investigators 30,440 0.3%
47-4099 Construction and Related Workers, All Other 29,870 0.3%
19-4093 Forest and Conservation Technicians 29,660 0.3%
47-4071 Septic Tank Servicers and Sewer Pipe Cleaners 26,910 0.2%
49-2097 Electronic Home Entertainment Equipment Installers and Repairers 26,780 0.2%
47-2131 Insulation Workers, Floor, Ceiling, and Wall 25,690 0.2%
53-6051 Transportation Inspectors 25,550 0.2%
39-4031 Morticians, Undertakers, and Funeral Directors 25,380 0.2%
47-2041 Carpet Installers 25,380 0.2%
37-3012 Pesticide Handlers, Sprayers, and Applicators, Vegetation 24,080 0.2%
49-2095 Electrical and Electronics Repairers, Powerhouse, Substation, and Relay 23,040 0.2%
47-5081 Helpers--Extraction Workers 22,690 0.2%
47-2161 Plasterers and Stucco Masons 21,820 0.2%
19-1031 Conservation Scientists 20,130 0.2%
19-4011 Agricultural and Food Science Technicians 20,130 0.2%
47-4021 Elevator Installers and Repairers 19,680 0.2%
49-9011 Mechanical Door Repairers 17,830 0.2%
19-1023 Zoologists and Wildlife Biologists 17,750 0.2%
49-9094 Locksmiths and Safe Repairers 17,730 0.2%
17-3025 Environmental Engineering Technicians 17,310 0.1%
49-3022 Automotive Glass Installers and Repairers 17,080 0.1%
51-8092 Gas Plant Operators 16,670 0.1%
13-1032 Insurance Appraisers, Auto Damage 15,160 0.1%
49-2021 Radio, Cellular, and Tower Equipment Installers and Repairers 14,110 0.1%
19-4092 Forensic Science Technicians 13,910 0.1%
53-7072 Pump Operators, Except Wellhead Pumpers 13,290 0.1%
33-9011 Animal Control Workers 13,140 0.1%
The Employment Impact of Autonomous Vehicles
Office of the Chief Economist Economics and Statistics Administration Page 24
Appendix Table 1: Driving-related Jobs (cont.)
53-7073 Wellhead Pumpers 12,370 0.1%
33-2021 Fire Inspectors and Investigators 12,200 0.1%
51-8099 Plant and System Operators, All Other 11,390 0.1%
51-8012 Power Distributors and Dispatchers 11,350 0.1%
49-2096 Electronic Equipment Installers and Repairers, Motor Vehicles 10,290 0.1%
11-9161 Emergency Management Directors 9,570 0.1%
33-3041 Parking Enforcement Workers 8,650 0.1%
25-9021 Farm and Home Management Advisors 8,630 0.1%
19-1032 Foresters 8,510 0.1%
11-9061 Funeral Service Managers 8,270 0.1%
49-9063 Musical Instrument Repairers and Tuners 7,700 0.1%
45-4011 Forest and Conservation Workers 6,450 0.1%
53-6041 Traffic Technicians 6,360 0.1%
47-5031 Explosives Workers, Ordnance Handling Experts, and Blasters 5,930 0.1%
33-3031 Fish and Game Wardens 5,630 0.0%
53-7071 Gas Compressor and Gas Pumping Station Operators 3,950 0.0%
39-4011 Embalmers 3,670 0.0%
49-9081 Wind Turbine Service Technicians 3,470 0.0%
49-9092 Commercial Divers 3,110 0.0%
33-3052 Transit and Railroad Police 3,000 0.0%
45-4023 Log Graders and Scalers 2,560 0.0%
39-7012 Travel Guides 2,550 0.0%
33-2022 Forest Fire Inspectors and Prevention Specialists 1,590 0.0%
47-4091 Segmental Pavers 1,230 0.0%
13-1074 Farm Labor Contractors 1,210 0.0%

The Employment Impact of Autonomous Vehicles
Office of the Chief Economist Economics and Statistics Administration Page 25
Appendix Table 2: Definitions of O*NET Output Measures
Source: https://www.O*NETonline.org/find/descriptor/browse/Work_Activities/4.A.3/
Output Measure Name Definition
1. Controlling Machines and Processes
Using either control mechanisms or direct physical activity to
operate machines or processes (not including computers or
vehicles)
2. Documenting/Recording InformationEntering, transcribing, recording, storing, or maintaining
information in written or electronic/magnetic form
3. Drafting, Laying Out, and Specifying Technical
Devices, Parts, and Equipment
Providing documentation, detailed instructions, drawings, or
specifications to tell others about how devices, parts,
equipment, or structures are to be fabricated, constructed,
assembled, modified, maintained, or used
4. Handling and Moving ObjectsUsing hands and arms in handling, installing, positioning, and
moving materials, and manipulating things
5. Interacting with Computers
Using computers and computer systems (including hardware and
software) to program, write software, set up functions, enter
data, or process information
6. Operating Vehicles, Mechanized Devices, or
Equipment
Running, maneuvering, navigating, or driving vehicles or
mechanized equipment, such as forklifts, passenger vehicles,
aircraft, or water craft
7. Performing General Physical Activities
Performing physical activities that require considerable use of
your arms and legs and moving your whole body, such as
climbing, lifting, balancing, walking, stooping, and handling of
materials
8. Repairing and Maintaining Electronic Equipment
Servicing, repairing, calibrating, regulating, fine-tuning, or testing
machines, devices, and equipment that operate primarily on the
basis of electrical or electronic (not mechanical) principles
9. Repairing and Maintaining Mechanical
Equipment
Servicing, repairing, adjusting, and testing machines, devices,
moving parts, and equipment that operate primarily on the basis
of mechanical (not electronic) principles

The Employment Impact of Autonomous Vehicles
Office of the Chief Economist Economics and Statistics Administration Page 26
Appendix Figure 1: Relative Importance of Driving by Industry
Source: O*NET, see https://www.onetonline.org/
0.8
0.5
0.6
0.4
0.9
0.6
0.9
0.9
0.6
0.8
1.4
0.6
0.5
0.5
1.0
0.9
0.9
0.9
1.2
1.1
1.1
1.3
1.2
1.0
1.2
1.4
1.3
1.3
1.5
1.2
1.2
2.0
1.5
1.0
1.0
1.1
1.4
1.1
1.2
1.1
1.5
1.2
2.0
2.9
2.5
2.4
2.3
2.2
2.1
2.1
2.0
2.0
2.0
2.0
2.0
1.9
1.9
1.9
1.8
1.8
1.8
1.8
1.8
0 0.5 1 1.5 2 2.5 3 3.5
All Industries
Education
Health Care/Social Assist.
Finance and Insurance
Government
Arts…
Other Services
Real Estate/Leasing
Information
Retail Trade
Transport/Warehousing
Accom/Food Svcs
Professional…
Mgt Companies
Wholesale Trade
Admin/Waste Mgt
Manufacturing
Utilities
Construction
Agriculture
Mining
Motor Vehicle Operators
Other On The Job Drivers
All Occupations
The Employment Impact of Autonomous Vehicles
Office of the Chief Economist Economics and Statistics Administration Page 27
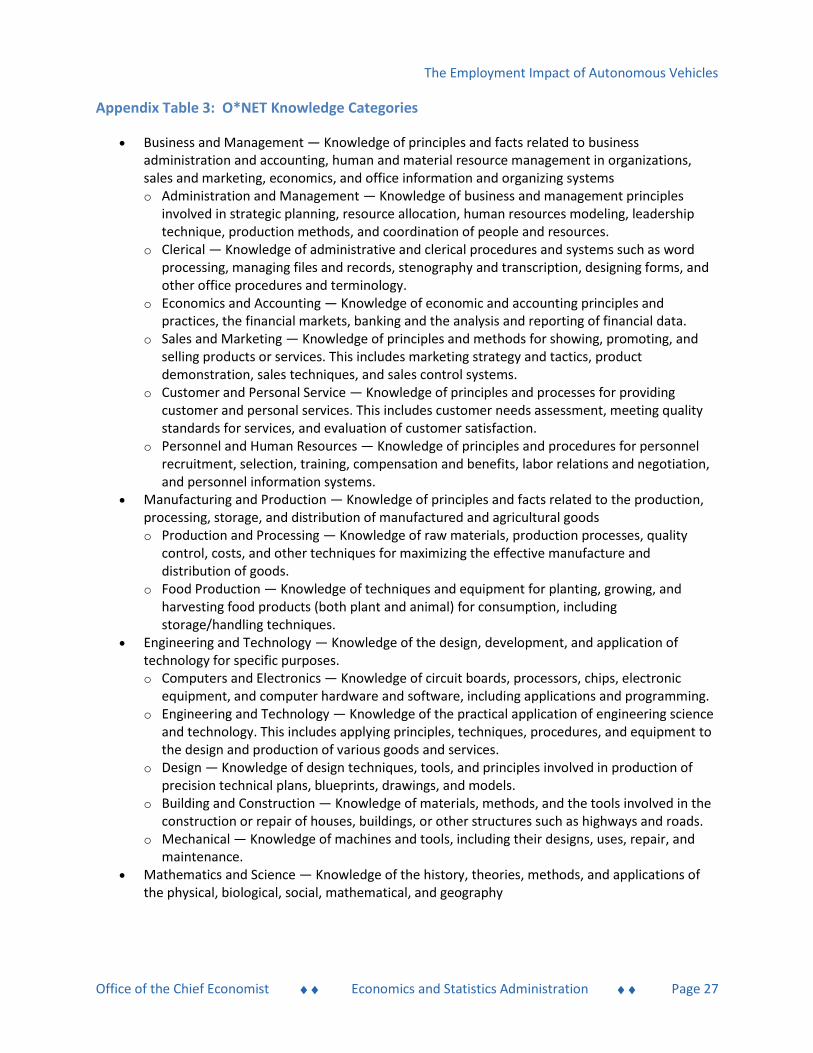
Appendix Table 3: O*NET Knowledge Categories
Business and Management — Knowledge of principles and facts related to business administration and accounting, human and material resource management in organizations, sales and marketing, economics, and office information and organizing systems o Administration and Management — Knowledge of business and management principles
involved in strategic planning, resource allocation, human resources modeling, leadership technique, production methods, and coordination of people and resources.
o Clerical — Knowledge of administrative and clerical procedures and systems such as word processing, managing files and records, stenography and transcription, designing forms, and other office procedures and terminology.
o Economics and Accounting — Knowledge of economic and accounting principles and practices, the financial markets, banking and the analysis and reporting of financial data.
o Sales and Marketing — Knowledge of principles and methods for showing, promoting, and selling products or services. This includes marketing strategy and tactics, product demonstration, sales techniques, and sales control systems.
o Customer and Personal Service — Knowledge of principles and processes for providing customer and personal services. This includes customer needs assessment, meeting quality standards for services, and evaluation of customer satisfaction.
o Personnel and Human Resources — Knowledge of principles and procedures for personnel recruitment, selection, training, compensation and benefits, labor relations and negotiation, and personnel information systems.
Manufacturing and Production — Knowledge of principles and facts related to the production, processing, storage, and distribution of manufactured and agricultural goods o Production and Processing — Knowledge of raw materials, production processes, quality
control, costs, and other techniques for maximizing the effective manufacture and distribution of goods.
o Food Production — Knowledge of techniques and equipment for planting, growing, and harvesting food products (both plant and animal) for consumption, including storage/handling techniques.
Engineering and Technology — Knowledge of the design, development, and application of technology for specific purposes. o Computers and Electronics — Knowledge of circuit boards, processors, chips, electronic
equipment, and computer hardware and software, including applications and programming. o Engineering and Technology — Knowledge of the practical application of engineering science
and technology. This includes applying principles, techniques, procedures, and equipment to the design and production of various goods and services.
o Design — Knowledge of design techniques, tools, and principles involved in production of precision technical plans, blueprints, drawings, and models.
o Building and Construction — Knowledge of materials, methods, and the tools involved in the construction or repair of houses, buildings, or other structures such as highways and roads.
o Mechanical — Knowledge of machines and tools, including their designs, uses, repair, and maintenance.
Mathematics and Science — Knowledge of the history, theories, methods, and applications of the physical, biological, social, mathematical, and geography

The Employment Impact of Autonomous Vehicles
Office of the Chief Economist Economics and Statistics Administration Page 28
Appendix Table 3: O*NET Knowledge Categories (cont.)
o Mathematics — Knowledge of arithmetic, algebra, geometry, calculus, statistics, and their
applications. o Physics — Knowledge and prediction of physical principles, laws, their interrelationships,
and applications to understanding fluid, material, and atmospheric dynamics, and mechanical, electrical, atomic and sub- atomic structures and processes.
o Chemistry — Knowledge of the chemical composition, structure, and properties of substances and of the chemical processes and transformations that they undergo. This includes uses of chemicals and their interactions, danger signs, production techniques, and disposal methods.
o Biology — Knowledge of plant and animal organisms, their tissues, cells, functions, interdependencies, and interactions with each other and the environment.
o Psychology — Knowledge of human behavior and performance; individual differences in ability, personality, and interests; learning and motivation; psychological research methods; and the assessment and treatment of behavioral and affective disorders.
o Sociology and Anthropology — Knowledge of group behavior and dynamics, societal trends and influences, human migrations, ethnicity, cultures and their history and origins.
o Geography — Knowledge of principles and methods for describing the features of land, sea, and air masses, including their physical characteristics, locations, interrelationships, and distribution of plant, animal, and human life.
Health Services — Knowledge of principles and facts regarding diagnosing, curing, and preventing disease, and improving and preserving physical and mental health and well-being o Medicine and Dentistry — Knowledge of the information and techniques needed to
diagnose and treat human injuries, diseases, and deformities. This includes symptoms, treatment alternatives, drug properties and interactions, and preventive health-care measures.
o Therapy and Counseling — Knowledge of principles, methods, and procedures for diagnosis, treatment, and rehabilitation of physical and mental dysfunctions, and for career counseling and guidance.
Education and Training — Knowledge of principles and methods for curriculum and training design, teaching and instruction for individuals and groups, and the measurement of training effects.
Arts and Humanities — Knowledge of facts and principles related to the branches of learning concerned with human thought, language, and the arts. o English Language — Knowledge of the structure and content of the English language
including the meaning and spelling of words, rules of composition, and grammar. o Foreign Language — Knowledge of the structure and content of a foreign (non-English)
language including the meaning and spelling of words, rules of composition and grammar, and pronunciation.
o Fine Arts — Knowledge of the theory and techniques required to compose, produce, and perform works of music, dance, visual arts, drama, and sculpture.
o History and Archeology — Knowledge of historical events and their causes, indicators, and effects on civilizations and cultures.

The Employment Impact of Autonomous Vehicles
Office of the Chief Economist Economics and Statistics Administration Page 29
Appendix Table 3: O*NET Knowledge Categories (cont.)
o Philosophy and Theology — Knowledge of different philosophical systems and religions. This
includes their basic principles, values, ethics, ways of thinking, customs, practices, and their impact on human culture.
Law and Public Safety — Knowledge of regulations and methods for maintaining people and property free from danger, injury, or damage; the rules of public conduct established and enforced by legislation, and the political process establishing such rules. o Public Safety and Security — Knowledge of relevant equipment, policies, procedures, and
strategies to promote effective local, state, or national security operations for the protection of people, data, property, and institutions.
o Law and Government — Knowledge of laws, legal codes, court procedures, precedents, government regulations, executive orders, agency rules, and the democratic political process.
Communications — Knowledge of the science and art of delivering information o Telecommunications — Knowledge of transmission, broadcasting, switching, control, and
operation of telecommunications systems. o Communications and Media — Knowledge of media production, communication, and
dissemination techniques and methods. This includes alternative ways to inform and entertain via written, oral, and visual media.
Transportation — Knowledge of principles and methods for moving people or goods by air, rail, sea, or road, including the relative costs and benefits.

The Employment Impact of Autonomous Vehicles
Office of the Chief Economist Economics and Statistics Administration Page 30
Appendix Table 4: O*NET Cross-Functional Skill Categories
Social Skills — Developed capacities used to work with people to achieve goals o Social Perceptiveness — Being aware of others' reactions and understanding why they react as
they do. o Coordination — Adjusting actions in relation to others' actions. o Persuasion — Persuading others to change their minds or behavior. o Negotiation — Bringing others together and trying to reconcile differences. o Instructing — Teaching others how to do something. o Service Orientation — Actively looking for ways to help people.
Complex Problem Solving Skills — Developed capacities used to solve novel, ill-defined problems in complex, real-world settings o Complex Problem Solving — Identifying complex problems and reviewing related information to
develop and evaluate options and implement solutions. Technical Skills — Developed capacities used to design, set-up, operate, and correct malfunctions
involving application of machines or technological systems o Operations Analysis — Analyzing needs and product requirements to create a design. o Technology Design — Generating or adapting equipment and technology to serve user needs. o Equipment Selection — Determining the kind of tools and equipment needed to do a job. o Installation — Installing equipment, machines, wiring, or programs to meet specifications. o Programming — Writing computer programs for various purposes. o Operation Monitoring — Watching gauges, dials, or other indicators to make sure a machine is
working properly. o Operation and Control — Controlling operations of equipment or systems. o Equipment Maintenance — Performing routine maintenance on equipment and determining
when and what kind of maintenance is needed. o Troubleshooting — Determining causes of operating errors and deciding what to do about it. o Repairing — Repairing machines or systems using the needed tools. o Quality Control Analysis — Conducting tests and inspections of products, services, or processes
to evaluate quality or performance. Systems Skills — Developed capacities used to understand, monitor, and improve socio-technical
systems o Judgment and Decision Making — Considering the relative costs and benefits of potential
actions to choose the most appropriate one. o Systems Analysis — Determining how a system should work and how changes in conditions,
operations, and the environment will affect outcomes. o Systems Evaluation — Identifying measures or indicators of system performance and the actions
needed to improve or correct performance, relative to the goals of the system. Resource Management Skills — Developed capacities used to allocate resources efficiently
o Time Management — Managing one's own time and the time of others. o Management of Financial Resources — Determining how money will be spent to get the work
done, and accounting for these expenditures. o Management of Material Resources — Obtaining and seeing to the appropriate use of
equipment, facilities, and materials needed to do certain work. o Management of Personnel Resources — Motivating, developing, and directing people as they
work, identifying the best people for the job.

The Employment Impact of Autonomous Vehicles
Office of the Chief Economist Economics and Statistics Administration Page 31
Appendix Table 5: Demographic and Economic Characteristics of Motor Vehicle Operators
Ambulance Drivers and Attendants, Except for EMTs are not shown separately because of insufficient data. Percentages for
Educational Attainment and Race may not sum to 100.0% due to rounding.
Bus Drivers
Driver/Sales
Workers and
Truck Drivers
Taxi
Drivers and
Chauffeurs
Employment (thousands of workers) 674 2,922 181
Employment Share (%) 17.8 77.4 4.8
Mean Annual Wages (dollars) 32,980 38,030 26,070
Median Age (years) 53 46 48
Educational Attainment (%)
Less than HS 8.3 16.1 13.9
HS or GED 43.1 47.3 36.0
Some College 39.4 30.5 32.8
Bachelors Plus 9.2 6.1 17.3
Unemployment Rate (%) 3.7 4.9 4.8
Male (%) 54.4 94.1 86.1
Race (%)
White 63.3 74.0 50.9
Black 27.3 15.0 25.1
Other 9.4 11.0 24.0
Hispanic (%) 13.7 19.5 18.5
Married, spouse present (%) 53.3 54.5 49.4
Non-Citizen (%) 3.2 8.1 17.8
Self-Employed (%) 1.4 10.7 32.2
Poverty (%) 6.4 5.5 12.7
Veteran (%) 11.5 11.7 9.3
No Health Insurance Coverage (%) 8.1 15.6 21.6
No Home Internet Access (%) 15.3 14.6 14.8
No Home Computer (%) 9.3 9.0 9.8
Worked part-time last year (%) 39.0 11.6 30.8
Paid by the hour (%) 73.5 67.2 40.2
Included in pension plan at work (%) 35.9 24.5 11.2
Union coverage (%) 31.8 15.7 16.2
Not in metro area (%) 14.0 18.5 6.2 16.2
17.4
53.8
8.4
11.5
6.3
11.5
15.2
C. Annual Social and Economic Supplement to Current Population Survey , 2016
14.7
9.1
17.2
64.7
24.3
88.0
70.3
17.6
12.1
18.7
4.7
All Motor
Vehicle
Operators
3,777
100
36,460
A. Occupational Employment Statistics, 2015
B. American Community Survey, 2015 Public Use Microdata Sample
47
14.8
45.6
32.0
7.6
The Employment Impact of Autonomous Vehicles
Office of the Chief Economist Economics and Statistics Administration Page 32
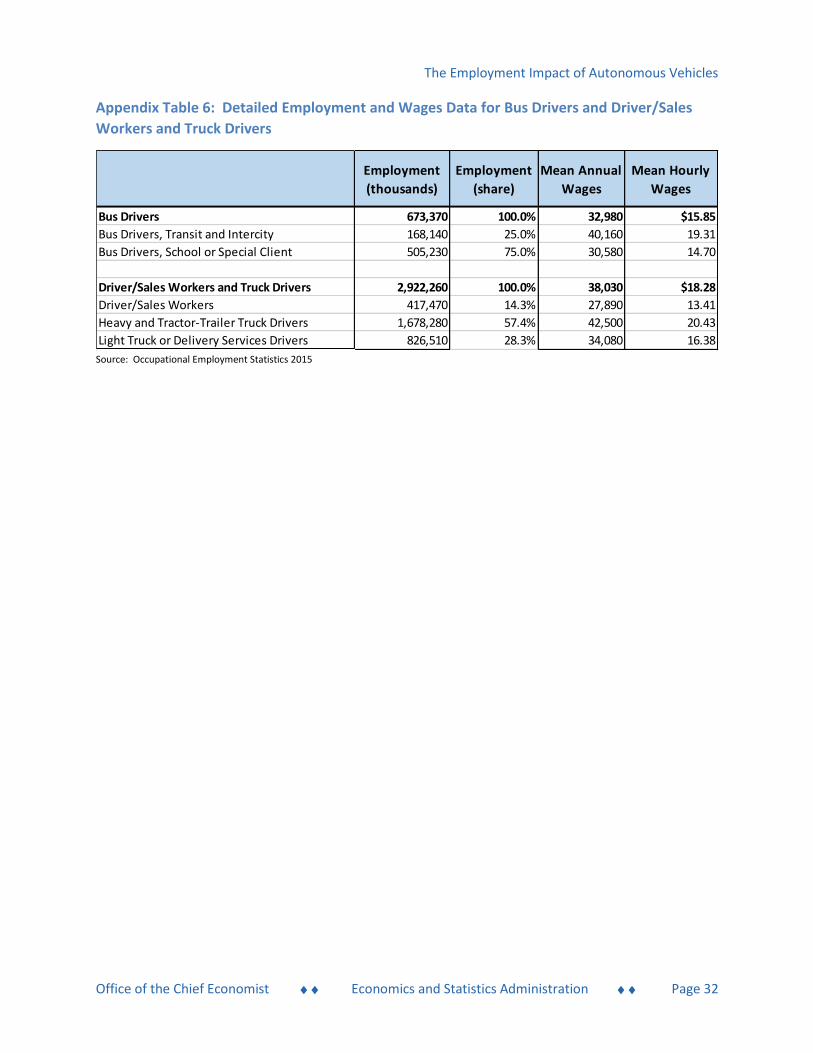
Appendix Table 6: Detailed Employment and Wages Data for Bus Drivers and Driver/Sales
Workers and Truck Drivers
Source: Occupational Employment Statistics 2015
Employment
(thousands)
Employment
(share)
Mean Annual
Wages
Mean Hourly
Wages
Bus Drivers 673,370 100.0% 32,980 $15.85
Bus Drivers, Transit and Intercity 168,140 25.0% 40,160 19.31
Bus Drivers, School or Special Client 505,230 75.0% 30,580 14.70
Driver/Sales Workers and Truck Drivers 2,922,260 100.0% 38,030 $18.28
Driver/Sales Workers 417,470 14.3% 27,890 13.41
Heavy and Tractor-Trailer Truck Drivers 1,678,280 57.4% 42,500 20.43
Light Truck or Delivery Services Drivers 826,510 28.3% 34,080 16.38

The Employment Impact of Autonomous Vehicles
Office of the Chief Economist Economics and Statistics Administration Page 33
Suggested citation: Beede, David, Regina Powers, and Cassandra Ingram. Office of the Chief Economist, Economics and Statistics Administration, U.S. Department of Commerce. (August 11, 2017). The Employment Impact of Autonomous Vehicles (ESA Issue Brief # 05-17).
U.S. Department of Commerce Economics and Statistics Administration Office of the Chief Economist Room 4848 1401 Constitution Ave., NW Washington, DC 20230 esa.doc.gov
Technical inquiries: Office of the Chief Economist (202) 482-3523
Media inquiries: Office of Communications (202) 482-3331


![Autonomous vehicles[1]](https://img.pdfslide.net/doc/110x75/54bf07bb4a7959cb478b4592/autonomous-vehicles1.jpg)