Embed Size (px)
Citation preview
1
The Enabling Services Accountability Project
Heidi Park, PhDThe New York Academy of Medicine
Rosy Chang Weir, PhDThe Association of Asian Pacific Community Health
Organizations
Presented at the NACHC Annual Conference
and Community Health Institute
San Francisco, CA
September 21, 2004
2
Project Goals
Develop new database and data collection protocol for enabling services at health centersDescribe the utilization of enabling services by AAPIs at health centersAssess health needs of enabling services users
3
$0
$200,000
$400,000
$600,000
$800,000
$1,000,000
$1,200,000
$1,400,000
$1,600,000
Total Cost Enabling Services
AAPCHO 00AAPCHO 01AAPCHO 02AAPCHO 03NATIONAL 00NATIONAL 01NATIONAL 02NATIONAL 03
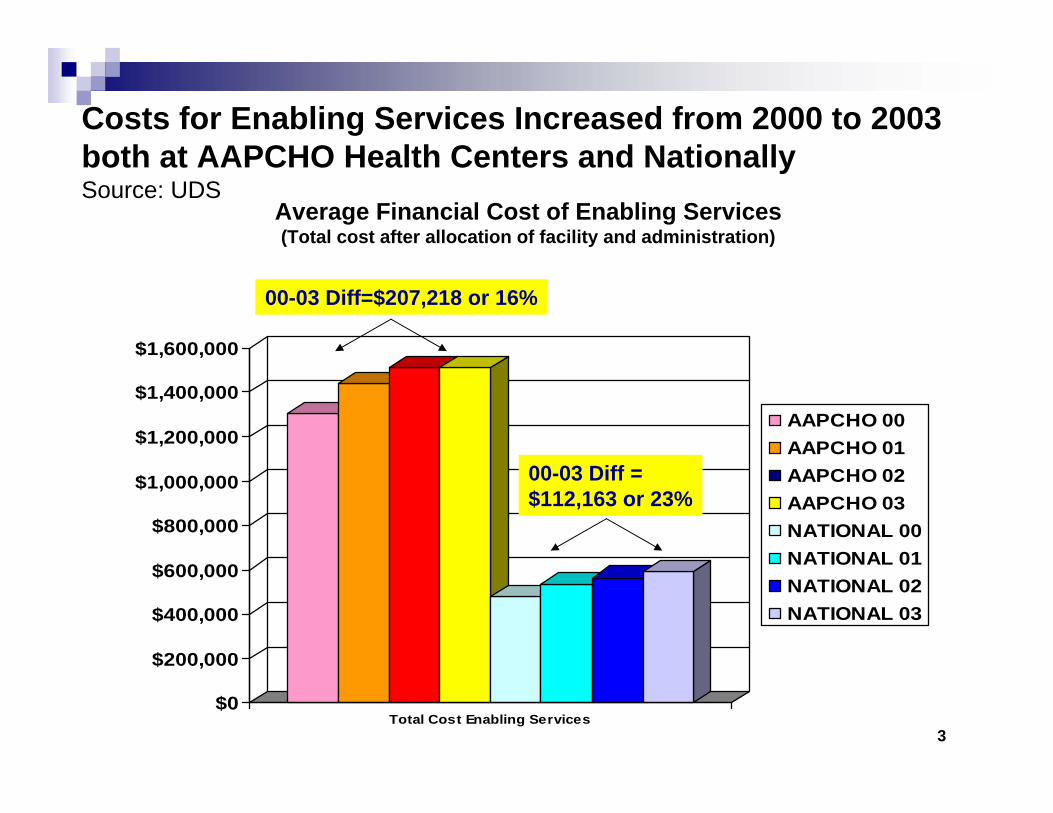
Average Financial Cost of Enabling Services(Total cost after allocation of facility and administration)
00-03 Diff=$207,218 or 16%
00-03 Diff =$112,163 or 23%
Costs for Enabling Services Increased from 2000 to 2003 both at AAPCHO Health Centers and Nationally Source: UDS
4
Background
Enabling services are critical to access to care for health center patientsEnabling services are not reimbursed and are often underfundedNeed for better data on enabling services and their impact on health
5
Background – 2
Budgetary pressures and rising health care costsRacial/ethnic disparities in healthNational focus on quality of care
6
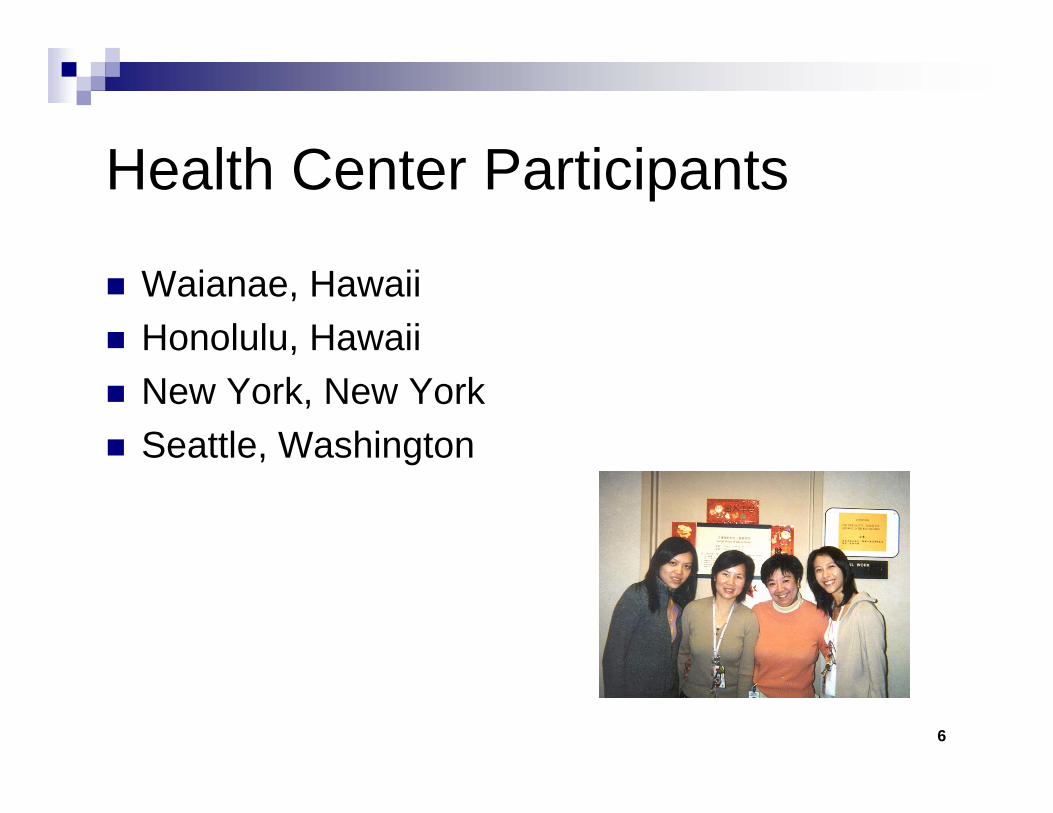
Health Center Participants
Waianae, HawaiiHonolulu, HawaiiNew York, New YorkSeattle, Washington
7
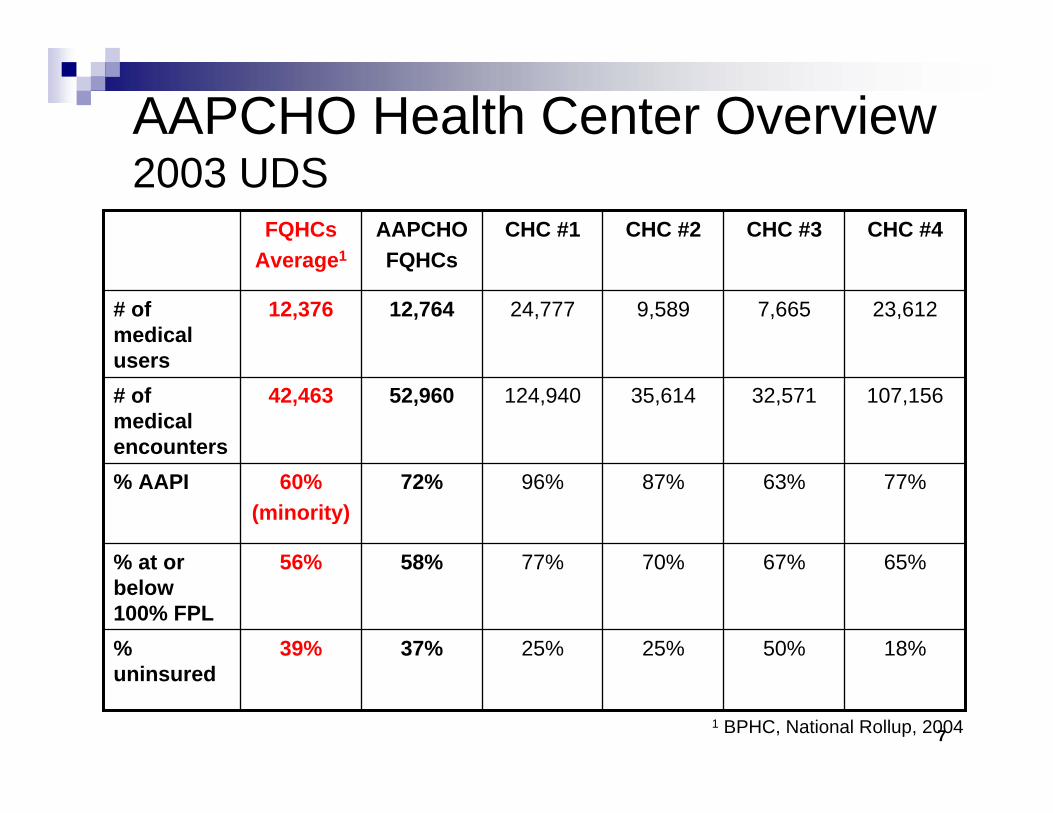
AAPCHO Health Center Overview2003 UDS
39%
56%
60%(minority)
42,463
12,376
FQHCsAverage1
18%50%25%25%37%% uninsured
65%67%70%77%58%% at or below 100% FPL
77%63%87%96%72%% AAPI
107,15632,57135,614124,94052,960# of medical encounters
23,6127,6659,58924,77712,764# of medical users
CHC #4CHC #3CHC #2CHC #1AAPCHO FQHCs
1 BPHC, National Rollup, 2004
8
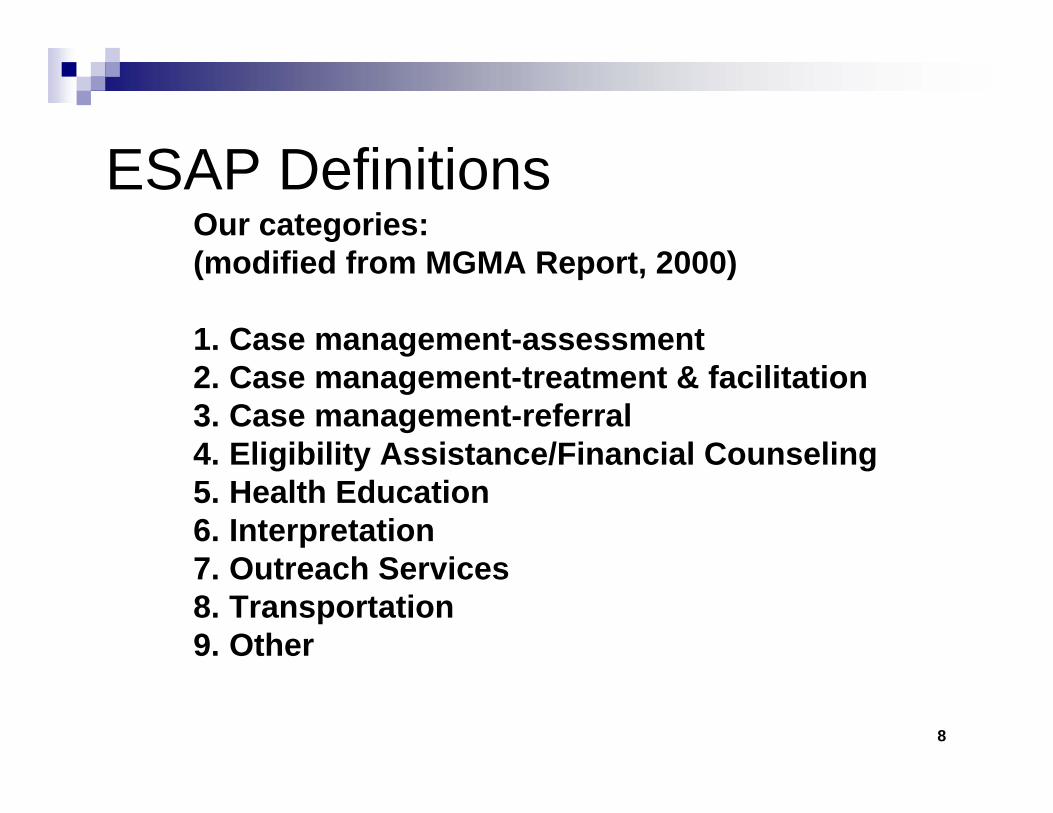
ESAP DefinitionsOur categories:(modified from MGMA Report, 2000)
1. Case management-assessment2. Case management-treatment & facilitation3. Case management-referral4. Eligibility Assistance/Financial Counseling5. Health Education6. Interpretation7. Outreach Services8. Transportation9. Other
9
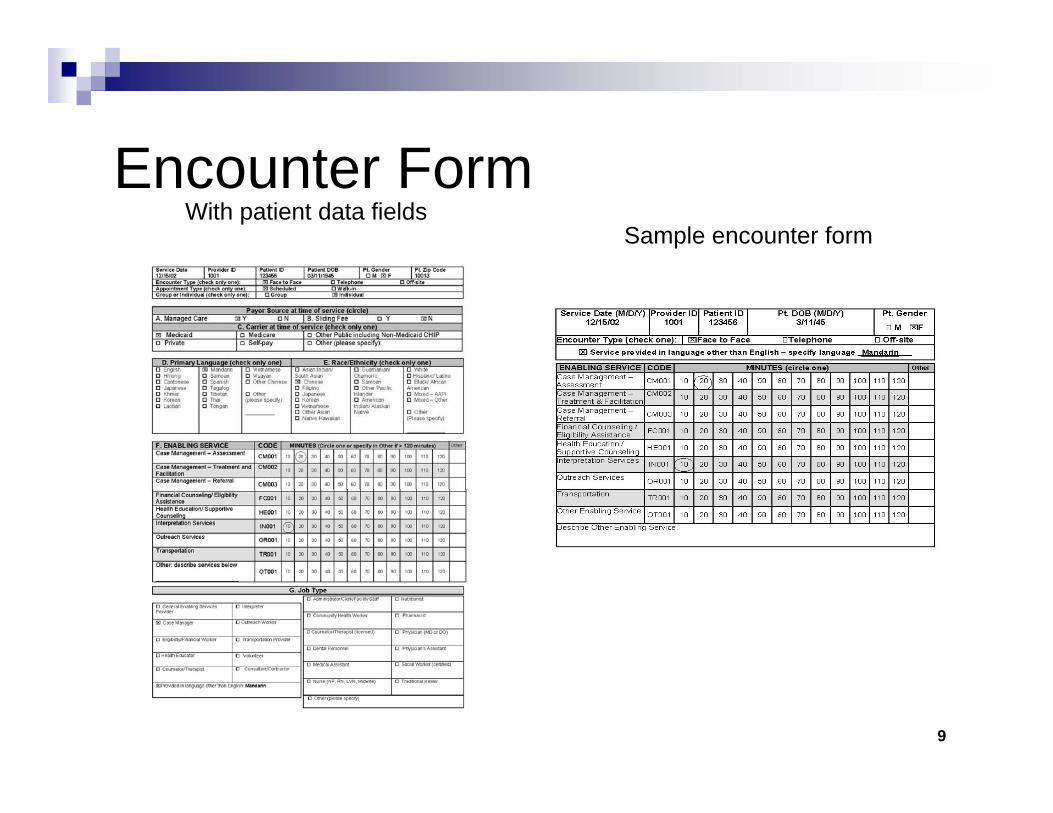
Encounter FormSample encounter form
With patient data fields
10
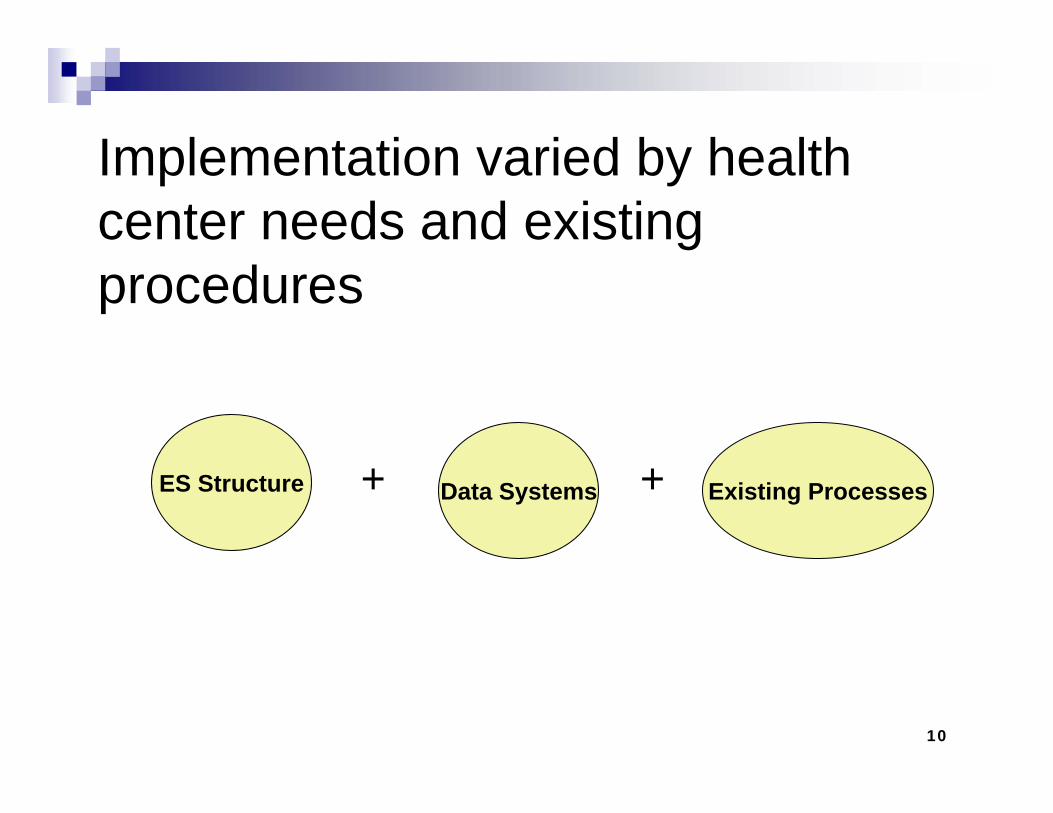
Implementation varied by health center needs and existing procedures
Data SystemsES Structure Existing Processes+ +
11
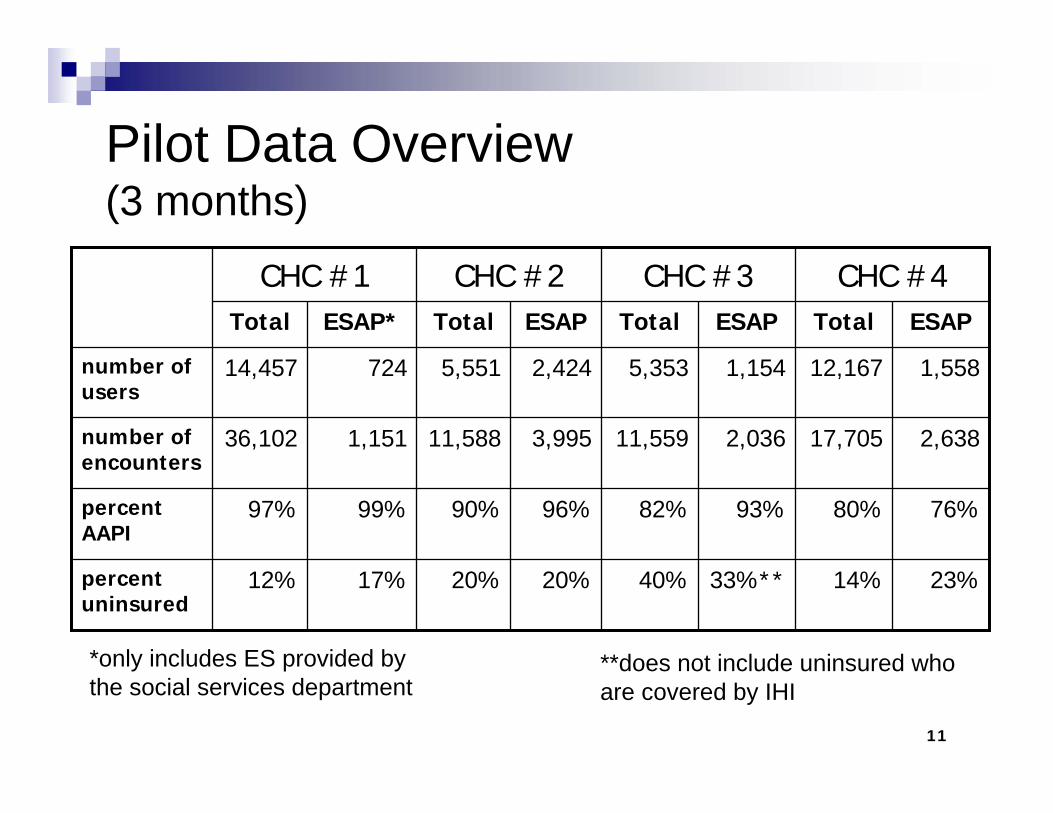
Pilot Data Overview (3 months)
23%
76%
2,638
1,558
ESAP
CHC #4CHC #3CHC #2CHC #1
14%33%**40%20%20%17%12%percent uninsured
80%93%82%96%90%99%97%percent AAPI
17,7052,03611,5593,99511,5881,15136,102number of encounters
12,1671,1545,3532,4245,55172414,457number of users
TotalESAPTotalESAPTotalESAP* Total
**does not include uninsured who are covered by IHI
*only includes ES provided by the social services department
12
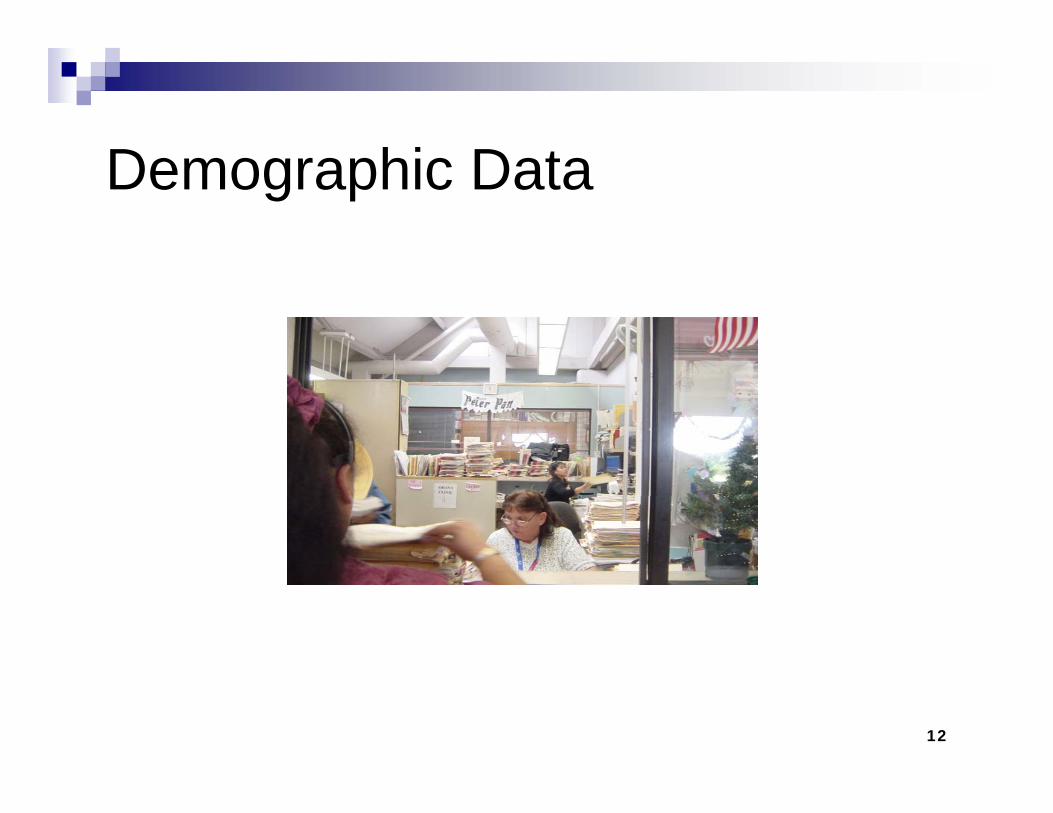
Demographic Data
13
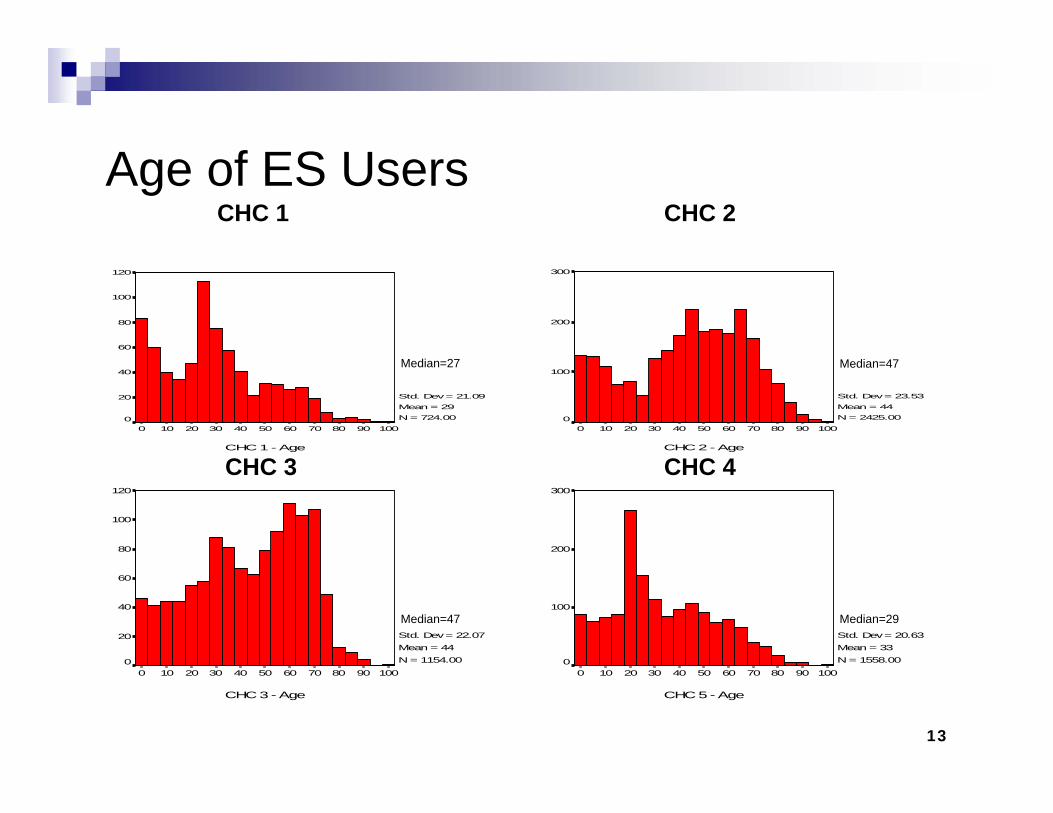
Age of ES Users
CHC 2 - Age
1009080706050403020100
300
200
100
0
Std. Dev = 23.53 Mean = 44N = 2425.00
CHC 3 - Age
1009080706050403020100
120
100
80
60
40
20
0
Std. Dev = 22.07 Mean = 44N = 1154.00
CHC 5 - Age
1009080706050403020100
300
200
100
0
Std. Dev = 20.63 Mean = 33N = 1558.00
CHC 1 - Age
1009080706050403020100
120
100
80
60
40
20
0
Std. Dev = 21.09 Mean = 29N = 724.00
CHC 1 CHC 2
CHC 3 CHC 4
Median=27 Median=47
Median=47 Median=29
14
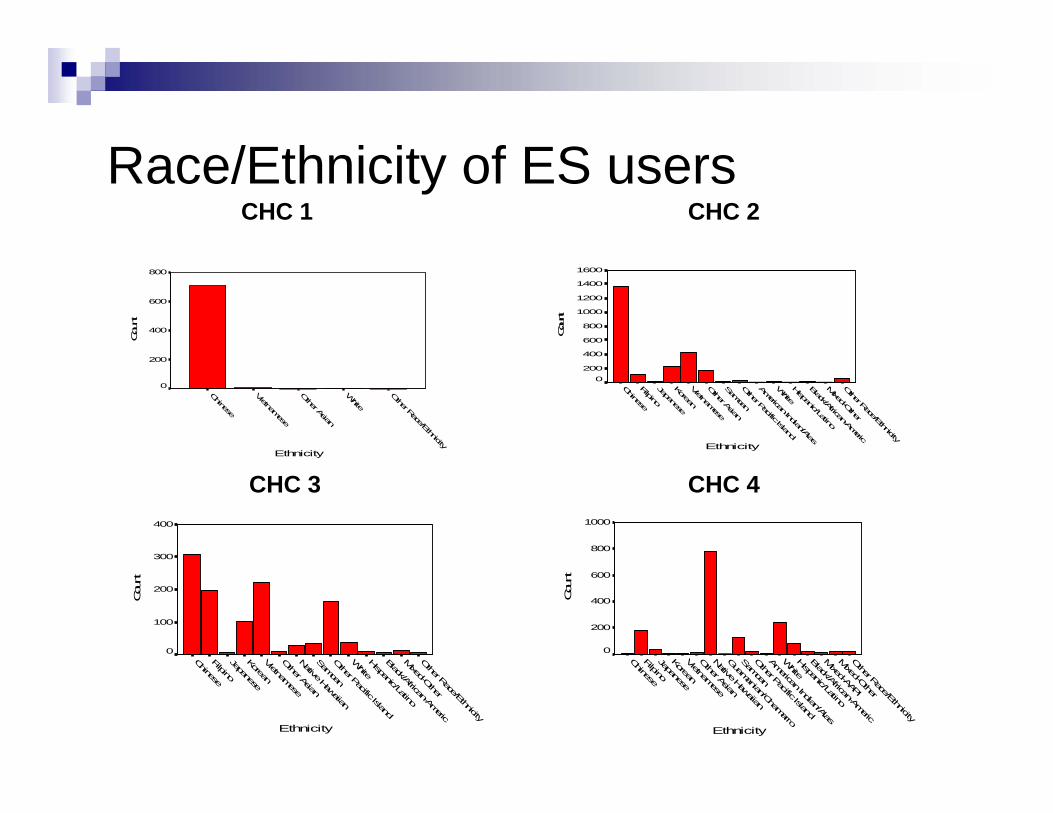
Race/Ethnicity of ES usersCHC 1 CHC 2
CHC 3 CHC 4Ethnicity
Other Race/Ethnicity
White
Other Asian
Vietnamese
Chinese
Cou
nt
800
600
400
200
0
Ethnicity
Other Race/Ethnicity
Mixed-O
ther
Black/African-Americ
Hispanic/Latino
White
American Indian/Alas
Other Pacific Island
Samoan
Other Asian
Vietnamese
Korean
Japanese
Filpino
Chinese
Count
1600
1400
1200
1000
800
600
400
2000
Ethnicity
Other Race/Ethnicity
Mixed-Other
Mixed-AAPI
Black/African-Americ
Hispanic/Latino
White
American Indian/Alas
Other Pacific Island
Samoan
Guamanian/Chamarro
Native Hawaiian
Other Asian
Vietnamese
Korean
Japanese
Filpino
Chinese
Cou
nt
1000
800
600
400
200
0
Ethnicity
Other Race/Ethnicity
Mixed-Other
Black/African-Americ
Hispanic/Latino
White
Other Pacific Island
Samoan
Native Hawaiian
Other Asian
Vietnamese
Korean
Japanese
Filpino
Chinese
Cou
nt
400
300
200
100
0
15
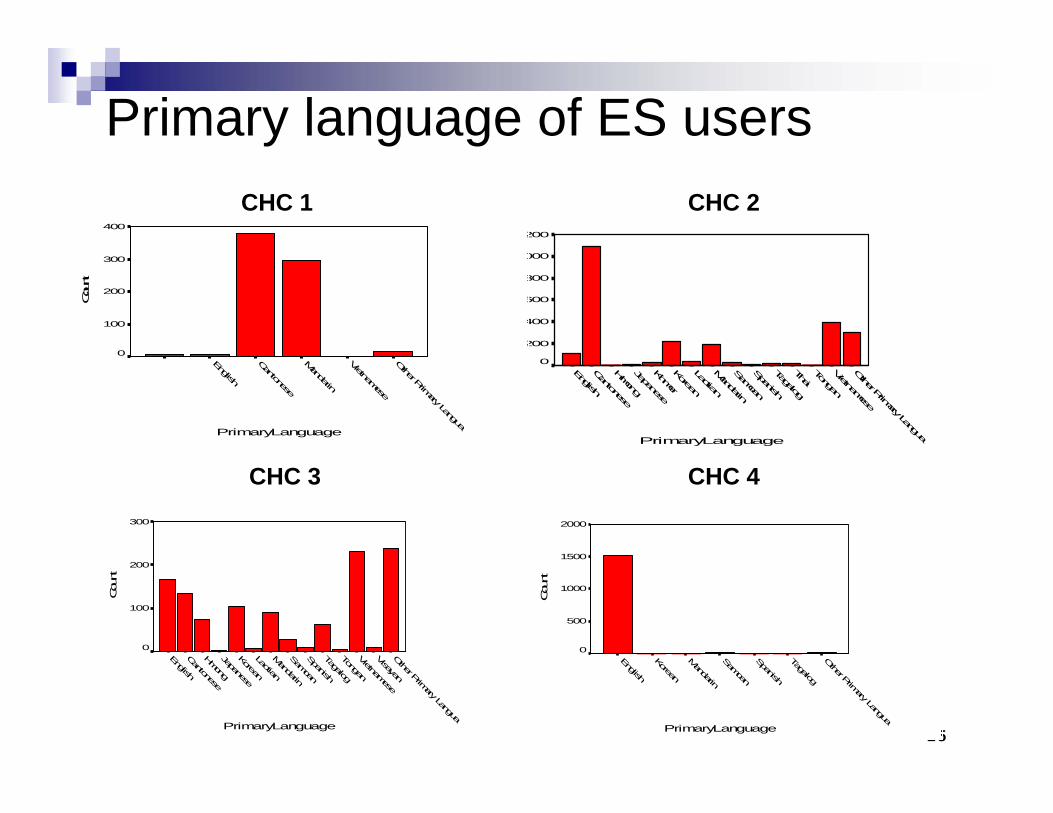
Primary language of ES usersCHC 1 CHC 2
CHC 3 CHC 4PrimaryLanguage
Other Prim
ary Langua
Vietnamese
Tongan
Thai
Tagalog
Spanish
Samoan
Mandarin
Laotian
Korean
Khmer
Japanese
Hmong
Cantonese
English
Count
1200
1000
800
600
400
200
0
PrimaryLanguage
Other Primary Langua
Visayan
Vietnamese
Tongan
Tagalog
Spanish
Samoan
Mandarin
Laotian
Korean
Japanese
Hmong
Cantonese
English
Cou
nt
300
200
100
0
PrimaryLanguage
Other Primary Langua
Tagalog
Spanish
Samoan
Mandarin
Korean
English
Cou
nt
2000
1500
1000
500
0
PrimaryLanguage
Other Primary Langua
Vietnamese
Mandarin
Cantonese
English
Cou
nt
400
300
200
100
0
16
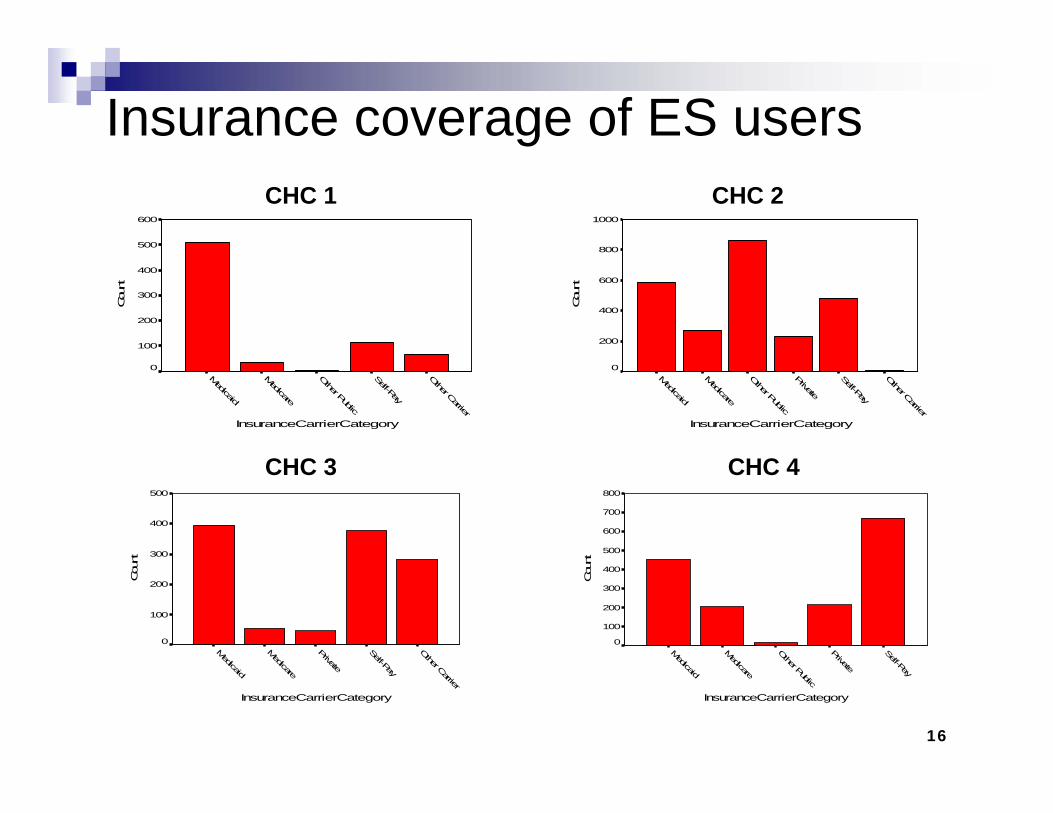
Insurance coverage of ES usersCHC 1 CHC 2
CHC 3 CHC 4
InsuranceCarrierCategory
Other Carrier
Self-Pay
Other Public
Medicare
Medicaid
Cou
nt
600
500
400
300
200
100
0
InsuranceCarrierCategory
Other Carrier
Self-Pay
Private
Other Public
Medicare
Medicaid
Cou
nt
1000
800
600
400
200
0
InsuranceCarrierCategory
Other Carrier
Self-Pay
Private
Medicare
Medicaid
Cou
nt
500
400
300
200
100
0
InsuranceCarrierCategory
Self-Pay
Private
Other Public
Medicare
Medicaid
Cou
nt
800
700
600
500
400
300
200
100
0
17
Utilization Data
18
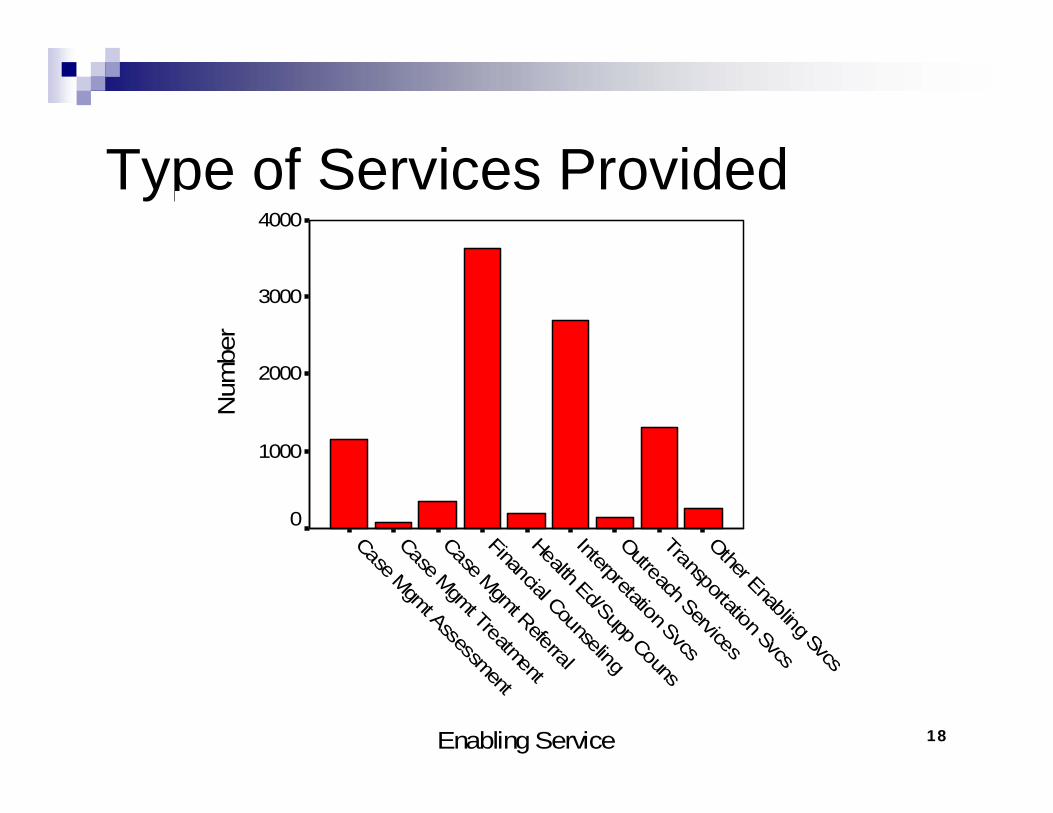
Type of Services Provided
Enabling Service
Other Enabling Svcs
Transportation Svcs
Outreach Services
Interpretation Svcs
Health Ed/Supp Couns
Financial Counseling
Case Mgmt Referral
Case Mgmt Treatment
Case Mgmt Assessment
Num
ber
4000
3000
2000
1000
0
19
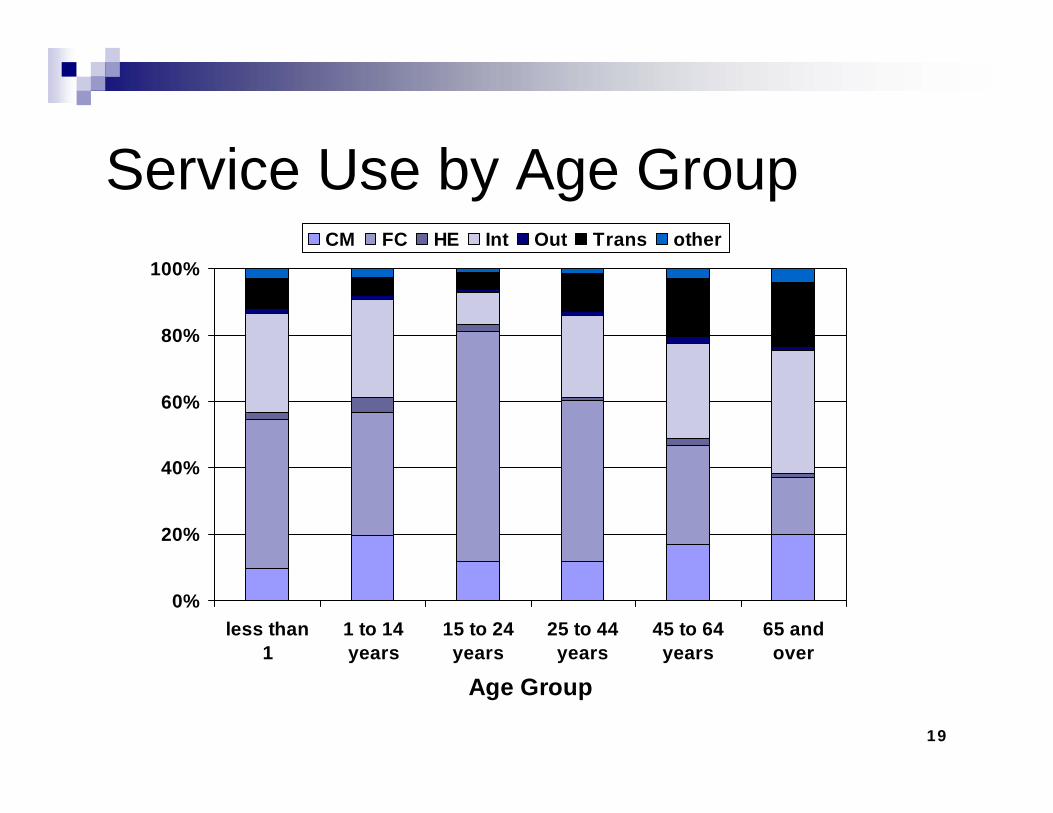
Service Use by Age Group
0%
20%
40%
60%
80%
100%
less than1
1 to 14years
15 to 24years
25 to 44years
45 to 64years
65 andover
Age Group
CM FC HE Int Out Trans other
20
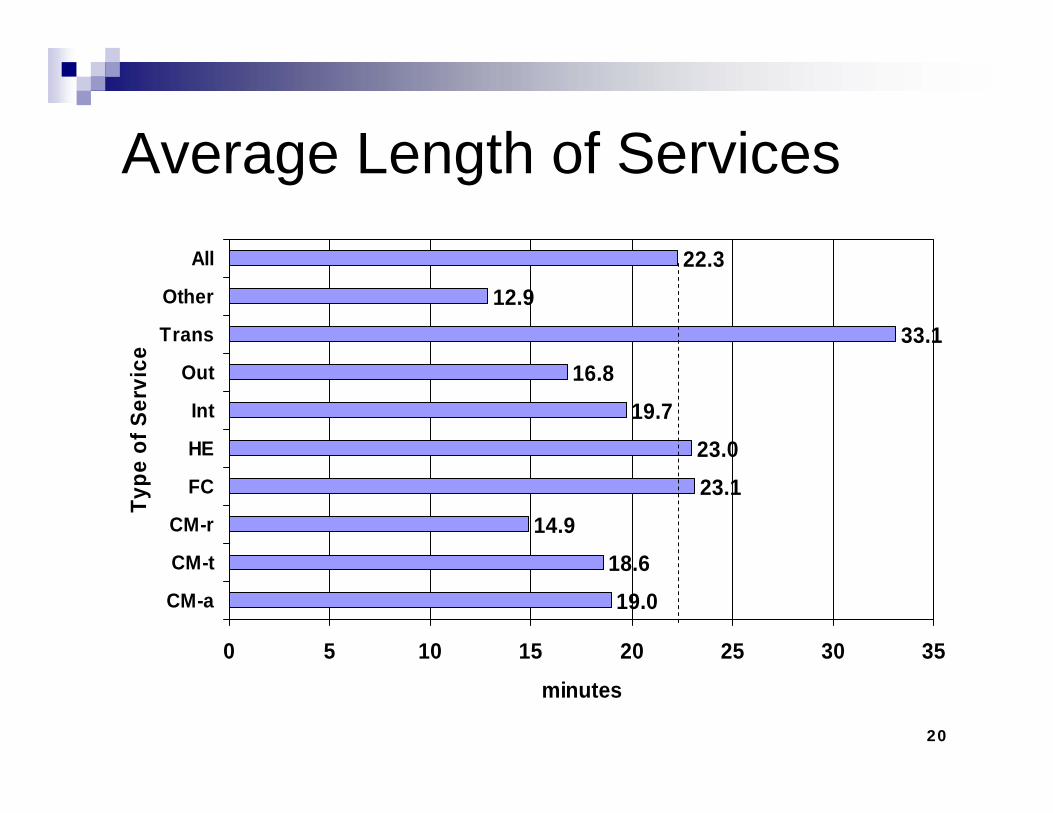
Average Length of Services
19.018.6
14.923.123.0
19.716.8
33.112.9
22.3
0 5 10 15 20 25 30 35
CM-a
CM-t
CM-r
FC
HE
Int
Out
Trans
Other
All
Type
of S
ervi
ce
minutes
21
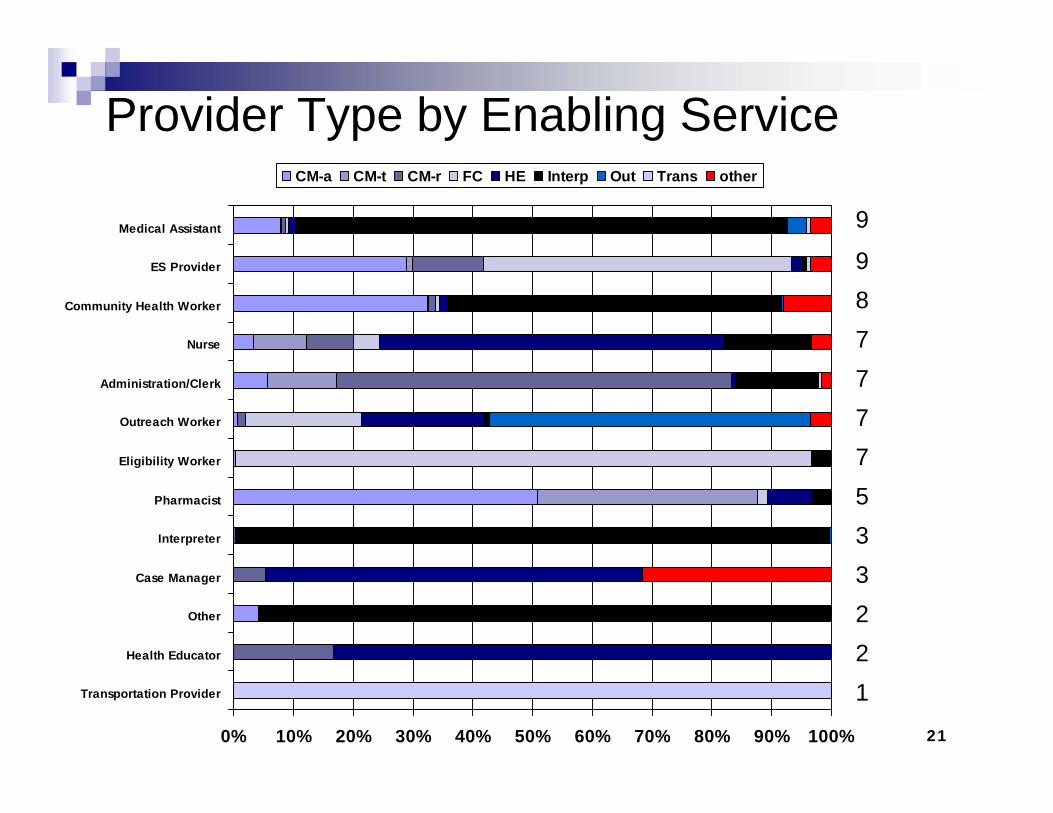
Provider Type by Enabling Service
0% 10% 20% 30% 40% 50% 60% 70% 80% 90% 100%
Transportation Provider
Health Educator
Other
Case Manager
Interpreter
Pharmacist
Eligibility Worker
Outreach Worker
Administration/Clerk
Nurse
Community Health Worker
ES Provider
Medical Assistant
CM-a CM-t CM-r FC HE Interp Out Trans other
9
987777533221
22
Project Evaluation – Feedback
Enabling services staff were interested in showing how their services impacted their patients’ healthEnabling services staff were willing to provide information about their workEnabling services staff were involved with improving processesHealth centers faced many similar challenges and benefits with the project
23
Limitations of the Data
Health centers use different methods for providing enabling servicesEnabling services (ESAP) data reflects those services captured through the protocols implemented at each health center“Other enabling services” include those that link patients with non-medically related services, such as housing, food, educationServices less than 10 minutes are not captured
24
Health Needs Project: Preliminary Data
- Do ES users have different characteristics from non-ES users?
- What are the health needs of ES users?
25
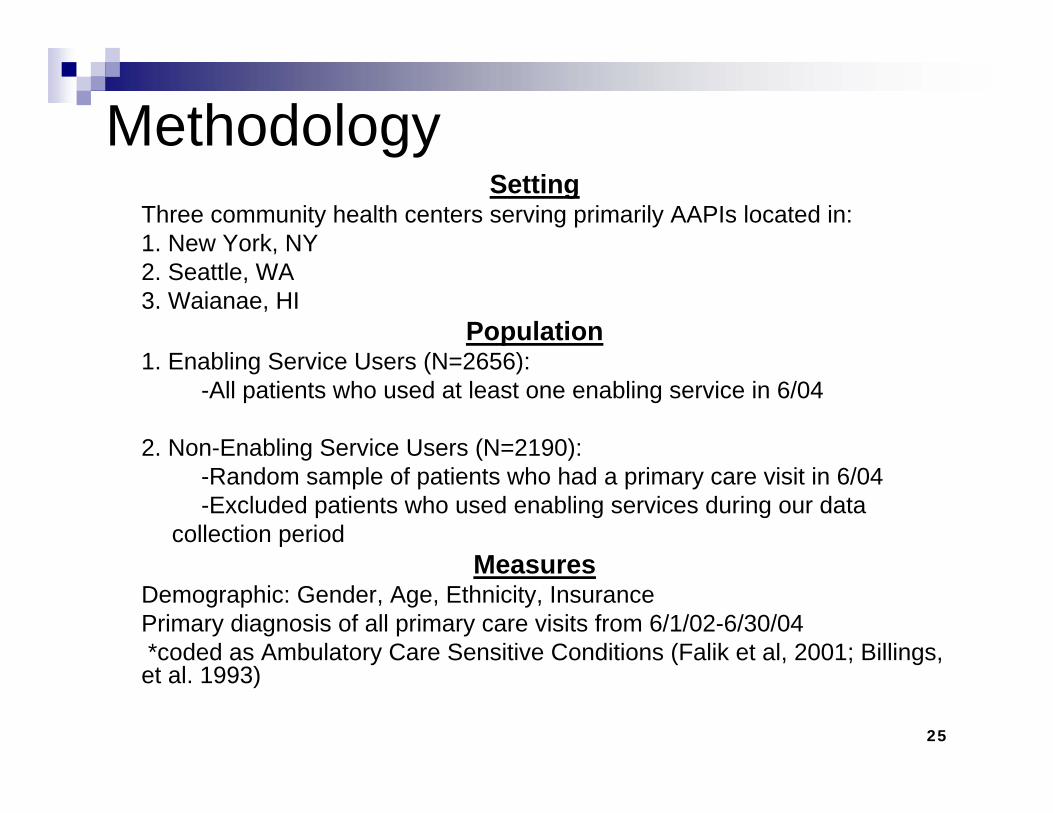
MethodologySetting
Three community health centers serving primarily AAPIs located in: 1. New York, NY2. Seattle, WA3. Waianae, HI
Population1. Enabling Service Users (N=2656):
-All patients who used at least one enabling service in 6/04
2. Non-Enabling Service Users (N=2190): -Random sample of patients who had a primary care visit in 6/04-Excluded patients who used enabling services during our data
collection periodMeasures
Demographic: Gender, Age, Ethnicity, InsurancePrimary diagnosis of all primary care visits from 6/1/02-6/30/04*coded as Ambulatory Care Sensitive Conditions (Falik et al, 2001; Billings, et al. 1993)
26
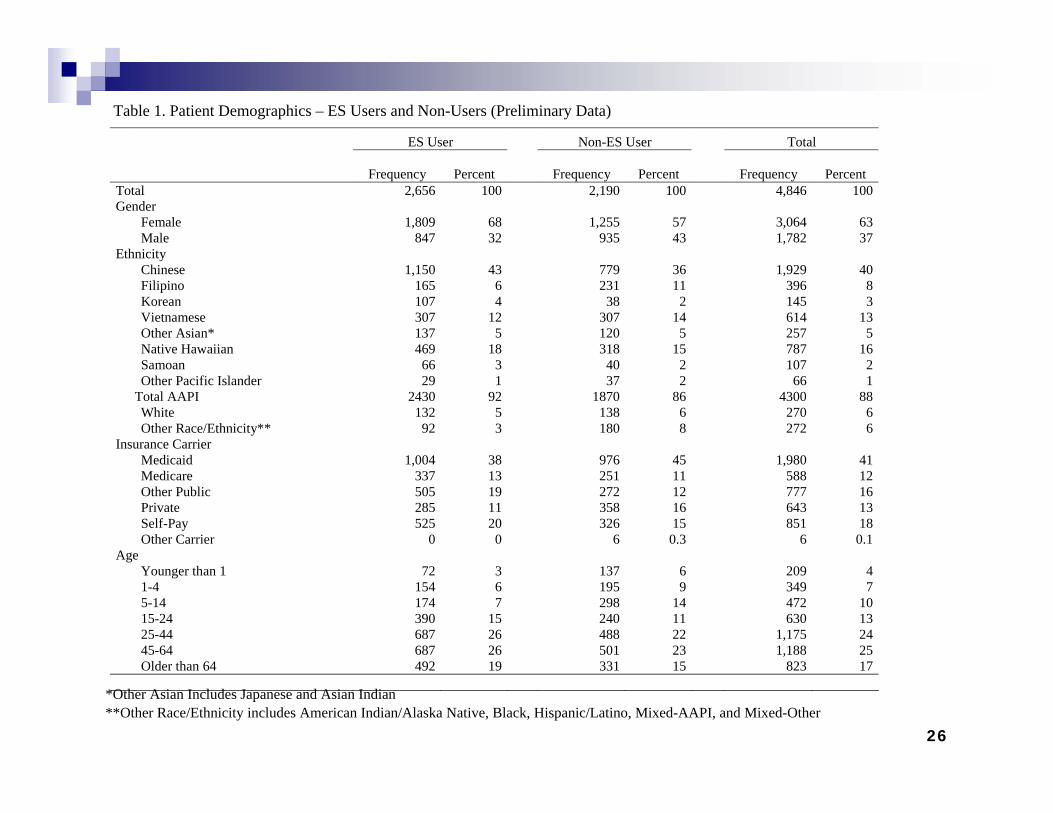
ES User Non-ES User Total Frequency Percent Frequency Percent Frequency Percent Total 2,656 100 2,190 100 4,846 100Gender Female 1,809 68 1,255 57 3,064 63 Male 847 32 935 43 1,782 37Ethnicity Chinese 1,150 43 779 36 1,929 40 Filipino 165 6 231 11 396 8 Korean 107 4 38 2 145 3 Vietnamese 307 12 307 14 614 13 Other Asian* 137 5 120 5 257 5 Native Hawaiian 469 18 318 15 787 16 Samoan 66 3 40 2 107 2 Other Pacific Islander 29 1 37 2 66 1 Total AAPI 2430 92 1870 86 4300 88 White 132 5 138 6 270 6 Other Race/Ethnicity** 92 3 180 8 272 6Insurance Carrier Medicaid 1,004 38 976 45 1,980 41 Medicare 337 13 251 11 588 12 Other Public 505 19 272 12 777 16 Private 285 11 358 16 643 13 Self-Pay 525 20 326 15 851 18 Other Carrier 0 0 6 0.3 6 0.1Age Younger than 1 72 3 137 6 209 4 1-4 154 6 195 9 349 7 5-14 174 7 298 14 472 10 15-24 390 15 240 11 630 13 25-44 687 26 488 22 1,175 24 45-64 687 26 501 23 1,188 25 Older than 64 492 19 331 15 823 17
*Other Asian Includes Japanese and Asian Indian**Other Race/Ethnicity includes American Indian/Alaska Native, Black, Hispanic/Latino, Mixed-AAPI, and Mixed-Other
Table 1. Patient Demographics – ES Users and Non-Users (Preliminary Data)
27
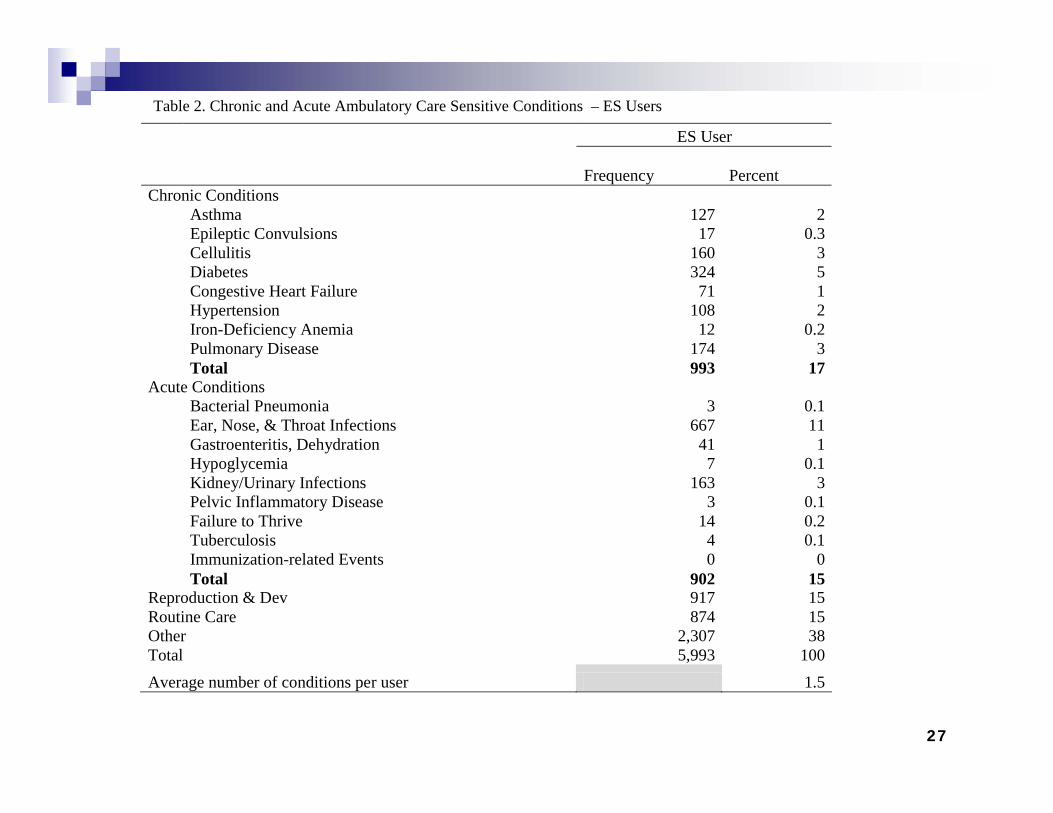
ES User Frequency Percent Chronic Conditions Asthma 127 2 Epileptic Convulsions 17 0.3 Cellulitis 160 3 Diabetes 324 5 Congestive Heart Failure 71 1 Hypertension 108 2 Iron-Deficiency Anemia 12 0.2 Pulmonary Disease 174 3 Total 993 17Acute Conditions Bacterial Pneumonia 3 0.1 Ear, Nose, & Throat Infections 667 11 Gastroenteritis, Dehydration 41 1 Hypoglycemia 7 0.1 Kidney/Urinary Infections 163 3 Pelvic Inflammatory Disease 3 0.1 Failure to Thrive 14 0.2 Tuberculosis 4 0.1 Immunization-related Events 0 0 Total 902 15Reproduction & Dev 917 15Routine Care 874 15Other 2,307 38Total 5,993 100Average number of conditions per user 1.5
Table 2. Chronic and Acute Ambulatory Care Sensitive Conditions – ES Users
28
Management Decisions
to allocate resources effectivelyto appeal for more fundingto improve servicesto target services
What can we do with the data? How can it be useful?
29
Future Studies
How to use the data in research studies:
To look at enabling services in more detail:Describe variation of servicesDetermine the nature of need for services
To look at the contribution of enabling services at health centers to quality care and reduction of health disparities
30
The ESAP Team
31
Thank you!
Our health center partnersBill Shanks, Hawaii Patient Accounting ServicesLinda Tran, AAPCHO
Funded by: Agency for Healthcare Research and Quality and MetLife Foundation (HP), Office of Minority Health and the California Wellness Foundation (RCW)


![ACCOUNTABILITY REPORT 2013 › ... › 01 › EDUCO-ACCOUNTABILITY-REPO… · Accountability report 2013 [3]](https://img.pdfslide.net/doc/110x75/5f03b5847e708231d40a62a8/accountability-report-2013-a-a-01-a-educo-accountability-repo-accountability.jpg)