Embed Size (px)
Citation preview

The Energy Balance of the Photovoltaic (PV) Industry: Is the PV industry a net electricity producer?
Michael Dale
GCEP Symposium 2012
October 11th
Outline:
• Background
• Energy inputs to PV manufacturing
• Dynamic net energy analysis
• Results
• Conclusions
2

Outline:
• Background
• Energy inputs to PV manufacturing
• Dynamic net energy analysis
• Results
• Conclusions
3
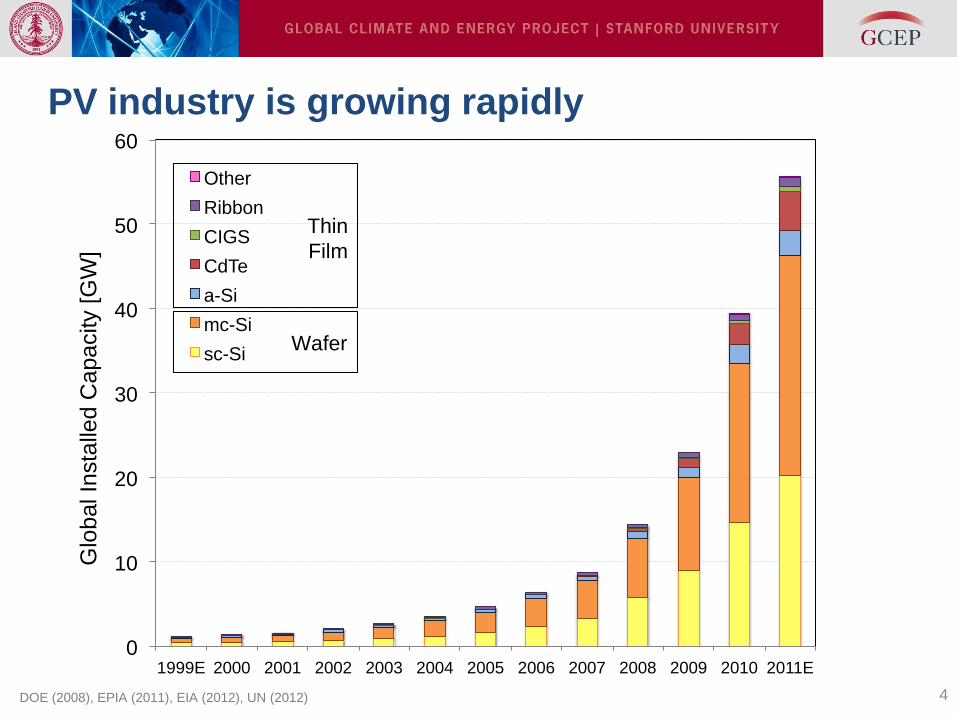
0
10
20
30
40
50
60
1999E 2000 2001 2002 2003 2004 2005 2006 2007 2008 2009 2010 2011E
Glo
ba
l In
sta
lled
Ca
pa
city [
GW
]
Other
Ribbon
CIGS
CdTe
a-Si
mc-Si
sc-Si
Thin
Film
Wafer
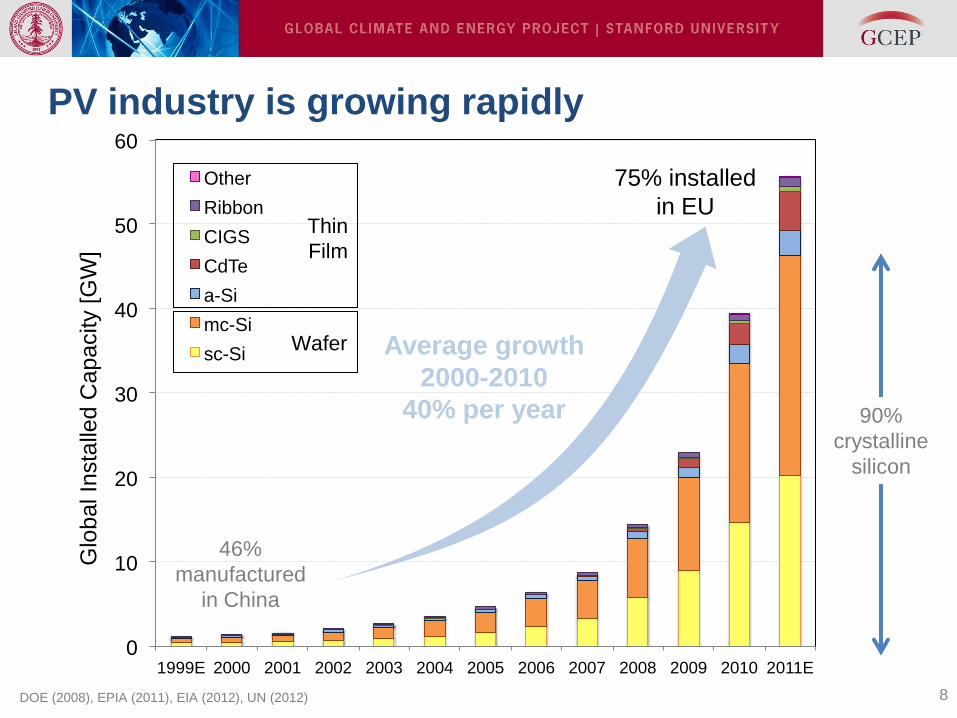
PV industry is growing rapidly
4 DOE (2008), EPIA (2011), EIA (2012), UN (2012)
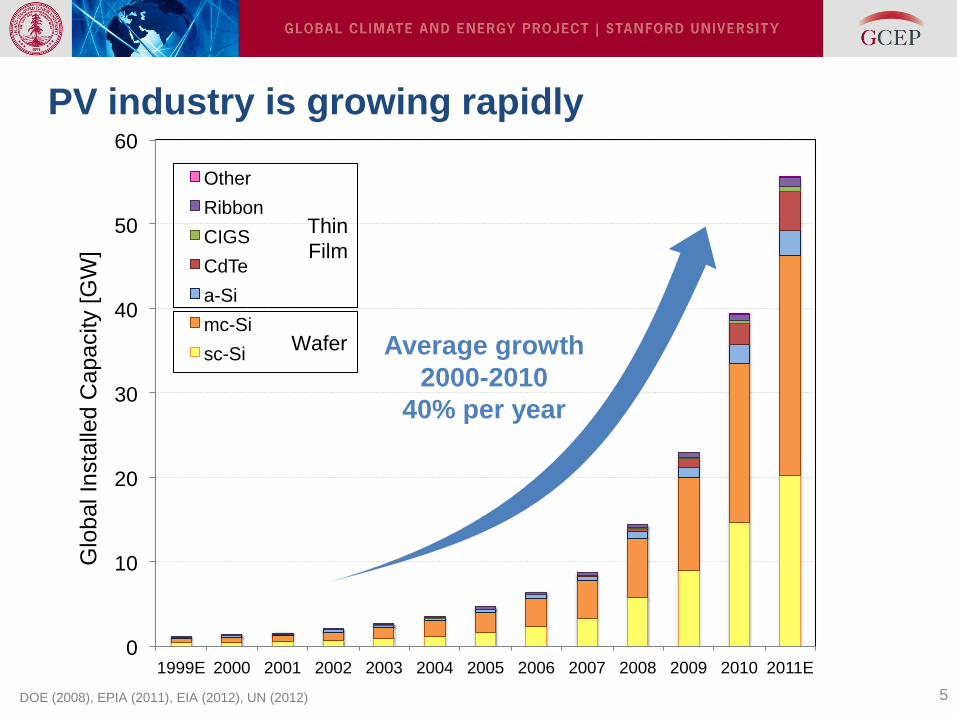
0
10
20
30
40
50
60
1999E 2000 2001 2002 2003 2004 2005 2006 2007 2008 2009 2010 2011E
Glo
ba
l In
sta
lled
Ca
pa
city [
GW
]
Other
Ribbon
CIGS
CdTe
a-Si
mc-Si
sc-Si
Thin
Film
Wafer
PV industry is growing rapidly
5
Average growth
2000-2010
40% per year
DOE (2008), EPIA (2011), EIA (2012), UN (2012)

0
10
20
30
40
50
60
1999E 2000 2001 2002 2003 2004 2005 2006 2007 2008 2009 2010 2011E
Glo
ba
l In
sta
lled
Ca
pa
city [
GW
]
Other
Ribbon
CIGS
CdTe
a-Si
mc-Si
sc-Si
Thin
Film
Wafer
PV industry is growing rapidly
6
Average growth
2000-2010
40% per year
DOE (2008), EPIA (2011), EIA (2012), UN (2012)
90%
crystalline
silicon

0
10
20
30
40
50
60
1999E 2000 2001 2002 2003 2004 2005 2006 2007 2008 2009 2010 2011E
Glo
ba
l In
sta
lled
Ca
pa
city [
GW
]
Other
Ribbon
CIGS
CdTe
a-Si
mc-Si
sc-Si
Thin
Film
Wafer
PV industry is growing rapidly
7 DOE (2008), EPIA (2011), EIA (2012), UN (2012)
90%
crystalline
silicon
46%
manufactured
in China
Average growth
2000-2010
40% per year
0
10
20
30
40
50
60
1999E 2000 2001 2002 2003 2004 2005 2006 2007 2008 2009 2010 2011E
Glo
ba
l In
sta
lled
Ca
pa
city [
GW
]
Other
Ribbon
CIGS
CdTe
a-Si
mc-Si
sc-Si
Thin
Film
Wafer
PV industry is growing rapidly
8 DOE (2008), EPIA (2011), EIA (2012), UN (2012)
90%
crystalline
silicon
75% installed
in EU
46%
manufactured
in China
Average growth
2000-2010
40% per year
Outline:
• Background
• Energy inputs to PV manufacturing
• Dynamic net energy analysis
• Results
• Conclusions
9
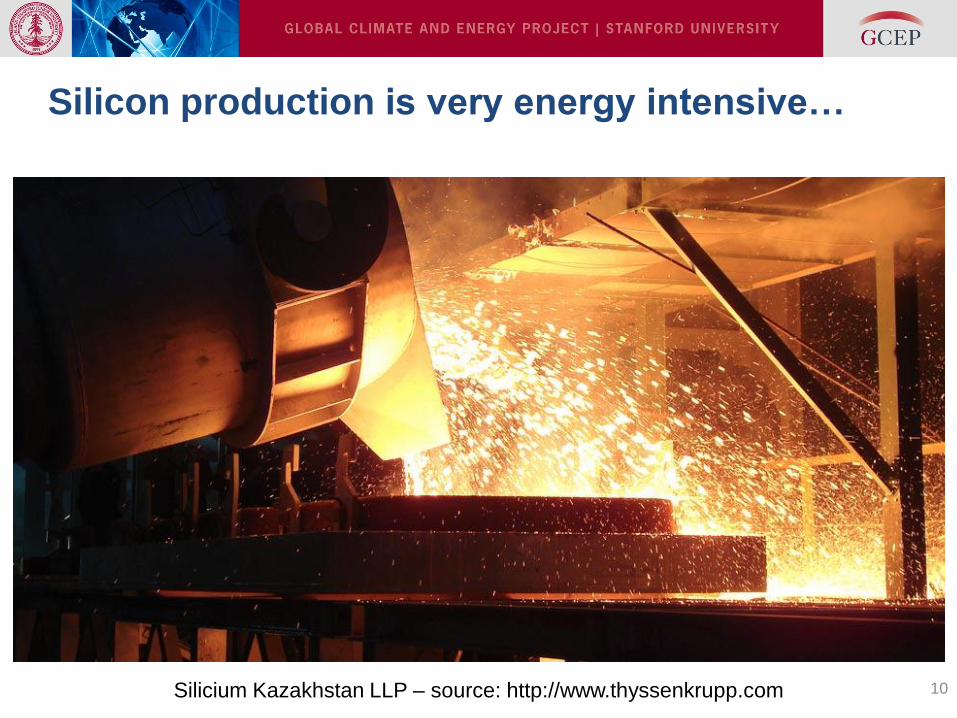
Silicon production is very energy intensive…
10 Silicium Kazakhstan LLP – source: http://www.thyssenkrupp.com

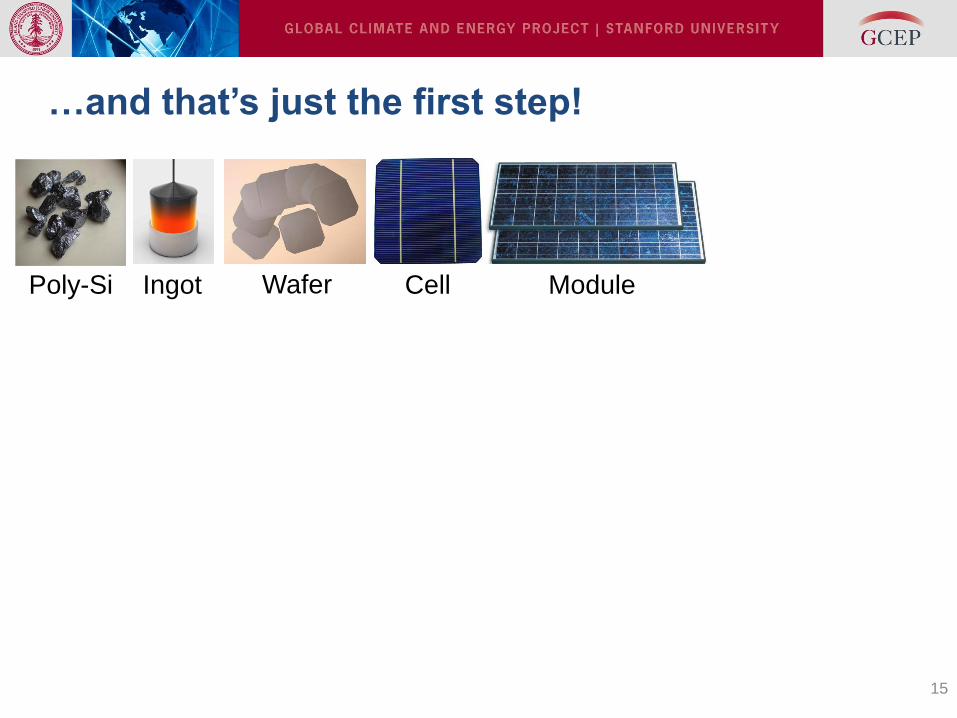
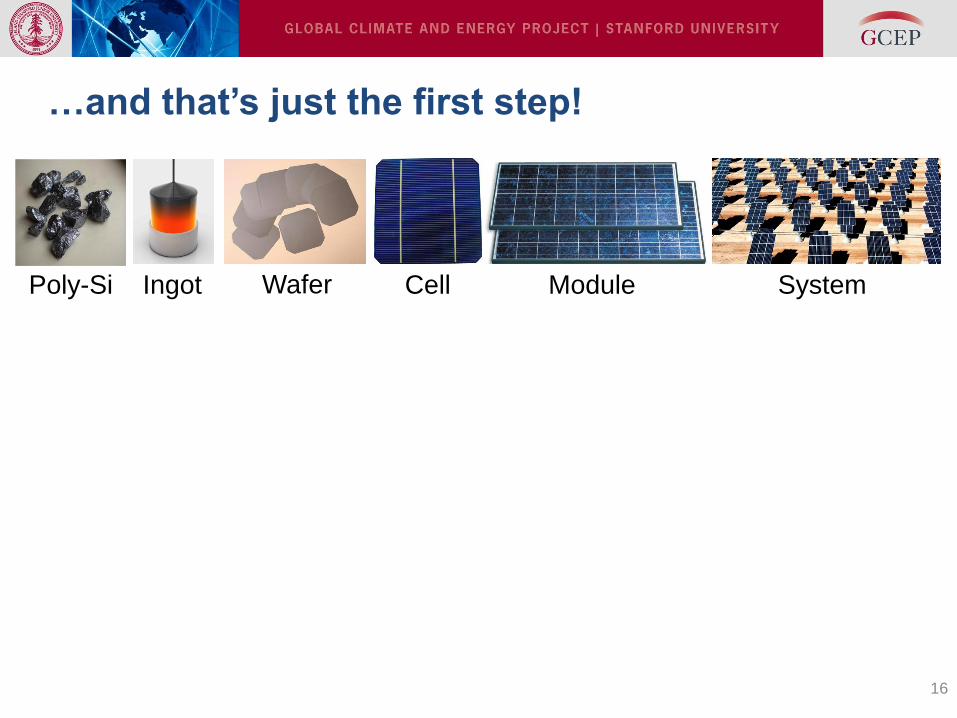
…and that’s just the first step!
11
Poly-Si

…and that’s just the first step!
12
Poly-Si Ingot
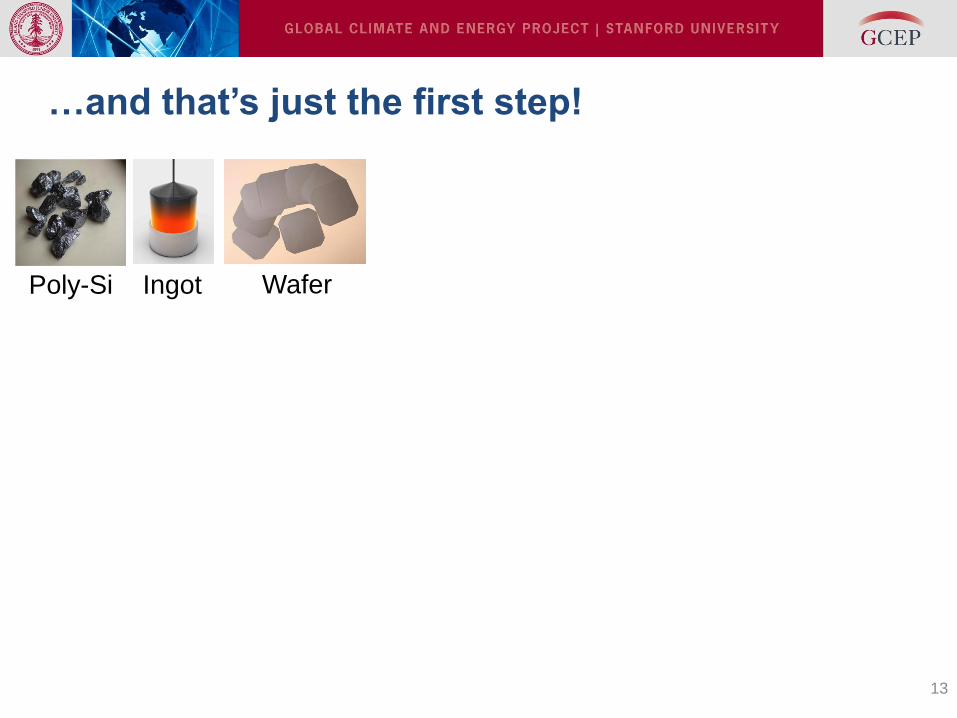
…and that’s just the first step!
13
Poly-Si Ingot Wafer
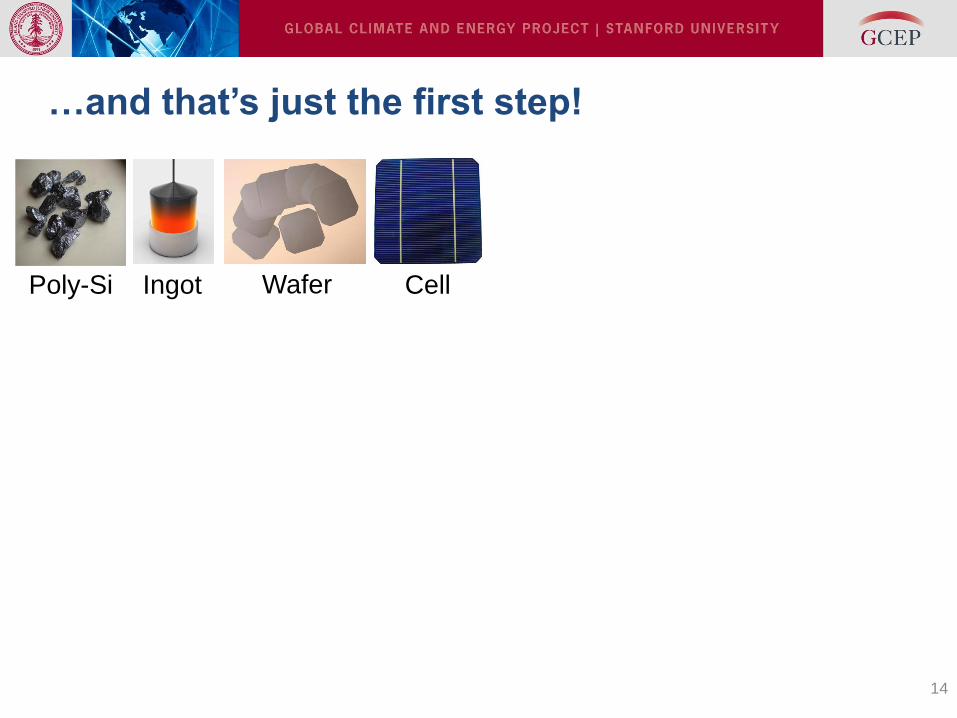
…and that’s just the first step!
14
Poly-Si Ingot Wafer Cell
…and that’s just the first step!
15
Poly-Si Ingot Wafer Cell Module
…and that’s just the first step!
16
Poly-Si Ingot Wafer Cell Module System

…and that’s just the first step!
17
Financial costs ≠ energy costs
Polysilicon
12 %
Ingot
6 %
Wafer
9 %
Solar cell
14 %
Solar panel
25 %
System
34 %
Polysilicon
21 %
Ingot & Wafer
36 %
Solar cell
11 %
Solar panel
19 %
System
13 %
FINANCIAL COST
ENERGY COST
Poly-Si Ingot Wafer Cell Panel System
Swanson
(2011)

…and that’s just the first step!
18
Financial costs ≠ energy costs
Polysilicon
12 %
Ingot
6 %
Wafer
9 %
Solar cell
14 %
Solar panel
25 %
System
34 %
Polysilicon
21 %
Ingot & Wafer
36 %
Solar cell
11 %
Solar panel
19 %
System
13 %
FINANCIAL COST
ENERGY COST
Poly-Si Ingot Wafer Cell Panel System
Swanson
(2011)
Alsema (2011)
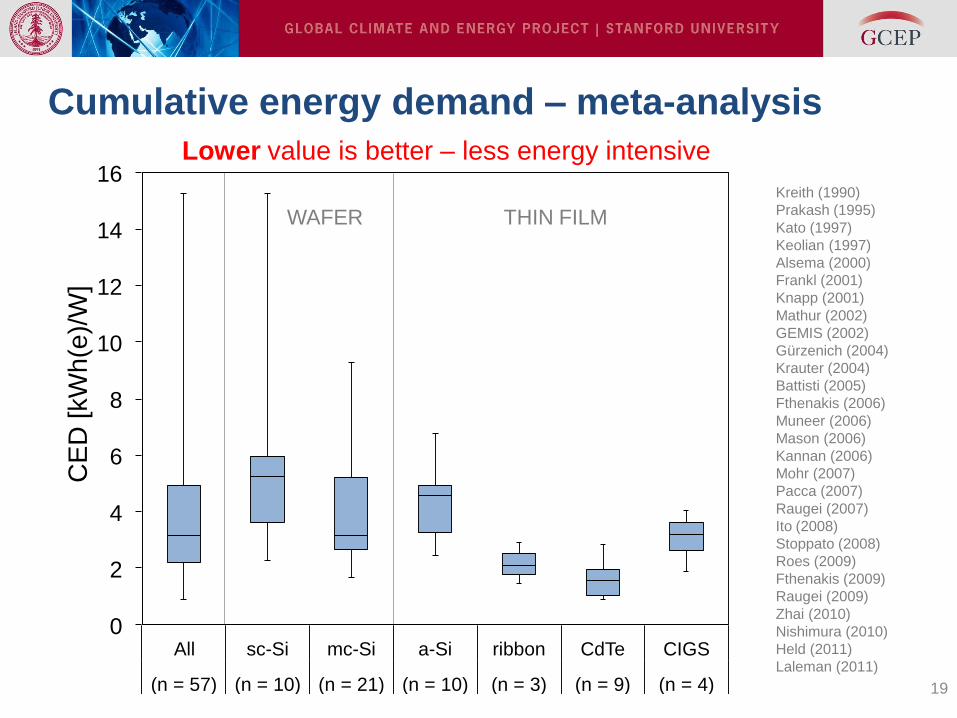
Cumulative energy demand – meta-analysis
19
Kreith (1990)
Prakash (1995)
Kato (1997)
Keolian (1997)
Alsema (2000)
Frankl (2001)
Knapp (2001)
Mathur (2002)
GEMIS (2002)
Gürzenich (2004)
Krauter (2004)
Battisti (2005)
Fthenakis (2006)
Muneer (2006)
Mason (2006)
Kannan (2006)
Mohr (2007)
Pacca (2007)
Raugei (2007)
Ito (2008)
Stoppato (2008)
Roes (2009)
Fthenakis (2009)
Raugei (2009)
Zhai (2010)
Nishimura (2010)
Held (2011)
Laleman (2011)
0
2
4
6
8
10
12
14
16
All sc-Si mc-Si a-Si ribbon CdTe CIGS
(n = 57) (n = 10) (n = 21) (n = 10) (n = 3) (n = 9) (n = 4)
CE
D [kW
h(e
)/W
]
Lower value is better – less energy intensive
WAFER THIN FILM

Energy inputs to PV – energy learning curves
20
Learning is
reducing
energy cost of
PV systems
101100 103102 105104
101100 103102 105104
101100 103102 105104
101100 103102 105104
0.1
1
10
100
0.1
1
10
100
0.1
1
10
100
0.1
1
10
100
THIN FILM
sc-Si
mc-Si
a-Si
CdTe
Em
bo
die
d E
ne
rgy [kW
he/W
p]
Cumulative Production [MW]
WAFER
CE
D [kW
h(e
)/W
]

Outline:
• Background
• Energy inputs to PV manufacturing
• Dynamic net energy analysis
• Results
• Conclusions
21
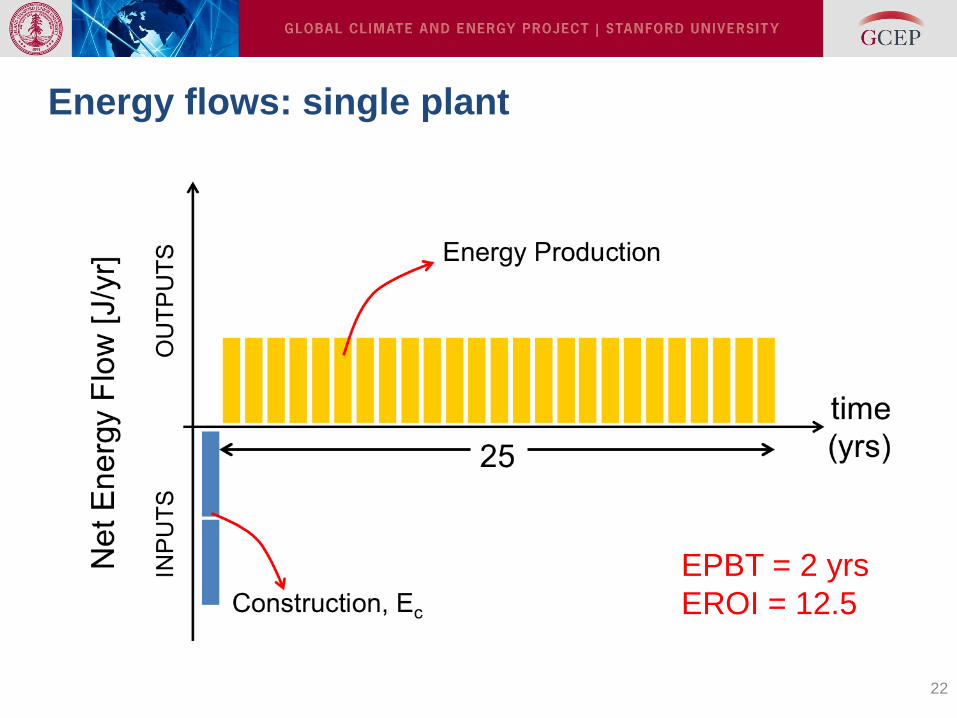
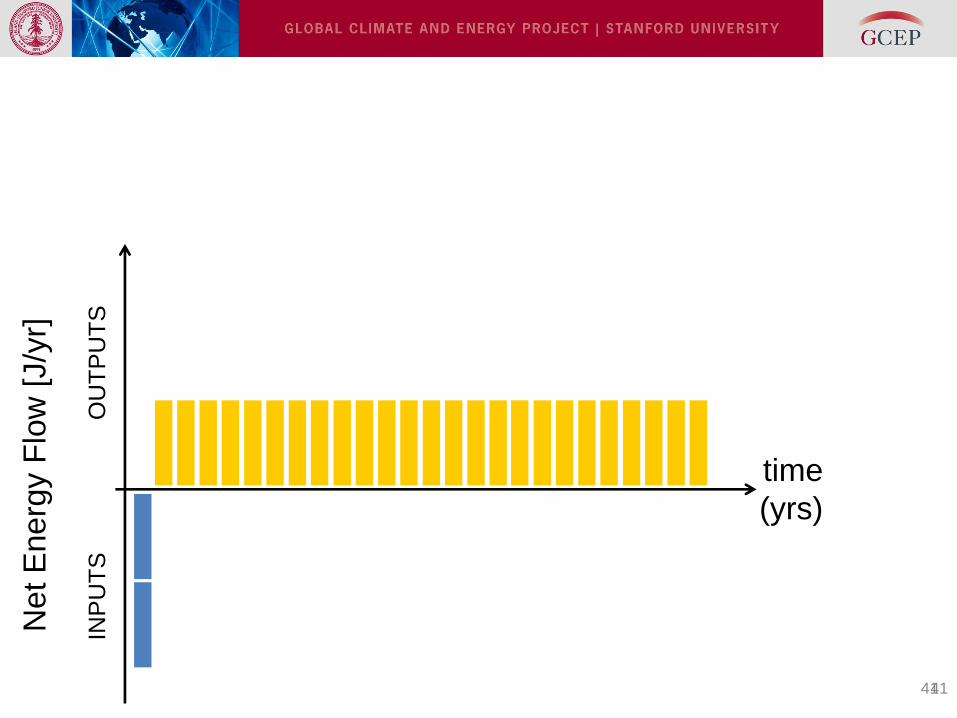
Energy flows: single plant
22
EPBT = 2 yrs
EROI = 12.5

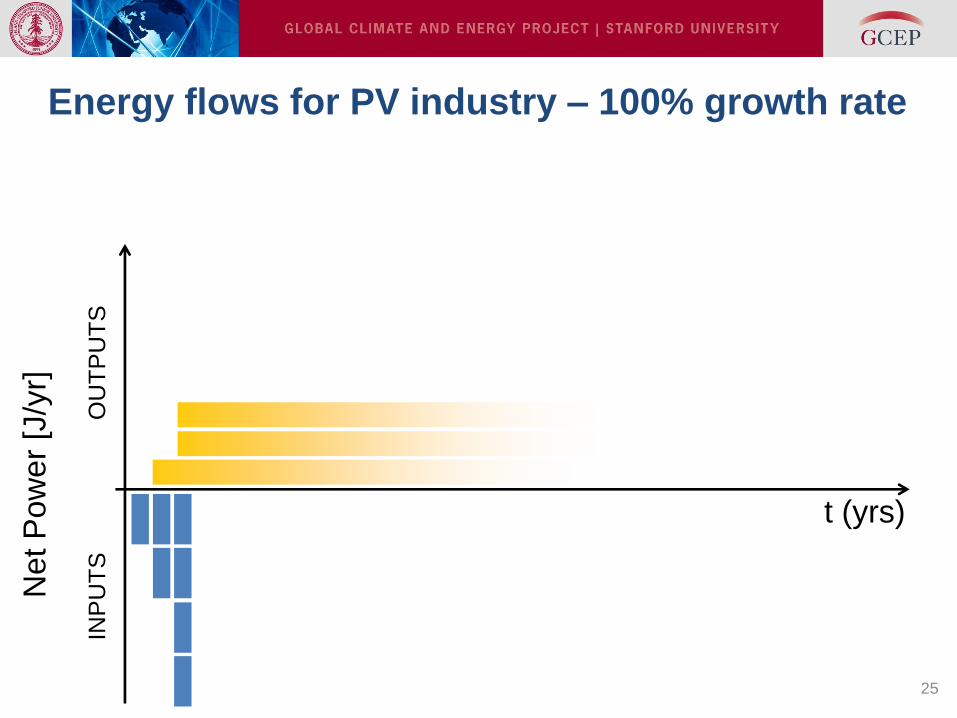
Energy flows for PV industry – 100% growth rate
23
INP
UT
S
OU
TP
UT
S
t (yrs)
Net P
ow
er
[J/y
r]

Energy flows for PV industry – 100% growth rate
24
INP
UT
S
OU
TP
UT
S
t (yrs)
Net P
ow
er
[J/y
r]
Energy flows for PV industry – 100% growth rate
25
INP
UT
S
OU
TP
UT
S
t (yrs)
Net P
ow
er
[J/y
r]
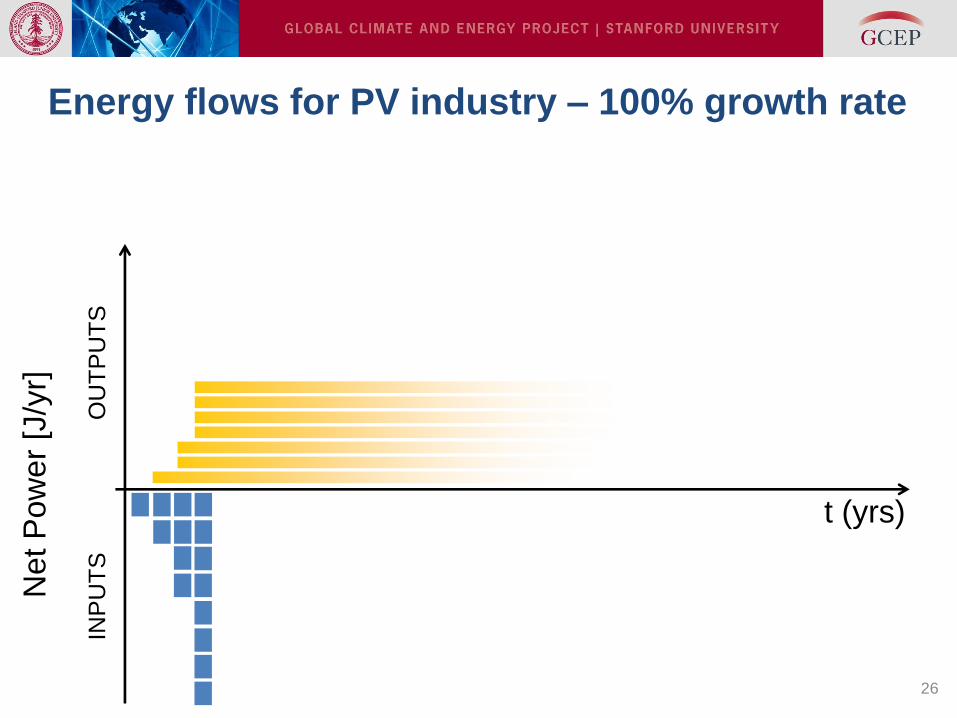
Energy flows for PV industry – 100% growth rate
26
INP
UT
S
OU
TP
UT
S
t (yrs)
Net P
ow
er
[J/y
r]

Energy flows for PV industry – 100% growth rate
27
INP
UT
S
OU
TP
UT
S
t (yrs)
Net P
ow
er
[J/y
r]
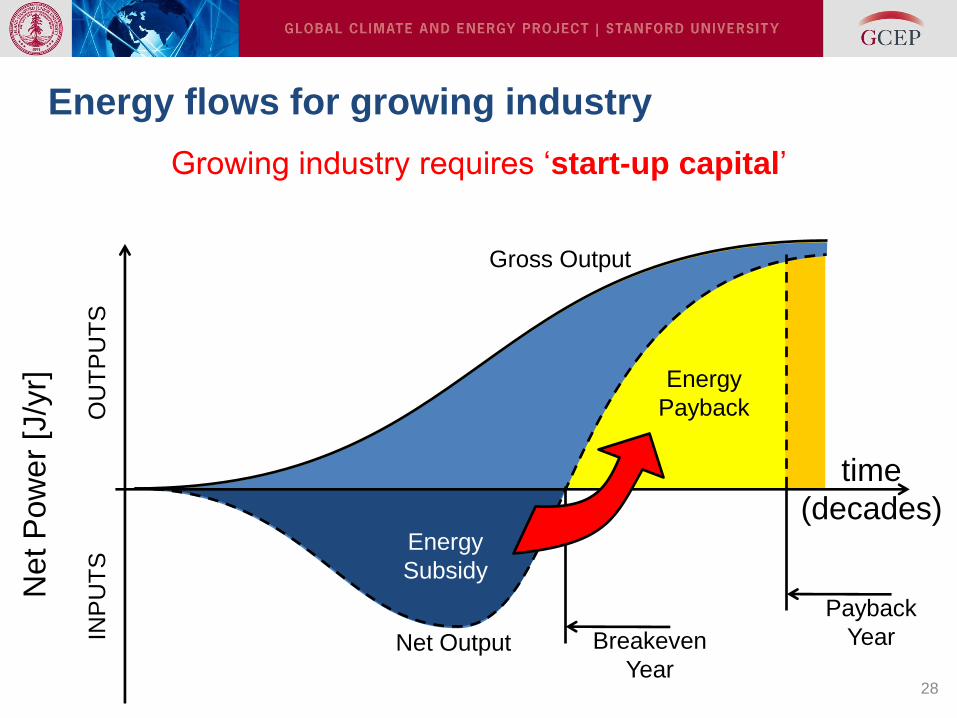
Energy flows for growing industry
28
Energy
Subsidy
Energy
Payback
Payback
Year
Gross Output
Net Output
Net P
ow
er
[J/y
r]
INP
UT
S
OU
TP
UT
S
time
(decades)
Growing industry requires ‘start-up capital’
Breakeven
Year

1 10
10
100
1 10
Cumulative Electricity Demand [kWhe/Wp]
Gro
wth
Ra
te [
%/y
r]
EPBT [yrs] assuming 11.5% capacity factor
70 %
300 %
400 %
fractional re-investment 20 %
NEGATIVE NET ENERGY YIELD
80 %
90 %
100 %
250 %
30 %
40 %
50 %
POSITIVE NET ENERGY YIELD
500 %
700 %
60 %
125 %
20
40
60
80
2 8
150 %
175 %
200 %
4 5 3 9 7 6
2 84 5 3 9 7 6
30
50
Growing industry may be a net energy sink
29
ENERGY
DEFICIT
ENERGY
SURPLUS

Outline:
• Background
• Energy inputs to PV manufacturing
• Dynamic net energy analysis
• Results
• Conclusions
30
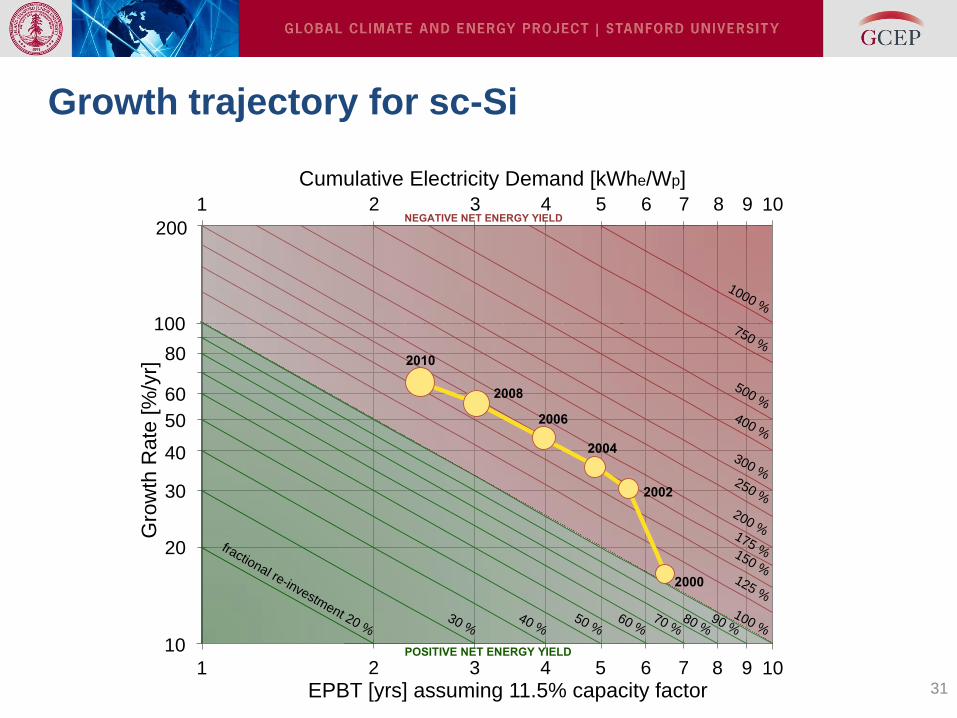
Growth trajectory for sc-Si
31
1 10
10
100
1 10
Cumulative Electricity Demand [kWhe/Wp]
Gro
wth
Ra
te [
%/y
r]
EPBT [yrs] assuming 11.5% capacity factor
70 %
fractional re-investment 20 %
NEGATIVE NET ENERGY YIELD
80 % 90 %
100 % 30 %
40 % 50 %
POSITIVE NET ENERGY YIELD
60 %
125 %
20
40
60
80
2 8
150 %
175 %
200 %
4 5 3 9 7 6
2 84 5 3 9 7 6
30
50
250 %
300 %
200
400 %
500 %
1000 %
750 %
2000
2002
2004
2006
2008
2010
1 10
10
100
1 10
Cumulative Electricity Demand [kWhe/Wp]
Gro
wth
Ra
te [
%/y
r]
EPBT [yrs] assuming 11.5% capacity factor
70 %
fractional re-investment 20 %
NEGATIVE NET ENERGY YIELD
80 % 90 %
100 % 30 %
40 % 50 %
POSITIVE NET ENERGY YIELD
60 %
125 %
20
40
60
80
2 8
150 %
175 %
200 %
4 5 3 9 7 6
2 84 5 3 9 7 6
30
50
250 %
300 %
200
400 %
500 %
1000 %
750 %
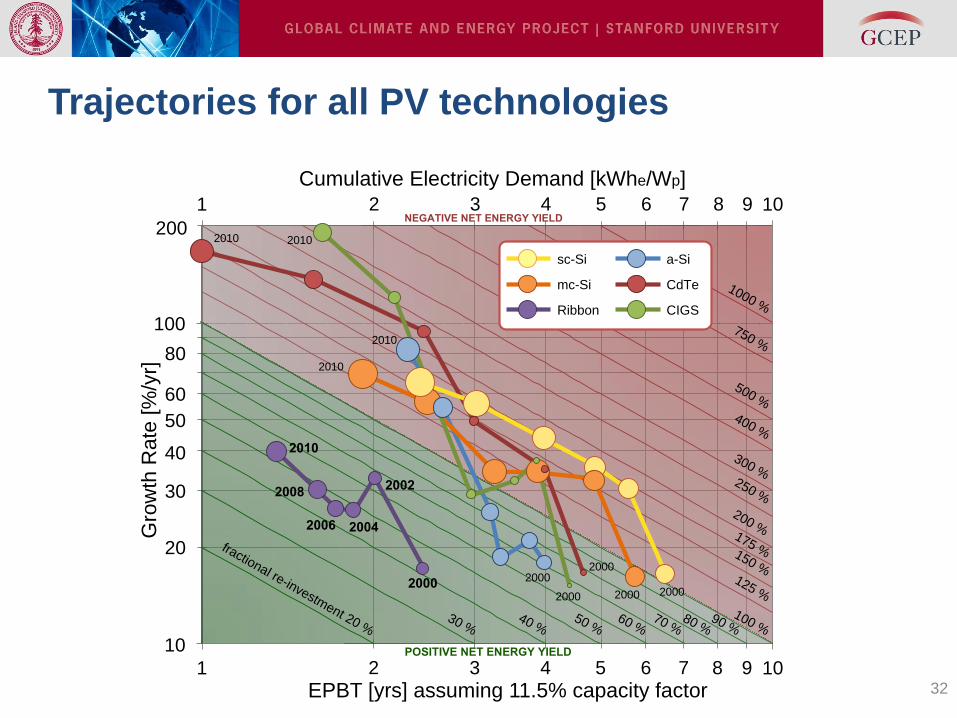
mc-Si
Ribbon
sc-Si
CdTe
CIGS
a-Si
2000
2002
2004 2006
2008
2000 2000 2000
2000 2000
2010
2010
2010 2010
2010
Trajectories for all PV technologies
32

Growth trajectory for the PV industry
33
1 10
10
100
1 10
Cumulative Electricity Demand [kWhe/Wp]
Gro
wth
Ra
te [
%/y
r]
EPBT [yrs] assuming 11.5% capacity factor
70 %
300 %
400 %
fractional re-investment 20 %
NEGATIVE NET ENERGY YIELD
80 %
90 %
100 %
250 %
30 %
40 %
50 %
POSITIVE NET ENERGY YIELD
500 %
700 %
60 %
125 %
20
40
60
80
2 8
150 %
175 %
200 %
4 5 3 9 7 6
2 84 5 3 9 7 6
30
50
2000
2010
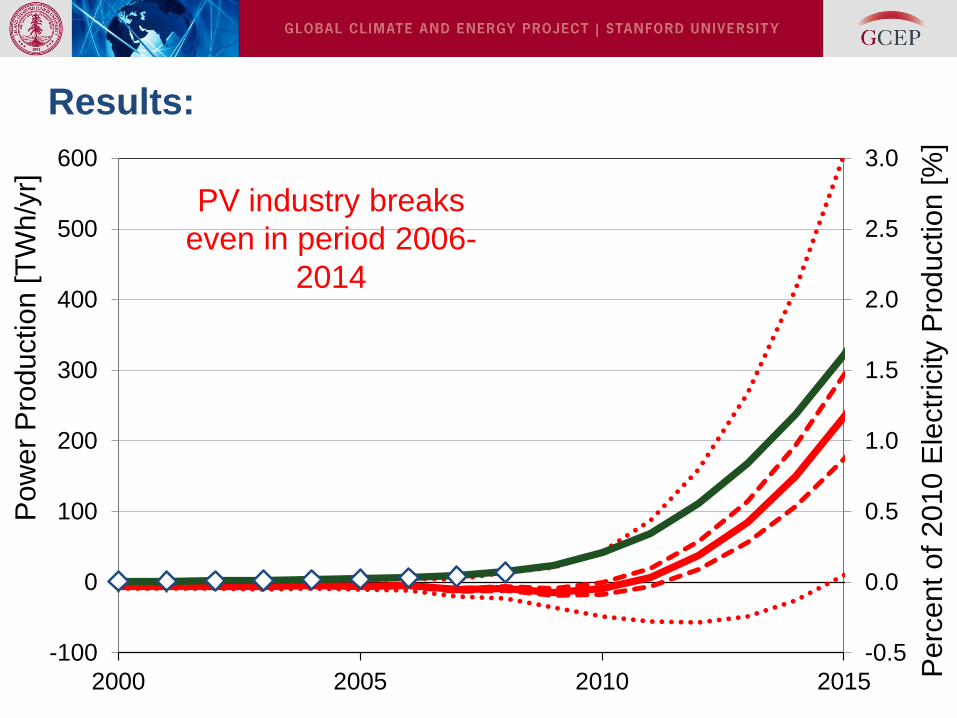
Results:
34
-0.5
0.0
0.5
1.0
1.5
2.0
2.5
3.0
-100
0
100
200
300
400
500
600
2000 2005 2010 2015
Perc
ent of 2010 E
lectr
icity P
roduction [
%]
Pow
er
Pro
duction [
TW
h/y
r]
PV industry breaks
even in period 2006-
2014

Outline:
• Background
• Energy inputs to PV manufacturing
• Dynamic net energy analysis
• Results
• Conclusions
35
Conclusions
• The PV industry is now likely (>50%) to be a net
electricity provider.
• The PV industry almost certainly become a net power
provider by 2015.
• The industry will ‘pay back’ the electricity consumed in its
early growth between by 2018.
• Even in our ‘worst-case’ scenario, GHG emissions
breakeven lags electricity breakeven by 3 years.
36
Implications
• Not all financial cost reductions lead to reductions in
embodied energy
Economic analysis should be supplemented with energy
analysis
• PV systems with lower energy costs provide more net
energy
These systems will also cost less money
Have lower associated GHG emissions
37
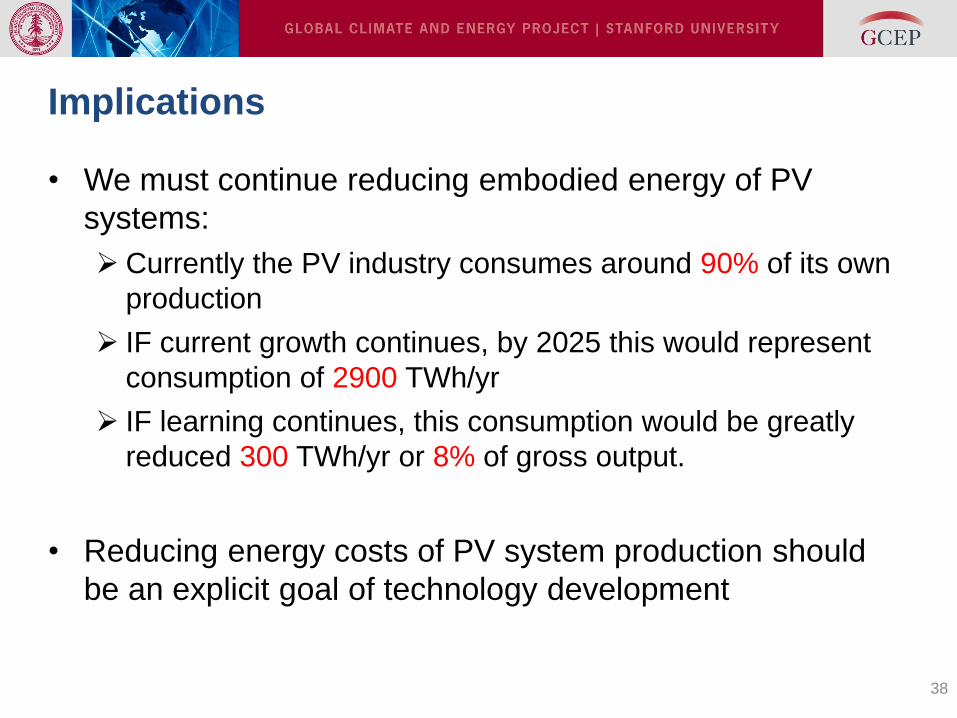
Implications
• We must continue reducing embodied energy of PV
systems:
Currently the PV industry consumes around 90% of its own
production
IF current growth continues, by 2025 this would represent
consumption of 2900 TWh/yr
IF learning continues, this consumption would be greatly
reduced 300 TWh/yr or 8% of gross output.
• Reducing energy costs of PV system production should
be an explicit goal of technology development
38

Acknowledgements:
• Thanks to GCEP for funding this research;
• Thanks to Prof. Sally Benson, Dr. Richard Sassoon, Prof.
Adam Brandt and Dr. Charles Barnhart for very fruitful and
enlivening discussions;
• Thanks to Prof. Mike McGehee, Dr. Jenny Milne, Patricia
Carbajales, Leigh Johnson, Mark Golden and Maxine Lym
for very helpful comments;
• Thanks to you for listening…
… any questions?
39
References:
• EPIA, (2010) Solar Generation 6, European Photovoltaic
Industry Association
• Swanson, R. (2011) The Silicon Photovoltaic Roadmap
,Stanford Energy Seminar Nov 14, 2011,
http://energyseminar.stanford.edu/
• EIA, International Energy Statistics (2012).
• UN, UN Energy Statistics Database (2012).
40
41 41
INP
UT
S
OU
TP
UT
S
time
(yrs)
Net E
nerg
y F
low
[J/y
r]
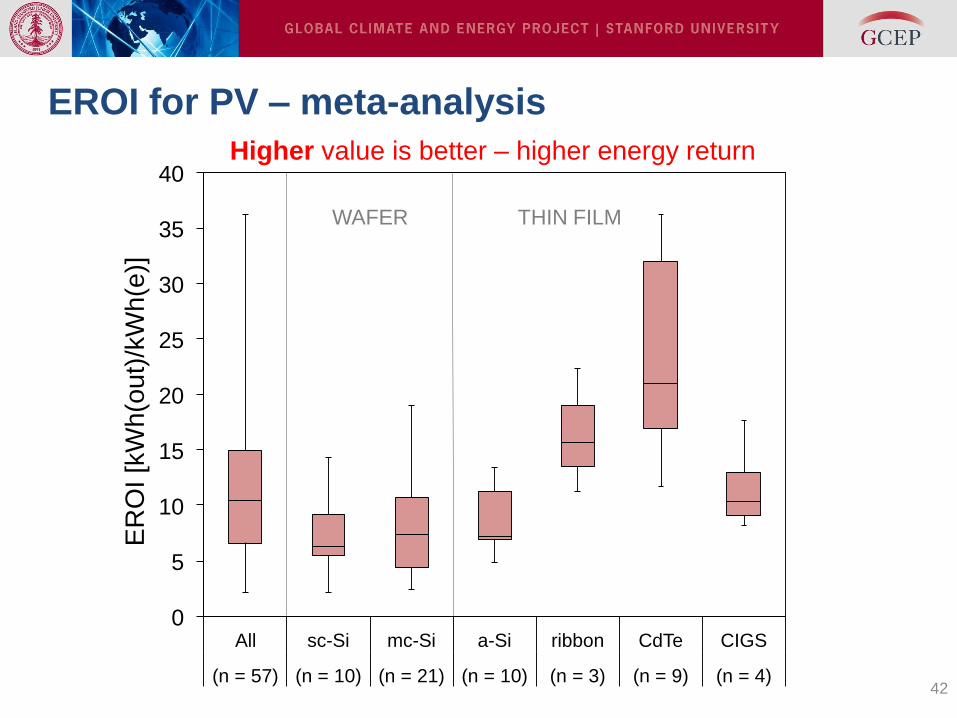
EROI for PV – meta-analysis
42
0
5
10
15
20
25
30
35
40
All sc-Si mc-Si a-Si ribbon CdTe CIGS
(n = 57) (n = 10) (n = 21) (n = 10) (n = 3) (n = 9) (n = 4)
ER
OI
[kW
h(o
ut)
/kW
h(e
)]
Higher value is better – higher energy return
WAFER THIN FILM

Energy payback time (EPBT) PV – meta-analysis
43
0
2
4
6
8
10
12
All sc-Si mc-Si a-Si ribbon CdTe CIGS
(n = 57) (n = 10) (n = 21) (n = 10) (n = 3) (n = 9) (n = 4)
EP
BT
(yrs
) Lower value is better – faster energy return
WAFER THIN FILM
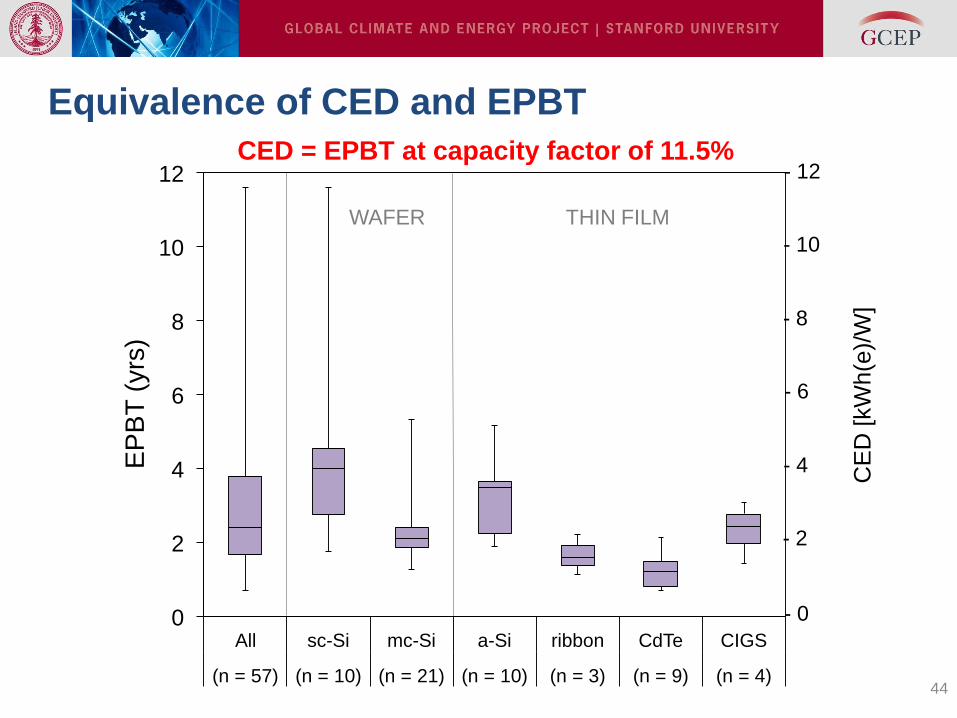
Equivalence of CED and EPBT
44
0
2
4
6
8
10
12
All sc-Si mc-Si a-Si ribbon CdTe CIGS
(n = 57) (n = 10) (n = 21) (n = 10) (n = 3) (n = 9) (n = 4)
EP
BT
(yrs
) CED = EPBT at capacity factor of 11.5%
CE
D [
kW
h(e
)/W
]
- 12
- 10
- 8
- 6
- 4
- 2
- 0
WAFER THIN FILM
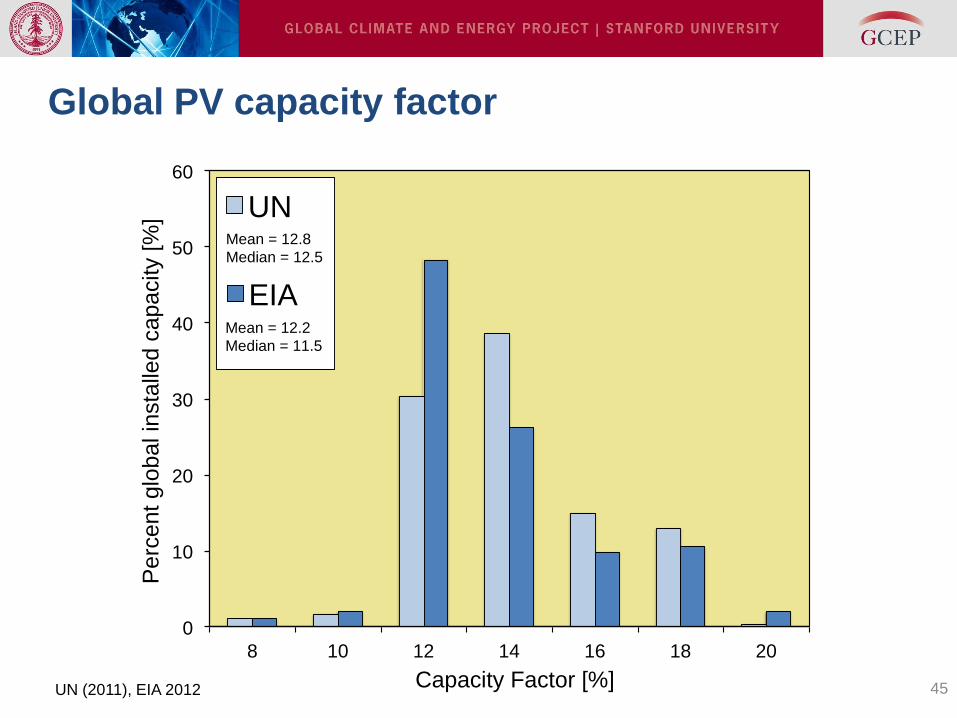
0
10
20
30
40
50
60
8 10 12 14 16 18 20
Perc
ent
glo
ba
l in
sta
lled
ca
pa
city [
%]
Capacity Factor [%]
Mean = 12.8
Median = 12.5
UN
Mean = 12.2
Median = 11.5
EIA
Global PV capacity factor
45 UN (2011), EIA 2012