Embed Size (px)
Citation preview

THE ENGINEERING PROFESSION
A Statistical Overview, Thirteenth Edition
February 2017
THE ENGINEERING PROFESSION: A STATISTICAL OVERVIEW,
Thirteenth Edition, February 2017
ISBN 978-1-925627-06-0
Author: Andre Kaspura
© Institution of Engineers Australia 2017
All rights reserved. Other than brief extracts, no part of this publication may be reproduced in any form without the
written consent of the publisher. The report can be downloaded at www.engineersaustralia.org.au
Public Affairs
Engineers Australia
11 National Circuit, Barton ACT 2600
Tel: 02 6270 6555
Email: [email protected]
www.engineersaustralia.org.au
Engineers Australia
THE ENGINEERING PROFESSION 3
Contents
Chapter 1: Introduction ....................................................................................................................................................................... 5
Main Points ..................................................................................................................................................................................... 5
1.1 Objective of the statistical overview .............................................................................................................................. 5
1.2 Engineers and engineering ................................................................................................................................................ 5
1.3 The engineering team ........................................................................................................................................................ 6
1.4 Competent practicing engineers ...................................................................................................................................... 7
1.5 What’s new in this edition? .............................................................................................................................................. 8
Chapter 2: A longitudinal perspective of engineers ..................................................................................................................... 10
Main Points ...................................................................................................................................................................................10
2.1 Objective, data and methodology .................................................................................................................................10
2.2 How does ACLD for 2006 compare to mainstream census statistics? ..................................................................12
2.3 Changes in labour market status of engineers ............................................................................................................12
2.4 Mobility and industries ....................................................................................................................................................17
2.5 Mobility of engineers in “engineering intense” industries ........................................................................................20
Chapter 3: The engineering labour force over time ..................................................................................................................... 27
Main Points ...................................................................................................................................................................................27
3.1 Objective and methodology ...........................................................................................................................................27
3.2 The supply of engineers ..................................................................................................................................................28
3.3 The demand for of engineers .........................................................................................................................................30
3.4 The underlying situation in 2016...................................................................................................................................31
3.5 Women engineers.............................................................................................................................................................32
3.6 Changing the age basis in the Education and Work Survey ....................................................................................33
Chapter 4: The transition to engineering education .................................................................................................................... 35
Main Points ...................................................................................................................................................................................35
4.1 Science and mathematics studies at school ................................................................................................................35
4.2 Retention to year 12 is critical .......................................................................................................................................40
4.3 Admission to university engineering courses ..............................................................................................................42
Chapter 5: Engineering education ................................................................................................................................................... 47
Main Points ...................................................................................................................................................................................47
5.1 Domestic students ............................................................................................................................................................47
5.2 Overseas students ............................................................................................................................................................51
5.3 Distribution by State and Territory ...............................................................................................................................54
Engineers Australia
THE ENGINEERING PROFESSION 4
Chapter 6: Domestic completions and the supply of engineers ................................................................................................ 56
Main Points ...................................................................................................................................................................................56
6.1 Introduction .......................................................................................................................................................................56
6.2 The experiences of new graduates ...............................................................................................................................58
6.3 Three year degrees in engineering ................................................................................................................................60
6.4 Four year degrees in engineering ..................................................................................................................................60
6.5 Degree qualifications in engineering overall ...............................................................................................................63
6.6 Associate qualifications in engineering ........................................................................................................................64
6.7 Engineering education and the supply of engineers ..................................................................................................65
Chapter 7: Skilled migration and the supply of engineers ........................................................................................................... 67
Main Points ...................................................................................................................................................................................67
7.1 Skilled migration policy ....................................................................................................................................................67
7.2 Migration skills assessment ............................................................................................................................................68
7.3 Skilled migration trends ...................................................................................................................................................69
7.4 Permanent migration .......................................................................................................................................................71
7.5 Temporary migration........................................................................................................................................................74
7.6 Skilled migration, education outcomes and the supply of engineers .....................................................................75
Chapter 8: Age, skill levels and salaries .......................................................................................................................................... 77
Main Points ...................................................................................................................................................................................77
8.1 How we treat these issues ..............................................................................................................................................77
8.2 Experience of professional engineers ...........................................................................................................................79
8.3 Age of professional engineers ........................................................................................................................................79
8.4 Remuneration of professional engineers .....................................................................................................................82
Chapter 9: Some further indicators of the status of the engineering labour market ............................................................. 85
Main Points ...................................................................................................................................................................................85
9.1 Trends in engineering construction ..............................................................................................................................85
9.2 Trends in vacancies for engineers .................................................................................................................................88
Chapter 10: The engineering labour market in 2017 ................................................................................................................... 90
Main Points ...................................................................................................................................................................................90
10.1 Overview ............................................................................................................................................................................90
10.2 The year ahead ..................................................................................................................................................................91
Engineers Australia
THE ENGINEERING PROFESSION 5
Chapter 1: Introduction
Main Points The Statistical Overview assembles statistics about engineers from a variety of official sources and from some unofficial sources to build an evidence base for public policy about engineers and engineering.
Engineers are a small, but indispensable, component of Australia’s labour force because the skills and expertise of engineers are unique and embodied in practically every good or service used in the Australian economy.
1.1 Objective of the statistical overview
The purpose of Engineers Australia is to advance the science and practice of engineering for the benefit of the community. Engineers Australia sets and maintains professional standards for its members consistent with international benchmarks, encourages the development of engineering knowledge and competencies, facilitates the exchange of ideas and information and informs community leaders and decision makers about engineers and engineering issues.
To facilitate the achievement of its purpose, especially in so far as it involves public advocacy, it is important to underpin policies and analyses with the best factual information available. Over the years, the Statistical Overview has sought to contribute to an understanding of Australia’s engineering profession by compiling statistics about engineers in Australia. The Statistical Overview fills a gap created by the fragmented nature of Australian statistics as they relate to specific professions and occupational groups.
High quality statistics to assist labour market policy decisions at macroeconomic level have been available for many decades. The focus on macroeconomics and resource constraints on collecting agencies have meant that statistics for professions and most occupational groups are fragmented and often unreliable. This has particularly been the case for groups that require specific educational qualifications. In 2015, the Australian Bureau of Statistics (ABS) recognised these problems and introduced changes into the Labour Force Survey (LFS) to overcome them. This is a positive development, but it will take a number of years to elapse to build useful time series statistics. Even then, there will be limits to the information available from the LFS and recourse to other information sources will remain necessary.
The approach adopted in the Statistical Overview is to apply the formal statistical classification systems used by the ABS and official statistics as far as possible. All statistical systems involve some compromise and often the nomenclature used does not accord well with popular usage. This should not be a major problem for user prepared to check ABS definitions on its web-site. Common use terms often have multiple meanings and using ABS classification avoids this problem and has the advantage that this approach is consistent with the methodology used by the Australian Public Service to advise ministers and governments.
1.2 Engineers and engineering
Engineers and engineering are indispensable contributors to Australian prosperity and lifestyles. Engineering services are embodied in almost every good or service consumed or
Engineers Australia
THE ENGINEERING PROFESSION 6
used by Australians, now and in the future. In this respect, engineers are the enablers of productivity growth through their role in converting “brilliant ideas” into new commercial products, new productive processes and new services. Engineers also ensure that society gets the most out of existing facilities through optimising their operations and maintenance.
Fully competent engineers hold accredited academic credentials in engineering and then complete a process of professional formation that bridges the gap between academic studies and engineering practice. The time necessary to become an engineer is very long, academic studies are specific and highly analytical and the skills of engineering practice are vital to successful outcomes for the individual and society.
Engineering is not homogeneous and there are numerous areas of engineering practice. To some degree, specialisation begins with academic studies, for example, students can choose between degrees in mechanical engineering, civil engineering or electrical engineering. Most specialisation, however, takes place through on-the-job practice during professional formation, for example, a graduate with a degree in civil engineering can choose to practice as a structural engineer, a geotechnical engineer, a coastal engineer or as a civil engineer. More detail on engineering specialisations can be found at www.engineersaustralia.org.au/professional-development/what-engineering
Engineering skills and expertise are unique and other skills cannot substitute for them. When engineering decisions made by engineers are over-ruled by general managers, administrators, accountants, lawyers or politicians, outcomes will be problematic. This has become particularly evident in government procurement of infrastructure and/or highly technical equipment by agencies where engineering positions have been abolished and not replaced by arrangements with the technical competence to ensure that engineering decisions and recommendations are soundly based. There are a host of examples that demonstrate how such short term cost savings have resulted in damaging and expensive outcomes1.
In contrast, the training, skills and experience of engineers are transferable to many other fields of work where they are highly valued. As a consequence, people with engineering qualifications contribute to the broader skills development of the Australian economy. In practice this means that only about 60% are employed in occupations closely related to engineering. The other 40% are employed in a range of other occupations where analytical and problem solving ability is required. Retaining trained engineers in engineering is just as important as encouraging more people to study and complete engineering qualifications
1.3 The engineering team
In Australia, the engineering profession is organised into the engineering team. The engineering team comprises Professional Engineers, Engineering Technologists and Engineering Associates. The three groups are differentiated by educational qualifications, which in conjunction with the process of professional formation undertaken, shape the engineer’s degree of conceptualisation and independent decision-making and so determine the complementarity between the groups in engineering practice. In detail, the roles of the three groups are:
Professional Engineers apply lifelong learning, critical perception and engineering judgment to the performance of engineering services. Professional Engineers challenge current thinking and conceptualise alternative approaches, often engaging in research and development of new engineering principles, technologies and materials. Professional Engineers apply their analytical skills and well developed grasp of scientific principles and engineering theory to design original and novel solutions to complex problems. Professional Engineers exercise a disciplined and
1 See for example www.anao.gov.au
Engineers Australia
THE ENGINEERING PROFESSION 7
systematic approach to innovation and creativity, comprehension of risks and benefits and use informed professional judgment to select optimal solutions and to justify and defend these selections to clients, colleagues and the community. Professional Engineers require at least the equivalent of the competencies in a four-year full time Bachelor’s Degrees in engineering.
Engineering Technologists exercise ingenuity, originality and understanding in adapting and applying technologies, developing related new technologies or applying scientific knowledge within their specialised environment. The education, expertise and analytical skills of Engineering Technologists equip them with a robust understanding of the theoretical and practical application of engineering and technical principles. Within their specialisation, Engineering Technologists contribute to the improvement of standards and codes of practise and the adaptation of established technologies to new situations. Engineering Technologists require at least the equivalent of the competencies in a three-year full time Bachelor Degree in engineering.
Engineering Associates apply detailed knowledge of standards and codes of practice to selecting, specifying, installing, commissioning, monitoring, maintaining, repairing and modifying complex assets such as structures, plant, equipment, components and systems. The education, training and experience of Engineering Associates equip them with the necessary theoretical knowledge and analytical skills for testing, fault diagnosis and understanding the limitations of complex assets in familiar operating situations. Engineering Associates require at least the equivalent of the competencies in a two-year full time Associate Degree in engineering or a two-year full time Advanced Diploma in engineering from a university or TAFE college.
1.4 Competent practicing engineers
In some countries the professional status and practice of engineering is legally defined and protected by law. Supporting arrangements vary and include regulation through government bodies and self-governing bodies granted powers through legislation. In Australia, only Queensland has similar legislation. Although some other Australian jurisdictions are actively considering legislated regulation of engineers, but at present most current Australian arrangements are voluntary.
Engineers Australia’s National Engineering Register (NER) is the uniform national benchmark standard of professionalism in engineering practice. The NER is a compliance benchmark that corresponds to the standards of competence required in legislated systems and identifies individuals who satisfy the following criteria:
Recognised academic qualifications in engineering.
Cumulative (five years in the past seven years) and current experience in their chosen area of engineering practice.
Commitment to and practice of ethical standards in engineering practice.
Commitment to and practice of an appropriate standard of continuing professional development.
Have the benefit of professional indemnity insurance and demonstrate that they can maintain this benefit throughout the provision of engineering services.
The NER is a publicly searchable database providing a voluntary national system of registration for the engineering team in both the private and public sectors in Australia. The NER is open to both members and non-members of Engineers Australia and aims to provide consistency in standards of engineering practice across states and territories and to facilitate any new
Engineers Australia
THE ENGINEERING PROFESSION 8
legislated approaches. In our view, the NER is an important indicator of Australia’s engineering capability.
1.5 What’s new in this edition?
A major source of statistics about engineers is the population census undertaken by the ABS. The census occurs every five years and 2016 was a census year. The statistics from this census are expected to be available from October 2017. There are hazards in relying on census statistics because the further from a census year, the less useful they are. Accordingly, in this Edition of the Statistical Overview statistics from the 2006 and 2011 censuses are no longer included. These statistics are unchanged and can be found in archived Editions from the Engineers Australia web-site (www.engineersaustralia.org.au ).
There is one exception to this policy. Since the last edition was released, the ABS has released the Australian Census Longitudinal Database (ACLD). The ACLD is a five percent random sample of records from the 2006 census. These records are matched to corresponding records from the 2011 census and the ABS plans to extend the matching to records from the 2016 census. This will allow analysis of the behaviour of an initial group of engineers to be tracked over time. Even though the 2011 census results are now five years old, in Chapter 2 we discuss a preliminary investigation of the labour market behaviour of engineers from 2006 into 2011. This investigation forms the foundation for a later three censuses longitudinal investigation of engineers but even at this stage it contains important insights into the mobility of engineers.
Census statistics are vital sources of cross sectional information about engineers but understanding progress of the engineering labour market over time is an important determinant of labour market policy. We have mentioned the limitations of the ABS Labour Force survey in this regard in section 1.1. To overcome these concerns, we employ statistics from the ABS Education and Work survey (SEW) in Chapter 3. In the absence of other contemporary statistics, SEW statistics provides detailed insights into how the engineering labour market has changed.
The transition from school to engineering education determines Australia’s home grown capacity to build its engineering capability. This Edition Chapter 4 contains fresh statistics on high school retention to year 12, the participation of high school students in mathematics, physics and chemistry studies and previously unpublished statistics on applications for, offers of and acceptances of offers of places in engineering courses conducted by Australian universities.
Chapters 5 and 6 present the now familiar reviews of engineering education focusing on course commencements and completions updated to 2015. Some new material on distributions by State and Territories is included in Chapter 5. Chapter looks in more detail at the contribution of domestic education completions to the supply of engineers, adding material on TAFE outcomes to the university based statistics from Chapter 5, again updated to 2015.
Skilled migration statistics are reviewed in Chapter 7. These statistics have been updated to the end of June 2016; permanent migration statistics were obtained from the relevant section of the Department of Immigration and Border Protection (DIBP), temporary migration statistics were obtained from the pivot tables available on the Department’s web-site. A fresh approach to the presentation and discussion of these statistics was employed this Edition.
The age, skill levels and salaries of engineers are discussed in Chapter 8. The statistics used are from the June engineer salary survey undertaken by Professionals Australia (formerly the Association of Professional Engineers, Scientists and Managers, or APESMA). This is now the only salary survey covering engineers and the size of its sample has fallen sharply in recent

Engineers Australia
THE ENGINEERING PROFESSION 9
years. The survey only covers professional engineers but provides salary statistics that are important surrogates about the interaction between the demand for and supply of engineers.
Engineering construction trends and trends in the vacancies for engineers are two further indicators of the status of the engineering labour market and updated statistics are discussed in Chapter 9. Finally, Chapter 10 brings the various indicators together in a discussion of general conditions in the engineering labour market in the year ahead.
Engineers Australia
THE ENGINEERING PROFESSION 10
Chapter 2: A longitudinal perspective of engineers
Main Points This Chapter explores the first longitudinal statistics that cover Australian engineers. The statistics relate to the 2006 and 2011 censuses and in that sense are somewhat out of date. Because the ABS plans to extend the longitudinal statistics to the 2016 census, the examination here is an important foundation for future work as well as providing immediately applicable insights.
Longitudinal statistics facilitate the construction of transitional probability which measure the probability of an engineer in 2006 who has a particular labour force status remaining in that status or shifting to another one by 2011. For engineers as a whole, 89% who were employed in 2006 were still employed in 2011 and 2% became unemployed while 9% left the labour force. Other important probabilities include; 24% of engineers not in the labour force in 2006 were employed in 2011; 73% of engineers who were unemployed in 2006 were employed in 2011 and only 9% of engineers unemployed in 2006 remained unemployed in 2011. Transitional probabilities also highlight the different experiences of women engineers.
Transition probabilities facilitate more instructive examination of changes in the engineering over the life-cycle of their careers. An important result is that engineers have a strong propensity to retire from the labour force when their ages reach the mid-50s. This result occurred during a period of very high demand for engineers and was evident in engineering intense industries, including those experiencing severe shortages of engineers. Another important result is to clearly illustrate the career cycle of women engineers highlighting changes in child bearing years and more severe pressures to retire early.
The stability of employment at industry level was examined. We found that contrary to widespread perceptions that engineers stick with their industry of choice, the proportion of engineers who continue in a given industry varies substantially and is often lower than commonly thought; for example, just 47% of engineers employed in mining in 2006 were still employed in that industry in 2011. Even in the industry employing the most engineers, the proportion remaining in the industry was just 61%. However, it was found that engineers had higher probabilities of remaining in the same industry in what we termed as engineering intense industries.
2.1 Objective, data and methodology
Most statistics used to analyse the engineering labour market are snapshots at a point in time. The changes observed between two or more snapshots are net changes, change in one direction typically offset by an opposing one. Statistics of this nature serves many purposes fairly well, but there is value in being able to understand the sizes of the countervailing changes. This can be done using longitudinal statistics, that is, statistics that track a group of people over time to see how their situations change.
Engineers Australia
THE ENGINEERING PROFESSION 11
Longitudinal statistics are expensive, difficult to maintain and have not been available to cover engineers. This situation has now changed with the release of the Australian Census Longitudinal Database (ACLD) by the ABS.
This chapter reports the first application of longitudinal statistics to investigate changes that affect engineers. We use the ACLD to examine changes in the labour market status of engineers, the movement of engineers between industries, the movement of engineers between Australian jurisdictions and the movement of engineers between different types of employment.
At this stage, the research is limited to the period 2006 to 2011. Ideally, the research should be extended to include 2016 and this will be done when the 2016 census results are released. At this stage, the research provides important base line information about engineers and adds substantially to the knowledge gleaned from cross section statistics.
The ACLD is based on a five percent random sample of records from the 2006 population census. These records were matched with corresponding records from the 2011 census using data linkage techniques without names and addresses2. Engineers Australia has access to the dataset using the ABS TableBuilder Pro facility, a powerful and flexible tool that allows users to experiment with alternative specifications of situations in order to decide the most useful one.
Because the ACLD is a sample, the ABS adjusts results to infer results applicable to the entire population by allocating weights to persons included in the sample to indicate how many population units are represented by the sample unit.
Numerically, a five percent sample from the 2006 census is just short of 1 million records. For research purposes, this is a generous sample calculated to withstand the inevitable drop-off in numbers over time, a common feature of longitudinal data collections. However, engineers are a small component of the population and the Australian labour market and this in conjunction with the confidentiality features built into TableBuilder mean that there are limits to how far statistics on engineers can be disaggregated.
The method used to preserve confidentiality is perturbation which involves small random adjustments of statistics in data cells where numbers are small. These adjustments often mean that elements of tables do not sum. Experimentation with alternative table structure was used to identify where the adjustment through perturbation produced silly results and the decision was taken to withdraw to a higher level of aggregation where this issue does not arise. In extreme cases, whole tables were suppressed because cell counts were too small. This typically occurred when exploring what happened to unemployed engineers where nationally the count was very small and in the smaller jurisdictions like Tasmania, the Northern and Australian Capital Territories, and to some extent in South Australia.
It is important to remind readers that the reference base for the ACLD is engineers in 2006. Engineers who join the engineering labour market after the 2006 census are not included. What this study seeks to do is track the 2006 cohort of engineers over time to see what happened to them.
Section 2.2 considers how the ACLD statistics for engineers compare to 2006 census statistics. Section 2.3 examines changes in the labour market status of engineers. We consider how many engineers who were employed in 2006 were still employed in 2011. The corresponding changes for the two other important labour markets statuses, unemployed and not in the labour market, are also examined.
2 ABS, Microdata: The Australian Census Longitudinal Dataset, 2006 to 2011, Cat No 2080.0, February 2016, www.abs.gov.au
Engineers Australia
THE ENGINEERING PROFESSION 12
In Section 2.4, we consider the seven industries that employed the most engineers in 2006 and ask the question which industry did these engineers work in in 2011? Section 2.5 explores the mobility of engineers in seven “engineering intense” industries in greater detail.
2.2 How does ACLD for 2006 compare to mainstream
census statistics?
The ACLD is a sample from the population records in the 2006 census and as such is likely to produce results that are different to the 2006 population results. Before proceeding it is important to examine the differences between the two data sets to assist the formulation of judgments about the longitudinal results. This comparison is made in Table 1.
The results in Table 1 show that the ACLD has oversampled the census population of engineers by about 14%. Employed engineers were oversampled by 17%, unemployed engineers by 12%, the labour force by 17%. The sample for engineers not in the labour force was almost exactly the census population.
Over-sampling engineers means there are more records for engineers than initially needed so that over time the representation of engineers is buttressed against the small relative size of the engineering population and the inevitable reduction in the longitudinal sample over time. To adjust for this difference, the approach we adopt is to operate within the confines of the ACLD, expressing the 2011 outcome relative to the 2006 base.
2.3 Changes in labour market status of engineers
In Table 2.2 the second column shows the labour market status of engineers in 2006. The next three columns indicate how this status changed by 2011. There were 204,922 employed men in 2006; of these 183,422 were still employed in 2011, although not necessarily in the same job or with the same employer; 4,301 became unemployed and 17,199 left the labour force. Similarly, 37,969 men were not in the labour force in 2006; by 2011 8,116 of them had become employed (most likely this group are students returning to employment following post graduate studies), 660 had become unemployed and 29,193 remained out of the labour force. The totals in Table 2.2 are slightly different to those in Table 2.1 because of the data perturbations employed under the ABS confidentiality policy.
Table 2.1: Comparison between ACLD statistics on engineers and the census population for engineers, 2006
Labour force
status Men Women Total Men Women Total
Employed 174491 20079 194570 205019 22337 227252
Unemployed 4957 1088 6045 5448 1335 6755
Labour force 179448 21167 200615 210467 23672 234007
Not in labour force 37892 7124 45016 37849 7574 45501
Engineering Population 217340 28291 245631 248316 31246 279508
Census population for engineers ACLD statistics for engineers
Engineers Australia
THE ENGINEERING PROFESSION 13
Another way to examine Table 2.2 is from the perspective of 2011. In this instance there were 217,810 men engineers employed in 2011; 183,422 were already employed in 2006, 3,436 were unemployed in 2006 but had found employment by 2011 and 8,116 were not in the labour force in 2006 but by 2011 not only joined the labour force but had found employment.
It is important to appreciate that retirement is not the only reason why engineers leave the labour force. Other reasons are to undertake full time post graduate study, to take care of family responsibilities which for women may include pregnancy and the period immediately after child birth and there may be other personal circumstances that cause both men and women to leave the labour force early.
Table 2.2: The labour force status of engineers in 2006 and subsequent status in 2011
Men
2006
Employment Unemployment Not in Labour force Totals
Employment 183422 4301 17199 204922
Status in 2006 Unemployment 3436 809 1090 5335
Not in Labour Force 8116 660 29193 37969
Women
2006
Employment Unemployment Not in Labour force Totals
Employment 18891 308 3045 22244
Status in 2006 Unemployment 837 99 210 1146
Not in Labour Force 2916 170 4603 7689
Men and Women
2006
Employment Unemployment Not in Labour force Totals
Employment 202470 4702 20397 227569
Status in 2006 Unemployment 4364 887 1356 6607
Not in Labour Force 10976 831 33877 45684
STATUS IN 2011
STATUS IN 2011
STATUS IN 2011
Table 2.3: Transition probabilities for engineers, 2006 to 2011
Men
Employment Unemployment Not in Labour force
Employment 0.90 0.02 0.08
Status in 2006 Unemployment 0.64 0.15 0.20
Not in Labour Force 0.21 0.02 0.77
Women
Employment Unemployment Not in Labour force
Employment 0.85 0.01 0.14
Status in 2006 Unemployment 0.73 0.09 0.18
Not in Labour Force 0.38 0.06 0.60
Men and Women
Employment Unemployment Not in Labour force
Employment 0.89 0.02 0.09
Status in 2006 Unemployment 0.66 0.13 0.21
Not in Labour Force 0.24 0.02 0.74
STATUS IN 2011
STATUS IN 2011
STATUS IN 2011
Engineers Australia
THE ENGINEERING PROFESSION 14
In labour economics, changes in labour market status are often measured using transition probabilities; a transition probability measures the likelihood that someone in a given labour market status in 2006, for example employed, is still in the same status in 2011. Similarly, transition probabilities can be calculated for someone employed in 2006 becoming unemployed by 2011 or leaving the labour force by 2011. Transition probabilities are calculated by dividing the 2011 outcomes by the initial 2006 status. We calculated the transition probabilities implied by Table 2.2 and show them in Table 2.3.
Transition probabilities are interpreted as follows. Consider again the first panel of the Table relating to men engineers; a male employed engineer in 2006 had an 90% probability of still being employed in 2011, a 2% probability of becoming unemployed and an 8% probability of leaving the labour force. Similarly, an unemployed male engineer in 2006 had an 64% probability of becoming employed by 2011, a 15% probability of remaining unemployed and a 20% probability of leaving the labour force. Finally, male engineers who were not in the labour force in 2006 had a 21% probability of becoming employed by 2011, a 2% probability of becoming unemployed by 2011 and a 77% probability that they would not be in the labour force in 2011. Similar interpretations apply to each of the other two panels of the Table.
An important missing link in our information about engineers is the rate at which they retire. The transition probabilities in Table 2.3 overcome this problem. Irrespective of the reason, retirement is the cessation of active participation in the labour market. Table 2.3 shows that 9% of qualified engineers who were employed in 2006 had retired by 2011. Similarly, it shows that 20% of unemployed engineers in 2006 retired by 2011. Retirement is not a permanent status; Table 2.3 also shows that 74% of qualified engineers who had retired in 2006 were still retired in 2011. However, the other 26% had resumed active participation in the labour market; 24% had found employment and 2% were still looking for a job. There are important gender differences in the Table that warrant further examination.
Table 2.3 is about aggregate movements in the labour market, but the activities of some groups are related to age. To explore this proposition, we reconstructed Table 2.3 by six age group. Rather than present these results in a complicated Table we show the results in simple diagrammatic form. In Figure 2.1 we illustrate the transition probabilities for qualified
Engineers Australia
THE ENGINEERING PROFESSION 15
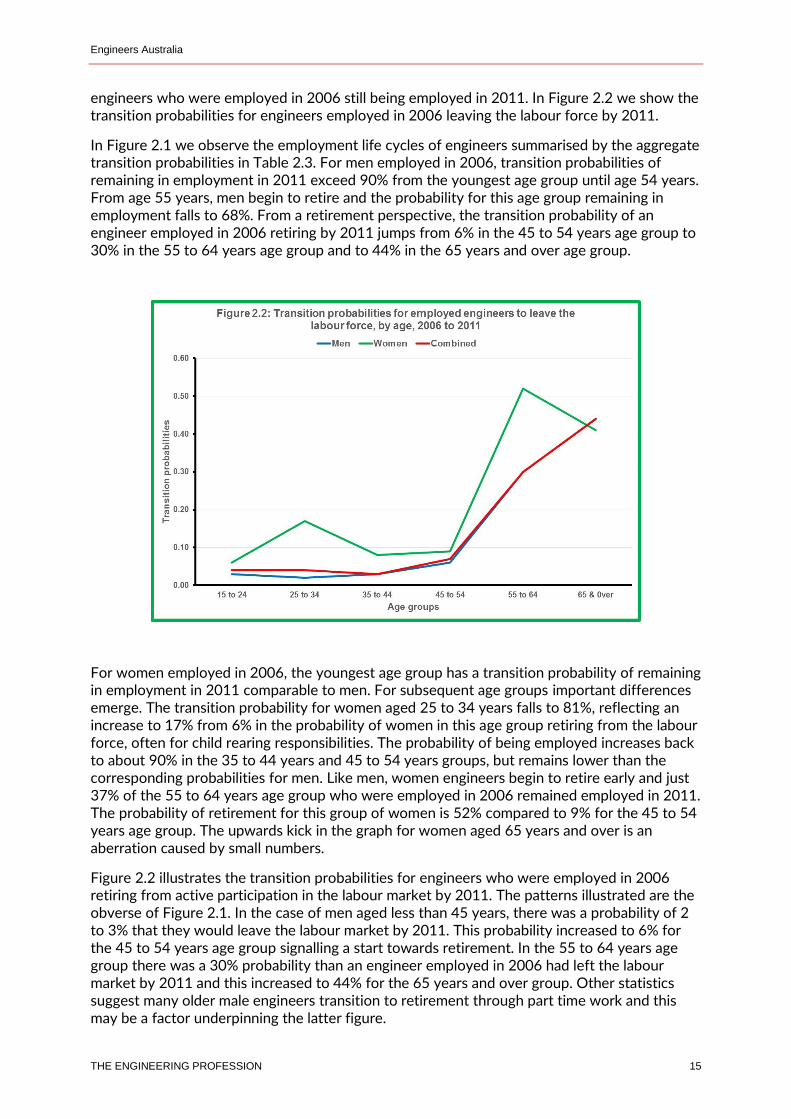
engineers who were employed in 2006 still being employed in 2011. In Figure 2.2 we show the transition probabilities for engineers employed in 2006 leaving the labour force by 2011.
In Figure 2.1 we observe the employment life cycles of engineers summarised by the aggregate transition probabilities in Table 2.3. For men employed in 2006, transition probabilities of remaining in employment in 2011 exceed 90% from the youngest age group until age 54 years. From age 55 years, men begin to retire and the probability for this age group remaining in employment falls to 68%. From a retirement perspective, the transition probability of an engineer employed in 2006 retiring by 2011 jumps from 6% in the 45 to 54 years age group to 30% in the 55 to 64 years age group and to 44% in the 65 years and over age group.
For women employed in 2006, the youngest age group has a transition probability of remaining in employment in 2011 comparable to men. For subsequent age groups important differences emerge. The transition probability for women aged 25 to 34 years falls to 81%, reflecting an increase to 17% from 6% in the probability of women in this age group retiring from the labour force, often for child rearing responsibilities. The probability of being employed increases back to about 90% in the 35 to 44 years and 45 to 54 years groups, but remains lower than the corresponding probabilities for men. Like men, women engineers begin to retire early and just 37% of the 55 to 64 years age group who were employed in 2006 remained employed in 2011. The probability of retirement for this group of women is 52% compared to 9% for the 45 to 54 years age group. The upwards kick in the graph for women aged 65 years and over is an aberration caused by small numbers.
Figure 2.2 illustrates the transition probabilities for engineers who were employed in 2006 retiring from active participation in the labour market by 2011. The patterns illustrated are the obverse of Figure 2.1. In the case of men aged less than 45 years, there was a probability of 2 to 3% that they would leave the labour market by 2011. This probability increased to 6% for the 45 to 54 years age group signalling a start towards retirement. In the 55 to 64 years age group there was a 30% probability than an engineer employed in 2006 had left the labour market by 2011 and this increased to 44% for the 65 years and over group. Other statistics suggest many older male engineers transition to retirement through part time work and this may be a factor underpinning the latter figure.
Engineers Australia
THE ENGINEERING PROFESSION 16
The transition probabilities for women engineers employed in 2006, but having left the labour force by 2011 are generally higher than for men. In the youngest age group, 15 to 24 years, there was a 6% probability that a women engineers employed in 2006 had left the labour force by 2011. This probability increased to 17% for women in the 25 to 34 years age group and fell back to 8 and 9% respectively for the 35 to 44 years and 45 to 54 years age group. There was a 52% probability that a women engineer aged 55 to 64 years who was employed in 2006 left the labour market by 2011.
We have not illustrated the transition probabilities for employed engineers in 2006 becoming unemployed by 2011 because the numbers are too small to produce reliable results.
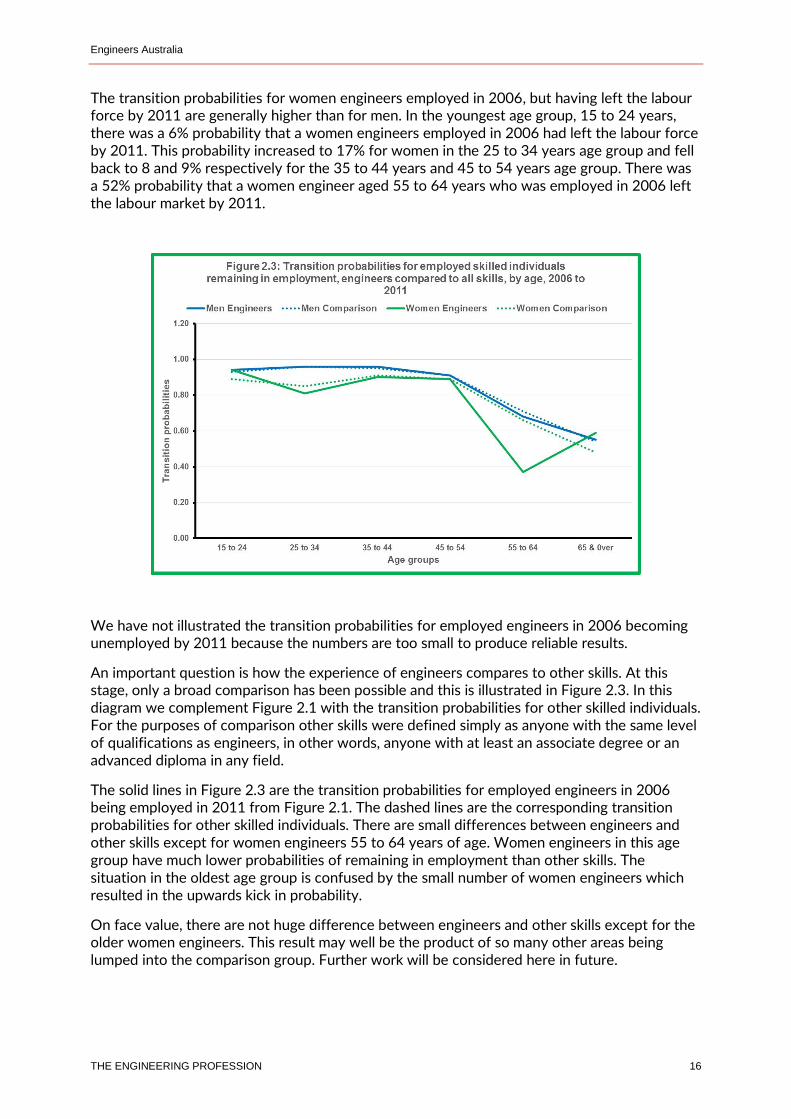
An important question is how the experience of engineers compares to other skills. At this stage, only a broad comparison has been possible and this is illustrated in Figure 2.3. In this diagram we complement Figure 2.1 with the transition probabilities for other skilled individuals. For the purposes of comparison other skills were defined simply as anyone with the same level of qualifications as engineers, in other words, anyone with at least an associate degree or an advanced diploma in any field.
The solid lines in Figure 2.3 are the transition probabilities for employed engineers in 2006 being employed in 2011 from Figure 2.1. The dashed lines are the corresponding transition probabilities for other skilled individuals. There are small differences between engineers and other skills except for women engineers 55 to 64 years of age. Women engineers in this age group have much lower probabilities of remaining in employment than other skills. The situation in the oldest age group is confused by the small number of women engineers which resulted in the upwards kick in probability.
On face value, there are not huge difference between engineers and other skills except for the older women engineers. This result may well be the product of so many other areas being lumped into the comparison group. Further work will be considered here in future.
Engineers Australia
THE ENGINEERING PROFESSION 17
2.4 Mobility and industries
Engineers employed in a particular industry in 2006 could exercise several options by 2011; they could remain in the same industry, either in the same job or with another employer, they could move to a different industry, either with another branch of their employer or with a different employer, they could become unemployed or they could leave the labour market into retirement, to undertake family responsibilities or to pursue further education. All options are of interest, but at this stage we have completed research for only the first option, engineers who remained in the same industry in 2006 and 2011.
Early experimentation with the ACLD showed that useful results could only be obtained at industry group level. The ABS ANZSIC3 classifications has nineteen industry groups, or one digit industries. As the classification is further disaggregated the number of industries expands rapidly with the result the number of engineers in most industries becomes unviable given the small number of engineers included in the ACLD sample. Even at industry group level, it was evident that data perturbations distorted the results for women engineers. Further work is needed to analyse these results and accordingly only overall results are presented.
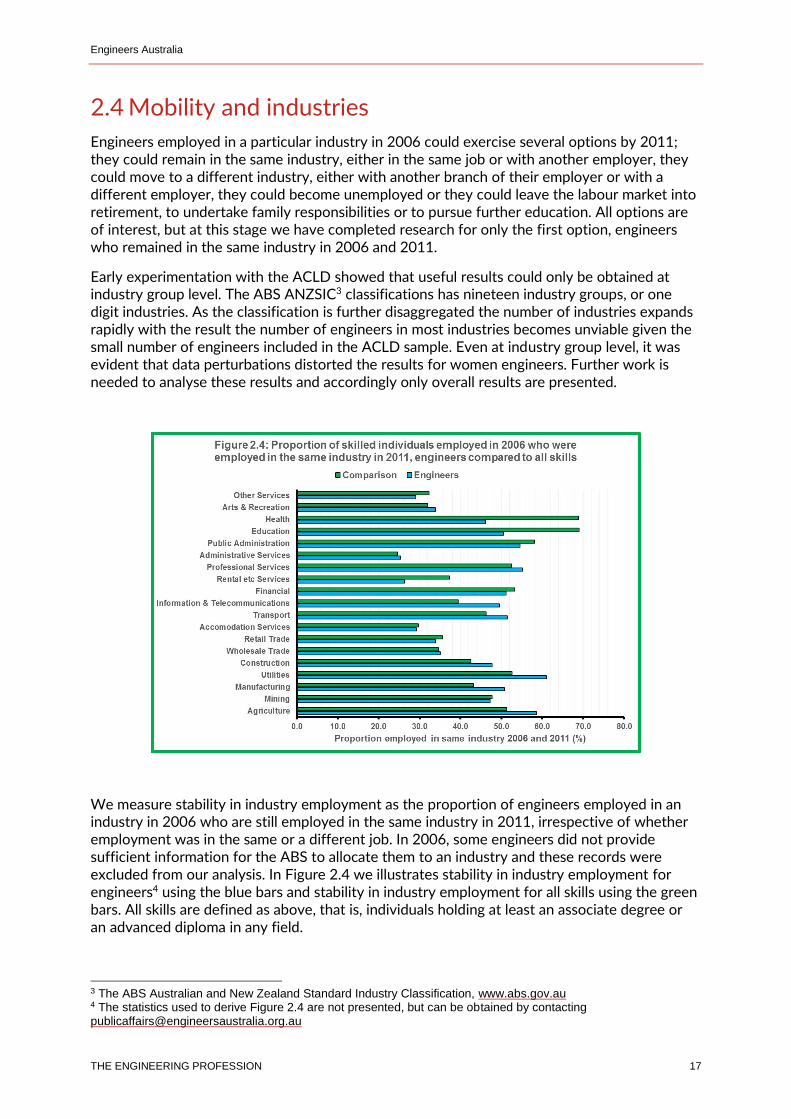
We measure stability in industry employment as the proportion of engineers employed in an industry in 2006 who are still employed in the same industry in 2011, irrespective of whether employment was in the same or a different job. In 2006, some engineers did not provide sufficient information for the ABS to allocate them to an industry and these records were excluded from our analysis. In Figure 2.4 we illustrates stability in industry employment for engineers4 using the blue bars and stability in industry employment for all skills using the green bars. All skills are defined as above, that is, individuals holding at least an associate degree or an advanced diploma in any field.
3 The ABS Australian and New Zealand Standard Industry Classification, www.abs.gov.au 4 The statistics used to derive Figure 2.4 are not presented, but can be obtained by contacting [email protected]
Engineers Australia
THE ENGINEERING PROFESSION 18
The results illustrated in Figure 2.4 suggest the following conclusions:
Stability in industry employment of engineers is not as high as commonly thought. The highest proportion of engineers employed in the same industry in 2006 and in 2011 was in the utilities (electricity, gas, water and sewerage and waste) and professional services industries where 61.0% were employed in the two years. By implication, the remaining 39% moved to another industry, became unemployed or retired.
Stability in employment of engineers was higher than stability in employment for all skilled workers in nine of the 19 industry groups and lower in the other 10 industry groups.
Stability in employment of engineers was highly variable ranging from 26.3% in rental services to 61.0% in utilities. In several industries where the employment of engineers is important, the proportion of engineers who remained in the same industry suggests high turnovers; for example, 47.2% of engineers remained employed in mining, 50.8% remained employed in manufacturing, 47.7% remained employed in construction and 55.1% remained employed in professional services.
To probe these results further we used the concept of “engineering intense” industries. In previous research, we identified 51 of 358 four digit ANZSCO occupations as engineering occupations5. Engineering occupations are occupations closely aligned with engineering work and include occupations in typical engineering career progression and the spread of engineering work throughout the economy. In 2006, 60.9% of the engineering labour force, that is, the labour force with qualifications acceptable for inclusion in the engineering team, were employed in engineering occupations. The remainder were employed in non-engineering work throughout the economy. When analysing industry distribution, we look at the proportion of engineering employment in engineering occupations because unemployed engineers cannot be assigned to an industry6. In 2006 this figure was 62.8%.
Ideally, we should reproduce the results illustrated in Figure 2.4 using employment in engineering occupations rather than the total employment of individuals holding engineering qualifications. Just as the ACLD does lend itself to industry disaggregation, disaggregating occupations to the level necessary to identify engineering occupations is not feasible. Instead, as a surrogate we define “engineering intense” industry groups as those where the proportion of engineers employed in engineering occupations is above the economy wide average. In 2006, this was the following industries:
Professional, technical and scientific services; 82.2% employed in engineering occupations.
Mining; 82.1% employed in engineering occupations.
Utilities (electricity, gas, water and sewerage and waste); 78.3% employed in engineering occupations.
Public administration; 70.7% employed in engineering occupations.
5 Engineers Australia, The Engineering Profession in Australia, A Profile from the 2006 Census, September 2010, www.engineersaustralia.org.au 6 The labour force consists of engineers who are employed or potentially employed (that is, unemployed). In macroeconomic analyses this is the appropriate magnitude to consider but a different approach is needed for industry work because by definition unemployed engineers are not employed in an industry which is the basis for ABS statistics.
Engineers Australia
THE ENGINEERING PROFESSION 19
Construction; 69.1% employed in engineering occupations.
Information media and telecommunications; 67.9% employed in engineering occupations.
Manufacturing; 63.3% employed in engineering occupations.
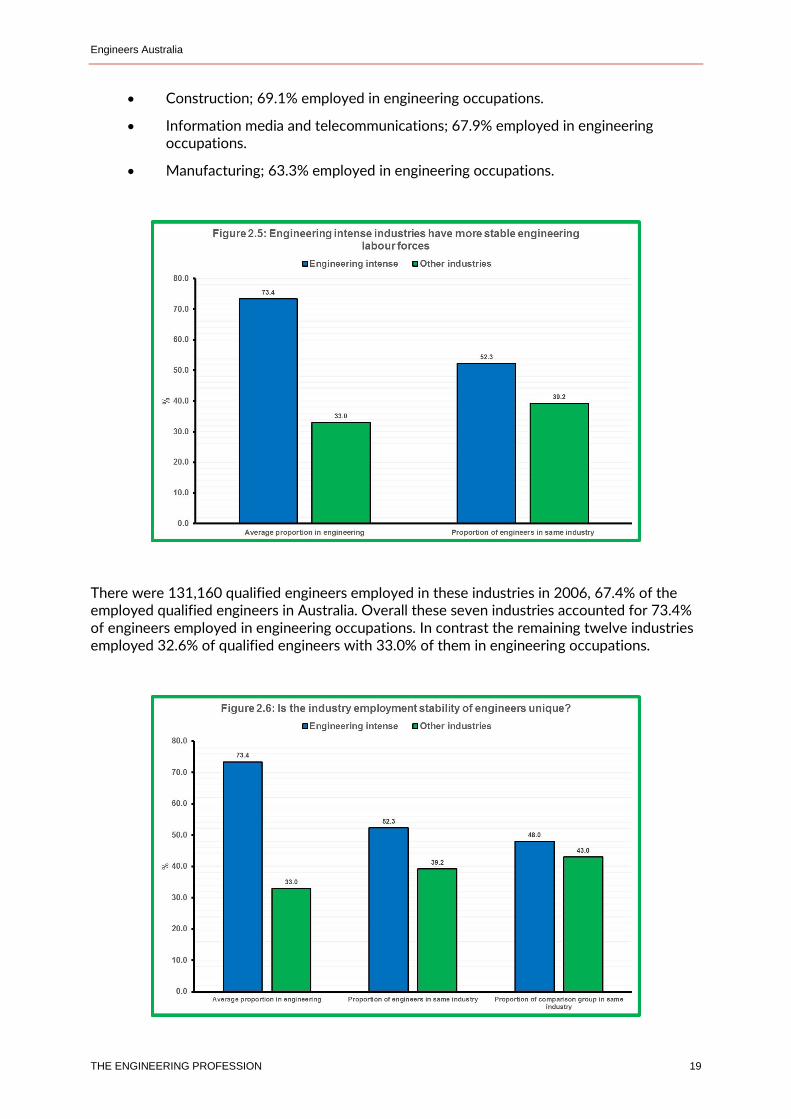
There were 131,160 qualified engineers employed in these industries in 2006, 67.4% of the employed qualified engineers in Australia. Overall these seven industries accounted for 73.4% of engineers employed in engineering occupations. In contrast the remaining twelve industries employed 32.6% of qualified engineers with 33.0% of them in engineering occupations.
Engineers Australia
THE ENGINEERING PROFESSION 20
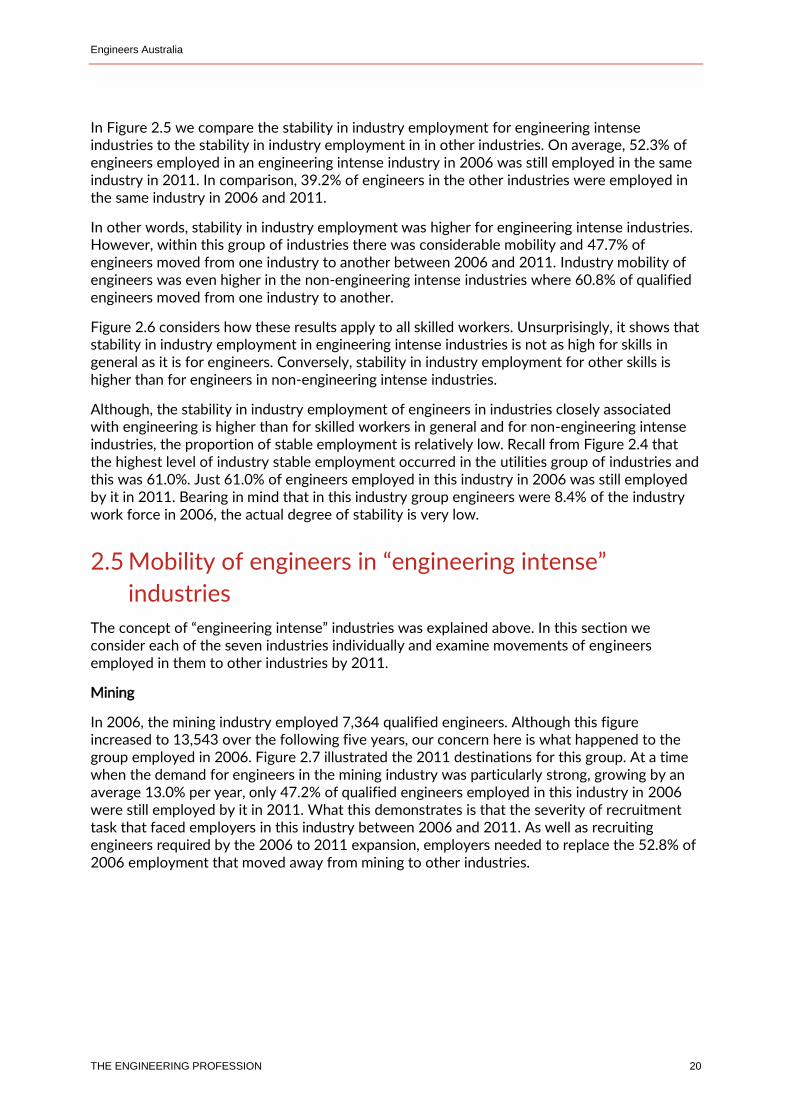
In Figure 2.5 we compare the stability in industry employment for engineering intense industries to the stability in industry employment in in other industries. On average, 52.3% of engineers employed in an engineering intense industry in 2006 was still employed in the same industry in 2011. In comparison, 39.2% of engineers in the other industries were employed in the same industry in 2006 and 2011.
In other words, stability in industry employment was higher for engineering intense industries. However, within this group of industries there was considerable mobility and 47.7% of engineers moved from one industry to another between 2006 and 2011. Industry mobility of engineers was even higher in the non-engineering intense industries where 60.8% of qualified engineers moved from one industry to another.
Figure 2.6 considers how these results apply to all skilled workers. Unsurprisingly, it shows that stability in industry employment in engineering intense industries is not as high for skills in general as it is for engineers. Conversely, stability in industry employment for other skills is higher than for engineers in non-engineering intense industries.
Although, the stability in industry employment of engineers in industries closely associated with engineering is higher than for skilled workers in general and for non-engineering intense industries, the proportion of stable employment is relatively low. Recall from Figure 2.4 that the highest level of industry stable employment occurred in the utilities group of industries and this was 61.0%. Just 61.0% of engineers employed in this industry in 2006 was still employed by it in 2011. Bearing in mind that in this industry group engineers were 8.4% of the industry work force in 2006, the actual degree of stability is very low.
2.5 Mobility of engineers in “engineering intense”
industries
The concept of “engineering intense” industries was explained above. In this section we consider each of the seven industries individually and examine movements of engineers employed in them to other industries by 2011.
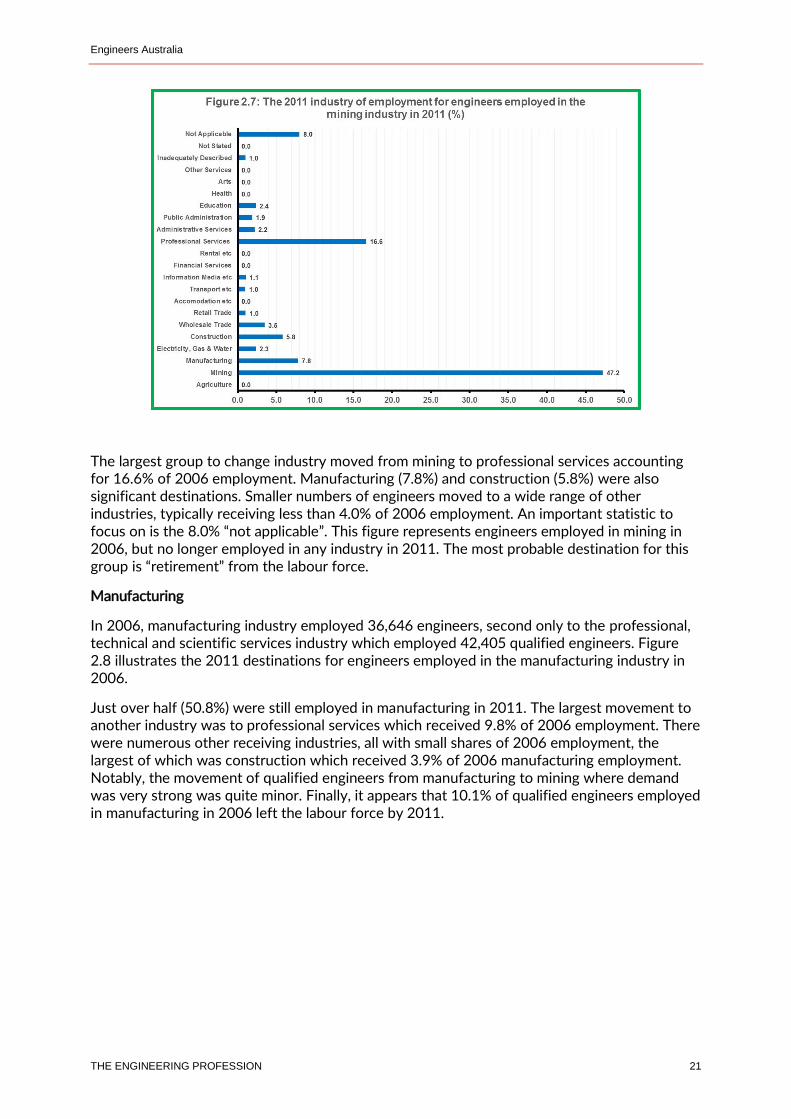
Mining
In 2006, the mining industry employed 7,364 qualified engineers. Although this figure increased to 13,543 over the following five years, our concern here is what happened to the group employed in 2006. Figure 2.7 illustrated the 2011 destinations for this group. At a time when the demand for engineers in the mining industry was particularly strong, growing by an average 13.0% per year, only 47.2% of qualified engineers employed in this industry in 2006 were still employed by it in 2011. What this demonstrates is that the severity of recruitment task that faced employers in this industry between 2006 and 2011. As well as recruiting engineers required by the 2006 to 2011 expansion, employers needed to replace the 52.8% of 2006 employment that moved away from mining to other industries.
Engineers Australia
THE ENGINEERING PROFESSION 21
The largest group to change industry moved from mining to professional services accounting for 16.6% of 2006 employment. Manufacturing (7.8%) and construction (5.8%) were also significant destinations. Smaller numbers of engineers moved to a wide range of other industries, typically receiving less than 4.0% of 2006 employment. An important statistic to focus on is the 8.0% “not applicable”. This figure represents engineers employed in mining in 2006, but no longer employed in any industry in 2011. The most probable destination for this group is “retirement” from the labour force.
Manufacturing
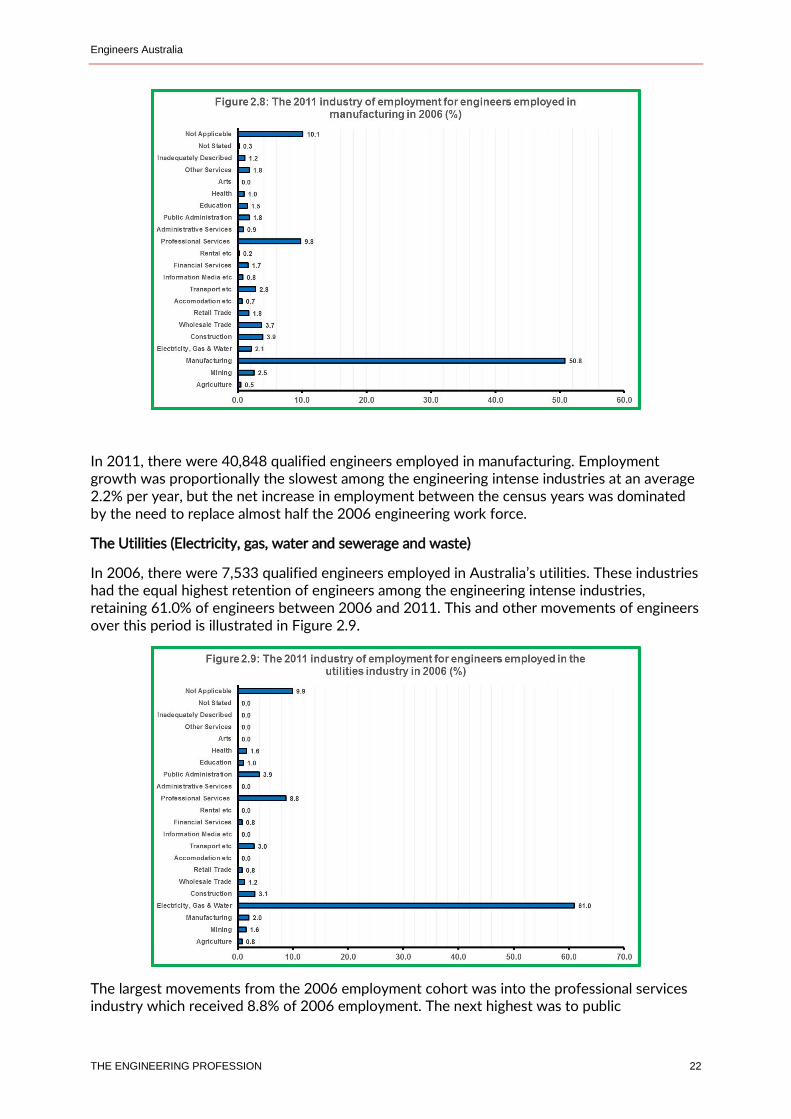
In 2006, manufacturing industry employed 36,646 engineers, second only to the professional, technical and scientific services industry which employed 42,405 qualified engineers. Figure 2.8 illustrates the 2011 destinations for engineers employed in the manufacturing industry in 2006.
Just over half (50.8%) were still employed in manufacturing in 2011. The largest movement to another industry was to professional services which received 9.8% of 2006 employment. There were numerous other receiving industries, all with small shares of 2006 employment, the largest of which was construction which received 3.9% of 2006 manufacturing employment. Notably, the movement of qualified engineers from manufacturing to mining where demand was very strong was quite minor. Finally, it appears that 10.1% of qualified engineers employed in manufacturing in 2006 left the labour force by 2011.
Engineers Australia
THE ENGINEERING PROFESSION 22
In 2011, there were 40,848 qualified engineers employed in manufacturing. Employment growth was proportionally the slowest among the engineering intense industries at an average 2.2% per year, but the net increase in employment between the census years was dominated by the need to replace almost half the 2006 engineering work force.
The Utilities (Electricity, gas, water and sewerage and waste)
In 2006, there were 7,533 qualified engineers employed in Australia’s utilities. These industries had the equal highest retention of engineers among the engineering intense industries, retaining 61.0% of engineers between 2006 and 2011. This and other movements of engineers over this period is illustrated in Figure 2.9.
The largest movements from the 2006 employment cohort was into the professional services industry which received 8.8% of 2006 employment. The next highest was to public
Engineers Australia
THE ENGINEERING PROFESSION 23
administration with 3.9%, not surprising given the high degree of public ownership in these industries. Movements to other industries were widespread but small. Once again the movement of qualified engineers to the mining industry was minor. About 9.9% of 2006 employment left the labour force by 2011.
Employment of qualified engineers in the utility industries grew by 8.0% between 2006 and 2011, a demand situation exacerbated by the turnover of engineers which in numerical terms was almost as high as the increase in employment over the five years.
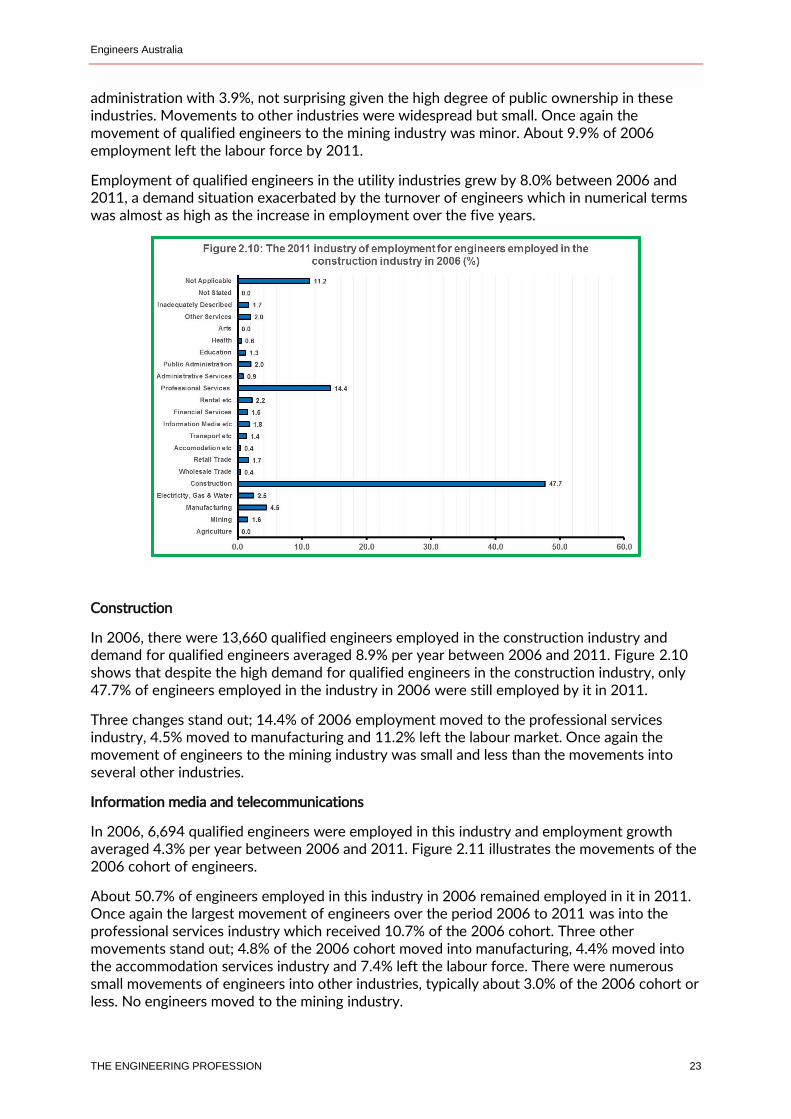
Construction
In 2006, there were 13,660 qualified engineers employed in the construction industry and demand for qualified engineers averaged 8.9% per year between 2006 and 2011. Figure 2.10 shows that despite the high demand for qualified engineers in the construction industry, only 47.7% of engineers employed in the industry in 2006 were still employed by it in 2011.
Three changes stand out; 14.4% of 2006 employment moved to the professional services industry, 4.5% moved to manufacturing and 11.2% left the labour market. Once again the movement of engineers to the mining industry was small and less than the movements into several other industries.
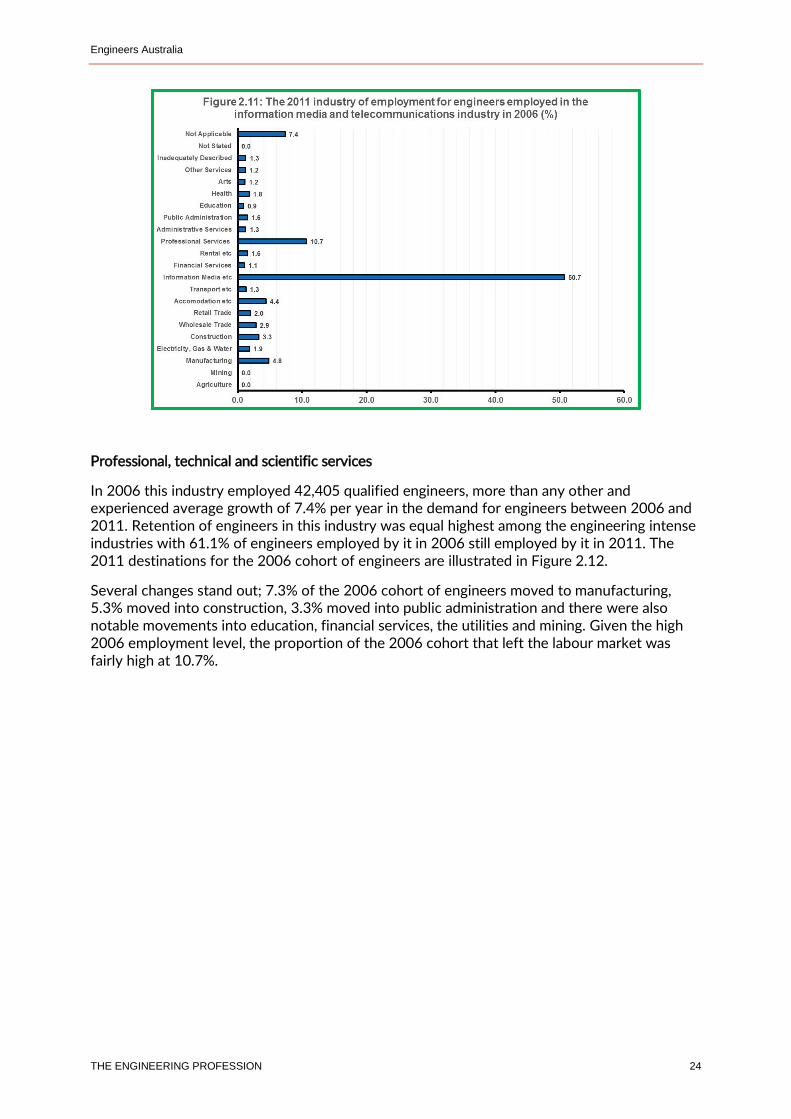
Information media and telecommunications
In 2006, 6,694 qualified engineers were employed in this industry and employment growth averaged 4.3% per year between 2006 and 2011. Figure 2.11 illustrates the movements of the 2006 cohort of engineers.
About 50.7% of engineers employed in this industry in 2006 remained employed in it in 2011. Once again the largest movement of engineers over the period 2006 to 2011 was into the professional services industry which received 10.7% of the 2006 cohort. Three other movements stand out; 4.8% of the 2006 cohort moved into manufacturing, 4.4% moved into the accommodation services industry and 7.4% left the labour force. There were numerous small movements of engineers into other industries, typically about 3.0% of the 2006 cohort or less. No engineers moved to the mining industry.
Engineers Australia
THE ENGINEERING PROFESSION 24
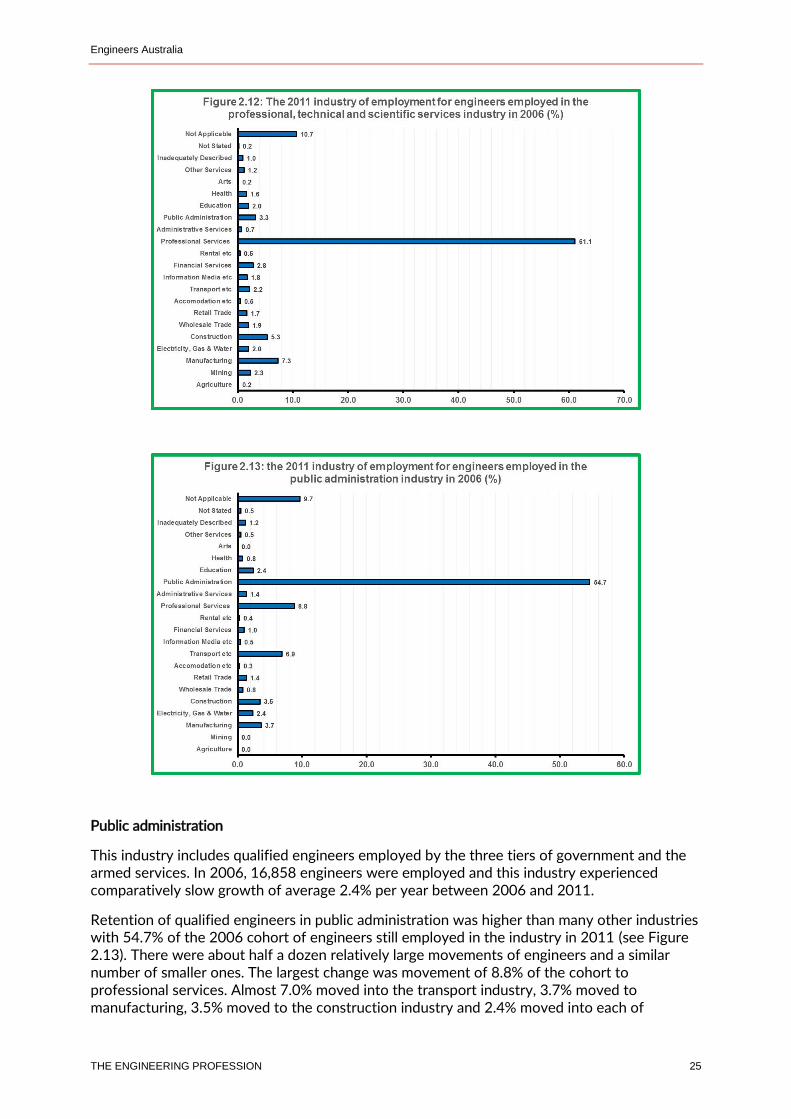
Professional, technical and scientific services
In 2006 this industry employed 42,405 qualified engineers, more than any other and experienced average growth of 7.4% per year in the demand for engineers between 2006 and 2011. Retention of engineers in this industry was equal highest among the engineering intense industries with 61.1% of engineers employed by it in 2006 still employed by it in 2011. The 2011 destinations for the 2006 cohort of engineers are illustrated in Figure 2.12.
Several changes stand out; 7.3% of the 2006 cohort of engineers moved to manufacturing, 5.3% moved into construction, 3.3% moved into public administration and there were also notable movements into education, financial services, the utilities and mining. Given the high 2006 employment level, the proportion of the 2006 cohort that left the labour market was fairly high at 10.7%.
Engineers Australia
THE ENGINEERING PROFESSION 25
Public administration
This industry includes qualified engineers employed by the three tiers of government and the armed services. In 2006, 16,858 engineers were employed and this industry experienced comparatively slow growth of average 2.4% per year between 2006 and 2011.
Retention of qualified engineers in public administration was higher than many other industries with 54.7% of the 2006 cohort of engineers still employed in the industry in 2011 (see Figure 2.13). There were about half a dozen relatively large movements of engineers and a similar number of smaller ones. The largest change was movement of 8.8% of the cohort to professional services. Almost 7.0% moved into the transport industry, 3.7% moved to manufacturing, 3.5% moved to the construction industry and 2.4% moved into each of
Engineers Australia
THE ENGINEERING PROFESSION 26
education and the utilities. None moved to mining. Finally, 9.7% of the 2006 cohort of engineers left the labour market.
Overview of industry changes
This discussion demonstrates that there were numerous large movements of engineers throughout the engineering intense industries between 2006 and 2011. Most public policy discussions have focused on the comparatively high rate of growth in the demand for engineers between these years, especially in the mining industry. ACLD statistics demonstrates the way in which the turnovers of engineers complicated the situation.
Meeting the requirements of the resources boom was an important aspect of public policy at the time. The mining industry retained only 47.2% of engineers of the engineers it employed in 2006 through to 2011. A further 8.0% of 2011 industry employment came from the movement of engineers from industries discussed in this section. Although the rate of departure from mining out of the labour force was proportionally lower than other industries at 8.0%, it was still high given the demand circumstances faced by the industry.
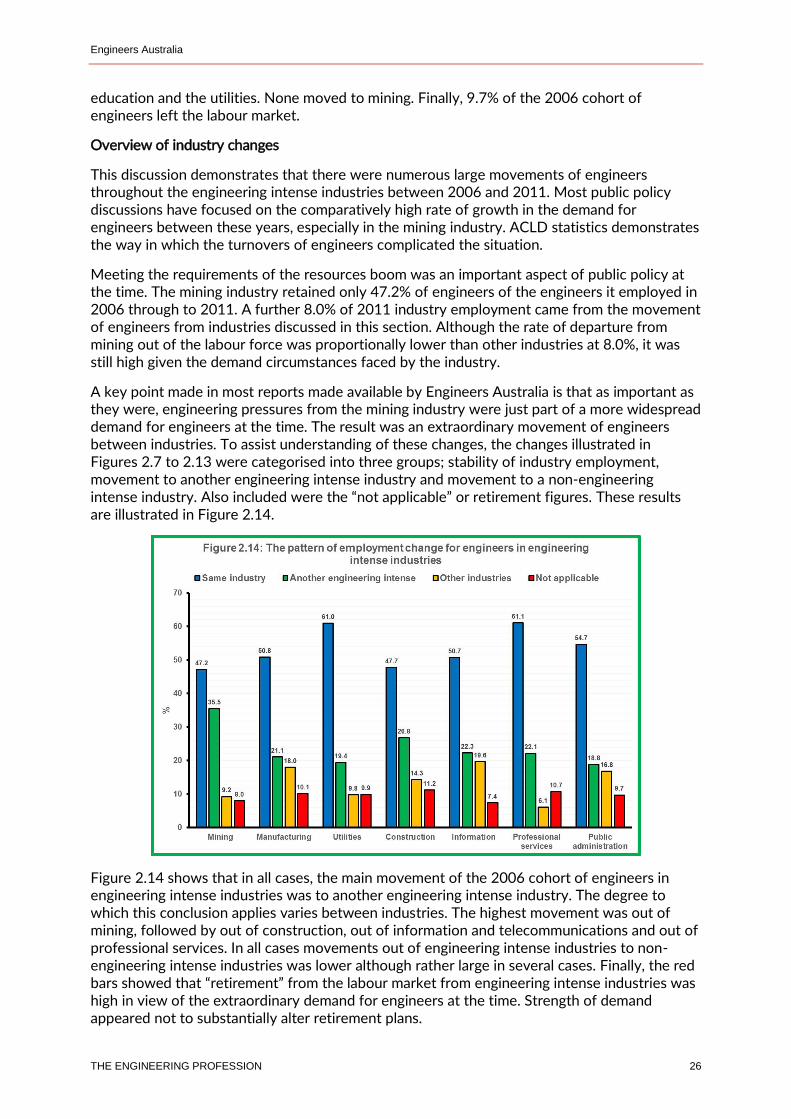
A key point made in most reports made available by Engineers Australia is that as important as they were, engineering pressures from the mining industry were just part of a more widespread demand for engineers at the time. The result was an extraordinary movement of engineers between industries. To assist understanding of these changes, the changes illustrated in Figures 2.7 to 2.13 were categorised into three groups; stability of industry employment, movement to another engineering intense industry and movement to a non-engineering intense industry. Also included were the “not applicable” or retirement figures. These results are illustrated in Figure 2.14.
Figure 2.14 shows that in all cases, the main movement of the 2006 cohort of engineers in engineering intense industries was to another engineering intense industry. The degree to which this conclusion applies varies between industries. The highest movement was out of mining, followed by out of construction, out of information and telecommunications and out of professional services. In all cases movements out of engineering intense industries to non-engineering intense industries was lower although rather large in several cases. Finally, the red bars showed that “retirement” from the labour market from engineering intense industries was high in view of the extraordinary demand for engineers at the time. Strength of demand appeared not to substantially alter retirement plans.
Engineers Australia
THE ENGINEERING PROFESSION 27
Chapter 3: The engineering labour force over time
Main Points This chapter explores an alternative to census statistics to ascertain how the engineering labour market has changed since 2011. The main disadvantage of the statistics used is that they exclude engineers aged 65 years or older.
After many years of consistent expansion, the engineering labour force contracted by 0.7% in 2016. An important factor was a fall in labour force participation, most likely due to retirement of older engineers. This occurred against the background of record completions of engineering entry level qualifications by Australians and permanent residents and record skilled migration.
On the demand side, employment of qualified engineers increased by 0.5% in 2016, but employment of qualified engineers in engineering occupations fell sharply, by 7.3%. The unemployment rate for engineers fell, but as stated this was due to many accepting jobs outside of engineering or retiring.
The proportion of engineers who are women has changed very slowly and was still just 12.4% in 2016.
3.1 Objective and methodology
High quality statistics to assist labour market policy decisions at macroeconomic level have been available for many decades. Policy focus on the macro level and resource constraints on agencies collecting statistics have meant that statistics for professions and most occupational groups are fragmented and often unreliable. This has particularly been the case for groups where specific educational qualifications are mandatory. In 2015, the Australian Bureau of Statistics (ABS) recognised these problems and introduced changes into the Labour Force Survey (LFS) to overcome them. Previously, there were no questions about educational attainment in the LFS did not. This is a positive development, but building useful time series statistics will take several more years to achieve. Even then, the sample survey nature of the LFS will pose inherent limitations and recourse to other information sources will remain essential.
The most useful source of statistics about engineers has been the ABS population census. However, the census is conducted on a five-year cycle and the further we are away from the most recent census year, the more out of date is the information. The 2016 census was undertaken in August and the ABS advises that TableBuilder statistics are expected to be released in late 2017. Engineers Australia argued in a 2015 Policy Note7, that the information gap between 2011 and the release of the 2016 statistics is too long and there is a strong case for utilising alternative statistics produced by the ABS.
These statistics are from the Survey of Education and Work (SEW), an annual supplement to the LFS which covers educational attainment. In the past access to these statistics was through traditional paper based data releases. This meant that statistics specifically related to engineers 7 Engineers Australia, The Status of Engineering 2015, March 2015, www.engineersaustralia.org.au
Engineers Australia
THE ENGINEERING PROFESSION 28
were obtained through special requests to the ABS. Considerable time was expended on a priori research to ensure the right requests went to the ABS and there was little latitude for change once the process was underway.
The Survey of Education and Work (SEW) is a supplementary survey that draws on the LFS sample and is undertaken annually in May8. Although a subset of the LFS sample, there are some differences in survey response rates and the scope of the surveys. There have been important improvements to the SEW and how statistics from it are released over the past decade. Since 2011, SEW statistics are available through the ABS TableBuilder facility which has improved access immeasurably. Since 2008, the SEW sample has changed to reflect the fact that people are working longer. This change occurred progressively over several years, but we now have five years of the expanded age range.
The sample survey nature of the SEW and changes to the survey have meant that attention to statistical protocols is important. In order to examine a long time series of statistics, we use the age basis for the labour force before the changes mentioned above, that is, the labour force is defined as comprising of people aged 15 to 64 years. This will continue to be necessary until several more years of statistics are compiled for the expanded age range, 15 to 74 years, adopted by the ABS.
All sample surveys face disaggregation limitations producing high standard errors. This is a particular problem for engineers who are only about two percent of the population with a corresponding representation in the SEW sample. In this chapter we attempt to avoid these problems as far as possible by reporting the highest level statistic available, for example, the labour force is comprised of employed and unemployed people, rather than extract the two variables and then sum them to obtain the labour force, we extract the statistic for the labour force to minimise the scope for variability.
The SEW statistics in this chapter relate to the engineering team as it is usually defined by Engineers Australia. Disaggregation into the three occupational groups of the team is not feasible for definitional reasons. Similarly, only the aggregate of the 51 four digit engineering occupations9 can be estimated and only since the ANZSCO system was applied to the SEW survey. There are other statistical protocols applied by the ABS to the SEW that influence the precise values of the statistics. The key point is that providing these protocols are applied consistently over time, SEW statistics provide sound indicators of trends in important variables. This is the approach used in this chapter.
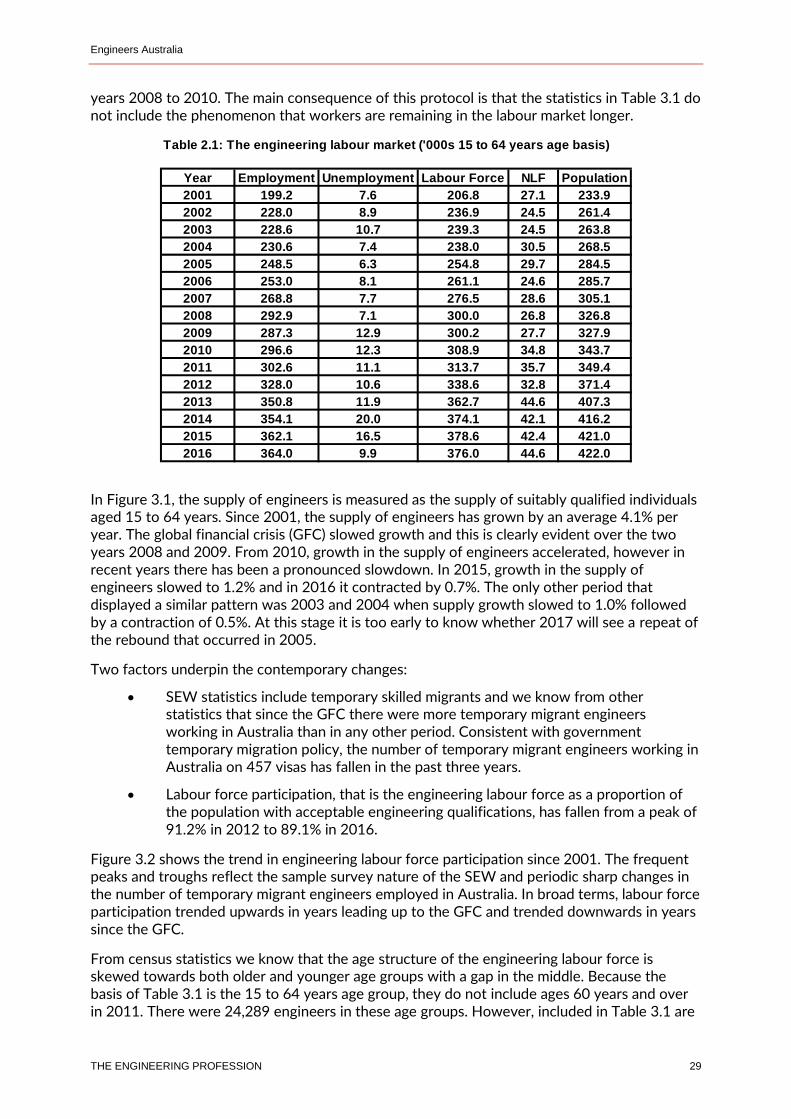
3.2 The supply of engineers
SEW statistics that describe the engineering labour market from 2001 to 2016 are shown in Table 2.1. The statistics in this Table were compiled on the 15 to 64 years age basis. In effect this means that all individuals aged 65 years and over are excluded from the labour market. A later section considers the implications of extending the age basis to include the 65 to 74 years age group.
The supply of engineers is measured by the engineering labour force, and comprises individuals who hold acceptable educational qualifications in engineering and who are actively participating in the labour market either by being employed or by actively looking for work if unemployed. To construct time series statistics that cover the period from 2001 to 2016, it is necessary to use the age basis for the SEW in use before the changes introduced during the
8 ABS, Education and Work, Australia, May 2014, Cat No 6227.0, www.abs.gov.au 9 Engineers Australia, The Engineering Profession in Australia; A Profile from the 2006 Population Census, 2010, www.engineersaustralia.org.au
Engineers Australia
THE ENGINEERING PROFESSION 29
years 2008 to 2010. The main consequence of this protocol is that the statistics in Table 3.1 do not include the phenomenon that workers are remaining in the labour market longer.
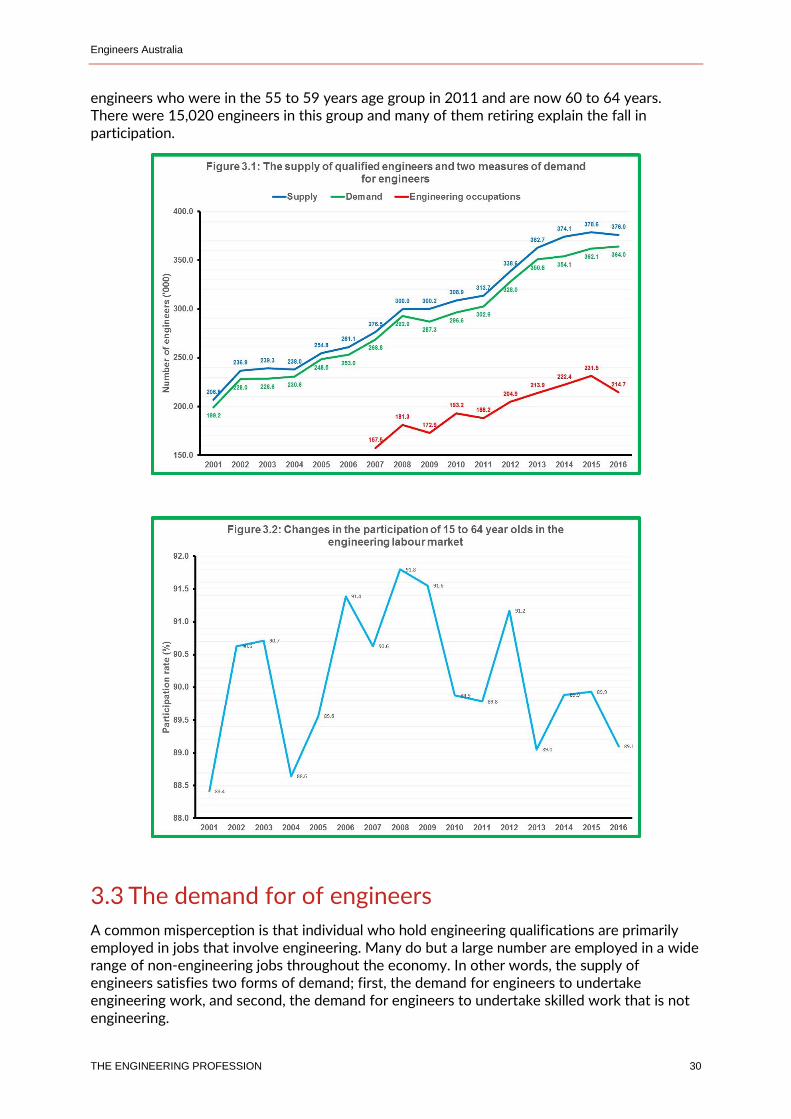
In Figure 3.1, the supply of engineers is measured as the supply of suitably qualified individuals aged 15 to 64 years. Since 2001, the supply of engineers has grown by an average 4.1% per year. The global financial crisis (GFC) slowed growth and this is clearly evident over the two years 2008 and 2009. From 2010, growth in the supply of engineers accelerated, however in recent years there has been a pronounced slowdown. In 2015, growth in the supply of engineers slowed to 1.2% and in 2016 it contracted by 0.7%. The only other period that displayed a similar pattern was 2003 and 2004 when supply growth slowed to 1.0% followed by a contraction of 0.5%. At this stage it is too early to know whether 2017 will see a repeat of the rebound that occurred in 2005.
Two factors underpin the contemporary changes:
SEW statistics include temporary skilled migrants and we know from other statistics that since the GFC there were more temporary migrant engineers working in Australia than in any other period. Consistent with government temporary migration policy, the number of temporary migrant engineers working in Australia on 457 visas has fallen in the past three years.
Labour force participation, that is the engineering labour force as a proportion of the population with acceptable engineering qualifications, has fallen from a peak of 91.2% in 2012 to 89.1% in 2016.
Figure 3.2 shows the trend in engineering labour force participation since 2001. The frequent peaks and troughs reflect the sample survey nature of the SEW and periodic sharp changes in the number of temporary migrant engineers employed in Australia. In broad terms, labour force participation trended upwards in years leading up to the GFC and trended downwards in years since the GFC.
From census statistics we know that the age structure of the engineering labour force is skewed towards both older and younger age groups with a gap in the middle. Because the basis of Table 3.1 is the 15 to 64 years age group, they do not include ages 60 years and over in 2011. There were 24,289 engineers in these age groups. However, included in Table 3.1 are
Table 2.1: The engineering labour market ('000s 15 to 64 years age basis)
Year Employment Unemployment Labour Force NLF Population
2001 199.2 7.6 206.8 27.1 233.9
2002 228.0 8.9 236.9 24.5 261.4
2003 228.6 10.7 239.3 24.5 263.8
2004 230.6 7.4 238.0 30.5 268.5
2005 248.5 6.3 254.8 29.7 284.5
2006 253.0 8.1 261.1 24.6 285.7
2007 268.8 7.7 276.5 28.6 305.1
2008 292.9 7.1 300.0 26.8 326.8
2009 287.3 12.9 300.2 27.7 327.9
2010 296.6 12.3 308.9 34.8 343.7
2011 302.6 11.1 313.7 35.7 349.4
2012 328.0 10.6 338.6 32.8 371.4
2013 350.8 11.9 362.7 44.6 407.3
2014 354.1 20.0 374.1 42.1 416.2
2015 362.1 16.5 378.6 42.4 421.0
2016 364.0 9.9 376.0 44.6 422.0
Engineers Australia
THE ENGINEERING PROFESSION 30
engineers who were in the 55 to 59 years age group in 2011 and are now 60 to 64 years. There were 15,020 engineers in this group and many of them retiring explain the fall in participation.
3.3 The demand for of engineers
A common misperception is that individual who hold engineering qualifications are primarily employed in jobs that involve engineering. Many do but a large number are employed in a wide range of non-engineering jobs throughout the economy. In other words, the supply of engineers satisfies two forms of demand; first, the demand for engineers to undertake engineering work, and second, the demand for engineers to undertake skilled work that is not engineering.
Engineers Australia
THE ENGINEERING PROFESSION 31
In labour market analysis, demand is measured by employment. In Table 3.1, the employment statistics record the composite of the two forms of demand. In Figure 3.1, the green trend line illustrates this composite demand from 2001 onwards. Over the long term, the composite demand for engineers has grown by an average 4.2% per year, slightly higher than the average annual growth in supply. This difference explains the pressures that have been experienced in the engineering labour market at various time during the past decade and a half.
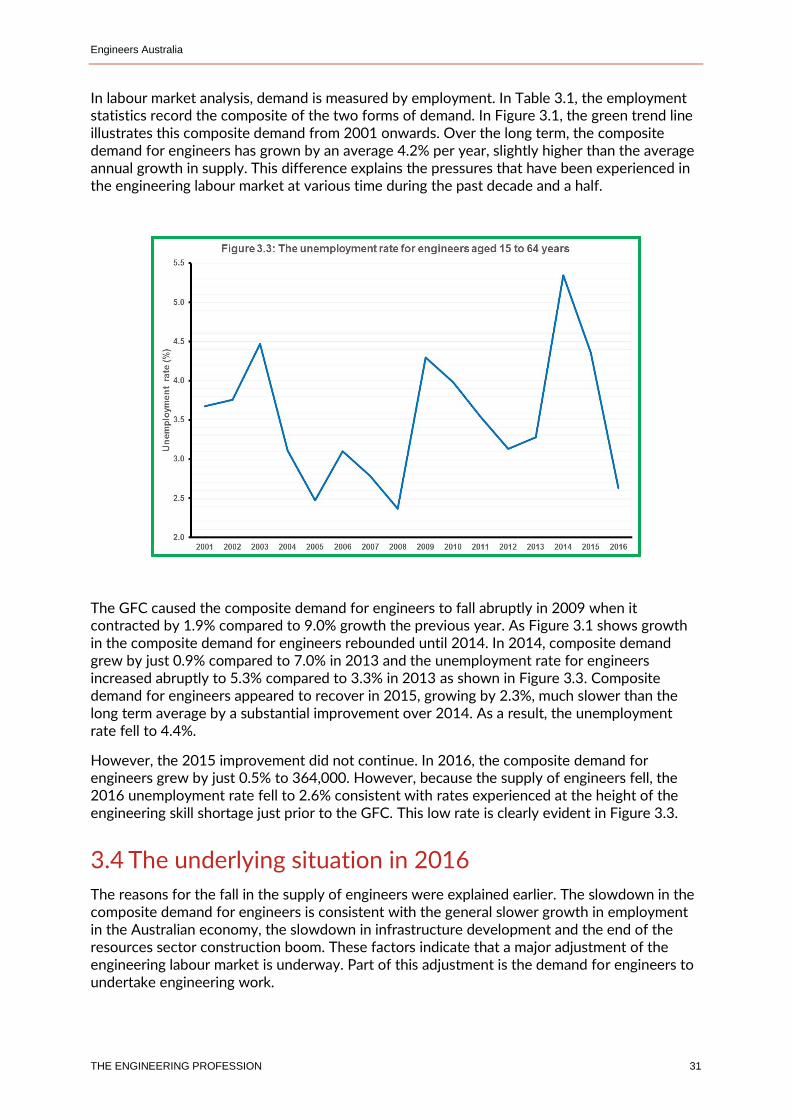
The GFC caused the composite demand for engineers to fall abruptly in 2009 when it contracted by 1.9% compared to 9.0% growth the previous year. As Figure 3.1 shows growth in the composite demand for engineers rebounded until 2014. In 2014, composite demand grew by just 0.9% compared to 7.0% in 2013 and the unemployment rate for engineers increased abruptly to 5.3% compared to 3.3% in 2013 as shown in Figure 3.3. Composite demand for engineers appeared to recover in 2015, growing by 2.3%, much slower than the long term average by a substantial improvement over 2014. As a result, the unemployment rate fell to 4.4%.
However, the 2015 improvement did not continue. In 2016, the composite demand for engineers grew by just 0.5% to 364,000. However, because the supply of engineers fell, the 2016 unemployment rate fell to 2.6% consistent with rates experienced at the height of the engineering skill shortage just prior to the GFC. This low rate is clearly evident in Figure 3.3.
3.4 The underlying situation in 2016
The reasons for the fall in the supply of engineers were explained earlier. The slowdown in the composite demand for engineers is consistent with the general slower growth in employment in the Australian economy, the slowdown in infrastructure development and the end of the resources sector construction boom. These factors indicate that a major adjustment of the engineering labour market is underway. Part of this adjustment is the demand for engineers to undertake engineering work.
Engineers Australia
THE ENGINEERING PROFESSION 32
We measure the demand for engineers to undertake engineering work by employment of engineers in engineering occupations10. Statistics for this measure are available from 2007 onwards following the application of the ANZSCO classification to the SEW. The trend for these statistics are illustrated by the red line in Figure 3.1.
This trend line shows that the demand for engineers to undertake engineering work fell in 2009 (due to the GFC) and there was a smaller fall in 2011. However, on average post GFC until 2015, the demand for engineers to undertake engineering work has grown by an average 5.1% per year. Growth slowed in the three years 2013 to 2015 inclusive to 4.2% per year. The important point to note is that this slower growth is still as high as the long term average growth in the composite demand for engineers.
In 2016, the demand for engineers to undertake engineering work fell sharply by 7.3% to 214,700 compared to a 4.6% fall in the GFC year. From 2007 until 2015, the average proportion of the supply of engineers satisfying the demand for engineers to undertake engineering work was 59.7%. This measure peaked in 2015 at 61.1%. In 2016, it fell to 57.1%. In other words, when we combine this information with the early account of composite demand more or less balancing the supply of engineers, we observe that fewer engineers are employed in engineering work and instead have taken up jobs outside of engineering. This observation is consistent with the work of the Grattan Institute which noted that “while engineering jobs are cyclical, engineering graduates find it easier to obtain alternative high-skill work than do other STEM graduates”.11
Whether further adjustment in the engineering labour market occurs depends on several factors:
Infrastructure development remains in the doldrums despite statements from political leaders.
The Australian labour market generally is weak suggesting low demand generally.
Currently, the output of university graduates is at record level, but new graduates are finding it more difficult to find full time jobs than in the past. This has two consequences, the immediate one is unemployment for more graduates, but a medium term consequence is that new graduates who cannot find a job cannot commence professional formation to be recognised as a competent, practicing engineer.
Permanent skill migration of engineers continues at near record levels.
3.5 Women engineers
Historically, the proportion of engineers who are women has been low. In the 2011 census, there were 11.8% women in the engineering labour force and 9.7% of employment of engineers in engineering occupations. At times, the number of women completing engineering qualifications has shown promise of a change. However, as illustrated in Figure 3.4, change is very slow. In 2016, the proportion of women in the engineering labour force was still 12.4%.
10 See footnote 9. 11 Grattan Institute, Mapping Australian Higher Education, 2016, Author Andrew Norton, 7 August 2016, p96, www.grattan.edu.au
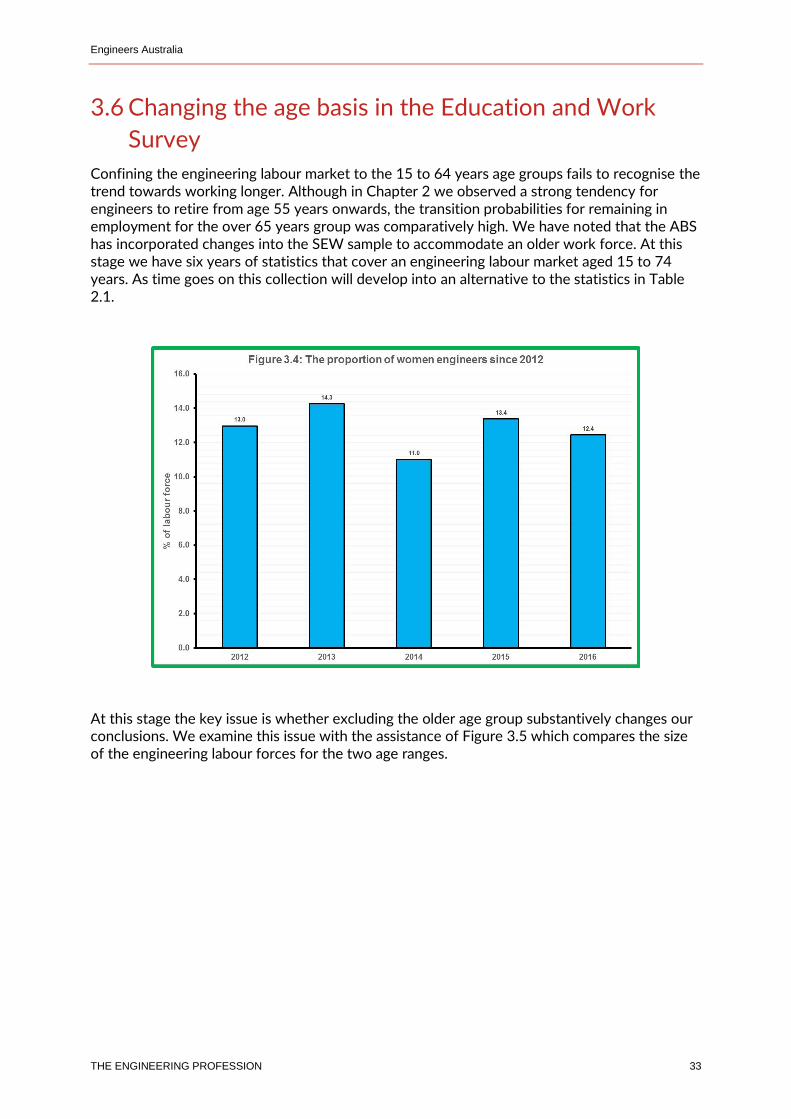
Engineers Australia
THE ENGINEERING PROFESSION 33
3.6 Changing the age basis in the Education and Work
Survey
Confining the engineering labour market to the 15 to 64 years age groups fails to recognise the trend towards working longer. Although in Chapter 2 we observed a strong tendency for engineers to retire from age 55 years onwards, the transition probabilities for remaining in employment for the over 65 years group was comparatively high. We have noted that the ABS has incorporated changes into the SEW sample to accommodate an older work force. At this stage we have six years of statistics that cover an engineering labour market aged 15 to 74 years. As time goes on this collection will develop into an alternative to the statistics in Table 2.1.
At this stage the key issue is whether excluding the older age group substantively changes our conclusions. We examine this issue with the assistance of Figure 3.5 which compares the size of the engineering labour forces for the two age ranges.
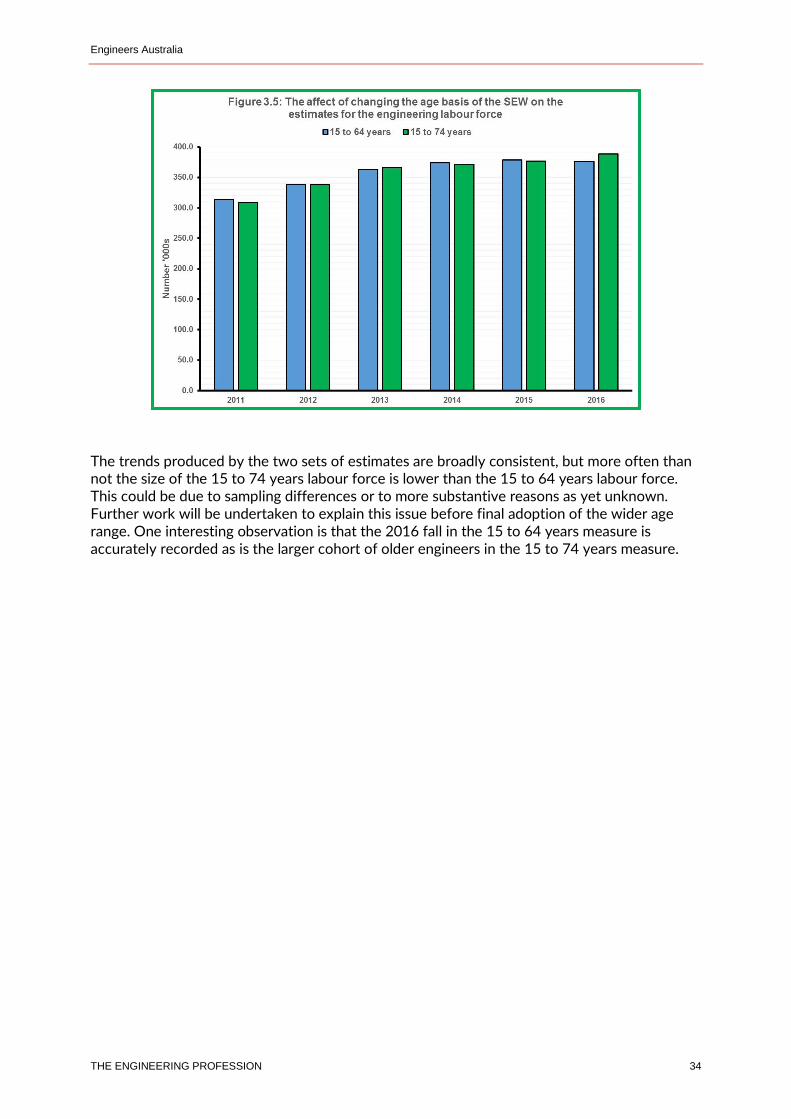
Engineers Australia
THE ENGINEERING PROFESSION 34
The trends produced by the two sets of estimates are broadly consistent, but more often than not the size of the 15 to 74 years labour force is lower than the 15 to 64 years labour force. This could be due to sampling differences or to more substantive reasons as yet unknown. Further work will be undertaken to explain this issue before final adoption of the wider age range. One interesting observation is that the 2016 fall in the 15 to 64 years measure is accurately recorded as is the larger cohort of older engineers in the 15 to 74 years measure.
Engineers Australia
THE ENGINEERING PROFESSION 35
Chapter 4: The transition to engineering education
Main Points This Chapter reviews statistics important to the transition of students from high school to engineering studies at Australia’s universities. Trends in the proportion of year 12 students studying mathematics and science subjects continue to fall but increased retention of high school students to year 12 has stabilised the numbers in some subjects opening a short term window in which policies that reverse falling participation can be implemented. High school retention is unacceptably high across States and Territories.
Statistics on two sources of new engineering students—the flow of students from year 12 to university through tertiary admission centres and direct applications for places by students to universities—are discussed. Statistics show the former has been falling for two years while the latter has been increasing. The net effect has been to stabilise acceptances of places. Engineering courses continue to attract students with high ATAR rankings, particularly from women, although the proportion of women moving into engineering education remains small.
4.1 Science and mathematics studies at school
Australia’s capacity to produce its own engineers begins at school. Most of the public commentary and discussion of school trends has been qualitative or, if statistical, confined to the school sector. To address this gap Engineers Australia has produced a report that analyses the connections between engineering education and the study of foundation subjects at school. This section reports the statistics that support that research with minimal commentary.
The definitive statistics on trends in year 12 participation in mathematics and science subjects were compiled by Kennedy, Lyons and Quinn12 who, following some controversy surrounding statistics then in use produced fresh statistics directly from enrolment data held by state and territory boards of education. This substantial undertaking built on earlier work about the alignment of mathematics and science courses offered by state and territory education systems. Following personal correspondence, Mr Kennedy generously provided Engineers Australia with statistics for year 12 STEM subject participation rates and gender ratios13. Without this assistance the work described in this chapter would not have been possible.
Our focus is particularly on year 12 study of mathematics, intermediate and advanced levels, chemistry and physics which are vital foundation subjects for tertiary engineering studies. The statistics provided by Mr Kennedy covered the period 1992 to 2012. We extended these statistics to 2015 by combining the Kennedy, Lyons and Quinn subject participation rates14 and
12 J Kennedy, T Lyons and F Quinn, The Continuing Decline of Science and Mathematics Enrolments in Australian High Schools, Teaching Science, Volume 60, Number 2, June 2014, available from www.eprints.qut.edu.au/73153/1/Continuing_decline_of_science_proof.pdf 13 Personal correspondence with Mr John Kennedy 14 Kennedy, Lyons and Quinn used overall subject participation rates and sex ratios (the number of girls per 100 boys) derived from examination of raw enrolment statistics from the Boards of Studies in each state and territory. The number of boys was estimated as p/(1+0.1r) where p is the number in year 12 and r is the subject sex ratio. Having estimated the numbers of each gender, gender specific participation rates could be calculated.
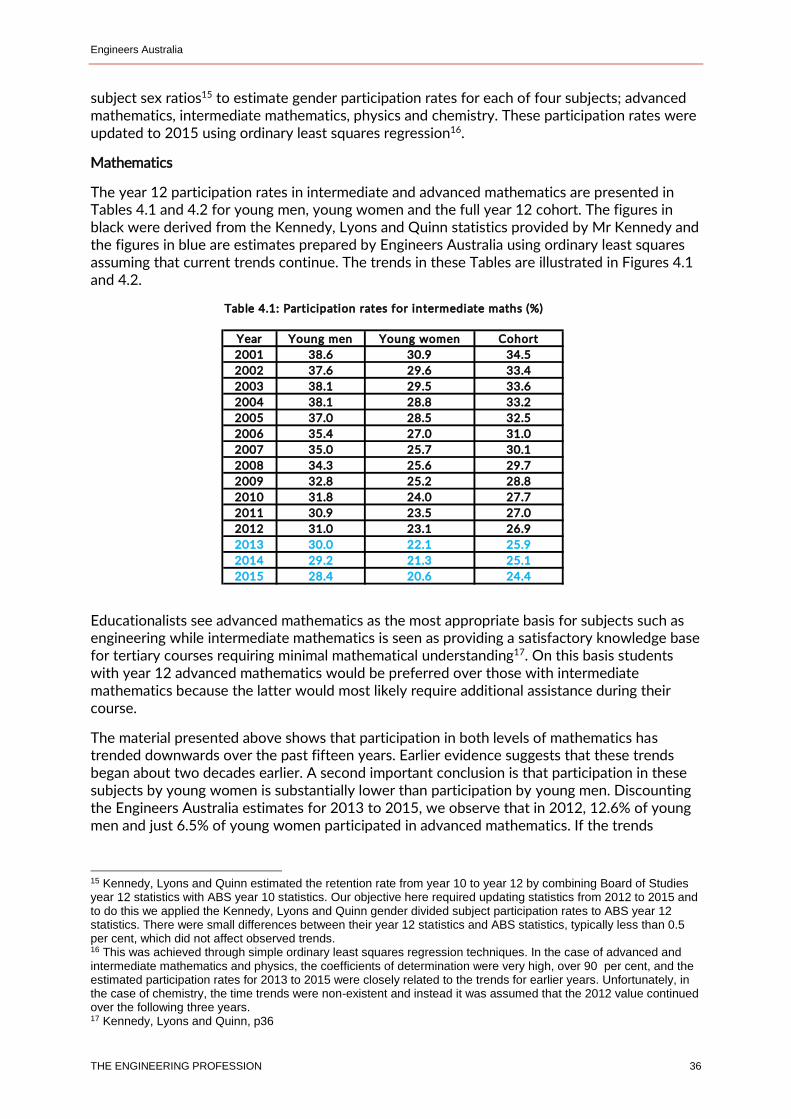
Engineers Australia
THE ENGINEERING PROFESSION 36
subject sex ratios15 to estimate gender participation rates for each of four subjects; advanced mathematics, intermediate mathematics, physics and chemistry. These participation rates were updated to 2015 using ordinary least squares regression16.
Mathematics
The year 12 participation rates in intermediate and advanced mathematics are presented in Tables 4.1 and 4.2 for young men, young women and the full year 12 cohort. The figures in black were derived from the Kennedy, Lyons and Quinn statistics provided by Mr Kennedy and the figures in blue are estimates prepared by Engineers Australia using ordinary least squares assuming that current trends continue. The trends in these Tables are illustrated in Figures 4.1 and 4.2.
Educationalists see advanced mathematics as the most appropriate basis for subjects such as engineering while intermediate mathematics is seen as providing a satisfactory knowledge base for tertiary courses requiring minimal mathematical understanding17. On this basis students with year 12 advanced mathematics would be preferred over those with intermediate mathematics because the latter would most likely require additional assistance during their course.
The material presented above shows that participation in both levels of mathematics has trended downwards over the past fifteen years. Earlier evidence suggests that these trends began about two decades earlier. A second important conclusion is that participation in these subjects by young women is substantially lower than participation by young men. Discounting the Engineers Australia estimates for 2013 to 2015, we observe that in 2012, 12.6% of young men and just 6.5% of young women participated in advanced mathematics. If the trends
15 Kennedy, Lyons and Quinn estimated the retention rate from year 10 to year 12 by combining Board of Studies year 12 statistics with ABS year 10 statistics. Our objective here required updating statistics from 2012 to 2015 and to do this we applied the Kennedy, Lyons and Quinn gender divided subject participation rates to ABS year 12 statistics. There were small differences between their year 12 statistics and ABS statistics, typically less than 0.5 per cent, which did not affect observed trends. 16 This was achieved through simple ordinary least squares regression techniques. In the case of advanced and intermediate mathematics and physics, the coefficients of determination were very high, over 90 per cent, and the estimated participation rates for 2013 to 2015 were closely related to the trends for earlier years. Unfortunately, in the case of chemistry, the time trends were non-existent and instead it was assumed that the 2012 value continued over the following three years. 17 Kennedy, Lyons and Quinn, p36
Table 4.1: Participation rates for intermediate maths (%)
Year Young men Young women Cohort
2001 38.6 30.9 34.5
2002 37.6 29.6 33.4
2003 38.1 29.5 33.6
2004 38.1 28.8 33.2
2005 37.0 28.5 32.5
2006 35.4 27.0 31.0
2007 35.0 25.7 30.1
2008 34.3 25.6 29.7
2009 32.8 25.2 28.8
2010 31.8 24.0 27.7
2011 30.9 23.5 27.0
2012 31.0 23.1 26.9
2013 30.0 22.1 25.9
2014 29.2 21.3 25.1
2015 28.4 20.6 24.4
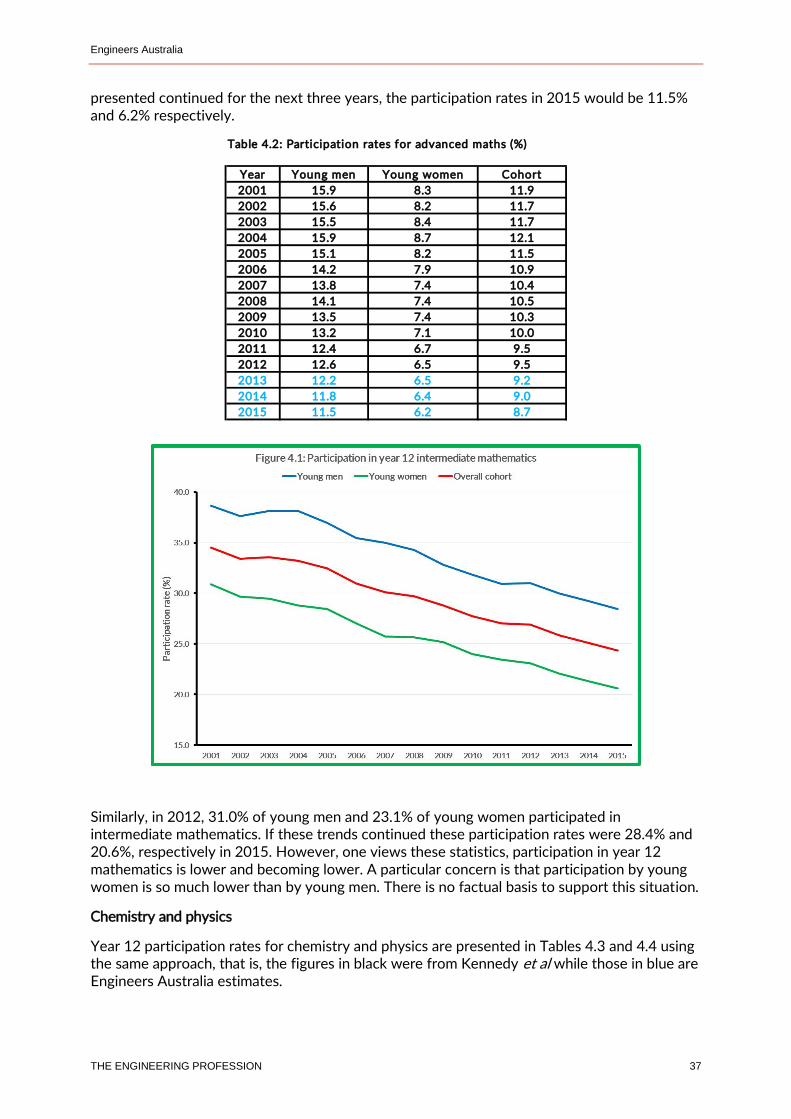
Engineers Australia
THE ENGINEERING PROFESSION 37
presented continued for the next three years, the participation rates in 2015 would be 11.5% and 6.2% respectively.
Similarly, in 2012, 31.0% of young men and 23.1% of young women participated in intermediate mathematics. If these trends continued these participation rates were 28.4% and 20.6%, respectively in 2015. However, one views these statistics, participation in year 12 mathematics is lower and becoming lower. A particular concern is that participation by young women is so much lower than by young men. There is no factual basis to support this situation.
Chemistry and physics
Year 12 participation rates for chemistry and physics are presented in Tables 4.3 and 4.4 using the same approach, that is, the figures in black were from Kennedy et al while those in blue are Engineers Australia estimates.
Table 4.2: Participation rates for advanced maths (%)
Year Young men Young women Cohort
2001 15.9 8.3 11.9
2002 15.6 8.2 11.7
2003 15.5 8.4 11.7
2004 15.9 8.7 12.1
2005 15.1 8.2 11.5
2006 14.2 7.9 10.9
2007 13.8 7.4 10.4
2008 14.1 7.4 10.5
2009 13.5 7.4 10.3
2010 13.2 7.1 10.0
2011 12.4 6.7 9.5
2012 12.6 6.5 9.5
2013 12.2 6.5 9.2
2014 11.8 6.4 9.0
2015 11.5 6.2 8.7
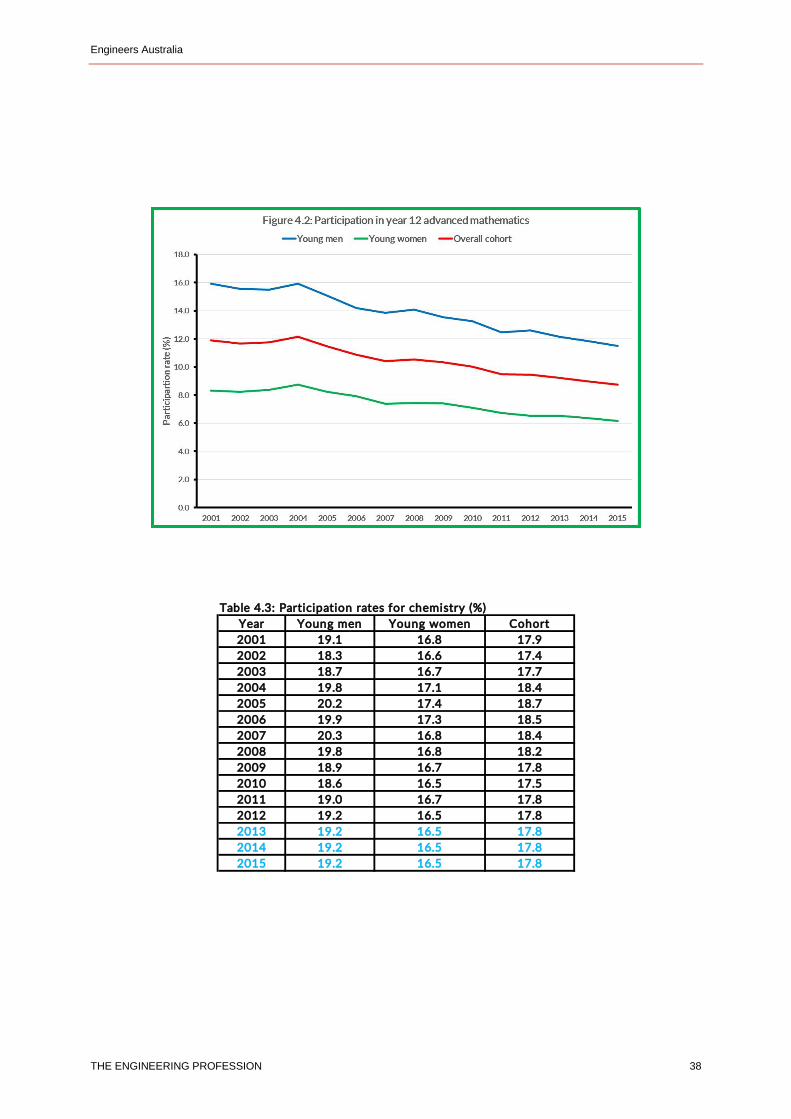
Engineers Australia
THE ENGINEERING PROFESSION 38
Table 4.3: Participation rates for chemistry (%)
Year Young men Young women Cohort
2001 19.1 16.8 17.9
2002 18.3 16.6 17.4
2003 18.7 16.7 17.7
2004 19.8 17.1 18.4
2005 20.2 17.4 18.7
2006 19.9 17.3 18.5
2007 20.3 16.8 18.4
2008 19.8 16.8 18.2
2009 18.9 16.7 17.8
2010 18.6 16.5 17.5
2011 19.0 16.7 17.8
2012 19.2 16.5 17.8
2013 19.2 16.5 17.8
2014 19.2 16.5 17.8
2015 19.2 16.5 17.8

Engineers Australia
THE ENGINEERING PROFESSION 39
The trends in Tables 4.3 and 4.4 are illustrated in Figures 4.3 and 4.4 below.
Prior to 2001, chemistry participation fell but during the period covered by our statistics trends have stabilised. Although participation by young women is lower than for young men, the gap between the two genders is less than was the case for mathematics. In the final year of the Kennedy statistics 19.2% of young men studied chemistry compared to 16.5% of young women. We estimate that these figures were unchanged in 2015.
The trends for participation are of serious concern because they show a continuation of declines that stretch back several decades and show no sign of stabilising. In 2012, 22.3% of young men studied physics and just 6.5% of young women. Our estimate is that further declines occur through to 2015 when 21.0% of young men and 5.9% of young women studied this subject. This gender gap is very large and translates into a very small number of young women in this subject even though year 12 participation by young men is substantially higher than by young women.
Table 4.4: Participation rates for physics (%)
Year Young men Young women Cohort
2001 25.1 8.8 16.5
2002 24.6 8.3 15.9
2003 24.8 8.3 16.1
2004 25.3 8.4 16.4
2005 23.8 7.8 15.3
2006 23.2 7.5 14.8
2007 23.3 7.3 14.8
2008 23.3 7.5 14.9
2009 22.3 7.4 14.5
2010 22.4 7.0 14.3
2011 22.1 6.6 14.0
2012 22.3 6.5 14.0
2013 21.6 6.3 13.6
2014 21.3 6.1 13.4
2015 21.0 5.9 13.1
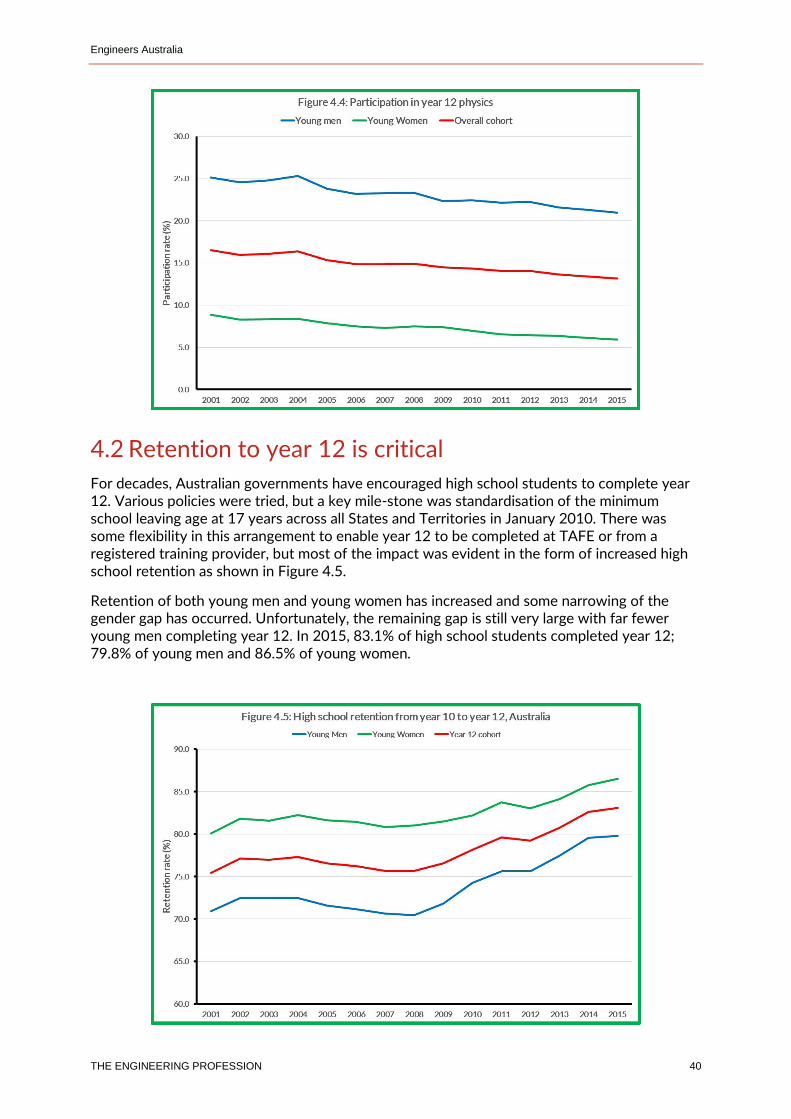
Engineers Australia
THE ENGINEERING PROFESSION 40
4.2 Retention to year 12 is critical
For decades, Australian governments have encouraged high school students to complete year 12. Various policies were tried, but a key mile-stone was standardisation of the minimum school leaving age at 17 years across all States and Territories in January 2010. There was some flexibility in this arrangement to enable year 12 to be completed at TAFE or from a registered training provider, but most of the impact was evident in the form of increased high school retention as shown in Figure 4.5.
Retention of both young men and young women has increased and some narrowing of the gender gap has occurred. Unfortunately, the remaining gap is still very large with far fewer young men completing year 12. In 2015, 83.1% of high school students completed year 12; 79.8% of young men and 86.5% of young women.

Engineers Australia
THE ENGINEERING PROFESSION 41
High school retention is important because of the interaction Kennedy, Lyons and Quinn observed between falling subject participation rates and the increasing student population. This important observation points to a window of opportunity during which relative stability in student numbers offers policy makers the time necessary to implement policies to reverse subject participation rates. With retention already at 83.1% and continuing to increase, this window of opportunity is not likely to be available for long and taking advantage of it requires urgent attention.
As is the case in many other areas, there are extraordinary differences in high school retention rates between States and Territories. These are illustrated in Figure 4.5 and give rise to a number of observations:
The highest retention is in the ACT; in 2001, retention was already 93.3%, but by 2015 it had increased further to 95.1% with 92.2% for young men and 98.1% for young women.
In 2015, retention in NSW, the largest jurisdiction, Tasmania, and the Northern Territory was below the national average and this was the case for the entire period illustrated.
In 2015, retention in Victoria, Queensland and the Australian Capital Territory was above the national average a relationship that prevailed the entire period illustrated.
The big improver was South Australia which increased retention from 70.2% in 2001 to 92.7% in fifteen years.
From 2011, the retention rate in Western Australia passed the national average and continued to increase for several years before reversing in 2014. This change is explained by the so-called “half cohort effect” caused by an increase to the school starting age by six months in 2001. This reduced numbers by about 10,000 students and as this cohort has moved through the school system it has distorted statistics. This group was in year 12 in 2014 and a more normal trend similar to South Australia is expected to resume in future years.
Engineers Australia
THE ENGINEERING PROFESSION 42
4.3 Admission to university engineering courses
The statistics reported this year draw on previously unpublished detailed statistics provided on from the Department of Education and Training18 collection. These statistics cover both genders and distinguish between students moving into engineering courses straight from school through the Tertiary Admission Centre (TAC) process and students who applied directly to universities for places. The main limitation of the statistics used is that they cover only the period 2010 to 2015 inclusive. Prior to 2010, the Department was not involved in the collection of these statistics and the level of detail provided by TACs was limited.
Applications for places in engineering by prospective current year 12 students, offers made in response by universities and acceptances of places since 2010 are presented in Table 4.5. The corresponding statistics for applications made directly to universities are presented in Table 4.6. Both Tables provide statistics by gender which have not been available previously.
18 Engineers Australia acknowledges and thanks the generous cooperation of the Department’s Application Data Team.
Table 4.5: The TAC admission process for engineering courses
Applications for places
Year 2010 2011 2012 2013 2014 2015
Women 2058 2117 2272 2524 2439 2566
Men 14655 15042 15952 16046 15011 13848
Cohort 16713 17159 18224 18570 17450 16414
Offers made by universities
Young women 2050 2015 2242 2427 2339 2466
Young men 12033 12474 13344 13424 12547 11641
Cohort 14083 14489 15586 15851 14886 14108
Acceptances of offers
Women 1492 1449 1608 1794 1696 1845
Men 9099 9701 10438 10431 9807 9217
Cohort 10591 11150 12046 12225 11503 11063
Table 4.6: Direct application admission process for engineering courses
Applications for places
Year 2010 2011 2012 2013 2014 2015
Women 226 325 338 492 517 664
Men 1812 2510 2497 3422 3857 4209
Cohort 2038 2835 2835 3914 4374 4873
Offers made by universities
Women 189 275 284 440 468 581
Men 1546 2153 2069 2914 3455 3872
Cohort 1735 2428 2353 3354 3923 4453
Acceptances of offers
Women 148 203 230 324 363 461
Men 1221 1606 1564 2249 2687 3254
Cohort 1369 1809 1794 2573 3050 3715
Engineers Australia
THE ENGINEERING PROFESSION 43
We look at the TAC process first and the key points are illustrated in Figure 4.5. In 2010, there were 14,655 applications for places in engineering from men and 2,058 from women for an overall total of 16,713. For next two years, applications increased. From 2012, applications slowed abruptly and peaked at 18,570 in 2013. During the past two years, applications have fallen and by 2015 were down to 16,414. The fall was primarily due to fewer applications from men which were down to 13,848 while applications from women continued to slowly increase to 2,566. The result was that applications for places from women increased from 12.3% in 2010 to 15.6% in 2015.
Offers of places by universities also continued to increase until 2013 and fell in the last two years. Between 82.1% and 84.3% of men who applied for places received offers. The downturn in the last two years resulted in 11,641 offers, the lowest level since before 2010. Figure 4.5 shows that almost all women who applied for places received an offer and offer rates19 have consistently exceeded 96%. This statistic confirms that engineering course administrators are conscious of the need to increase the number of women in engineering and, as we will see below, also reflects the standard of women applicants.
The final element of the process is acceptances of offers. Once again a similar trend emerged. In 2010, there were 10,591 acceptances of places, 9,099 by men and 1,491 by women. Acceptances peaked at 12,225 in 2013 and by 2015 had decreased back to 11,061, 9,217 men and 1,845 women. The acceptance rate20 for men was lower than for women ranging from 62.1% to 66.6% compared to a range from 68.4% to 72.5% for women. This difference and the higher offer rate to women applicants saw the proportion of acceptances by women increase from 14.1% in 2010 to 16.7% in 2015.
Although the proportion of acceptances of places by young women as increased, mainly through the efforts of universities offering places to most young women applying for places, we need to put this into perspective. Retention of young women until year 12 has been much higher than young men for some time. At the same time, far more young women go to university than young men. In 2010, 60,211 young men accepted places at university compared to 84,189 young women. The numbers of young men grew by 13.1% by 2015 to
19 The proportion of applicants who received an offer. 20 The proportion of applicants for places that accept offers made to them.
Engineers Australia
THE ENGINEERING PROFESSION 44
68,093. Growth in the number of young women accepting places grew more slowly, increasing by 10.1% to 92,694.
When seen against these figures, the gender situation in engineering is direr. In 2010, 15.1% of young men accepted university places in engineering. This share increased to peak at 15.5% in 2012 and 2013. The share has since fallen; to 14.3% in 2014 and to 13.5% in 2015. In contrast, the average share of young women accepting places in engineering over this period was 1.8%, 2.0% in 2015. Proportionally fewer young men are accepting places in engineering while the proportion of young women doing so is stuck at 2% or less.
Since 2010, the number of direct applications to universities for places in engineering has increased markedly. In 2010, there were 2,038 direct applications, 1,812 from men and 226 from women. Direct applications were 10.9% of total applications. By 2015, direct applications had increased by almost 2⅖times to 4,873, 4,209 men and 664 women. The proportion of direct applications received from women increased from 11.1% to 13.6% in 2015.
Offers rates were higher for direct applicant men than men in the TAC process but the reverse was the case for women. The offer rate for men ranged from 82.9% to 92.0%, but for women the range was 83.6% to 90.5%. Acceptance rates were similar between direct applicants and TAC applicants but for both men and women appeared to increase in recent years. For men the acceptance rate ranged from 62.6% to 77.3% and for women from 62.5% to 70.2%. The result was acceptances from 3,715 men and 461 women, giving 3,715 overall.
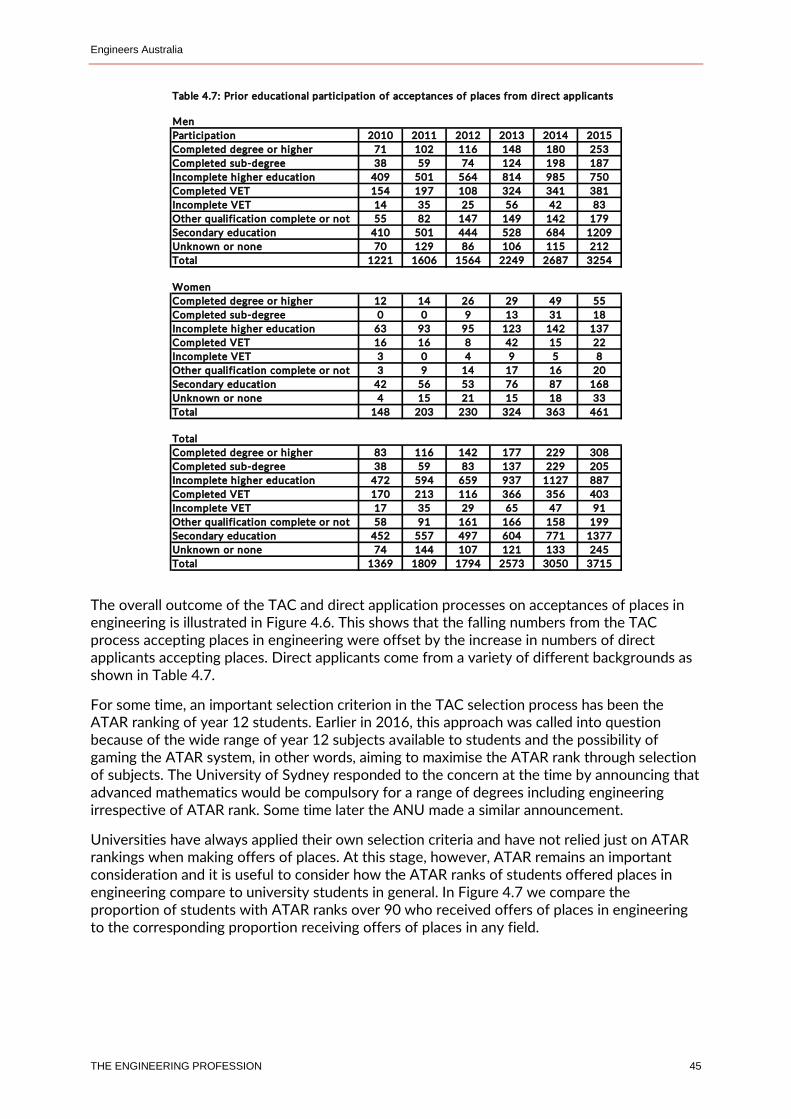
Engineers Australia
THE ENGINEERING PROFESSION 45
The overall outcome of the TAC and direct application processes on acceptances of places in engineering is illustrated in Figure 4.6. This shows that the falling numbers from the TAC process accepting places in engineering were offset by the increase in numbers of direct applicants accepting places. Direct applicants come from a variety of different backgrounds as shown in Table 4.7.
For some time, an important selection criterion in the TAC selection process has been the ATAR ranking of year 12 students. Earlier in 2016, this approach was called into question because of the wide range of year 12 subjects available to students and the possibility of gaming the ATAR system, in other words, aiming to maximise the ATAR rank through selection of subjects. The University of Sydney responded to the concern at the time by announcing that advanced mathematics would be compulsory for a range of degrees including engineering irrespective of ATAR rank. Some time later the ANU made a similar announcement.
Universities have always applied their own selection criteria and have not relied just on ATAR rankings when making offers of places. At this stage, however, ATAR remains an important consideration and it is useful to consider how the ATAR ranks of students offered places in engineering compare to university students in general. In Figure 4.7 we compare the proportion of students with ATAR ranks over 90 who received offers of places in engineering to the corresponding proportion receiving offers of places in any field.
Table 4.7: Prior educational participation of acceptances of places from direct applicants
Men
Participation 2010 2011 2012 2013 2014 2015
Completed degree or higher 71 102 116 148 180 253
Completed sub-degree 38 59 74 124 198 187
Incomplete higher education 409 501 564 814 985 750
Completed VET 154 197 108 324 341 381
Incomplete VET 14 35 25 56 42 83
Other qualification complete or not 55 82 147 149 142 179
Secondary education 410 501 444 528 684 1209
Unknown or none 70 129 86 106 115 212
Total 1221 1606 1564 2249 2687 3254
Women
Completed degree or higher 12 14 26 29 49 55
Completed sub-degree 0 0 9 13 31 18
Incomplete higher education 63 93 95 123 142 137
Completed VET 16 16 8 42 15 22
Incomplete VET 3 0 4 9 5 8
Other qualification complete or not 3 9 14 17 16 20
Secondary education 42 56 53 76 87 168
Unknown or none 4 15 21 15 18 33
Total 148 203 230 324 363 461
Total
Completed degree or higher 83 116 142 177 229 308
Completed sub-degree 38 59 83 137 229 205
Incomplete higher education 472 594 659 937 1127 887
Completed VET 170 213 116 366 356 403
Incomplete VET 17 35 29 65 47 91
Other qualification complete or not 58 91 161 166 158 199
Secondary education 452 557 497 604 771 1377
Unknown or none 74 144 107 121 133 245
Total 1369 1809 1794 2573 3050 3715
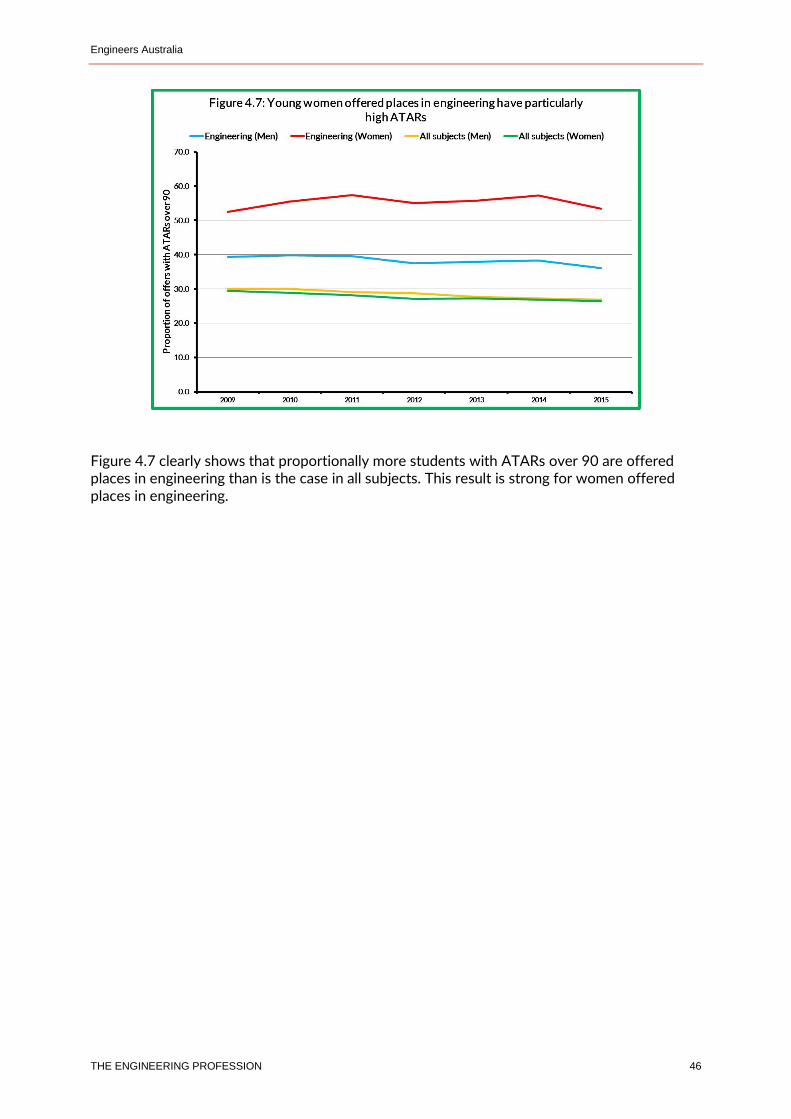
Engineers Australia
THE ENGINEERING PROFESSION 46
Figure 4.7 clearly shows that proportionally more students with ATARs over 90 are offered places in engineering than is the case in all subjects. This result is strong for women offered places in engineering.
Engineers Australia
THE ENGINEERING PROFESSION 47
Chapter 5: Engineering education
Main Points This Chapter reviews statistics relating to engineering education at Australian universities. Statistics for two groups of students are discussed; domestic students, Australian citizens and permanent residents who directly feed into the Australian engineering workforce and overseas students, international students studying in Australia on temporary visa. The latter are an important source of export income for universities and a major source for on-shore visa applicants in Australia’s skilled migration program.
After many years of increases, commencements by domestic students in entry level engineering courses have now fallen for two years. Despite these falls commencements remain comparatively high. Completions of entry level courses by this group continue to increase and will do so until the fall in commencements progresses through the system over time. About three quarters of entry level completions occurred in the three eastern States.
Commencements and completions of post-graduate courses in engineering continue to trend upwards but last year there was a dip in commencements compared to the previous year. Over 60% of post-graduate completions occurred in NSW and Victoria.
The population of domestic students studying engineering in Australia has increased to 68,028.
In 2015, 44.4% of overseas students commenced entry level courses in engineering with the rest commencing post-graduate courses. Entry level completions fell in 2015 while post-graduate completions continued to increase driven by doctoral and coursework masters degrees.
The proportion of women studying engineering continues to be low, particularly in entry level courses where it was 14.9% in 2015. Women have a greater propensity to pursue post-graduate qualifications than men. In 2015, the proportion of women in these courses was 19.9%.
5.1 Domestic students
The engineering student body, as is the case in other fields of education, comprises two groups. Domestic students are essentially citizens and permanent residents of Australia who are able to take advantage of Australian student loan arrangements and deferred arrangements for repayment of fees. On completion of their courses this group is able to directly join the engineering labour market. The second group comprises overseas full fee paying students who study in Australia while on temporary student visas. Universities earn export income from the education of this group. Although there are provisions that enable overseas students to remain in Australia following completion of their courses, in all cases students must convert temporary student visas to other temporary visas or permanent visas. In Engineers Australia’s statistics, domestic students represent Australia developing its own engineers and overseas students who remain in Australia are included as a component of skilled migration intakes. This section discusses commencements, enrolments and completions of engineering courses by domestic students at Australian universities.
Engineers Australia
THE ENGINEERING PROFESSION 48
Statistics on commencements of engineering courses by domestic students are presented in Table 5.1. Courses of all levels are included and the three panels of the Table provide statistics for men, women and both genders combined. Formal statistics are only available on this basis. Three groups of courses are covered; post graduate courses include doctoral degrees, masters degrees, both by research and coursework and a range of post graduate diplomas and certificates. Entry level courses include bachelor degrees, associate degrees and advanced diplomas. Although the ABS defines bachelor degrees as courses with duration from three to six years, the Department of Education and Training is able to differentiate between three, four and more than four year courses. These statistics are covered in the next chapter. Finally, there is a range of sub-graduate courses comprised of diplomas and other undergraduate programs.
Statistics on course completions are presented on the same basis in Table 5.2. Readers should note that relating Tables 5.1 and 5.2 does not yield sensible course completion rates. To estimate course completion rates longitudinal statistics on the starting cohort of students are required because courses vary in full time duration, students transfer between courses within engineering and students transfer between faculties. Having said this, course commencements can provide a crude guide to the likely trend in course completions in the future. With this in mind, Figure 5.1 illustrates the trends in entry level course commencements and completions by domestic students.
In 2001, 11,012 domestic students commenced entry level courses in engineering with 98% commencing bachelor degrees. Over the next six years commencements declined and it was not until 2007 that the 2001 figure was exceeded. Both degree and associate qualification commencements contributed to that result. From 2007 onwards commencements steadily increased and peaked at 16,707 in 2013. The situation reversed in 2014 and 2015 with falls in each year. The 2015 result, 16,074 commencements, never-the-less was the third highest outcome on record.
In 2001, there were 6,201 completions of entry level courses by domestic students. Although there was some annual variability, completions were static until 2008, averaging just 6,016. It was not until 2009 that completions definitively increased above the 2001 level. They have continued to increase each year since, recording a 3.7% increase in 2015 to 8,204. Given the trend in commencements, completions are likely to continue to increase for another two to three years and then begin to fall unless the trend in commencements reverses.
Figure 5.2 illustrates the commencement and completion trends for post graduate courses in engineering. The same caveat concerning estimation of completion rates applies to these statistics. Post graduate trends exhibit greater variability than entry level counterparts. There were two notable downturns in commencements; the first was from 2004 to 2007 and coincided with the emergence of acute skill shortages and the second was from 2010 to 2011 which coincided with a sharp increase in demand for engineers following the disruption caused by the global financial crisis (GFC). Post graduate commencements peaked in 2014 and fell in 2015 but are still at historically high levels. In 2015, there were 3,906 post graduate commencements, 4.5% down on 2014. The main driver of change has been coursework masters degrees.
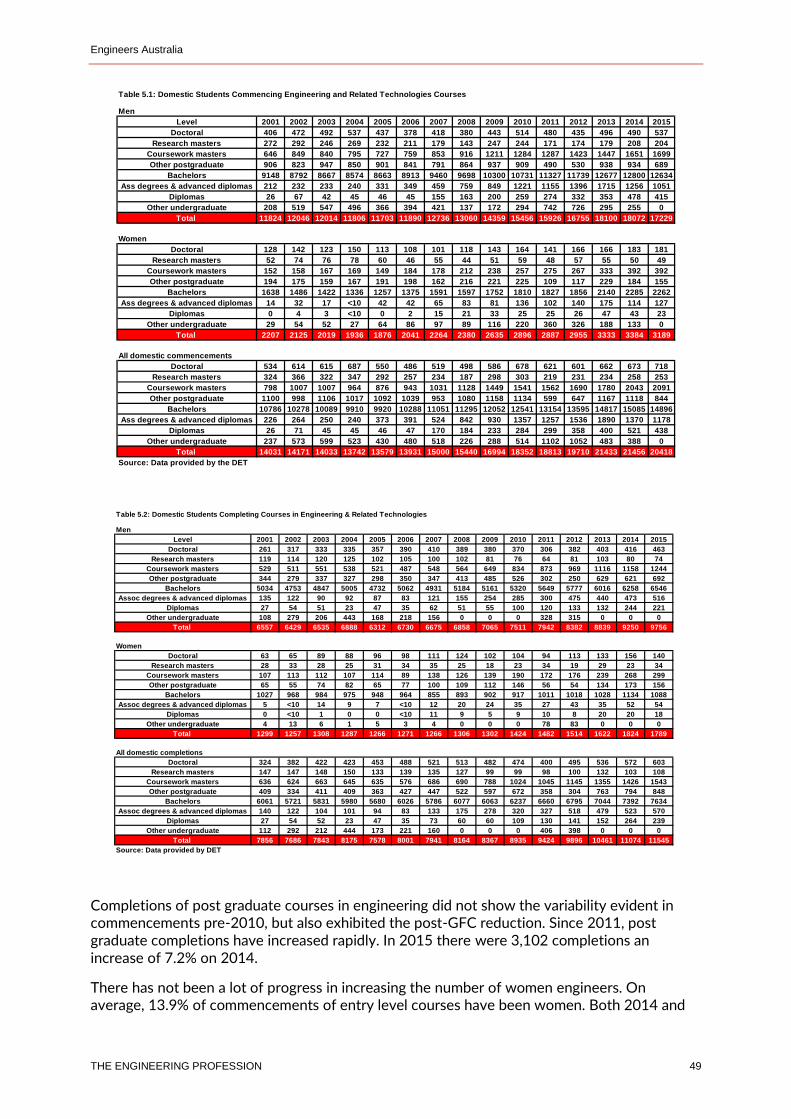
Engineers Australia
THE ENGINEERING PROFESSION 49
Completions of post graduate courses in engineering did not show the variability evident in commencements pre-2010, but also exhibited the post-GFC reduction. Since 2011, post graduate completions have increased rapidly. In 2015 there were 3,102 completions an increase of 7.2% on 2014.
There has not been a lot of progress in increasing the number of women engineers. On average, 13.9% of commencements of entry level courses have been women. Both 2014 and
Table 5.1: Domestic Students Commencing Engineering and Related Technologies Courses
Men
Level 2001 2002 2003 2004 2005 2006 2007 2008 2009 2010 2011 2012 2013 2014 2015
Doctoral 406 472 492 537 437 378 418 380 443 514 480 435 496 490 537
Research masters 272 292 246 269 232 211 179 143 247 244 171 174 179 208 204
Coursework masters 646 849 840 795 727 759 853 916 1211 1284 1287 1423 1447 1651 1699
Other postgraduate 906 823 947 850 901 841 791 864 937 909 490 530 938 934 689
Bachelors 9148 8792 8667 8574 8663 8913 9460 9698 10300 10731 11327 11739 12677 12800 12634
Ass degrees & advanced diplomas 212 232 233 240 331 349 459 759 849 1221 1155 1396 1715 1256 1051
Diplomas 26 67 42 45 46 45 155 163 200 259 274 332 353 478 415
Other undergraduate 208 519 547 496 366 394 421 137 172 294 742 726 295 255 0
Total 11824 12046 12014 11806 11703 11890 12736 13060 14359 15456 15926 16755 18100 18072 17229
Women
Doctoral 128 142 123 150 113 108 101 118 143 164 141 166 166 183 181
Research masters 52 74 76 78 60 46 55 44 51 59 48 57 55 50 49
Coursework masters 152 158 167 169 149 184 178 212 238 257 275 267 333 392 392
Other postgraduate 194 175 159 167 191 198 162 216 221 225 109 117 229 184 155
Bachelors 1638 1486 1422 1336 1257 1375 1591 1597 1752 1810 1827 1856 2140 2285 2262
Ass degrees & advanced diplomas 14 32 17 <10 42 42 65 83 81 136 102 140 175 114 127
Diplomas 0 4 3 <10 0 2 15 21 33 25 25 26 47 43 23
Other undergraduate 29 54 52 27 64 86 97 89 116 220 360 326 188 133 0
Total 2207 2125 2019 1936 1876 2041 2264 2380 2635 2896 2887 2955 3333 3384 3189
All domestic commencements
Doctoral 534 614 615 687 550 486 519 498 586 678 621 601 662 673 718
Research masters 324 366 322 347 292 257 234 187 298 303 219 231 234 258 253
Coursework masters 798 1007 1007 964 876 943 1031 1128 1449 1541 1562 1690 1780 2043 2091
Other postgraduate 1100 998 1106 1017 1092 1039 953 1080 1158 1134 599 647 1167 1118 844
Bachelors 10786 10278 10089 9910 9920 10288 11051 11295 12052 12541 13154 13595 14817 15085 14896
Ass degrees & advanced diplomas 226 264 250 240 373 391 524 842 930 1357 1257 1536 1890 1370 1178
Diplomas 26 71 45 45 46 47 170 184 233 284 299 358 400 521 438
Other undergraduate 237 573 599 523 430 480 518 226 288 514 1102 1052 483 388 0
Total 14031 14171 14033 13742 13579 13931 15000 15440 16994 18352 18813 19710 21433 21456 20418
Source: Data provided by the DET
Table 5.2: Domestic Students Completing Courses in Engineering & Related Technologies
Men
Level 2001 2002 2003 2004 2005 2006 2007 2008 2009 2010 2011 2012 2013 2014 2015
Doctoral 261 317 333 335 357 390 410 389 380 370 306 382 403 416 463
Research masters 119 114 120 125 102 105 100 102 81 76 64 81 103 80 74
Coursework masters 529 511 551 538 521 487 548 564 649 834 873 969 1116 1158 1244
Other postgraduate 344 279 337 327 298 350 347 413 485 526 302 250 629 621 692
Bachelors 5034 4753 4847 5005 4732 5062 4931 5184 5161 5320 5649 5777 6016 6258 6546
Assoc degrees & advanced diplomas 135 122 90 92 87 83 121 155 254 285 300 475 440 473 516
Diplomas 27 54 51 23 47 35 62 51 55 100 120 133 132 244 221
Other undergraduate 108 279 206 443 168 218 156 0 0 0 328 315 0 0 0
Total 6557 6429 6535 6888 6312 6730 6675 6858 7065 7511 7942 8382 8839 9250 9756
Women
Doctoral 63 65 89 88 96 98 111 124 102 104 94 113 133 156 140
Research masters 28 33 28 25 31 34 35 25 18 23 34 19 29 23 34
Coursework masters 107 113 112 107 114 89 138 126 139 190 172 176 239 268 299
Other postgraduate 65 55 74 82 65 77 100 109 112 146 56 54 134 173 156
Bachelors 1027 968 984 975 948 964 855 893 902 917 1011 1018 1028 1134 1088
Assoc degrees & advanced diplomas 5 <10 14 9 7 <10 12 20 24 35 27 43 35 52 54
Diplomas 0 <10 1 0 0 <10 11 9 5 9 10 8 20 20 18
Other undergraduate 4 13 6 1 5 3 4 0 0 0 78 83 0 0 0
Total 1299 1257 1308 1287 1266 1271 1266 1306 1302 1424 1482 1514 1622 1824 1789
All domestic completions
Doctoral 324 382 422 423 453 488 521 513 482 474 400 495 536 572 603
Research masters 147 147 148 150 133 139 135 127 99 99 98 100 132 103 108
Coursework masters 636 624 663 645 635 576 686 690 788 1024 1045 1145 1355 1426 1543
Other postgraduate 409 334 411 409 363 427 447 522 597 672 358 304 763 794 848
Bachelors 6061 5721 5831 5980 5680 6026 5786 6077 6063 6237 6660 6795 7044 7392 7634
Assoc degrees & advanced diplomas 140 122 104 101 94 83 133 175 278 320 327 518 479 523 570
Diplomas 27 54 52 23 47 35 73 60 60 109 130 141 152 264 239
Other undergraduate 112 292 212 444 173 221 160 0 0 0 406 398 0 0 0
Total 7856 7686 7843 8175 7578 8001 7941 8164 8367 8935 9424 9896 10461 11074 11545
Source: Data provided by DET
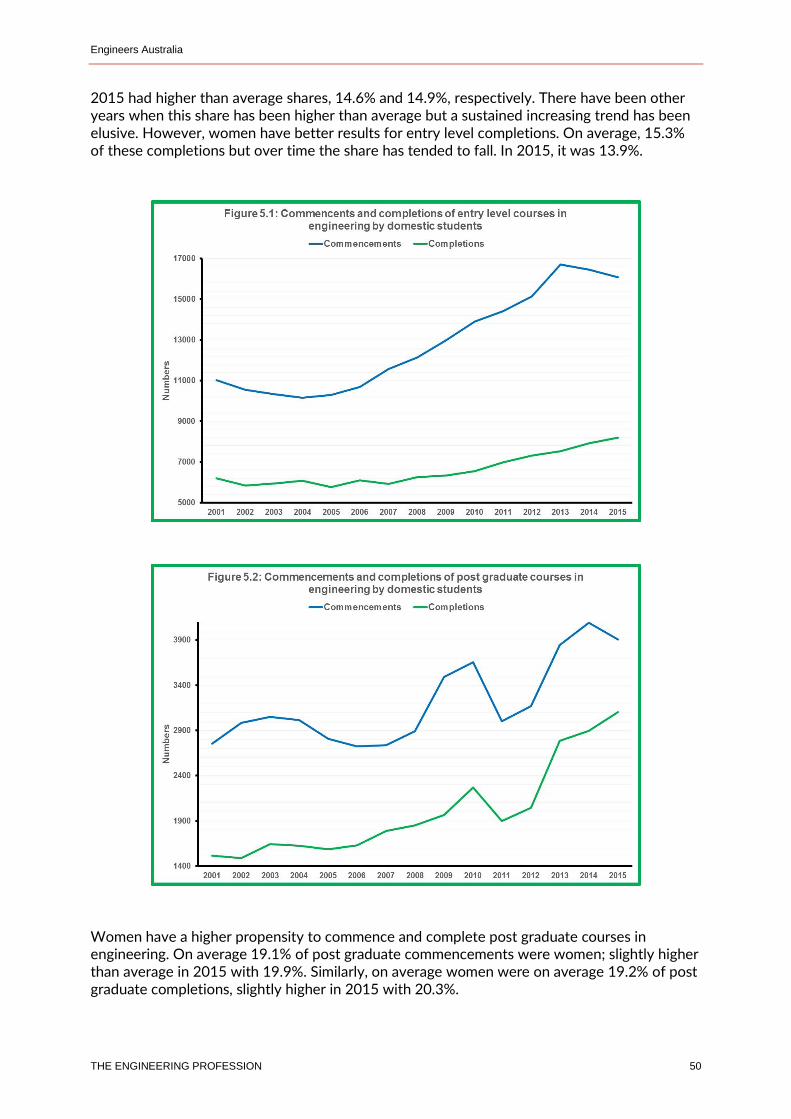
Engineers Australia
THE ENGINEERING PROFESSION 50
2015 had higher than average shares, 14.6% and 14.9%, respectively. There have been other years when this share has been higher than average but a sustained increasing trend has been elusive. However, women have better results for entry level completions. On average, 15.3% of these completions but over time the share has tended to fall. In 2015, it was 13.9%.
Women have a higher propensity to commence and complete post graduate courses in engineering. On average 19.1% of post graduate commencements were women; slightly higher than average in 2015 with 19.9%. Similarly, on average women were on average 19.2% of post graduate completions, slightly higher in 2015 with 20.3%.
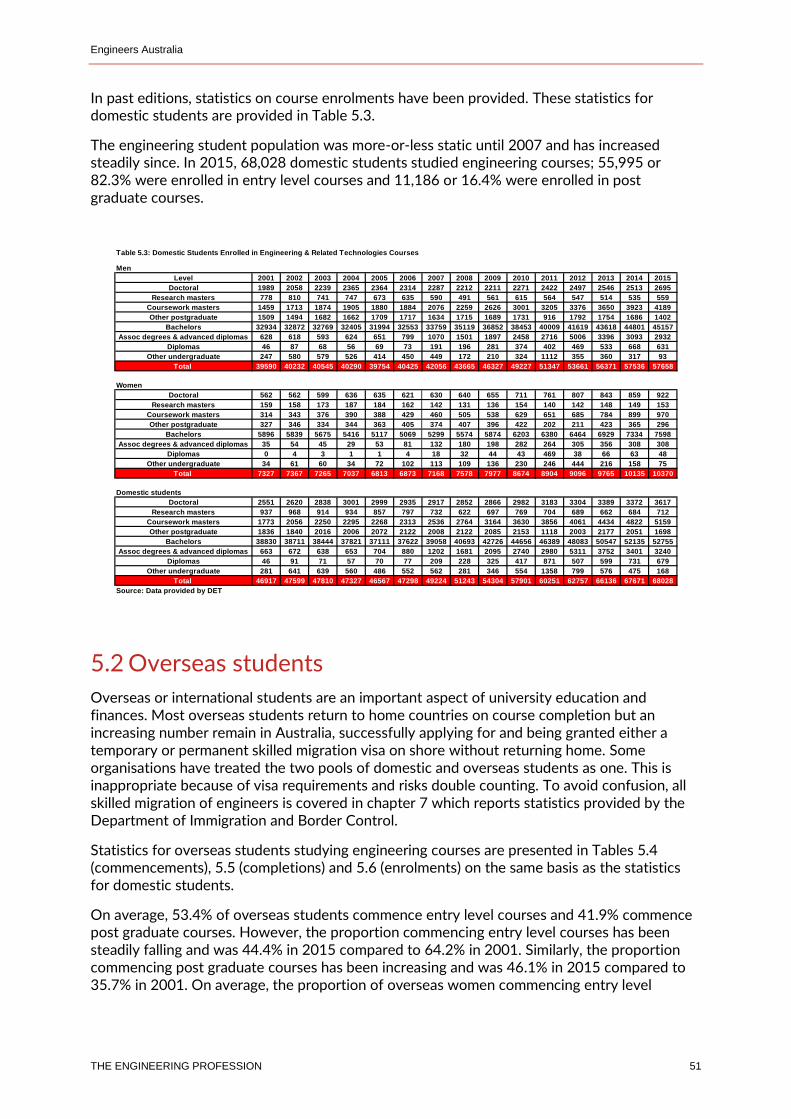
Engineers Australia
THE ENGINEERING PROFESSION 51
In past editions, statistics on course enrolments have been provided. These statistics for domestic students are provided in Table 5.3.
The engineering student population was more-or-less static until 2007 and has increased steadily since. In 2015, 68,028 domestic students studied engineering courses; 55,995 or 82.3% were enrolled in entry level courses and 11,186 or 16.4% were enrolled in post graduate courses.
5.2 Overseas students
Overseas or international students are an important aspect of university education and finances. Most overseas students return to home countries on course completion but an increasing number remain in Australia, successfully applying for and being granted either a temporary or permanent skilled migration visa on shore without returning home. Some organisations have treated the two pools of domestic and overseas students as one. This is inappropriate because of visa requirements and risks double counting. To avoid confusion, all skilled migration of engineers is covered in chapter 7 which reports statistics provided by the Department of Immigration and Border Control.
Statistics for overseas students studying engineering courses are presented in Tables 5.4 (commencements), 5.5 (completions) and 5.6 (enrolments) on the same basis as the statistics for domestic students.
On average, 53.4% of overseas students commence entry level courses and 41.9% commence post graduate courses. However, the proportion commencing entry level courses has been steadily falling and was 44.4% in 2015 compared to 64.2% in 2001. Similarly, the proportion commencing post graduate courses has been increasing and was 46.1% in 2015 compared to 35.7% in 2001. On average, the proportion of overseas women commencing entry level
Table 5.3: Domestic Students Enrolled in Engineering & Related Technologies Courses
Men
Level 2001 2002 2003 2004 2005 2006 2007 2008 2009 2010 2011 2012 2013 2014 2015
Doctoral 1989 2058 2239 2365 2364 2314 2287 2212 2211 2271 2422 2497 2546 2513 2695
Research masters 778 810 741 747 673 635 590 491 561 615 564 547 514 535 559
Coursework masters 1459 1713 1874 1905 1880 1884 2076 2259 2626 3001 3205 3376 3650 3923 4189
Other postgraduate 1509 1494 1682 1662 1709 1717 1634 1715 1689 1731 916 1792 1754 1686 1402
Bachelors 32934 32872 32769 32405 31994 32553 33759 35119 36852 38453 40009 41619 43618 44801 45157
Assoc degrees & advanced diplomas 628 618 593 624 651 799 1070 1501 1897 2458 2716 5006 3396 3093 2932
Diplomas 46 87 68 56 69 73 191 196 281 374 402 469 533 668 631
Other undergraduate 247 580 579 526 414 450 449 172 210 324 1112 355 360 317 93
Total 39590 40232 40545 40290 39754 40425 42056 43665 46327 49227 51347 53661 56371 57536 57658
Women
Doctoral 562 562 599 636 635 621 630 640 655 711 761 807 843 859 922
Research masters 159 158 173 187 184 162 142 131 136 154 140 142 148 149 153
Coursework masters 314 343 376 390 388 429 460 505 538 629 651 685 784 899 970
Other postgraduate 327 346 334 344 363 405 374 407 396 422 202 211 423 365 296
Bachelors 5896 5839 5675 5416 5117 5069 5299 5574 5874 6203 6380 6464 6929 7334 7598
Assoc degrees & advanced diplomas 35 54 45 29 53 81 132 180 198 282 264 305 356 308 308
Diplomas 0 4 3 1 1 4 18 32 44 43 469 38 66 63 48
Other undergraduate 34 61 60 34 72 102 113 109 136 230 246 444 216 158 75
Total 7327 7367 7265 7037 6813 6873 7168 7578 7977 8674 8904 9096 9765 10135 10370
Domestic students
Doctoral 2551 2620 2838 3001 2999 2935 2917 2852 2866 2982 3183 3304 3389 3372 3617
Research masters 937 968 914 934 857 797 732 622 697 769 704 689 662 684 712
Coursework masters 1773 2056 2250 2295 2268 2313 2536 2764 3164 3630 3856 4061 4434 4822 5159
Other postgraduate 1836 1840 2016 2006 2072 2122 2008 2122 2085 2153 1118 2003 2177 2051 1698
Bachelors 38830 38711 38444 37821 37111 37622 39058 40693 42726 44656 46389 48083 50547 52135 52755
Assoc degrees & advanced diplomas 663 672 638 653 704 880 1202 1681 2095 2740 2980 5311 3752 3401 3240
Diplomas 46 91 71 57 70 77 209 228 325 417 871 507 599 731 679
Other undergraduate 281 641 639 560 486 552 562 281 346 554 1358 799 576 475 168
Total 46917 47599 47810 47327 46567 47298 49224 51243 54304 57901 60251 62757 66136 67671 68028
Source: Data provided by DET
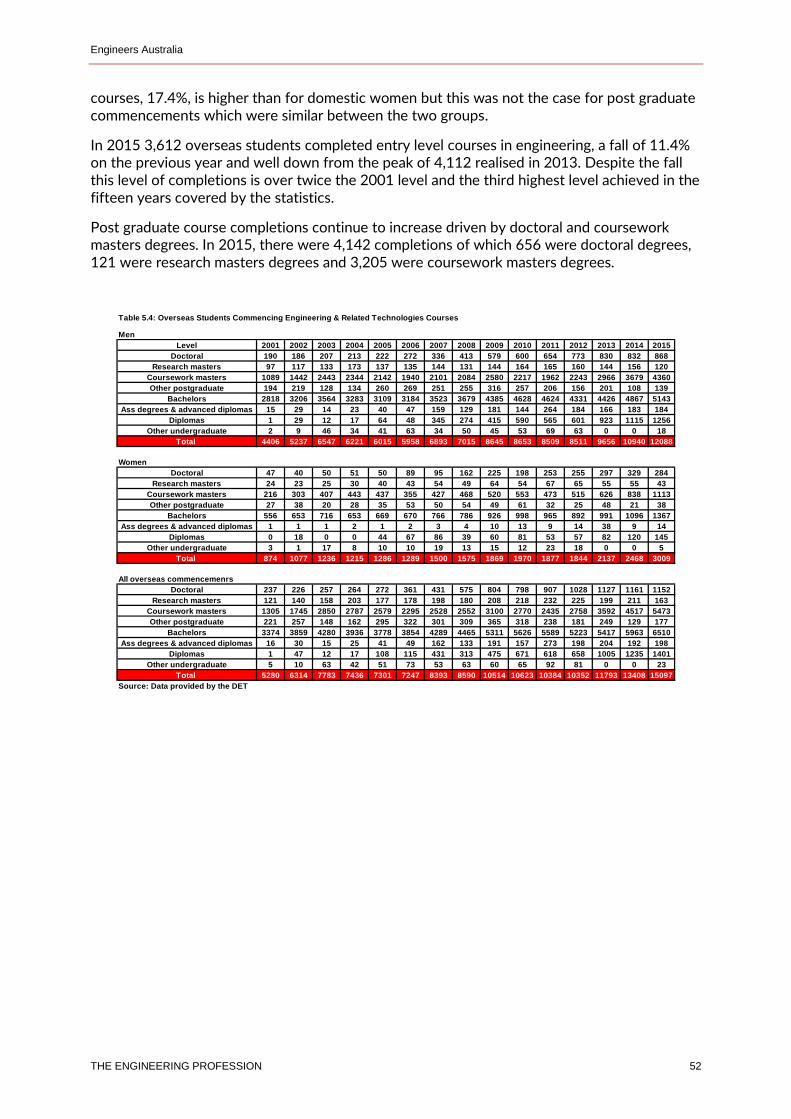
Engineers Australia
THE ENGINEERING PROFESSION 52
courses, 17.4%, is higher than for domestic women but this was not the case for post graduate commencements which were similar between the two groups.
In 2015 3,612 overseas students completed entry level courses in engineering, a fall of 11.4% on the previous year and well down from the peak of 4,112 realised in 2013. Despite the fall this level of completions is over twice the 2001 level and the third highest level achieved in the fifteen years covered by the statistics.
Post graduate course completions continue to increase driven by doctoral and coursework masters degrees. In 2015, there were 4,142 completions of which 656 were doctoral degrees, 121 were research masters degrees and 3,205 were coursework masters degrees.
Table 5.4: Overseas Students Commencing Engineering & Related Technologies Courses
Men
Level 2001 2002 2003 2004 2005 2006 2007 2008 2009 2010 2011 2012 2013 2014 2015
Doctoral 190 186 207 213 222 272 336 413 579 600 654 773 830 832 868
Research masters 97 117 133 173 137 135 144 131 144 164 165 160 144 156 120
Coursework masters 1089 1442 2443 2344 2142 1940 2101 2084 2580 2217 1962 2243 2966 3679 4360
Other postgraduate 194 219 128 134 260 269 251 255 316 257 206 156 201 108 139
Bachelors 2818 3206 3564 3283 3109 3184 3523 3679 4385 4628 4624 4331 4426 4867 5143
Ass degrees & advanced diplomas 15 29 14 23 40 47 159 129 181 144 264 184 166 183 184
Diplomas 1 29 12 17 64 48 345 274 415 590 565 601 923 1115 1256
Other undergraduate 2 9 46 34 41 63 34 50 45 53 69 63 0 0 18
Total 4406 5237 6547 6221 6015 5958 6893 7015 8645 8653 8509 8511 9656 10940 12088
Women
Doctoral 47 40 50 51 50 89 95 162 225 198 253 255 297 329 284
Research masters 24 23 25 30 40 43 54 49 64 54 67 65 55 55 43
Coursework masters 216 303 407 443 437 355 427 468 520 553 473 515 626 838 1113
Other postgraduate 27 38 20 28 35 53 50 54 49 61 32 25 48 21 38
Bachelors 556 653 716 653 669 670 766 786 926 998 965 892 991 1096 1367
Ass degrees & advanced diplomas 1 1 1 2 1 2 3 4 10 13 9 14 38 9 14
Diplomas 0 18 0 0 44 67 86 39 60 81 53 57 82 120 145
Other undergraduate 3 1 17 8 10 10 19 13 15 12 23 18 0 0 5
Total 874 1077 1236 1215 1286 1289 1500 1575 1869 1970 1877 1844 2137 2468 3009
All overseas commencemenrs
Doctoral 237 226 257 264 272 361 431 575 804 798 907 1028 1127 1161 1152
Research masters 121 140 158 203 177 178 198 180 208 218 232 225 199 211 163
Coursework masters 1305 1745 2850 2787 2579 2295 2528 2552 3100 2770 2435 2758 3592 4517 5473
Other postgraduate 221 257 148 162 295 322 301 309 365 318 238 181 249 129 177
Bachelors 3374 3859 4280 3936 3778 3854 4289 4465 5311 5626 5589 5223 5417 5963 6510
Ass degrees & advanced diplomas 16 30 15 25 41 49 162 133 191 157 273 198 204 192 198
Diplomas 1 47 12 17 108 115 431 313 475 671 618 658 1005 1235 1401
Other undergraduate 5 10 63 42 51 73 53 63 60 65 92 81 0 0 23
Total 5280 6314 7783 7436 7301 7247 8393 8590 10514 10623 10384 10352 11793 13408 15097
Source: Data provided by the DET
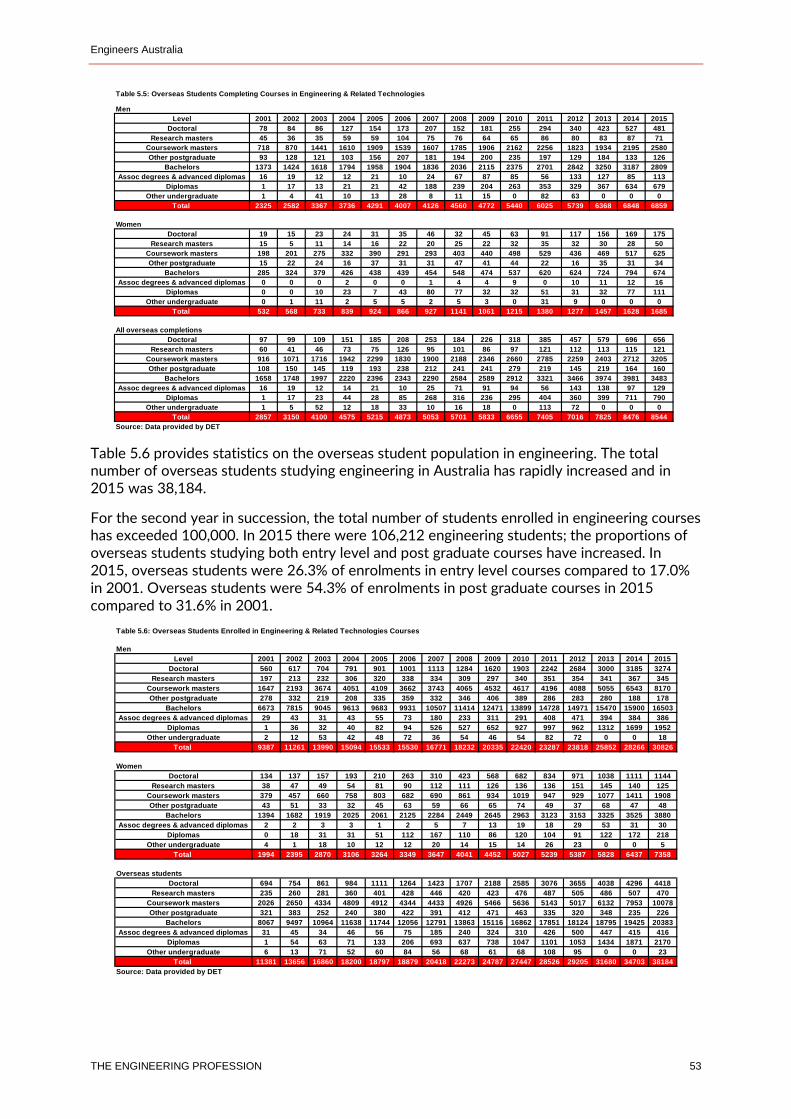
Engineers Australia
THE ENGINEERING PROFESSION 53
Table 5.6 provides statistics on the overseas student population in engineering. The total number of overseas students studying engineering in Australia has rapidly increased and in 2015 was 38,184.
For the second year in succession, the total number of students enrolled in engineering courses has exceeded 100,000. In 2015 there were 106,212 engineering students; the proportions of overseas students studying both entry level and post graduate courses have increased. In 2015, overseas students were 26.3% of enrolments in entry level courses compared to 17.0% in 2001. Overseas students were 54.3% of enrolments in post graduate courses in 2015 compared to 31.6% in 2001.
Table 5.5: Overseas Students Completing Courses in Engineering & Related Technologies
Men
Level 2001 2002 2003 2004 2005 2006 2007 2008 2009 2010 2011 2012 2013 2014 2015
Doctoral 78 84 86 127 154 173 207 152 181 255 294 340 423 527 481
Research masters 45 36 35 59 59 104 75 76 64 65 86 80 83 87 71
Coursework masters 718 870 1441 1610 1909 1539 1607 1785 1906 2162 2256 1823 1934 2195 2580
Other postgraduate 93 128 121 103 156 207 181 194 200 235 197 129 184 133 126
Bachelors 1373 1424 1618 1794 1958 1904 1836 2036 2115 2375 2701 2842 3250 3187 2809
Assoc degrees & advanced diplomas 16 19 12 12 21 10 24 67 87 85 56 133 127 85 113
Diplomas 1 17 13 21 21 42 188 239 204 263 353 329 367 634 679
Other undergraduate 1 4 41 10 13 28 8 11 15 0 82 63 0 0 0
Total 2325 2582 3367 3736 4291 4007 4126 4560 4772 5440 6025 5739 6368 6848 6859
Women
Doctoral 19 15 23 24 31 35 46 32 45 63 91 117 156 169 175
Research masters 15 5 11 14 16 22 20 25 22 32 35 32 30 28 50
Coursework masters 198 201 275 332 390 291 293 403 440 498 529 436 469 517 625
Other postgraduate 15 22 24 16 37 31 31 47 41 44 22 16 35 31 34
Bachelors 285 324 379 426 438 439 454 548 474 537 620 624 724 794 674
Assoc degrees & advanced diplomas 0 0 0 2 0 0 1 4 4 9 0 10 11 12 16
Diplomas 0 0 10 23 7 43 80 77 32 32 51 31 32 77 111
Other undergraduate 0 1 11 2 5 5 2 5 3 0 31 9 0 0 0
Total 532 568 733 839 924 866 927 1141 1061 1215 1380 1277 1457 1628 1685
All overseas completions
Doctoral 97 99 109 151 185 208 253 184 226 318 385 457 579 696 656
Research masters 60 41 46 73 75 126 95 101 86 97 121 112 113 115 121
Coursework masters 916 1071 1716 1942 2299 1830 1900 2188 2346 2660 2785 2259 2403 2712 3205
Other postgraduate 108 150 145 119 193 238 212 241 241 279 219 145 219 164 160
Bachelors 1658 1748 1997 2220 2396 2343 2290 2584 2589 2912 3321 3466 3974 3981 3483
Assoc degrees & advanced diplomas 16 19 12 14 21 10 25 71 91 94 56 143 138 97 129
Diplomas 1 17 23 44 28 85 268 316 236 295 404 360 399 711 790
Other undergraduate 1 5 52 12 18 33 10 16 18 0 113 72 0 0 0
Total 2857 3150 4100 4575 5215 4873 5053 5701 5833 6655 7405 7016 7825 8476 8544
Source: Data provided by DET
Table 5.6: Overseas Students Enrolled in Engineering & Related Technologies Courses
Men
Level 2001 2002 2003 2004 2005 2006 2007 2008 2009 2010 2011 2012 2013 2014 2015
Doctoral 560 617 704 791 901 1001 1113 1284 1620 1903 2242 2684 3000 3185 3274
Research masters 197 213 232 306 320 338 334 309 297 340 351 354 341 367 345
Coursework masters 1647 2193 3674 4051 4109 3662 3743 4065 4532 4617 4196 4088 5055 6543 8170
Other postgraduate 278 332 219 208 335 359 332 346 406 389 286 283 280 188 178
Bachelors 6673 7815 9045 9613 9683 9931 10507 11414 12471 13899 14728 14971 15470 15900 16503
Assoc degrees & advanced diplomas 29 43 31 43 55 73 180 233 311 291 408 471 394 384 386
Diplomas 1 36 32 40 82 94 526 527 652 927 997 962 1312 1699 1952
Other undergraduate 2 12 53 42 48 72 36 54 46 54 82 72 0 0 18
Total 9387 11261 13990 15094 15533 15530 16771 18232 20335 22420 23287 23818 25852 28266 30826
Women
Doctoral 134 137 157 193 210 263 310 423 568 682 834 971 1038 1111 1144
Research masters 38 47 49 54 81 90 112 111 126 136 136 151 145 140 125
Coursework masters 379 457 660 758 803 682 690 861 934 1019 947 929 1077 1411 1908
Other postgraduate 43 51 33 32 45 63 59 66 65 74 49 37 68 47 48
Bachelors 1394 1682 1919 2025 2061 2125 2284 2449 2645 2963 3123 3153 3325 3525 3880
Assoc degrees & advanced diplomas 2 2 3 3 1 2 5 7 13 19 18 29 53 31 30
Diplomas 0 18 31 31 51 112 167 110 86 120 104 91 122 172 218
Other undergraduate 4 1 18 10 12 12 20 14 15 14 26 23 0 0 5
Total 1994 2395 2870 3106 3264 3349 3647 4041 4452 5027 5239 5387 5828 6437 7358
Overseas students
Doctoral 694 754 861 984 1111 1264 1423 1707 2188 2585 3076 3655 4038 4296 4418
Research masters 235 260 281 360 401 428 446 420 423 476 487 505 486 507 470
Coursework masters 2026 2650 4334 4809 4912 4344 4433 4926 5466 5636 5143 5017 6132 7953 10078
Other postgraduate 321 383 252 240 380 422 391 412 471 463 335 320 348 235 226
Bachelors 8067 9497 10964 11638 11744 12056 12791 13863 15116 16862 17851 18124 18795 19425 20383
Assoc degrees & advanced diplomas 31 45 34 46 56 75 185 240 324 310 426 500 447 415 416
Diplomas 1 54 63 71 133 206 693 637 738 1047 1101 1053 1434 1871 2170
Other undergraduate 6 13 71 52 60 84 56 68 61 68 108 95 0 0 23
Total 11381 13656 16860 18200 18797 18879 20418 22273 24787 27447 28526 29205 31680 34703 38184
Source: Data provided by DET
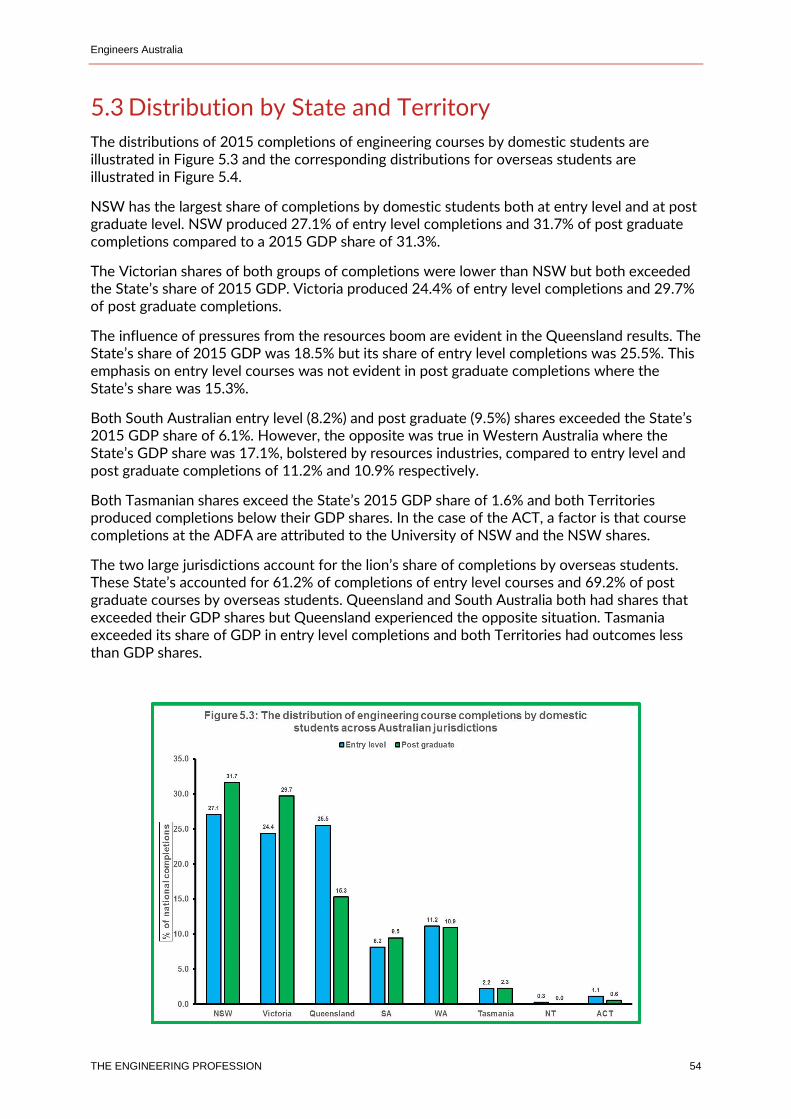
Engineers Australia
THE ENGINEERING PROFESSION 54
5.3 Distribution by State and Territory
The distributions of 2015 completions of engineering courses by domestic students are illustrated in Figure 5.3 and the corresponding distributions for overseas students are illustrated in Figure 5.4.
NSW has the largest share of completions by domestic students both at entry level and at post graduate level. NSW produced 27.1% of entry level completions and 31.7% of post graduate completions compared to a 2015 GDP share of 31.3%.
The Victorian shares of both groups of completions were lower than NSW but both exceeded the State’s share of 2015 GDP. Victoria produced 24.4% of entry level completions and 29.7% of post graduate completions.
The influence of pressures from the resources boom are evident in the Queensland results. The State’s share of 2015 GDP was 18.5% but its share of entry level completions was 25.5%. This emphasis on entry level courses was not evident in post graduate completions where the State’s share was 15.3%.
Both South Australian entry level (8.2%) and post graduate (9.5%) shares exceeded the State’s 2015 GDP share of 6.1%. However, the opposite was true in Western Australia where the State’s GDP share was 17.1%, bolstered by resources industries, compared to entry level and post graduate completions of 11.2% and 10.9% respectively.
Both Tasmanian shares exceed the State’s 2015 GDP share of 1.6% and both Territories produced completions below their GDP shares. In the case of the ACT, a factor is that course completions at the ADFA are attributed to the University of NSW and the NSW shares.
The two large jurisdictions account for the lion’s share of completions by overseas students. These State’s accounted for 61.2% of completions of entry level courses and 69.2% of post graduate courses by overseas students. Queensland and South Australia both had shares that exceeded their GDP shares but Queensland experienced the opposite situation. Tasmania exceeded its share of GDP in entry level completions and both Territories had outcomes less than GDP shares.
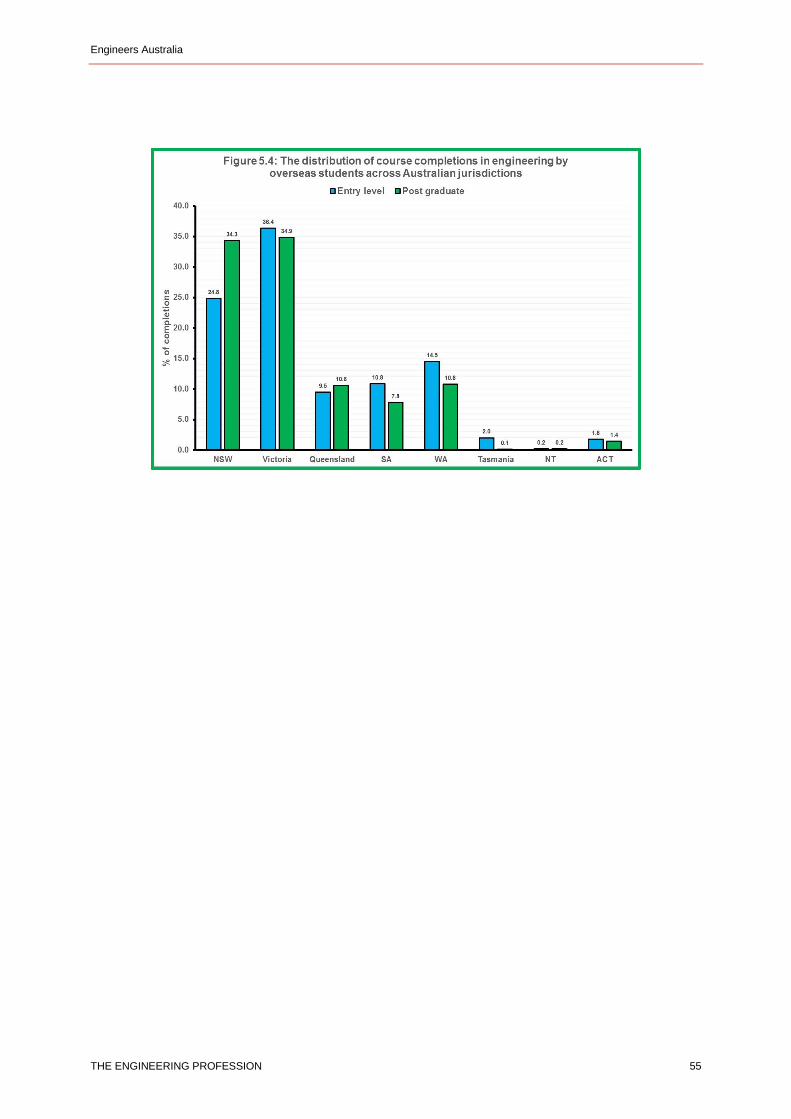
Engineers Australia
THE ENGINEERING PROFESSION 55
Engineers Australia
THE ENGINEERING PROFESSION 56
Chapter 6: Domestic completions and the supply of engineers
Main Points This Chapter discusses the flow of domestic engineering completions into the Australian engineering labour market in greater detail. We look at completions in the various streams of engineering bearing in mind that most engineering specialisation occurs during the post education process of on-the-job professional formation in engineering practice. The Chapter also looks at the experiences of new engineering graduates in the labour market.
Historically, more engineering graduates have shown a preference for full time work than graduates in other fields, and conversely a lower preference for full time post graduate education. Since 2009, these preferences have slowly changed but it remains the case that about 80% of engineering graduates prefer full time work compared to an average 63% in other fields.
However, fewer new engineering graduates available for full time work now succeed in finding it, with the proportion falling from 87.1% in 2009 to 73.5% in 2015. Despite this change, proportionally more engineers than graduates in other fields find full time work. Conversely, the proportion of new engineering graduates available for full time work but who are unemployed has increased substantially and is now higher than is the case for other new graduates. This result has severe implications for individuals concerned and for the future of the engineering profession because professional formation cannot begin until new graduates are in work.
Trends in different areas of entry level engineering courses have not changed over the past year and tend to reflect the pattern of demand established during the resources boom. A glaring trend is the large fall in completions in electrical and electronic engineering.
Although the proportion of women completing entry level courses in engineering has increased in each of the past two years, this has occurred against the background of a falling trend in this share.
In 2014, a record number of Australian citizens and permanent residents completed entry level courses of engineering adding 9,797 new entrants to the supply of engineers in Australia compared to 7,077 in 2003. We estimate that the number of new entrants will increase to 9,910 in 2016. The proportion of women engineers in 2016 is likely to be 13.2%.
6.1 Introduction
This chapter examines in greater detail how annual completions of entry level courses in engineering contribute to the supply of engineers. Some universities offer coursework masters programs as an entry qualification for Professional Engineer. Most graduates are overseas students seeking to upgrade qualifications from their home country. These graduates are not adequately covered by our statistics because of an inability to disentangle these masters programs from statistics on completions of more conventional programs. The saving grace is that overseas students completing these masters courses still need to comply with migration
Engineers Australia
THE ENGINEERING PROFESSION 57
formalities before working as engineers in Australia. Accordingly, they are included in the migration statistics covered in the next Chapter. Some domestic graduates also progress through this route, mainly as a means of upgrading their status from associate engineer or engineering technologists. These completions cannot be separately identified and results in an undercount of new professional engineers. In the main, these graduates are included in statistics for the profession as a whole by virtue of their existing qualifications.
The chapter provides statistics on engineering specialisations. These statistics are constructed in accordance with the current ABS classifications of occupations and relate to the specialisation of courses just completed. When specialisations are reported by universities to the Department of Education and Training the protocols used are inconsistent year on year with large numbers of completions allocated to “general” categories in some years but not in others. This limits the degree of disaggregation that is possible. Through experience we have found that the optimal approach is to utilise the three-digit level of the ANZSCO classification. This level of disaggregation obscures common specialisations and the following key explains the relationship between two:
Engineering and Related Technologies (not further defined); a “general” category
Process and Resource Engineering includes o Chemical Engineering o Mining Engineering o Materials Engineering o Food Processing Technology
Mechanical and Industrial Engineering includes o Mechanical Engineers o Industrial engineers
Civil Engineering includes o Civil Engineers o Construction Engineers o Building Services Engineers o Water and Sanitary Engineers o Transport Engineers o Geotechnical Engineers o Ocean Engineers
Electrical and Electronic Engineering includes o Electrical Engineers o Electronic Engineers o Computer Engineers o Communication Technologies
Aerospace Engineering includes
o Aerospace Engineers o Aircraft Maintenance Engineers
Maritime Engineering includes o Maritime Engineers o Maritime Construction Engineers
Other Engineering includes o Environmental Engineers
Engineers Australia
THE ENGINEERING PROFESSION 58
o Biomedical Engineers o Naval Architects o Other Engineers
The statistics in this Chapter are compiled in a different data set to those discussed in chapter 5 resulting in minor discrepancies between them. In most cases these differences are very small and do not alter conclusions about trends.
6.2 The experiences of new graduates
When they complete their first degree new graduates need to decide whether they are available for full time or part time work in the field of their degree or whether they want to pursue full time post graduate study. Figure 6.1 illustrates how new engineering graduates compare to new graduates overall in respect to this decision.
Engineers are more disposed to be available for full time work than new graduates generally. Follow the variability that accompanied the global financial crisis, the proportion of new engineering graduates available for full time work peaked at 85.0% in 2012. The proportion of new engineering graduates who pursued full time study was 8.6%. The remaining 6.4% of new engineering graduates were disposed to either part time work only or were not available for work of any kind or for full time education.
In 2012, in contrast 62.9% of all new graduates were available for full time work and 20.8% pursued full time study. A much higher proportion opted for part time work only or chose not to be available for either full or part time work or study.
As the labour market deteriorated after 2012, the proportion of new engineering graduates available for full time work has fallen and the proportion in full time study has increased. In 2015, the proportion of new engineering graduates available for full time work had fallen to 80.3% while the proportion in full time study had increased to 12.0%. The circumstances for new graduates in general was more-or-less steady between 2012 and 2015. The proportion
Engineers Australia
THE ENGINEERING PROFESSION 59
available for full time employment was slightly lower at 61.9% as was the proportion in full time study at 19.7%.
From a structural point of view, although there has been a deterioration in the proportion of engineers available for full time work, there is still a substantially higher disposition among new engineering graduates than new graduates generally. The proportion of new engineering graduates available only for part time work or not available for work of any kind of full time study has increased slightly to 7.7% but is less than half the share for new graduates in all fields.
Having established that over 80% of new engineering graduates are available for full time work, Figures 6.2 and 6.3 consider their experience in the labour market. Figure 6.2 shows that the proportion of new engineering graduates available for full time work who succeed in obtaining such jobs has been higher than new graduates generally. After the disturbance
Engineers Australia
THE ENGINEERING PROFESSION 60
caused by the global financial crisis, the proportion of new engineers who wanted full time work and found it was 86.7%, lower than the 87.1% recorded in 2009 but well above the 76.1% for new graduates generally. When evaluating these results bear in mind that they are from a survey undertaken about four months following graduation.
Since 2012, the situation has deteriorated markedly. The proportion of new engineering graduates available for full time work and obtaining it fell to a low of 72.2% in 2014 before recovering slightly to 73.5% in 2015. The deterioration for new graduates generally was not as great with the result that the wide gap between engineering and graduates generally has diminished. In 2012, the gap was 10.6 percentage points and this reduced to 4.7 percentage points in 2015. Conversely, the proportions of new engineering graduates available for full time work but accepting part time work has increased from 4.9% in 2009 to 5.9% in 2012 and 11.8% in 2015. The proportion of new graduates generally in this situation has always been higher than for engineers and has also increased.
Finally, Figure 6.3 considers the circumstances of new graduates who want full time work but failed to obtain it. The blue bars show the proportion of new engineering graduates who wanted full time work but were unemployed. This can be viewed as a surrogate unemployment rate for new engineering graduates. Consistent with the preceding discussion this measure has increased in recent years and in 2015 showed that 14.8% of new engineering graduates available for full time work were unemployed. Indeed, in the past two years, this measure of new graduate unemployment has been higher for engineers than new graduates generally.
The orange bars add together the unemployed new engineers just discussed and new engineers who want full time work but have accepted part time jobs. This measure has increased substantially in recent years and in 2015 showed that 26.5% of new engineering graduates who were available for full time work were unsuccessful in finding it.
6.3 Three year degrees in engineering
Completions of three year degrees in engineering qualify individuals to become engineering technologists. Trends relevant to these degrees are presented in Table 6.1. In 2015, there were 497 completions of three year degrees, down by 22.7% on the previous year. This result is a continuation of past trends; completions of these degrees represent the smallest element of engineering education and numbers have fluctuated up and down regularly over the past fifteen years.
6.4 Four year degrees in engineering
Completions of four year degrees in engineering qualify individuals to become professional engineers. There are two pathways towards this end; statistics relating to the first, four-year full time degrees in engineering, are presented in Table 6.2; statistics relating to the second pathway, four-year full time degrees in engineering undertaken in conjunction with a degree in another discipline, are presented in Table 6.3.
The number of conventional four year degrees completed increased by 2.8% from 4,938 in 2014 to 5,078 in 2015.The broad distribution of completions between different streams of engineering was largely unchanged. Similarly, the propensity of universities to utilise the general categories, 0300 and 0399, remained high with 39.6% of completions.
Completions of four-year double degrees in engineering increased by 5.8% from 1,911 to 2022 in 2015. The use of general categories was even higher in this case accounting for 59.9% of completions.
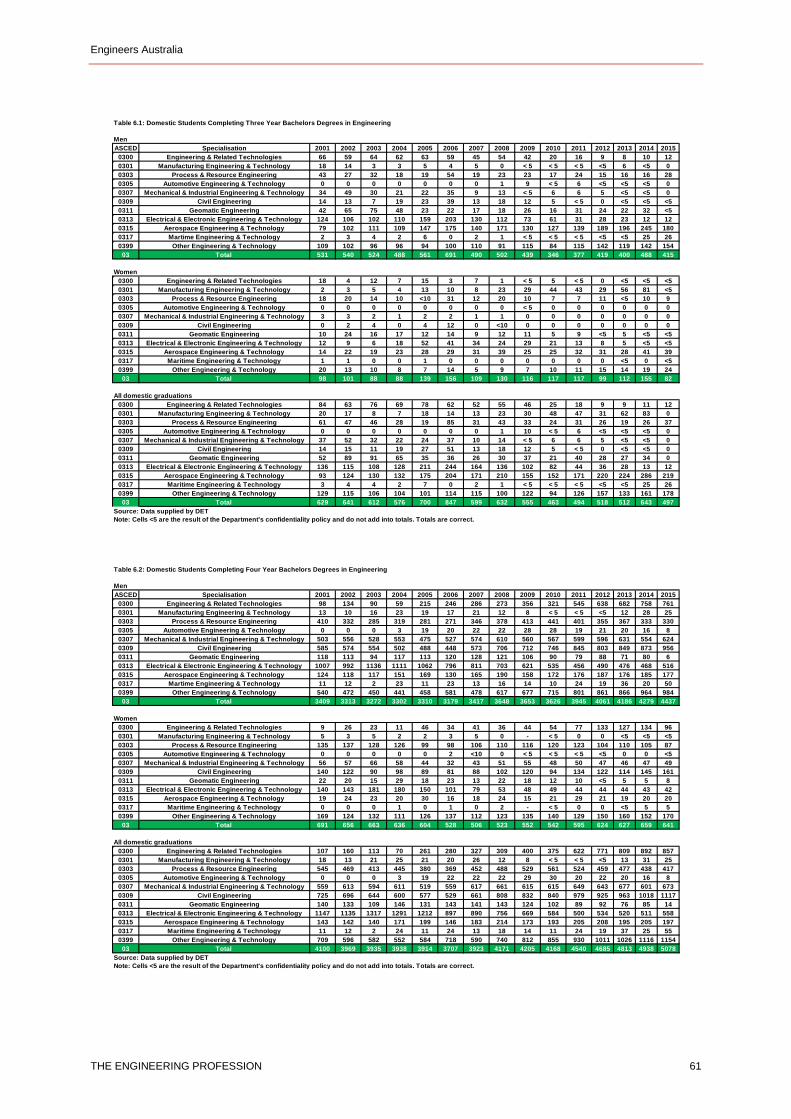
Engineers Australia
THE ENGINEERING PROFESSION 61
Table 6.1: Domestic Students Completing Three Year Bachelors Degrees in Engineering
Men
ASCED Specialisation 2001 2002 2003 2004 2005 2006 2007 2008 2009 2010 2011 2012 2013 2014 2015
0300 Engineering & Related Technologies 66 59 64 62 63 59 45 54 42 20 16 9 8 10 12
0301 Manufacturing Engineering & Technology 18 14 3 3 5 4 5 0 < 5 < 5 < 5 <5 6 <5 0
0303 Process & Resource Engineering 43 27 32 18 19 54 19 23 23 17 24 15 16 16 28
0305 Automotive Engineering & Technology 0 0 0 0 0 0 0 1 9 < 5 6 <5 <5 <5 0
0307 Mechanical & Industrial Engineering & Technology 34 49 30 21 22 35 9 13 < 5 6 6 5 <5 <5 0
0309 Civil Engineering 14 13 7 19 23 39 13 18 12 5 < 5 0 <5 <5 <5
0311 Geomatic Engineering 42 65 75 48 23 22 17 18 26 16 31 24 22 32 <5
0313 Electrical & Electronic Engineering & Technology 124 106 102 110 159 203 130 112 73 61 31 28 23 12 12
0315 Aerospace Engineering & Technology 79 102 111 109 147 175 140 171 130 127 139 189 196 245 180
0317 Martime Engineering & Technology 2 3 4 2 6 0 2 1 < 5 < 5 < 5 <5 <5 25 26
0399 Other Engineering & Technology 109 102 96 96 94 100 110 91 115 84 115 142 119 142 154
03 Total 531 540 524 488 561 691 490 502 439 346 377 419 400 488 415
Women
0300 Engineering & Related Technologies 18 4 12 7 15 3 7 1 < 5 5 < 5 0 <5 <5 <5
0301 Manufacturing Engineering & Technology 2 3 5 4 13 10 8 23 29 44 43 29 56 81 <5
0303 Process & Resource Engineering 18 20 14 10 <10 31 12 20 10 7 7 11 <5 10 9
0305 Automotive Engineering & Technology 0 0 0 0 0 0 0 0 < 5 0 0 0 0 0 0
0307 Mechanical & Industrial Engineering & Technology 3 3 2 1 2 2 1 1 0 0 0 0 0 0 0
0309 Civil Engineering 0 2 4 0 4 12 0 <10 0 0 0 0 0 0 0
0311 Geomatic Engineering 10 24 16 17 12 14 9 12 11 5 9 <5 5 <5 <5
0313 Electrical & Electronic Engineering & Technology 12 9 6 18 52 41 34 24 29 21 13 8 5 <5 <5
0315 Aerospace Engineering & Technology 14 22 19 23 28 29 31 39 25 25 32 31 28 41 39
0317 Maritime Engineering & Technology 1 1 0 0 1 0 0 0 0 0 0 0 <5 0 <5
0399 Other Engineering & Technology 20 13 10 8 7 14 5 9 7 10 11 15 14 19 24
03 Total 98 101 88 88 139 156 109 130 116 117 117 99 112 155 82
All domestic graduations
0300 Engineering & Related Technologies 84 63 76 69 78 62 52 55 46 25 18 9 9 11 12
0301 Manufacturing Engineering & Technology 20 17 8 7 18 14 13 23 30 48 47 31 62 83 0
0303 Process & Resource Engineering 61 47 46 28 19 85 31 43 33 24 31 26 19 26 37
0305 Automotive Engineering & Technology 0 0 0 0 0 0 0 1 10 < 5 6 <5 <5 <5 0
0307 Mechanical & Industrial Engineering & Technology 37 52 32 22 24 37 10 14 < 5 6 6 5 <5 <5 0
0309 Civil Engineering 14 15 11 19 27 51 13 18 12 5 < 5 0 <5 <5 0
0311 Geomatic Engineering 52 89 91 65 35 36 26 30 37 21 40 28 27 34 0
0313 Electrical & Electronic Engineering & Technology 136 115 108 128 211 244 164 136 102 82 44 36 28 13 12
0315 Aerospace Engineering & Technology 93 124 130 132 175 204 171 210 155 152 171 220 224 286 219
0317 Maritime Engineering & Technology 3 4 4 2 7 0 2 1 < 5 < 5 < 5 <5 <5 25 26
0399 Other Engineering & Technology 129 115 106 104 101 114 115 100 122 94 126 157 133 161 178
03 Total 629 641 612 576 700 847 599 632 555 463 494 518 512 643 497
Source: Data supplied by DET
Note: Cells <5 are the result of the Department's confidentiality policy and do not add into totals. Totals are correct.
Table 6.2: Domestic Students Completing Four Year Bachelors Degrees in Engineering
Men
ASCED Specialisation 2001 2002 2003 2004 2005 2006 2007 2008 2009 2010 2011 2012 2013 2014 2015
0300 Engineering & Related Technologies 98 134 90 59 215 246 286 273 356 321 545 638 682 758 761
0301 Manufacturing Engineering & Technology 13 10 16 23 19 17 21 12 8 < 5 < 5 <5 12 28 25
0303 Process & Resource Engineering 410 332 285 319 281 271 346 378 413 441 401 355 367 333 330
0305 Automotive Engineering & Technology 0 0 0 3 19 20 22 22 28 28 19 21 20 16 8
0307 Mechanical & Industrial Engineering & Technology 503 556 528 553 475 527 574 610 560 567 599 596 631 554 624
0309 Civil Engineering 585 574 554 502 488 448 573 706 712 746 845 803 849 873 956
0311 Geomatic Engineering 118 113 94 117 113 120 128 121 106 90 79 88 71 80 6
0313 Electrical & Electronic Engineering & Technology 1007 992 1136 1111 1062 796 811 703 621 535 456 490 476 468 516
0315 Aerospace Engineering & Technology 124 118 117 151 169 130 165 190 158 172 176 187 176 185 177
0317 Martime Engineering & Technology 11 12 2 23 11 23 13 16 14 10 24 19 36 20 50
0399 Other Engineering & Technology 540 472 450 441 458 581 478 617 677 715 801 861 866 964 984
03 Total 3409 3313 3272 3302 3310 3179 3417 3648 3653 3626 3945 4061 4186 4279 4437
Women
0300 Engineering & Related Technologies 9 26 23 11 46 34 41 36 44 54 77 133 127 134 96
0301 Manufacturing Engineering & Technology 5 3 5 2 2 3 5 0 - < 5 0 0 <5 <5 <5
0303 Process & Resource Engineering 135 137 128 126 99 98 106 110 116 120 123 104 110 105 87
0305 Automotive Engineering & Technology 0 0 0 0 0 2 <10 0 < 5 < 5 < 5 <5 0 0 <5
0307 Mechanical & Industrial Engineering & Technology 56 57 66 58 44 32 43 51 55 48 50 47 46 47 49
0309 Civil Engineering 140 122 90 98 89 81 88 102 120 94 134 122 114 145 161
0311 Geomatic Engineering 22 20 15 29 18 23 13 22 18 12 10 <5 5 5 8
0313 Electrical & Electronic Engineering & Technology 140 143 181 180 150 101 79 53 48 49 44 44 44 43 42
0315 Aerospace Engineering & Technology 19 24 23 20 30 16 18 24 15 21 29 21 19 20 20
0317 Maritime Engineering & Technology 0 0 0 1 0 1 0 2 - < 5 0 0 <5 5 5
0399 Other Engineering & Technology 169 124 132 111 126 137 112 123 135 140 129 150 160 152 170
03 Total 691 656 663 636 604 528 506 523 552 542 595 624 627 659 641
All domestic graduations
0300 Engineering & Related Technologies 107 160 113 70 261 280 327 309 400 375 622 771 809 892 857
0301 Manufacturing Engineering & Technology 18 13 21 25 21 20 26 12 8 < 5 < 5 <5 13 31 25
0303 Process & Resource Engineering 545 469 413 445 380 369 452 488 529 561 524 459 477 438 417
0305 Automotive Engineering & Technology 0 0 0 3 19 22 22 22 29 30 20 22 20 16 8
0307 Mechanical & Industrial Engineering & Technology 559 613 594 611 519 559 617 661 615 615 649 643 677 601 673
0309 Civil Engineering 725 696 644 600 577 529 661 808 832 840 979 925 963 1018 1117
0311 Geomatic Engineering 140 133 109 146 131 143 141 143 124 102 89 92 76 85 14
0313 Electrical & Electronic Engineering & Technology 1147 1135 1317 1291 1212 897 890 756 669 584 500 534 520 511 558
0315 Aerospace Engineering & Technology 143 142 140 171 199 146 183 214 173 193 205 208 195 205 197
0317 Maritime Engineering & Technology 11 12 2 24 11 24 13 18 14 11 24 19 37 25 55
0399 Other Engineering & Technology 709 596 582 552 584 718 590 740 812 855 930 1011 1026 1116 1154
03 Total 4100 3969 3935 3938 3914 3707 3923 4171 4205 4168 4540 4685 4813 4938 5078
Source: Data supplied by DET
Note: Cells <5 are the result of the Department's confidentiality policy and do not add into totals. Totals are correct.
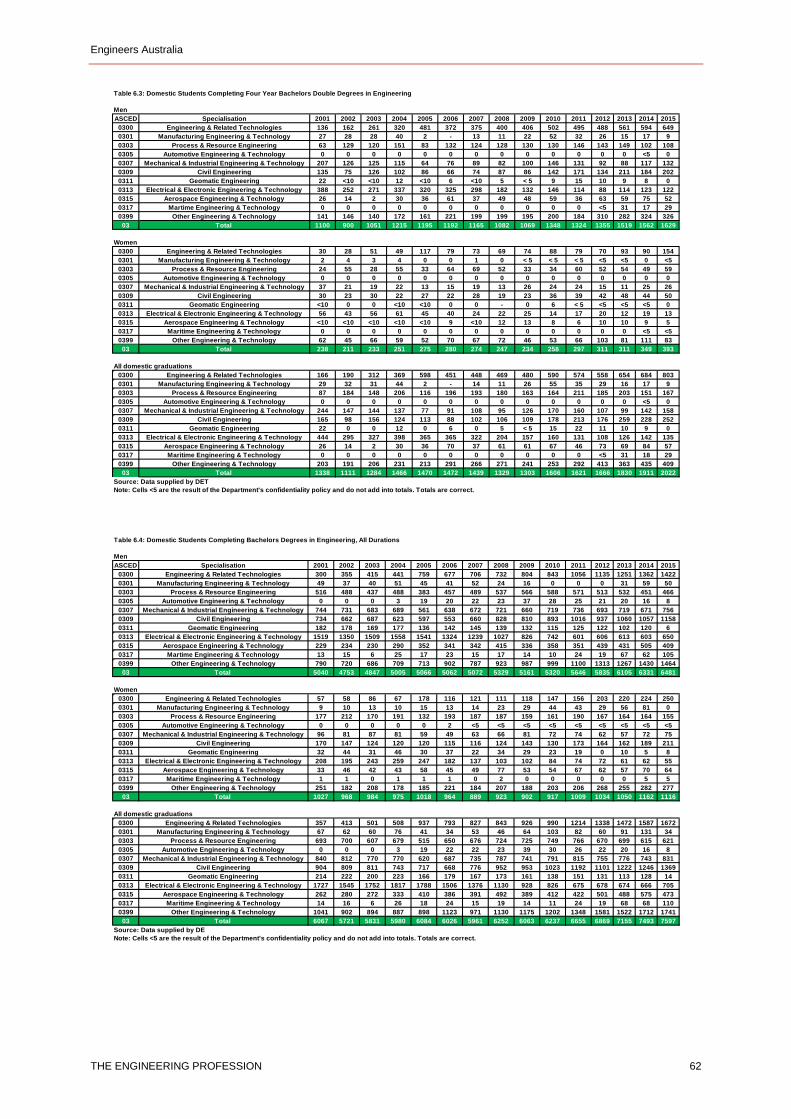
Engineers Australia
THE ENGINEERING PROFESSION 62
Table 6.3: Domestic Students Completing Four Year Bachelors Double Degrees in Engineering
Men
ASCED Specialisation 2001 2002 2003 2004 2005 2006 2007 2008 2009 2010 2011 2012 2013 2014 2015
0300 Engineering & Related Technologies 136 162 261 320 481 372 375 400 406 502 495 488 561 594 649
0301 Manufacturing Engineering & Technology 27 28 28 40 2 - 13 11 22 52 32 26 15 17 9
0303 Process & Resource Engineering 63 129 120 151 83 132 124 128 130 130 146 143 149 102 108
0305 Automotive Engineering & Technology 0 0 0 0 0 0 0 0 0 0 0 0 0 <5 0
0307 Mechanical & Industrial Engineering & Technology 207 126 125 115 64 76 89 82 100 146 131 92 88 117 132
0309 Civil Engineering 135 75 126 102 86 66 74 87 86 142 171 134 211 184 202
0311 Geomatic Engineering 22 <10 <10 12 <10 6 <10 5 < 5 9 15 10 9 8 0
0313 Electrical & Electronic Engineering & Technology 388 252 271 337 320 325 298 182 132 146 114 88 114 123 122
0315 Aerospace Engineering & Technology 26 14 2 30 36 61 37 49 48 59 36 63 59 75 52
0317 Martime Engineering & Technology 0 0 0 0 0 0 0 0 0 0 0 <5 31 17 29
0399 Other Engineering & Technology 141 146 140 172 161 221 199 199 195 200 184 310 282 324 326
03 Total 1100 900 1051 1215 1195 1192 1165 1082 1069 1348 1324 1355 1519 1562 1629
Women
0300 Engineering & Related Technologies 30 28 51 49 117 79 73 69 74 88 79 70 93 90 154
0301 Manufacturing Engineering & Technology 2 4 3 4 0 0 1 0 < 5 < 5 < 5 <5 <5 0 <5
0303 Process & Resource Engineering 24 55 28 55 33 64 69 52 33 34 60 52 54 49 59
0305 Automotive Engineering & Technology 0 0 0 0 0 0 0 0 0 0 0 0 0 0 0
0307 Mechanical & Industrial Engineering & Technology 37 21 19 22 13 15 19 13 26 24 24 15 11 25 26
0309 Civil Engineering 30 23 30 22 27 22 28 19 23 36 39 42 48 44 50
0311 Geomatic Engineering <10 0 0 <10 <10 0 0 - 0 6 < 5 <5 <5 <5 0
0313 Electrical & Electronic Engineering & Technology 56 43 56 61 45 40 24 22 25 14 17 20 12 19 13
0315 Aerospace Engineering & Technology <10 <10 <10 <10 <10 9 <10 12 13 8 6 10 10 9 5
0317 Maritime Engineering & Technology 0 0 0 0 0 0 0 0 0 0 0 0 0 <5 <5
0399 Other Engineering & Technology 62 45 66 59 52 70 67 72 46 53 66 103 81 111 83
03 Total 238 211 233 251 275 280 274 247 234 258 297 311 311 349 393
All domestic graduations
0300 Engineering & Related Technologies 166 190 312 369 598 451 448 469 480 590 574 558 654 684 803
0301 Manufacturing Engineering & Technology 29 32 31 44 2 - 14 11 26 55 35 29 16 17 9
0303 Process & Resource Engineering 87 184 148 206 116 196 193 180 163 164 211 185 203 151 167
0305 Automotive Engineering & Technology 0 0 0 0 0 0 0 0 0 0 0 0 0 <5 0
0307 Mechanical & Industrial Engineering & Technology 244 147 144 137 77 91 108 95 126 170 160 107 99 142 158
0309 Civil Engineering 165 98 156 124 113 88 102 106 109 178 213 176 259 228 252
0311 Geomatic Engineering 22 0 0 12 0 6 0 5 < 5 15 22 11 10 9 0
0313 Electrical & Electronic Engineering & Technology 444 295 327 398 365 365 322 204 157 160 131 108 126 142 135
0315 Aerospace Engineering & Technology 26 14 2 30 36 70 37 61 61 67 46 73 69 84 57
0317 Maritime Engineering & Technology 0 0 0 0 0 0 0 0 0 0 0 <5 31 18 29
0399 Other Engineering & Technology 203 191 206 231 213 291 266 271 241 253 292 413 363 435 409
03 Total 1338 1111 1284 1466 1470 1472 1439 1329 1303 1606 1621 1666 1830 1911 2022
Source: Data supplied by DET
Note: Cells <5 are the result of the Department's confidentiality policy and do not add into totals. Totals are correct.
Table 6.4: Domestic Students Completing Bachelors Degrees in Engineering, All Durations
Men
ASCED Specialisation 2001 2002 2003 2004 2005 2006 2007 2008 2009 2010 2011 2012 2013 2014 2015
0300 Engineering & Related Technologies 300 355 415 441 759 677 706 732 804 843 1056 1135 1251 1362 1422
0301 Manufacturing Engineering & Technology 49 37 40 51 45 41 52 24 16 0 0 0 31 59 50
0303 Process & Resource Engineering 516 488 437 488 383 457 489 537 566 588 571 513 532 451 466
0305 Automotive Engineering & Technology 0 0 0 3 19 20 22 23 37 28 25 21 20 16 8
0307 Mechanical & Industrial Engineering & Technology 744 731 683 689 561 638 672 721 660 719 736 693 719 671 756
0309 Civil Engineering 734 662 687 623 597 553 660 828 810 893 1016 937 1060 1057 1158
0311 Geomatic Engineering 182 178 169 177 136 142 145 139 132 115 125 122 102 120 6
0313 Electrical & Electronic Engineering & Technology 1519 1350 1509 1558 1541 1324 1239 1027 826 742 601 606 613 603 650
0315 Aerospace Engineering & Technology 229 234 230 290 352 341 342 415 336 358 351 439 431 505 409
0317 Martime Engineering & Technology 13 15 6 25 17 23 15 17 14 10 24 19 67 62 105
0399 Other Engineering & Technology 790 720 686 709 713 902 787 923 987 999 1100 1313 1267 1430 1464
03 Total 5040 4753 4847 5005 5066 5062 5072 5329 5161 5320 5646 5835 6105 6331 6481
Women
0300 Engineering & Related Technologies 57 58 86 67 178 116 121 111 118 147 156 203 220 224 250
0301 Manufacturing Engineering & Technology 9 10 13 10 15 13 14 23 29 44 43 29 56 81 0
0303 Process & Resource Engineering 177 212 170 191 132 193 187 187 159 161 190 167 164 164 155
0305 Automotive Engineering & Technology 0 0 0 0 0 2 <5 <5 <5 <5 <5 <5 <5 <5 <5
0307 Mechanical & Industrial Engineering & Technology 96 81 87 81 59 49 63 66 81 72 74 62 57 72 75
0309 Civil Engineering 170 147 124 120 120 115 116 124 143 130 173 164 162 189 211
0311 Geomatic Engineering 32 44 31 46 30 37 22 34 29 23 19 0 10 5 8
0313 Electrical & Electronic Engineering & Technology 208 195 243 259 247 182 137 103 102 84 74 72 61 62 55
0315 Aerospace Engineering & Technology 33 46 42 43 58 45 49 77 53 54 67 62 57 70 64
0317 Maritime Engineering & Technology 1 1 0 1 1 1 0 2 0 0 0 0 0 5 5
0399 Other Engineering & Technology 251 182 208 178 185 221 184 207 188 203 206 268 255 282 277
03 Total 1027 968 984 975 1018 964 889 923 902 917 1009 1034 1050 1162 1116
All domestic graduations
0300 Engineering & Related Technologies 357 413 501 508 937 793 827 843 926 990 1214 1338 1472 1587 1672
0301 Manufacturing Engineering & Technology 67 62 60 76 41 34 53 46 64 103 82 60 91 131 34
0303 Process & Resource Engineering 693 700 607 679 515 650 676 724 725 749 766 670 699 615 621
0305 Automotive Engineering & Technology 0 0 0 3 19 22 22 23 39 30 26 22 20 16 8
0307 Mechanical & Industrial Engineering & Technology 840 812 770 770 620 687 735 787 741 791 815 755 776 743 831
0309 Civil Engineering 904 809 811 743 717 668 776 952 953 1023 1192 1101 1222 1246 1369
0311 Geomatic Engineering 214 222 200 223 166 179 167 173 161 138 151 131 113 128 14
0313 Electrical & Electronic Engineering & Technology 1727 1545 1752 1817 1788 1506 1376 1130 928 826 675 678 674 666 705
0315 Aerospace Engineering & Technology 262 280 272 333 410 386 391 492 389 412 422 501 488 575 473
0317 Maritime Engineering & Technology 14 16 6 26 18 24 15 19 14 11 24 19 68 68 110
0399 Other Engineering & Technology 1041 902 894 887 898 1123 971 1130 1175 1202 1348 1581 1522 1712 1741
03 Total 6067 5721 5831 5980 6084 6026 5961 6252 6063 6237 6655 6869 7155 7493 7597
Source: Data supplied by DE
Note: Cells <5 are the result of the Department's confidentiality policy and do not add into totals. Totals are correct.
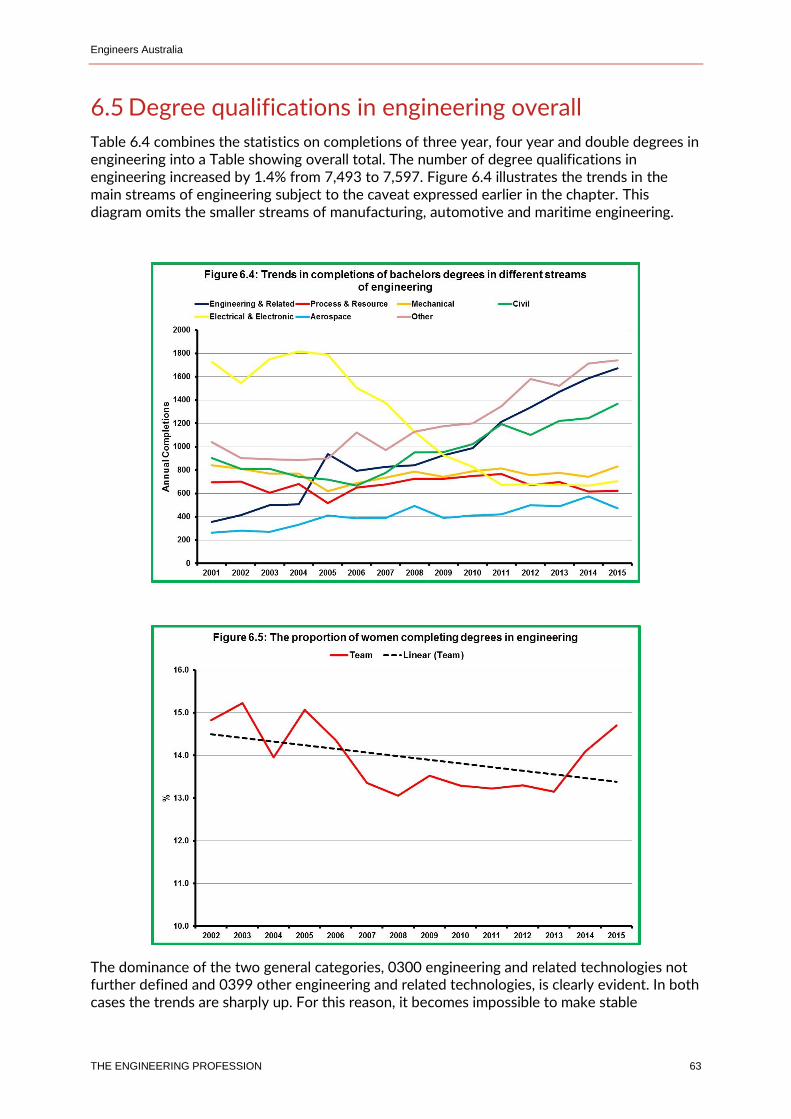
Engineers Australia
THE ENGINEERING PROFESSION 63
6.5 Degree qualifications in engineering overall
Table 6.4 combines the statistics on completions of three year, four year and double degrees in engineering into a Table showing overall total. The number of degree qualifications in engineering increased by 1.4% from 7,493 to 7,597. Figure 6.4 illustrates the trends in the main streams of engineering subject to the caveat expressed earlier in the chapter. This diagram omits the smaller streams of manufacturing, automotive and maritime engineering.
The dominance of the two general categories, 0300 engineering and related technologies not further defined and 0399 other engineering and related technologies, is clearly evident. In both cases the trends are sharply up. For this reason, it becomes impossible to make stable
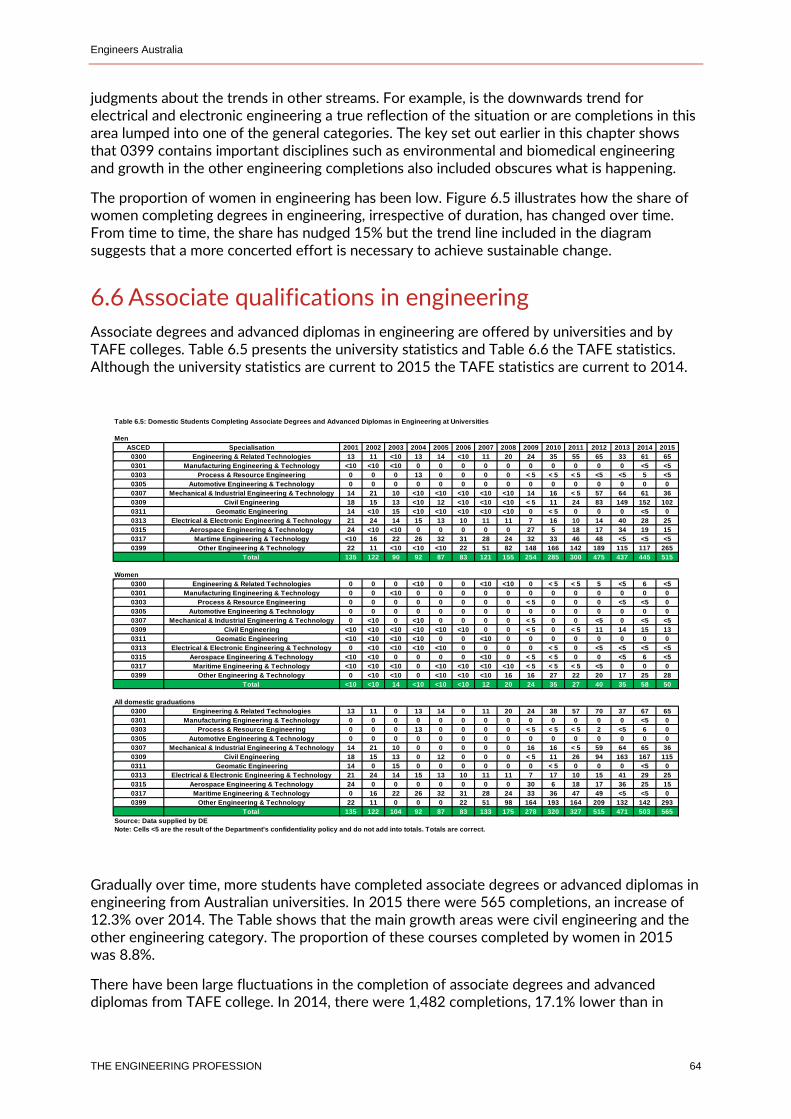
Engineers Australia
THE ENGINEERING PROFESSION 64
judgments about the trends in other streams. For example, is the downwards trend for electrical and electronic engineering a true reflection of the situation or are completions in this area lumped into one of the general categories. The key set out earlier in this chapter shows that 0399 contains important disciplines such as environmental and biomedical engineering and growth in the other engineering completions also included obscures what is happening.
The proportion of women in engineering has been low. Figure 6.5 illustrates how the share of women completing degrees in engineering, irrespective of duration, has changed over time. From time to time, the share has nudged 15% but the trend line included in the diagram suggests that a more concerted effort is necessary to achieve sustainable change.
6.6 Associate qualifications in engineering
Associate degrees and advanced diplomas in engineering are offered by universities and by TAFE colleges. Table 6.5 presents the university statistics and Table 6.6 the TAFE statistics. Although the university statistics are current to 2015 the TAFE statistics are current to 2014.
Gradually over time, more students have completed associate degrees or advanced diplomas in engineering from Australian universities. In 2015 there were 565 completions, an increase of 12.3% over 2014. The Table shows that the main growth areas were civil engineering and the other engineering category. The proportion of these courses completed by women in 2015 was 8.8%.
There have been large fluctuations in the completion of associate degrees and advanced diplomas from TAFE college. In 2014, there were 1,482 completions, 17.1% lower than in
Table 6.5: Domestic Students Completing Associate Degrees and Advanced Diplomas in Engineering at Universities
Men
ASCED Specialisation 2001 2002 2003 2004 2005 2006 2007 2008 2009 2010 2011 2012 2013 2014 2015
0300 Engineering & Related Technologies 13 11 <10 13 14 <10 11 20 24 35 55 65 33 61 65
0301 Manufacturing Engineering & Technology <10 <10 <10 0 0 0 0 0 0 0 0 0 0 <5 <5
0303 Process & Resource Engineering 0 0 0 13 0 0 0 0 < 5 < 5 < 5 <5 <5 5 <5
0305 Automotive Engineering & Technology 0 0 0 0 0 0 0 0 0 0 0 0 0 0 0
0307 Mechanical & Industrial Engineering & Technology 14 21 10 <10 <10 <10 <10 <10 14 16 < 5 57 64 61 36
0309 Civil Engineering 18 15 13 <10 12 <10 <10 <10 < 5 11 24 83 149 152 102
0311 Geomatic Engineering 14 <10 15 <10 <10 <10 <10 <10 0 < 5 0 0 0 <5 0
0313 Electrical & Electronic Engineering & Technology 21 24 14 15 13 10 11 11 7 16 10 14 40 28 25
0315 Aerospace Engineering & Technology 24 <10 <10 0 0 0 0 0 27 5 18 17 34 19 15
0317 Martime Engineering & Technology <10 16 22 26 32 31 28 24 32 33 46 48 <5 <5 <5
0399 Other Engineering & Technology 22 11 <10 <10 <10 22 51 82 148 166 142 189 115 117 265
Total 135 122 90 92 87 83 121 155 254 285 300 475 437 445 515
Women
0300 Engineering & Related Technologies 0 0 0 <10 0 0 <10 <10 0 < 5 < 5 5 <5 6 <5
0301 Manufacturing Engineering & Technology 0 0 <10 0 0 0 0 0 0 0 0 0 0 0 0
0303 Process & Resource Engineering 0 0 0 0 0 0 0 0 < 5 0 0 0 <5 <5 0
0305 Automotive Engineering & Technology 0 0 0 0 0 0 0 0 0 0 0 0 0 0 0
0307 Mechanical & Industrial Engineering & Technology 0 <10 0 <10 0 0 0 0 < 5 0 0 <5 0 <5 <5
0309 Civil Engineering <10 <10 <10 <10 <10 <10 0 0 < 5 0 < 5 11 14 15 13
0311 Geomatic Engineering <10 <10 <10 <10 0 0 <10 0 0 0 0 0 0 0 0
0313 Electrical & Electronic Engineering & Technology 0 <10 <10 <10 <10 0 0 0 0 < 5 0 <5 <5 <5 <5
0315 Aerospace Engineering & Technology <10 <10 0 0 0 0 <10 0 < 5 < 5 0 0 <5 6 <5
0317 Maritime Engineering & Technology <10 <10 <10 0 <10 <10 <10 <10 < 5 < 5 < 5 <5 0 0 0
0399 Other Engineering & Technology 0 <10 <10 0 <10 <10 <10 16 16 27 22 20 17 25 28
Total <10 <10 14 <10 <10 <10 12 20 24 35 27 40 35 58 50
All domestic graduations
0300 Engineering & Related Technologies 13 11 0 13 14 0 11 20 24 38 57 70 37 67 65
0301 Manufacturing Engineering & Technology 0 0 0 0 0 0 0 0 0 0 0 0 0 <5 0
0303 Process & Resource Engineering 0 0 0 13 0 0 0 0 < 5 < 5 < 5 2 <5 6 0
0305 Automotive Engineering & Technology 0 0 0 0 0 0 0 0 0 0 0 0 0 0 0
0307 Mechanical & Industrial Engineering & Technology 14 21 10 0 0 0 0 0 16 16 < 5 59 64 65 36
0309 Civil Engineering 18 15 13 0 12 0 0 0 < 5 11 26 94 163 167 115
0311 Geomatic Engineering 14 0 15 0 0 0 0 0 0 < 5 0 0 0 <5 0
0313 Electrical & Electronic Engineering & Technology 21 24 14 15 13 10 11 11 7 17 10 15 41 29 25
0315 Aerospace Engineering & Technology 24 0 0 0 0 0 0 0 30 6 18 17 36 25 15
0317 Maritime Engineering & Technology 0 16 22 26 32 31 28 24 33 36 47 49 <5 <5 0
0399 Other Engineering & Technology 22 11 0 0 0 22 51 98 164 193 164 209 132 142 293
Total 135 122 104 92 87 83 133 175 278 320 327 515 471 503 565
Source: Data supplied by DE
Note: Cells <5 are the result of the Department's confidentiality policy and do not add into totals. Totals are correct.
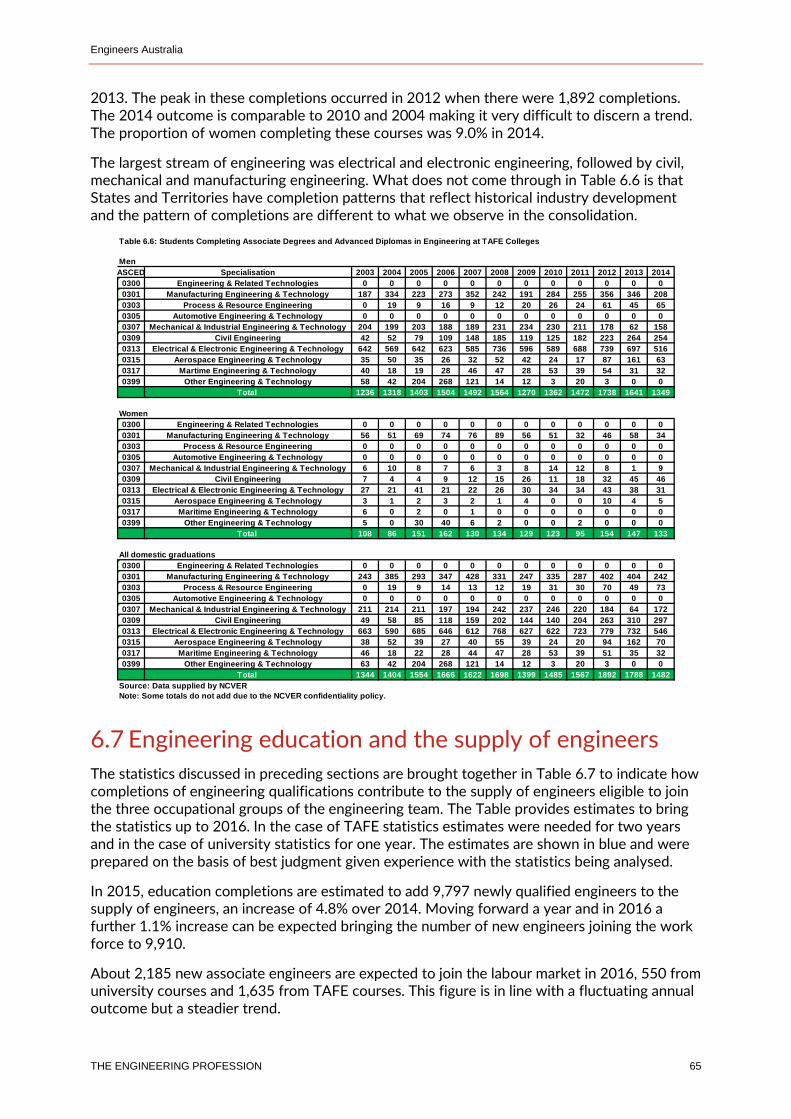
Engineers Australia
THE ENGINEERING PROFESSION 65
2013. The peak in these completions occurred in 2012 when there were 1,892 completions. The 2014 outcome is comparable to 2010 and 2004 making it very difficult to discern a trend. The proportion of women completing these courses was 9.0% in 2014.
The largest stream of engineering was electrical and electronic engineering, followed by civil, mechanical and manufacturing engineering. What does not come through in Table 6.6 is that States and Territories have completion patterns that reflect historical industry development and the pattern of completions are different to what we observe in the consolidation.
6.7 Engineering education and the supply of engineers
The statistics discussed in preceding sections are brought together in Table 6.7 to indicate how completions of engineering qualifications contribute to the supply of engineers eligible to join the three occupational groups of the engineering team. The Table provides estimates to bring the statistics up to 2016. In the case of TAFE statistics estimates were needed for two years and in the case of university statistics for one year. The estimates are shown in blue and were prepared on the basis of best judgment given experience with the statistics being analysed.
In 2015, education completions are estimated to add 9,797 newly qualified engineers to the supply of engineers, an increase of 4.8% over 2014. Moving forward a year and in 2016 a further 1.1% increase can be expected bringing the number of new engineers joining the work force to 9,910.
About 2,185 new associate engineers are expected to join the labour market in 2016, 550 from university courses and 1,635 from TAFE courses. This figure is in line with a fluctuating annual outcome but a steadier trend.
Table 6.6: Students Completing Associate Degrees and Advanced Diplomas in Engineering at TAFE Colleges
Men
ASCED Specialisation 2003 2004 2005 2006 2007 2008 2009 2010 2011 2012 2013 2014
0300 Engineering & Related Technologies 0 0 0 0 0 0 0 0 0 0 0 0
0301 Manufacturing Engineering & Technology 187 334 223 273 352 242 191 284 255 356 346 208
0303 Process & Resource Engineering 0 19 9 16 9 12 20 26 24 61 45 65
0305 Automotive Engineering & Technology 0 0 0 0 0 0 0 0 0 0 0 0
0307 Mechanical & Industrial Engineering & Technology 204 199 203 188 189 231 234 230 211 178 62 158
0309 Civil Engineering 42 52 79 109 148 185 119 125 182 223 264 254
0313 Electrical & Electronic Engineering & Technology 642 569 642 623 585 736 596 589 688 739 697 516
0315 Aerospace Engineering & Technology 35 50 35 26 32 52 42 24 17 87 161 63
0317 Martime Engineering & Technology 40 18 19 28 46 47 28 53 39 54 31 32
0399 Other Engineering & Technology 58 42 204 268 121 14 12 3 20 3 0 0
Total 1236 1318 1403 1504 1492 1564 1270 1362 1472 1738 1641 1349
Women
0300 Engineering & Related Technologies 0 0 0 0 0 0 0 0 0 0 0 0
0301 Manufacturing Engineering & Technology 56 51 69 74 76 89 56 51 32 46 58 34
0303 Process & Resource Engineering 0 0 0 0 0 0 0 0 0 0 0 0
0305 Automotive Engineering & Technology 0 0 0 0 0 0 0 0 0 0 0 0
0307 Mechanical & Industrial Engineering & Technology 6 10 8 7 6 3 8 14 12 8 1 9
0309 Civil Engineering 7 4 4 9 12 15 26 11 18 32 45 46
0313 Electrical & Electronic Engineering & Technology 27 21 41 21 22 26 30 34 34 43 38 31
0315 Aerospace Engineering & Technology 3 1 2 3 2 1 4 0 0 10 4 5
0317 Maritime Engineering & Technology 6 0 2 0 1 0 0 0 0 0 0 0
0399 Other Engineering & Technology 5 0 30 40 6 2 0 0 2 0 0 0
Total 108 86 151 162 130 134 129 123 95 154 147 133
All domestic graduations
0300 Engineering & Related Technologies 0 0 0 0 0 0 0 0 0 0 0 0
0301 Manufacturing Engineering & Technology 243 385 293 347 428 331 247 335 287 402 404 242
0303 Process & Resource Engineering 0 19 9 14 13 12 19 31 30 70 49 73
0305 Automotive Engineering & Technology 0 0 0 0 0 0 0 0 0 0 0 0
0307 Mechanical & Industrial Engineering & Technology 211 214 211 197 194 242 237 246 220 184 64 172
0309 Civil Engineering 49 58 85 118 159 202 144 140 204 263 310 297
0313 Electrical & Electronic Engineering & Technology 663 590 685 646 612 768 627 622 723 779 732 546
0315 Aerospace Engineering & Technology 38 52 39 27 40 55 39 24 20 94 162 70
0317 Maritime Engineering & Technology 46 18 22 28 44 47 28 53 39 51 35 32
0399 Other Engineering & Technology 63 42 204 268 121 14 12 3 20 3 0 0
Total 1344 1404 1554 1666 1622 1698 1399 1485 1567 1892 1788 1482
Source: Data supplied by NCVER
Note: Some totals do not add due to the NCVER confidentiality policy.
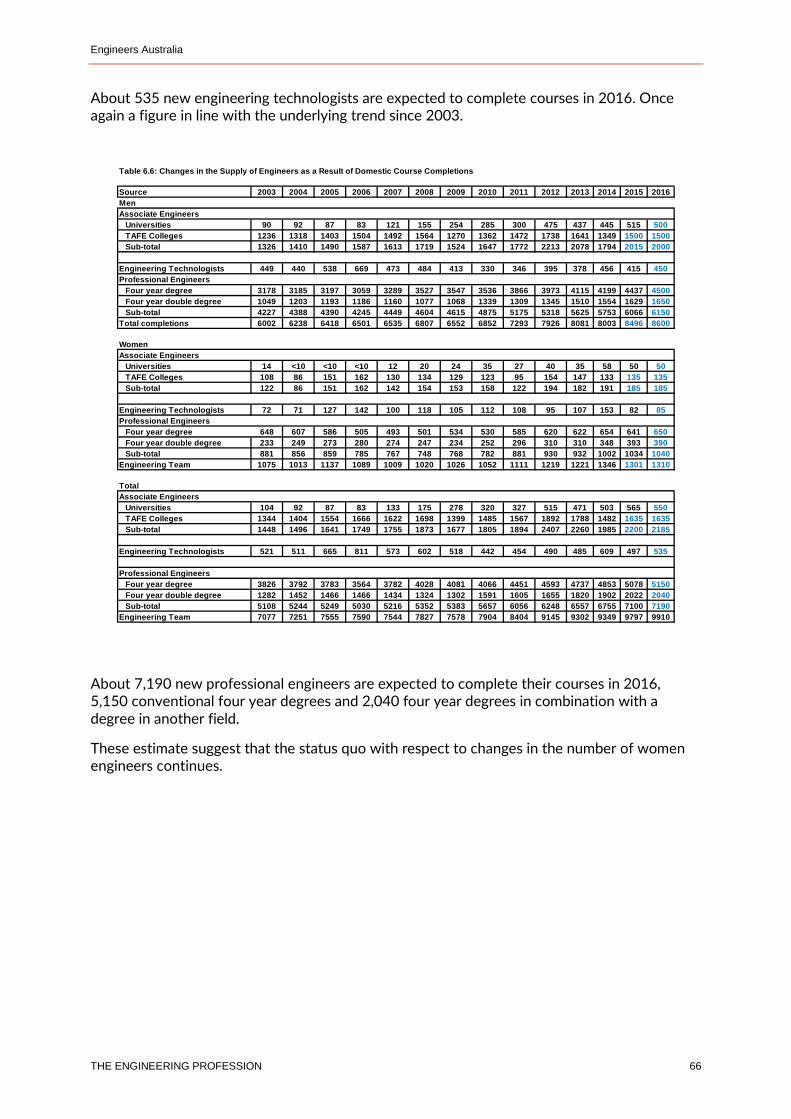
Engineers Australia
THE ENGINEERING PROFESSION 66
About 535 new engineering technologists are expected to complete courses in 2016. Once again a figure in line with the underlying trend since 2003.
About 7,190 new professional engineers are expected to complete their courses in 2016, 5,150 conventional four year degrees and 2,040 four year degrees in combination with a degree in another field.
These estimate suggest that the status quo with respect to changes in the number of women engineers continues.
Table 6.6: Changes in the Supply of Engineers as a Result of Domestic Course Completions
Source 2003 2004 2005 2006 2007 2008 2009 2010 2011 2012 2013 2014 2015 2016
Men
Associate Engineers
Universities 90 92 87 83 121 155 254 285 300 475 437 445 515 500
TAFE Colleges 1236 1318 1403 1504 1492 1564 1270 1362 1472 1738 1641 1349 1500 1500
Sub-total 1326 1410 1490 1587 1613 1719 1524 1647 1772 2213 2078 1794 2015 2000
Engineering Technologists 449 440 538 669 473 484 413 330 346 395 378 456 415 450
Professional Engineers
Four year degree 3178 3185 3197 3059 3289 3527 3547 3536 3866 3973 4115 4199 4437 4500
Four year double degree 1049 1203 1193 1186 1160 1077 1068 1339 1309 1345 1510 1554 1629 1650
Sub-total 4227 4388 4390 4245 4449 4604 4615 4875 5175 5318 5625 5753 6066 6150
Total completions 6002 6238 6418 6501 6535 6807 6552 6852 7293 7926 8081 8003 8496 8600
Women
Associate Engineers
Universities 14 <10 <10 <10 12 20 24 35 27 40 35 58 50 50
TAFE Colleges 108 86 151 162 130 134 129 123 95 154 147 133 135 135
Sub-total 122 86 151 162 142 154 153 158 122 194 182 191 185 185
Engineering Technologists 72 71 127 142 100 118 105 112 108 95 107 153 82 85
Professional Engineers
Four year degree 648 607 586 505 493 501 534 530 585 620 622 654 641 650
Four year double degree 233 249 273 280 274 247 234 252 296 310 310 348 393 390
Sub-total 881 856 859 785 767 748 768 782 881 930 932 1002 1034 1040
Engineering Team 1075 1013 1137 1089 1009 1020 1026 1052 1111 1219 1221 1346 1301 1310
Total
Associate Engineers
Universities 104 92 87 83 133 175 278 320 327 515 471 503 565 550
TAFE Colleges 1344 1404 1554 1666 1622 1698 1399 1485 1567 1892 1788 1482 1635 1635
Sub-total 1448 1496 1641 1749 1755 1873 1677 1805 1894 2407 2260 1985 2200 2185
Engineering Technologists 521 511 665 811 573 602 518 442 454 490 485 609 497 535
Professional Engineers
Four year degree 3826 3792 3783 3564 3782 4028 4081 4066 4451 4593 4737 4853 5078 5150
Four year double degree 1282 1452 1466 1466 1434 1324 1302 1591 1605 1655 1820 1902 2022 2040
Sub-total 5108 5244 5249 5030 5216 5352 5383 5657 6056 6248 6557 6755 7100 7190
Engineering Team 7077 7251 7555 7590 7544 7827 7578 7904 8404 9145 9302 9349 9797 9910
Engineers Australia
THE ENGINEERING PROFESSION 67
Chapter 7: Skilled migration and the supply of engineers
Main Points Australia’s skilled migration policies have not changed since 2009 despite evidence that some adjustment is necessary. Present policies comprise a short term, temporary element which is demand driven and aims to deal with immediate short term skill shortages and a medium to long term permanent element that aims to supplement the medium to long term skills capability of the Australian economy.
Temporary skilled migration is intended to rise and fall in line with the demand for labour. In broad terms this behaviour has occurred in respect to skilled migration of engineers. However, the scale of change has been lopsided with very large rises in temporary skilled migration when demand increased, but with much lower falls when demand abated. In 2015-16, some four years after the collapse in the demand for engineers, 6,975 temporary migrant engineers were still employed in Australia, a number commensurate with the situation in Australia just prior to the global financial crisis when skill shortages were at their highest.
Permanent migration of engineers has continued to increase apart from a one-year dip shortly after the global financial crisis. In 2015-16, 13,265 migrant engineers were granted permanent visas compared to 11,638 the previous year and 5,852 in 2008-09.
Changes in the number of permanent migrant engineers and temporary visa holders have been countervailing with the result that in each of the five years since 2011-12 the total number of migrant engineers added to the engineering labour market has been relatively stable, averaging just over 20,000 per year compared to an average of about 9,200 from engineering education completions (9,797 in 2015-16).
Combined skilled migration and education completions have added 122,082 additional engineers to the Australian engineering labour market since 2011-12.
7.1 Skilled migration policy
Australia has a long history of skilled migration, particularly in engineering and this is reflected in features such as the age structure of the profession. Present government skilled migration policies have been in force since 2010 and are based on an extensive review that took place over 2008 and 2009. That review was necessary because over time skilled migration practice diverged from original policy intentions as a result of periodic incremental change introducing inconsistencies. This is a problem for all long running policies remedied by comprehensive review and policy revision. In late 2013, the newly elected government commenced such a periodic review, but during 2014 work was discontinued and has not recommenced. There is no doubt now that a review is overdue and should address the recommendations made by the Productivity Commission in its 2016 report21, as well as the merits or otherwise of a high migration intake.
21 Productivity Commission, Migrant Intake into Australia, September 2016, www.pc.gov.au/inquiries/completed/migrant-intake#report
Engineers Australia
THE ENGINEERING PROFESSION 68
Current skilled migration policy has two objectives. Permanent migration aims to supplement Australia’s medium to longer term skills capability in areas where the output of our education system is insufficient for future needs. Temporary migration aims to establish a demand driven mechanism that enables employers to quickly overcome short term skills shortages. At times there is some confusion between the two because of careless reference to the term “skill shortage”. The key point to make is there is a substantial difference between medium to long term skill shortages and more immediate short term skill shortages. The annual Commonwealth budget sets the permanent migration target for the next financial year, but being demand driven there is no limit on temporary migration. The permanent migration target has been unchanged at 128,550 in the past three budgets.
Temporary migration to deal with immediate skill shortages is driven by employers. There are no skills assessments for temporary migrants, but sponsoring employers are expected to validate their competence. Similarly, employers can claim skill shortage without testing their claim in the labour market. Short term skilled migration is designed to operate as an automatic stabiliser; increasing when labour markets are tight causing skill shortages, and decreasing when labour markets ease and shortages disappear. Employers can elect to sponsor temporary migrants for permanent visas. In these cases, the normal arrangements for permanent migration apply including the annual cap on visa numbers and formal skills assessment.
Since 2010, the Skilled Occupation List (SOL) has been the framework that prioritises skills in the skilled migration program. The SOL was initially compiled by the former Australian Workplace Productivity Agency (AWPA). Since the 2013 election when AWPA was abolished, responsibility for the SOL was initially transferred to the Department of Industry, and subsequently to the Department of Education and Training. In practical terms, the SOL determines whether or not permanent visas are granted to independent migrants. Employer who require engineering skills not presently on the SOL are able to use temporary migration to quickly recruit needed skills and to take advantage of provisions that allow sponsorship of temporary visa holders for permanent visas.
The criteria used to compile the SOL are:
Long training lead time in specialized skills.
High Degree of relationship between area of training and subsequent employment.
High risk of labour market and economic disruption if the skill is in short supply.
Sufficient high quality information to assess future skills requirements.
The SOL is reviewed annually. In the year commencing 1 July 2016, two engineering occupations (petroleum engineer and mining engineer) were removed from the SOL and all engineering occupations included on the SOL were flagged for review in the 2017-18 SOL. We use the SOL as a convenient framework to compile consistent statistics on skilled migration of engineers.
7.2 Migration skills assessment
Aspiring permanent skilled migrants must have their educational qualifications and labour market experience assessed by an assessment authority appointed by the Department of Immigration and Border Protection (DIBP) prior to submitting their application for a visa. Engineers Australia is the authorised assessing authority for nearly all engineering occupations. Assessments are undertaken consistent with Engineers Australia’s stage 1 competencies. These competencies are used in Engineers Australia’s accreditation process for university entry level engineering courses and for all new members.
Engineers Australia
THE ENGINEERING PROFESSION 69
Recognition of engineering qualifications can occur through several pathways22: Qualifications may be treated as accredited qualifications if they are:
Australian qualifications;
Accredited under the Washington Accord which is an agreement between international engineering accreditation bodies23 to recognise the equivalence of each other’s undergraduate qualifications for Professional Engineers (the equivalent of an Australian four year full time Bachelors Degree in engineering);
Accredited under the Sydney Accord which is an agreement between international engineering accreditation bodies24 to recognise the equivalence of each other’s undergraduate educational qualifications for Engineering Technologists (the equivalent of an Australian three year full time Bachelor Degree in engineering).
Accredited under the Dublin Accord which is an agreement between international engineering accreditation bodies25 to recognise each other’s qualifications for Engineering Technicians (the equivalent of an Australian two year full time Associate Degree or Advanced Diploma).
Qualifications that cannot be assessed in one of these ways can be accredited through a stage 1 competency assessment in which applicants are required to demonstrate that their engineering knowledge and skills meet the competency standards for the engineering occupation they intend to apply for. The competency standards applied are available on Engineers Australia’s web-site26.Engineers that come to Australia on temporary 457 visas do not have their qualifications assessed. Providing their visa application is accompanied by an employer’s offer of employment and complies with minimum employment conditions, skills assessments are deemed as unnecessary.
Australia’s permanent migration policy is heavily weighted towards entry level recruits. The assessment process described deals with entry level qualifications. There is some consideration of work experience in the points test used to rank prospective migrants and while this is better than nothing, it falls a long way short of the criteria Engineers Australia apply to recognise competent, practicing engineers. The points test always rewards younger engineers at the expense of older, more experienced ones. One consequence is that fewer skilled migrant engineers are employed in engineering than is the case for Australian born engineers. In effect, engineers who are granted permanent visas satisfy two entirely different demands in the Australian labour force; the demand for engineers to build Australia’s engineering capability and the demand for general analytical skills.
7.3 Skilled migration trends
Both permanent and temporary skilled migrants increase the supply of engineers in Australia. New permanent migrant engineers add to supply on an on-going basis. Temporary 457 migration visas have durations that vary between three months and four years and add to the supply of engineers in accordance with those durations. In the past, statistics on the number of 457 visa holders have not been available and it was necessary to use the number of new 457 visas approved as a guide. However, this is no longer the case and DIBP have made available
22 www.engineersaustralia.org.au 23 The signatories to the Washington Accord are Canada, Hong Kong SAR, Ireland, New Zealand, South Africa, the United Kingdom, the United States of America and Australia. 24 The signatories to the Sydney Accord are Canada, Hong Kong SAR, Ireland, New Zealand, South Africa, the United Kingdom and Australia. 25 The signatories of the Dublin Accord are Canada, Ireland, Korea, New Zealand, UK, USA and Australia 26 See www.engineersaustralia.org.au
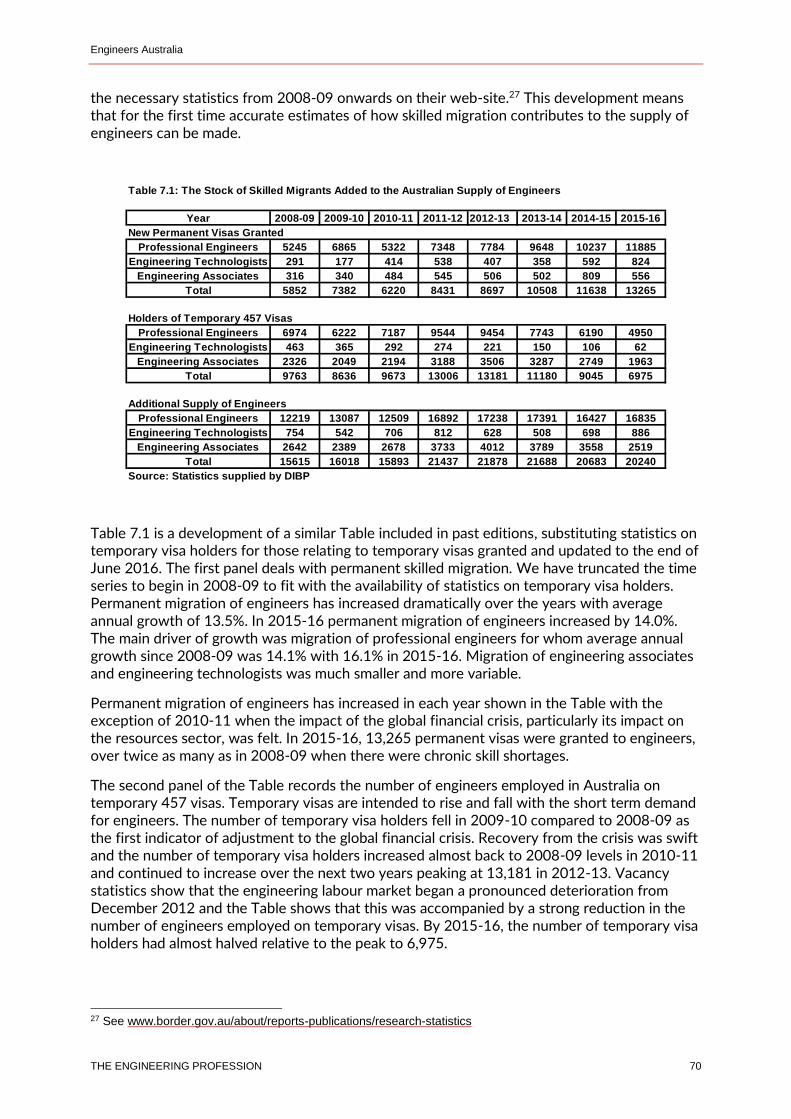
Engineers Australia
THE ENGINEERING PROFESSION 70
the necessary statistics from 2008-09 onwards on their web-site.27 This development means that for the first time accurate estimates of how skilled migration contributes to the supply of engineers can be made.
Table 7.1 is a development of a similar Table included in past editions, substituting statistics on temporary visa holders for those relating to temporary visas granted and updated to the end of June 2016. The first panel deals with permanent skilled migration. We have truncated the time series to begin in 2008-09 to fit with the availability of statistics on temporary visa holders. Permanent migration of engineers has increased dramatically over the years with average annual growth of 13.5%. In 2015-16 permanent migration of engineers increased by 14.0%. The main driver of growth was migration of professional engineers for whom average annual growth since 2008-09 was 14.1% with 16.1% in 2015-16. Migration of engineering associates and engineering technologists was much smaller and more variable.
Permanent migration of engineers has increased in each year shown in the Table with the exception of 2010-11 when the impact of the global financial crisis, particularly its impact on the resources sector, was felt. In 2015-16, 13,265 permanent visas were granted to engineers, over twice as many as in 2008-09 when there were chronic skill shortages.
The second panel of the Table records the number of engineers employed in Australia on temporary 457 visas. Temporary visas are intended to rise and fall with the short term demand for engineers. The number of temporary visa holders fell in 2009-10 compared to 2008-09 as the first indicator of adjustment to the global financial crisis. Recovery from the crisis was swift and the number of temporary visa holders increased almost back to 2008-09 levels in 2010-11 and continued to increase over the next two years peaking at 13,181 in 2012-13. Vacancy statistics show that the engineering labour market began a pronounced deterioration from December 2012 and the Table shows that this was accompanied by a strong reduction in the number of engineers employed on temporary visas. By 2015-16, the number of temporary visa holders had almost halved relative to the peak to 6,975.
27 See www.border.gov.au/about/reports-publications/research-statistics
Table 7.1: The Stock of Skilled Migrants Added to the Australian Supply of Engineers
Year 2008-09 2009-10 2010-11 2011-12 2012-13 2013-14 2014-15 2015-16
New Permanent Visas Granted
Professional Engineers 5245 6865 5322 7348 7784 9648 10237 11885
Engineering Technologists 291 177 414 538 407 358 592 824
Engineering Associates 316 340 484 545 506 502 809 556
Total 5852 7382 6220 8431 8697 10508 11638 13265
Holders of Temporary 457 Visas
Professional Engineers 6974 6222 7187 9544 9454 7743 6190 4950
Engineering Technologists 463 365 292 274 221 150 106 62
Engineering Associates 2326 2049 2194 3188 3506 3287 2749 1963
Total 9763 8636 9673 13006 13181 11180 9045 6975
Additional Supply of Engineers
Professional Engineers 12219 13087 12509 16892 17238 17391 16427 16835
Engineering Technologists 754 542 706 812 628 508 698 886
Engineering Associates 2642 2389 2678 3733 4012 3789 3558 2519
Total 15615 16018 15893 21437 21878 21688 20683 20240
Source: Statistics supplied by DIBP
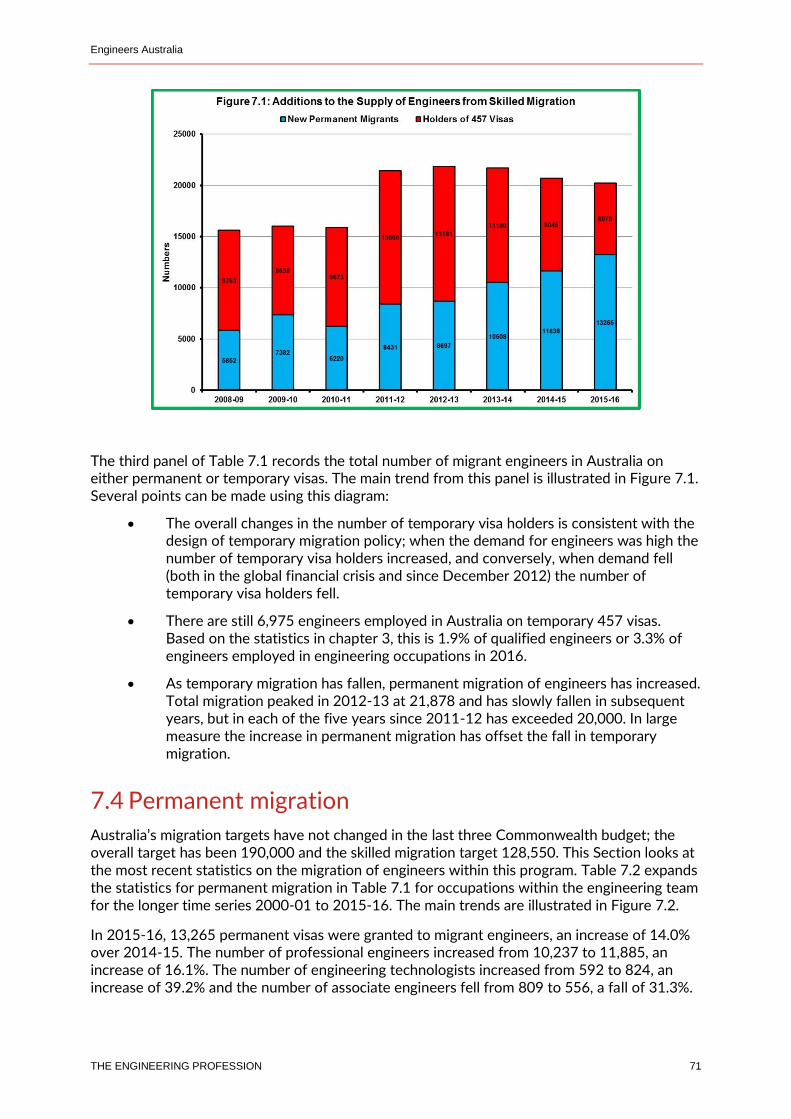
Engineers Australia
THE ENGINEERING PROFESSION 71
The third panel of Table 7.1 records the total number of migrant engineers in Australia on either permanent or temporary visas. The main trend from this panel is illustrated in Figure 7.1. Several points can be made using this diagram:
The overall changes in the number of temporary visa holders is consistent with the design of temporary migration policy; when the demand for engineers was high the number of temporary visa holders increased, and conversely, when demand fell (both in the global financial crisis and since December 2012) the number of temporary visa holders fell.
There are still 6,975 engineers employed in Australia on temporary 457 visas. Based on the statistics in chapter 3, this is 1.9% of qualified engineers or 3.3% of engineers employed in engineering occupations in 2016.
As temporary migration has fallen, permanent migration of engineers has increased. Total migration peaked in 2012-13 at 21,878 and has slowly fallen in subsequent years, but in each of the five years since 2011-12 has exceeded 20,000. In large measure the increase in permanent migration has offset the fall in temporary migration.
7.4 Permanent migration
Australia’s migration targets have not changed in the last three Commonwealth budget; the overall target has been 190,000 and the skilled migration target 128,550. This Section looks at the most recent statistics on the migration of engineers within this program. Table 7.2 expands the statistics for permanent migration in Table 7.1 for occupations within the engineering team for the longer time series 2000-01 to 2015-16. The main trends are illustrated in Figure 7.2.
In 2015-16, 13,265 permanent visas were granted to migrant engineers, an increase of 14.0% over 2014-15. The number of professional engineers increased from 10,237 to 11,885, an increase of 16.1%. The number of engineering technologists increased from 592 to 824, an increase of 39.2% and the number of associate engineers fell from 809 to 556, a fall of 31.3%.
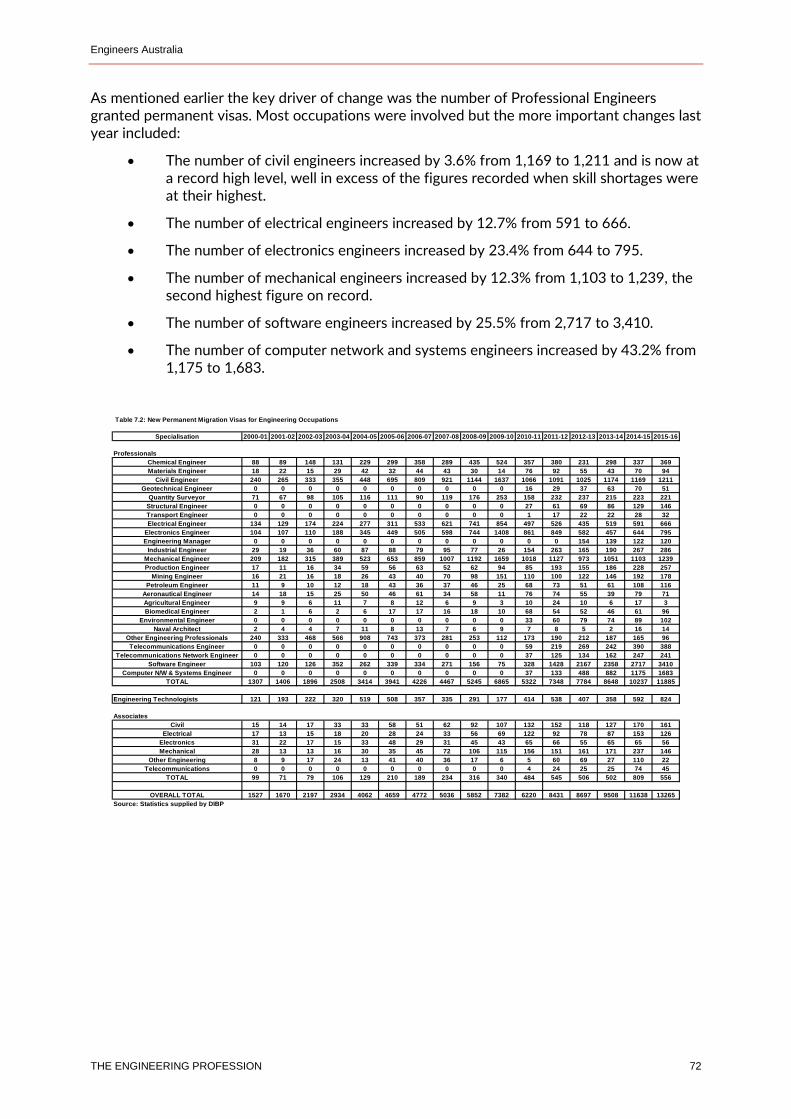
Engineers Australia
THE ENGINEERING PROFESSION 72
As mentioned earlier the key driver of change was the number of Professional Engineers granted permanent visas. Most occupations were involved but the more important changes last year included:
The number of civil engineers increased by 3.6% from 1,169 to 1,211 and is now at a record high level, well in excess of the figures recorded when skill shortages were at their highest.
The number of electrical engineers increased by 12.7% from 591 to 666.
The number of electronics engineers increased by 23.4% from 644 to 795.
The number of mechanical engineers increased by 12.3% from 1,103 to 1,239, the second highest figure on record.
The number of software engineers increased by 25.5% from 2,717 to 3,410.
The number of computer network and systems engineers increased by 43.2% from 1,175 to 1,683.
Table 7.2: New Permanent Migration Visas for Engineering Occupations
Specialisation 2000-01 2001-02 2002-03 2003-04 2004-05 2005-06 2006-07 2007-08 2008-09 2009-10 2010-11 2011-12 2012-13 2013-14 2014-15 2015-16
Professionals
Chemical Engineer 88 89 148 131 229 299 358 289 435 524 357 380 231 298 337 369
Materials Engineer 18 22 15 29 42 32 44 43 30 14 76 92 55 43 70 94
Civil Engineer 240 265 333 355 448 695 809 921 1144 1637 1066 1091 1025 1174 1169 1211
Geotechnical Engineer 0 0 0 0 0 0 0 0 0 0 16 29 37 63 70 51
Quantity Surveyor 71 67 98 105 116 111 90 119 176 253 158 232 237 215 223 221
Structural Engineer 0 0 0 0 0 0 0 0 0 0 27 61 69 86 129 146
Transport Engineer 0 0 0 0 0 0 0 0 0 0 1 17 22 22 28 32
Electrical Engineer 134 129 174 224 277 311 533 621 741 854 497 526 435 519 591 666
Electronics Engineer 104 107 110 188 345 449 505 598 744 1408 861 849 582 457 644 795
Engineering Manager 0 0 0 0 0 0 0 0 0 0 0 0 154 139 122 120
Industrial Engineer 29 19 36 60 87 88 79 95 77 26 154 263 165 190 267 286
Mechanical Engineer 209 182 315 389 523 653 859 1007 1192 1659 1018 1127 973 1051 1103 1239
Production Engineer 17 11 16 34 59 56 63 52 62 94 85 193 155 186 228 257
Mining Engineer 16 21 16 18 26 43 40 70 98 151 110 100 122 146 192 178
Petroleum Engineer 11 9 10 12 18 43 36 37 46 25 68 73 51 61 108 116
Aeronautical Engineer 14 18 15 25 50 46 61 34 58 11 76 74 55 39 79 71
Agricultural Engineer 9 9 6 11 7 8 12 6 9 3 10 24 10 6 17 3
Biomedical Engineer 2 1 6 2 6 17 17 16 18 10 68 54 52 46 61 96
Environmental Engineer 0 0 0 0 0 0 0 0 0 0 33 60 79 74 89 102
Naval Architect 2 4 4 7 11 8 13 7 6 9 7 8 5 2 16 14
Other Engineering Professionals 240 333 468 566 908 743 373 281 253 112 173 190 212 187 165 96
Telecommunications Engineer 0 0 0 0 0 0 0 0 0 0 59 219 269 242 390 388
Telecommunications Network Engineer 0 0 0 0 0 0 0 0 0 0 37 125 134 162 247 241
Software Engineer 103 120 126 352 262 339 334 271 156 75 328 1428 2167 2358 2717 3410
Computer N/W & Systems Engineer 0 0 0 0 0 0 0 0 0 0 37 133 488 882 1175 1683
TOTAL 1307 1406 1896 2508 3414 3941 4226 4467 5245 6865 5322 7348 7784 8648 10237 11885
Engineering Technologists 121 193 222 320 519 508 357 335 291 177 414 538 407 358 592 824
Associates
Civil 15 14 17 33 33 58 51 62 92 107 132 152 118 127 170 161
Electrical 17 13 15 18 20 28 24 33 56 69 122 92 78 87 153 126
Electronics 31 22 17 15 33 48 29 31 45 43 65 66 55 65 65 56
Mechanical 28 13 13 16 30 35 45 72 106 115 156 151 161 171 237 146
Other Engineering 8 9 17 24 13 41 40 36 17 6 5 60 69 27 110 22
Telecommunications 0 0 0 0 0 0 0 0 0 0 4 24 25 25 74 45
TOTAL 99 71 79 106 129 210 189 234 316 340 484 545 506 502 809 556
OVERALL TOTAL 1527 1670 2197 2934 4062 4659 4772 5036 5852 7382 6220 8431 8697 9508 11638 13265
Source: Statistics supplied by DIBP
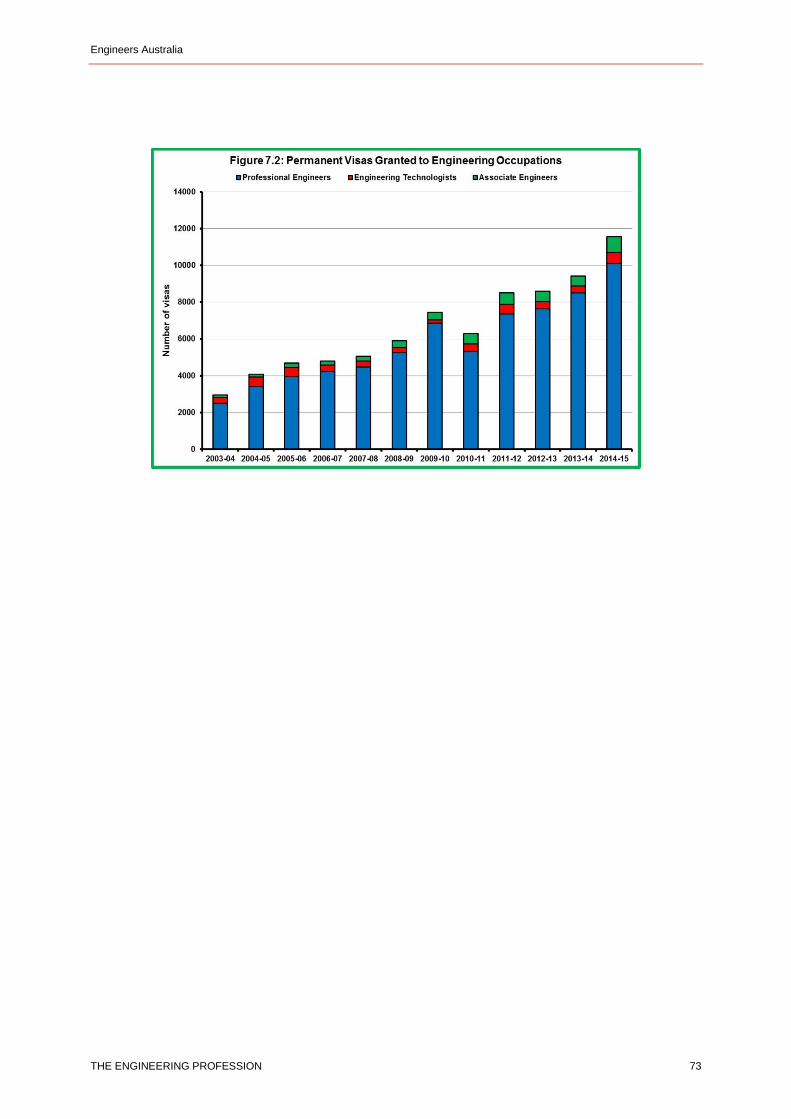
Engineers Australia
THE ENGINEERING PROFESSION 73
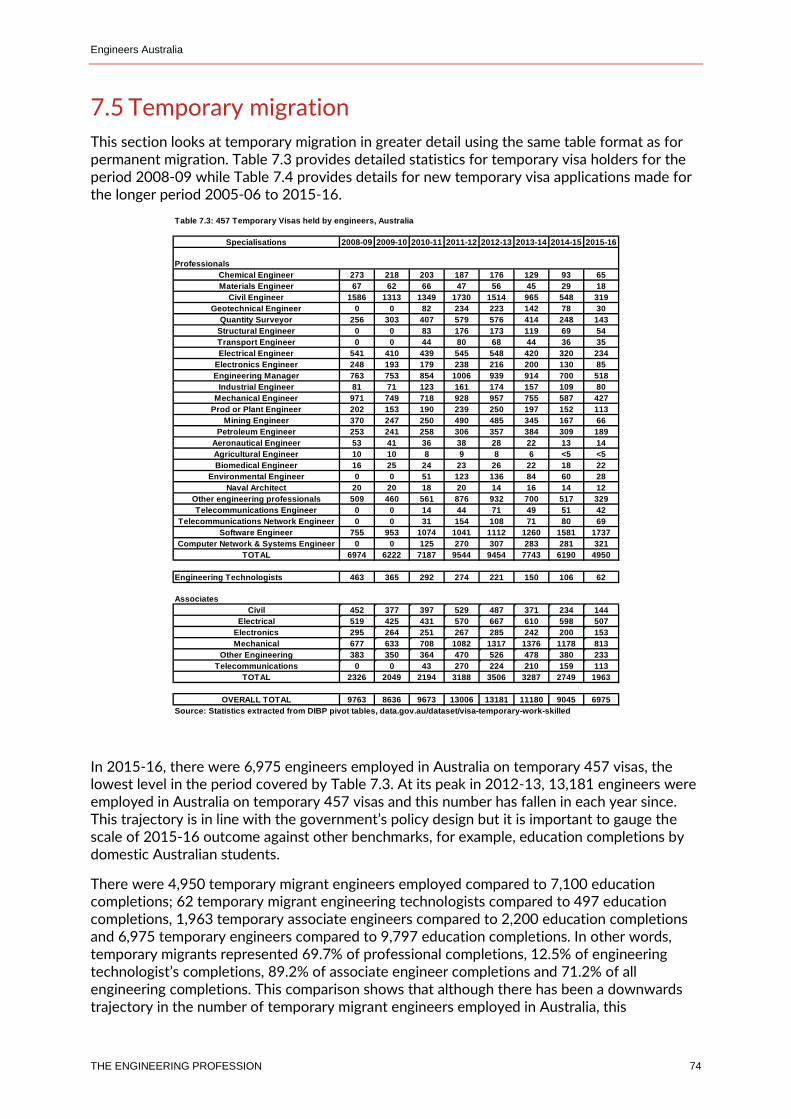
Engineers Australia
THE ENGINEERING PROFESSION 74
7.5 Temporary migration
This section looks at temporary migration in greater detail using the same table format as for permanent migration. Table 7.3 provides detailed statistics for temporary visa holders for the period 2008-09 while Table 7.4 provides details for new temporary visa applications made for the longer period 2005-06 to 2015-16.
In 2015-16, there were 6,975 engineers employed in Australia on temporary 457 visas, the lowest level in the period covered by Table 7.3. At its peak in 2012-13, 13,181 engineers were employed in Australia on temporary 457 visas and this number has fallen in each year since. This trajectory is in line with the government’s policy design but it is important to gauge the scale of 2015-16 outcome against other benchmarks, for example, education completions by domestic Australian students.
There were 4,950 temporary migrant engineers employed compared to 7,100 education completions; 62 temporary migrant engineering technologists compared to 497 education completions, 1,963 temporary associate engineers compared to 2,200 education completions and 6,975 temporary engineers compared to 9,797 education completions. In other words, temporary migrants represented 69.7% of professional completions, 12.5% of engineering technologist’s completions, 89.2% of associate engineer completions and 71.2% of all engineering completions. This comparison shows that although there has been a downwards trajectory in the number of temporary migrant engineers employed in Australia, this
Table 7.3: 457 Temporary Visas held by engineers, Australia
Specialisations 2008-09 2009-10 2010-11 2011-12 2012-13 2013-14 2014-15 2015-16
Professionals
Chemical Engineer 273 218 203 187 176 129 93 65
Materials Engineer 67 62 66 47 56 45 29 18
Civil Engineer 1586 1313 1349 1730 1514 965 548 319
Geotechnical Engineer 0 0 82 234 223 142 78 30
Quantity Surveyor 256 303 407 579 576 414 248 143
Structural Engineer 0 0 83 176 173 119 69 54
Transport Engineer 0 0 44 80 68 44 36 35
Electrical Engineer 541 410 439 545 548 420 320 234
Electronics Engineer 248 193 179 238 216 200 130 85
Engineering Manager 763 753 854 1006 939 914 700 518
Industrial Engineer 81 71 123 161 174 157 109 80
Mechanical Engineer 971 749 718 928 957 755 587 427
Prod or Plant Engineer 202 153 190 239 250 197 152 113
Mining Engineer 370 247 250 490 485 345 167 66
Petroleum Engineer 253 241 258 306 357 384 309 189
Aeronautical Engineer 53 41 36 38 28 22 13 14
Agricultural Engineer 10 10 8 9 8 6 <5 <5
Biomedical Engineer 16 25 24 23 26 22 18 22
Environmental Engineer 0 0 51 123 136 84 60 28
Naval Architect 20 20 18 20 14 16 14 12
Other engineering professionals 509 460 561 876 932 700 517 329
Telecommunications Engineer 0 0 14 44 71 49 51 42
Telecommunications Network Engineer 0 0 31 154 108 71 80 69
Software Engineer 755 953 1074 1041 1112 1260 1581 1737
Computer Network & Systems Engineer 0 0 125 270 307 283 281 321
TOTAL 6974 6222 7187 9544 9454 7743 6190 4950
Engineering Technologists 463 365 292 274 221 150 106 62
Associates
Civil 452 377 397 529 487 371 234 144
Electrical 519 425 431 570 667 610 598 507
Electronics 295 264 251 267 285 242 200 153
Mechanical 677 633 708 1082 1317 1376 1178 813
Other Engineering 383 350 364 470 526 478 380 233
Telecommunications 0 0 43 270 224 210 159 113
TOTAL 2326 2049 2194 3188 3506 3287 2749 1963
OVERALL TOTAL 9763 8636 9673 13006 13181 11180 9045 6975
Source: Statistics extracted from DIBP pivot tables, data.gov.au/dataset/visa-temporary-work-skilled
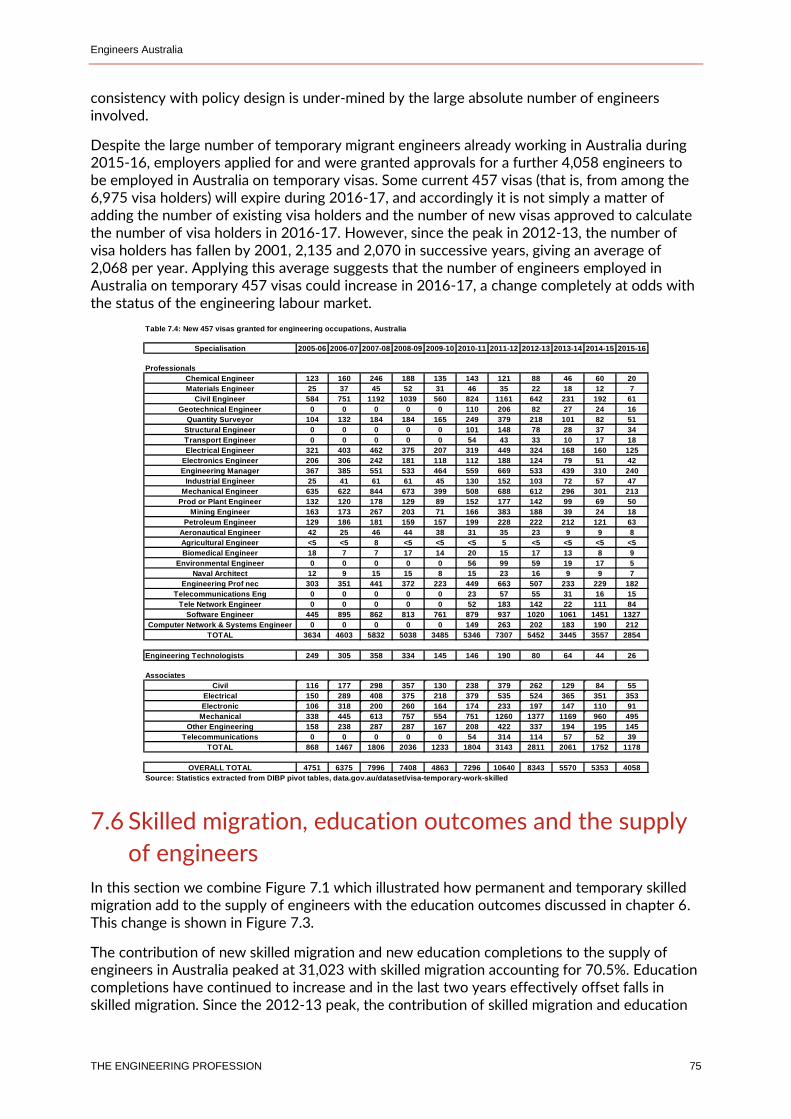
Engineers Australia
THE ENGINEERING PROFESSION 75
consistency with policy design is under-mined by the large absolute number of engineers involved.
Despite the large number of temporary migrant engineers already working in Australia during 2015-16, employers applied for and were granted approvals for a further 4,058 engineers to be employed in Australia on temporary visas. Some current 457 visas (that is, from among the 6,975 visa holders) will expire during 2016-17, and accordingly it is not simply a matter of adding the number of existing visa holders and the number of new visas approved to calculate the number of visa holders in 2016-17. However, since the peak in 2012-13, the number of visa holders has fallen by 2001, 2,135 and 2,070 in successive years, giving an average of 2,068 per year. Applying this average suggests that the number of engineers employed in Australia on temporary 457 visas could increase in 2016-17, a change completely at odds with the status of the engineering labour market.
7.6 Skilled migration, education outcomes and the supply
of engineers
In this section we combine Figure 7.1 which illustrated how permanent and temporary skilled migration add to the supply of engineers with the education outcomes discussed in chapter 6. This change is shown in Figure 7.3.
The contribution of new skilled migration and new education completions to the supply of engineers in Australia peaked at 31,023 with skilled migration accounting for 70.5%. Education completions have continued to increase and in the last two years effectively offset falls in skilled migration. Since the 2012-13 peak, the contribution of skilled migration and education
Table 7.4: New 457 visas granted for engineering occupations, Australia
Specialisation 2005-06 2006-07 2007-08 2008-09 2009-10 2010-11 2011-12 2012-13 2013-14 2014-15 2015-16
Professionals
Chemical Engineer 123 160 246 188 135 143 121 88 46 60 20
Materials Engineer 25 37 45 52 31 46 35 22 18 12 7
Civil Engineer 584 751 1192 1039 560 824 1161 642 231 192 61
Geotechnical Engineer 0 0 0 0 0 110 206 82 27 24 16
Quantity Surveyor 104 132 184 184 165 249 379 218 101 82 51
Structural Engineer 0 0 0 0 0 101 148 78 28 37 34
Transport Engineer 0 0 0 0 0 54 43 33 10 17 18
Electrical Engineer 321 403 462 375 207 319 449 324 168 160 125
Electronics Engineer 206 306 242 181 118 112 188 124 79 51 42
Engineering Manager 367 385 551 533 464 559 669 533 439 310 240
Industrial Engineer 25 41 61 61 45 130 152 103 72 57 47
Mechanical Engineer 635 622 844 673 399 508 688 612 296 301 213
Prod or Plant Engineer 132 120 178 129 89 152 177 142 99 69 50
Mining Engineer 163 173 267 203 71 166 383 188 39 24 18
Petroleum Engineer 129 186 181 159 157 199 228 222 212 121 63
Aeronautical Engineer 42 25 46 44 38 31 35 23 9 9 8
Agricultural Engineer <5 <5 8 <5 <5 <5 5 <5 <5 <5 <5
Biomedical Engineer 18 7 7 17 14 20 15 17 13 8 9
Environmental Engineer 0 0 0 0 0 56 99 59 19 17 5
Naval Architect 12 9 15 15 8 15 23 16 9 9 7
Engineering Prof nec 303 351 441 372 223 449 663 507 233 229 182
Telecommunications Eng 0 0 0 0 0 23 57 55 31 16 15
Tele Network Engineer 0 0 0 0 0 52 183 142 22 111 84
Software Engineer 445 895 862 813 761 879 937 1020 1061 1451 1327
Computer Network & Systems Engineer 0 0 0 0 0 149 263 202 183 190 212
TOTAL 3634 4603 5832 5038 3485 5346 7307 5452 3445 3557 2854
Engineering Technologists 249 305 358 334 145 146 190 80 64 44 26
Associates
Civil 116 177 298 357 130 238 379 262 129 84 55
Electrical 150 289 408 375 218 379 535 524 365 351 353
Electronic 106 318 200 260 164 174 233 197 147 110 91
Mechanical 338 445 613 757 554 751 1260 1377 1169 960 495
Other Engineering 158 238 287 287 167 208 422 337 194 195 145
Telecommunications 0 0 0 0 0 54 314 114 57 52 39
TOTAL 868 1467 1806 2036 1233 1804 3143 2811 2061 1752 1178
OVERALL TOTAL 4751 6375 7996 7408 4863 7296 10640 8343 5570 5353 4058
Source: Statistics extracted from DIBP pivot tables, data.gov.au/dataset/visa-temporary-work-skilled
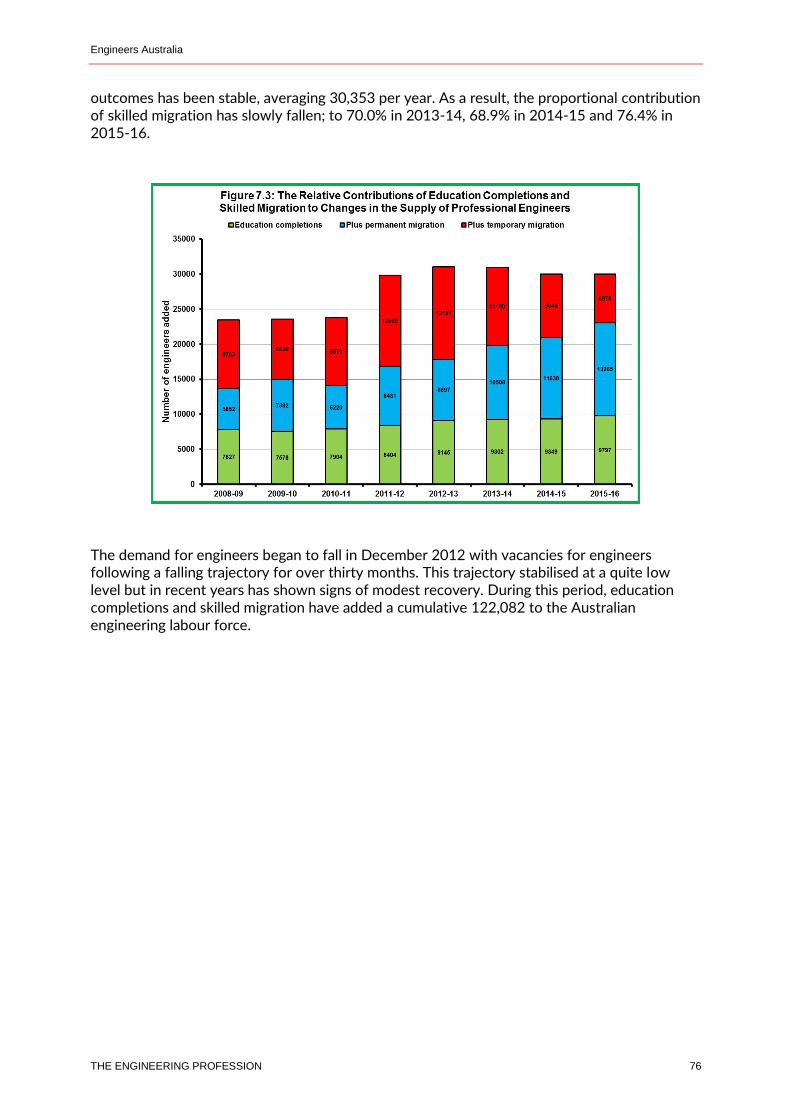
Engineers Australia
THE ENGINEERING PROFESSION 76
outcomes has been stable, averaging 30,353 per year. As a result, the proportional contribution of skilled migration has slowly fallen; to 70.0% in 2013-14, 68.9% in 2014-15 and 76.4% in 2015-16.
The demand for engineers began to fall in December 2012 with vacancies for engineers following a falling trajectory for over thirty months. This trajectory stabilised at a quite low level but in recent years has shown signs of modest recovery. During this period, education completions and skilled migration have added a cumulative 122,082 to the Australian engineering labour force.
Engineers Australia
THE ENGINEERING PROFESSION 77
Chapter 8: Age, skill levels and salaries
Main Points Public sector professional engineers have more years of experience at every responsibility level than private sector engineers and this relationship also occurs for ages of professional engineers. Since 2013, the average ages of professional engineers in both sectors has fallen with the fall in the private sector larger than the public sector.
Private sector remuneration packages are less than public sector packages for engineers levels 1 and 2, the two sectors pay about the same at level 3 and for levels 4 and 5 the private sector packages are higher. On average, about 82% of engineers are in the private sector.
Historically, engineers have been well remunerated but this point often obscures the fact that over time average annual changes in engineering remuneration packages have lagged behind annual changes in average adult full time earnings. The gap between the two has widened since 2011, especially for private sector engineers.
In 2016, remuneration packages for private sector engineers contracted for engineers at every responsibility level with the smallest contraction occurring for engineers level 3 at 3.6%. Although, wage growth in the wider economy slowed substantially, average adult full time earnings increased by 1.8%. Public sector remuneration packages were more resilient with changes at some responsibility levels exceeding changes in average adult full time earnings.
8.1 How we treat these issues
Engineers are often discussed according to the economic sector they work in and by the degree of experience they have. Census statistics allow us to consider the three levels of government and the private sector, but between censuses the best we can do is differentiate between the private and public sectors. Discussions of experience are commonly in terms of job titles which can mean different things in different circumstances. A more stable framework is the concept of engineering responsibility levels which is related to engineering career criteria.
Engineering responsibility levels are defined by the degree of supervisory input, the degree of independent decision making capacity expected from an engineer and the engineer’s capacity to undertake different roles in the engineering work force. Responsibility levels are embedded in salary arrangements and are often used to characterise engineering positions. There are five engineering responsibility levels defined as follows28.
28 The definitions used by the Association of Professional Engineers, Scientists and Managers, Australia
(APESMA) are used. APESMA has conducted surveys of engineering salaries since 1974 in June and December.
Each edition, as well as the targeted salary information, contains statistics about the characteristics of survey
respondents which provide important insights on the profession. The main limitation of the statistics is that they
only cover Professional Engineers. Similar statistics for Engineering Technologists and Associate Engineers are
Engineers Australia
THE ENGINEERING PROFESSION 78
Level 1 Professional Engineer; this is the graduate engineer entry level. The engineer undertakes engineering tasks of limited scope and complexity in offices, plants, in the field or in laboratories under the supervision of more senior engineers.
Level 2 Professional Engineer; this level recognizes the experience and competence gained as a Level 1 Engineer. At this level engineers have greater independence and less supervision, but guidance on unusual features is provided by engineers with more substantial experience.
Level 3 Professional Engineer; this level requires the application of mature engineering knowledge with scope for individual accomplishment and problem solving that require modification of established guides. Original contributions to engineering approaches and techniques are common. This level outlines and assigns work, reviews it for technical accuracy and adequacy and may plan, direct, coordinate and supervise other professional and technical staff.
Level 4 Professional Engineers; this level requires considerable independence in approach with a high degree of originality, ingenuity and judgment. Positions responsibilities often include independent decisions on engineering policies and procedures for overall programs, provision of technical advice to management, detailed technical responsibility for product development and the provision of specialized engineering systems and facilities and the coordination of work programs.
Level 5 Professional Engineer; this level is usually responsible for an engineering administrative function, directing several professional and other groups engaged in inter-related engineering responsibilities or as an engineering consultant. This level independently conceives programs and problems to be investigated and participates in their resolution within existing organizational operating and management arrangements. Typical reporting line is to senior management.
A sixth level, above Level 5 Professional Engineer, is sometimes used in salary setting and related matters, this level is not defined in the same terms but is used for engineering senior management positions including, Managing Director, Chief Executive Officer and Group General Manager.
In the following sections this framework is used to examine average length of experience of engineers at each level, average age and average salary packages in both private and public sectors. Over the period examined the Australian economy has experienced the resources boom, the pre-GFC boom in infrastructure, particularly in Australian cities, the shock of the GFC and more muted economic conditions since. These factors have impacted engineers in different ways; at times the demand for engineers has been extraordinarily high, but it has now collapsed, high demand attracted more Australian students to undertake engineering courses and chapter five showed that this is now reversing, and finally the fortunes of the engineering profession are reflected in salaries outcomes.
The statistics used are derived from the June salaries survey undertaken by Professions Australia29. These statistics do not conform to ABS definitions, but in the past have been high quality and consistent indicators. Unfortunately, over time the survey sample has become smaller and in the June 2016 survey was too small to sustain some elements of the
not available. See APESMA, Professional Engineer Remuneration Survey Report, December 2012, pp8-9 for the
source of the definitions. 29 See footnote 27
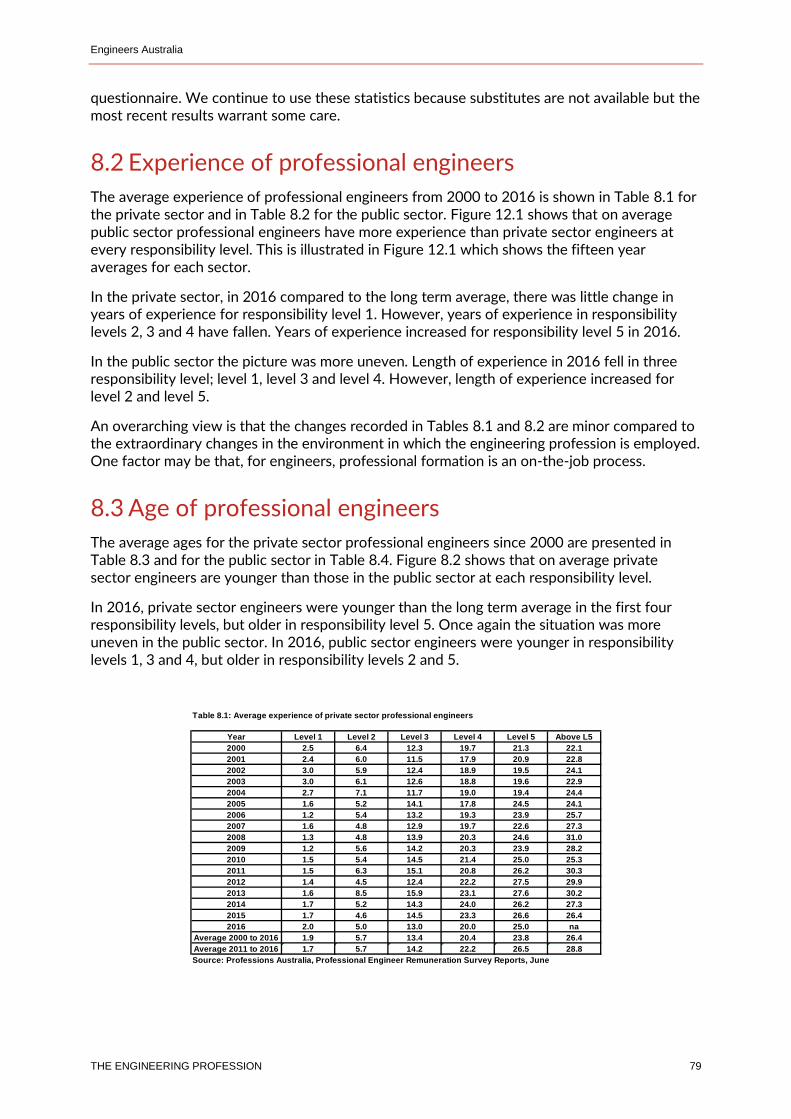
Engineers Australia
THE ENGINEERING PROFESSION 79
questionnaire. We continue to use these statistics because substitutes are not available but the most recent results warrant some care.
8.2 Experience of professional engineers
The average experience of professional engineers from 2000 to 2016 is shown in Table 8.1 for the private sector and in Table 8.2 for the public sector. Figure 12.1 shows that on average public sector professional engineers have more experience than private sector engineers at every responsibility level. This is illustrated in Figure 12.1 which shows the fifteen year averages for each sector.
In the private sector, in 2016 compared to the long term average, there was little change in years of experience for responsibility level 1. However, years of experience in responsibility levels 2, 3 and 4 have fallen. Years of experience increased for responsibility level 5 in 2016.
In the public sector the picture was more uneven. Length of experience in 2016 fell in three responsibility level; level 1, level 3 and level 4. However, length of experience increased for level 2 and level 5.
An overarching view is that the changes recorded in Tables 8.1 and 8.2 are minor compared to the extraordinary changes in the environment in which the engineering profession is employed. One factor may be that, for engineers, professional formation is an on-the-job process.
8.3 Age of professional engineers
The average ages for the private sector professional engineers since 2000 are presented in Table 8.3 and for the public sector in Table 8.4. Figure 8.2 shows that on average private sector engineers are younger than those in the public sector at each responsibility level.
In 2016, private sector engineers were younger than the long term average in the first four responsibility levels, but older in responsibility level 5. Once again the situation was more uneven in the public sector. In 2016, public sector engineers were younger in responsibility levels 1, 3 and 4, but older in responsibility levels 2 and 5.
Table 8.1: Average experience of private sector professional engineers
Year Level 1 Level 2 Level 3 Level 4 Level 5 Above L5
2000 2.5 6.4 12.3 19.7 21.3 22.1
2001 2.4 6.0 11.5 17.9 20.9 22.8
2002 3.0 5.9 12.4 18.9 19.5 24.1
2003 3.0 6.1 12.6 18.8 19.6 22.9
2004 2.7 7.1 11.7 19.0 19.4 24.4
2005 1.6 5.2 14.1 17.8 24.5 24.1
2006 1.2 5.4 13.2 19.3 23.9 25.7
2007 1.6 4.8 12.9 19.7 22.6 27.3
2008 1.3 4.8 13.9 20.3 24.6 31.0
2009 1.2 5.6 14.2 20.3 23.9 28.2
2010 1.5 5.4 14.5 21.4 25.0 25.3
2011 1.5 6.3 15.1 20.8 26.2 30.3
2012 1.4 4.5 12.4 22.2 27.5 29.9
2013 1.6 8.5 15.9 23.1 27.6 30.2
2014 1.7 5.2 14.3 24.0 26.2 27.3
2015 1.7 4.6 14.5 23.3 26.6 26.4
2016 2.0 5.0 13.0 20.0 25.0 na
Average 2000 to 2016 1.9 5.7 13.4 20.4 23.8 26.4
Average 2011 to 2016 1.7 5.7 14.2 22.2 26.5 28.8
Source: Professions Australia, Professional Engineer Remuneration Survey Reports, June
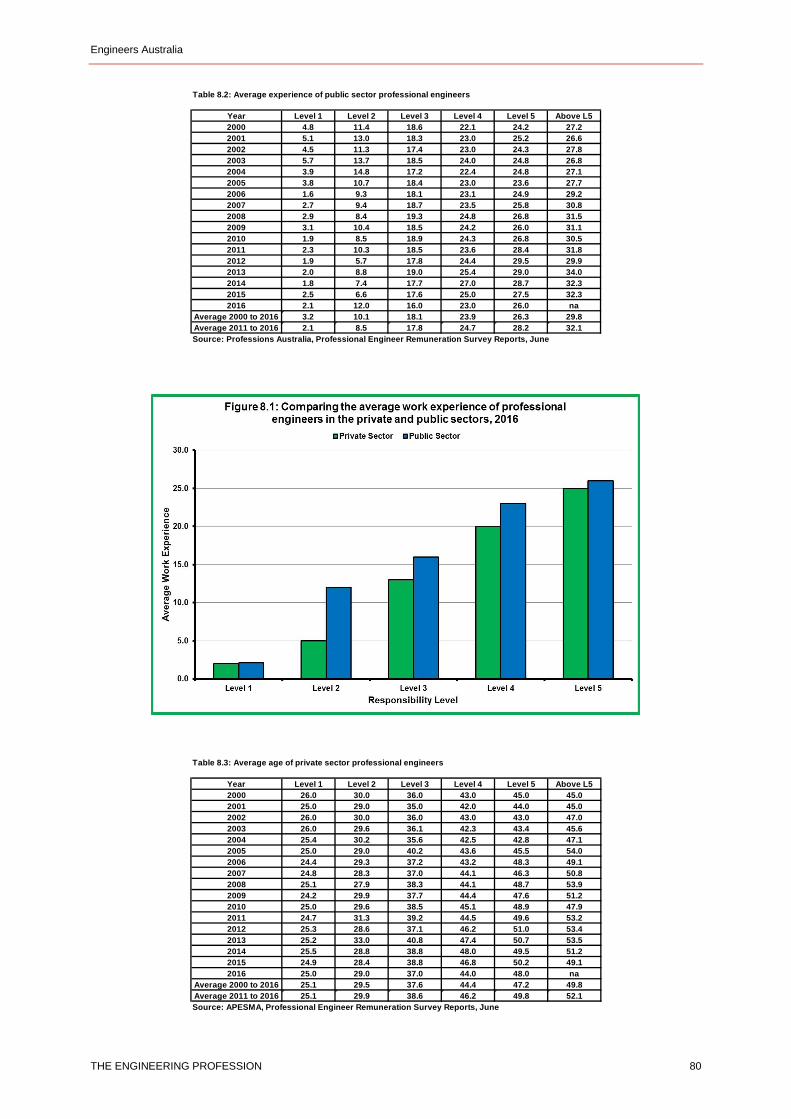
Engineers Australia
THE ENGINEERING PROFESSION 80
Table 8.2: Average experience of public sector professional engineers
Year Level 1 Level 2 Level 3 Level 4 Level 5 Above L5
2000 4.8 11.4 18.6 22.1 24.2 27.2
2001 5.1 13.0 18.3 23.0 25.2 26.6
2002 4.5 11.3 17.4 23.0 24.3 27.8
2003 5.7 13.7 18.5 24.0 24.8 26.8
2004 3.9 14.8 17.2 22.4 24.8 27.1
2005 3.8 10.7 18.4 23.0 23.6 27.7
2006 1.6 9.3 18.1 23.1 24.9 29.2
2007 2.7 9.4 18.7 23.5 25.8 30.8
2008 2.9 8.4 19.3 24.8 26.8 31.5
2009 3.1 10.4 18.5 24.2 26.0 31.1
2010 1.9 8.5 18.9 24.3 26.8 30.5
2011 2.3 10.3 18.5 23.6 28.4 31.8
2012 1.9 5.7 17.8 24.4 29.5 29.9
2013 2.0 8.8 19.0 25.4 29.0 34.0
2014 1.8 7.4 17.7 27.0 28.7 32.3
2015 2.5 6.6 17.6 25.0 27.5 32.3
2016 2.1 12.0 16.0 23.0 26.0 na
Average 2000 to 2016 3.2 10.1 18.1 23.9 26.3 29.8
Average 2011 to 2016 2.1 8.5 17.8 24.7 28.2 32.1
Source: Professions Australia, Professional Engineer Remuneration Survey Reports, June
Table 8.3: Average age of private sector professional engineers
Year Level 1 Level 2 Level 3 Level 4 Level 5 Above L5
2000 26.0 30.0 36.0 43.0 45.0 45.0
2001 25.0 29.0 35.0 42.0 44.0 45.0
2002 26.0 30.0 36.0 43.0 43.0 47.0
2003 26.0 29.6 36.1 42.3 43.4 45.6
2004 25.4 30.2 35.6 42.5 42.8 47.1
2005 25.0 29.0 40.2 43.6 45.5 54.0
2006 24.4 29.3 37.2 43.2 48.3 49.1
2007 24.8 28.3 37.0 44.1 46.3 50.8
2008 25.1 27.9 38.3 44.1 48.7 53.9
2009 24.2 29.9 37.7 44.4 47.6 51.2
2010 25.0 29.6 38.5 45.1 48.9 47.9
2011 24.7 31.3 39.2 44.5 49.6 53.2
2012 25.3 28.6 37.1 46.2 51.0 53.4
2013 25.2 33.0 40.8 47.4 50.7 53.5
2014 25.5 28.8 38.8 48.0 49.5 51.2
2015 24.9 28.4 38.8 46.8 50.2 49.1
2016 25.0 29.0 37.0 44.0 48.0 na
Average 2000 to 2016 25.1 29.5 37.6 44.4 47.2 49.8
Average 2011 to 2016 25.1 29.9 38.6 46.2 49.8 52.1
Source: APESMA, Professional Engineer Remuneration Survey Reports, June
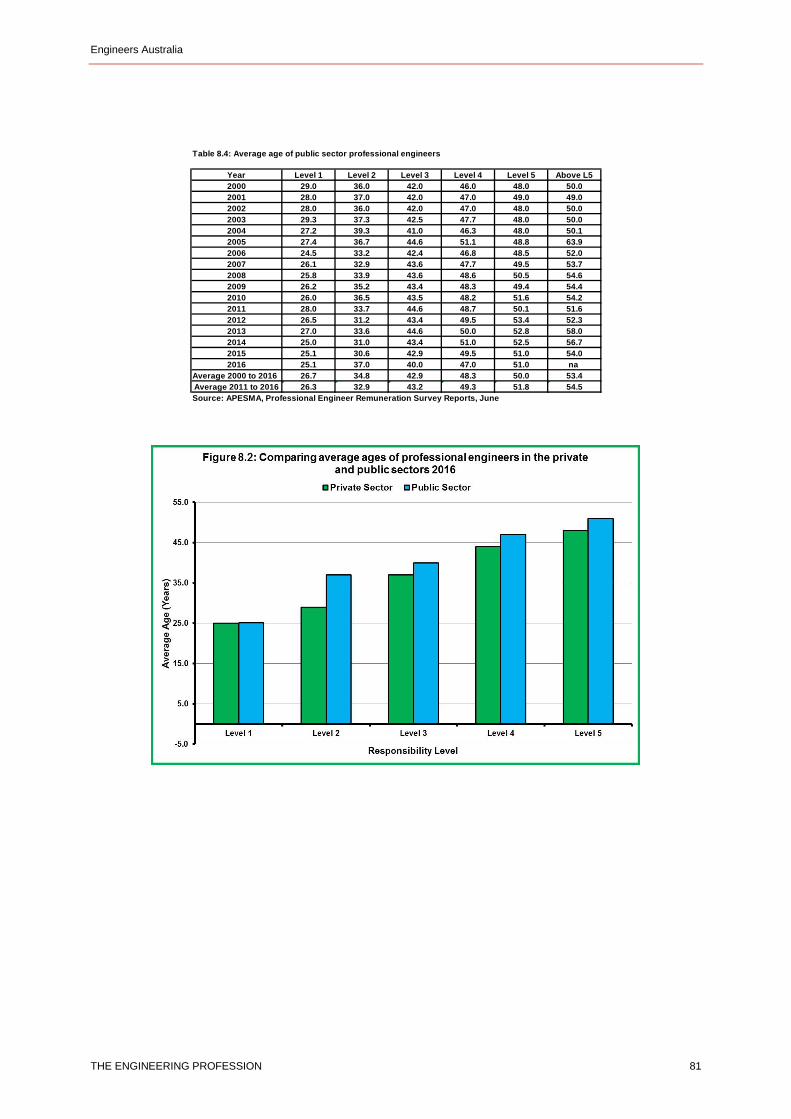
Engineers Australia
THE ENGINEERING PROFESSION 81
Table 8.4: Average age of public sector professional engineers
Year Level 1 Level 2 Level 3 Level 4 Level 5 Above L5
2000 29.0 36.0 42.0 46.0 48.0 50.0
2001 28.0 37.0 42.0 47.0 49.0 49.0
2002 28.0 36.0 42.0 47.0 48.0 50.0
2003 29.3 37.3 42.5 47.7 48.0 50.0
2004 27.2 39.3 41.0 46.3 48.0 50.1
2005 27.4 36.7 44.6 51.1 48.8 63.9
2006 24.5 33.2 42.4 46.8 48.5 52.0
2007 26.1 32.9 43.6 47.7 49.5 53.7
2008 25.8 33.9 43.6 48.6 50.5 54.6
2009 26.2 35.2 43.4 48.3 49.4 54.4
2010 26.0 36.5 43.5 48.2 51.6 54.2
2011 28.0 33.7 44.6 48.7 50.1 51.6
2012 26.5 31.2 43.4 49.5 53.4 52.3
2013 27.0 33.6 44.6 50.0 52.8 58.0
2014 25.0 31.0 43.4 51.0 52.5 56.7
2015 25.1 30.6 42.9 49.5 51.0 54.0
2016 25.1 37.0 40.0 47.0 51.0 na
Average 2000 to 2016 26.7 34.8 42.9 48.3 50.0 53.4
Average 2011 to 2016 26.3 32.9 43.2 49.3 51.8 54.5
Source: APESMA, Professional Engineer Remuneration Survey Reports, June
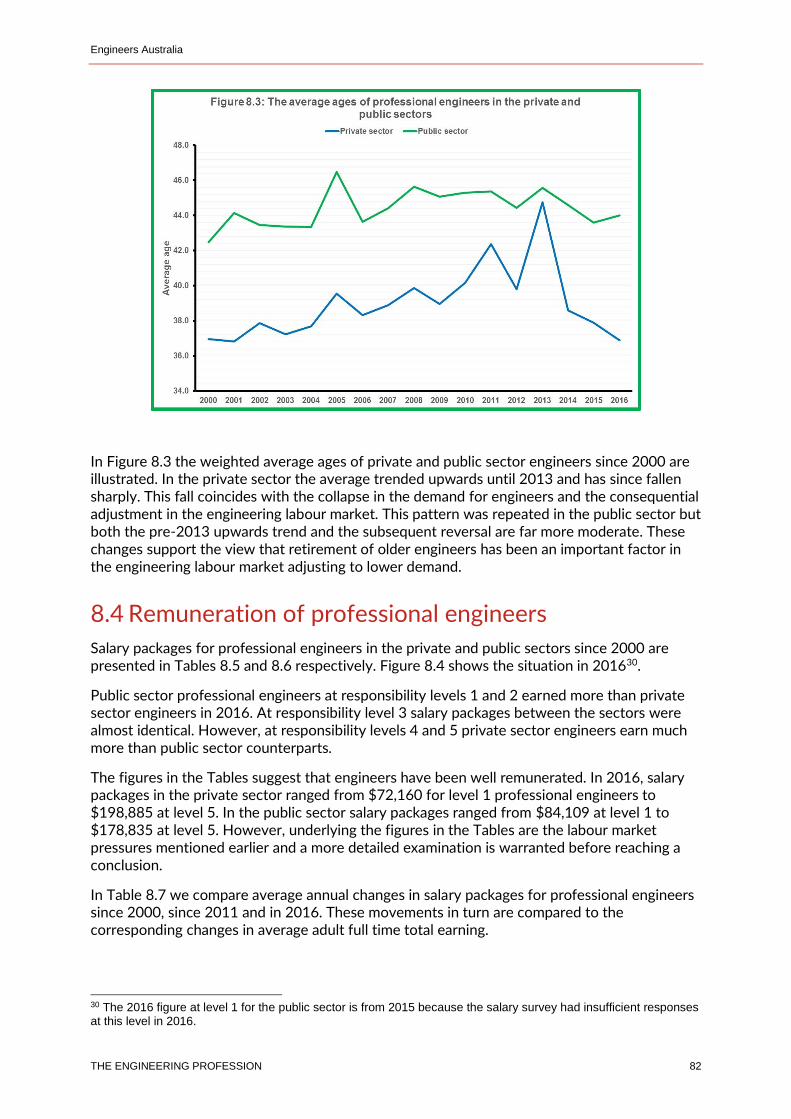
Engineers Australia
THE ENGINEERING PROFESSION 82
In Figure 8.3 the weighted average ages of private and public sector engineers since 2000 are illustrated. In the private sector the average trended upwards until 2013 and has since fallen sharply. This fall coincides with the collapse in the demand for engineers and the consequential adjustment in the engineering labour market. This pattern was repeated in the public sector but both the pre-2013 upwards trend and the subsequent reversal are far more moderate. These changes support the view that retirement of older engineers has been an important factor in the engineering labour market adjusting to lower demand.
8.4 Remuneration of professional engineers
Salary packages for professional engineers in the private and public sectors since 2000 are presented in Tables 8.5 and 8.6 respectively. Figure 8.4 shows the situation in 201630.
Public sector professional engineers at responsibility levels 1 and 2 earned more than private sector engineers in 2016. At responsibility level 3 salary packages between the sectors were almost identical. However, at responsibility levels 4 and 5 private sector engineers earn much more than public sector counterparts.
The figures in the Tables suggest that engineers have been well remunerated. In 2016, salary packages in the private sector ranged from $72,160 for level 1 professional engineers to $198,885 at level 5. In the public sector salary packages ranged from $84,109 at level 1 to $178,835 at level 5. However, underlying the figures in the Tables are the labour market pressures mentioned earlier and a more detailed examination is warranted before reaching a conclusion.
In Table 8.7 we compare average annual changes in salary packages for professional engineers since 2000, since 2011 and in 2016. These movements in turn are compared to the corresponding changes in average adult full time total earning.
30 The 2016 figure at level 1 for the public sector is from 2015 because the salary survey had insufficient responses at this level in 2016.
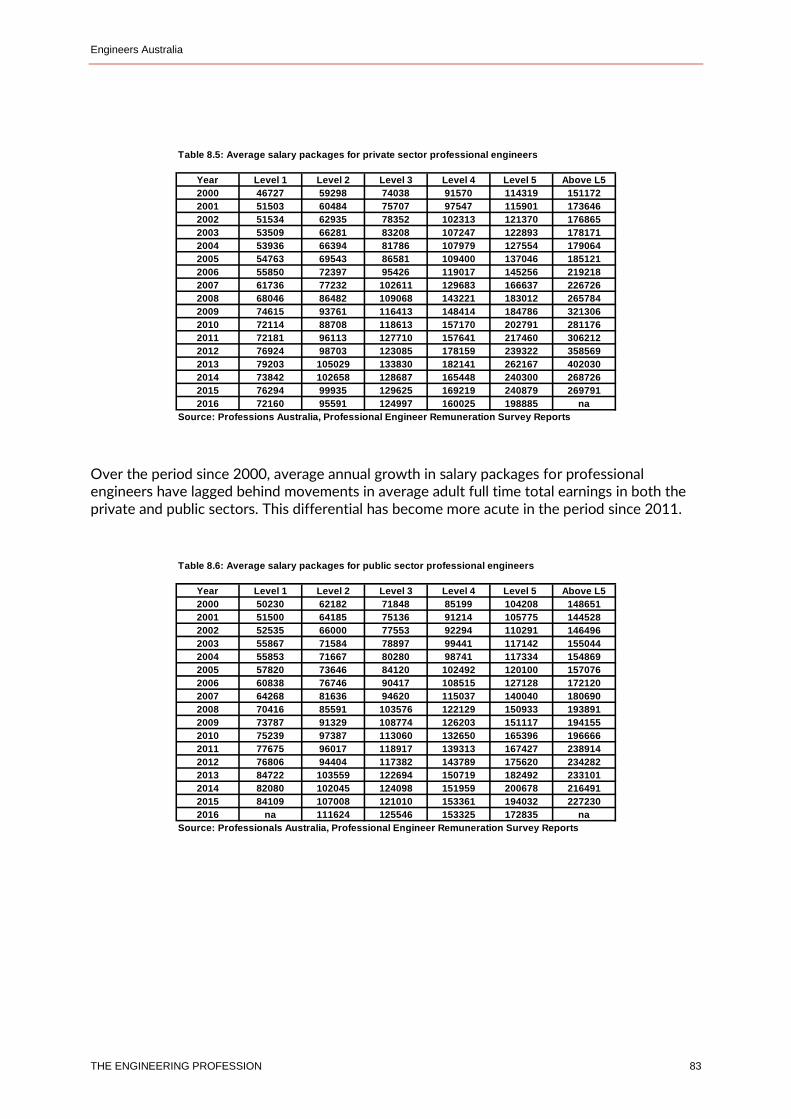
Engineers Australia
THE ENGINEERING PROFESSION 83
Over the period since 2000, average annual growth in salary packages for professional engineers have lagged behind movements in average adult full time total earnings in both the private and public sectors. This differential has become more acute in the period since 2011.
Table 8.5: Average salary packages for private sector professional engineers
Year Level 1 Level 2 Level 3 Level 4 Level 5 Above L5
2000 46727 59298 74038 91570 114319 151172
2001 51503 60484 75707 97547 115901 173646
2002 51534 62935 78352 102313 121370 176865
2003 53509 66281 83208 107247 122893 178171
2004 53936 66394 81786 107979 127554 179064
2005 54763 69543 86581 109400 137046 185121
2006 55850 72397 95426 119017 145256 219218
2007 61736 77232 102611 129683 166637 226726
2008 68046 86482 109068 143221 183012 265784
2009 74615 93761 116413 148414 184786 321306
2010 72114 88708 118613 157170 202791 281176
2011 72181 96113 127710 157641 217460 306212
2012 76924 98703 123085 178159 239322 358569
2013 79203 105029 133830 182141 262167 402030
2014 73842 102658 128687 165448 240300 268726
2015 76294 99935 129625 169219 240879 269791
2016 72160 95591 124997 160025 198885 na
Source: Professions Australia, Professional Engineer Remuneration Survey Reports
Table 8.6: Average salary packages for public sector professional engineers
Year Level 1 Level 2 Level 3 Level 4 Level 5 Above L5
2000 50230 62182 71848 85199 104208 148651
2001 51500 64185 75136 91214 105775 144528
2002 52535 66000 77553 92294 110291 146496
2003 55867 71584 78897 99441 117142 155044
2004 55853 71667 80280 98741 117334 154869
2005 57820 73646 84120 102492 120100 157076
2006 60838 76746 90417 108515 127128 172120
2007 64268 81636 94620 115037 140040 180690
2008 70416 85591 103576 122129 150933 193891
2009 73787 91329 108774 126203 151117 194155
2010 75239 97387 113060 132650 165396 196666
2011 77675 96017 118917 139313 167427 238914
2012 76806 94404 117382 143789 175620 234282
2013 84722 103559 122694 150719 182492 233101
2014 82080 102045 124098 151959 200678 216491
2015 84109 107008 121010 153361 194032 227230
2016 na 111624 125546 153325 172835 na
Source: Professionals Australia, Professional Engineer Remuneration Survey Reports
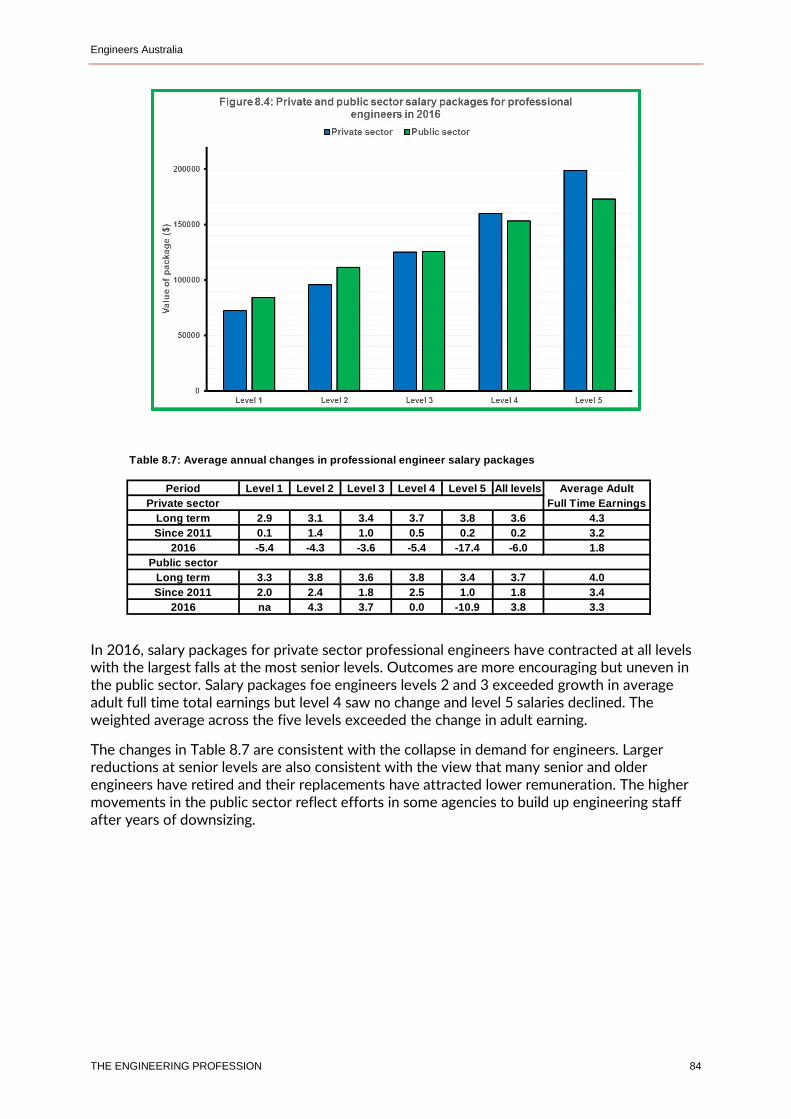
Engineers Australia
THE ENGINEERING PROFESSION 84
In 2016, salary packages for private sector professional engineers have contracted at all levels with the largest falls at the most senior levels. Outcomes are more encouraging but uneven in the public sector. Salary packages foe engineers levels 2 and 3 exceeded growth in average adult full time total earnings but level 4 saw no change and level 5 salaries declined. The weighted average across the five levels exceeded the change in adult earning.
The changes in Table 8.7 are consistent with the collapse in demand for engineers. Larger reductions at senior levels are also consistent with the view that many senior and older engineers have retired and their replacements have attracted lower remuneration. The higher movements in the public sector reflect efforts in some agencies to build up engineering staff after years of downsizing.
Table 8.7: Average annual changes in professional engineer salary packages
Period Level 1 Level 2 Level 3 Level 4 Level 5 All levels Average Adult
Private sector Full Time Earnings
Long term 2.9 3.1 3.4 3.7 3.8 3.6 4.3
Since 2011 0.1 1.4 1.0 0.5 0.2 0.2 3.2
2016 -5.4 -4.3 -3.6 -5.4 -17.4 -6.0 1.8
Public sector
Long term 3.3 3.8 3.6 3.8 3.4 3.7 4.0
Since 2011 2.0 2.4 1.8 2.5 1.0 1.8 3.4
2016 na 4.3 3.7 0.0 -10.9 3.8 3.3
Engineers Australia
THE ENGINEERING PROFESSION 85
Chapter 9: Some further indicators of the status of the engineering labour market
Main Points To complement statistics discussed in earlier Chapter, here we consider two other important indicators of the demand for engineers; trends in engineering construction and vacancies for engineers.
In other publications, trends in engineering construction are used to monitor progress in infrastructure development. In this Chapter we are concerned about what these trends mean for the demand for engineers. There has been some recovery in public sector infrastructure but this work continues to contract in the private sector as the resources construction boom eases. These trends support a weak recovery in the demand for engineers in population centres but continuing weakness elsewhere. Trends in non-infrastructure engineering construction show continuing contraction but the scale of activity remains very high. Combined trends in engineering construction suggest a continuation of the present situation in the immediate future.
Trends in vacancies for engineers show some signs of recovery, but the engineering labour market remains weaker than both the professionals and overall labour markets. Statistics reported in Engineers Australia’s vacancies reports suggest recovery is concentrated in NSW and Victoria.
9.1 Trends in engineering construction
The discussion in this section is a summary of the most recent report by Engineers Australia reviewing trends in engineering construction to the end of June 201631.This report updated trends in an earlier set of reports covering national, state and territory trends32. The focus of these reports was Engineers Australia’s support for infrastructure investment to drive Australian productivity growth. In this Chapter we have a different focus, that is what do trends in infrastructure development and engineering construction say about the engineering labour market.
The basis of our analyses is the engineering construction statistics released by the Australian Bureau of Statistics (ABS)33. These statistics relate to additions to the stock of infrastructure through work completed on new assets. Not all engineering construction conforms to Infrastructure Australia’s concept of economic infrastructure and the emphasis in the reports mentioned above was on infrastructure. We repeat that approach here but draw greater attention to engineering construction that lies outside the Infrastructure Australia definition. Most of this relates to engineering construction to support the resources sector, and has been
31 Engineers Australia, Infrastructure in Australia; Update to June 2016, 21 December 2016, www.engineersaustralia.org.au 32 [email protected] 33 ABS, Engineering Construction, Australia, Cat No 8762.0, electronic releases, www.abs.gov.au
Engineers Australia
THE ENGINEERING PROFESSION 86
commented upon extensively in the press, the resources construction boom is now over. This factor underpins the changes in the engineering labour market since late 2012 and how it continues to progress has an important bearing on the immediate future.
Nearly all public sector engineering construction is on infrastructure and the bulk of it is located in population centres or links population centres (see Figure 9.1). Private sector engineering construction has a more complex composition.
Part of it is engineering construction on infrastructure projects on contract from the public sector. Assets so constructed typically remain in public ownership and are included in our review as public sector construction.
Another part is private sector engineering construction on infrastructure projects whose assets are owned by the private sector when completed. Some of these assets to all intents and purposes are identical to public infrastructure, for example, toll roads in cities, railway lines or privately owned and operated sewerage plants. Other such assets are in support of resources projects, for example, a railway linking a mine to a port, and although infrastructure have different impacts.
Finally, a large part of private sector engineering construction is on the development of resources facilities like mines and gas wells. This construction is not infrastructure in the reports mentioned above.
The key issue in this Chapter is that all engineering construction affects the engineering labour market irrespective of whether it is infrastructure development or something else. The distinctions outlined simply give an indication of where the construction is located.
The most effective way to gauge the strength of current engineering construction is in the context of historical trends. Our analysis looks at trends in constant 2013-14 prices from 1990-91 until 2015-16. The red line in Figure 9.1 is the trend in engineering construction overall. The trend is clearly downwards. Until recently, the downwards change was the result of contraction in both public and private sector construction, but in the last year there was a small upswing in public sector construction. A large proportion of this was the infrastructure
Engineers Australia
THE ENGINEERING PROFESSION 87
surge that occurred in NSW. However, the scale of this surge was minute compared to the downwards shifts in both private sector infrastructure construction and non-infrastructure (that is, mainly resources sector) construction.
In Figures 9.2 and 9.3 we delve into these trends in greater detail. Figure 9.2 looks at combined public and private sector engineering construction on infrastructure. Three aspects of construction are illustrated; work completed (blue line), new work commenced (green line) and work underway but not yet completed (red line). Combined public and private sector infrastructure work completed trended downwards in 2015-16, despite the upswing in public sector construction, continuing a three-year trend. In 2015-16, a total of $45.5 billion in infrastructure work was completed.
Engineers Australia
THE ENGINEERING PROFESSION 88
New infrastructure construction commenced recovered by 4.4% compared to the previous year and appeared to be sufficient to slow the rapid decline in uncompleted construction. All of the increase in new commencements was public sector infrastructure which offset a falling private sector trend which began three years earlier. New construction commencements represent just short of one year’s work at the present rate of completions. In 2015-16 there was uncompleted infrastructure valued at $101.4 billion yet to be completed; $66.1 billion public sector construction and $35.3 billion private sector construction. The public sector work represents 2.6 years of work at the present rate of completions while the private sector work represents 1.8 years work at the present rate of completions.
The implications of infrastructure trends are that construction is likely to continue at present levels for the next one to two years as uncompleted work continues to wind down. There is likely to be a faster wind down in the private sector than the public sector. Increases in the public sector are not likely to be sufficient to offset the decline in the private sector.
Since almost all non-infrastructure engineering construction occurs in the private sector we simplify Figure 9.3 by restricting our examination to this sector.
In 2012-13, non-infrastructure engineering construction yet to be completed peaked at $443.5 billion and it has fallen each year since. In 2015-16, it was $186.0 billion, 98.7% in the private sector. The rapid decline of uncompleted work underscores the falling trend in construction completed. Interestingly, there was a 13.7% increase in new construction commenced, but this is unlikely to make much impression on the fall in uncompleted work. At the present rate of completion, new commencements represent about one third of a year’s work and unfinished construction represents about 3.8 year’s work. This substantial backlog may not all be completed with some projects mothballed, but statistics provide no insights.
Overall, we observe some recovery in public sector infrastructure development while private sector infrastructure development continues to fall as the resources sector construction boom eases off. These trends support a weak recovery in the demand for engineers in population centres but suggest continued weakness in the resources sector. It is important to note the scale of activity in non-infrastructure engineering construction remains large despite the falling trends. However, the scale of the reductions in activity in these areas is also very large and their impact on the demand for engineers has been significant. Putting these views together suggests a continuation of the present situation, signs of recovery in some locations offset by continuing weakness in the resources sector.
9.2 Trends in vacancies for engineers
A common indicator of labour market conditions used in economics is the Beveridge Curve which hypothesizes the unemployment rate (the number of unemployed persons scaled by the labour force) as a function of the vacancy rate (the number of job vacancies scaled by the labour force). The Beveridge curve indicates that higher rates of unemployment are associated with lower vacancy rates, and conversely, lower rates of unemployment are associated with higher vacancy rates34. The Beveridge curve underpins Engineers Australia’s monitoring of vacancies for engineers based on the internet vacancies statistics released by the Department of Employment.
Engineers Australia has not estimated a Beveridge Curve for the engineering labour market because this would involve bringing together statistics from different sources; vacancies statistics from the Department of Employment and unemployment and labour force statistics from the ABS (as described in Chapter 3). Given this complication we monitor vacancies for 34 K Edwards and L Gustafsson, Indicators of labour demand, Reserve Bank of Australia Bulletin, September Quarter 2013, www.rba.gov.au
Engineers Australia
THE ENGINEERING PROFESSION 89
engineers on the presumption that the scaling factor on both sides of the Beveridge Curve, the labour force, is the same. Thus, we associate high vacancy levels with low unemployment and high demand for engineers, and conversely, low vacancy levels with higher unemployment and low demand for engineers.
In Figure 9.4, we compare the trend in vacancies for engineers to trends in vacancies for professionals in all fields and all vacancies in the Australian labour market. The most recent statistics are for December 2016 and show that after languishing at very low levels since July 2013, vacancies for engineers have begun to slowly increase. This change emerged about April 2016 and each month since has showed a small increase. In December 2016, the vacancy index for engineers was 66.6 compared to 100 in January 2007 when the index commenced and 198.3 at the height of the resources boom in January 2012.
When compared to other vacancies, the trend in vacancies for engineers clearly illustrates the pressures in the engineering labour market during the resources boom (the dip in 2010 was the short term effect of the global financial crisis). Vacancies for engineers were substantially higher than either of the other two trends shown. However, this situation began to collapse in about December 2012 and resulted in an extensive downwards trend in vacancies for engineers that did not bottom out until about January 2014. Since July 2014, the trend in vacancies for engineers has been well below the other trends illustrated. This remains the case despite the signs of recovery in vacancies for engineers.
In summary, the latest statistics on vacancies for engineers indicate a weak labour market. While there are signs of recovery, the engineering labour market is weaker than the professionals labour market and the Australian labour market overall. State and Territory statistics35 suggest most of the recovery in engineering vacancies has occurred in NSW and Victoria.
35 State and Territory analyses of vacancies for engineers are available from newsroom.engineersaustralia.org.au/news/statistics-data/engineering-market-analysis
Engineers Australia
THE ENGINEERING PROFESSION 90
Chapter 10: The engineering labour market in 2017
Main Points
This Chapter summarises the main trends discussed in the Statistical Overview and considers the implications for the year ahead.
Considered judgment suggests that little improvement in the engineering labour market should be expected in 2017.
10.1 Overview
This section summarises those results discussed in the Statistical Overview that are important elements in an assessment of the year ahead.
Chapter 2 showed that engineers have a strong propensity to retire from the labour force when their ages reach the mid-50s. This result occurred during a period of very high demand for engineers and was evident in engineering intense industries, including those experiencing severe shortages of engineers.
Chapter 3 showed that the supply of qualified engineers aged 15 to 64 years fell in 2016. This change reflects falling labour force participation by engineers and a fall in the number of unemployed qualified engineers. Though there was an increase in employment of qualified engineers but the number of qualified engineers employed in engineering occupations fell. The proportion of women in the engineering labour force remains low at just 12.4% in 2016.
Chapter 4 showed that year 12 students studying mathematics and science subjects is precarious. In some subjects falls in subject participation rates were offset by rises in year 12 retention so that actual numbers of students were stable or slowly rising. In advanced mathematics and physics the number of young women was especially low. Variability in year 12 between jurisdictions was excessive. For the second year in succession, the number of year 12 students accepting places in engineering courses fell and was only offset by universities accepting more students, including mature age applicants, who applied directly to universities by-passing the tertiary admission process. Among students participating in the tertiary admission process, young women had tertiary admission ranks substantially higher than young men, and in turn. the young men had tertiary admission ranks higher than acceptances in other subjects.
Chapter 5 showed that the rising trend of commencements in university entry level engineering courses have fallen since 2013. At this stage, entry level course completions still reflect earlier rises in commencements and continue to increase. This trend will reverse as new commencements progress through their courses
More engineering graduates are available for full time work than in the past and more choose full time post graduate study. Of those preferring full time work, the proportion who remain unemployed six months after graduation has increased sharply over the past six years
Engineers Australia
THE ENGINEERING PROFESSION 91
and in the past two years has been substantially higher than graduates from other fields of study.
Engineering course completions covering the engineering team are now at record levels and are now almost 30% higher each year than in 2003. I 2016, there were 9,910 completions. Engineers Australia’s advocacy in this area has been successful.
In 2015-16, a record number of skilled migrants, almost twice as many as in 2009-10, were granted permanent visas. At the same time, 6,975 migrant engineers were employed in Australia on temporary 457 visas. This is a large number despite the reduction in temporary visa holder since 2012-13. In recent years, permanent migration numbers have increased offsetting a decline in temporary visa holders so that total skilled migration of engineers has exceeded 20,000 in each of the past five years.
In 2016, the remuneration packages of private sector engineers at all skill levels decreased. This change indicates a substantial reduction in the demand for engineers in a sector that employs over 82% of engineers.
Engineering construction statistics show signs of recovery in public sector construction, mainly located in population centres and connecting links. However, construction in the private sector, heavily dependent on the resources sector continues to fall and these falls still have some way to go. These statistics show a mixed picture for the demand for engineers weighted towards a negative prognosis.
Vacancies for engineers also show some signs of recovery over the past nine to twelve months, but the trend for engineers remains substantially below the trend in vacancies for professionals and well below the trend for vacancies in general in the Australian labour market. State statistics suggest most of any recovery is in NSW and Victoria.
10.2 The year ahead
There are countervailing factors influencing the supply of engineers. New engineering course completions by Australians and permanent residents are at a record level. Even allowing for some completions to move into post-graduate studies rather than the labour force does little to alter this perspective because completing post graduate students offset this effect.
Permanent skilled migration has increased substantially in recent years. Although temporary visa holder numbers have fallen in line with government policy design, almost 7,000 continue to be employed in Australia. The trends in the two categories of skilled migration have combined to deliver over 20,000 new migrant engineers into the Australian engineering labour force in each of the past five years. Combined with education completions, over 30,000 additional engineers have entered the engineering labour force in each of the past five years.
Offsetting these factors increasing the supply of engineers, labour force participation for engineers less than 65 years of age has fallen sharply. ACLD statistics suggest that most engineers aged 65 and over will have retired but SEW statistics suggest that many younger than 65 years have as well. Although now five years old, 2011 census age structure statistics indicate that there was a large number of engineers aged 55 years or more at the time. The fall in labour force participation, combined with the fall in the labour force in 2016 suggest that large numbers of older engineers have exited the labour market in recent years creating room for new entrants with a temporary spike in the unemployment rate which now has started to abate.
On the demand side, we have observed an increase in employment of qualified engineers aged under 65 years, but a sharp fall in the employment of this group in engineering occupations.
Engineers Australia
THE ENGINEERING PROFESSION 92
Three indicators of demand; across the board falls in private sector professional engineer remuneration, engineering construction statistics and statistics on vacancies for engineers suggest that demand remains weak despite some encouraging signs in the latter two indicators. Another concern is that fewer new engineering graduates available for full time employment are finding it and the proportion of them remaining unemployed is now substantially higher than for graduates in other fields. Embedded in this concern is a future problem; new graduates who cannot find full time work cannot begin on-the-job professional formation. In other words, the implications of this employment situation is long-lived.
Considered judgment suggests that little improvement in the engineering labour market should be expected in 2017. Education completions will continue to increase and there are no indications of change in Australia’s skilled migration policies and targets at this stage. There are few, if any, indications that demand will improve. There has been substantial adjustment in the engineering labour market in recent years and the turmoil this has caused participants should not be under-estimated. Although participation has fallen and the peak in unemployment has passed, our view is that adjustment will continue for the next year or two.