Embed Size (px)
Citation preview
THEENRICHMENTOFHUMIC‐REDUCINGBACTERIA
TerryLegg
UniversityofColorado/INSTAAR
MicrobialDiversity2009

2
INTRODUCTION
Humicsubstancesareubiquitousandheterogeneousorganiccompoundsthatcomprise
upto80%oftheorganicmatterpoolinsoil,sedimentandaquaticenvironments(Mulholland
2003).Untilrecently,humicsubstances(HS)wereconsideredchemicallyunreactivepoolsof
dissolvedorganicmatter.However,ithasbeenshownthatHSformcomplexeswithmetals,
andthiscansignificantlyinfluencethemobility,bioavailabilityandspeciationofmetals(Tipping
1981;SpositoandWeber1986).HSalsoparticipateinreductionandoxidation(redox)reactions
withmetalspeciessuchasiron,otherorganiccompoundsandchlorinatedsolvents(Lovley,et
al.1996).TheredoxreactivityofHSisprimarilyattributedtoquinonemoieties(Scott,etal.
1998).
Phylogeneticallydiversemicroorganismsusethereductionandoxidationofhumic
substancestogenerateenergyand/ortosupportgrowth(Lovely,etal.1996).Manyhumics‐
reducingmicroorganismscoupletheoxidationofacetatetothereductionofquinones(Coates,
etal.1998).Whenpairedtotheoxidationofacetate,thereductionofanthraquinone‐2,6‐
disulfonicacid,amodelquinone‐likecompoundwhichisoftenusedasafunctionalhumic
substanceanalog,yields91.46kJofenergy(Equation1;Straub,etal.2005).Amoreselect
groupofmicroorganismsusehydrogenasanelectrondonorinHSreduction(Cervantes,etal.
2002).
Equation1.
Humics‐reducingmicroorganismshavebeenisolatedfromavarietyofanoxicfreshwater
andmarinesediments(Coates,etal.1998).Evidencesuggeststhathumics‐reducing
microorganismscouldbeasabundantasiron‐reducingandfermentingmicroorganismsin
anaerobicfreshwatersediments(Kappler,etal.2004).Initialinvestigationsfoundthatthe
majorityofhumics‐reducingmicroorganismswereDeltaproteobacteriaintheGeobacteraceae
family(Coates,etal.1998).MorerecentstudieshaveshownthatGammaproteobacteriainthe
Shewanellagenus,aswellashalorespiring,sulphate‐reducingandmethanogenic

3
microorganismscanalsoreducehumicsubstances(NewmanandKolter2000;Cervantes,etal.
2002).Whileadiversityoforganismscanreducequinonemoieties,growththroughhumics‐
reductionhasnotbeenconfirmedformanyorganismsoutsideoftheGeobacteraceaefamily.
Theprimarygoalofthisstudywastoisolateacetate‐oxidizinghumics‐reducing
microorganismsfromsedimentsamplescollectedinfreshwaterandsaltwaterenvironments
nearWoodsHole,Massachusetts.Anothergoalofthestudywastomonitortherelative
abundanceofDeltaproteobacteriawithintheenrichmentstotestifDeltaproteobacteriasuchas
thoseintheGeobacteraceaewerethedominantacetate‐oxidizinghumics‐reducing
microorganismsatthesamplesites.Resultsfromthisstudysuggestthatmicroorganismsthat
canpairacetateoxidationtoquinonereductionarepresentintheanoxicsedimentsofCedar
Swamp,SchoolStreetMarch,LittleSippewissettSaltMarshandoffthecoastofNaushonIsland
inMassachusetts(Figure1).
MATERIALSANDMETHODS
SedimentSampleCollection
Freshwaterandsaltwatersedimentswereusedasinoculaforeachofthehumics‐
reducingenrichments.AnoxicfreshwatersedimentswerecollectedfromSchoolStreetMarsh
(onecore)andCedarSwamp(twocores)onJuly8,2009(Figure1).Sedimentfromamicrobial
matintheLittleSippewissettSaltMarsh(onecore)wascollectedonJuly9,2009atlowtide.
SedimentcollectedfromaneelgrassbednearNaushonIslandwascollectedonJuly10,2009.
SedimentsamplesfromSchoolStreetMarsh,CedarSwampandLittleSippewissettSaltMarsh
werestoredinananoxicgas‐packjarthatwasflushedwithN2‐CO2(80:20)gasatfourdegrees
Celsiusuntilthetimeofinoculation.TheNaushonIslandsedimentwascollectedhourspriorto
inoculation,andstoredatfourdegreesCelsiusuntiltheinoculation.
EnrichmentCulturePreparation
EnrichmentcultureswerepreparedonJuly10,2009asdescribedinCoates,etal.1998
andStraub,etal.2005.Adetaileddescriptionoftheconcentrationsofconstituentswithinthe
bicarbonate‐bufferedbasalfreshwatermediacanbefoundinLovleyandPhillips1988whereas
therecipeforthebasalmarinemediacanbefoundinCoates,etal.1995.Anaerobicculturing
techniqueswereusedthroughouttheenrichmentculturepreparation(MillerandWolin1974).

4
BasalliquidmediawasautoclavedandthencooledunderN2‐CO2(80:20)foratleast20
minutes.Oncecooled,2mMacetateand5mMAQDSwasaddedtothebasalfreshwatermedia.
Next,20mlofmediawasaddedtoBalchtubesandonegramofsedimentwasaddedtoeach
tubewhilegassingtheheadspacewithN2‐CO2(80:20).Uninoculatedfreshwaterandmarine
controlswerealsopreparedusingthesamemethods.Moredetailsaboutthesampleinocula
arelistedinTable1.Freshwaterenrichmentswereincubatedinthedarkat30degreesCelsius
whilemarineenrichmentswereincubatedatroomtemperatureinthedark.
ThereductionofAQDSwasinitiallymonitoredbyobservanceofacolorchangefrom
pink‐ishtoadarkorange.Freshwaterenrichmentculturesweretransferredthreedaysafter
preparationbyadding1mlofprimaryenrichmentcultureto19mloffreshmedia,using
anaerobictechniques.MarineandfreshwaterenrichmentsweretransferredagainonJuly21,
2009toadilutionseries;thedilutionsusedwere10‐2,10‐4,10‐6and10‐8.Thedilutionseries
wereusedtoinoculate1.3%agaroseplateswiththesamechemicalcompositionastheliquid
media.Theseplateswereincubatedanaerobicallyat30degreesCelsius.Growthwasobserved
fortheplateinoculatedwiththeCS2sampleafterfivedays.
CARD‐FISH
ThesedimentsusedtoinoculateenrichmentcultureswerealsousedforCARD‐FISH
analysis.0.5mlofadditionalsedimentwaspreservedatthetimeofinoculationthrough
fixation,usingProtocolv2.0availableathttp://www.arb‐silva.de/fish‐probes/fish‐protocols/.
Fixedsedimentsweresonicatedusingthefollowingmethod:sonicateonlowspeedfor30
seconds,waitfor30seconds,seventimes.Sedimentswerestoredat‐20degreesCelsiusuntil
furtherCARD‐FISHpreparation.Primaryandsecondaryenrichmentculturesampleswerealso
fixedandstoredaccordingtothepreviouslymentionedprotocolattimepointsthroughoutthe
experiment.50μloffixedandsonicatedsamplewasaddedto10mlof1xPBSandvacuum‐
filteredonaMilliporeGTTPmembranefilterwith0.2μmporesize.Filterswerethenrinsed
with20mlofsterileMilliQwater.Next,filterswerepreparedaccordingtotheCARD‐FISH
protocolforsedimentsamplesavailableathttp://www.arb‐
silva.de/fileadmin/graphics_fish/SILVA_FISH_protocols_card_080702.pdf(Ishii,etal.2004).
FilterswerehybridizedwiththeEubacteria338,Archaea915,DeltaproteobacteriaandNonsense

5
probes;moredetailsareavailableathttp://www.microbial‐
ecology.net/probebase/list.asp?list=insitu‐probes.
ChemicalAnalysis
AcetateandAQDSconcentrationsweremonitoredthroughouttheenrichmentculture
experiment.Samplesforacetateanalysiswerepreparedbyextracting1mlofenrichment
cultureandcentrifugingthesampleonhighspeedfor5minutes,oruntilapelletformed.Then,
500μlofthesupernatantwastransferredintoa1.5mlsamplevial.Acetateconcentrations
weremeasuredonaShimadzuLC‐2010C‐HTHighPerformanceLiquidChromatography
instrument.TherearefewprecisemethodsformeasuringconcentrationsofAQDSinwater
samples.SincethereductionofAQDStoanthrahydroquinone‐2,6‐disulfonicacid(AHDS)results
inacolorchangetheprocesscanbemonitoredthroughobservations.Inaddition,the
absorbanceofasampleat450nmcanprovideanestimateoftheamountofAQDSreduction
thathasoccurred.AnothermethodformeasuringAQDSreductionindirectlyincludesreacting
avolumeoffilteredsamplewithanequalvolumeofferriciron,andthenmeasuringthe
concentrationofferrousironproducedbythetransferofelectronsfromAHDStoferriciron
(Straub,etal.2005).Ferrousironconcentrationscanbedeterminedbytheferrozinemethod
(Stookey1970).EachofthesemethodswasusedtoestimateAQDSreductioninthe
incubations.
RESULTS
Observationsandchemicalanalysisofenrichmentculturesidentifieddifferences
betweenfreshwaterandmarineenrichmentcultures.Theculturemediaintheprimary
freshwaterenrichmentschangedtoadarkorangecolor,asignofAQDSreduction,afteronly3
daysofincubationat30degreesCelsius.Incontrast,thesamemagnitudeofcolorchangewas
notobservedinthemarineenrichmentsevenafter17daysofincubationatroomtemperature.
TheNaushonIslandeelgrassbedenrichmentshowedthelargestamountofcolorchangeduring
theenrichmentexperiment,andtheenrichmentinoculatedwithshallowsedimentformthe
LittleSippewissettSaltMarshshowedamoderateamountofcolorchangeduringthesame
periodoftime.Thesecondaryfreshwaterenrichmentswereslowertoshowacolorchange
thantheprimaryenrichments;8daysforthesecondaryenrichmentsasopposedtothreedays

6
fortheprimaryenrichments.Additionally,onlytheCS2enrichmentshowedanyAQDS
reductionthroughacolorchangewithinsevendaysofthethirdtransfer,thedilutionseries
(Table1).
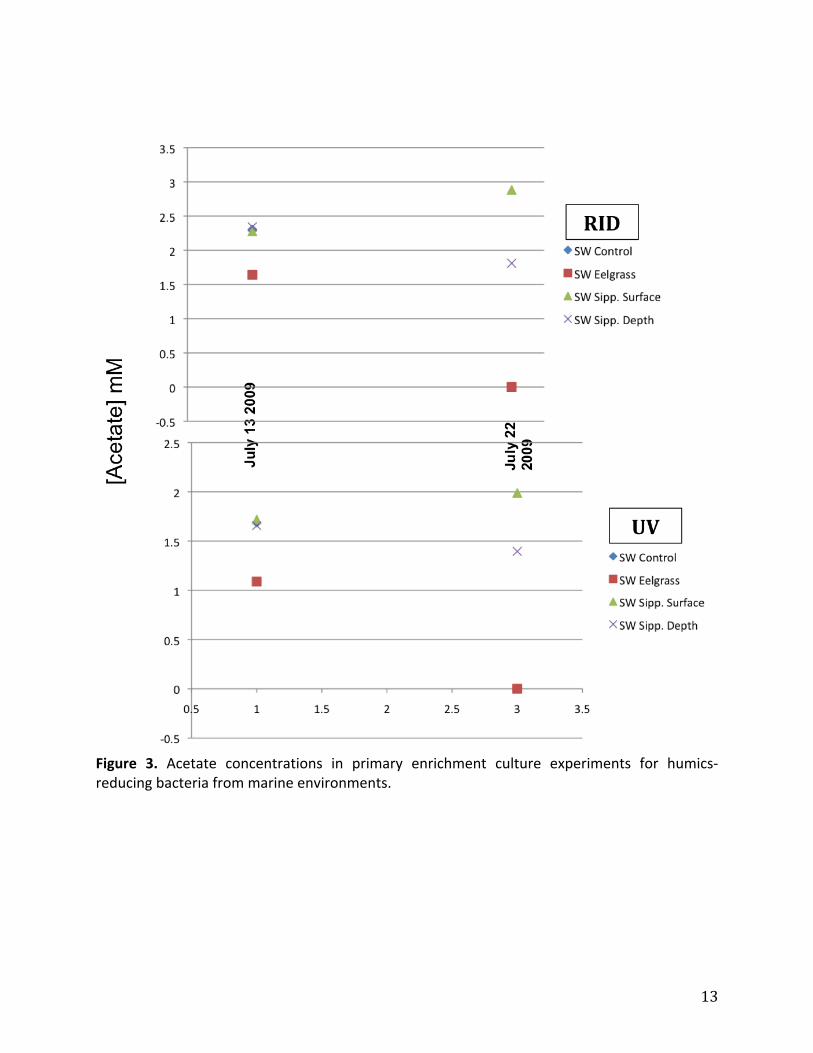
Acetatemeasurementsovertheexperimentalperioddemonstratethatacetatewas
consumedintheenrichmentcultures(Figures2‐4).Asstatedpreviously,2mMacetatewas
addedineachoftheenrichmentcultures.Atthetimeofthefirstacetatemeasurement,three
daysafterinoculation,thefreshwaterenrichmentsfromCedarSwampshowedsome
consumptionofacetatecomparedtothecontrolenrichment.Bytheendoftheprimary
enrichmentexperiment,13daysafterinoculation,alloftheaddedacetatehadbeenconsumed
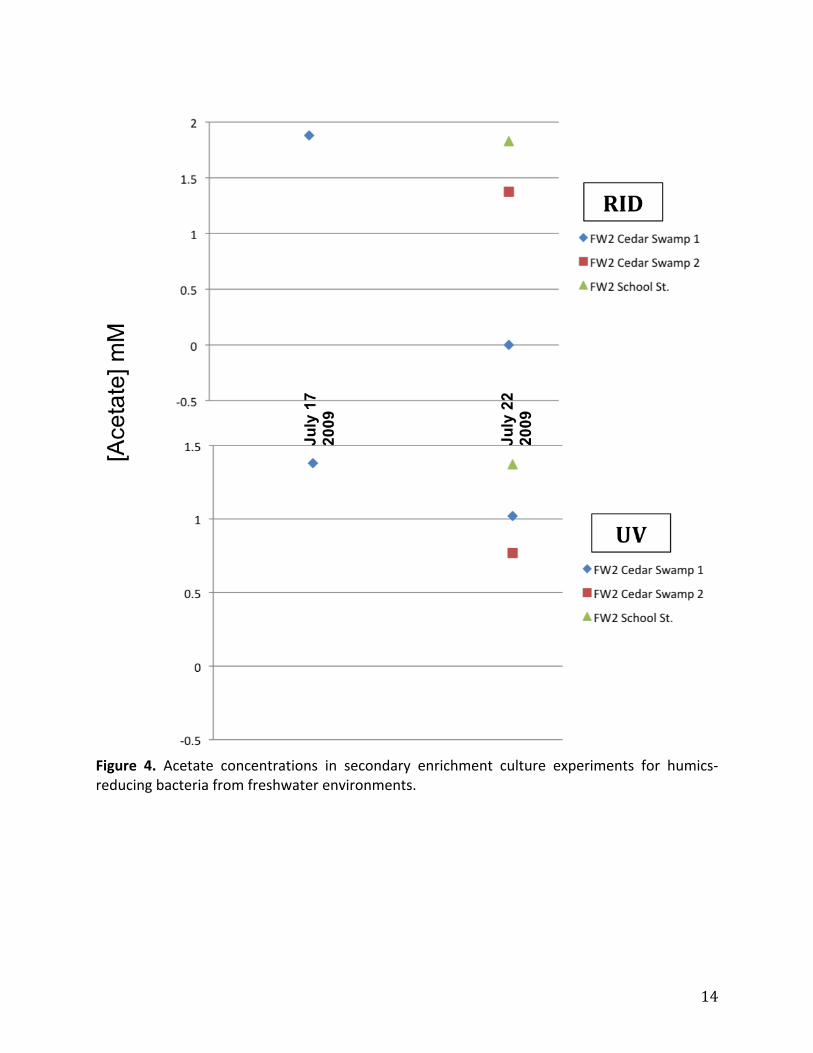
inthefreshwaterenrichments(Figure2).Acetatemeasurementsofthesecondaryfreshwater
enrichmentsalsoindictedthatacetateconsumptionoccurredovertheenrichmentperiod,and
thegreaterconsumptionoccurredinthesamplesfromCedarSwamp(Figure4).Incontrast,
acetateconcentrationsdecreasedverylittle,andevenincreasedinthemarineenrichments
fromtheLittleSippewissettSaltMarsh(Figure3).
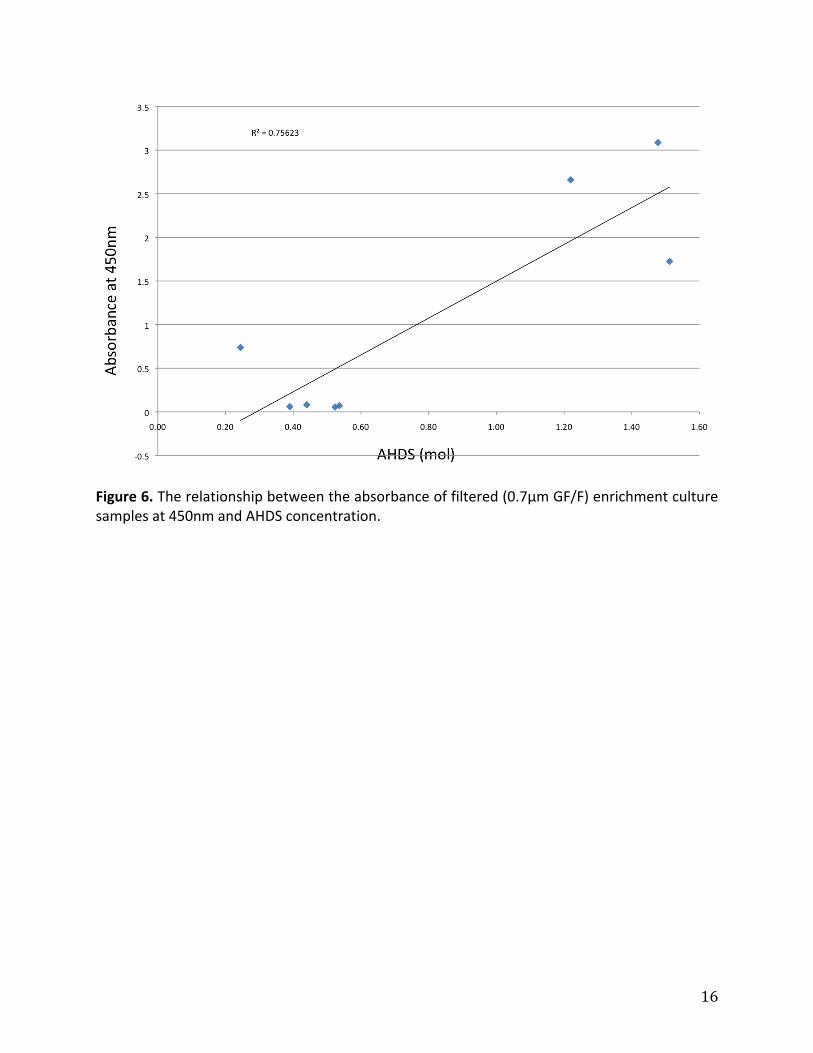
ResultsfromAQDSreductionestimateswereinconsistentwithacetateconsumption
(Figure7).Inaddition,AHDSconcentrationswerehigherinthemarineuninoculatedcontrol
enrichmentthanintheinoculatedenrichments(Figure5).TheseresultsindicatethattheAHDS
measurementsmaynotbeanaccuratemeasureofbiologicalAQDSreduction.However,there
wasastrongrelationshipbetweenresultsfromthetwomethodsusedtomeasureAQDS
reduction(Figure6).
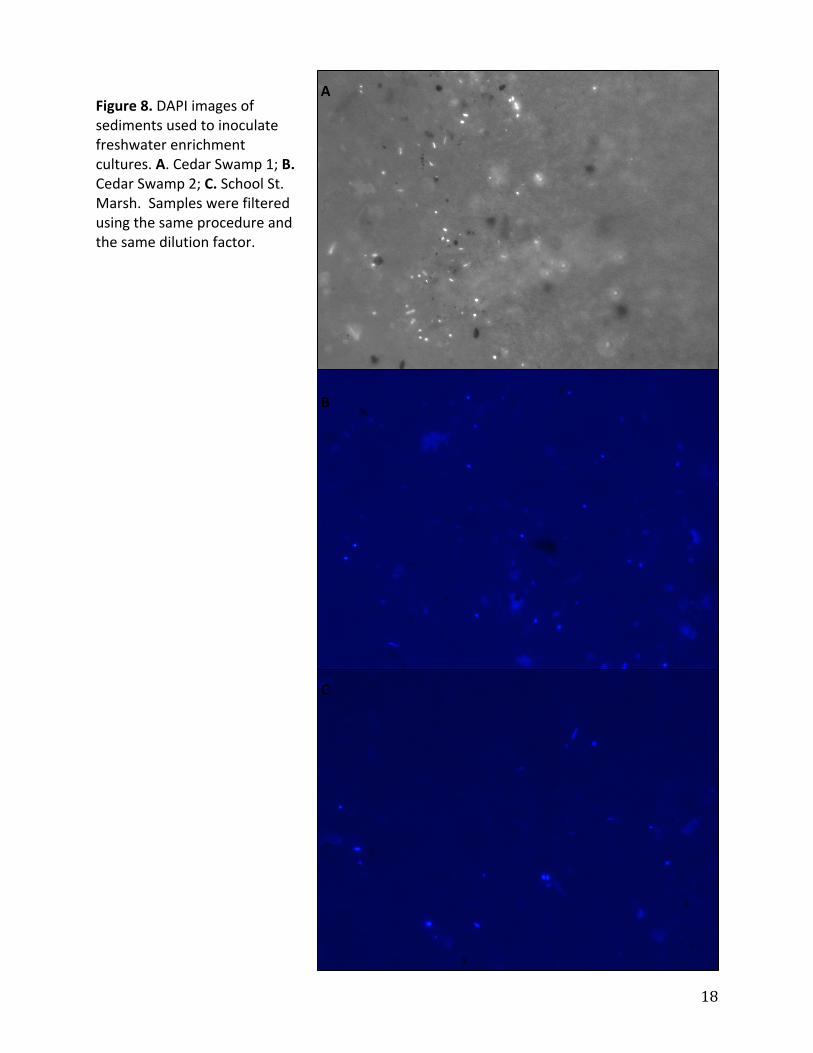
TheCARD‐FISHhybridizationwasnotverysuccessfulbecauseitwasdifficulttofindthe
dilutionfactorforwhichtherewasanappropriateproportionofcellstobackground
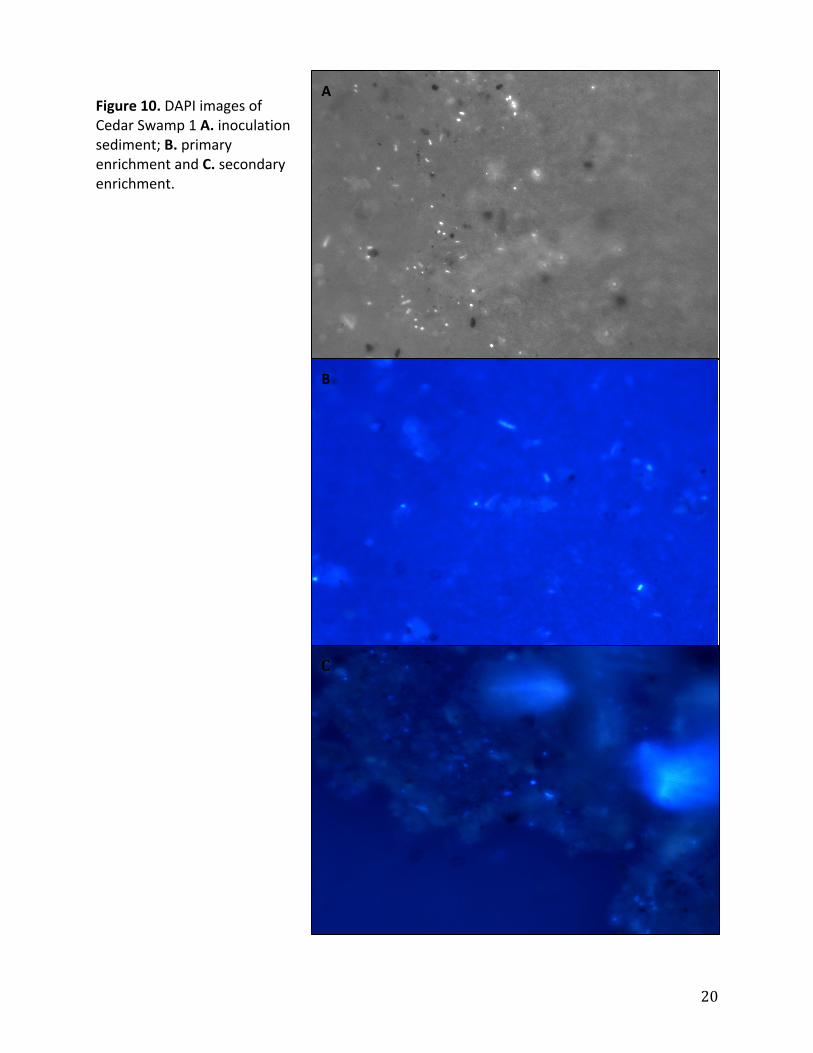
particulates.AsshowninFigures8‐10,theparticulatebackgroundincreasedbetweenthe
sedimentsamplestotheenrichmentsprobablybecauseofhighconcentrationsofAQDSinthe
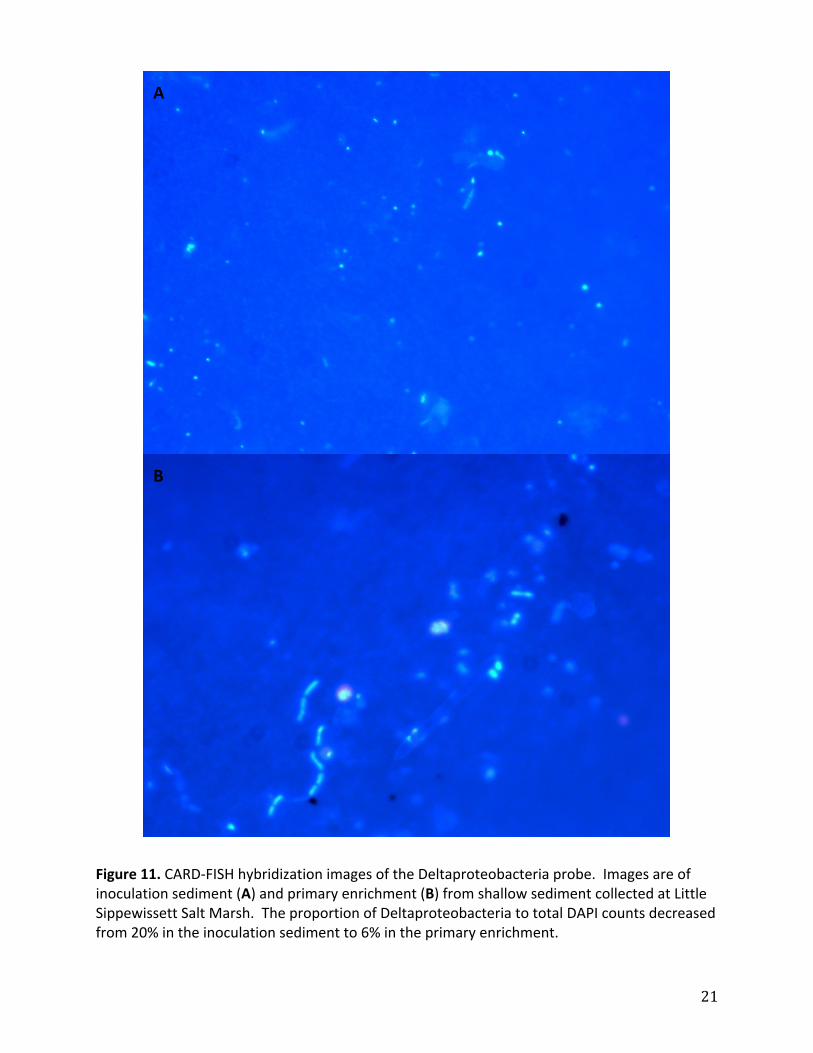
enrichments.ForLittleSippewissett1thepercentageofDeltaproteobacteriatototalDAPI
countsdecreasedfrom20%to6%betweentheinoculationsedimenttotheprimary
enrichment.CARD‐FISHhybridizationresultsfortheCedarSwamp1primaryenrichment
sampleshowedthatEubacteriacomprised50%ofthetotalDAPIcounts.

7
DISCUSSION
Resultsfromvisualobservationsandchemicalanalysissuggestthattheenrichmentof
humics‐reducingmicroorganismsfromfreshwaterenvironmentsassuccessful.Themorerapid
colorchangeinprimaryenrichmentsthaninsecondaryenrichmentscouldbeattributedto
abioticredoxreactionsbetweenAQDSinthemediaandchemicalspeciesintheinoculation
sediment,suchasferrousiron.Inaddition,thesurprisingacetateandAHDSconcentrationsin
themarineenrichmentscouldbetheresultofredoxreactionsbetweenthesediment,and
acetateandAQDSinthemedia.Inaddition,acetateincreasesintheLittleSippewissett1
primaryenrichmentcouldhavebeenproducedbyacetogenicmicroorganismsinthe
inoculationsediment.MethodsformeasuringthereductionofAQDSintheenrichment
culturesshouldbeoptimizedsothattheresultsfromthesemethodsarestronglycorrelated
withoneanother,andacetateconsumptionovertheexperimentalperiod.
ThegoaloftheCARD‐FISHexperimentwastomonitorchangesinthemicrobial
communityintheenrichmentculturesovertime.However,duetoproblemsinthe
optimizationofsampledilutionfactorsitwasnotpossibletogetaccuratecountsofthe
microbialtargetgroups.IntheoneenrichmentseriesforwhichDeltaproteobacteriacounts
werepossible,thepercentageofDeltaproteobacteriatototalDAPIcountsdecreased.This
resultwasindirectcontrasttothefindingthatthemajorityofacetate‐oxidizinghumics‐
reducingbacteriaareDeltaproteobacteria.
CONCLUSIONS
Futureexperimentsaimedatenrichingforandisolatinghumics‐reducingbacteria
shouldusesmalleramountsofsedimentinoculum,andshoulddevelopmoreaccuratemethods
forestimatingAQDSreduction.CARD‐FISHisaveryeffectivemethodfortrackingthe
developmentofenrichmentcultureshowever,humics‐reducingenrichmentswillbemore
difficulttotrackduetothebackgroundinterferencefromhumicsubstances.Also,itis
importanttonotethathumics‐reducingorganismsgrowrelativelyslowlyandtherefore,itmay
notbepossibletoisolatethesemicroorganismswithinashortperiodoftime.

8
REFERENCES
Cervantes,F.J.,F.A.M.deBok,T.Duong‐Dac,A.J.M.Stams,G.LettingaandJ.A.Field.2002.Reductionofhumicsubstancesbyhalorespiring,sulphate‐reducingandmethanogenicmicroorganisms,EnvironmentalMicrobiology4(1):51‐57.
Coates,J.D.,D.J.Lonergan,andD.R.Lovley.1995.Desulfuromonaspalmitatissp.nov.,along‐chainfattyacidoxidizingFe(III)reducerfrommarinesediments,ArchivesofMicrobiology164(6):406‐413.
Ishii,K.,M.Mußmann,B.J.MacGregor,andR.Amann.2004.Animprovedfluorescenceinsituhybridizationprotocolfortheidentificationofbacteriaandarchaeainmarinesediments,FEMSMicrobiologyEcology50:203‐212.
Kappler,A.,M.Benz,B.Schink,andA.Brune.2004.Electronshuttlingviahumicacidsinmicrobialiron(III)reductioninafreshwatersediment,FEMSMicrobiologyEcology47:85‐92.
Lovley,D.R.andE.J.P.Phillips.1988.Novelmodeofmicrobialenergymetabolism:organiccarbonoxidationcoupledtodissimilatoryreductionofironormanganese,AppliedandEnvironmentalMicrobiology54(6):1472‐1480.
Lovley,D.R.,J.D.Coates,E.L.Blunt‐Harris,E.J.P.Phillips,andJ.C.Woodward.1996.Humicsubstancesaselectronacceptorsformicrobialrespiration,Nature382:445‐448.
Miller,T.L.andM.J.Wolin.1974.AserumbottlemodificationoftheHungatetechniqueforculturingobligateanaerobes,AppliedMicrobiology27(5):985‐987.
Mulholland,P.J.2003.Large‐scalepatternsindissolvedorganiccarbonconcentration,fluxandsources.InInteractivityofDissolvedOrganicMatter;Findlay,S.E.G.,Sinsabaugh,R.L.,Eds.;AcademicPress:SanDiego,CA:139‐159.
Newman,D.K.andR.Kolter.2000.Aroleforexcretedquinonesinextracellularelectrontransfer,Nature405:94‐97.
Scott,D.T.,D.M.McKnight,E.L.Blunt‐Harris,S.E.Kolesar,andD.R.Lovley.1998.Quinonemoietiesactaselectronacceptorsinthereductionofhumicsubstancesbyhumics‐reducingmicroorganisms,EnvironmentalScienceandTechnology32:2984‐2989.
Sposito,G.andJ.H.Weber.1986.Sorptionoftracemetalsbyhumicmaterialsinsoilsandnaturalwaters,CriticalReviewsinEnvironmentalScienceandTechnology16(2):193‐229.
Straub,K.L.,A.Kappler,andB.Schink.2005.Enrichmentandisolationofferric‐iron‐andhumic‐acid‐reducingbacteria,EnvironmentalMicrobiology397:58‐77.
Stookey,L.L.1970.Ferrozine:anewspectrophotometricreagentforiron,AnalyticalChemistry42:779‐781.
Tipping,E.1981.Theadsorptionofaquatichumicsubstancesbyironoxides,GeochimicaetCosmochimicaActa45(2):191‐199.

9
10
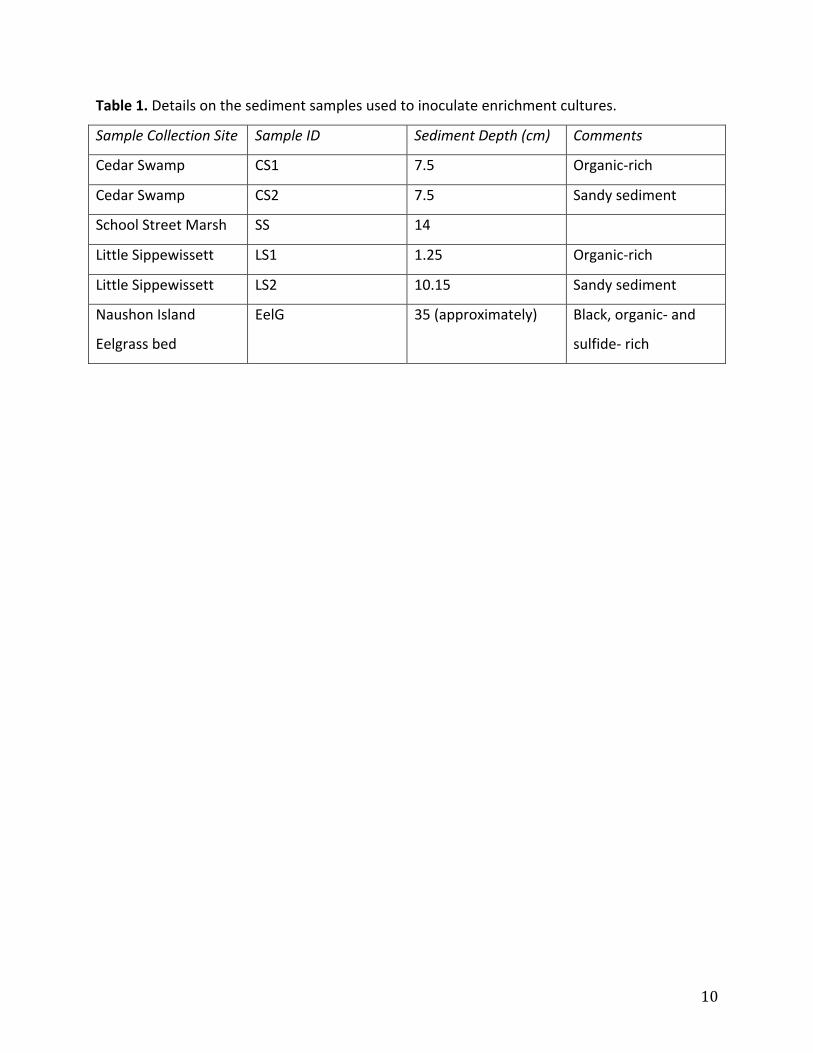
Table1.Detailsonthesedimentsamplesusedtoinoculateenrichmentcultures.
SampleCollectionSite SampleID SedimentDepth(cm) Comments
CedarSwamp CS1 7.5 Organic‐rich
CedarSwamp CS2 7.5 Sandysediment
SchoolStreetMarsh SS 14
LittleSippewissett LS1 1.25 Organic‐rich
LittleSippewissett LS2 10.15 Sandysediment
NaushonIsland
Eelgrassbed
EelG 35(approximately) Black,organic‐and
sulfide‐rich

11
Figure1.SedimentsamplingsitesnearWoodsHole,Massacusetts.SedimentInoculaforenrichmentcultureswerecollectedatSchoolStreetMarsh,CedarSwamp,LittleSippewissettSaltMarshandoffthecoastofNaushonIsland(courtesyofDr.ColleenCavanaugh).

12
Figure2.Acetateconcentrationsinprimaryenrichmentcultureexperimentsforhumics‐reducingbacteriafromfreshwaterenvironments.
13
Figure 3. Acetate concentrations in primary enrichment culture experiments for humics‐reducingbacteriafrommarineenvironments.
14
Figure 4. Acetate concentrations in secondary enrichment culture experiments for humics‐reducingbacteriafromfreshwaterenvironments.

15
Figure5.AHDSconcentrationestimatesinprimaryenrichmentcultures.AHDSconcentrationswereestimatedbyreacting500μlofsamplewith500μlof5mMferriccitrate for15minutes.Next, I performed the ferrozine method on the mixture to determine the concentration offerrousiron.IestimatedAHDSconcentrationbymultiplyingtheconcentrationofferrousironby2sincethereductionofFe(III)toFe(II) isaoneelectrontransfer,whereastheoxidationofAHDStoAQDSisatwoelectrontransfer.
16
Figure6.Therelationshipbetweentheabsorbanceoffiltered(0.7μmGF/F)enrichmentculturesamplesat450nmandAHDSconcentration.

17
Figure 7. The relationship between acetate and AHDS concentrations in primary enrichmentcultures. The R2 of the linear relationship between acetate andAHDS concentrations is lessthan0.1.
18
Figure8.DAPIimagesofsedimentsusedtoinoculatefreshwaterenrichmentcultures.A.CedarSwamp1;B.CedarSwamp2;C.SchoolSt.Marsh.Sampleswerefilteredusingthesameprocedureandthesamedilutionfactor.
A
B
C

19
Figure9.DAPIimagesofsedimentsusedtoinoculatemarineenrichmentcultures.A.LittleSippewissett1;B.LittleSippewissett2;C.NaushonIslandeelgrassbed.Sampleswerefilteredusingthesameprocedureandthesamedilutionfactor.
A
B
C
20
Figure10.DAPIimagesofCedarSwamp1A.inoculationsediment;B.primaryenrichmentandC.secondaryenrichment.
A
B
C
21
Figure11.CARD‐FISHhybridizationimagesoftheDeltaproteobacteriaprobe.Imagesareofinoculationsediment(A)andprimaryenrichment(B)fromshallowsedimentcollectedatLittleSippewissettSaltMarsh.TheproportionofDeltaproteobacteriatototalDAPIcountsdecreasedfrom20%intheinoculationsedimentto6%intheprimaryenrichment.
A
B

22
Figure12.CARD‐FISHhybridizationimagesoftheEubacteriaprobe.Imagesareoftheprimaryenrichment(A)DAPIand(B)EubacteriaprobefromSchoolStreetMarsh.AccordingtothehydridizationresultsEubacteriacomprised50%ofthetotalDAPIcounts.
A
B