Embed Size (px)
Citation preview

The Environmental Fate and Effects of Sea Lice
Chemotherapeutants used in Canadian Salmon
Aquaculture
by
Fauve Strachan
B.Sc., University of Calgary, 2012
Project Submitted in Partial Fulfillment of the
Requirements for the Degree of
Master of Environmental Toxicology
in the
Department of Biological Sciences
Faculty of Science
© Fauve Strachan 2018
SIMON FRASER UNIVERSITY
Fall 2018
Copyright in this work rests with the author. Please ensure that any reproduction or re-use is done in accordance with the relevant national copyright legislation.
ii
Approval
Name:
Degree:
Title:
Examining Committee:
Fauve Strachan
Master of Environmental Toxicology
The Environmental Fate and Persistence of Sea Lice Chemotherapeutants used in Canadian Salmon Aquaculture
Chair: Gordon Rintoul
Associate Professor
Date Defended/Approved:
Chris Kennedy Senior Supervisor Professor
Vicki Marlatt Supervisor Assistant Professor
Rostam Namdari External Examiner Senior Director Translational Drug Development Xenon Pharmaceuticals Inc.
May 23, 2018

iii
Ethics Statement

iv
Abstract
In Canada, five formulations have been used to treat sea lice infestations in salmon
aquaculture. This research investigated the environmental partitioning, persistence, and
acute toxicity to marine organisms of Slice® (AI: emamectin benzoate [EB]), Salmosan®
(AI: azamethiphos [AZ]), Alphamax® (AI: deltamethrin [DM]), Excis® (AI: cypermethrin
[CP]), and Interox® Paramove 50 (AI: hydrogen peroxide [HP]). EB, CP and DM
partitioned mainly to the sediment in sediment-water microcosms; AZ and HP remained
mainly in the water. The persistence of chemicals in water was reported: CP > DM > AZ
> HP. In sediment, CP > EB > DM was observed. Toxicity tests indicate a lack of trends
however the information is useful for identifying risks. Some reported values for
echinoderms, kelp, and topsmelt toxicity are below the recommended treatment
concentrations. This research provides insight into the environmental fate and associated
risks to non-target marine organisms in the vicinity of salmon aquaculture sites.
Keywords: toxicity; sea lice; aquaculture; pesticide; fate, persistence; partitioning;
chemotherapeutants
v
Acknowledgements
I must extend gratitude to my supervisor, Dr. Chris Kennedy, for allowing me the
freedom to take on this project as my own and for his invaluable guidance (and patience)
along the way. Without your help, the successful completion of this project would not have
been possible. This research was supported by a grant from the National Contaminants
Advisory Group of Fisheries and Oceans Canada to Dr. Chris Kennedy.
I owe much of the success of my toxicological testing to the people at Nautilus
Environmental, Burnaby BC. They provided me with a wealth of knowledge and
experience while preparing and performing my toxicological tests at their facility. I am
indebted to Emma Marus, Yvonne Lam, Karen Lee and Jeslin Wijaya who went above-
and-beyond the call of duty repeatedly, lending a hand and providing me with their
expertise and friendship. Special thanks must also be given to Krysta Pearcy for always
lending a hand, whenever possible.
The distractions, well-wishes, and advice of my lab-mates in the Kennedy lab were
always a special treat. A few amongst them were kind enough to volunteer their time when
I needed it most. The help of Tina Johnson, Vinicius Cavicchioli Azevedo, Kate Mill, and
Jessica Banning was instrumental to the success of my tests. Vini’s help extended beyond
lab-work. His positive attitude, kind spirit and friendship helped to keep me sane in the lab.
Special thanks must also go to Jill Bennett without whom the completion of the
environmental fate and persistence testing would not have been possible.
Thanks to the Gobas lab, Frank Gobas and Victoria Otton, for sharing their facilities
and expertise, lending an ear when needed, and for all their help in the early stages of the
project.
Last but not least, I am eternally grateful for the support of my friends and family
without which I most certainly would not have made it this far – I love you all. I am
especially thankful for the support of my parents, Rob and Josée, and my sister, Jessica,
for not only being my number one fans, supporting me in everything that I do, but also for
coming to visit me!

vi
Table of Contents
Approval .......................................................................................................................... ii Ethics Statement ............................................................................................................ iii Abstract .......................................................................................................................... iv Acknowledgements ......................................................................................................... v Table of Contents ........................................................................................................... vi List of Tables .................................................................................................................. ix List of Figures.................................................................................................................. x List of Acronyms ............................................................................................................. xi
Chapter 1. Introduction .............................................................................................. 1 1.1. Aquaculture .......................................................................................................... 1 1.2. Canadian aquaculture ........................................................................................... 2
1.2.1. Overview ....................................................................................................... 2 1.2.2. Aquaculture economics ................................................................................. 3 1.2.3. Regulation and management ......................................................................... 4 1.2.4. Environmental concerns ................................................................................ 5
1.3. Salmon aquaculture .............................................................................................. 7 1.3.1. History of salmon aquaculture ....................................................................... 7 1.3.2. Salmon aquaculture in Canada ...................................................................... 7 1.3.3. Environmental concerns of salmon aquaculture ............................................. 8 1.3.4. Disease and infection in salmon aquaculture ............................................... 10
1.4. Sea lice............................................................................................................... 10 1.4.1. Sea lice biology ........................................................................................... 10 1.4.2. Sea lice concerns in aquaculture ................................................................. 12 1.4.3. Sea lice treatments ...................................................................................... 13 1.4.4. Sea lice treatment in Canada ....................................................................... 16
1.5. Emamectin benzoate .......................................................................................... 17 1.5.1. Canadian usage .......................................................................................... 18 1.5.2. Chemotherapeutant efficacy ........................................................................ 18 1.5.3. Environmental fate of EB ............................................................................. 19 1.5.4. EB mechanism of action and effects on non-target species ......................... 19
1.6. Hydrogen peroxide ............................................................................................. 24 1.6.1. Canadian usage .......................................................................................... 24 1.6.2. Chemotherapeutant efficacy ........................................................................ 24 1.6.3. HP environmental fate ................................................................................. 25 1.6.4. HP mechanism of action and effects on non-target species ......................... 25
1.7. Pyrethroids ......................................................................................................... 29 1.7.1 Canadian usage .......................................................................................... 29 1.7.2 Chemotherapeutant efficacy ........................................................................ 29 1.7.3 Pyrethroid fate in the environment ............................................................... 30 1.7.4 Pyrethroid mechanism of action ................................................................... 30 1.7.5 CP effects on non-target species ................................................................. 31

vii
1.7.6 DM effects on non-target species ................................................................ 36 1.8. Azamethiphos ..................................................................................................... 40
1.8.1. Canadian usage .......................................................................................... 40 1.8.2. Chemotherapeutant efficacy ........................................................................ 40 1.8.3. AZ environmental fate and persistence ........................................................ 41 1.8.4. AZ mechanism of action and effects on non-target species ......................... 41
1.9. Risk of sea lice pesticide use .............................................................................. 46
Chapter 2. Environmental Fate and Effects of Sea Lice Pesticides used in Canadian Salmon Aquaculture ......................................................................... 47
Abstract ......................................................................................................................... 48 2.1. Introduction ......................................................................................................... 49 2.2. Materials and methods ....................................................................................... 51
2.2.1. Organisms ................................................................................................... 51 2.2.2. Chemicals .................................................................................................... 51 2.2.3. Fate and persistence ................................................................................... 52 2.2.3 Toxicity tests ................................................................................................ 53
2.2.3.1 Giant kelp germination and growth ....................................................... 53 2.2.3.2 Topsmelt survival .................................................................................. 54 2.2.3.3 Mysid survival ....................................................................................... 55 2.2.3.4 Bivalve embryo survival and development ............................................ 55 2.2.3.5 Echinoderm fertilization ........................................................................ 56
2.2.4 Chemical analysis ........................................................................................ 57 2.2.5 Calculations and statistics ........................................................................... 60
2.2.5.1 Partitioning and chemical persistence ................................................... 60 2.2.5.2 Toxicity tests ......................................................................................... 61
2.3 Results and discussion ........................................................................................ 61 2.3.1 Chemical partitioning and persistence ......................................................... 61 2.3.2 Toxicity tests ................................................................................................ 68
2.3.2.1 Giant kelp germination and growth ....................................................... 68 2.3.2.2 Topsmelt survival .................................................................................. 69 2.3.2.3 Mysid survival ....................................................................................... 69 2.3.2.4 Bivalve embryo survival and development ............................................ 70 2.3.2.5 Echinoderm fertilization ........................................................................ 71
2.4 Conclusions ......................................................................................................... 73
Chapter 3. Overall conclusions and future directions ........................................... 74 3.1. Overall Conclusions ............................................................................................ 74 3.2. Future Directions ................................................................................................ 75
References ................................................................................................................... 77
Appendix A. Summary of key properties for test substances ............................ 93
Appendix B. Raw Data: Fate and persistence testing ......................................... 94

viii
Appendix C. Raw Data: Toxicity tests .................................................................. 96
ix
List of Tables
Table 1 : Comparison of the effective versus lethal dose of sea louse treatment substances used in salmon aquaculture (Bright and Dionne, 2005; Roth, 2000). ..................................................................................................... 17
Table 2: Data from emamectin benzoate acute and chronic exposures to marine and freshwater invertebrates and fish species. ....................................... 21
Table 3: Data from hydrogen peroxide acute and chronic exposures to marine and freshwater invertebrates and fish species............................................... 27
Table 4: Data from cypermethrin acute and chronic exposures to fresh water and marine invertebrates and fish species. ................................................... 32
Table 5: Data from deltamethrin acute and chronic exposures to fresh water and marine invertebrates and fish species. ................................................... 37
Table 6: Data from azamethiphos acute and chronic exposures to freshwater and marine invertebrates and fish species. ................................................... 43
Table 7: Summary key information pertaining to the use of formulations in Canada to treat sea lice infestations: AI, recommended treatment dose, or concentration, and recommended duration of treatment. ........................ 50
Table 8: Summary of nominal EB, CP, DM, AZ, and HP test concentrations used in
toxicity tests (g L-1). Range of nominal concentration (Range), number of concentrations used in testing (Number) and the dilution factor (DF) are reported. ................................................................................................ 53
Table 9: Summary of sediment and water characteristics used in partitioning and persistence study. .................................................................................. 62
Table 10: Half-life (and p-values) for AZ, CP, DM, EB, and HP in water and sediment calculated using first-order rate equations. P-value <0.05 indicates relationships between the variables that are statistically significant. ....... 64

x
List of Figures
Figure 1: Visual representation of the major types of aquaculture practiced around the world, both marine and freshwater, including sea ranching, surface lines, subsurface lines, bottom culture, racks, cages, ponds and hatcheries (DFO, 2012). ............................................................................................ 2
Figure 2: Map of open-net pen salmon farms (indicated by yellow dots) and wild salmon migration routes (indicated by red lines) in southwest British Colombia (BC) (Morton, 2015). ................................................................ 6
Figure 3: Life cycle of sea lice, Caligus elongatus. Legend: 1 Nauplius I; 2 Nauplius II; 3 Copepodid; 4 Chalimus I; 5 Chalimus II; 6 Chalimus III; 7 Chalimus IV; 8 Pre-adult; 9 Adult (female); 10 Adult (male) (Haya et al., 2005). .......... 11
Figure 4: Chemical structures of the compounds that have been used to treat sea lice infestations worldwide: A) dichlorvos B) malathion C) trichlorfon D) azamethiphos E) pyrethrum F) cypermethrin G) deltamethrin H) ivermectin I) emamectin benzoate J) doramectin K) hydrogen peroxide L) teflubenzuron and M) diflubenzuron. ...................................................... 15
Figure 5: Chemical structure of emamectin benzoate, where when R=methanol (CH3) it is MAB1b and when R=ethanol (CH2CH3) is it is MAB1a. ......... 18
Figure 6: Chemical structure of hydrogen peroxide. .............................................. 24
Figure 7: Chemical structure of A) cypermethrin and B) deltamethrin. ................... 29
Figure 8: Chemical structure of azamethiphos. ..................................................... 40
Figure 9: Distribution of chemotherapeutants among sediment (grey bars) and water (white bars) at different sampling times presented as a percentage (%) of the total administered dose. A) AZ; B) EB; C) CP; and D) DM. ............... 64
Figure 10: Decay figures for A) AZ; B) CP; C) DM; and D) HP in water shown as concentration (µg L-1 [AZ, CP and DM] and mg L-1 [HP]) versus time. The trend lines represent the decay per standard first-order rate equations. . 67
Figure 11: Decay figure for A) CP; B) EB; and C) DM in sediment shown as
concentration (g 100 g-1 sediment) versus time. The trend lines represent the decay per standard first-order rate equations. .................................. 68

xi
List of Acronyms
Ach acetylcholine
AChE Acetyl-cholinesterase
AI active ingredient
AZ azamethiphos
BC British Colombia
BCF bioconcentration factor
BMP best management practice
CA California
CBSA Canada Border Services Agency
CCME Canadian Council of Ministers of the Environment
CDN Canadian dollars
CEAA Canadian Environmental Assessment Act
CETIS Comprehensive Environmental Toxicity Information System
CFIA Canadian Food Inspection Agency
CO Colorado
CP cypermethrin
d day
DF dilution factor
DFO Department of Fisheries and Oceans
DM deltamethrin
DNA deoxyribonucleic acid
EB emamectin benzoate
EC European Commission
EC50 effect concentration resulting in 50 % effects
ECCC Environment and Climate Change Canada
ED50 effect dose resulting in 50 % effects
EFSA European Food Safety Authority
ERM furunculosis, erenteric redmouth disease
FAO Food and Agriculture Organization of the United Nations
FDA Food and Drugs Act
FHL Norwegian Seafood Federation
g gram
xii
GABA gama-aminobutyric acid
h hour
HC Health Canada
HP hydrogen peroxide
IC50 Inhibiting concentration for a 50 % effect
IMTA integrated multi-trophic aquacutlure
IPN pancreatic necrosis
KOW n-octanol-water partition coefficient
L liter
LC50 lethal concentration resulting in 50 % mortality
LD50 lethal dose resulting in 50 % mortality
LOAEC lowest observed adverse effect concentration
LOAEL lowest observed adverse effect level
min minute
MOA mechanism of action
MSD minimum significant difference
NBDA New Brunswick Department of Agriculture
NOAEC no observed adverse effect concentration
NOAEL no observed adverse effect level
NWPA Navigable Water Protection Act
OECD Organization for Economic Co-operation and Develop-ment
OIE World Organization for Animal Health
ON Ontario
OP organophosphate
PCPA Pest Control Products Act
PMRA Pest Management Regulatory Agency
ROS reactive oxygen species
SAV salmonid alphavirus
SD standard deviation
SCCP Canadian Shellfish Sanitation program
SEPA Scottish Environmental Protection Agency
SFU Simon Fraser University
TOC total organic carbon
TOM total organic matter

xiii
USD U.S. dollars
US EPA U.S. Environmental Protection Agency
UT Utah
V volts
VDD Veterinary Drugs Directorate
WA Washington

1
Chapter 1. Introduction
1.1. Aquaculture
Fisheries and aquaculture play an essential role in ensuring food security
worldwide; additionally, these industries employ a large number of people thereby
contributing to the reduction of poverty (FAO, 2014). The aquaculture industry, which
consists of large-scale aquatic farming, is a growing industry that began in part, as a result
of unsustainable fishing practices and increasing worldwide seafood demand (DFO, 2012;
FAO, 2014; Naylor et al., 2000). However, despite contributing to an increase in the world
fish supplies, aquaculture of carnivorous fish requires the input of large quantity of wild
fish supply for feed which increases the demand on fisheries. Additionally, aquaculture
can negatively affect wild fisheries through habitat modification, food web interactions,
introduction of exotic species, and nutrient pollution (Naylor et al., 2000).
Aquaculture is a broad term that describes a variety of activities involved in farming
aquatic organisms. Aquaculture can be subdivided into two branches: marine aquaculture,
or mariculture, and freshwater aquaculture. Inland aquaculture generally involves
freshwater species whereas marine aquaculture typically occurs in the sea, intertidal, or
in land-based production facilities (FAO, 2014). There are a variety of different aquaculture
systems, each associated with their own list of species for which aquaculture has been
well established; common examples of marine aquaculture include sea ranching, surface
lines, subsurface lines, racks, cages, ponds and hatcheries (Figure 1) (DFO, 2012;
Queensland Government, 2013). Despite the tendency for monoculture, integrated multi-
trophic aquaculture (IMTA), a polyculture which combines aquaculture practices involving
species from different trophic levels, can result in greater production with lower
environmental impacts (Olin et al., 2011; Thierry et al., 2012). Specifically, polyculture
practices result in increased environmental sustainability by taking advantage of natural
processes and interactions between species of different trophic levels (e.g. through
nutrient cycling).

2
Figure 1: Visual representation of the major types of aquaculture practiced around the world, both marine and freshwater, including sea ranching, surface lines, subsurface lines, bottom culture, racks, cages, ponds and hatcheries
Source: Aquaculture in Canada 2012, A Report on Aquaculture Sustainability, Department of Fisheries and Oceans (2012). Used with permission.
Over 600 species are produced in aquaculture worldwide, including a variety of
finfish, molluscs, crustaceans, amphibians and reptiles, aquatic invertebrates, and algae
(FAO, 2014). Global aquaculture production in 2014 was estimated at $160.2 billion (USD)
(FAO, 2016), up from $144.4 billion in 2012 (FAO, 2014). Furthermore, it has been
estimated that over 25 % of fish consumed by humans comes from a farmed source
(Naylor et al., 2000). It is clear that aquaculture plays an important role in the nourishment
of humans worldwide.
1.2. Canadian aquaculture
1.2.1. Overview
Commercial aquaculture, which is present in all Canadian provinces and in the
Yukon territory, is a multi-million-dollar industry in Canada and worldwide (Bright and
Dionne, 2005; Costello, 2009; DFO, 2012; DFO, 2014; Olin et al., 2011; Torrissen et al.,
2013). Aquaculture in Canada can be divided into two major categories: finfish aquaculture
and shellfish aquaculture (DFO, 2017; Olin et al., 2011). Species of finfish cultured in
Canada includes primarily: Atlantic salmon, coho salmon, Chinook salmon, and steelhead

3
(marine); rainbow trout and brook trout (freshwater). Species of shellfish cultured in
Canada includes primarily: blue mussels, oysters, clams, scallops, and geoduck.
Additionally, there are a number of species, both marine and freshwater, for which there
is potential for industry expansion (DFO, 2012; Olin et al., 2011).
Depending on the species, finfish production can involve cage-based methods or
land-based cultures. Cage-based farms are typically large open-net pens that are
anchored in the water. In Canada, cage-based farming is mainly used for salmon farming
(marine) or rainbow trout (freshwater). Land-based cultures, which are used in freshwater
finfish production in locations where there are no other viable options, consist of raceways,
ponds or circular tanks with a continuous water supply (either fresh or recirculated).
Historically, shellfish culture, especially oyster culture, was primarily bottom culture
however more commonly off-bottom cultures are farmed using long lines or raft systems,
again, depending on the species. Bottom culture involves the seeding of intertidal or
subtidal beds whereas off-bottom cultures, such as suspended cultures, uses either long
lines or rafts. Off-bottom culture is generally preferred as it can result in higher yields,
however its viability depends on factors including local conditions and the species being
farmed.
1.2.2. Aquaculture economics
In Canada, where salmon is the primary contributor to aquaculture production, the
annual production value in 2015 was estimated at over $967 million (CDN); this figure
includes a number of other species that are farmed domestically including: trout,
steelhead, clams, oysters, mussels, and scallops (DFO, 2012; 2017). The second most
important species, in terms of production and value, is the blue mussel (Mytilus edulis),
however two species of oyster, the American oyster (Crassostrea virginica) and the Pacific
oyster (Crassistrea gigas) are also important in this regard. For in-land species, the
rainbow trout (Oncorhynchus mykiss) is the most commonly farmed. British Columbia
accounts for the greatest production value in Canada, followed by New Brunswick and
Newfoundland and Labrador (DFO, 2012).

4
1.2.3. Regulation and management
Fisheries and Oceans Canada (DFO) has the lead federal role in managing
fisheries and safeguarding its waters in Canada; it does so by supporting economic
growth, supporting innovation and contributing to sustainability (DFO, 2017b). Key pieces
of legislation guide the work of the department, including: the Oceans Act, the Fisheries
Act, the Health of Animals Act, the Species at Risk Act, the Coastal Fisheries Protection
Act, the Canada Shipping Act, the Fish Inspection Act, the Navigable Water Protection Act
(NWPA) and the Canadian Environmental Assessment Act (CEAA). The most important,
however, is the Fisheries Act which provides DFO with the legislative power to approve
aquaculture applications by focusing on habitat protection and pollution prevention.
Other agencies in the Federal government also play an important role in Canadian
aquaculture and include Health Canada (HC), the Canadian Food Inspection Agency
(CFIA), and the Canada Border Services Agency (CBSA). Within HC, the Pest
Management Regulatory Agency (PMRA) and the Veterinary Drugs Directorate (VDD)
play an important role in pest and animal health management. The CFIA enforces
aquaculture biosecurity (food safety) and works with CBSA to restrict imports when
necessary. Additionally, the CFIA also works with the DFO to implement the North
American Animal Health Program (NAAHP) which align with the World Organisation for
Animal Health (OIE) standards (DFO, 2012). The two of them also administer the
Canadian Shellfish Sanitation program (SCCP) along with Environment and Climate
Change Canada (ECCC). The goals of these programs are to protect wild and farmed
species from infectious diseases.
Regulatory responsibilities are shared among federal, provincial, and territorial
governments, as well as with private industry. These responsibilities can vary from
province to province; some provinces lead aquaculture site leasing and licences, whereas
in other provinces this is federally led (DFO, 2012). In addition to a long list of legislation
and a variety of programs that regulate aquaculture, best management practises (BMPs)
have been developed by industry and federal agencies. An example of the government’s
efforts is Canada’s Sustainable Aquaculture Program which was renewed in 2013. This
demonstrates the government’s commitment to the sustainable development of
aquaculture in Canada. The Aquaculture Development Strategy 2016-2019, a recent

5
publication by the DFO (2012), identifies means by which the development of sustainable
aquaculture in Canada can be encouraged.
1.2.4. Environmental concerns
As previously mentioned, a strong environmental regulatory framework is in place
in Canada. For example, environmental assessments, monitoring, and surveillance play
an important role in Canadian aquaculture (Olin et al., 2011). Despite these efforts, there
are still a variety of environmental concerns with respect to aquaculture, specifically
regarding open-net pen aquaculture, which is prominent. These concerns include: the
potential for disease/virus transmission between captive and wild fish populations,
conflicts with marine mammals, sea lice infestations, water pollution, escape of non-native
fish, displacement of local fishermen, and impacts to tourism (Morton, 2015). These
concerns are similar around the world and the industry is constantly trying to improve its
practices to reduce them (e.g. improved net-pet design, development of vaccines to treat
fish, improved husbandry and BMPs).
In Canada, the concerns about water quality resulting from chemical releases,
pathogen transfer and the potential for release and gene transfer from species to species
from non-native escapees is especially concerning as the density of farms along the coast
lines are very high (DFO, 2016; Morton, 2015). Furthermore, this is aggravated by the
proximity of the farms to similar wild species (i.e. sockeye salmon migratory routes)
(Morton, 2015). Figure 2 provides a visual representation of aquaculture sites on the
Pacific coast of Canada.

6
Figure 2: Map of marine finfish aquaculture facilities in British Columbia (BC).
Source: 2016 Marine finfish aquaculture facilities in BC, Aquaculture maps, Department of Fisheries and Oceans (2016). Used with permission.
The environmental impact of salmon farming has reduced with time; significant
improvements have been made in the reduction of escapees, husbandry practices,
disease control and treatment (Ellis et al., 2016).

7
1.3. Salmon aquaculture
1.3.1. History of salmon aquaculture
Salmon aquaculture began in Norway and Scotland, in the 1960s, and the industry
subsequently expanded as a result of improved technologies, financial incentives, and
support from government agencies (Ellis et al., 2016; FHL, 2011; Naylor et al., 1998b).
Since its inception, the industry has expanded to include Canada, Australia, Chile and the
United Kingdom, among others (Ellis et al., 2016). Globally, Norway is the largest salmon
producing country, followed by Chile, the United Kingdom and Canada (~8 percent) (DFO,
2012; Ellis et al., 2016; Olin et al., 2011). Notably, shrimp and salmon are two of the most
important species in aquaculture, making salmon among the most economically valuable
species produced in aquaculture (Naylor et al., 1998b).
Altantic salmon (Salmo salar), the dominant species produced in aquaculture, are
anadromous, i.e. they live out their early life stages in freshwater before heading out to
sea and ultimately return to freshwater to reproduce. Smoltification is the combined
physiological, morphological and behavioral change that enables salmon to survive in
seawater (Ellis et al., 2016). As a result, the hatchery stage occurs in freshwater and once
smoltification has occurred, the fish can be transferred to the ocean (~ 12 months old to
24 months old) (Ellis et al., 2016; Olin et al., 2011). The grow-out stage occurs primarily
in large floating pens on coastlines and last for anywhere between ~ 18 and 24 months
(Burridge et al., 2008; Burridge et al., 2010; Ellis et al., 2016; Olin et al., 2011). Ultimately,
salmon are then harvested for processing and marketed for human consumption (Olin et
al., 2011).
1.3.2. Salmon aquaculture in Canada
Salmon farming in Canada began in the 1970s with coho (Oncorhynchus kisutch)
and Chinook (Oncorhynchus tshawytscha) salmon, however it quickly shifted to Atlantic
salmon (Salmo salar) since that species can withstand being cultured at greater densities
and grows more rapidly. Atlantic salmon were first farmed successfully in New Brunswick
in 1979 before farming of the species extended to the west coast (Burridge, 2003; Olin et
al., 2011). A small number of coho and Chinook salmon are still farmed today (Olin et al.,
2011).

8
As reflected by production values, the majority of salmon farms are located on the
west coast of Canada (DFO, 2017). On the west coast, salmon are commercially important
due to their significant contributions to the local economy (DFO, 2014a; DFO, 2014; DFO
2017; Manning and Hubley, 2015; Olin et al., 2011). Finfish aquaculture nationwide is
valued at over $877 million (CDN), the majority of which (> 75 %) can be attributed to
salmon aquaculture; in BC alone salmon aquaculture production was valued at over $485
million (CDN) (DFO, 2017). British Columbia, New Brunswick and Nova Scotia are the
three highest salmon producing provinces in Canada (DFO, 2017).
1.3.3. Environmental concerns of salmon aquaculture
Several environmental concerns have emerged as a result of salmon aquaculture
practices. Salmon aquaculture can have negative impacts on non-target organisms,
including native salmon populations, local benthic communities, and zooplankton and
phytoplankton communities (Buschmann et al., 2006; Ellis et al., 2016; Islam and Tanaka,
2004; Naylor et al., 1998; 2000). The negative impacts occur primarily as a result of
nutrient release, pollution resulting from the need to medicate farmed salmon, the effect
of escaped fish on native organisms, and the transfer of disease or pests to native salmon
populations (Bushmann et al., 2006; Ellis et al., 2016; Naylor et al., 1998; 1998b; 2000;
Torrissen et al., 2013). However, there is also some evidence of increased marine bird
numbers in areas where salmon aquaculture is prevalent which has been suggested to
pose additional adverse ecological effects (Buschmann et al., 2006). These concerns are
all amplified by the density of the farms along the coastlines.
Specifically, nutrient release from uneaten food or faecal matter can result in high
water levels of phosphorus and nitrogen (among other compounds) that can cause
harmful algal blooms leading to reduced oxygen concentrations in the water, to dangerous
levels, causing death or other adverse effects to non-target aquatic organisms. Escapees
are problematic because they are typically non-native and may interbreed with local
populations of wild salmon, affecting the gene pool of local populations (Bushmann et al.,
2006; Naylor et al., 1998b). Furthermore, sea lice infestations in farmed salmon generate
concerns about the potential for transfer to wild populations which can potentially lead to
wild population decline (Buschmann et al., 2006; Krkosek et al., 2005; Morton et al., 2011;
Torrissen et al., 2013).

9
Mentioned above, high-density farming often requires the use of a variety of
substances, including: antibiotics, vaccines, or chemotherapeutants which in themselves
may have negative effects on the environment and other local species (Bushmann et al.,
2006; Burridge et al., 2011).
The use of antibiotics in large-scale farming is of concern as it can contribute to
antibiotic resistance. In Canada, antibiotic use is highly regulated and only four products
are available for use in aquaculture (Burridge et al., 2011). Other chemicals used in
salmonid aquaculture include anaesthetics, pesticides, antifoulants and disinfectants
(Burridge et al., 2010; 2011; Burka et al., 1997). The use of these substances is highly
regulated too since their use can potentially result in adverse effects in the environment.
For example, the use of two metals in aquaculture have been shown to contribute to
environmental impacts: copper (Cu) is used as an anti-foulant and zinc (Zn) an additive in
food (Burridge et al., 2011).
Marine ecosystems are complex, consisting of numerous biotic and abiotic
components linked by a series of ecological interdependencies (NRC, 2010). Coast-lines
are particularly high in productivity / rich in biodiversity due to the presence of sunlight.
For example, kelp which is abundant along coast-lines, is known to provide very important
habitat which contributes to higher diversity and productivity (as discussed in Graham et
al. [2007]). Because of the complex web of interactions and ecological interdependencies
in the natural environment it is essential to conserve biodiversity and productivity wherever
reasonably possible. The high-density with which farms are found on coast-lines
contributes to the concerns being raised, as it magnifies other concerns and also results
in a loss of wild habitat (Naylor et al., 2000), often in areas along wild population migratory
routes (see Figure 2) and in areas of high biodiversity and productivity.
Because of the differences in substrates at the various sites in BC, ranging from
black, silty, mud to cobble or rocky, species composition also varies (Winsby et al., 1996).
However, numerous species that have been reported under or in the immediate vicinity of
salmon aquaculture sites in Canada. This includes benthic invertebrates such as starfish,
anemones, and lobsters as well as a variety of species of fish, mammals, zooplankton and
phytoplankton (WInsby et al., 1996). Therefore, salmon farms have the potential to pose
significant ecological concerns.
10
1.3.4. Disease and infection in salmon aquaculture
As with all largescale farming operations, infection, disease and parasite
infestation is often problematic (Burka et al., 1997; Burridge et al., 2010; Ellis et al., 2016;
Haya et al., 2001). In aquaculture, this is primarily the result of high fish densities and poor
water quality. Disease in salmon aquaculture was very problematic in the early 1980s with
Infectious Salmon Anemia (ISA) appearing for the first time in 1984 (FHL, 2011). Other
viral diseases in salmon aquaculture emerged including pancreatic necrosis (IPN), viral
haemorrhagic septicemia, salmonid alphavirus (SAV), and infectious hematopoietic
necrosis (Ellis et al., 2016; Gudding and Van Muiswinkel, 2013; Olin et al., 2011).
Problematic bacterial diseases, such as furunculosis, erenteric redmouth disease (ERM),
and vibiosis also emerged (Ellis et al., 2016). Pests have also been problematic,
particularly sea lice, as infestations have become an increasing area of concern (Ellis et
al., 2016; Olin et al., 2011; Torrissen et al., 2013). In 1994, disease and parasite problems
became a significant issue in Canadian aquaculture (Burridge, 2003).
These diseases and infections can contribute to significant losses in the industry.
As a result, a variety of antibiotics, vaccines, and chemotherapeutants are used to treat
or prevent disease (Burridge et al., 2008; Burridge et al., 2011; Ellis et al., 2016; Gudding
and Van Muiswinkel, 2013). The development and use of these antibiotics, vaccines,
chemotherapeutants, as well as the implementation of improved management techniques
(e.g. fallowing, monitoring) and introduction of new technologies (e.g. automatic feeding
systems, camera surveillance) has resulted in improved production, reduced costs and
increased efficiency (Ellis et al., 2016).
1.4. Sea lice
1.4.1. Sea lice biology
Sea lice are ectoparasite copepods which can cause significant health reduction
in their host, often resulting in death. This occurs directly by hemorrhaging or stress and
indirectly through increased susceptibility to infection and disease (Burridge et al., 2010;
Bright and Dionne, 2005; Costello, 2006; Mustafa et al., 2000; Pahl and Opitz, 1999;
Torrissen et al., 2013). These small crustaceans are natural parasites to wild salmon
populations (DFO, 2014a). Several hundred species of sea lice exist with two genera

11
having been reported to infect salmonids (Caligus and Lepeophtheirus). In Canada, three
species of sea lice have are reported as having infected salmon: Lepeophtheirus salmonis
(with a circumpolar distribution), Caligus elongatus (Atlantic ocean distribution) and
Caligus clemensi (Pacific ocean distribution) (Burridge et al., 2010; Bright and Dionne,
2005; DFO, 2014a; Grant, 2002; Hogans and Trudeau, 1989). A number of other species
have also been reported on farmed salmon including C. rercresseyi, C. teres (in Chile),
and C. orientalis (in Japan) (Costello, 2006).
The life cycle of most sea lice is composed of 10 stages including planktonic
naupliar stages, an infective copepodite stage, and attached stages (Figure 3) (Burridge
and Van Geest, 2014; Costello, 2006; Haya et al., 2005; Hogans and Trudeau, 1989; Roth
et al., 1993; Torrissen et al., 2013). Details of the various life stages are described in the
referenced literature and will not be detailed herein. In general, there are several factors
which influence the fecundity and survival of these year-round parasites. These include
temperature, salinity, abundance of planktonic predators, and host size and density
(Torrissen et al., 2013; Burridge and Van Geest, 2014; Haya et al., 2005; Hogans and
Trudeau, 1989).
Figure 3: Life cycle of sea lice, Caligus elongatus. Legend: 1 Nauplius I; 2 Nauplius II; 3 Copepodid; 4 Chalimus I; 5 Chalimus II; 6 Chalimus III; 7 Chalimus IV; 8 Pre-adult; 9 Adult (female); 10 Adult (male).

12
Source: A review and assessment of environmental risk of chemicals used for the
treatment of sea lice infestations of cultured salmon, Handbook of Environmental
Chemistry, vol. 5. Haya et al. (2005). Used with permission.
1.4.2. Sea lice concerns in aquaculture
Sea lice infestations were first reported in Norway in the early 1970s and have
since been reported essentially everywhere that salmon are commercially farmed (Roth,
1993; Torrisen et al., 2013). Although many of the concerns with sea lice relate to salmonid
species, other marine species can also be infected (Roth et al., 1993; Torrissen et al.,
2013). Concerns regarding direct losses to the aquaculture industry as a result of sea lice
infestations, the potential for sea lice transfer to native salmon populations, and the effect
of chemicals used to treat infestations, have been raised (Burridge and Van Geest, 2014;
Buschmann et al., 2006; Krkosek et al., 2005; Morton et al., 2011; Torrissen et al., 2013).
Additionally, sea lice transfers between farms are also cause for concern (Torrissen et al.,
2013). This issue becomes more serious in areas where the density of aquaculture sites
along coastlines is high. Global monetary losses due to sea lice infestation have been
estimated to be in the tens of millions of dollars (CDN) (DFO, 2014a). In Canada alone,
reported annual costs associated with sea lice infestations are over $15 million (CDN)
(Costello, 2009; Roth, 2000). In addition to the obvious cost of treatments, there are also
costs associated with reduced growth and losses resulting from a lower quality product as
a result of lice-induced skin damage (Mustafa et al., 2000).
Reviews by Costello (2006) and Torrissen et al. (2013) provide good summaries
of the effects on sea lice on both farmed and wild salmon. Sea lice grip their host with
specialized antennae and maxiliped after which they use their mouthparts to nourish
themselves through the removal and ingestion of mucus, skin and tissue. In fish, this
causes epithelium loss, bleeding, increased mucus discharge, altered biochemistry, tissue
necrosis and a loss of microbial protection. Additionally, host fish experience reduced
appetite, reduced growth and increased secondary infection rates. Finally, there is a risk
of bacterial or viral pathogen transfer via host to host transfer. Risk of bacterial or viral
pathogen transfer is magnified by the fact that sea lice can have a number of potential
host species. In the wild, host irritation may cause behaviours in fish that increase the risk
of predation by distraction, altered behaviours (e.g. leaping behaviours which can attract
predators), or energy losses (Costello, 2006).
13
The economics of commercial aquaculture, as well as concerns regarding negative
impacts to wild salmonid populations (i.e. transfer), necessitate the use of
chemotherapeutants, chemicals which are commonly employed to treat sea lice
infestations worldwide (Torrissen et al., 2013; Burridge et al., 2010; Burka et al; 1997;
Burridge and Van Geest 2014; Burridge et al., 2008; Grant, 2002; Haya et al., 2005; Roth
et al., 1993).
1.4.3. Sea lice treatments
In an attempt to minimize losses due to sea lice infestations, fish are often treated
with a wide range of available drugs, antibiotics and pesticides (Burridge et al., 2008;
Burridge et al. 2010; Burridge et al., 2011; Mustafa et al., 2000; Roth et al., 1993; Torrissen
et al., 2013). The use of these chemical controls is one of the major areas of concern with
respect to the environmental impacts of salmon aquaculture, especially in Canada
(Burridge et al., 2011; Burridge and Van Geest, 2014; Bushmann et al., 2006; Torrissen
et al., 2013). Several specific areas of concern include determining the magnitude of
effects to non-target organisms, assessing the potential bioaccumulation of substances
and investigating the cumulative effects resulting from concurrent or consecutive
treatments at adjacent farms (Burridge et al., 2011). These concerns have fueled a
number of research endeavours in Canada (many funded by DFO), many of which are
cited herein (e.g. Burridge et al. (2011), Lyons et al. (2014) and Bright and Dionne (2005)).
Historically, sea lice control has included a number of different treatments, most of
which have been shown to have negative impacts on the environment (Roth et al., 1993).
The first compound reported to be used to treat sea lice infestations on farms in Norway
was formaldehyde, however, its use was short lived due to its low margin of safety (Roth
et al., 1993). Subsequently, a number of compounds have been used, or are currently
used as a treatment (Burka et al., 1997; Burridge and Van Geest, 2014; Burridge et al.,
2008; 2010; 2011; DFO, 2003; 2013; Grant, 2002; Roth et al., 1993; Roth, 2000). Although
the clinically available treatments vary from country to country, 13 compounds have been
used to treat sea lice infestations worldwide: 4 organophosphates (dichlorvos, malathion,
trichlorfon and azamethiphos); 3 pyrethroids (pyrethrum, cypermethrin, and deltamethrin);
3 avermectins (ivermectin, emamectin benzoate and doramectin); hydrogen peroxide; and
2 benzoylphenyl ureas (teflubenzuron and diflubenzuron) (Figure 4) (Haya et al., 2005;
Roth, 2000).

14
Treatment options include topical, treatments applied to feed or treatments that
are administered directly to an organism (Burridge, 2013; Haya et al., 2005). Bath
treatments involve the direct application of the formulation to the cage at a particular
treatment concentration for a designated period of time. However, prior to application, the
depth of the cage is reduced and the cage is surrounded by a tarpaulin or skirt and upon
completion of treatment the tarp is removed and the formulation is left to disperse into the
surrounding water. Alternately, fish can be treated in well-boats, which often results in
reduced chemical release but can result in higher levels of stress in treated fish (Burridge
and Van Geest, 2014). If applied efficiently, the use of medicated feed can have less of
an environmental impact and be less stressful for the fish, however diseased fish may
consume less food thus resulting in insufficient treatment (Burridge et al., 2011; Haya et
al., 2005).

15
A
B
C
D
E
F
G
H
I
J
K
L
M
Figure 4: Chemical structures of the compounds that have been used to treat sea lice infestations worldwide: A) dichlorvos B) malathion C) trichlorfon D) azamethiphos E) pyrethrum F) cypermethrin G) deltamethrin H) ivermectin I) emamectin benzoate J) doramectin K) hydrogen peroxide L) teflubenzuron and M) diflubenzuron.
In addition to chemical use, there are a number different methods to address the
issue of sea lice infestations in salmon aquaculture. These include: monitoring, biological
control, immunostimulation, mechanical de-lousing, vaccination, selective breeding, and
regulatory approaches (MacKinnon, 1995; Torrissen et al., 2013; Webb et al., 2013).
Examples of current and potential biological controls include the use of cleaner fish, filter-

16
feeding shellfish, ciliates, Bacillus thuringiensis, or flatworms (Deady et al., 1995; Chopin
et al., 2012; MacKinnon, 1995; Skiftesvik et al., 2013; Torrinsen et al., 2013; Treasurer,
2002; Webb et al, 2013). Additionally, examples of regulatory approaches might include
ensuring that zones have synchronized production or designating minimum fallowing
periods. Despite the emergence of numerous alternatives and improved management
practices, it should be noted that there is still a heavy reliance on the use of
chemotherapeutants in salmon aquaculture (Burridge et al., 2011).
Depending on the availability of different treatment options, there are also a
number of other factors which may affect treatment choice. These include cost, weather,
resistance, and withdrawal period, among others (Grant, 2002).
1.4.4. Sea lice treatment in Canada
Chemotherapeutants used in salmon aquaculture for sea lice treatment are
classified as being a pesticide or a drug based on the mode of application (Burridge et al.,
20011; Burridge and Van Geest, 2014; Haya et al., 2005). In all cases, the formulations
are applied based on the concentration of the active ingredient (AI). In Canada, all use of
chemotherapeutants to treat sea lice is tightly regulated by Health Canada, whose
mandate is to promote and maintain the health of Canadians (Burridge, 2003; Burridge et
al., 2011; Burridge, 2013; Van Geest et al. 2014b). Drug approval occurs under the Food
and Drugs Act (FDA) by the Veterinary Drugs Directorate (VDD) whereas pesticide
approval occurs under the Pest Control Products Act (PCPA) by the Pest Management
Regulatory Agency (PMRA). In both cases, withdrawal times are applied so as to ensure
safe levels for human consumption. Additionally, an important factor to consider when
selecting any pesticide is the margin of safety of the product in question. As mentioned
previously, DFO has the lead federal role in managing fisheries and safeguarding its
waters in Canada. Unregulated use is not taken lightly; for example, in 2013, a company
pled guilty to the illegal use of a pesticide (AI cypermethrin) in southwestern New
Brunswick, and was fined $500,000 (CDN) (ECCC, 2013).
A number of formulations have been used, or continue to be used in Canada. This
includes the off-label use of ivermectin (Burridge, 2003) and the emergency use of
Calicide® (AI teflubenzuron) (Burridge et al., 2011; Haya et al., 2005). Slice® (AI
emamectin benzoate), Salmosan® (AI azamethiphos), Alphamax® (AI deltamethrin),

17
Excis® (AI cypermethrin), and Interox® Paramove 50 (AI hydrogen peroxide) are other
examples of products that have been used, or continue to be used in Canada, mostly
under emergency approvals (Burridge, 2003; Burridge et al., 2014; PMRA, 2016). Table
1 provides a summary of the margin of safety for each of these substances. Notably, some
substances (e.g. hydrogen peroxide and deltamethrin) have very low margins of safety
whereas others have very high margins of safety (e.g. cypermethrin). More specifics
regarding the use of the latter in Canada will be outlined in the following sections.
Table 1 : Comparison of the effective versus lethal dose of sea louse treatment substances used in salmon aquaculture (Bright and Dionne, 2005; Roth, 2000).
Substance Application Therapeutic Dose
(g L -1)
Toxic Dose to Atlantic Salmon (Salmo salar)
(g L -1)
Margin of Safety
Azamethiphos Topical (bath) 100 > 500 > 5x Hydrogen Peroxide Topical (bath) 1,500,000 1,500,000 –
4,000,000 0 – 3x
Cypermethrin Topical (bath) 5 > 500 > 100x Deltamethrin Topical (bath) 3 3 - > 10 0 – 3.5x
Emamectin Benzoate Oral (feed) 50 g kg-1 for 7 d 360 g kg-1 for 7 d 7x
1.5. Emamectin benzoate
Emamectin benzoate (EB) is a two component mixture consisting of a minimum of
90 % MAB1a and 10 % MAB1b (US EPA, 2009; Bright and Dionne, 2005) (Figure 5). It is
a broad-spectrum pesticide from the avermectin class used to control a wide variety of
pest infestations (Lumaret et al., 2012; Reddy, 2012). In general, EB is not very water-
soluble (Log KOW = 5; solubility = 5,500 g L-1 in seawater), unlikely to volatilize, unlikely
to bioaccumulate due to its large molecular size, and sorbs readily to organic matter (Bright
and Dionne, 2005; Lumaret et al., 2012; Reddy, 2012). Additional information on the
physical and chemical properties of EB, as MAB1a, are summarized in Appendix A.

18
Figure 5: Chemical structure of emamectin benzoate, where when R=methanol (CH3) it is MAB1b and when R=ethanol (CH2CH3) is it is MAB1a.
1.5.1. Canadian usage
Slice® (AI EB), is one of several chemotherapeutants used to treat salmon for sea
lice and the only treatment currently used on the west coast of Canada (Bright and Dionne,
2005; DFO, 2012; Ikonomou, 2011). On the east coast of Canada, and elsewhere, reports
of resistance among sea lice populations to EB has resulted in the use of other, more
effective, pesticides (Aaen et al., 2015; Burridge and Van Geest, 2014). The Slice®
formulation contains 0.2 % EB (Bright and Dionne, 2005) and has been used under an
emergency drug release in Canada since 1999 until getting full approval from the VVD in
2009 (Ikonomou, 2011). The optimal prescribed dose is 50 μg kg-1 day-1 applied to feed
for 7 consecutive days, as confirmed by laboratory studies involving L. salmonis and S.
salar L (Stone et al., 1999).
1.5.2. Chemotherapeutant efficacy
Laboratory and field experiments in Scotland have indicated that Slice® provides
effective treatment against adult, pre-adult and larval stages of L. salmonis and C.
elongatus (Stone et al., 2000b). However, Bravo et al. (2015) also found that the use of a
number of sea lice pesticides, including EB, can result in decreased egg survival among
C. rogercresseyi. Furthermore, a number of field and laboratory studies have investigated
numerous aspects of the drug’s efficacy or safety (e.g. Saksida et al. [2010], Stone et al.
[2000a; 2000b; 2002]). In general, these studies support that the drug is effective at
reducing sea lice burdens on infected populations and at reducing future infestations (for
upwards of 60 days in some cases). However, there have also been numerous reports of
reduced efficacy of the drug worldwide (e.g. Chile [Bravo et al., 2008], Scotland [Lees et
19
al., 2008], and Norway [Espedal et al., 2013]), even on the east coast of Canada (Park,
2013; Saksida et al., 2010). Saksida et al. (2010) noted some of the potential reasons why
resistance has not been observed on the west coast of Canada, including the presence of
large numbers of wild salmon and genetic differences within sea lice species, especially
when compared with the east coast.
1.5.3. Environmental fate of EB
In the vicinity of salmon farms, EB can enter the environment via uneaten food
pellets, through faecal matter and/or urine as either parent EB or its metabolites (Bright
and Dionne, 2005; DFO, 2012). Non-target organisms can be exposed to EB in water, the
sediment, or through ingestion of treated feed or faecal matter. EB has been detected in
sediments up to 1.5 years after treatment within a 150 m radius of farm sites and in the
water column at farm sites several days following treatment (Ikonomou, 2011).
Furthermore, several reports have also confirmed the presence of detectable levels of EB
(and its metabolites) in marine organisms in areas where Slice® is used (SEPA, 1999;
DFO, 2012; Ikonomou, 2011) confirming its bioavailability in marine organisms. Laboratory
tests in blue gill sunfish (Chukwudebe et al., 1996) demonstrated the ability for EB to
bioconcentrate but the authors though it unlikely that the substance would bioaccumulate
to any degree. It is possible to attribute EB’s potential inability to bioaccumulate to its high
molecular weight, the size of the molecule, and its polarity.
1.5.4. EB mechanism of action and effects on non-target species
The precise mechanism of action of EB is not fully understood. In invertebrates,
avermectins are thought to interfere with GABA- and glutamate-gated chloride channel
receptors in nerve and muscle cells to stimulate the influx of chloride ions (Burridge et al.
2010; Lumaret et al., 2012; McKellar & Benchaoui, 1996), resulting in paralysis and death
(Reddy, 2012; Lumaret et al., 2012; McKellar & Benchaoui, 1996). Endocrine disruption,
as a secondary mechanism of action, has also been speculated following molting induction
in lobsters (Waddy et al., 2002). EB is not mutagenic. The toxic effect of the substance is
observed at lower concentrations in invertebrates than in vertebrates, thus resulting in
relative selectivity (McKellar & Benchaoui, 1996). The specific glutamate-gated chloride
channels thought to be the target of avermectins have not been reported in mammals in
high numbers (McKellar & Benchaoui, 1996). A recent review by Lumaret et al. (2012) has

20
summarized the toxicological data in non-target organisms in both terrestrial and aquatic
environments. Additionally, Park (2013) provides a summary of the effects of EB to non-
target marine and freshwater invertebrates and fish species. Table 2 provides a summary
of information available in the literature. One noteworthy observation made by Park (2013)
is that a large portion of the body of literature on this topic is only located in confidential
reports and, as such, is not readily accessible.
In addition to safety testing in salmon, vertebrate toxicity has been investigated in
a number of species and species-specific differences in sensitivity have been observed.
Invertebrate sensitivity varies greatly, with crustaceans being the most sensitive of the
groups tested (Burridge et al., 2004; Lumaret et al., 2012). However, sensitivity among
crustaceans varies as well (Lumaret et al., 2012; Willis and Ling, 2003). For water
exposures, the most sensitive crustaceans appears to be M. bahia (mysid shrimp) with a
reported 96 h LC50 of 0.04 g EB L-1 (Lumaret et al., 2012), with most other values reported
for other species being orders of magnitude greater. Examples include C. crangon (bay
shrimp) with a reported 96 h LC50 of 242 g EB L-1 and C. volutator (mud shrimp) with a
reported 10 d LC50 of 6.32 g EB L-1 (Lumaret et al., 2012). Additionally, 7 d LC50 for H.
americanus (American lobster) of 644 g EB g-1 in feed has been reported. Although the
toxicity to lobsters is higher than many other values reported in the literature, a significant
amount of research has focused on this economically valuable species as EB has been
shown to induce molting (Waddy et al., 2002; 2007). C. virginica (eastern oyster), M.
galloprovincialus (Mediterranean mussel), and C. capitata (polychaete worm), are
examples of species with lower sensitivity to EB as compared to crustaceans (refer to
Table 2) (Lumaret et al., 2012; Park, 2013).
Tests involving micro-algae (Lemna gibba) exposed to 94 g EB L-1 for 14 days
and (Selenastrum capricornutum) exposed to 3.9 g EB L-1 demonstrated no effect
(Lumaret et al., 2012). Additionally, bacteria (V. fischeri) exposed to 5,000 g EB L-1
resulted in no effects on bioluminescence (Hernando et al., 2007). These results
demonstrate that some species have low sensitivity to EB.

21
Table 2: Data from emamectin benzoate acute and chronic exposures to marine and freshwater invertebrates and fish species.
Test Organism Endpoint Effect Measurement Notes Duration Concentration of EB Source
INVERTEBRATES
Homarus americanus
(American lobster) LOEL / NOEL Molting Feed (single dose) Chronic
effects 0.22 / 0.12 g a.i. g-1
lobster
Waddy et al. (2007)
Homarus americanus
(American lobster) EC44* Premature molting Feed (single dose) Molting
effects 1 g a.i. g-1 lobster Waddy et al. (2002)
Homarus americanus
(American lobster) LC50 Mortality Feed;
Juvenile 7 d >589 g g-1 Burridge et al. (2004)
LC50 Mortality Feed; Adult
7 d 644 g g-1
Nephrops
norvegicus (Dublin Bay prawn)
LC50 / NOEC Mortality Sea water 96 h 983 / 814 g L-1 McHenery & Mackie (1999), Schering-Plough Anim. Health (2002) – in Lumaret et al. (2012)
LC50 / NOEC Mortality Sea water 192 h 572 / 440 g L-1 LC50 / NOEC Mortality Feed 96 h > 0.0682 / 0.0682 g L-1 LC50 / NOEC Mortality Feed 192 h > 0.0682 / 0.0682 g L-1
Crangon crangon
(Bay shrimp) LC50 / NOEC Mortality Sea water 96 h 242 / 161 g L-1 McHenery & Mackie (1999), Schering-
Plough Anim. Health (2002) – in Lumaret et al. (2012)
LC50 / NOEC Mortality Sea water 192 h 161 / < 161 g L-1 Crangon crangon
(Bay shrimp) LC50 / NOEC Mortality Feed 96 h >0.0693 / 0.0693 g L-1 LC50 Mortality Feed 192 h >0.0693 / 0.0693 g L-1 LOEC/NOEC Egg production Adult 7 d 0.16 / 0.05 g L-1
Artemia salina
(Brine shrimp) IC50 Immobilization Sea water 6 h 1.73 g L-1 McHenery & Mackie (1999), Schering-
Plough Anim. Health (2002) – in Lumaret et al. (2012)
Mysidopsis bahia
(Mysid shrimp) LC50 / NOEC Mortality Sea water 96 h 0.04 / 0.02 g L-1
McHenery & Mackie (1999), Schering-Plough Anim. Health (2002)– in Lumaret et al. (2012)
Americamysis bahia (Mysid shrimp)
NOEC Growth Sea water 28 d 0.0087 g L-1 Blankinship et al. 2002b – in Park (2013)
Pseudocalanus
elongatus (Copepod) EC50 Immobilization Nauplii (N6) 48 h 0.12 g L-1 Willis & Ling (2003)
EC50 Immobilization Copepodites (C1) 48 / 96 h 0.14 / 0.17 g L-1
EC50 Immobilization Copepodites (C6) 48 / 96 h 0.45 / 10.9 g L-1

22
Test Organism Endpoint Effect Measurement Notes Duration Concentration of EB Source
Temora longicornis
(Copepod) EC50 Immobilization Nauplii (N6) 48 h 0.23 g L-1 Willis & Ling (2003)
EC50 Immobilization Copepodites (C1) 48 h 0.41 gL-1 EC50 Immobilization Copepodites (C6) 48 h 2.8 g L-1
Oithona similis
(Copepod) EC50 Immobilization Nauplii (N6) 48 / 96 h >15.8 g L-1 Willis & Ling (2003)
EC50 Immobilization Copepodites (C1) 48 / 96 h 15.86 / 14.75 g L-1
EC50 Immobilization Copepodites (C6) 48 / 96 h 232 / 113 g L-1
Acartia clausi
(Copepod) EC50 Immobilization Nauplii (N6) 48 / 96 h 0.57 / 0.48 g L-1 Willis & Ling (2003)
EC50 Immobilization Copepodites (C1) 48 / 96 h 0.28 / 0.13 g L-1
EC50 Immobilization Copepodites (C6) 48 / 96 h 0.29 / 5.27 g L-1 Corophium volutator (mud shrimp)
LC50 / NOEC Mortality Sea water 10 d 6.32 / 3.2 g L-1 McHenery & Mackie (1999), Schering-Plough Anim. Health (2002) – in Lumaret et al. (2012)
LC50 / NOEC Mortality Sediment 10 d 193 / 115 g kg-1
Corophium volutator (mud shrimp)
LC50 Mortality Sediment 10 d 153 g kg-1 wet sediment
Mayor et al. (2008)
Daphnia magna
(Water flea) LC50 / NOEC Mortality Sea water 48 h 1.0 / 0.3 g L-1 McHenery & Mackie (1999), Schering-
Plough Anim. Health (2002) – in Lumaret et al. (2012)
EC50 / LOEC Reproduction Sea water 21 d 0.16 / 0.09 g L-1
LC50 Mortality Feed 21 d 0.13 g kg-1
Eohaustorius
estuarius
(Amphipod)
LC50 Mortality Sediment 10 d 185 g kg-1 wet sediment
Kuo et al. (2010)
Monocorophium
insidiosum
(Amphipod)
LC50 Mortality Sediment 10 d 890 g kg-1 Tucca et al. (2014)
LOEC* Biochemical
response
(GST act./TBARS)
Sediment 10 d 100 / 50 g kg-1
Mytilus
galloprovincialus
(Mediterranean
mussel)
EC50 Development Sea water 48 h 314 g L-1 Aufderheide (2002) – in Park (2013)
LC50 Mortality Sea water 48 h > 713 g L-1
Crassostrea
virginica
(Eastern oyster)
EC50 / NOEC
Shell deposition
Sea water 96 h 530 / 260 g L-1 Zelinka et al. (1994a) – in Park (2013)
LC50 / NOEC Mortality Sea water 96 h 665 / 260 g L-1

23
*interpreted from data
Test Organism Endpoint Effect Measurement Notes Duration Concentration of EB Source
Hediste diversicolor
(Rag worm) LC50 Mortality Sediment 10 d 1368 g kg-1 wet
sediment
Mayor et al. (2008)
Capitella capitata
(Polychaete worm) LC50 / NOEC Mortality Sea water 21 d 1,040 / 460 g L-1 McHenery & Mackie (1999), Schering-
Plough Anim. Health (2002) – in Lumaret et al. (2012)
Arenicola marina
(Lugworm) LC50 / NOEC Mortality Sediment 10 d 111 / 56.0 g kg-1 wet
sediment
McHenery & Mackie (1999), Schering-Plough Anim. Health (2002) – in Lumaret et al. (2012)
VERTEBRA TES
Oncorhynchus
mykiss (Rainbow trout) LC50 / NOEC Mortality Fresh water
96 h 174 / 48.7 g L-1 McHenery & Mackie (1999), Schering-
Plough Anim. Health (2002) – in Lumaret et al. (2012)
Lepomis
macrochirus (Bluegill sunfish)
LC50 / NOEC Mortality Fresh water
96 h 180 / 87 g L-1 Chukwudebe et al. (1996) – in Lumaret et
al. (2012)
Salmo salar
(Atlantic Salmon)
LOEC* Mortality Sea water;
Feed 7 d 0.00036 g kg-1 Bright and Dionne (2005)
Salmo salar
(Atlantic Salmon)
NOEC* Behavior, weight,
histology
Sea water;
Feed 7 d 54 g kg-1 Stone et al. (2002)
Salmo salar
(Atlantic Salmon)
LC50 / NOEC Mortality Sea water;
Feed 7 d 356 / 170 g kg-1 McHenery & Mackie (1999) - in Lumaret
et al. (2012) Pimephales promelas
(Fathead minnow) LC50 / NOEC Mortality Fresh water 96 h 194 / 156 g L-1
McHenery & Mackie (1999), Schering-Plough Anim. Health (2002) – in Lumaret et al. (2012) LC50 /
NOEC MATC (Maximum acceptable toxicant concentration)
Fresh water;
Early life stages 96 h 18 /12 g L-1
LOEC Fresh water;
Early life stages 96 h 28 g L-1
Cyprinodon
variegatus
(Sheepshead minnow)
LC50 / NOEC Mortality Fresh water 96 h 1,340 / 860 g L-1 McHenery & Mackie (1999);, Schering-Plough Anim. Health (2002) – in Lumaret et al. (2012)
Cyprinus carpio
(Common carp)
LC50 Mortality Fresh water 96 h 260 – 444 g L-1 Wallace (2001b) in Park (2013)

24
1.6. Hydrogen peroxide
Hydrogen Peroxide (HP) (chemical structure shown in Figure 6) is the simplest
peroxide compound. It is used in a wide variety of commercial and industrial applications
(e.g. disinfectant, detergents, dyes, and as a reactive intermediate), including aquaculture
where it is used as an anti-fungal (Gaikowski et al., 1999) and anti-parasitic treatment
(Burridge and Van Geest, 2014; Montgomery-Brock et al., 2001). Details on relevant
physical and chemical properties of HP can be found in Appendix A.
Figure 6: Chemical structure of hydrogen peroxide.
1.6.1. Canadian usage
Interox® Paramove 50 (AI HP), is one of several chemotherapeutant formulations
used to treat salmon for sea lice worldwide (Burridge, 2013; Burridge and Van Geest,
2014; Grant, 2002; Haya et al., 2005). In May 2016, the PMRA of Canada granted full
registration (sale and use) to Interox® Paramove 50, for the treatment of sea lice
infestations on Atlantic salmon in aquaculture (PMRA, 2016). It can now be applied in
Canada as a bath treatment at 1,500,000 g L-1 for 20-30 min (PMRA, 2014), which is in-
line with the recommended dosage applied elsewhere: 1,200,000-1,800,000 g L-1 for 30
min (Burridge, 2013; Burridge and Van Geest, 2014; Grant, 2002). However, caution with
this treatment is advised as temperature-dependent toxicity has been observed (Bruno
and Raynard, 1994; Gaikowski et al., 1999; Johnson et al., 1993; Kiemer and Black, 1997).
1.6.2. Chemotherapeutant efficacy
Field and laboratory experiments with L. salmonis and C. elongatus suggest that
HP provides effective treatment for adult and potentially pre-adult stages of sea lice
(Treasurer and Grant, 1997). Notably, HP only effectively immobilizes the sea lice and as
such they could potentially attach to new hosts (Bravo et al., 2010), although this has not

25
been observed by all (Treasurer and Grant, 1997). Additionally, Bravo et al. (2015) found
that the use of a number of sea lice pesticides, including HP, can result in decreased egg
survival among C. rogercresseyi, in Chile. Some seasonal variation in effectiveness has
been reported by one Canadian study (Gautam et al., 2016). Furthermore, reduced
efficacy of HP has been observed in Scotland following heavy reliance for sea lice
control/treatment (Treasurer et al., 2000).
1.6.3. HP environmental fate
HP enters the aquatic environment through direct application to salmon
aquaculture farms where it is applied to treat sea lice or to bodies of water to treat algal
blooms. Notably, it is also naturally occurring in the marine environment (Hopwood et al.,
2017; Petasne and Zika, 1997; Yocis et al., 2000; Yuan and Shiller, 2004). In short, it has
a limited half-life in water (PMRA, 2014; Haya, 2005; Bruno and Raynard, 1994) and its
degradation products are water and oxygen (Burridge et al., 2008; Haya, 2005; PMRA,
2014). Furthermore, it has a low log Kow value (~0: highly water soluble) and as such it
does not readily bind to organic matter and is not expected to accumulate in sediment or
to bioaccumulate (PMRA, 2014; US EPA, 2007). As such, HP is not generally considered
an environmental concern.
1.6.4. HP mechanism of action and effects on non-target species
In addition to its natural occurrence in the marine environment, HP is naturally
occurring in biota where it is produced in cells via multiple pathways (Boveris et al., 1972;
Geiszt and Leto, 2004). HP serves several important chemical messenger roles in cells
(Boveris and Cadenas 2000; Rhee et al., 2003; Veal et al., 2007) (e.g. in apoptosis and
necrosis [Saito et al., 2006] and others [Gough and Cotter, 2011]). Numerous reviews
have explored both the natural role of HP in biota (Cabiscol et al., 2000; Geiszt and Leto,
2004; Gouch and Cotter 2011; Liou and Storz 2010) as well as its toxicity (Gouch and
Cotter, 2011; Veal et al., 2007; Valavanidis et al., 2006) in greater detail. The mechanism
of HP toxicity in cells is non-specific and not fully understood. As with other reactive
oxygen species (ROS), high concentrations have been attributed to cell damage (Cabiscol
et al., 2000), cell death (Saito et al., 2006) and carcinogenesis (Liou and Storz, 2010). In
sea lice control, HP is believed to involve paralysis, reduced egg string viability and
reduced ability to reattach following treatment (PMRA, 2014). HP has also been identified

26
as a weak mutagen (Kensese and Smith, 1989). In-vitro investigations provide some
support to the mechanical paralysis MOA with the formation of gas bubbles in the
haemolymph of sea lice treated with HP, immobilizing them and thus causing them to
detach and float to the surface (Burka et al., 1997; Bruno and Raynard, 1994; Grant 2002).
However, a variety of other MOAs have also been proposed, including: peroxidation of
lipid and cellular organelle membranes by hydroxyl radicals, and the inactivation of
enzymes and DNA replication (Burridge, 2013). Relatively few studies have reported
toxicity of HP to marine organisms (PMRA, 2014; Haya 2005); those that have focus
primarily on crustaceans or salmonids due to their economic importance (Burridge, 2013;
Burridge et al., 2014b; Van Geest et al., 2014a; Taylor and Glenn, 2008). Table 3 provides
a summary of toxicity information for HP available in the literature for aquatic invertebrates
and fish species.
HP has been shown to cause gill damage, decreased growth rate and mortality in
salmon (Johnson et al., 1993; Kiemer and Black, 1997) with a low margin of safety for its
use as a pesticide (Roth et al., 1993). One study demonstrated size and species
differences, even reporting LD50 values for juvenile salmonids at concentrations below the
recommended treatment levels (Taylor and Glenn, 2008). Gill damage and decreased
growth rate have been reported in rainbow trout as well, with effects lasting weeks post-
treatment (Carvajal et al., 2000). Additionally, the toxicity of HP to salmonids has been
shown to increase with temperature (Bruno and Raynard, 1994; Gaikowski et al., 1999;
Johnson et al., 1993; Kiemer and Black, 1997).
The results of a risk assessment by PMRA (2014) suggested that the use of HP
as a pesticide in salmon aquaculture poses a negligible risk to the environment, with the
exception of marine algae to which HP is highly toxic (Barroin and Feuillade, 1986).
However, effects have been reported in lobsters, shrimp, oligochaetes, and copepods at
or below treatment levels (Burridge et al., 2014b; Mischke et al., 2001; Van Geest et al.,
2014a), following short-term exposures.

27
Table 3: Data from hydrogen peroxide acute and chronic exposures to marine and freshwater invertebrates and fish species.
Test Organism Endpoint Effect Measurement Notes Duration Concentration of HP Source
INVERTEBRATES
Dero digitata
(Oligochaete Worm) LC50 Mortality Pond water 24 / 48 h 4,360 g L-1 Mischke et al. (2001)
Zooplankton spp.
(Copepods) LC50 Mortality Sea water 1 h + 5 h** 68,000 g L-1 Van Geest et al. (2014)
EC50 Feeding rate Sea water 1 h + 5 h** 2,600 – 10,000 g L-1 Homarus americanus
(American lobster) LC50 Mortality Sea water;
Stage 1 1 h + 95 h**
1,637,000 g L-1 Burridge et al. (2014b)
LC50 Mortality Sea water;
Adult 1 h + 95 h**
>3,750,000 g L-1
C. septemspinosa
(Sand shrimp) LC50 Mortality Sea water 1 h + 95
h** 3,182,000 g L-1 Burridge et al. (2014b)
Praunus flexuosus
Mysis stenolepsis
(Mysid spp.)
LC50 Mortality Sea water 1 h + 95 h**
973,000 g L-1 Burridge et al. (2014b)
VERTEBRATES
Salmo salar
(Atlantic Salmon) LOEC* Mortality Sea water;
Temp.
dependence;
100 % mortality
20 m 52,360 g L-1 HP Bruno and Raynard (1994)
LOEC* Mortality 2 h 13,530 g L-1 HP
Ctenolabrus
rupestris
(Goldskinny wrasse)
NOEC* Mortality Sea water 2 h 13,860 g L-1 HP
Oncorhynchus
kisutch
(Coho Salmon)
LD50 Mortality Fresh water;
1 h + 120 h**
test
96 h 231,000 g L-1 (small)
225,000 g L-1 (large)
Taylor and Glenn (2008)
Oncorhynchus
tshawytscha
(Chinook Salmon)
LD50 Mortality Fresh water;
1 h + 120 h**
test
96 h 200,000 g L-1 (small)
106,000 g L-1 (large)
Oncorhynchus
mykiss
(Rainbow trout)
LD50 Mortality Fresh water;
1 h + 120 h**
test
96 h 373,000 g L-1 (small)
196,000 g L-1 (large)

28
*interpreted from data **time in clean water (following exposure)
Test Organism Endpoint Effect Measurement Notes Duration Concentration of HP Source
Oncorhynchus
mykiss
(Rainbow trout)
LOEC* Growth rate
reduction Fresh water;
Single
concentration
20 m + 5 w**
1,250,000 g L-1 Carvajal et al. (2000)
Salmo salar
(Atlantic Salmon) LOEC* Mortality;
Gill histology Sea water;
Single
concentration;
Temp.
dependence
20 / 40 m 1,500,000 g L-1 Johnson et al. (1993)
Oncorhynchus
tshawytscha
(Chinook Salmon)
LOEC* Mortality;
Gill histology Sea water;
Single
concentration;
Temp.
dependence
20 / 40 m 1,500,000 g L-1 Johnson et al. (1993)
Salmo salar
(Atlantic Salmon) LC100* Mortality Sea water 20 m 2,580,000 g L-1 Kiemer and Black (1997)
NOEC* / LOEC*
Gill damage Sea water 20 m 1,370,000 / 2,520,000
g L-1
INVERTEBRATES
Dero digitata
(Oligochaete Worm) LC50 Mortality Pond water 24 / 48 h 4,360 g L-1 Mischke et al. (2001)
Zooplankton spp.
(Copepods) LC50 Mortality Sea water 1 h + 5 h** 68,000 g L-1 Van Geest et al. (2014)
EC50 Feeding rate Sea water 1 h + 5 h** 2,600 – 10,000 g L-1 Homarus americanus
(American lobster) LC50 Mortality Sea water;
Stage 1 1 h + 95 h**
1,637,000 g L-1 Burridge et al. (2014b)
LC50 Mortality Sea water;
Adult 1 h + 95 h**
>3,750,000 g L-1
C. septemspinosa
(Sand shrimp) LC50 Mortality Sea water 1 h + 95
h** 3,182,000 g L-1 Burridge et al. (2014b)
Praunus flexuosus
Mysis stenolepsis
(Mysid spp.)
LC50 Mortality Sea water 1 h + 95 h**
973,000 g L-1 Burridge et al. (2014b)

29
1.7. Pyrethroids
Pyrethroids, or synthetic pyrethrins, are a class of broad-spectrum pesticides used in a
wide variety of applications (CCME, 1999; Costa et al., 2008; Haya, 1989, PMRA, 2015) due to
their high degradability, low mammalian toxicity and high toxicity to arthropods (Burridge et al.,
2008). The latter makes them an ideal candidate for use as pesticides to treat sea lice. Two
pyrethroids are used as the active ingredient in commercially available sea lice pesticides,
cypermethrin (CP) and deltamethrin (DM), whose chemical structures are presented in Figure 7.
A
B
Figure 7: Chemical structure of A) cypermethrin and B) deltamethrin.
1.7.1 Canadian usage
These two pyrethroids, deltamethrin (DM) and cypermethrin (CP), have been used in
Canada to treat sea lice infestations. AlphaMax® (AI DM) and Excis® (AI CP) are commercially
available sea lice pesticide formulations, both containing 1 % AI (Van Geest et al., 2014).
Recommended treatment with AlphaMax® is for 40 min at 2,000-3,000 g DM L-1 (Burridge and
Van Geest, 2014; Haya et al., 2005) and recommended treatment with Excis® is for 1 hour at
5,000 g CP L-1 (Burridge and Van Geest, 2014; Haya et al., 2005; Grant, 2002). In Canada,
Alphamax® was used under emergency registration in 2009/2010 (Burridge et al., 2014; DFO
2010; NBDA, 2011). Excis®, however, was only used under a research permit in 1995 (Burridge
et al., 2014).
1.7.2 Chemotherapeutant efficacy
Studies have found that CP (Hart et al., 1997; Jiminez et al., 2013) and DM (Bravo et al.,
2014) both provide effective treatment for adult and pre-adult stages of sea lice (family Caliigidae)
but are less effective against the chalimus stages. However, Whyte et al. (2014) did see some
30
inconsistent results in Canadian field and laboratory experiments, where the efficacy of DM
against adult and pre-adult L. salmonis was variable, especially with respect to differences
between males and females. However, Bravo et al. (2015) found that the use of a number of sea
lice pesticides, including DM, can result in decreased egg survival among C. rogercresseyi.
Numerous accounts of reduced efficacy, decreased sensitivity, or failed treatments have been
documented around the world (e.g. Sevatdal and Horsberg [2003]). Examples of countries where
decreased sea lice sensitivity to CP and DM has been confirmed with in vitro bioassays include
include Norway, Ireland and Scotland (Sevatdal et al., 2005), and Chile (Helgesen et al., 2014).
1.7.3 Pyrethroid fate in the environment
Pyrethroids can hydrolyze in water (Burka et al., 1997; Roth et al., 1993) and have
relatively short half-lives in aqueous solution, however, they may persist in sediments (Burridge
and Haya 1997; Haya et al., 2005; Muir et al., 1985). Their tendency to sorb to sediments (with a
log KOW value of ~ 5) (Ernst et al., 2014; Maund et al., 2002; PMRA, 2015) may alter the apparent
toxicity of the chemicals or result in chronic exposure to lower concentrations (Muir et al., 1985;
Clark et al., 1989). They also decompose readily due to their susceptibility to catabolic enzymes
and sunlight (Burridge and Van Geest, 2014; Roth et al., 1993). For example, in laboratory
experiments an average of 70 % loss of DM was observed over 48 h (Van Geest et al., 2014b).
Despite their rapid rate of metabolism (Alonso et al., 2012; Haya 1989; Muir et al., 1985; PMRA,
2015), some evidence of pyrethroid bioaccumulation has been documented (Alonso et al., 2012;
Van Geest et al., 2014d; Van Geest et al., 2014b). Additional details regarding the physical and
chemical properties of CP and DM can be found in Appendix A.
1.7.4 Pyrethroid mechanism of action
The most likely MOA of pyrethroids involves interference with nerve membrane function,
primarily by their interaction with sodium (Na+) channels (Soderlund and Bloomquist, 1989), which
results in depolarization of nerves. The repetitive firing of nerves resulting from Na+ channels
remaining open ultimately leads to paralysis and death (Burka et al., 1997; Crane et al., 2011;
Haya et al., 2005). Other, less likely, MOAs that have been proposed include blocked neuronal
conduction (PMRA, 2015; Sonderlund and Bloomquist, 1989) and GABA- and glutamate-
controlled channel effects (Burka et al., 1997; Soderlund and Bloomquist, 1989). CP and DM are
not mutagenic.

31
Pyrethroids are well known for their toxicity towards arthropods (Burridge et al, 2014; Haya
et al., 2005). Additionally, crustaceans have demonstrated high sensitivity to both CP and DM
(Clark et al., 1989; Haya et al., 2005; Fairchild et al., 2010; etc.). Thus, the majority of research in
this area has focused on their toxicity to economically valuable crustacean species (Burridge et
al., 2000b; Burridge et al., 2000a; Burridge et al., 2014b). Research indicates that DM is more
toxic than CP (Burridge and Van Geest, 2014; Fairchild et al., 2010; Haya, 1989; Tucca et al.,
2014; Van Geest et al., 2014a). Additional information regarding the toxicity of these two
compounds is discussed briefly in the following subsections.
1.7.5 CP effects on non-target species
Knowledge regarding the toxicity of CP to marine species is limited (Burridge et al., 2008).
Several studies have demonstrated toxicity to a variety of non-target marine species following
short-term exposure, including inhibitory effects in marine mussels (Ayad et al., 2011) and
delayed toxicity in copepods (Medina et al., 2004). Importantly, toxicity to marine organisms (e.g.
copepods, lobsters, and amphipods) has been reported at concentrations below the
recommended treatment levels following short-term exposure (e.g. Burridge et al. [2000a],
Medina et al., [2002], Willis and Ling [2004], and Van Geest et al. [2014c]). However, Burridge et
al. (2000b) concluded that a single sea lice treatment is not likely to result in lobster mortality.
A review by Clark et al. (1989) found that crustaceans to have greater sensitivity to CP
than fish and molluscs (Clark et al., 1989). The high sensitivity of benthic crustaceans and
amphipods has also been observed in whole sediment bioassays (Mayor et al., 2008; Tucca et
al., 2014). Additionally, the results of Ernst et al. (2001) demonstrated toxicity to non-target
organisms in laboratory testing using water collected from within a net pen during CP treatment
and in the vicinity of salmon aquaculture sites (up to 5 h post-release). Specifically, although the
results indicated significant short-duration toxicity with samples taken during treatment, longer
exposures resulted in toxicity for samples taken from the vicinity after release and delayed effects
were also observed (i.e. observations following transfer to clean sea water). Overall, the data
indicates that there is a potential for CP to cause adverse effects to non-target species over a
large area following treatment. More information on the toxicity of CP to non-target species is
provided in Table 4.

32
Table 4: Data from cypermethrin acute and chronic exposures to fresh water and marine invertebrates and fish species.
Test Organism Endpoint Effect Measurement Notes Duration Concentration of CP Source
INVERTEBRATES
Palaemonetes pugio
(Grass shrimp)
LC50 Mortality Sea water; Flow through
96 h 0.016 g L-1 Clark et al. (1987)
LC50 Mortality Sediment- static 96 h 175 g kg-1 LC50 Mortality Sediment flow
through 96 h 270 g kg-1
Mysidopsis bahia
(Mysid shrimp)
LC50 Mortality 96 h 0.056 g L-1 Unpublished data - in Clark et al. (1989)
Mysidopsis bahia
(Mysid shrimp)
LC50 Mortality 96 h 0.005 g L-1 Clark et al. (1989)
Panaeus duorarum
(Pink shrimp)
LC50 Mortality 96 h 0.036 g L-1 Clark et al. (1989)
Uca pugilator
(Atlantic sand
fiddler)
LC50 Mortality 96 h 0.2 g L-1 Hill (1985) - in Clark et al. (1989)
Cragnon
septemspinosa
(Sand shrimp)
LC50 Mortality Static toxicity
test
96 h 0.01 g L-1 Mcleese et al. (1980) - in Clark et al. (1989)
Homarus americanus
(American lobster)
LC50 Mortality Static toxicity
test
96 h 0.04 g L-1 Mcleese et al. (1980) - in Clark et al. (1989)
Homarus americanus
(American lobster)
LC50 Mortality Stage 1 48 h 0.18 g L-1 Burridge et al. (2000b)
LC50 Mortality Stage 2 48 h 0.12 g L-1 LC50 Mortality Stage 3 48 h 0.06 g L-1 LC50 Mortality Stage 4 48 h 0.12 g L-1 LC50 Mortality Adult 24 / 48 h 0.14 / 0.081 g L-1
LC50 Mortality Adult 60 m 0.025 g L-1 Homarus americanus
(American lobster)
LC50 Mortality Larvae;
10 or 12 C
5 m -12 h 0.66 – 0.058 g L-1 Pahl and Opitz (1999)
LC50 Mortality Larvae;
10 or 12 C
5 m -12 h 1.69 – 0.365 g L-1
Corophium volutator (mud shrimp)
LC50 Mortality Sediment 10 d 5 g kg-1 wet sediment Mayor et al. (2008)
Acartia tonsa
(Copepod)
LC50 Mortality Adult 96 h 0.142 g L-1 Medina et al. (2002)
LC50 Mortality Naupliar 96 h 0.005 g L-1 Acartia tonsa
(Copepod)
LC50 / LOEC Mortality Eggs 48 h 0.1288 / 0.0893 g L-1 Barata et al. (2002)
LC50 / LOEC Mortality Copepodites 48 h 0.0646 / 0.0222 g L -1

33
Test Organism Endpoint Effect Measurement Notes Duration Concentration of CP Source
Acartia clause
(Copepod)
EC50 Immobility Nauplii 48 h 1.1 g L-1 Willis and Ling (2004)
EC50 Immobility Copepodites 48 h 1.49 g L-1
EC50 Immobility Adult 48 h 2.67 g L-1 Pseudocalanus
elongatus
(Copepod)
EC50 Immobility Nauplii 48 h 1.37 g L-1 Willis and Ling (2004)
EC50 Immobility Copepodites / Adult
48 h > 5 g L-1
Temora longicornis
(Copepod)
EC50 Immobility Nauplii 48 h 0.12 g L-1 Willis and Ling (2004)
EC50 Immobility Copepodites 48 h 0.73 g L-1
EC50 Immobility Adult 48 h 0.74 g L-1 Oithona similis
(Copepod)
EC50 Immobility Nauplii 48 h 0.14 g L-1 Willis and Ling (2004)
EC50 Immobility Copepodites 48 h 0.17 g L-1 EC50 Immobility Adult 48 h 0.24 g L-1
Zooplankton spp.
(Copepod)
EC50 Feeding Rate Formulation 1 h + 5 h** 0.098 – 0.36 g L-1 Van Geest et al. (2014a)
Echinogammarus
finmarchius
(Amphipod)
EC50 Immobility Formulation 1 h + 95 h**
0.189 g L-1
Van Geest et al. (2014c)
LC50 Mortality Formulation 1 h + 95 h**
0.220 g L-1
EC50 Immobility Formulation 24 h + 72 h**
0.020 g L-1
LC50 Mortality Formulation 24 h + 72 h**
0.077 g L-1
LC50 Mortality Formulation; Spiked sediment
10 d 80 g kg-1
Gammarus spp.
(Amphipod)
LC50 Mortality Sea water 96 h 0.36 g L-1 Ernst el al. (2001)
Voltulator
(Amphipod)
LC50 Mortality Spiked sediment 10 d 5 g kg-1 Mayor et al. (2008)
A. virginiana
(Amphipod)
EC50 Sea water 48 h 0.03 g L-1 Ernst el al. (2001)
LC50 Mortality Sea water 48 h 7.42 g L-1
A. virginiana
(Amphipod)
EC50 Sea water 48 h 0.0034 g L-1 Ernst el al. (2001)
LC50 Mortality Sea water 48 h 6.86 g L-1
LC50 Mortality Sea water 48 h + 48 h **
0.012 g L-1

34
Test Organism Endpoint Effect Measurement Notes Duration Concentration of CP Source
Eohaustorius
estuarius
(Amphipod)
EC50 Immobility Field collected
samples of
formulation
48 h 0.007 – 0.08 g L-1 Ernst el al. (2001)
LC50 Mortality 48 h 1-3.6 g L-1
Monocorophium insidiosum (Amphipod)
LC50
Mortality
Spiked sediment
10 d
57 g L-1
Tucca et al. (2014)
Daphnia magna (Water flea)
EC50 48 h 2.1 g L-1 Hill (1985) - in Clark et al. (1987)
Artemia franciscana
(Artemia)
LC50 Mortality Larvae 24 h 4720 g L-1 Sanchez-Fortun and Barahona (2005)
Brachionus plicatilis
(Rotifer)
LC50 Mortality Larvae 24 h 300 g L-1 Sanchez-Fortun and Barahona (2005)
Mytilus
galloprovincialis
(Mediterranean
mussel)
EC50 Valve activity Sea water 0.5 h + 4 h 161 g L-1 Ayad et al. (2011)
Crassostrea
virginica
(Eastern Oyster)
LC50 Mortality Static toxicity
test
96 h 370 g L-1 Hill (1985) - in Clark et al. (1989)
Crassostrea gigas
(Pacific Oyster)
LC50 Mortality Static toxicity
test
96 h > 2300 g L-1 Hill (1985) - in Clark et al. (1989)
L. pictus
(sea urchin)
IC25 Fertilization Sea water 20 m 1330 g L-1 Ernst et al. (2001)
IC50 Fertilization Sea water 20 m 2560 g L-1
P. Commuta
(Polychaete)
LC50 Mortality Sea water 96 h + 96 h **
27.8 g L-1 Ernst et al. (2001)
VERTEBRATES
Salmo salar
(Atlantic salmon)
LC50 Mortality Static toxicity
test
96 h 2.0 g L-1 Mcleese et al. (1980) - in Clark et al. (1989)
Cypinodon
variegatus
(Sheepshead
minnow)
LC50 Mortality Sea water 96 h 1.0 g L-1 Hill (1985) - in Clark et al. (1989)
Salmo gairnerii
(Rainbow trout)
LC50 Mortality 96 h 0.5 – 0.9 g L-1 Hill (1985) - in Clark et al. (1987)
Salmo salar
(Atlantic salmon)
LC50 Mortality Juvenile 96 h 5.8 g L-1 Mcleese et al. (1980) – in Katsuji (1989)

35
*interpreted from data **time in clean water (following exposure)
Test Organism Endpoint Effect Measurement Notes Duration Concentration of CP Source
Salmo gairnerii
(Rainbow trout)
LC50 Mortality Adult 24 h 54.9 g L-1 Mcleese et al. (1980) – in Katsuji (1989)
LC50 Mortality Adult 96 h 0.416 – 0.832 g L-1 Coats and O’Donnell-Jeffery (1979) – in Katsuji (1989)
LC50 Mortality Adult 96 h 2 g L-1 Shires (1983) – in Katsuji (1989)
Oncorhychus mykiss
(Rainbow trout)
NOEC* Immunological
response;
Weight
Flow through;
Fresh water
28 d 0.100 g L-1 Shelley et al. (2009)
G. aculeatus
(Sticklebacks)
LC50 Mortality Sea water 96 h 8.1 g L-1 Ernst et al. (2001)

36
1.7.6 DM effects on non-target species
As with CP, due to the increased sensitivity of crustaceans to DM, many studies have
focused their efforts on that subphylum. Toxicity testing results report acute toxicity at extremely
low concentrations (ng DM L-1 range), much lower than the recommended treatment
concentrations used in salmon aquaculture. For example, acute lethality to lobsters and shrimp
following short-term exposures has been reported 2000 x dilution of the treatment concentration
(Burridge et al., 2014b). Similar accounts of sensitivity in copepods, lobsters, shrimp, and
amphipods following 1-h exposure have also been reported (Ernst et al., 2014; Fairchild et al.,
2010; Van Geest et al., 2014a; Van Geest et al., 2014e). Other studies, which have investigated
the effects to other species, have demonstrated less sensitivity among polychaetes and
amphipods (Van Geest et al., 2014d; Tucca et al., 2014). However, results suggest that DM is
potentially harmful to bacteria (Vibrio fischeri) (Hernando et al., 2007). Table 5 provides a
summary of toxicity information available in the literature for aquatic invertebrates and fish
species. Interestingly, research by Fairchild et al. (2010) tested two different formulations of DM
(Decis® and Alphamax®) and obtained different results providing some support to the idea that
formulations can influence toxicity.

37
Table 5: Data from deltamethrin acute and chronic exposures to fresh water and marine invertebrates and fish species.
Test Organism Endpoint Effect Measurement Notes Duration Concentration of DM Source
INVERTEBRATES
Echinogammarus
finmarchius
(Amphipod)
EC50 Immobilization Formulation 1 h + 95 h**
0.047 g L-1 Van Geest et al. (2014c)
EC50 Immobilization Formulation 1 h + 95 h**
0.070 g L-1
EC50 Immobilization Formulation 24 h + 72 h**
0.0067 g L-1
LC50 Mortality Formulation 24 h + 72 h**
0.0094 g L-1
LC50 Mortality Formulation; Spiked sediment
10 d 0.016 g g-1
Eohaustorius
estuarius
(Amphipod)
LC50 Mortality Formulation 96 h 0.00166 – 0.00799 g L-1
Fairchild et al. (2010)
EC50 Immobility Formulation 96 h < 0.00032 – < 0.0032
g L-1 LC50 Mortality Formulation 1 h + 95
h** 0.0131 g L-1
EC50 Immobility Formulation 1 h + 95 h**
0.00552 g L-1
LC50 Mortality Formulation 48 h + 48 h**
0.00032 g L-1
EC50 Immobility Formulation 48 h + 48 h**
< 0.000032 g L-1
Monocorophium insidiosum (Amphipod)
LC50
Mortality
Sediment
10 d
7,800,000 g kg-1
Tucca et al. (2014)
Cragnon
septemspinosa
(Sand shrimp)
LC50 Mortality Formulation 96 h 0.0274 - 0.0453 g L-1
Fairchild et al. (2010)
LC50 Mortality Formulation 1 h + 95 h**
0.142 g L-1
LC50 Mortality Formulation 14 d 0.0151 - 0.0238 g L-1

38
Test Organism Endpoint Effect Measurement Notes Duration Concentration of DM Source Cragnon
septemspinosa
(Sand shrimp)
IC25 Growth
inhibition
Formulation 14 d 0.0104 - > 0.032 g L-
1
Fairchild et al. (2010)
LC50 Mortality Formulation 48 h + 48 h
0.00032 g L-1
EC50 Immobilization Formulation 48 h + 48 h
< 0.000032 g L-1
Cragnon
septemspinosa
(Sand shrimp)
LC50 Mortality Sea water 24 h 0.027 g L-1 Burridge et al. (2014b)
LC50 Mortality Sea water 1 h + 95 h**
0.142 g L-1
Eohaustorius
estuarius
(Amphipod)
EC50 Death and
immobilization
Field collected
samples of
formulation
(filtered)
48 h 0.64 % of sample taken within net pen
Ernst et al. (2014)
Eohaustorius
estuarius
(Amphipod)
EC50 Death and
immobilization
Field collected
samples of
formulation
(unfiltered)
48 h 0.032 % of sample taken within net pen
Ernst et al. (2014)
Praunus flecuosis
Mysis stenolepsis LC50 Mortality Sea water 24 h 0.0014 g L-1 Burridge et al. (2014b)
LC50 Mortality Sea water 1 h + 95 h**
0.0139 g L-1
Homarus
americanus
(American lobster)
LC50 Mortality Formulation;
Stage 3 96 h 0.00374 – 0.00492 g
L-1
Fairchild et al. (2010)
LC50 Mortality Formulation;
Stage 4 96 h 0.0282 g L-1
LC50 Mortality Formulation;
Stage 3 1 d + 16 d**
0.0365 g L-1
LC50 Mortality Formulation;
Stage 3 16 d 0.00445 g L-1
Homarus
americanus
(American lobster)
LC50 Mortality Stage 1 1 h + 95 h 0.0034 g L-11 Burridge et al. (2014)
LC50 Mortality Adult 1 h +95 h 0.0188 g L-11
LC50 Mortality Stage 1 24 h 0.0008 g L-11
LC50 Mortality Stage 2 24 h 0.0006 g L-1
LC50 Mortality Stage 4 24 h 0.0017 g L-1
LC50 Mortality Adult 24 h 0.015 g L-1
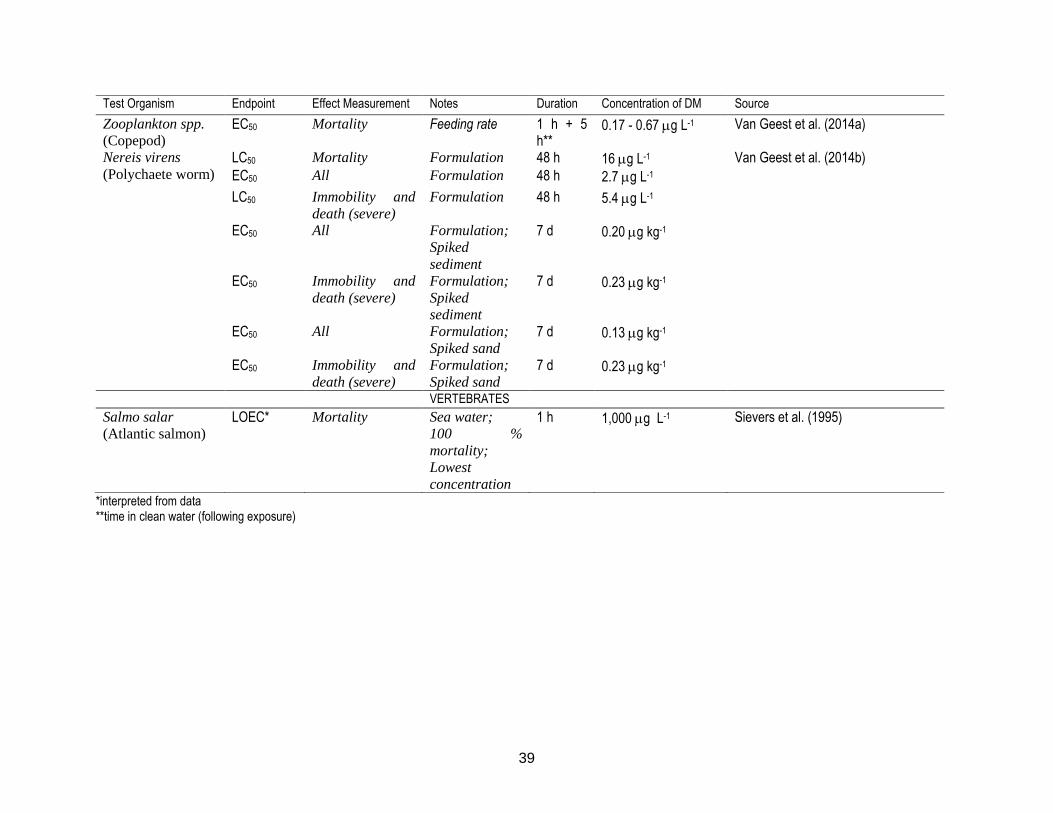
39
*interpreted from data **time in clean water (following exposure)
Test Organism Endpoint Effect Measurement Notes Duration Concentration of DM Source
Zooplankton spp.
(Copepod) EC50 Mortality Feeding rate 1 h + 5
h** 0.17 - 0.67 g L-1 Van Geest et al. (2014a)
Nereis virens
(Polychaete worm) LC50 Mortality Formulation 48 h 16 g L-1 Van Geest et al. (2014b)
EC50 All Formulation 48 h 2.7 g L-1
LC50 Immobility and
death (severe)
Formulation 48 h 5.4 g L-1
EC50 All Formulation;
Spiked
sediment
7 d 0.20 g kg-1
EC50 Immobility and
death (severe)
Formulation;
Spiked
sediment
7 d 0.23 g kg-1
EC50 All Formulation;
Spiked sand 7 d 0.13 g kg-1
EC50 Immobility and
death (severe)
Formulation;
Spiked sand 7 d 0.23 g kg-1
VERTEBRATES
Salmo salar
(Atlantic salmon) LOEC* Mortality Sea water;
100 %
mortality;
Lowest
concentration
1 h 1,000 g L-1 Sievers et al. (1995)

40
1.8. Azamethiphos
Organophosphates (OPs), are broad-spectrum pesticides used in a wide variety of pest
management applications (Costa et al., 2008; Kozawa et al., 2009). Azamethiphos (AZ), shown
in Figure 8, is one of many OP pesticides currently used worldwide to treat sea lice infestations
in salmon aquaculture. In addition to its use in salmon aquaculture, AZ is used as a pesticide to
control against a variety of insects. Some of the physical and chemical properties of AZ are
presented in Appendix A.
Figure 8: Chemical structure of azamethiphos.
1.8.1. Canadian usage
Salmosan® (AI AZ) is 47.5 % AI (Van Geest et al. 2014) and is applied as a bath treatment
at 100 μg AZ L-1 for 30-60 min in well boats and tarps and at 150 μg AZ L-1 in skirt treatments
(Burka et al., 1997; Van Geest et al., 2014; Burridge et al. 1999; Burridge et al., 2010; Grant,
2002; Haya et al., 2001; Haya et al., 2005). Salmosan® was registered for use in Canada until
2002 and it has been used under emergency approval since 2009 (Burridge and Van Geest,
2014). Salmosan® was available in Canada from 1995 to 2002 (Burridge and Van Geest, 2014).
Subsequently, it was given emergency registration for use in New Brunswick in 2009 (Van Geest
et al., 2014).
1.8.2. Chemotherapeutant efficacy
Studies have demonstrated the effectiveness of AZ against adult and pre-adult stages of
Caligidae (Gautam et al., 2016; Roth et al., 1996; Whyte et al, 2016). However, some seasonal
variation in effectiveness was reported in one Canadian study (Gautam et al., 2016). Additionally,
Bravo et al. (2015) found that the use of a number of sea lice pesticides, including AZ, can result
in decreased egg survival among C. rogercresseyi. Numerous reports of decreased sensitivity
have been filed. One study reported decreased sensitivity to AZ in populations of L. salmonis from
Canada and Norway in in vitro assays (Fallang et al., 2004). Roth et al., (1996) found that

41
sensitivity plays a large role in the effectiveness of AZ on Caligidae infestations in Scotland.
Notably, in addition to sensitivity differences among life stages, sensitivity also differed between
populations. Additionally, field trials in Norway by Whyte et al. (2016) demonstrated that the
modality of treatment can influence effectiveness significantly (i.e. wellboat, skirt v. tarpaulin),
however, it should be noted that the treatment concentrations differed based on the modality of
treatment (200 ppb for well boat or tarpaulin and 300 ppb for skirt treatment). The mechanism
behind the resistance to AZ has even been investigated using Norwegian strains of L. salmonis
(Kaur et al., 2015).
1.8.3. AZ environmental fate and persistence
In brief, AZ is water-soluble, non-volatile and has a low octanol-water partitioning
coefficient (log KOW value ~ 1) (Burridge et al., 2005; Burridge, 2013). As such, it is likely to remain
in the aqueous phase (Burridge and Van Geest, 2014): this has been confirmed in field
experiments (Ernst et al., 2014). Furthermore, AZ hydrolyzes in water and is not likely to persist
or bioaccumulate (Burridge and Van Geest, 2014; Burridge et al., 2010).
1.8.4. AZ mechanism of action and effects on non-target species
Due to the widespread use and reported toxicity associated with OP use, there have been
many reviews published on this topic many of which explore the MOA of this group of chemicals
(e.g. Costa et al. [2008], Kozawa et al., [2009], Mileson et al. [1998]). Acetylcholine (Ach) and
acetyl-cholinesterase (AChE), neurotransmitters, play critical roles in neurotransmission in the
cholinergic nervous system (Costa et al., 2008; Mileson et al., 1998). ACh stimulates cholinergic
receptors and AChE hydrolyses ACh to stop the response (Costa et al., 2008; Mileson et al.,
1998). OPs (including AZ) act by inhibiting AChE activity (Abgrall et al., 2000; Burridge and Van
Geest, 2014; Canty et al., 2007; Kozawa et al., 2009; Mileson et al., 1998). When AChE is
inhibited it results in the repetitive firing of nerves (Baillie, 1985), ultimately resulting in a wide
variety of symptoms including tremors, twitching and even death (Costa et al., 2008). AZ has been
shown to be mutagenic in several in vitro tests, but not in vivo (EMEA, 1999).
Overall, there is a lack of information on the toxicity of AZ to non-target organisms (Roth
et al., 1993). As with the other chemicals discussed here, research investigating the effects of AZ
has focused on sensitive non-target crustaceans (e.g. Abgrall et al., [2000], Burridge et al. [1999]).
Table 6 provides a summary of toxicity information available in the literature for aquatic

42
invertebrates and fish species. Notably, Van Geest et al. (2014a) have concluded that the AZ
containing formulation Salmosan® is the least toxic of the bath-applied pesticides.
The extreme sensitivity of lobsters (Homarus gammarus and H. americanus), mysid
shrimp (Mysidopdid bahia), and amphipods (Eohausorius estuarius) to AZ demonstrate the risk
of using this chemical in areas where these species are present. This is especially concerning
because the LC50 values are lower than the recommended treatment concentration (100 g AZ L-
1) for short-term exposures. For example, Burridge et al. (2014b) reported an LC50 value for adult
lobsters (1 h exposure followed by a 95 h observation period) of 24.8 g AZ L-1. Additionally, the
results of Ernst et al. (2001; 2014) demonstrated toxicity (immobility or mortality) to non-target
crustaceans in laboratory testing using water collected from within the net pen during treatment
and in the vicinity of salmon aquaculture sites (up to 20 min post-release). Specifically, although
these results indicate significant short-duration toxicity with samples taken from within the net pen
during treatment, only longer exposures (48 h) resulted in toxicity for samples taken from the
vicinity after release. However, the data indicates that the potential for the use of AZ to treat sea
lice in salmon aquaculture to cause adverse effects to non-target species is low.
Other species, including bivalves, fish, gastropods, and echinoderms are less sensitive to
AZ than crustaceans (Canty et al., 2007; Ernst et al., 2001; Van Geest et al., 2014a).

43
Table 6: Data from azamethiphos acute and chronic exposures to freshwater and marine invertebrates and fish species.
Test Organism Endpoint Effect Measurement Notes Duration Concentration of AZ Source
INVERTEBRATES
Homarus americanus
(American lobster)
LC50 Mortality Sea water;
Stage 1
48 h 3.57 g L-1 Burridge et al. (1999)
LC50 Mortality Sea water;
Stage 2
48 h 1.03 g L-1
LC50 Mortality Sea water;
Stage 3
48 h 2.29 g L-1
LC50 Mortality Sea water;
Stage 4
48 h 2.12 g L-1
LC50 Mortality Sea water;
Adult
48 h 1.39 g L-1
Homarus americanus
(American lobster)
LC50 Mortality
(seasonal)
Sea water;
Adult
48 h 0.61 – 3.24 g L-1 Burridge et al. (2005)
Homarus americanus
(American lobster)
LC50 Mortality Larvae;
10 or 12 C;
5 m - 12 h 33.9 – 1.3 g L-1 Pahl and Opitz (1999)
LC50 Mortality Larvae;
10 or 12 C
5 m - 12 h 50.4 – 0.9 g L-1
Homarus americanus
(American lobster)
LC50 Mortality 3 x 3 exposures;
Adult
48 h 1.08 g L-1 Burridge et al. (2000a)
NOEC Mortality 3 x 3 exposures;
Stage 4
30 m 11 g L-1
NOEC Mortality 3 x 3 exposures;
Adult
30 m 1.03 g L-1
Homarus americanus
(American lobster)
LC100* Mortality Sea water;
Bi-weekly
exposure
1 h 10 g L-1 Burridge et al. (2008b)
Homarus americanus
(American lobster)
LC50 Mortality Sea water;
Stage 1
24 h 8.9 g L-1 Burridge et al. (2014b)
LC50 Mortality Sea water;
Adult
24 h 2.8 g L-1
LC50 Mortality Sea water;
Stage 1
1 h + 95 h**
> 86.5 g L-1
LC50 Mortality Sea water;
Adult
1 h + 95 h**
24.8 g L-1
Homarus americanus
(American lobster)
LOEC Predator
avoidance / shelter
use
Sea water;
Pulse exposure
10 m 100 g L-1 Abgrall et al. (2000)

44
Test Organism Endpoint Effect Measurement Notes Duration Concentration of AZ Source
C. septemspinosa
(Sand shrimp)
LC50 Mortality Sea water;
Adult
24 h 191 g L-1 Burridge et al. (2014b)
LC50 Mortality Sea water;
Adult
1 h + 95 h**
> 85.5 g L-1
C. septemspinosa
(Sand shrimp)
LC50 Mortality Field collected
samples of
formulation
24 h (mean)
19.2 g L-1 Ernst et al. (2014)
Flexuosus Mysis
stenolepsis
(Mysid spp.)
LC50 Mortality Sea water 24 h 12.5 g L-1
Burridge et al. (2014b)
LC50 Mortality Sea water 1 h + 95 h**
> 85.5 g L-1
Mysis stenolepsis
(Mysid spp.)
LC50 Mortality Field collected
samples of
formulation
24 h (mean)
10.5 g L-1 Ernst et al. (2014)
Corophium volutator (mud shrimp)
LC50 Mortality Sediment 10 d 182 g kg-1 wet sediment
Mayor et al. (2008)
Ehaustorius
estuarius
(Amphipod)
EC50 Immobility Field collected
samples of
formulation
48 h 1.4 – 12.1 g L-1 Ernst et al., 2001
Zooplankton spp.
(Copepod)
NOAEL Mortality/Feeding
rate
Sea water 1 h + 5 h** 620 g L-1 Van Geest et al. (2014)
Mytilus edulis
(Marine molusc)
IC50 Gill AChE activity Sea water 1 h 736 g L-1 Canty et al. (2007)
IC50 Heamolymph
AChE activity
Sea water 1 h 1300 g L-1
LOEC* AChE activity;
Cytotoxicity
Sea water 1 / 24 h 100 g L-1
LOEC* Immune function Sea water 24 h 100 g L-1 NOEC* Feeding rate Sea water 1,000,000 g L-1
Voltulator
(Amphipod)
LC50 Mortality Sediment 10 d 182 g kg-1 Mayor et al. (2008)
Gammarus spp.
(Amphipod)
LC50 Mortality Sea water 96 h < 5 g L-1 Ernst el al. (2001)
L. pictus
(sea urchin)
IC25 Fertilization Sea water 20 m 3340 g L-1 Ernst et al. (2001)
IC50 Fertilization Sea water 20 m 6840 g L-1 P. Commuta
(Polychaete)
LC50 Mortality Sea water 96 h + 96 h **
2310 g L-1 Ernst et al. (2001)

45
*interpreted from data **time in clean water (following exposure)
Test Organism Endpoint Effect Measurement Notes Duration Concentration of AZ Source
VERTEBRATES
Salmo salar
(Atlantic Salmon)
LOEC* Mortality Sea water;
5 % mortality;
Lowest
concentration
1 h 1,000 g L-1 Sievers et al. (1995)
G. aculeatus
(Sticklebacks)
LC50 Mortality Sea water 96 h 190 g L-1 Ernst et al. (2001)

46
1.9. Risk of sea lice pesticide use
Several issues of concern have been identified regarding the use of chemotheraputants
in aquaculture (Burka et al., 1997; Bright and Dionne, 2005; Burridge & Van Geest, 2014). The
primary objective of the present work was to address several of the more important data gaps.
Specifically, this research addressed the lack of information on the toxicity of sea lice pesticides
used in salmon aquaculture to non-target marine organisms in the Pacific northwest region of
Canada as well as the lack of knowledge regarding the fate and persistence of these substances
once released to the environment. The results of this research will fill knowledge gaps and reduce
uncertainties for better risk assessments to be performed which will enable better decision making
for regulators and aquaculturists alike.

47
Chapter 2.
Environmental Fate and Effects of Sea Lice Pesticides used in Canadian Salmon Aquaculture
Fauve Strachan1, Frank Gobas2, Victoria Otton2, and Chris Kennedy1
1Department of Biological Sciences, Simon Fraser University, Burnaby, Canada
2Resource and Environmental Management, Simon Fraser University, Burnaby, Canada
Keywords: toxicity; sea lice; aquaculture; pesticide; fate, persistence; partitioning;
chemotherapeutants

48
Abstract
In Canada, five chemotherapeutant formulations, have been used or continue to be used to treat
sea lice infestations in salmon aquaculture. This research generated data on the environmental
partitioning and persistence, as well as acute toxicity of Slice® (AI: emamectin benzoate [EB]),
Salmosan® (AI: azamethiphos [AZ]), Alphamax® (AI: deltamethrin [DM]), Excis® (AI: cypermethrin
[CP]), and Interox® Paramove 50 (AI: hydrogen peroxide [HP]) to representative classes of marine
organisms. EB, CP and DM partitioned mainly to the sediment phase in sediment-water
microcosms; AZ and HP remained mainly in the water phase. The current study reports that the
persistence of chemicals in water was: CP > DM > AZ > HP. In sediment, the following trend was
observed: CP > EB > DM. Toxicity test results indicate a lack of susceptibility trends in any
species, or toxicity trends with any one chemical, however the information is useful for identifying
risks. Some of the values reported for echinoderms (IC25 values), kelp (IC50 values) and topsmelt
(LC50 values) are below the recommended treatment concentration. Together, this information
provides insight into the environmental fate and associated risks of chemotherapeutants to non-
target marine organisms that may be found in the vicinity of salmon aquaculture sites.

49
2.1. Introduction
Commercial aquaculture worldwide is a multi-million-dollar industry (Bright and Dionne,
2005; Costello, 2009; DFO, 2012; DFO, 2014; Olin et al., 2011; Torrissen et al., 2013) and in
Canada, salmon is the primary contributor to aquaculture production ($967 million CDN) (DFO,
2012; 2017). High-density farms use of a variety of regulated chemicals, including antibiotics,
vaccines and chemotherapeutants to maintain healthy stocks in order to reduce financial losses
(Bushmann et al., 2006; Burridge et al., 2011). Chemicals used in salmonid aquaculture include
anaesthetics, pesticides, antifoulants and disinfectants (Burridge et al., 2010; 2011; Burka et al.,
1997). Environmental concerns resulting from salmon aquaculture practices include conflicts with
marine mammals, escapes of non-native fish, displacement of local fishermen, impacts to tourism,
water pollution, and the potential for disease/virus/parasite (e.g. sea lice) transmission between
captive and wild fish populations (Morton, 2015).
Sea lice are ectoparasites that nourish themselves through the ingestion of mucus, skin
and tissue of their hosts (Burridge et al., 2010; Bright and Dionne, 2005; Costello, 2006; Mustafa
et al., 2000; Pahl and Opitz, 1999; Torrissen et al., 2013). Concerns regarding direct losses to the
salmon aquaculture industry as a result of sea lice infestations, the potential for sea lice transfer
to native salmon populations or between farms, and the effect of chemicals used to treat
infestations, have been raised (Burridge and Van Geest, 2014; Buschmann et al., 2006; Krkosek
et al., 2005; Morton et al., 2011; Torrissen et al., 2013). Global monetary losses in salmon
aquaculture due to sea lice infestation have been estimated to be in the tens of millions of dollars
(CDN) (DFO, 2014a). In Canada alone, annual costs associated with sea lice infestations are
estimated at over $15 million (CDN) (Costello, 2009; Roth, 2000). Although many of the concerns
regarding sea lice relate to salmonid species, other marine species can also be infected (Roth et
al., 1993; Torrissen et al., 2013). Sea lice infestations are commonly treated by a variety of
chemotherapeutants (Torrissen et al., 2013; Burridge et al., 2010; Burka et al; 1997; Burridge and
Van Geest 2014; Burridge et al., 2008; Grant, 2002; Haya et al., 2005; Roth et al., 1993) which
results in the entry of these substances into the surrounding marine environment.
A number of compounds have been used, or are currently used to treat sea lice
infestations in salmon aquaculture (Burka et al., 1997; Burridge and Van Geest, 2014; Burridge
et al., 2008; 2010; 2011; DFO, 2003; 2013; Grant, 2002; Roth et al., 1993; Roth, 2000). Clinically
available treatments vary from country to country, but essentially 13 compounds have been used
worldwide and include: dichlorvos, malathion, trichlorfon, azamethiphos [AZ], pyrethrum,

50
cypermethrin [CP], deltamethrin [DM], ivermectin, emamectin benzoate [EB], doramectin,
hydrogen peroxide [HP], teflubenzuron and diflubenzuron (Haya et al., 2005; Roth, 2000). In
Canada, five chemotherapeutant formulations have been used or continue to be used: Slice® (AI:
EB), Salmosan® (AI: AZ), Alphamax® (AI: DM), Excis® (AI: CP), and Interox® Paramove 50 (AI:
HP) (Burridge, 2003; Burridge et al., 2014; PMRA, 2016). With the exception of Slice® (which is
applied to feed), all of these formulations are applied as water bath treatments. In all cases,
formulations are applied based on the concentration of the product AI. A summary of the key
information pertaining to the use of these 5 formulations can be found in Table 7. The AIs used
in these formulations all have broad-spectrum mechanisms of toxic actions, the details of which
are explored in detail elsewhere (e.g. Grant [2002]; Burka et al. [1997]), and therefore pose a
potential risk to non-target organisms in the environment.
Table 7: Summary key information pertaining to the use of formulations in Canada to treat sea lice infestations: AI, recommended treatment dose, or concentration, and recommended duration of treatment.
Formulation Active Ingredient (AI) Dose Duration Source
Slice® Emamectin Benzoate (EB) 50 g kg-1 day-1 7 d Bright and Dionne (2005)
Salmosan® Azamethiphos (AZ) 100 g L-1 30 - 60 mins
Burridge and Van Geest (2014)
Alphamax® Deltamethrin (DM) 2 - 3 g L-1 40 mins Burridge and Van Geest (2014)
Excis® Cypermethrin (CP) 5 g L-1 60 mins Burridge and Van Geest (2014)
Interox®
Paramove 50 Hydrogen Peroxide (HP) 1,200,000 -
1,800,000 g L-1
20 - 30 mins
Burridge and Van Geest (2014); Grant (2002); PMRA (2014)
The toxicity of sea lice chemotherapeutants to non-target organisms has been the subject
of several studies, however, there exists a notable lack of information specific to non-target
species found in the Pacific north west region of Canada, where salmon aquaculture is common
(DFO, 2017), has been identified (Burridge and Van Geest, 2014). The majority of these studies
have focused on crustaceans (e.g. Burridge et al. [2014b], Ernst et al. [2014]). Significantly more
literature exists on the effects of Slice® (EB) on marine organisms compared to the other
chemicals, particularly Interox® Paramove 50 and HP. As well, there is limited information
regarding the fate and persistence of these substances in water-sediment systems as well
(Burridge and Van Geest, 2014; Benskin et al., 2016; Bruno and Raynard, 1994; Ernst et al.,
2001; Lyons et al., 2014; Meyer et al., 2013; Muir et al., 1985) which is essential for estimates of
exposure and risk assessments. Among these available studies, only Muir et al. (1985) and Meyer
et al. (2013) used a multi-phase system; studies that used water-only or sediment-only systems,
provide an incomplete understanding of the fate these substances in the environment. Lacking
51
this data, information on partitioning and environmental persistence is often inferred from
chemical properties or the results of limited field sampling.
The objectives of this study were 1) to generate data on the environmental partitioning
and persistence of these chemotherapeutants in a water-sediment microcosm, and 2) to
determine their acute toxicity to a broad representation of relevant classes of marine organisms
that may be exposed to them near aquaculture operations. The information gained here provides
valuable input to risk determinations for non-target organisms inhabiting in areas which may be
contaminated by these chemicals from salmon aquaculture operation. Additionally, comparisons
of the toxicity, environmental fate and persistence of the chemicals can easily be made between
chemicals and species.
2.2. Materials and methods
2.2.1. Organisms
Macrocystis pyrifera were obtained from A.K. Siewers (Santa Cruz, CA). Atherinops affinis
and Mysidopsis bahia were obtained from Aquatic Biosystems (Fort Collins, CO). Mytilus
galloprovincialis were obtained from Kamilche Seafarms (Shelton, WA). Strongylocentrotus
purpuratus were obtained from Nautilus Environmental (San Diego, CA). All work with animals
was conducted in accordance with Canadian Council of Animal Care (CCAC) guidelines under
permit of the Simon Fraser University Animal Care Committee.
2.2.2. Chemicals
The following chemicals were obtained from Sigma-Aldrich (Oakville, ON): AZ, (> 99 %
pure), CAS: 35575-96-3; CP, (> 98 % pure), CAS: 52315-07-8; DM, (> 99 % pure), CAS: 52918-
63-5; EB, (> 99 % pure), CAS: 155569-91-8; HP, (30 %), CAS: 7722-84-1; acetone, CAS: 67-64-
1; methanol, CAS: 67-56-1; dichloromethane, CAS: 75-09-2; chloroform, CAS: 67-66-3; and
sodium chloride (NaCl), CAS 7647-14-5. Copper chloride dehydrate (CAS: 10125-13-0);
potassium chloride (CAS: 7447-40-7), and prepared buffered formalin solutions (3% and 50%
[CAS: 50-00-0]) were sourced from Fisher Scientific (Ottawa, ON). Formalin was diluted with
deionized water and adjusted with Borax to a pH of 7.5.

52
2.2.3. Fate and persistence
Aerobic sediment and associated water was collected from Maplewood Flats
Conservation Area (North Vancouver, BC) as per OECD 308 (OECD, 2002) for use in determining
the partitioning behavior and persistence of each chemical in simple water-sediment microcosms.
Sediment collection was performed at low tide and included the entire 5 to 10 cm upper layer of
the sediment. Water was collected on the same day from the same site. Sediment and water were
stored in a cold room at 4 C in 20 L plastic buckets with free access to air for no more than 4
weeks before use. Prior to use, sediment was wet-sieved with a 2 mm sieve using excess water
collected from the site. During sampling, temperature, salinity, pH and O2 concentration of the
water were measured. Sediments collected from the site were analyzed post-handling for particle
size distribution, pH, microbial biomass, total organic matter (TOM) and total organic carbon
(TOC). At each sampling time, temperature, pH, O2 concentration, salinity and redox potential
were analyzed. At test initiation and test termination, TOC, microbial biomass (aerobic plate count
and mould plate count methods) and redox potential were also analyzed. Particle size distribution,
microbial biomass, TOM and TOC (water and sediment) in all cases were analyzed by Maxxam
Analytics (Burnaby, BC).
The procedure used to determine the partitioning and persistence of each
chemotherapeutant in the microcosms was a modified OECD 308 (OECD, 2002) methodology. A
single sediment type was used in the current study, consistent with recommendations by Ericson
(2007). Water and sediment were placed into 500 mL wide-mouth amber jars at a ratio of 3:1
(water:sediment) with a sediment depth of 2.5 cm. Prior to study initiation, sediment and water
were acclimated for 1 week in test vessels, at test conditions (10 C, in the dark, free access to
air). The initial nominal concentration of each substance in the water phase were as follows: AZ:
100 g L-1; CP: 200 g L-1; DM: 400 g L-1; EB: 100 g L-1; and HP: 100,00 g L-1. Sampling
occurred at initiation, 0.5, 1, 2, 4, 7, 14, 28, and 98 d for all substances, except HP, for which
sampling occurred at initiation, 1, 3, 6, 12, 24 and 48 h.
At the initiation of incubations, water-sediment systems were spiked with chemicals by
adding 32 L stock solution (for EB, CP and DM) or solvents (for methanol and acetone controls)
or 48.4 L 30 % HP to the water, followed by gentle swirling to avoid disturbing the sediment.
Stock solutions for all experiments were prepared using methanol (EB) and acetone (CP, DM,
and AZ) solvents. All tests included sea water controls, methanol solvent controls and acetone
53
solvent controls (0.01 %; for both). Incubations were performed such that whole units, in duplicate,
were sacrificed at each sampling time for analysis.
At each sampling period, water and sediment were carefully separated, and both were
stored at -20 C until analysis. Due to its high water solubility, HP recovery in sediment was not
considered.
2.2.3 Toxicity tests
Test chemical stock solutions for toxicity tests were prepared as described above. UV-
sterilized seawater was used for all tests. Test concentrations were prepared by serial dilutions
of the stock solution and a summary of the test concentrations used in each of the tests are
presented in Table 8. Concentrations were selected based on the results of range finding
experiments.
Table 8: Summary of nominal EB, CP, DM, AZ, and HP test concentrations used in
toxicity tests (g L-1). Range of nominal concentration (Range), number of concentrations used in testing (Number) and the dilution factor (DF) are reported.
Emamectin Benzoate
Hydrogen Peroxide
Cypermethrin Deltamethrin Azamethiphos
Kelp Range 300 – 5,000 24 – 15,000 10 – 50 0. 008 – 20 20 – 12,500
Number 5 5 5 5 5
DF 0.4 5 0.008 0.00125 0.5
Topsmelt Range 310 – 5,000 9,600 – 377,500 3.1 - 50 1.25 - 20 625 -10,000
Number 5 5 5 5 5
DF 2 2.5 2 2 2
Mysid Range 8 – 5,000 1100 – 90,000 6 –100 3 –50 180 – 3,000
Number 5 5 5 5 5
DF 5 3 2 2 2
Bivalve Range 300 – 5,000 60 – 7,500 3 –50 6 – 100 800 – 12,500
Number 5 7* 5 5 5
DF 2 2 2 2 2
Echinoderm Range 20 – 5,000 150 - 9,600 2 - 50 0. 08 - 20 10 – 12,500
Number 7 7 7 7 7
DF 2.5 2 2.5 2.5 3
*No effects up to 500 g L-1 in preliminary testing.
2.2.3.1 Giant kelp germination and growth
The giant kelp germination and growth test estimates the developmental toxicity to
zoospores and gametophytes of the giant kelp (Macrocystis pyrifera). Tests were performed

54
immediately as per US EPA (1995a) protocol, with some modifications. Sporophylls were rinsed
thoroughly with filtered seawater, blades were desiccated for 1 h and then rinsed with filtered
seawater to stimulate zoospore release and stored between paper towels until needed. Upon re-
submersion in seawater zoospores are released. The 48 h static non-renewal test was run at 15
C with 5 replicates per test concentration in petri dishes with 10 mL of test solution. CuCl2 was
used as a reference toxicant.
At test initiation, zoospores were added to test containers to achieve a concentration of ~
7,500 zoospores mL-1 in each of the randomly arranged test containers. Water quality
(temperature, pH, salinity, O2 concentration) was assessed prior to test initiation and once daily
for the duration of the test. After 48 h, tests were terminated by the addition of 3 % buffered
formalin and spores were counted directly in the vessels using an inverted microscope at 100 x
magnification.
The percent germination success was assessed for the first 100 spores encountered. The
length of the germination tube was determined, using a calibrated micrometer, for the first 10
germinated spores encountered per replicate following the initial 100 spore count (US EPA,
1995a). Germination was deemed successful if the spore was in development as determined by
the presence of a germination tube. Per the protocol (with previously mentioned modifications),
test acceptability was determined based on a mean control germination success of > 70 %, a
mean germination-tube length in the controls of > 9 m (slightly lower than the values
recommended by the protocol [10 m]), a germination-tube growth NOEC > 35 g L-1 for the
reference toxicant (CuCl2), and minimum significant difference (% MSD) < 20 % for the reference
toxicant relative to the control for both endpoints.
2.2.3.2 Topsmelt survival
This test was performed to estimate the acutely lethal toxicity of a chemical to juvenile
topsmelt (Atherinops affinis) in a 96 h static renewal test according to a modified US EPA (1995a)
protocol and recommendations found in US EPA (2002b). The US EPA (1995a) protocol was
shortened to a 96-h test to reflect an anticipated acute exposure to aquaculture chemicals in
practice. The growth endpoint was not assessed because growth changes were not anticipated
following such a short exposure. CuCl2 was used as a reference toxicant. Tests were performed
the day of organism receipt.

55
Topsmelt (9-d old) were randomly distributed into test vessels containing test solutions (5
per test vessel). The test was run at 20 C with 5 replicates in 1 L vessels containing 200 mL of
test solution. At 48 h, an 80 % solution change was performed and excess food and waste was
removed. Two h prior to test initiation and water change, fish were fed Artemia cysts cultured from
premium grade brine shrimp eggs (Brine Shrimp Direct Inc. [Ogden, UT]). Brine shrimp were
cultured using ~5 g of brine shrimp eggs in 500 mL of sea water left to hatch at 25 C overnight
with constant aeration and light in an inverted cone. Prior to use, shrimp were concentrated and
re-suspended in seawater for use in testing. Water quality (temperature, pH, salinity, O2
concentration) and mortality were assessed on each day of the test.
Tests were deemed acceptable if there was > 90 % control survival (US EPA, 1995a).
Mortality was confirmed by checking for movement following a gentle nudge with a glass rod.
2.2.3.3 Mysid survival
This acute lethal toxicity of the chemicals to mysid (Mysidopsis bahia) was examined in a
48-h static renewal test and was performed according to a modified US EPA (2002) protocol and
recommendations found in WS DOE (2008). The US EPA (2002) protocol was shortened to a 48-
h bioassay to reflect that anticipated acute exposure in practice. CuCl2 was used as a reference
toxicant. Tests were run the day of organism receipt.
Mysids (5-d old) were randomly distributed into test vessels containing test solutions (10
per vessel). This test was run at 20 C with 4 replicates for each test concentration (and 8 controls)
in 500 mL vessels containing 200 mL of a test solution. At 24 h, an 80 % solution change was
performed and excess food and waste was removed. Two h prior to test initiation and water
change, mysids were fed Artemia cysts. Water quality (temperature, pH, salinity, O2
concentration) and mortality was assessed on each day of the test.
Tests were deemed acceptable if there was > 90 % control survival (US EPA, 2002).
Mortality was confirmed by checking for movement following a gentle nudge with a glass rod.
2.2.3.4 Bivalve embryo survival and development
To estimate the acute developmental and lethal toxicity of bivalve larvae (Mytilus sp.) a
48-h static renewal test was performed according to US EPA (1995b) protocol with some
modifications. The test was conducted in the absence of sediment, in 30 mL scintillation vials
containing 10 mL of solution per replicate and 0.1 mL of larvae solution (containing 150-300
56
larvae). Because bivalve larvae are typically found in the water column the simplification to the
protocol to use a water only was deemed acceptable. CuCl2 was used as a reference toxicant.
Tests were performed on the day of organism receipt.
Bivalves were rinsed in seawater scrubbed clean of fouling organisms with a sponge and
spatula. Gamete release was induced by heat shock (28 C) and spawning organisms were
placed in individual beakers containing seawater at 15 C for approximately 30 mins. Gametes
were checked for viability and top quality gametes were pooled for testing. The test was run at 15
C with 4 replicates per test concentration (8 for the controls). Eggs were fertilized and once 90
percent cell division was achieved they were added to test vessels (0.1 mL; 1500 - 3000 eggs
mL-1) signifying test initiation. Water quality (temperature, pH, salinity, O2 concentration) was
assessed on each day of the test. Tests were terminated by the addition of 50 % buffered formalin
to each vial for preservation and embryos were counted directly in the vessels using an inverted
microscope under 100 x magnification. Additionally, day 0 counts were obtained by seeding 6
vessels and immediately preserving them.
Embryos were counted and scored as being normal or abnormal and the difference
between starting counts and the sum of the normal and abnormal embryos were assumed dead.
Development was determined based on the shape of the embryo; abnormal embryos were
circular whereas normal embryos were “D-shaped”. Tests were deemed acceptable if 70 % of
all control embryos survived and developed normally, the minimum significant difference for the
reference toxicant relative to the control is < 25 %, and the coefficient of variance for the initial
count vessels was 15 %. (US EPA, 1995b).
2.2.3.5 Echinoderm fertilization
The acute toxicity of chemicals to echinoderm gametes (Strongylocentrotus purpuratus.)
in a 20 min static non-renewal test according to Environment Canada (EC) (2011) protocol was
performed. CuCl2 was used as a reference toxicant. Tests were performed on the day of organism
receipt.
Gamete release was induced by the injection of 0.5 - 1 mL of 0.5 M potassium chloride
(KCl) through the peristomal membrane. All viable male gametes and all viable female gametes
were pooled for testing. The test was run at 15 C with 5 replicates for each test concentration
(and 3 for the controls) in 30 mL scintillation vials containing 10 mL of solution per vessel. Water
quality (temperature, pH, salinity, O2 concentration) was assessed prior to test initiation. Sperm

57
solution (100 L) was introduced to each of the test vessels, 10 min later, egg solution (1 mL,
2000 eggs mL-1) was added and incubated for an additional 10 min. Tests were terminated by the
addition of 50 % buffered formalin to each vial for preservation and fertilization was assessed
using an inverted microscope under 100 x magnification.
The first 100 eggs viewed under a microscope were scored as either fertilized or
unfertilized to and the percentage of fertilized eggs was reported. Successfully fertilized eggs can
be distinguished from unfertilized eggs by their raised fertilization membrane (EC, 2011). Tests
were deemed acceptable if the average success of fertilization in the control organisms is
between 60 - 98 % (EC, 2011).
2.2.4 Chemical analysis
Water samples from toxicity tests (100 mL) were collected in amber jars (100 mL). DM
and CP samples were collected and preserved with dichloromethane (~ 5 % v/v), shaken and
then stored at 4 C until analysis as described in Van Geest et al. (2014a). AZ samples were
collected and preserved with 2 g NaCl and 5 mL chloroform, shaken and then stored at 4 C until
analysis as described in Burridge et al. (1999). EB samples were collected and stored at -20 C
until analysis as described in Park (2013).
Hydrogen Peroxide. HP samples were analyzed, as soon as possible, on the day of
sampling using a Flurometric Hydrogen Peroxide Assay Kit, read at ex = 540/ em = 590 nm
(reporting limit: 0.1 uM, Sigma-Aldrich).
Cypermethrin and Deltamethrin. To assess water extraction efficiencies, samples
(deionized water spiked with 1 to 5 µg L-1 DM or CP), sediments, or water were added to round-
bottom flasks with 10 µL of PCB-155 (0.135 µg mL-1) added as an internal standard. Water was
extracted twice with 60 mL dichloromethane (DCM) using vigorous shaking for 5 min followed by
sonication and shaking at intervals of 5 s for another 5 min. Extracts were combined and allowed
to settle for 2 h and evaporated in a rotory evaporator until the volume was approximately 3 mL.
The remaining extract was transferred to a glass test tube and dried down to completeness under
nitrogen. Sediments were air-dried, and then transferred to a glass centrifuge tube for extraction
with DCM (60 mL) with shaking for 2 h followed by 5 min of alternating sonication and shaking.
The extract was centrifuged at 1,600 x g for 15 min. The supernatant was removed and the
extraction process repeated 2 times further. Supernatants were combined (Maund et al., 2002)

58
and allowed to settle for 2 h and evaporated in a rotory evaporator until the volume was
approximately 3 mL. Extracts were transferred to a glass test tube and dried down to
completeness under nitrogen gas. Water and sediment extracts were reconstituted to 5 mL in
methanol and co-extracted matrix interferences were removed by loading samples onto stacked
graphitized carbon and alumina SPE cartridges. DM or CP were eluted from the SPE cartridge
with DCM (Hladik et al., 2012), dried down to completeness under nitrogen gas. Dried extracted
water or sediment samples were reconstituted with 0.5 mL acetonitrile and placed into
autosampler vial. A Hewlett-Packard 5890 GC equipped with a 63Ni electron-capture detector, a
splitless injection port and a 30 m x 0.25 mm x 2.65 DB-5 column (Agilent Technologies,
Mississauga, ON) was used with the following conditions: an oven temperature program of 80 ºC
for 0.5 min, 20 ºC min-1 to 270 ºC, which was held for 5 min, then 15 ºC min-1 to 290 ºC, which
was held for 5 min. The injection port temperature and detector temperatures were 240 ºC and
310 ºC, respectively, and the carrier gas was helium (1 mL min-1). Argon/methane was used as
the make-up gas. Injections (2 µL) were done manually, using a gas-tight syringe with a Teflon-
tipped plunger. Peaks were integrated using Chemstation (Hewlett Packard, Mississauga, ON)
software. The GC was calibrated with each new sample batch. A number of calibration standards
were run using a minimum of five and up to seven. DM and CP recoveries were determined by
comparing 5 spiked samples with one another. DM or CP were spiked into several water and
sediment matrices at 10 and 100 ng per 1 L of water or 5 g (dry weight) of sediment. The detection
limit for DM and CP in water was 0.05 µg L-1. The detection limit for DM and CP in sediment was
0.10 µg kg-1. Recoveries from water and sediment were 92% and 86%, with between-day
variability of 6.1%.
Azamethiphos. To assess water extraction efficiencies, samples (deionized water spiked
with 10 to 50 µg AZ L-1), sediment, or water to assess extraction efficiencies were extracted with
DCM (Van Geest et al. 2014). Water samples were extracted as follows: 2 g of NaCl was added
to each 100 mL of water (Burridge et al. 1999), followed by the addition of 50 mL DCM and
vigorous shaking for 5 min followed by sonication and shaking at intervals of 5 s for another 5
min. DCM and water phases were separated using centrifugation at 1500 x g. The supernatant
was removed and the extraction process repeated 2 further times with 60 mL DCM. Supernatants
were combined and allowed to settle for 2 h and evaporated in a rotory evaporator until the volume
was approximately 3 mL. Extracts were transferred to a glass test tube and dried down to
completeness under nitrogen gas. Water and sediment extracts were reconstituted to 5 mL in
methanol and co-extracted matrix interferences were removed by loading samples onto stacked

59
graphitized carbon and alumina SPE cartridges. AZ was eluted from the SPE cartridge with DCM,
dried down to completeness under nitrogen gas. The residue taken up in 1 mL of high pressure
liquid chromotography (HPLC) grade acetonitrile into a 2-mL amber sample vial.
This sample was analyzed by HPLC on a Hewlett Packard Model 1050 with an HP Model
1046A programmable fluorescence detector (FLD) and HP 3396 Series II Integrator (Hewlett-
Packard). The analyte is determined by LC using a C18 column, ACN-H2O (32 + 68) mobile
phase, (Pfenning et al. 1999) under the following conditions: Column, Thermo Scientific™
Syncronis™ C18 reversed phase (100 Å, 5 µm, 250 × 3.2 mm id); mobile phase, water:acetonitrile
68:32 at 1.0 ml/min (isocratic); Fluorescence settings at 230 and 345 nm for excitation and
emission, respectively, with a 280 nm cutoff filter; detector temperature: 50 °C; column pressure,
220 bar; injection volume, 100 µL. Calibration was carried out by the analysis of a series of
standard AZ solutions, prepared in seawater or sediment and extracted by the above method.
Calibration standards were prepared weekly from technical AZ (Ciba Geigy Analytical Master
Standard). AZ recovery was determined by comparing 5 spiked samples with one another. AZ
was spiked into several water and sediment matrices at 10 and 100 ng per 1 L of water or 5 g
(dry weight) of sediment. The detection limit for AZ using 1-L water samples is 1.5 µg L-1. The
detection limit for AZ in sediment was 5 µg kg-1. Recoveries from water and sediment were 96%
and 94%, with between-day variability of 4.5%.
Emamectin Benzoate. To assess water extraction efficiencies, samples (deionized water
spiked with 10 to 50 ng L-1 EB), sediment, or water to assess extraction efficiencies were extracted
with DCM. Water samples were extracted as follows: samples were adjusted to pH 4 with
orthophosphoric acid (1% v/v) and extracted with 50 mL DCM by vigorous shaking for 5 min
followed by sonication and shaking at intervals of 5 s for another 5 min. DCM and water phases
were separated using centrifugation 1500 x g and the DCM removed. The supernatant was
removed and the extraction process repeated 2 further times with 60 mL DCM. Supernatants
were combined and allowed to settle for 2 h and evaporated in a rotory evaporator until the volume
was approximately 3 mL. Extracts were transferred to a glass test tube and dried down to
completeness under nitrogen gas. Sediments were air-dried, and then transferred to a glass
centrifuge tube for extraction with DCM (60 ml) with shaking for 2 h followed by 5 min of alternating
sonication and shaking. The extract was centrifuged at 1,600 x g for 15 min. The supernatant
was removed and the extraction process repeated 2 further times. Supernatants were combined
and allowed to settle for 2 h and evaporated in a rotory evaporator until the volume was
approximately 3 mL and transferred to a glass tube. Extracts were eluted through anhydrous

60
sodium sulphate, dried by rotary film evaporation (35 °C). The evaporated residues were reacted
with derivatisation reagents according to the following processes: 200 mL of N-NMIM/acetonitrile
(1:1, v/v) were added to the tube and vortexed briefly, followed by the addition of 300 mL
TFAA/acetonitrile (1: 2, v/v). The reaction mixtures were stored in the dark for at least 0.5 h. The
derivatisation reagents were made fresh every day. To avoid the decrease of fluorescent signal,
the analysis of derivates was completed within 80 h. The derivatisation solutions were dried down
under N2 and and the residue taken up in 1 mL of high pressure liquid chromotography (HPLC)
grade acetonitrile (Fisher Scientific) (1 mL) with ultrasonication (Xie et al. 2011).
This sample was analyzed by HPLC on a Hewlett Packard Model 1050 with an HP Model
1046A programmable fluorescence detector (FLD) and HP 3396 Series II Integrator (Hewlett-
Packard). The analyte was determined by LC according to Xie et al. (2011) under the following
conditions: Column, Waters Xbridge C18 column (250 x 4.6mm i.d., 5 µm) with a guard column
(20 x 4.6 mm i.d., 5 µm); mobile phase, gradient program of mobile phase with acetonitrile (solvent
A), methanol (solvent B) and water (solvent C) carried out at a flow rate of 1.0 ml min-1; gradient
elution program started with acetonitrile/methanol/water (10:80:10, v/v/v) followed by a linear
adjustment for acetonitrile/methanol (20/80, v/v) in 10 min; the last condition was kept constant
for 5 min; Fluorescence settings at 254 and 400 nm for excitation and emission, respectively;
detector temperature: 40 °C; column pressure, 220 bar; injection volume, 20 µL. Calibration was
carried out by the analysis of a series of standard EB solutions, prepared in seawater or sediment
and extracted by the above method. EB recovery was determined by comparing 5 spiked samples
with one another. EB was spiked into several water and sediment matrices at 1 and 50 ng per 1
L of water or 5 g (dry weight) of sediment. The detection limit for EB using 1-L water samples is
4.8 ng L-1. The detection limit for EB in sediment was 7.9 ng kg-1. Recoveries from water and
sediment were 89 and 86%, respectively with between-day variability of 6.7%.
2.2.5 Calculations and statistics
2.2.5.1 Partitioning and chemical persistence
Chemical analysis results from sediment and water in the microcosm experiment at each
sampling time are reported as the quantity recovered, concentration, the percent of the quantity
recovered, and the percent remaining of the applied concentration. The half-lives (t1/2) of the
chemicals were calculated using a standard first-order rate equation (1) (Ericson, 2007; Kwon

61
and Armbrust, 2006; Tariq et al., 2014), applied to the data following the observance of a peak
concentration to ensure more conservative results.
[𝐴] = [𝐴]0𝑒−𝑘𝑡 (1)
Where: [A] : concentration of the substance at time t; [A]0 : concentration of the substance
at time 0; and k : rate of decay.
And, the half-life is estimated as follows:
𝑡12
=ln 2
𝑘 (2)
Half-life values are reported with p-values to assess the fit of the model used in the
analysis. All statistical analyses were done using RStudio (version 1.0.44).
2.2.5.2 Toxicity tests
Calculations and statistical analyses were performed using the Comprehensive
Environmental Toxicity Information System CETIS (version 1.8.7.16, Tidepool Scientific LLC.).
Point estimate techniques were used to calculate endpoints (IC50, LC50, and EC50) and
LOEC/NOEC values were determined using appropriate hypothesis testing techniques per the
test protocols.
2.3 Results and discussion
2.3.1 Chemical partitioning and persistence
The fate and persistence testing was done based on the OECD 308 protocol (OECD,
2002). Modifications to the protocol were made in order to simplify testing, similar to
methodologies reported or recommended in the literature (Benskin et al., 2016; Ericson, 2007;
Lyons et al., 2014), as noted in the methodology section. A summary of the sediment and water
characteristics used in the current study is provided in Table 9. Sediment characteristics vary from
site to site, as confirmed by the results of field sampling in British Columbia (Winsby et al., 1996;
Wright et al., 2004). Notably, a reference site, as used in the current study might differ from
sediment under an aquaculture site in that sediment collected from beneath farms is more likely
to be anoxic, have high levels of sulphides, ammonia or methane or be as high in organic carbon
(Winsby et al., 1996; Wright et al., 2007).

62
Table 9: Summary of sediment and water characteristics used in partitioning and persistence study.
Characteristic (units) Average value
Sediment Moisture (%) 29
pH 7.5
Temperature (ºC) 10
Redox (mV) -20.1
Total organic carbon (TOC) (mg kg-1) 9350
Total organic matter (TOM) (%) 4.1
Microbial Biomass - Aerobic Plate Count (CFU g-1) 10300
Microbial Biomass - Mould Plate Count (CFU g-1) 590
Sand by hydrometer (%) 63
Silt by hydrometer (%) 32
Clay content (%) 5
Water pH 7.6
Redox (mV) -29.3
02 (mg L-1) 6.7
Salinity 23.5
Total organic carbon (TOC) (mg L-1) 5.2
The partitioning of the chemicals with time in sediment and water media are presented in
Figure 9. In short, substances with lower partition coefficients (log KOW) and higher solubility in
water (i.e AZ with a log KOW value of 1.05 and water solubility of 1,100,000 g L-1 [Burridge et al.,
2005; Burridge and Van Geest, 2014] and HP with a log KOW value of <0 and high affinity for water
[Lyons et al., 2014]) showed greater tendency to be recovered from the water phase, whereas,
more hydrophobic substances with higher partitioning coefficients showed greater tendency to be
recovered from the sediment phase (i.e. CP with a KOW value of 5.9 and water solubility of 10 -
200 g L-1 [Clark et al., 1987], DM with a log KOW value of 4.6 and water solubility of < 5 g L-1
[EC, 2002] , and EB with a log KOW value of 5 and water solubility of 5,500 g L-1 in seawater
[Lumaret et al., 2012]). Additionally, the results obtained in the current study are consistent with
the results of field sampling where sampling from aquaculture sites using EB-based treatments
(Ikonomou, 2011) and pyrethroids-based treatments (Benskin et al., 2016; Lao et al., 2012; Muir
et al., 1985; Weston et al., 2004; 2011) have detected these compounds in sediments; the
presence of AZ has been detected in water samples collected from the vicinity of aquaculture
sites following treatment with this chemical as well (Ernst et al., 2001).
AZ, which is generally believed to remain mostly in the aqueous phase (Burridge, 2013),
was almost undetectable in the sediment throughout the experiment (0.1 - 0.4 % of the applied
dose) and was almost undetectable in water by the end of the experiment (0.1 % of the applied

63
dose remained at 98 d). The partitioning of pyrethroids to sediment has been reported by others
(Muir et al., 1985; Palmquist et al., 2012). In the current study, 49 % of the applied DM dose had
partitioned into the sediment after 24 h and by test termination almost all that remained of the
substance had partitioned to the sediment (92 %). Similarly, at termination only 3 % of the applied
dose of CP remained in water, with 49 % of the applied dose remaining in sediment. Surprisingly
however, partitioning of CP into the sediment phase was slower than anticipated (slower than the
partitioning of DM). Given their similar chemical properties, more similar results would have been
expected. Finally, for EB, which has a tendency to sorb into particulate matter (Bright and Dionne,
2005; Lumaret et al., 2012; Reddy, 2012), 89 % of the applied dose had partitioned into the
sediment within the first 24 h and by the 48 h sampling time, it was undetectable in water.
Partitioning can be influenced by a number of factors, the primary influences being the
characteristics of the sediment, water and the substance itself (Zhou et al., 1995); it is therefore
difficult to compare the results of the present research to other studies without consideration of
these factors. However, given that the current study was done using the same conditions for all
of the chemicals tested the results provide an opportunity to compare the results.
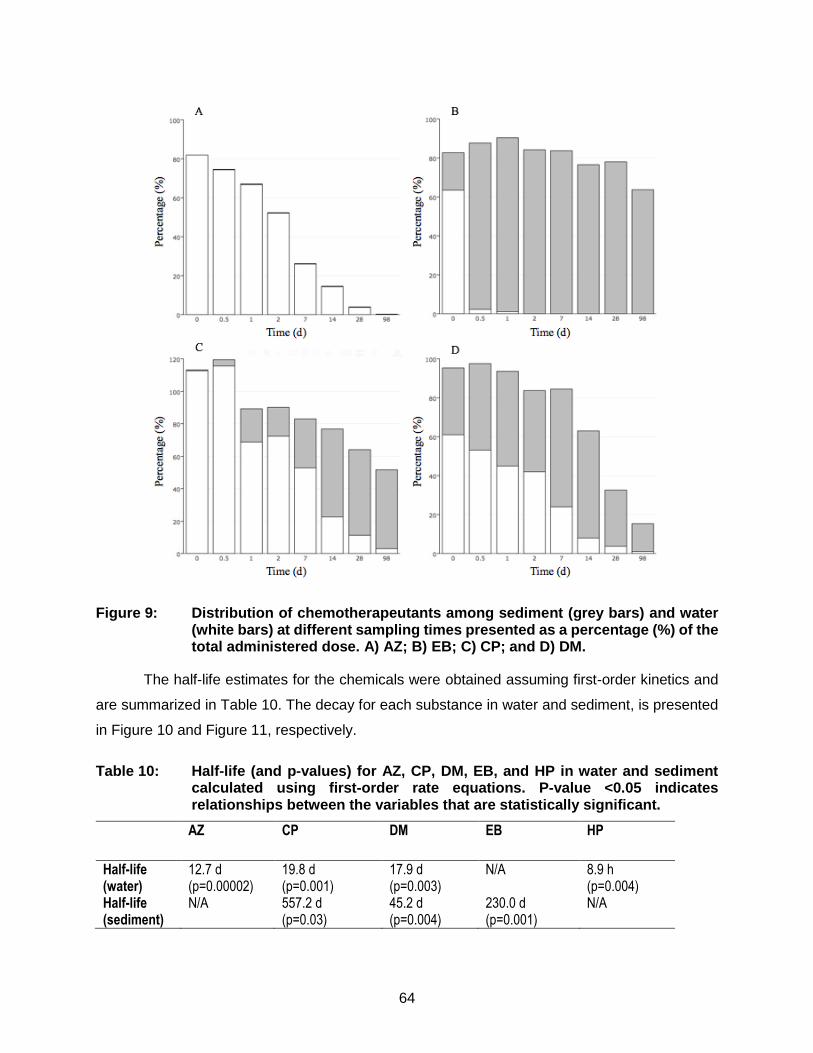
64
Figure 9: Distribution of chemotherapeutants among sediment (grey bars) and water (white bars) at different sampling times presented as a percentage (%) of the total administered dose. A) AZ; B) EB; C) CP; and D) DM.
The half-life estimates for the chemicals were obtained assuming first-order kinetics and
are summarized in Table 10. The decay for each substance in water and sediment, is presented
in Figure 10 and Figure 11, respectively.
Table 10: Half-life (and p-values) for AZ, CP, DM, EB, and HP in water and sediment calculated using first-order rate equations. P-value <0.05 indicates relationships between the variables that are statistically significant.
AZ CP DM EB HP
Half-life (water)
12.7 d (p=0.00002)
19.8 d (p=0.001)
17.9 d (p=0.003)
N/A 8.9 h (p=0.004)
Half-life (sediment)
N/A 557.2 d (p=0.03)
45.2 d (p=0.004)
230.0 d (p=0.001)
N/A

65
In the current study HP was the least persistent of all the chemicals tested. An estimated
half-life of 8.9 h was obtained which is similar to half-life values reported elsewhere (1.3 - 5.3 h in
aerobic biotic conditions [US EPA, 2007]). However, depending on the test conditions, reported
half-lives vary and include values on the order of days in seawater (between 1 and 28 d) (Bruno
and Raynard, 1994; Lyons et al., 2014; Pentasne and Zika, 1997; US EPA, 2007). HP
decomposition increases with increasing pH (US EPA, 2007), is susceptible to photolysis (US
EPA, 2007), and shows temperature dependent decay (Bruno and Raynard, 1994; Lyons et al.,
2017) and therefore variability among reported results is not unexpected. Persistence in sediment
was not estimated as a result of low partitioning to that media. Rapid decomposition via biological
and chemical pathways provide explanation for the short half-life of HP in water reported in the
current study (PMRA, 2014). Photolysis is another major decomposition pathway for HP,
however, the current study as performed in the absence of light thus making the results more
conservative.
AZ was the next least persistent substance with an estimated half-life of 12.7 d in water,
which is similar to the value of 8.9 d in seawater reported by Burridge (2013). Persistence in
sediment was not estimated as a result of low partitioning to that media. AZ’s physical/chemical
properties (i.e. octanol-water partitioning coefficient) and susceptibility to hydrolysis in water
provide explanation for the results reported in the current study (Burridge and Van Geest, 2014;
Burridge et al., 2010).
DM was found to have a half-life of 17.9 d in water and 45.2 d in sediment, values that are
similar to reported values (e.g. 11.7 - 44.6 d in sediment for aerobic water-sediment systems
[Meyer et al., 2013]). Others have reported half-lives as short as 2 - 4 h in small artificial outdoor
ponds (Muir et al., 1985).
The calculated half-life of CP in water (19.8 d) is much shorter than the half-life in sediment
(557.3 d). This is consistent with reports of CP having a shorter half-life in water than in sediment
where it is more persistent (Burridge and Haya 1997; Haya et al., 2005; Muir et al., 1985).
However, the result obtained in the current study is much longer than the values reported by
Meyer et al. (2013) (half-life in sediment of 3 - 14.1 d in aerobic water-sediment systems). Again,
a number of factors, including temperature, moisture content, soil type, dissolved organic matter
(DOM), and presence of microorganisms and metals, among others have been shown to affect
the half-life of CP in sediment and soil (Ismail et al., 2012; Palquist et al., 2012; Rafique and Tariq,
2015; Remucal, 2014).

66
Pyrethroids have a tendency to sorb to sediments (Ernst et al., 2014; Maund et al., 2002;
PMRA, 2015) where they are more persistent (Burridge and Haya 1997; Haya et al., 2005; Muir
et al., 1985) than in water where they tend to hydrolyze (Burka et al., 1997; Roth et al., 1993).
They also decompose readily due to their susceptibility to catabolic enzymes and sunlight
(Burridge and Van Geest, 2014; Roth et al., 1993), and therefore, the results presented in the
current study are conservative.
The slow disappearance of EB in sediment resulted in an estimated half-life of 230 d which
is similar to values reported by others (193.4 – 250 d) in aerobic soil [Burridge et al., 2010; SEPA
1999; SEPA 2004; US EPA, 2009]), however others have reported values as short as 63 - 71 d
in aerobic soils in the dark (EFSA, 2012). Photodegradation is a known decomposition pathway
for EB (Tariq et al., 2014) and therefore studies performed in the presence of light may have half-
lives shorter than similar experiments performed in the dark. As previously noted, there are also
a number of other factors which can contribute to the stability of the AI and result in differences
between studies. A half-life was not estimated in the water phase due to low partitioning in that
media. These results can be explained by EB’s low water solubility (Bright and Dionne, 2005;
Lumaret et al., 2012; Reddy, 2012).
Additives in formulations are thought to influence the properties of an AI (e.g. solubility,
toxicity, fate, persistence, etc.). The following half-lives of the AIs in formulation have been
reported in the literature: Salmosan® (AI: AZ), 9 - 50 d (Mayor et al., 2008); Excis® (AI:CP), 35 -
80 d (Mayor et al., 2008); Alphamax® (AI:DM), 285 d (Benskin et al., 2016); Paramove® 50 (AI:
HP), 8 - 19 d (Lyons et al., 2014); and Slice® (AI: EB), 164 - 175 d (Mayor et al., 2008) and > 400
d (Benskin et al., 2016). Consistent with general belief that AIs in formulation are more stable than
the chemicals alone (Burridge, 2013; Lyons et al., 2014; Mayor et al., 2008; Meyer et al., 2013;
US EPA, 2007), the majority of the half-lives reported herein are shorter than most of those
reported in the literature for the AIs in formulation. Notably however, one study reported no
statistical differences between the half-life of EB in Slice® and EB alone or DM in Alphamax® and
DM alone (Benskin et al., 2016).
Overall, the persistence of chemicals from greatest to least in water was: CP > DM > AZ
> HP. In sediment, the following trend was observed: CP > EB > DM. As with partitioning, a
number of factors influence the breakdown of a substance, primarily the physical/chemical
properties of the substance itself and the environment. Examples include temperature (Lyons et
al., 2014), the presence of biotic communities (Lyons et al., 2014), organic content (OECD, 2002)

67
and UV exposure (Tariq et al., 2014), among others. Because the current study was done using
the same conditions for all of the chemicals tested the results provide a unique opportunity to
compare the results more directly.
Figure 10: Decay figures for A) AZ; B) CP; C) DM; and D) HP in water shown as concentration (µg L-1 [AZ, CP and DM] and mg L-1 [HP]) versus time. The trend lines represent the decay per standard first-order rate equations.

68
Figure 11: Decay figure for A) CP; B) EB; and C) DM in sediment shown as
concentration (g 100 g-1 sediment) versus time. The trend lines represent the decay per standard first-order rate equations.
2.3.2 Toxicity tests
2.3.2.1 Giant kelp germination and growth
The results of the giant kelp germination and growth test are presented in Table 10. NOEL,
LOEL and IC50 values (with 95 % CI) are presented for the growth endpoint; and NOEL, LOEL
and EC50 values (with 95 % CI) are presented for the germination endpoint. In the current study
only HP demonstrated any measureable toxicity to kelp. HP has been considered for use as a
treatment to control harmful algal blooms (Barroin and Feuillade, 1986; Burson et al., 2014) and
is known for its toxicity to algae (PMRA, 2014). Toxicity in the current study was observed at
concentrations that are much lower than the recommended treatment concentration of 1,200,000-
1,800,000 g L-1 (EC50 4,500 g L-1 and IC50 3,700 g L-1) demonstrating potential risk for kelp in
69
the vicinity of salmon aquaculture sites using HP to treat sea lice infestations, a fact consistent
with suggestions by others in the past (Barroin and Feuillade, 1986). For the other 4 chemicals at
the concentrations tested no negative impacts on kelp germination and growth were seen. Several
researchers have suggested that, in general, pesticides may either have negative effects on spore
germination in algae (e.g. organophosphates [Agrawal, 2009]) however some have reported
growth stimulation in phytoplankton (e.g. ivermectin [Garric et al., 2007] and CP [Wang et al.,
2010]).
The results of the current study, and of others, suggests that when used to treat sea lice
infestations, HP may result in toxicity to algal species in the vicinity. Toxicity to macroalgal species
should be avoided as they often provide valuable coastal habitats for a multitude of organisms
(XXX). The use of HP may however help control harmful algal blooms that may occur under farms.
2.3.2.2 Topsmelt survival
The results of the topsmelt survival test are presented in Table 10. NOEL, LOEL and LC50
values (with 95 % CI) are presented for the survival endpoint. For the control treatment group,
survival was 90 %. The results of the current study suggest that topsmelt are sensitive to the
chemicals tested in the current study with the greatest sensitivity being to CP followed by DM >
EB > AZ > HP. LC50 values obtained for HP and DM are lower than the recommended treatment
concentrations (Table 6). Extreme sensitivity was observed for CP exposure where complete
mortality was observed after 24 h; it was not possible to determine an LC50 value. The lowest
concentration tested for CP (3 g CP L-1) is almost half the recommended application
concentration (5 g CP L-1). This was unexpected based on range finder experiments where 100%
survival was observed at 5 g CP L-1 after 48 h. No studies in the literature have reported the
effect of any chemotherapeutant or chemical used in salmon aquaculture on topsmelt.
The results of the current study suggest that the use of HP, DM and CP may introduce
unwanted risks to topsmelt in the vicinity. This is combination with the low margin of safety for the
use of DM (0 – 3.5x) and HP (0 – 3x) in the treatment of Atlantic salmon suggests that the entire
Actinoptrerygii class of fish might be at risk. Their use in areas where wild salmon populations (or
other ray-finned fish) are present should be minimized.
2.3.2.3 Mysid survival
The results of the mysid test are presented in Table 10. NOEL, LOEL and LC50 values
(with 95 % CI) are presented for the survival endpoint. For the control treatment group, survival
70
was 92 %. A 96-h LC50 value of 610 g EB L-1 was obtained in the current study; a similar study
reported a 96-h LC50 value of 0.04 g EB L-1 in formulation for the same species (Lumaret et al.,
2012). The differences observed may be attributable to the use of the formulations rather than
the chemical alone. Subtle differences in the test conditions (e.g. age of the organisms) could
also contribute to these differences. A 96-h LC50 value of 40 g CP L-1 was obtained in the current
study; a similar study reported 0.05 g CP L-1 for the same species (Clark et al., 1989). 96-h LC50
values of 16 g DM L-1, 7,700 g HP L-1, and 1,218 g AZ L-1 were also obtained in the current
study; for HP, DM, and AZ, no comparable values have been published in the literature. Overall,
these results show that mysids have lower sensitivity to HP and AZ than to the other chemicals
tested. The LC50 values reported in the current study for HP, DM and CP are below the
recommended treatment concentrations for their respective formulations but not for AZ (Table 6).
The results of the current study are unsurprising given that sea lice and mysids are both
crustaceans. Toxic effects to crustaceans following the use of sea lice pesticides have already
been documented by others (e.g. Burridge et al. [1999]). In general, because substances that
sorb to sediment have a tendency to be more persistent, benthic organisms are at greater risk of
toxicity .
2.3.2.4 Bivalve embryo survival and development
The results of the bivalve test are presented in Table 10. NOEL, LOEL and EC50 values
(with 95 % CI) are presented for the normality endpoint and combined endpoint of normal survival;
and NOEL, LOEL and LC50 values (with 95 % CI) are presented for the survival endpoint. The
results of the current study indicate low sensitivity to CP, DM and AZ. CP and DM did not have
an effect on bivalve survival and development at the concentrations tested (up to 500 g CP L-1
and 100 . g DM L-1). Other studies using bivalves have also demonstrated low sensitivity to CP
(Clark et al., 1989) and AZ (Canty et al., 2007; Roth et al., 1993; Van Geest et al., 2014a), however
the results presented by Canty et al. (2007) suggest that more subtle effects may be occurring
(e.g. neurotoxicity and immunotoxicity). For AZ, a 48-h LC50 value of > 12,500 g AZ L-1 and a 48-
h LC50 value of 2,9000 g HP L-1 was obtained in the present study. A 48-h LC50 of 1,605 g EB
L-1 was determined which demonstrates a relatively low sensitivity of bivalves to EB, a fact
reported elsewhere (a 48-h LC50 of > 713 g EB L-1 has been reported for M. galloprovincialus
[Park, 2013]). For the chemotherapeutants that are applied as a water bath, the reported LC50
values are all greater than the doses recommended in aquaculture practices (Table 6). Both the

71
information in the literature and the results of the current study suggest that bivalves are not very
sensitive to the toxic effects of chemicals used to treat sea lice in salmon aquaculture.
2.3.2.5 Echinoderm fertilization
The results of the echinoderm fertilization test are presented in Table 10. NOEL, LOEL
and IC25 values (with 95 % CI) are presented for the fertilization endpoint. For the control treatment
group, the average success of fertilization was 86 %. Fertilization was affected by all of the
chemicals tested, however, fertilization effects were insufficient to calculate an IC25 value for the
AZ treatments. The only information available in the literature in this regard was a report of low
sensitivity of echinoderms to AZ (Burridge and Van Geest, 2014; Ernst et al., 2001). A 20-min
fertilization IC25 value of 3340 g AZ L-1 in formulation was reported for effects on fertilization in
L. pictus (Ernst et al., 2001). This suggests that L. pictus may be more sensitive than S. purpuratus
(in this study: IC25 of > 12,500 g AZ L-1). However, formulations were used in the study by Ernst
et al. (2001). For all other chemicals that are applied in a water bath, effects on fertilization
occurred at concentrations below those used in salmon aquaculture (Table 6). Echinoderms are
benthic organisms that release their gametes into the water column. Ultimately the gametes settle
to the substrate. As such, substances dissolved in the water column and sorbed to sediment may
pose a risk, if bioavailable. Given the short duration of this test, the results of the current study
demonstrate real potential risk for echinoderms in the vicinity of aquaculture sites.

72
Table 10: Summary of results (in g L-1) for the 20-min echinoderm (S. purpuratus) fertilization assay, the 48-h kelp (M. pyrifera) germination and growth assay, the 96-h topsmelt (A. affinis) survival assay, performed using 9 d-old topsmelt, the 96-h mysid (M. bahia) survival assay, performed using 5 d-old mysids, and for the 48-h bivalve (M. galloprovincialis) embryo survival and development assay. Results are presented for all five chemicals tested: emamectin benzoate (EB), hydrogen peroxide (HP), cypermethrin (CP), deltamethrin (DM) and azamethiphos (AZ). This includes LC50, IC25, or EC50 values (presented with 95 % CI), NOELs and LOELs for each of the endpoints that were assessed.
Species Endpoint Result EB HP CP DM AZ
Echinoderm (Strongylocentrous purpuratus)
Fertilization IC25 2,100 (1,400-2,500) 2,800 (2,700-3,000) 5 (3-6) 4.2 (3-5) >12,500
NOEL 800 600 <0.2 2 17
LOEL 1,260 1,200 0.2* 5.1 50
Kelp (Macrocystis pyrifera)
Germination EC50 >5,000 4,500 (4,100-4,800) > 50 > 20 >12,500
NOEL 5,000 600 50 20 < 20
LOEL >5,000 3,000 > 50 > 20 20
Growth IC50 > 5,000 3,700 (3,200-4,200) > 50 > 20 >12,500
NOEL <33 < 24 < 1.3 <0.08 < 20
LOEL 33* 24* 1.3* 0.08* 20*
Topsmelt (Atherinops affinis)
Survival LC50 350 (290-420) 172,000 (140,000-211,000)
< 3 1.6 (1-2) 980 (800-1,200)
NOEL 300* 51,180 < 3 1* 600*
LOEL 600 144,970 3* 2 1,250
Mysid (Mysidopsis bahia)
Survival LC50 617 (480-780) 7,700 (5,800-10,100)
41 (36-45) 16 (14-19) 1,218 (1,080-1,370)
NOEL 200 1,110 25 6 750
LOEL 1,000 3,330 50 13 1,500
Bivalve (Mytilus galloprovincialis)
Combined Proportion Normal
EC50 1,060 (1,040-1,080) 2,530 (2,500-2,550) > 500 > 100 5,350 (5,210-4,490)
NOEL 600 1,900 500* 100* 3,100
LOEL 1,250 3,750 > 500 > 100 6,200
Proportion Normal
EC50 1,030 (1,010-1,050) 2,020 (1,970-2,060) > 500 > 100 6,010 (5,800-6,220)
NOEL 6,00 100 500* 100* 3,100
LOEL 1,250 200 > 500 > 100 6,200
Survival LC50 1,605 (1,580-1,630) 2,900 (2,800-2,920) > 500 > 100 >12,500
NOEL 1,250 1,900 500* 100* 3,100
LOEL 2,500 3,750 > 500 > 100 6,200
*lowest concentration tested
73
2.4 Conclusions
Understanding the fate and persistence of the 5 chemicals used prominently as
AIs to treat sea lice infestations in water-sediment systems is the first step to identifying
the organisms most at risk in the marine environment following their application, and the
potential exposure durations that they may face in real world scenarios. The results
confirm that EB, CP and DM partition mainly to marine sediments (benthic organism at
risk), and that AZ and HP will remain associated with water phase (pelagic organisms at
risk). The chemicals that partitioned mainly into sediment are relatively persistent
indicating that exposure durations for benthic species are expected to be much longer
than for pelagic species exposed to more water soluble chemicals. Future research may
consider focusing on the bioavailability of these substances to various organisms in water
and when sorbed to the sediment.
The results of bioassays are useful in calculating the risks to non-target organisms
using toxicity tests with representative classes of marine organisms that may be exposed
near aquaculture operations. A lack of susceptibility trends for any species, or toxicity
trends with any one chemical were found, but, generally, toxicity occurred at water
concentrations that were above the target treatment concentrations. However, some of
the values obtained for echinoderms (IC25), kelp (IC50), and topsmelt (LC50) are below the
recommended treatment concentrations indicating a high potential risk to those species.
These risks are amplified for more persistent chemicals that have a tendency to partition
into the sediment. The information generated here indicates that consideration of the
bioavailability and toxicity of sediment-bound chemicals to benthic species should be
made to adequately determine the consequences of chemotherapeutant use in
aquaculture in this regard.
74
Chapter 3. Overall conclusions and future directions
3.1. Overall Conclusions
The current study provides much needed information regarding the fate and
persistence in water-sediment systems of 5 active ingredients in chemotherapeutants that
are or have been used in salmon aquaculture while also providing information on their
toxicity to various non-target organisms. Information on the environmental fate and
persistence of these chemicals is critical to understanding exposure risks associated with
their use in salmon aquaculture and toxicity tests help to identify toxic thresholds to to non-
target organisms that live near aquaculture operations.
The results of the environmental fate and persistence testing confirm what is
reported in the literature such that it highlights the tendency for EB, CP and DM to partition
into the sediment; AZ and HP remained in the water phase and do not associate with
sediments. In sediment, CP was found to have the greatest half-life (557.2 d), followed by
EB (230.0 d), with DM being the least persistent in that media (45.2 d). In water, CP had
the greatest half-life (19.8 d), followed by DM (17.9 d), AZ (12.7 d), with HP (8.9 h) being
the least persistent. This this partitioning behaviour explains why EB (Ikonomou, 2011)
and pyrethroids (Benskin et al., 2016; Lao et al., 2012; Muir et al., 1985; Weston et al.,
2004; 2011) are found in sediments and AZ (Ernst et al., 2001) in water during field
sampling activities. The combined environmental fate and persistence data in the current
study show that the chemicals that have a tendency to partition into sediment are more
persistent than the more hydrophilic chemicals indicating higher potential risk to benthic
dwelling species.
Marine ecosystems are complex, consisting of numerous biotic and abiotic
components linked by a series of ecological interdependencies. Although some species
play more important roles than others (e.g. keystone species vs. redundant species), the
complex web of interactions in the natural environment makes it very important to protect
as many non-target organisms from toxic effects as reasonably possible. This reinforces
the need to better understand risks associated with the use of sea lice pesticides. In the
current study, differences in sensitivity to sea lice pesticides from species to species were

75
observed for all chemicals tested. As previously mentioned, the current study shows the
lack of susceptibility trends in any species, or toxicity trends with any one chemical. This
information is useful for identifying high risks to specific groups of organisms including
echinoderms, kelp and some developing fish (topsmelt) for which reported endpoints (IC25,
IC50 and LC50, respectively) are below the recommended treatment concentrations for
some of the pesticide formulations. The high sensitivity to topsmelt along with the low
margins of therapeutic safety for salmon (Bright and Dionne, 2005), raises concerns about
the potential for sea lice pesticides to elicit adverse effects to non-target fish species in
general.
Typically studies focus on one, or several pesticides, chemicals or organisms,
whereas, the current study included multiple chemicals and organisms. Because these
individual tests were done using similar procedures, it provides a means to do side-by-
side comparisons of the different chemicals while reducing uncertainty.
3.2. Future Directions
The current study investigated chemicals used as AIs in several
chemotherapeutants, however, other studies have used the formulations themselves (e.g.
Lyons et al. [2014], Mayor et al. [2008], and Burridge et al. [2014b]). As previously
mentioned, the formulations often behave differently than the active ingredient alone
(Burridge, 2013; Lyons et al., 2014; Mayor et al., 2008; Meyer et al., 2013; US EPA, 2007).
Future work should include simultaneous studies with formulations and the AI’s alone.
This would aid in understanding if synergistic or antagonistic effects of the ingredients
contained within the formulations exist. In nature, non-target organisms are likely exposed
to a multitude of toxicants both from the aquaculture sites (e.g. antibiotics, pesticides,
antifungals, etc.) as well as from other anthropogenic sources (e.g. sewage, spills, etc.)
and so mixture exposures may be necessary. For example, one study reported complex
toxic interactions in testing using sediment samples that were contaminated with a variety
of pyrethroid chemotherapeutants; it was noted that these interactions make it very difficult
to predict toxicity (Lao et al., 2012). The toxic loading that non-target organisms are
exposed to is difficult to predict, however a better understanding of the complexity of the
interactions between toxicants could help enable us to make better decisions and provide
greater protection to the non-target organisms.

76
The current study found that chemicals that have a tendency to partition into
sediment are more persistent than the more hydrophilic chemicals. Therefore, it is
recommended that future studies focus on the bioavailability of these chemicals in
sediment (in water-sediment systems). Similarly, more work to understand the
bioavailability of EB in fish feed would help understand the link between the water route
of exposure commonly used in toxicity tests and the exposure via faeces and food pellets
in nature. This information is critical to interpreting the environmental risks.
The results of the current study indicate that future studies may also examine
subtle sublethal endpoints, including behavioral endpoints (as these can have important
adverse impacts in nature). This recommendation was also listed in a review published by
the DFO (Burridge and Van Geest, 2014). For example, one study examined shelter use
among juvenile lobsters and found that repeated short-term pulse exposure to AZ resulted
in increased shelter use, a behavior which decreases vulnerability towards predators while
putting a halt to foraging behavior (Abgrall et al., 2000).
To assess the environmental consequences of aquaculture chemical use, it is
important to generate data on their environmental persistence, and acute and sublethal
toxicity to marine organisms. This research targeted specific research experiments to
yield information that would be useful to ensure the proper and safe use of aquaculture
chemicals, and to appropriately regulate this important industry.
77
References
Aaen, S.M., Helgesen, K.O., Bakke, M.J., Kaur, K., and Horsberg, T.E. 2015. Drug resistance in sea lice: a threat to salmonid aquaculture. Trends in Parasitology. 31(2):72-81.
Abgrall, P., Rangeley, R.W., Burridge, LE., and Lawton, P. 2000. Sublethal effects of azamethiphos on shelter use by juvenile lobsters (Homarus americanus). Aquaculture. 181:1-10.
Agrawal, S.C. 2009. Factors affecting spore germination in algae – review. Folia Microbiologica. 54(4):273-302.
Alonso, M.B., Feo, M.L., Corcellas, C., Vidal, L.G., Bertozzi, C.P., Marigo, J., Secchi, E.R., Bassoi, M., Azedeco, A.F., Dorneles, P.R., Torres, J.P.M., Lailson-Brito, J., Malm, O., Eljarrat, E., and Barcelo, D. 2012. Pyrethroids: A new threat to marine mammals? Environment International. 47: 2012: 99-106.
Ayad, M.A., Fdil, M.A., and Mouabad, A. 2011. Effects of cypermethrin (pyrethroid insecticide) on the valve activity behavior, byssal thread formation, and survival in air of the marine mussel Mytilus galloprovincialis. Archives of Environmental Contamination and Toxicology. 60:462-470.
Baillie, A.C. 1985. The biochemical mode of action of insecticides. recent advances in the chemistry of insect control. The Royal Society of Chemistry. Burlington House London. pp. 1-25.
Barata, C., Medina, M., Telfer, T., and Baird, D.J. 2002. Determining demographic effects of cypermethrin in the marine copepod Acartia tonsa: stage-specific short tests versus life-table tests. Archives of Environmental Contamination and Toxicology. 43:373-378.
Barroin, G. and Feuillade, M. 1986. Hydrogen peroxide as a potential algicide for Oscillatoria rubescens D.C. Water Research. 20:619-623.
Benskin, J.P., Ikonomou, M.G., Surridge, B.D., Dubetz, C., and Klaassen, E. 2016. Biodegradation potential of aquaculture chemotherapeutants in marine sediments. Aquaculture Research. 47:482-497.
Boveris, A. and Cadenas, E. 2000. Mitochondrial production of hydrogen peroxide regulation by nitric oxide and the role of ubisemiquinone. IMUBMB Life. 50:245-250.
Boveris, A., Oshino, N., and Chance, B. 1972. The cellular production of hydrogen peroxide. Biochemical Journal. 128:617-630.

78
Bravo, S., Sevetdal, S., and Horsberg., T.E. 2008. Sensitivity assessment of Caligus rogercresseyi to emamectin benzoate in Chile. Aquaculture. 282:7-12.
Bravo. S., Treasurer, J., Speulveda, M., and Lagos, C. 2010. Effectiveness of hydrogen peroxide in the control of Caligus rogercresseyi in Chile and implications for sea louse management. Aquaculture. 303:22-27.
Bravo, S., Sepulveda, M., Silva, M.T., and Costello, M.J. 2014. Efficacy of deltamethrin in the control of Caligus rogercresseyi (Boxshall and Bravo) using bath treatment. Aquaculture. 432:175-180.
Bright, D.A. and Dionne, S. 2005. Use of emamectin benzoate in the Canadian finfish aquaculture industry: A review of environmental fate and effects. Technical report, Environment Canada.
Bruno, D.W. and Raynard, R.S. 1994. Studies on the use of hydrogen peroxide as a method for the control of sea lice on Atlantic salmon. Aquaculture International. 2:10-18.
Burka, J.F., Hammell, K.L., Horsberg, T.E., Johnson, G.R., Rainnie, D.J., and Speare, D.J. 1997. Drugs in salmonid aquaculture – A review. Journal of Veterinary Pharmacology and Therapeutics. 20:333-349.
Burridge, L.E. 2003. Chemical use in marine finfish aquaculture in Canada: A review of current practices and possible environmental effects. Canadian Technical Report of Fisheries and Aquatic Sciences 2450: ix + 131 p.
Burridge, L. E. 2013. A review of potential environmental risks associated with the use of pesticides to treat Atlantic salmon against infestations of sea lice in southwest New Brunswick, Canada. DFO Can. Sci. Advis. Sec. Res. Doc, pages 2013/050. iv + 25 p.
Burridge, L.E., Haya, K., Zitko, V., Waddy, S. 1999. The lethality of Salmosan (aza- methiphos) to American lobster (Homarus americanus) larvae, post-larvae, and adults. Ecotoxicol. Environ. Saf. 43 (2), 165–169.
Burridge, L.E., Haya, K., Page, F.H., Waddy, S.L., Zitko, V., and Wade, J. 2000. The lethality of the cypermethrin formulation Excis to larval and post-larval stages of the American lobster (Homarus americanus). Aquaculture. 182:37-47.
Burridge, L.E., Haya, K., Waddy, S.L. and Wade, J. 2000a. The lethality of anti-sea lice formulations Salmosan (azamethiphos) and Excis (cypermethrin) to stage IV and adult lobsters Homarus americanus during repeated short-term exposures. Aquaculture. 182:27-35.
Burridge, L.E., Haya, K., and Waddy, S.L. 2005. Seasonal lethality of the organophosphate pesticide, azamethiphos to female American lobster (Homarus americanus). Ecotoxicology and Environmental Safety. 60:277-281.

79
Burridge, L.E., Haya, K., Waddy, S.L. 2008b. The effect of repeated exposure to azamethiphos on survival and spawning in the American lobster (Homarus americanus). Ecotoxicology and Environmental Safety 69:411-415.
Burridge, L., Weis, J., Cabello, F., and Pizzaro, J. 2008. Chemical use in salmon Aquaculture: A review of practices and possible environmental effects. Salmon Aquaculture Dialogue. 83 p.
Burridge, L.E., Weis, J.S., Cabello, F., Pizarro, J., and Bostick, K. 2010. Chemical use in salmon aquaculture: A review of current practices and possible environmental effects. Aquaculture. 306:7–23.
Burridge, L. E., Doe, K.G., and Ernst, W. 2011. Pathway of effects of chemical inputs from the aquaculture activities in Canada. Technical Report 2010/017, DFO.
Burridge, L. E., Lyons, M. C., Wong, D. K. H., MacKeigan, K., and VanGeest, J. L. 2014. The acute lethality of three anti-sea lice formulations: AlphaMax®, Salmosan®, and Interox® Paramove™ 50 to lobster and shrimp. Aquaculture, 420-421: 180-186.
Burridge L.E. and Van Geest, J.L. 2014. A review of potential environmental risks associated with the use of pesticides to treat Atlantic salmon against infestations of sea lice in Canada. DFO Can. Sci. Advis. Sec. Res. Doc. 2014/002. vi + 36 p.
Buschmann, A.H., Riquele, V.A., Hernandez-Gonzalez, M.C., Varela, D., Jimenez, J.E., Henriquez, L.A., Vergara, P.A., Guinez, R., and Filun, L. 2006. A review of the impacts of salmonid farming on marine coastal ecosystems in the southeast Pacific. ICES Journal of Marine Science. 63:1338-1345.
Bright, D.A., and Dionne., S. 2005. Use of emamectin benzoate in the Canadian finfish aquaculture industry: review of environmental fate and effects. Environment Canada.
Bruno, D.W. and R.A. Raynard. 1994. Studies on the use of hydrogen peroxide as a method for the control of sea lice on Atlantic salmon. Aquaculture International. 2:10-18.
Burson, A., Matthijs, H.C.P., Bruijne, W., Talens, R., Hoogenboom, R., Gerssen, A., Visser, P.M., Stomp, M., Steur, K., van Scheppingen, Y., and Huisman, J. 2014. Termination of a toxic Alexandrium bloom with hydrogen peroxide. Harmful Algae. 31:125-135.
Cabiscol, E., Tamarit, J., and Ros, J. 2000. Oxidative stress in bacteria and protein damage by reactive oxygen species. International Microbiology. 3:3-8.
Canadian Council of Ministers of the Environment (CCME). 1999. Canadian water quality guidelines for the protection of aquatic life: Deltamethrin. In: Canadian environmental quality guidelines, 1999, Canadian Council of Ministers of the Environment, Winnipeg.

80
Canty, M.N., Hagger, J.A., Moore, R.T.B., Cooper, L., and Galloway, T.S. 2007. Sublethal impact of short term exposure to the organophosphate pesticide azamethiphos in the marine mollusc Mytilus edulis. Marine Pollution Bulletin. 54:396-402.
Carvajal, V., Speare, D.J., and Horney, B.S. 2000. Culture method influences degree of growth rate reduction in rainbow trout following exposure to hydrogen peroxide. Journal of Aquatic Animal Health 12(2):146-148.
Chopin, T., Cooper, J.A., Reid, G., Cross, S., and Moore, C.2012. Open-water integrated multi-trophic aquaculture: Environmental biomitigation and economic diversification of fed aquaculture by extractive aquaculture. Reviews in Aquaculture. 4 :209-220.
Chukwudebe, A.C., Andrew, N., Drottar, K., Swigert, J., and Wislocki, P.G. 1996. Bioaccumulation Potential of 4′′-epi-(Methylamino)-4′′-deoxyavermectin B1a Benzoate (emamectin benzoate) in bluegill sunfish. Journal of Agricultural and Food Chemistry. 44:2894-2899.
Clark, J.R., Patrick, J.M., Moore, J.C., and Lores, E.M. 1987. Waterborne and sediment-source toxicities of six organic chemicals to grass shrimp, (Palaemonetes pugio) and amphioxus (Branchiostoma caribaeum). Archives of Environmental Contamination and Toxicology. 16:401-407.
Clark, J.R., Goodman, L.R., Borthwick, P.W., Patrick, J.M., Cripe, G.M., Moore, J.C., and Lores, E.M. 1989. Toxicity of pyrethroids to marine invertebrates and fish: A literature review and test results with sediment-sorbed chemicals. Environmental Toxicology and Chemistry. 8:393-401.
Costa, L.G., Giordano, G., Guissetti, M., and VItalone, A. 2008. Neurotoxicity of pesticides: A brief review. Frontier in Bioscience. 13:1240-1249.
Costello, M.J. 2006. Ecology of sea lice parasic on farmed and wild fish. Trends in Parasitology. 22(10) :475-483.
Costello, M.J. 2009. The global economic cost of sea lice to the salmonid farming industry. Journal of Fish Diseases. 32:115-118.
Deady, S., Varian, S.J.A., Fives, J.M. 1995. The use of cleaner-fish to control sea lice on two Irish salmon (Salmo salar) farms with particular reference to wrasse behaviour in salmon cages. Aquaculture. 131:73-90.
Department of Fisheries and Oceans (DFO). 2010. Memorandum for the Minister: Use of Alphamax® for sea lice control (information only). Ottawa, ON. 5 p.
Department of Fisheries and Oceans (DFO). 2012. Aquaculture in Canada 2012: A report on aquaculture sustainability. ISBN 978-1-100-10131-3

81
Department of Fisheries and Oceans (DFO). 2014a. Sea lice monitoring and non-chemical measures. DFO Can. Sci. Advis. Sec. Sci. Advis. Rep. 2014/006.
Department of Fisheries and Oceans Canada (DFO). 2014. Aquaculture production quantities and values. Statistics Canada Catalogue no. 23-222-X. Accessed online August 25, 2016: http://www.dfo-mpo.gc.ca/stats/aqua/aqua14-eng.htm
Department of Fisheries and Oceans (DFO). 2016. Aquaculture maps. http://www.pac.dfo-mpo.gc.ca/aquaculture/maps-cartes-eng.html#sites [Accessed online 9 May 2017].
Department of Fisheries and Oceans (DFO). 2017. Aquaculture Production quantities and values. http://www.dfo-mpo.gc.ca/stats/aqua/aqua15-eng.htm [Accessed online 26 April 2017].
Department of Fisheries and Oceans (DFO). 2017b. Mission, vision and values. http://www.dfo-mpo.gc.ca/about-notre-sujet/org/vision-eng.htm [Accessed online 8 May 2017].
Ellis, T. Turnbull, J.F., Knowles, T.G., Lines, J.A., and Auchterlonie, N.A. 2016. Trends during development of Scottish salmon farming: An example of sustainable intensification? Aquaculture. 458:82-99.
EMEA Committee for Veterinary Medicinal Products. 1999. Azamethiphos summary report (2), EMEA/MRL 527: 98
Environment and Climate Change Canada (ECCC). 2013. Kelly Cove Salmon Ltd. Ordered to Pay $500,000 for Federal Fisheries Act Violations. https://www.ec.gc.ca/alef-ewe/default.asp?lang=En&n=68361B85-1) [ Accessed online 29 June, 2016].
Environment Canada (EC). 2011. Biological test method: Fertilization assay using echinoids (sea urchins and sand dollars) Second Edition. EPS 1/RM/27.
Ernst, W., Jackman, P., Doe, K., Page, F., Julien, G., Mackay, K., and Sutherland, T. 2001. Dispersion and toxicity to non-target aquatic organisms of pesticides used to treat sea lice on salmon in net pen enclosures. Marine Pollution Bulletin. 42(6):433-444.
Ernst, W., Doe, K., Cook, A., Burridge, L., Lalonde, B., Jackman, P., Aube, J.G., and Page, F. 2014. Dispersion and toxicity to non-target crustaceans of azamethiphos and deltamethrin after sea lice treatments on farmed salmon, Salmo salar. Aquaculture. 242-245:104-112.
Espedal, P.G., Glover, K.A., Horsberg., T.E., and Nilsen, F. 2013. Emamectin benzoate resistance and fitness in laboratory reared salmon lice (Lepeophtheirus salmonis). Aquaculture. 4160417:111-118.

82
European Commission (EC), 2002. Review report for the active substance deltamethrin finalised in the Standing Committee on the Food Chain and Animal Health at its meeting on 18 October 2002 in view of the inclusion of deltamethrin in Annex I of Directive 91/414/EEC. 6504/VI/99-final, p. 78.
European Commission (EC), 2005. Review report for the active substance cypermethrin finalised in the Standing Committee on the Food Chain and Animal Health at its meeting on 15 February 2005 in view of the inclusion of cypermethrin in Annex I of Directive 91/414/EEC. SANCO/4333/2000, p. 41.
European Food Safety Authority (EFSA). 2012. Conclusion on the peer review of the pesticide risk assessment of the active substance emamectin. EFSA Journal. 10(11):2955.
Food and Agriculture Organization of the United Nations (FAO). 2014. The State of World Fisheries and Aquaculture 2014. Rome. 223 pp.
Food and Agriculture Organization of the United Nations (FAO). 2016. The State of World Fisheries and Aquaculture - Contributing to Food Security and Nutrition for All. Rome. 204 pp.
Food and Agriculture Organization of the United Nations (FAO). 2015. FAO Global Aquaculture production database updated to 2013 – Summary information.
Fairchild, W., Doe, K., Jackman,P., Arsenault, J., Aube, J., Losier M., and Cook, A. 2010. Acute and chronic toxicity of two formulations of the pyrethroid pesticide deltamethrin to an amphipod, sand shrimp and lobster larvae. Can. Tech. Rep. Fish. Aquat. Sci. 2876: vi + 34 p.
The Norwegian Seafood Federation (FHL). 2011. Aquaculture in Norway. 26pp. http://sjomatnorge.no/wp-content/uploads/importedfiles/Aquaculture%2520in%2520Norway%25202011.pdf [Accessed online 9 May 2017].
Gaikowski, M.P., Rach, J.R., Olson, J.J., Ramsay, R.T., and Wolgamood, M. 1998. Toxicity of hydrogen peroxide treatments to rainbow trout eggs. Journal of Aquatic Animal Health 10(3):241-251.
Gaikowski, M.P., Rach, J.J., and Ramsay, R.T. 1999. Acute toxicity of hydrogen peroxide treatments to selected lifestages of cold-, cool-, and warmwater fish. Aquaculture. 178:191-207.
Garric, J., Vollat, B., Duis, K., Pery, A., Junker, T, Ramil, M., Fink, G., Ternes, T.A. Effects of the parasiticide ivermectin on the cladoceran Daphnia magna and the green alga Pseudokirchneriella subcapitata. Chemosphere. 69:903-910.
Geiszt, M. and Leto, T.L. 2004. The Nox Family of NAD(P)H Oxidases: Host Defense and beyond. The Journal of Biological Chemistry. 279(50):51715-51718.

83
Gerringa, L.JA., Rijkenberg, M.J.A., Timmermans, K.R., and Buma, A.G.J. 2004. The influence of solar ultraviolet radiation on the photochemical production of H2O2 in the equatorial Atlantic Ocean. Journal of Sea Research. 51:3-10.
Gough, D.R. and Cotter, T.G. 2011. Hydrogen Peroxide: A Jekyll and Hyde signalling molecule. Cell Death and Disease. 2, e21.
Grant, A.N. 2002. Medicines for sea lice. Pest Management Science. 58:521-527.
Graham, M.H., Kinlan, B.P., Druehl, L.D., Garske, L.E., and Banks, S. 2007. Deep-water kelp refugia as potential hotspots of tropical marine diversity and productivity. Proceedings of the National Academy of Sciences of the United States of America. 104(42):16576-16580.
Gudding, R. and Van Muiswinkel, W.B. 2013. A history of fish vaccination: Science-based disease prevention in aquaculture. Fish and Shellfish Immunology. 35:1683-1688.
Hart, J.L., Thacker, J.R.M., Braidwood, J.C., Fraser, N.R., and Mathews, J.E. 1997. Novel cypermethrin formulation for the control of sea lice on salmon (Salmo salar). Veterinary Record. 35:263-270.
Haya, K. 1989. Toxicity of Pyrethroid Insecticides to Fish. Environmental Toxicology and Chemistry. 8:381-391.
Haya, K., Burridge, L.E., and Change, B.D. 2001. Environmental impact of chemical wastes produced by the salmon aquaculture industry. ICES Journal of Marine Science. 58:492-496.
Haya, K., Burridge, L.E., Davies, I.M., and Ervik, A. 2005. A review and assessment of environmental risk of chemicals used for the treatment of sea lice infestations of cultured salmon. Environ. Chem. 5(M): 305–340.
Helgesen, K.O., Bravo, S., Sevatdal, S., Mendoza, J., and Hosberg., T.E. 2014. Deltamethrin resistance in the sea louse Caligus rogercresseyi (Boxhall and Bravo) in Chile: bioassay results and usage data for antiparasitic agents with references to Norwegian conditions. Journal of Fish Diseases. 37:877-890.
Hladik, M.L., Smalling, K.L., and Kuivila, M.. 2012. Methods of Analysis - Determination of Pyrethroid insecticides in water and sediment using gas chromatography/mass spectrometry. techniques and methods 5-C2. U.S. Department of the Interior, U.S. Geological Survey. https://pubs.usgs.gov/tm/tm5c2/tm5c2.pdf
Hogans, W.E. and Trudeau, D.J. 1989. Preliminary studies on the biology of sea lice, Caligus elongatus, Caligus curtus and Lepeophtheirus saimonis (copepoda: caligoida) parasitic on cage-cultured salmonids in the lower Bay of Fundy. Can. Tech. Rep. Fish. Aquat. Sci. 1715: iv + 14 p.

84
Hopwood, M.J., Rapp, I., Schlosser, C., and Achterberg, E.P. 2017. Hydrogen peroxide in deep waters from the Mediterranean Sea, South Atlantic and South Pacific Oceans. Nature.com Scientific Reports. DOI: 10.1038/srep43436
Ikonomou, M.I. 2011. Environmental fate and potential biological effects of the anti- parasitic chemotherapeutant emamectin benzoate (active ingredient of Slice®) in the Canadian marine environment. DFO CSAP Working Paper. 2011/P55. vi + 31 p.
Islam, M.S. and Takana, M. 2004. Impacts of pollution on coastal and marine ecosystems including coastal and marine fisheries and approach for management: a review and synthesis. Marine Pollution Bulletin. 48:624-649.
Ismail, B.S., Mazlinda, M., and Zuriati, Z. 2012. Effects of temperature, soil moisture content and soil type on the degradation of cypermethrin in two types of Malaysian agricultural soils. World Applied Sciences Journal. 17(4):428-432.
Jimenez, D.F., Revie, C.W., Hardy, S.P., Jansen, P.A., and Gettinby, G. 2013. Multivariate evaluation of the effectiveness of treatment efficacy of cypermethrin against sea lice (Lepeophtheirus salmonis) in Atlantic salmon (Salmo salar). Biomed Central. Open Access (http//creativecommons.org/liceses/by/2.0).
Johnson, S.C., Constible, J.M., and Richard, J. 1993. Laboratory investigations on the efficacy of hydrogen peroxide against the salmon louse Lepeophtheirus salmonis and its toxicological and histopathological effects on Atlantic salmon Salmo salar and chinook salmon Oncorhynchus tshawytscha. Diseases of Aquatic Organisms. 17:197-204.
Kensese, S.M. and Smith, L.L. 1989. Hydrogen peroxide mutagenicity towards Salmonella typhimurium. Teratogeness, Carncinogenesis, and Mutagenesis. 9:211-218.
Kiemer, M.C.B. and Black., K.D. 1997. The effects of hydrogen peroxide on the gill tissues of Atlantic salmon, Salmo salar L. Aquaculture. 153:181-189.
Kozawa, K., Aoyama, Y., Mashimo, S., and Kimura, H. 2009. Toxicity and actual regulation of organophosphate pesticides. Toxin Reviews. 28(4):245-254.
Krksosek, M., Lewis, M.A. and Volpe, J.P. 2005. Transmission dynamics of parasitic sea lice from farm to wild salmon. Proceedings: Biological Sciences. 272(1564):689-696.
Kuo., J., Buday, C., Van Aggelen, G., Ikonomou, M.G., and Pasternak, J. 2010. Acute toxicity of emamectin benzoate and its desmethyl metabolite to Eohaustorius estuarius. Environmental Toxicology and Chemistry. 29:1816-1820.
Lao, W., Tiefenthaler, Greenstein, D.J., Maruya, K.A., Bay, S.M., Ritter K., and Schiff, K. 2012. Pyrethroids in southern California coastal sediments. Environmental Toxicology and Chemistry. 31(7):1649-1659.

85
Lees, F., Bailie, M., Geetinby, G., and Revie, C.W. 2008. The efficacy of emamectin benzoate against infestations of Lepeophtheirus salmonis on farmed Atlantic salmon (Salmo salar L) in Scotland, 2002–2006. PLoS One. 3(2). E1549.
Liou, G. and Storz, P. 2010. Reactive oxygen species in cancer. Free Radical Research. 444(5): doi:10.3109/10715761003667554
Lumaret, J., Errouissi, F., Floate, K., Rombke, J., and Wardhaugh, K.A. 2012 review on the toxicity and non-target effects of macrocyclic lactones in terrestrial and aquatic environments. Current Pharmaceutical Biotechnology, 13:1004–1060.
Lyons, M.C., Wong, D.K.H. and Page, F.H. 2014. Degradation of hydrogen peroxide in seawater using the anti-sea louse formulation Interox® ParamoveTM50. Can. Tech. Rep. Fish. Aquat. Sci. 3080: v + 19p.
MacKinnon, B.M. 1995. The poor potential of cunner, Tautogolabrus adspersus, to act as cleaner fish in removing sea lice (Caligus elongatus) from farmed salmon in eastern Canada. Canadian Journal of Fisheries and Aquatic Sciences. 52:175-177.
Manning, F. and Hubley, E. 2015. Volume one – Aquaculture industry and governance in Canada. Standing Senate Committee on Fisheries and Oceans. 72 p.
Maund, S.J., Hamer, M.J., Lane, M.C.G., Farrelly, E., Rapley, J.H., Goggin, U.M., and Gentle, W.E. 2002. Partitioning, bioavailability, and toxicity of the pyrethroid insecticide cypermethrin in sediments. Environmental Toxicology and Chemistry. 21(1):9-15.
Mayor, D.J., Solan, M., Martinez, I., Murray, L., McMillan, H., Paton, G.I. and Kilham, K. 2008. Acute toxicity of some treatments commonly used by the salmonid aquaculture industry to Corophium volutator and Hediste diversicolor: Whole sediment bioassay tests. Aquaculture. 285:102-108.
McKellar, Q.A. and Benchaoui, H.A. 1996. Avermectins and milbemycins. Journal of Veterinary Pharmacology and Therapeutics, 19:331–351.
Medina, M., Barata, C., Telfer, T., and Baird, D.J. 2002. Age- and sex-related variation in sensitivity to the pyrethroid cypermethrin in the marine copepod Acartia tonsa Dana. Archives of Environmental Contamination and Toxicology. 42:17-22.
Medina, M., Barata, C., Telfer, T., and Baird, D.J. 2004. Assessing the risks to zooplankton grazers of continuous versus pulsed cypermethrin exposures from marine cage aquaculture. Archives of Environmental Contamination and Toxicology. 47:67-73.
Mileson, B.E., Chamber, J.E., Chen, W.L., Dettbarn, W., Ehrich, M., Eldefrawi, A.T., Gaylor, D.W., Hamernik, K., Hodgson, E., Karczmar, A.G., Padilla, S., Pope, C.N., Richardson, R.J., Saunders, D.R., Sheets, L.P., Sultatos, L.G., and Wallace, K.B. 1998. Common mechanism of toxicity: A case study of organophosphorus pesticides. Toxicological Sciences. 41:8-20.

86
Mischke, C.C., Terhune, T.S., and Wise, D.J. 2001. Acute toxicity of several chemicals to the oligochaete Dero digitata. Journal of the World Aquaculture Society. 32(2):184-188.
Montgomery-Brock, D., Sato, V.T., Brock, J.A., and Tamaru, C.S. 2001. The application of hydrogen peroxide as a treatment for the ectoparasite Amyloodinium ocellatum (Brown 1931) on the Pacific threadfin Polydactylus sexfilis. Journal of the World Aquaculture Society. 32(2):250-254.
Morton, A. 2015. Salmon Confidential: the ugly truth about Canada’s open-net salmon farms. http://www.alexandramorton.ca/salmon-confidential-booklet/ [Accessed online 9 May 2017].
Morton, A., Routledge, R., McConnell, A., and Krkosek, M. 2011. Sea lice dispersion and salmon survival in relation to salmon farm activity in the Broughton Archipelago. ICED Journal or Marine Science. 68(1):144- 156.
Muir, D.C.G., Hobden, B.R., and Servos, M.R. 1994. Bioconcentration of pyrethroid insecticides and DDT by rainbow trout: uptake, depuration, and effect of dissolved organic carbon. Aquatic Toxicology. 29:223-240.
Muir, D.C.G., Rawn, G.P., Townsend, B.E., Lockhart, W.L., and Greenhalgh, R. 1985. Bioconcentration of cypermethrin, deltamethrin, fenvalerate and permethrin by Chironomus tentans larvae in sediment and water. Environmental Toxicology and Chemistry. 4:51-61.
Mustafa, A., Rankaduwa, W., and Campbell, P. 2000. Estimating the cost of sea lice to salmon aquaculture in eastern Canada. Canadian Veterinary Journal. 41:54-56.
National Research Council (NRC). 2010. Ecosystem concepts for sustainable bivalve mariculture. Washington, DC: The National Academies Press. https://doi.org/10.17226/12802.
Naylor, R.L., Goldburg, R.J., Primavera, J.H., Kautsky, N., Beveridge, M.C.M., Clay, J., Folkes, C., Lubchenco, J., Mooney, H., and Troell, M. 2000. Effect of aquaculture on world fish supplies. Nature. 405:1017-1024.
Naylor, R.L., Goldburg, R.J., Mooney, H., Beveridge, M.C.M., Clay, J., Folkes, C., Kautsky, N., Lubchenco, J., Primavera, J.H., Primavera, J. and Williams, M. 1998b. Nature’s subsidies to shrimp and salmon farming. Science. 282(5390):883-884.
New Brunswick Department of Agriculture (NBDA). 2011. Monitoring, surveillance and research in support of the emergency registration of AlphaMax® (10g/L deltamethrin) for sea lice control in New Brunswick. 115 pp.
Olin, P.G., Smith, J., and Nabi, R. 2011. Regional review on status and trends in aquaculture development in North America: Canada and United States of America – 2010. FAO Fisheries and Aquaculture Circular No. 1061/2. Rome, FAO. 84pp.

87
Organisation for Economic Co‐operation and Development (OECD). 2002. Aerobic and
anaerobic in aquatic sediment systems; Guideline for Testing of Chemicals No. 308.
Pahl, B.C. and Opitz, H.M. 1999. The effects of cypermethrin (Excis) and azamethiphos (Salmosan) on lobster Homarus americanus h. Milne Edwards larvae in a laboratory study. Aquaculture Research, 30:655–665.
Palmquist, K., Salatas, J., and Fairbrother, A. 2012. Pyrethroid Insecticides: Use, environmental fate, and ecotoxicology. Insecticides – advances in integrated pest management. Dr. Farzana Perveen (Ed.), ISBN 978-953-307-780-2. 252-278.
Park., A. 2013. The biological effects of emamectin benzoate (Slice®) on spot prawn (Pandalus platyceros). Unviersity of Victoria.
Pest Management Regulatory Agency (PMRA). 2014. Proposed registration document PRD2014-11 : Hydrogen peroxide. Pest Management Regulatory Agency. Health Canada. Ottawa, ON. 40pp.
Pest Management Regulatory Agency (PMRA). 2015. Proposed re-evaluation decision PRVD2015-07 : Deltamethrin. Pest Management Regulatory Agency. Health Canada. Ottawa, ON. 175 pp.
Pest Management Regulatory Agency (PMRA). 2016. Registration decision RD2016-18 : Hydrogen peroxide. Pest Management Regulatory Agency. Health Canada. Ottawa, ON. 7pp.
Petasne, R.G. and Zika, R.G. 1997. Hydrogen peroxide lifetimes in south Florida coastal and offshore waters. Marine Chemistry. 56:215-225.
Pfenning A.P., Roybal J.E., Turnipseed S.B., Gonzales S.A., Hurlbut J.A. 1999. Determination of residues of azamethiphos in salmon tissue by liquid chromatography with fluorescence detection. Journal of AOAC International. 82:1224-1228.
Price, D., Mantoura, F.C., and Worsfold., P.J. 1998. Shipboard determination of hydrogen peroxide in the western Mediterranean Sea using flow injection with chemiluminescence detection. Analytica Chimica Acta. 377:145-155.
Queensland Government. 2013. Types of aquaculture. https://www.daf.qld.gov.au/fisheries/aquaculture/overview/types [Accessed online 8 May 2017].
Rafique, N. and Tariq, S.R. 2015. Photodegradation of a-cypermethrin in the soil in the presence of trace metals (Cu2+, Cd2+, Fe2+ and Zn2+). Environmental Science Processes & Impacts. 17:166-176.

88
Reddy, P.P. 2012. Recent Advances in crop protection. Springer Science and Business Media. pp. 13-24.
Remucal., C.K. 2014. The role of indirect photochemical degradation in the environmental fate of pesticides: A review. Environmental Science Processes & Impacts. 16:628-653.
Rhee, S.G., Chang, T., Bae, Y.S., Lee, S., and Kang, S.W. 2003. Cellular regulation by hydrogen peroxide. Journal of the American Society of Nephrology. 14:S211-S214.
Roth, M., Richards, R.H., and Sommerville, C. 1993. Current practices in the chemothera- peutic control of sea lice infestations in aquaculture: a review. Joural of Fish Diseases, 16:1–26.
Roth, M., Richards, R.H., Dobson, D.P., and Rae, G.H. 1996. Field trials on the efficacy of the organophosphorus compound azamethiphos for the control of sea lice (Copopoda: Caligidae) infestations of farmed Atlantic salmon (Salmo salar). Aquaculture. 140:217-239.
Roy, W., Sutherland, I., Rodger, H.D., and Varma, K. 2000. Tolerance of Atlantic salmon, Salmo salar L., and rainbow trout, Oncorhynchus mykiss (Walbaum), to emamectin benzoate, a new orally administered treatment for sea lice. Aquaculture. 184:19–29.
Saksida, S.M., Morrison, D., and Review, C.W. 2010. The efficacy of emamectin benzoate against infestations of sea lice, Lepeophtheirus salmonis, on farmed Atlantic salmon, Salmo salar L., in British Columbia. Journal of Fish Diseases. 33:913-917.
Sanchez-Fortun, S. and Barahona, M.V. 2005. Comparative study on the environmental risk induced by several pyrethroids in estuarine and freshwater invertebrate organisms. Chemosphere. 59:553-559.
Scottish Environmental Protection Agency (SEPA). 1999. Emamectin benzoate use in marine fish farming. Scottish Environment Protection Agency Firsh Farm Advisory Group. SEPA 65/99.
Scottish Environmental Protection Agency (SEPA). 2004. Guidance on the use of emamectin benzoate at marine cage fish farms. Regulation and monitoring of maine case fish farming in Scotland – A procedures manual. Attachment XI. Version 1.0.
Sevatdal, S., Copley, L., Wallace, C., Jackson, D., and Horsberg, T.E. 2005. Monitoring of the sensitivity of sea lice (Lepeophtheirus salmonis) to pyrethroids in Norway, Ireland and Scotland using bioassays and probit modelling. Aquaculture. 244:19-27.

89
Sevatdal, S., and Horsberg, T.E. 2003. Determination of reduced sensitivity in sea lice (Lepeophtheirus salmonis Krøyer) against the pyrethroid deltamethrin using bioassays and probit modelling. Aquaculture. 218:21-31.
Skiftesvik, A.B., Bjelland, R.M., Durif, C.M.F., Johansen, I.S., Browman, H.I. 2013. Delousing of Atlantic salmon (Salmo salar) by cultured vs. wild ballan wrasse (Labrus bergylta). Aquaculture. 402-403:113.118.
Soderlund, D.M. and Bloomquist, J.R. 1989. Neurotoxic actions of pyrethroid insecticides. Annual Review of Entomorlogy. 34:77-96.
Stone, J., Sutherland, I.H., Sommerville, C., Richards, R.H. Varma, K.J. 1999. The efficacy of emamectin benzoate as an oral treatment of sea lice, Lepeophtheirus salmonis (Krøyer), infestations in Atlantic salmon, Salmo salar L. Journal of Fish Diseases 22, 261-270.
Stone, J., Sutherland, I.H., Sommerville, C., Richards, R.H., Endris, R.G. 2000a. The duration of efficacy following oral treatment with emamectin benzoate against infestations of sea lice, Lepeophtheirus salmonis (Krøyer), in Atlantic salmon Salmo salar L. Journal of Fish Diseases 23, 185-192.
Stone, J., Sutherland, I.H., Sommerville, C., Richards, R.H. Varma, K.J. 2000b. Field trials to evaluate the efficacy of emamectin benzoate in the control of sea lice, Lepeophtheirus salmonis (Krøyer) and Caligus elongatus Nordmann, infestations in Atlantic salmon Salmo salar L. Aquaculture 186, 205-219.
Stone, J., Roy, W.J., Sutherland, I.H., Ferguson, H.W., Sommerville, C., and Endris, R. 2002. Safety and efficacy of emamectin benzoate administered in-feed to Atlantic salmon, Salmo salar L., smolts in freshwater, as a preventative treatment against infestations of sea lice, Lepeophtheirus salmonis (Krøyer). Aquaculture. 210:21-34.
Tariq, S.R., Rafique, N., Kiran, S., and Khan, A.M. 2014. Photo-induced degradation of emamectin benzoate: effect of iron amendments and solvent system. Environmental Earth Sciences. 72:983-988.
Taylor, P.W. and Glenn, R.A. 2008. Toxicity of five therapeutic compounds on juvenile salmonids. North American Journal of Aquaculture. 70(2):175-183.
Torrissen, O., Jones, S., Asche, F., Guttormsen, A., Skilbrei, O.T., Nilsen, F., Horsberg, T.E., and Jackson, D. 2013. Salmon lice – impact on wild salmonids and salmon aquaculture. Journal of Fish Diseases, 36:171–194.
Treasurer, J.W., Wadsworth, S., and Grant, A. 2000. Resistance of sea lice, Lepeophtheirus salmonis (Kroyer), to hydrogen peroxide on farmed Atlantic salmon Salmo salar L. Aquaculture Research. 31:855-860.

90
Tucca, F., Díaz-Jaramillo, M., Cruz, G., Silva, J., Bay-Schmith, E., Chiang, G. and Barra, R. 2014. Toxic effects of antiparasitic pesticides used by the salmon industry in the marine amphipod Monocorophium insidiosum. Archives of Environmental Contamination and Toxicology. 67:139-148.
U.S. Environmental Protection Agency (US EPA). 1995a. Short-term methods for estimating the chronic toxicity of effluents and receiving waters to west coast marine and estuarine organisms, first edition. National Health and Ecological Effects Research Laboratory, Newport, OR. EPA/600/R-95-136.
U.S. Environmental Protection Agency (US EPA). 1995b. Recommended guidelines for conducting laboratory bioassays on Puget Sound sediments. Puget Sound Water Quality Authority.
U.S. Environmental Protection Agency (US EPA). 2002. Short-term methods for estimating the chronic toxicity of effluents and receiving waters to marine and estuarine organisms, third edition. Office of Water. Washington, DC. EPA-821-R-02-014.
U.S. Environmental Protection Agency (US EPA). 2002b. Methods for measuring the acute toxicity of effluents and receiving waters to freshwater and marine organisms, firth edition. Office of Water. Washington, DC. EPA-821-R-02-012.
U.S. Environmental Protection Agency (US EPA). 2007. Peroxy compounds: Hydrogen peroxide and peroxyacetic acid environmental fate science chapter. Washington DC. 35 pp.
U.S. Environmental Protection Agency (US EPA). 2009. Section 3 request for a new use of the insecticide emamectin benzoate (PC Code 122806). Washington, DC: Office of Prevention, Pesticides, and Toxic Substances.
Valavanidis, A., Vlahogianni, T., Dassenakis, M., and Scoullos, M. 2006. Molecular biomarkers of oxidative stress in aquatic organisms in relation to toxic environmental pollutants. Ecotoxicology and Environmental Safety. 64:178-189.
Van Geest, J.L., Burridge, L.E., Fife, F.J. and Kidd, K.A. 2014a. Feeding response in marine copepods as a measure of acute toxicity of four anti-sea lice pesticides. Marine Environmental Research. 101:145-152.
Van Geest, J.L., Burridge, L.E., and Kidd, K.A. 2014d. The toxicity of the anti-sea lice pesticide AlphaMax® to the polychaete worm Nereis virens. Aquaculture. 430:98-106.
Van Geest, J.L., Burridge, L.E., and Kidd, K.A. 2014b. Toxicity of two pyrethroid-based anti-sea lice pesticides, AlphaMax® and Excis®, to a marine amphipod in aqueous and sediment exposures. Aquaculture. 434:233-240.
Veal, E.A., Day, A.M., and Morgan, B.A. 2007. Hydrogen peroxide sensing and signaling. Molecular Cell 26:1-14.

91
Veldhoen, N., Ikonomou, M. G., Buday, C., Jordan, J., Rehaume, V., Cabecinha, M., Dubetz, C., Chamberlain, J., Pittroff, S., Vallee, K., van Aggelen, G., and Helbing, C.C. 2012. Biological effects of the anti-parasitic chemotherapeutant emamectinbenzoate on a non-target crustacean, the spot prawn (Pandalus platyceros Brandt,1851) under laboratory conditions. Aquatic Toxicology, 108:94-105.
Waddy, S.L., Burridge, L.E., Hamilton, M.N., Mercer, S.M., Aiken, D.E., and Haya, K. 2002. Emamectin benzoate induces molting in American lobster, Homarus americanus. Canadian Journal of Fisheries and Aquatic Sciences, 59:1096–1099.
Waddy, S.L., Merritt, V.A., Hamilton-Gibson, M.N., Aiken, D.E., and Burridge, L.E. 2007. Relationship between dose of emamectin benzoate and molting response of ovigerous American lobsters (Homarus americanus). Ecotoxicology and Environmetal Safety. 67(1):95-99.
Wang, Z., Yang, Y., Yue, W., Kang, W., Liang, W., and Li, W. 2010. The growth behaviour of three marine phytoplankton species in the presence of commercial cypermethrin. Ecotoxicology and Environmental Safety. 73:1408-1414.
Washington State Department of Ecology (WS DOE). 2008. Laboratory guidance and whole effluent toxicity test review criteria. Washington. Publication no. WQ-R-95-80.
Webb, J.L., Vandebor, J., Pirie, B., Robinson, S.M.C., Cross, S.F., Jones, S.R.M., and Pearce, C.M. 2013. Effects of temperature, diet, and bivalve size on the ingestion of sea lice (Lepeophtheirus salmonis) larvae by various filter-feeding shellfish. Aquaculture. 406-407:9-17.
Weston, D.P., You, J., and Lydy, M.J. 2004. Distribution and toxicity of sediment-associated pesticides in agriculture-dominated water bodies of California’s central valley. Environmental Science and Technology. 38:2752-2759.
Weston, D.P., Asbell, A.M., Hecht, S.A., Scholz, N.L., and Lydy, M.J. 2011. Pyrethroid insecticides in urban salmon streams of the Pacific Northwest. Environmental Pollution. 159:3051-3056.
Weyman, G.S., Rufli, H., Weltje, L., Salinas, E.R., and Hamitou, M. 2012. Aquatic toxicity tests with substances that are poorly soluble in water and consequences for environmental risk assessment. Environmental Toxicology and Chemistry. 31:1-8.
Whyte, S. K., Westcott, J.D., Jiminez, D., Review, C.W., and Hammell, K.L. 2014. Assessment of sea lice (Lepeophtheirus salmonis) management in New Brunswick, Canada using deltamethrin (AlphaMax®) through clinical field treatment and laboratory bioassay responses. Aquaculture. 422-423:54-62.
Willis, K.J., and Ling, N. 2003. The toxicity of emamectin benzoate, an aquaculture pesticide, to planktonic marine copepods. Aquaculture. 221:289-297.

92
Willis, K.J. and Ling, N. 2004. Toxicity of the aquaculture pesticide cypermethrin to planktonic marine copepods. Aquaculture Research. 35:263-270.
Winsby, M., Sander, B., Archibald, D., Daykin, M., Nix, P., Taylor, F.J.R., and Munday, D. 1996. The environmental Effects of salmon netcage culture in British Columbia.
Wright, C., Taekema, B., Burd, B., and McGreer, E. 2007. Salmon aquaculture environmental monitoring data report Results of sampling program for year 2004.
Xie, G., Wang, W. and Zhao. 2011.Simplified RP-HPLC method for multi-residue analysis of abamectin, emamectin benzoate.and ivermectin in rice. Food Additives and Contaminants. 28:19–25.
Xie, W. and Zhou, J. 2008. Cypermethrin persistence and soil properties as affected by long-term fertilizer management. Acta Agriculturae Scandinavica, Section B – Soil & Plant Science.58:314-321.
Yocis, B.H., Kieber, D.J., and Mopper, K. 2000. Photochemical production of hydrogen peroxide in Antarctic Waters. Deep Sea Research Part I. 47:1077-1099.
Yoshiro S., Nishio, K., Ogawa, Y., Kimata, J., Kinumi, T., Yoshida, Y., Noguchi, N., and Niki, E. 2006. Turning point in apoptosis/ necrosis induced by hydrogen peroxide. Free Radical Research. 40(6): 619-630.
Yuan, J. and Shiller, A.M. 2001. The distribution of hydrogen peroxide in the southern and central Atlantic Ocean. Deep Sea Research Part II. 48:2947-2970.
Yuan, J. and Shiller, A.M. 2004. Hydrogen peroxide in deep waters of the North Pacific Ocean. Geophysical Research Letters. 31:1-4.
Zhou, J.L., Rowland, S., Fauzi, R., and Mantoura, C. 1995. Partition of synthetic pyrethroid insecticides between dissolved and particulate phases. Water Research. 29(4):1023-1031.

93
Appendix A. Summary of key properties for test substances
Table A1: Summary of Key Properties for Test Substances.
Azamethiphos Cypermethrin Deltamethrin Emamectin Benzoate
Hydrogen Peroxide
CAS 35575-96-3 52315-07-8 52918-63-5 155569-91-8 7722-84-1
Molecular Formula
C9H10ClN2O5PS C22H19Cl2NO3 C2H19Br2NO3 C56H81NO15 H2O2
Structural Formula
Molecular Weight (g mol-1)
324.68 416.3 505.2 994 - 1008.24 34.01
Purity 99.5% >98% 99.6% 99.4% 30%
Source Sigma-Aldrich Sigma-Aldrich Sigma-Aldrich Sigma-Aldrich Sigma-Aldrich
Log Kow 1.05 f, g 5.9 e 4.6a 5 c < 0 d
Solubility (mg L-1)
1100 f, g < 0.009 b (20°C) 0.01-0.2 e
0.0002 a < 0.005 a
(25 & 20°C)
24-320 c 5.5 (in seawater)
high affinity for water d
Completely miscible h
Vapour Pressure (Pa)
low 2.3 x 10⁻⁷ b
(at 20°C) 1.24 x 10⁻⁸ a
(at 25°C) 4 x 10⁻⁶ c
200 h
(30 °C)
pKa - does not dissociate b
does not dissociate a
- 11.62 h
Photolysis in Water (days)
- 5.1 – 221 b (pH 7-8)
stable (pH 7) 31 (pH 8) a
0.7 – 35.4 c -
Half-Life (days)
8.9 g 48-88 b (20-22°C)
26 a (at 25°C)
174 c 8 hrs - > 6 days d
Formulation Dose (mg L-1)
0.1 f, g
0.005 g 0.002 - 0.003 g 0.05 mg/kg/day i (for 7 days)
1200 - 1800 d
a EC (2002) b EC (2005) c Lumaret et al. (2012) d Lyons et al. (2014) e Clark et al. (1987) f Burridge et al. (2005) g Burridge and Van Geest (2014) h PMRA (2014) i Bright and Dionne (2005)

94
Appendix B. Raw Data: Fate and persistence testing
Table B1: Summary of results from the fate and persistence test (HP).
Time (h) Concentration (mg L-1)
0.5 75.2
1 62.2
5 50.1
10.5 13.8
27.5 3.5
46.25 2.5

95
Table B1: Summary of results from the fate and persistence tests (AZ, CP, DM, and EB).

96
Appendix C.
Raw Data: Toxicity tests
Table C1: Raw data for kelp toxicity test – hydrogen peroxide (nominal).
Concentration Rep
No. Germi-nated
No. Not Germi-nated
Tube Length (m)
1 2 3 4 5 6 7 8 9 10
SW Control A 76 24 11 9 11 12 10 8 11 10 8 10 B 80 20 9 7 8 10 15 9 11 7 11 10 C 79 21 10 8 12 9 9 9 10 12 11 10 D 67 33 8 10 10 10 14 9 10 8 9 10
E 66 34 8 9 10 11 8 10 9 10 10 11
HP C5 A 82 18 6 7 8 7 11 12 10 8 10 8 (0.024 mg L-1) B 61 39 10 12 10 6 8 10 8 8 9 11
C 67 33 10 11 8 12 8 6 9 11 8 10 D 78 22 8 12 10 8 8 12 10 12 7 9 E 75 25 9 9 8 10 12 9 10 8 8 10
HP C4 A 63 37 6 6 8 8 8 8 10 10 8 9 (0.12 mg L-1) B 74 26 8 7 9 8 6 10 12 8 8 10
C 68 32 12 6 10 7 8 7 7 9 7 9 D 67 33 8 6 9 8 10 8 9 9 8 8 E 60 40 8 8 13 11 8 11 10 8 8 9
HP C3 A 71 29 6 10 10 8 10 7 10 8 7 8 (0.6 mg L-1) B 72 28 6 8 10 8 8 10 7 5 8 9
C 79 21 8 10 8 5 6 9 6 10 7 11 D 70 30 9 7 10 6 8 8 6 8 11 9 E 50 50 11 6 6 8 10 6 8 9 10 7
HP C2 A 64 36 6 7 4 7 4 7 5 6 8 7 (3 mg L-1) B 72 28 5 6 5 4 6 5 6 7 4 4
C 66 34 4 5 4 7 4 4 6 5 7 6 D 53 47 8 4 5 6 6 8 5 6 6 5 E 64 36 7 5 6 4 6 4 6 5 6 6
HP C1 A 0 100 0 0 0 0 0 0 0 0 0 0 (15 mg L-1) B 0 100 0 0 0 0 0 0 0 0 0 0
C 0 100 0 0 0 0 0 0 0 0 0 0 D 0 100 0 0 0 0 0 0 0 0 0 0 E 0 100 0 0 0 0 0 0 0 0 0 0
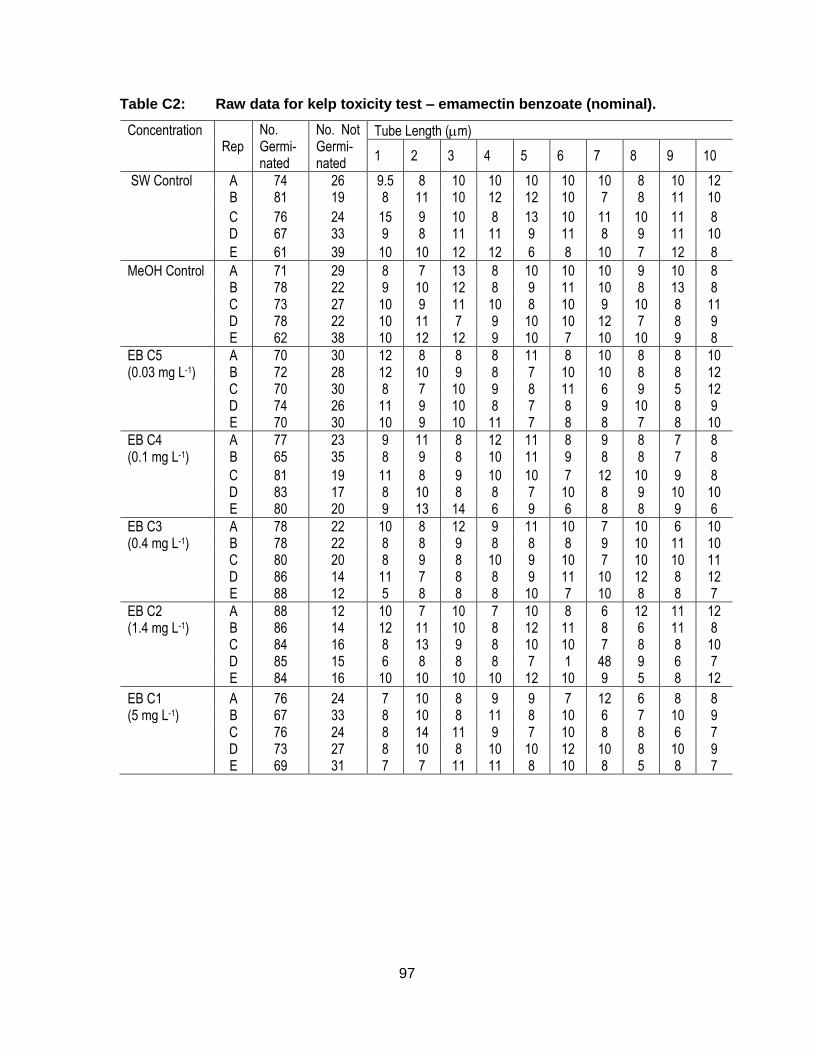
97
Table C2: Raw data for kelp toxicity test – emamectin benzoate (nominal).
Concentration Rep
No. Germi-nated
No. Not Germi-nated
Tube Length (m)
1 2 3 4 5 6 7 8 9 10
SW Control A 74 26 9.5 8 10 10 10 10 10 8 10 12 B 81 19 8 11 10 12 12 10 7 8 11 10
C 76 24 15 9 10 8 13 10 11 10 11 8 D 67 33 9 8 11 11 9 11 8 9 11 10
E 61 39 10 10 12 12 6 8 10 7 12 8
MeOH Control A 71 29 8 7 13 8 10 10 10 9 10 8 B 78 22 9 10 12 8 9 11 10 8 13 8 C 73 27 10 9 11 10 8 10 9 10 8 11 D 78 22 10 11 7 9 10 10 12 7 8 9 E 62 38 10 12 12 9 10 7 10 10 9 8
EB C5 A 70 30 12 8 8 8 11 8 10 8 8 10 (0.03 mg L-1) B 72 28 12 10 9 8 7 10 10 8 8 12
C 70 30 8 7 10 9 8 11 6 9 5 12 D 74 26 11 9 10 8 7 8 9 10 8 9 E 70 30 10 9 10 11 7 8 8 7 8 10
EB C4 A 77 23 9 11 8 12 11 8 9 8 7 8 (0.1 mg L-1) B 65 35 8 9 8 10 11 9 8 8 7 8
C 81 19 11 8 9 10 10 7 12 10 9 8 D 83 17 8 10 8 8 7 10 8 9 10 10 E 80 20 9 13 14 6 9 6 8 8 9 6
EB C3 A 78 22 10 8 12 9 11 10 7 10 6 10 (0.4 mg L-1) B 78 22 8 8 9 8 8 8 9 10 11 10
C 80 20 8 9 8 10 9 10 7 10 10 11 D 86 14 11 7 8 8 9 11 10 12 8 12 E 88 12 5 8 8 8 10 7 10 8 8 7
EB C2 A 88 12 10 7 10 7 10 8 6 12 11 12 (1.4 mg L-1) B 86 14 12 11 10 8 12 11 8 6 11 8
C 84 16 8 13 9 8 10 10 7 8 8 10 D 85 15 6 8 8 8 7 1 48 9 6 7 E 84 16 10 10 10 10 12 10 9 5 8 12
EB C1 A 76 24 7 10 8 9 9 7 12 6 8 8 (5 mg L-1) B 67 33 8 10 8 11 8 10 6 7 10 9
C 76 24 8 14 11 9 7 10 8 8 6 7 D 73 27 8 10 8 10 10 12 10 8 10 9 E 69 31 7 7 11 11 8 10 8 5 8 7

98
Table C3: Raw data for kelp toxicity test – cypermethrin (nominal).
Concentration Rep
No. Germi-nated
No. Not Germi-nated
Tube Length (m)
1 2 3 4 5 6 7 8 9 10
Acetone A 76 24 11 9 11 12 10 8 11 10 8 10 Control 1 B 80 20 9 7 8 10 15 9 11 7 11 10 C 79 21 10 8 12 9 9 9 10 12 11 10 D 67 33 8 10 10 10 14 9 10 8 9 10
E 66 34 8 9 10 11 8 10 9 10 10 11
Acetone A 81 19 8 12 9 9 8 10 10 12 10 11 Control 2 B 72 28 14 10 7 8 11 8 11 9 10 9 C 77 23 6 10 10 11 8 11 9 9 12 10 D 67 33 8 12 12 9 7 10 8 10 11 10 E 73 27 10 8 11 10 11 11 7 11 8 8
CP C5 A 70 30 7 8 12 8 9 8 10 10 8 10 (0.001 mg L-1) B 70 30 8 10 7 8 7 7 9 8 7 10 C 76 24 8 11 6 9 9 12 10 8 12 8 D 78 22 8 10 9 10 8 10 7 8 10 7 E 74 26 8 7 13 8 7 11 10 10 10 7
CP C4 A 76 24 7 10 11 6 7 10 10 10 7 10 (0.003 mg L-1) B 70 30 10 8 8 10 6 8 7 10 6 9
C 80 20 8 12 10 9 6 10 7 9 10 12 D 90 10 10 6 14 10 6 10 10 11 9 8 E 71 29 10 7 12 8 9 8 7 8 8 10
CP C3 A 71 29 11 8 9 8 8 10 9 8 7 10 (0.008 mg L-1) B 80 20 10 6 11 7 8 12 8 6 8 10 C 74 26 8 7 6 12 8 8 12 10 10 8 D 64 36 10 9 6 7 8 10 7 11 10 8 E 51 49 8 8 6 8 12 7 10 10 7 10
CP C2 A 71 29 12 12 10 7 8 9 8 8 8 10 (0.02 mg L-1) B 70 30 10 7 8 9 9 8 10 7 10 11
C 82 18 9 7 6 10 12 7 14 8 9 10 D 86 14 10 10 9 10 10 9 7 12 7 10 E 51 49 6 8 7 12 9 6 8 8 6 7
CP C1 A 81 19 11 9 10 9 8 11 10 10 6 10 (0.05 mg L-1) B 65 35 8 10 8 10 9 6 8 12 8 8 C 67 33 8 6 8 8 8 9 11 9 6 8 D 75 25 8 6 10 12 6 8 11 9 8 7 E 90 10 9 9 10 7 10 8 12 7 9 10

99
Table C4 - Raw data for kelp toxicity test – deltamethrin (nominal).
Concentration Rep
No. Germi-nated
No. Not Germi-nated
Tube Length (m)
1 2 3 4 5 6 7 8 9 10
Acetone A 76 24 11 9 11 12 10 8 11 10 8 10 Control 1 B 80 20 9 7 8 10 15 9 11 7 11 10 C 79 21 10 8 12 9 9 9 10 12 11 10 D 67 33 8 10 10 10 14 9 10 8 9 10
E 66 34 8 9 10 11 8 10 9 10 10 11
Acetone A 81 19 8 12 9 9 8 10 10 12 10 11 Control 2 B 72 28 14 10 7 8 11 8 11 9 10 9 C 77 23 6 10 10 11 8 11 9 9 12 10 D 67 33 8 12 12 9 7 10 8 10 11 10 E 73 27 10 8 11 10 11 11 7 11 8 8
DM C5 A 66 34 9 10 11 8 9 8 9 9 6 6
(0.00008 mg L-1)
B 70 30 8 11 9 8 7 8 8 9 7 8
C 74 26 13 10 8 8 8 6 8 8 6 9 D 78 22 10 10 10 8 7 8 8 8 8 8 E 70 30 9 10 9 11 7 8 10 12 8 8
DM C4 A 70 30 8 8 12 12 10 6 8 12 8 7
(0.0003 mg L-1)
B 60 40 7 8 10 14 8 10 6 8 8 8
C 88 12 12 7 8 10 8 10 7 8 6 11 D 69 31 8 9 6 10 12 6 7 8 8 7 E 80 20 8 7 10 7 7 7 11 8 10 6
DM C3 A 66 34 8 6 8 9 7 8 6 8 6 8 (0.001 mg L-1) B 78 22 11 7 9 8 8 12 8 8 8 9 C 76 24 8 10 8 9 8 8 6 8 11 8 D 80 20 11 6 8 8 8 9 7 10 6 7 E 75 25 9 8 7 8 8 12 7 8 9 10
DM C2 A 70 30 8 9 9 7 10 11 10 6 10 7 (0.005 mg L-1) B 79 21 8 8 7 9 7 13 11 9 6 6 C 65 35 8 10 6 8 7 8 6 12 8 11 D 77 23 7 9 8 12 8 12 9 7 10 6 E 73 27 10 6 8 10 9 6 7 8 10 9
DM C1 A 78 22 10 7 9 7 8 8 8 10 9 6 (0.02 mg L-1) B 66 34 11 6 10 10 6 7 8 7 6 8 C 62 38 6 8 7 11 9 8 7 10 10 8 D 75 25 8 9 10 6 10 8 10 10 6 10 E 72 28 8 8 8 7 10 6 12 11 8 8

100
Table C5 - Raw data for kelp toxicity test – azamethiphos (nominal).
Concentration Rep
No. Germi-nated
No. Not Germi-nated
Tube Length (m)
1 2 3 4 5 6 7 8 9 10
Acetone A 76 24 11 9 11 12 10 8 11 10 8 10 Control 1 B 80 20 9 7 8 10 15 9 11 7 11 10 C 79 21 10 8 12 9 9 9 10 12 11 10 D 67 33 8 10 10 10 14 9 10 8 9 10
E 66 34 8 9 10 11 8 10 9 10 10 11
Acetone A 81 19 8 12 9 9 8 10 10 12 10 11 Control 2 B 72 28 14 10 7 8 11 8 11 9 10 9 C 77 23 6 10 10 11 8 11 9 9 12 10 D 67 33 8 12 12 9 7 10 8 10 11 10 E 73 27 10 8 11 10 11 11 7 11 8 8
AZ C5 A 69 31 7 6 8 10 8 11 7 10 10 10
(0.02 mg L-1)
B 69 31 11 7 12 10 8 8 10 8 7 10
C 85 15 9 11 11 8 10 5 8 10 8 8 D 62 38 11 8 10 5 6 8 10 7 11 8 E 18 82 8 8 9 8 8 12 13 10 10 8
AZ C4 A 74 26 9 8 8 10 9 8 8 7 10 9 (0.1 mg L-1) B 68 32 6 6 8 8 11 10 6 6 9 6
C 83 17 9 9 8 7 9 8 6 6 7 12 D 48 52 8 8 6 9 9 9 6 8 12 6 E 68 32 6 12 10 9 7 9 8 8 7 9
AZ C3 A 70 30 6 8 6 9 12 9 9 6 7 9 (0.5 mg L-1) B 67 33 9 7 8 11 9 8 8 12 8 9 C 80 20 8 7 10 8 8 8 8 8 12 8 D 81 19 9 10 8 6 12 8 8 12 6 10 E 72 28 10 6 13 9 7 8 9 6 14 10
AZ C2 A 65 35 10 8 10 6 6 6 12 8 10 14 (2.5 mg L-1) B 78 22 5 6 7 10 6 12 10 10 6 11 C 69 31 7 8 10 9 8 8 8 7 8 10 D 71 29 10 8 9 6 8 10 8 6 10 9 E 79 21 10 6 11 8 6 10 7 8 8 6
AZ C1 A 66 34 8 8 10 7 10 9 10 7 9 8 (12.5 mg L-1) B 62 38 8 8 6 5 8 8 7 10 7 9 C 62 38 8 8 10 7 6 10 8 6 8 6 D 66 34 6 8 6 6 8 9 8 8 8 7 E 65 35 8 8 6 6 8 8 8 7 6 6

101
Table C6: Raw data for topsmelt toxicity test – azamethiphos (nominal).

102
Table C7: Raw data for topsmelt toxicity test – deltamethrin (nominal).

103
Table C8: Raw data for topsmelt toxicity test – cypermethrin (nominal).

104
Table C9: Raw data for topsmelt toxicity test – emamectin benzoate (nominal).

105
Table C10: Raw data for topsmelt toxicity test – hydrogen peroxide (nominal).

106
Table C11: Raw data for mysid toxicity test – deltamethrin (nominal).
Concentration Rep Survival Temperature (°C) Dissolved oxygen (mg L-1)
pH Salinity (ppt)
Time (h) 24 48 0 24 48 0 24 48 0 24 48 0 24
DMC5 A 10 10 20 19 20 7.4 7.1 56.1 7.6 7.6 7.6 28 28
(0.003 ug L-1) B 10 10
C 10 10
D 10 9
DMC4 A 10 9 20 19 19 7.4 7.1 6 7.6 7.6 7.6 28 28
(0.006 ug L-1) B 10 9
C 10 10
D 10 8
DMC3 A 10 7 19 19 20 7.4 7.1 6 7.6 7.6 7.6 28 28
(0.013 ug L-1) B 9 6
C 10 5
D 9 8
DMC2 A 9 1 19 19 19 7.4 7.1 6 7.6 7.6 7.7 28 28
(0.025 ug L-1) B 9 3
C 10 3
D 8 2
DMC1 A 9 1 20 19 20 7.4 7.2 6.1 7.6 7.6 7.7 28 28
(0.05 ug L-1) B 10 1
C 7 0
D 9 0

107
Table C12: Raw data for mysid toxicity test – azamethiphos (nominal).
Concentration Rep Survival Temperature (°C) Dissolved oxygen (mg L-1)
pH Salinity (ppt)
Time (h) 24 48 0 24 48 0 24 48 0 24 48 0 24
AZC5 A 10 9 20 19 20 7.4 7.1 6.1 7.6 7.6 7.6 28 28
(0.18 ug L-1) B 9 10
C 10 10
D 10 10
AZC4 A 10 10 20 19 19 7.4 7.1 6 7.6 7.6 7.6 28 28
(0.375 ug L-1) B 10 10
C 10 10
D 10 10
AZC3 A 10 8 19 19 20 7.4 7.1 6 7.6 7.6 7.6 28 28
(0.75 ug L-1) B 10 9
C 10 10
D 10 9
AZC2 A 9 0 19 19 19 7.4 7.1 6 7.6 7.6 7.6 28 28
(1.5 ug L-1) B 10 5
C 9 3
D 9 3
AZC1 A 2 0 19 19 20 7.4 7.1 6.1 7.6 7.6 7.6 28 28
(3 ug L-1) B 1 0
C 3 0
D 3 0
Cont SW 1 A 10 8 20 19 20 7.4 7 6.3 7.6 7.6 7.6 28 28
B 10 9
C 10 10
D 10 10
Cont SW 2 E 10 10
F 10 10
G 10 10
H 10 10

108
Table C13: Raw data for mysid toxicity test – cypermethrin (nominal).
Concentration Rep Survival Temperature (°C) Dissolved oxygen (mg L-1)
pH Salinity (ppt)
Time (h) 24 48 0 24 48 0 24 48 0 24 48 0 24
CP C5 A 10 10 19 19 20 7.4 7.1 5.7 7.6 7.6 7.6 28 28
(0.006 ug L-1) B 9 9
C 10 10
D 10 10
CPC4 A 9 9 19 19 20 7.4 7.1 5.6 7.6 7.6 7.6 28 28
(0.01 ug L-1) B 9 9
C 10 10
D 10 10
CPC3 A 10 9 20 19 20 7.4 7.1 5.9 7.6 7.6 7.6 28 28
(0.025 ug L-1) B 10 8
C 10 10
D 10 10
CPC2 A 9 2 20 19 19 7.4 7.1 6.2 7.6 7.6 7.7 28 28
(0.05 ug L-1) B 9 2
C 9 2
D 10 3
CPC1 A 8 1 20 19 19 7.4 7.2 6.2 7.6 7.6 7.7 28 28
(0.1 ug L-1) B 8 0
C 8 0
D 8 0
Control A 10 10 20 19 20 7.4 7.1 6.4 7.6 7.6 7.6 28 28
Acetone 1 B 10 9
C 10 10
D 10 10
Control E 10 10
Acetone 2 F 10 10
G 10 10
H 10 10

109
Table C14: Raw data for mysid toxicity test – emamectin benzoate (nominal).
Concentration Rep Survival Temperature (°C) Dissolved oxygen (mg L-1)
pH Salinity (ppt)
Time (h) 24 48 0 24 48 0 24 48 0 24 48 0 24
Control SW A 10 10 20 19 19 7 6.9 6.4 7.7 7.7 7.6 28 29
B 10 9
C 10 9
D 10 9
Control MeOH
A 10 10 20 19 19 7 6.9 6 7.7 7.7 7.6 28 29
B 10 9
C 10 10
D 10 10
EB C5 A 10 10 20 19 19 7 6.5 5.3 7.7 7.6 7.6 28 29
(0.008 mg L-1)
B 10 10
C 9 9
D 10 10
EB C4 A 9 9 20 19 19 7 6.6 5.7 7.7 7.6 7.6 28 29
(0.04 mg L-1) B 10 10
C 10 10
D 10 10
EB C3 A 10 10 20 19 19 7.8 6.6 5.4 7.7 7.7 7.6 28 29
(0.2 mg L-1) B 10 10
C 10 10
D 6 7
EB C2 A 10 3 20 19 19 7.8 6.7 5.1 7.7 7.7 7.6 28 29
(1 mg L-1) B 9 3
C 10 2
D 8 1
EB C1 A 0 0 20 19 19 7 6.8 6.2 7.7 7.6 7.6 28 29
(5 mg L-1) B 1 0
C 0 0
D 0 0
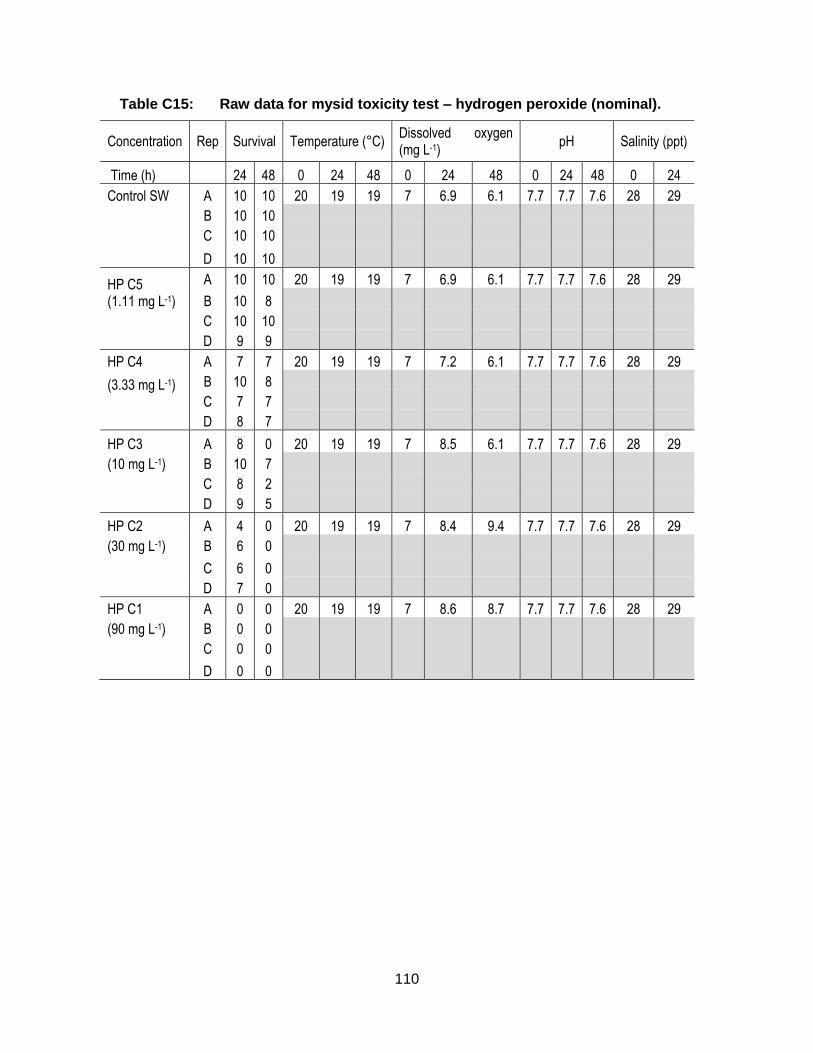
110
Table C15: Raw data for mysid toxicity test – hydrogen peroxide (nominal).
Concentration Rep Survival Temperature (°C) Dissolved oxygen (mg L-1)
pH Salinity (ppt)
Time (h) 24 48 0 24 48 0 24 48 0 24 48 0 24
Control SW A 10 10 20 19 19 7 6.9 6.1 7.7 7.7 7.6 28 29
B 10 10
C 10 10
D 10 10
HP C5 (1.11 mg L-1)
A 10 10 20 19 19 7 6.9 6.1 7.7 7.7 7.6 28 29
B 10 8
C 10 10
D 9 9
HP C4 A 7 7 20 19 19 7 7.2 6.1 7.7 7.7 7.6 28 29
(3.33 mg L-1) B 10 8
C 7 7
D 8 7
HP C3 A 8 0 20 19 19 7 8.5 6.1 7.7 7.7 7.6 28 29
(10 mg L-1) B 10 7
C 8 2
D 9 5
HP C2 A 4 0 20 19 19 7 8.4 9.4 7.7 7.7 7.6 28 29
(30 mg L-1) B 6 0
C 6 0
D 7 0
HP C1 A 0 0 20 19 19 7 8.6 8.7 7.7 7.7 7.6 28 29
(90 mg L-1) B 0 0
C 0 0
D 0 0

111
Table C16: Raw data for bivalve toxicity test – azamethiphos (nominal).
Concentration Rep No. Normal No. Abnormal
AZ C5 A 165 67
(0.8 mg L-1) B 126 53
C 161 65
D 170 48
E 139 59
AZ C4 A 130 46
(1.6 mg L-1) B 136 66
C 176 55
D 145 50
E 158 56
AZ C3 A 131 51
(3.1 mg L-1) B 104 67
C 148 60
D 163 65
E 130 67
AZ C2 A 64 110
(6.2 mg L-1) B 48 130
C 49 121
D 48 119
E 54 117
AZ C1 A 10 101
(12.5 mg L-1) B 14 97
C 9 98
D 9 102
E 9 95
Control A 154 28
SW AZ B 152 48
C 147 39
D 131 45
E 143 48
Control A 167 56
Acetone AZ B 169 75
C 147 54
D 158 43
E 136 51

112
Table C17: Raw data for bivalve toxicity test – cypermethrin (nominal).
Concentration Rep No. Normal No. Abnormal
CP C5 A 134 25
(0.03 mg L-1) B 143 43
C 151 68
D 129 54
E 138 43
CP C4 A 160 67
(0.06 mg L-1) B 155 44
C 136 62
D 146 69
E 178 54
CP C3 A 144 65
(0.1 mg L-1) B 145 77
C 154 66
D 161 65
E 145 71
CP C2 A 152 59
(0.2 mg L-1) B 151 64
C 153 55
D 127 47
E 171 66
CP C1 A 154 71
(0.5 mg L-1) B 125 62
C 158 55
D 156 51
E 166 59
Control A 133 41
SW CP B 177 60
C 131 78
D 141 54
E 166 43
Control A 155 42
Acetone CP B 139 56
C 151 60
D 169 52
E 128 39

113
Table C18: Raw data for bivalve toxicity test – deltamethrin (nominal).
Concentration Rep No. Normal No. Abnormal
DM C5 A 165 65
(0.006 mg L-1) B 145 59
C 153 49
D 152 47
E 136 40
DM C4 A 135 46
(0.01 mg L-1) B 122 50
C 155 73
D 147 61
E 148 52
DM C3 A 161 38
(0.02 mg L-1) B 136 67
C 140 61
D 133 66
E 161 52
DM C2 A 142 45
(0.05 mg L-1) B 167 55
C 167 58
D 141 52
E 158 60
DM C1 A 131 72
(0.1 mg L-1) B 149 58
C 145 65
D 179 96
E 128 75
Control A 171 71
SW DM B 176 73
C 153 73
D 166 82
E 156 64
Control A 151 50
Acetone DM B 124 53
C 138 77
D 183 72
E 181 82
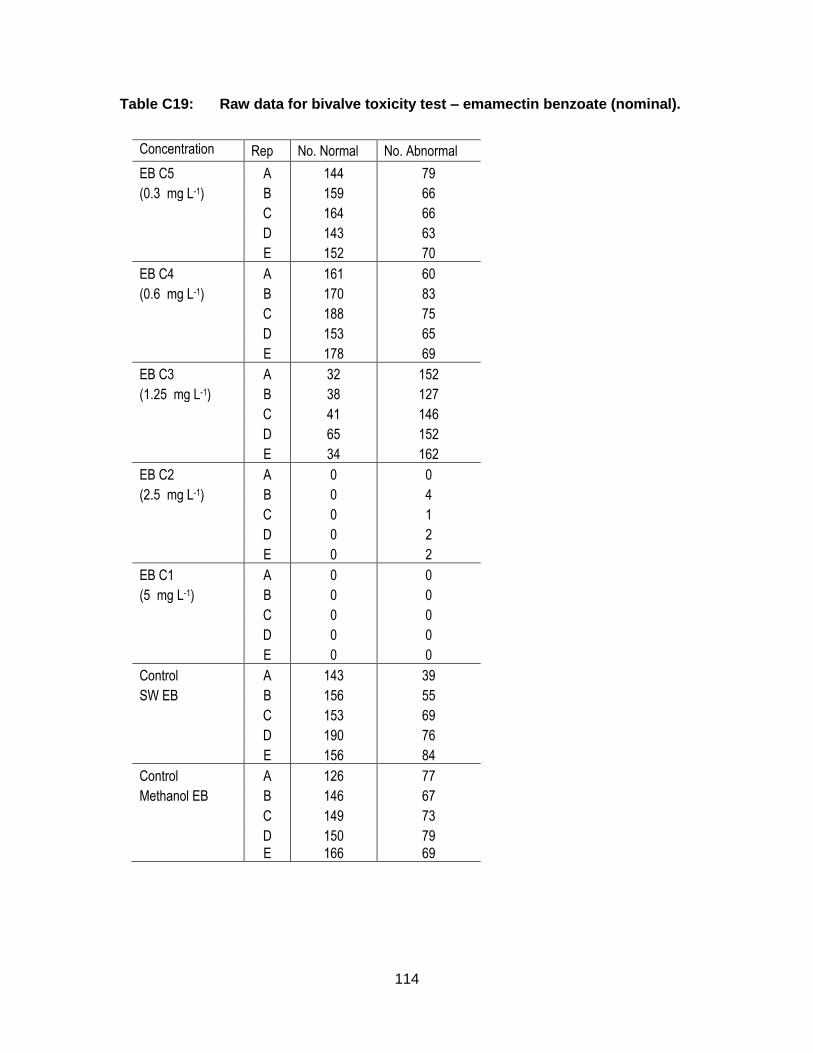
114
Table C19: Raw data for bivalve toxicity test – emamectin benzoate (nominal).
Concentration Rep No. Normal No. Abnormal
EB C5 A 144 79
(0.3 mg L-1) B 159 66
C 164 66
D 143 63
E 152 70
EB C4 A 161 60
(0.6 mg L-1) B 170 83
C 188 75
D 153 65
E 178 69
EB C3 A 32 152
(1.25 mg L-1) B 38 127
C 41 146
D 65 152
E 34 162
EB C2 A 0 0
(2.5 mg L-1) B 0 4
C 0 1
D 0 2
E 0 2
EB C1 A 0 0
(5 mg L-1) B 0 0
C 0 0
D 0 0
E 0 0
Control A 143 39
SW EB B 156 55
C 153 69
D 190 76
E 156 84
Control A 126 77
Methanol EB B 146 67
C 149 73
D 150 79
E 166 69
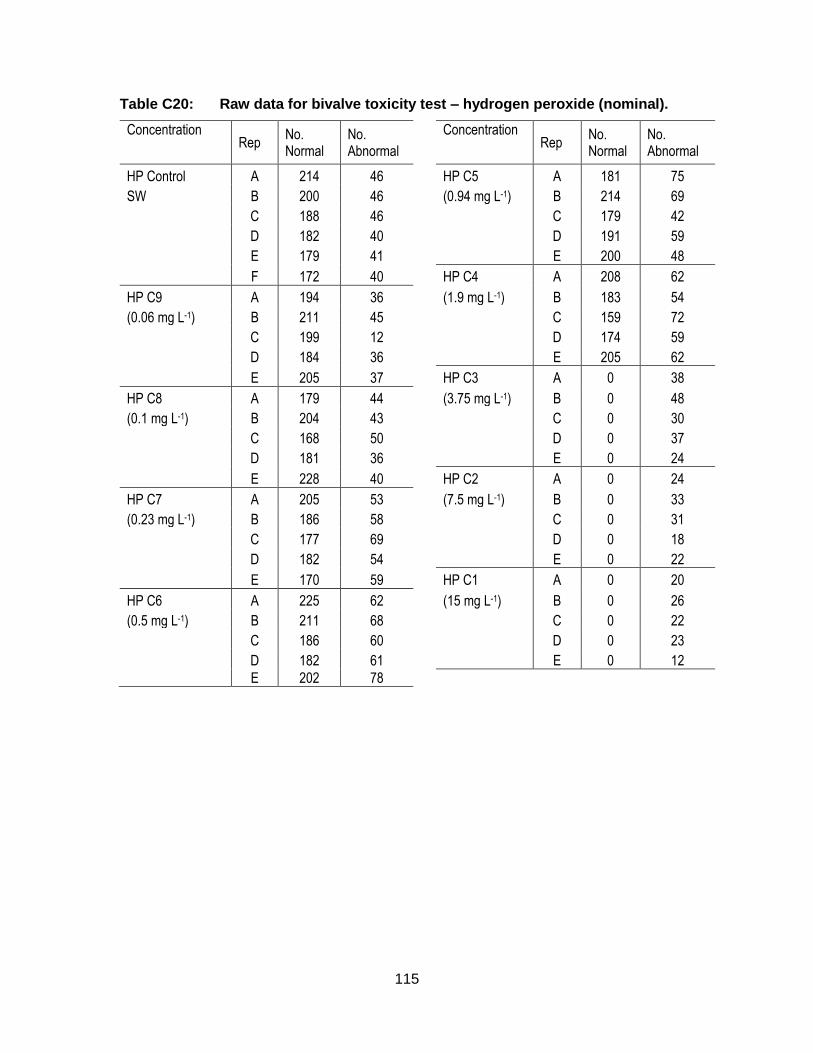
115
Table C20: Raw data for bivalve toxicity test – hydrogen peroxide (nominal).
Concentration Rep
No. Normal
No. Abnormal
Concentration Rep
No. Normal
No. Abnormal
HP Control A 214 46 HP C5 A 181 75
SW B 200 46 (0.94 mg L-1) B 214 69
C 188 46 C 179 42
D 182 40 D 191 59
E 179 41 E 200 48
F 172 40 HP C4 A 208 62
HP C9 A 194 36 (1.9 mg L-1) B 183 54
(0.06 mg L-1) B 211 45 C 159 72
C 199 12 D 174 59
D 184 36 E 205 62
E 205 37 HP C3 A 0 38
HP C8 A 179 44 (3.75 mg L-1) B 0 48
(0.1 mg L-1) B 204 43 C 0 30
C 168 50 D 0 37
D 181 36 E 0 24
E 228 40 HP C2 A 0 24
HP C7 A 205 53 (7.5 mg L-1) B 0 33
(0.23 mg L-1) B 186 58 C 0 31
C 177 69 D 0 18
D 182 54 E 0 22
E 170 59 HP C1 A 0 20
HP C6 A 225 62 (15 mg L-1) B 0 26
(0.5 mg L-1) B 211 68 C 0 22
C 186 60 D 0 23
D 182 61 E 0 12
E 202 78

116
Table C21: Raw data for echinoderm toxicity test – azamethiphos (nominal).
Concentration Rep No. Fertilized Eggs No. Unfertilized Eggs
AZ C1 A 77 23
(12.5 mg L-1) B 74 26
C 85 15
D 84 16
E 77 23
AZ C2 A 85 15
(4.1 mg L-1) B 85 15
C 87 13
D 84 16
E 83 17
AZ C3 A 84 16
(1.4 mg L-1) B 80 20
C 78 22
D 81 19
E 84 16
AZ C4 A 86 14
(0.5 mg L-1) B 85 15
C 80 20
D 78 22
E 77 23
AZ C5 A 82 18
(0.15 mg L-1) B 76 24
C 83 17
D 80 20
E 76 24
AZ C6 A 79 21
(0.05 mg L-1) B 84 16
C 77 23
D 75 25
E 78 22
AZ C7 A 77 23
(0.02 mg L-1) B 81 19
C 80 20
D 88 12
E 81 19
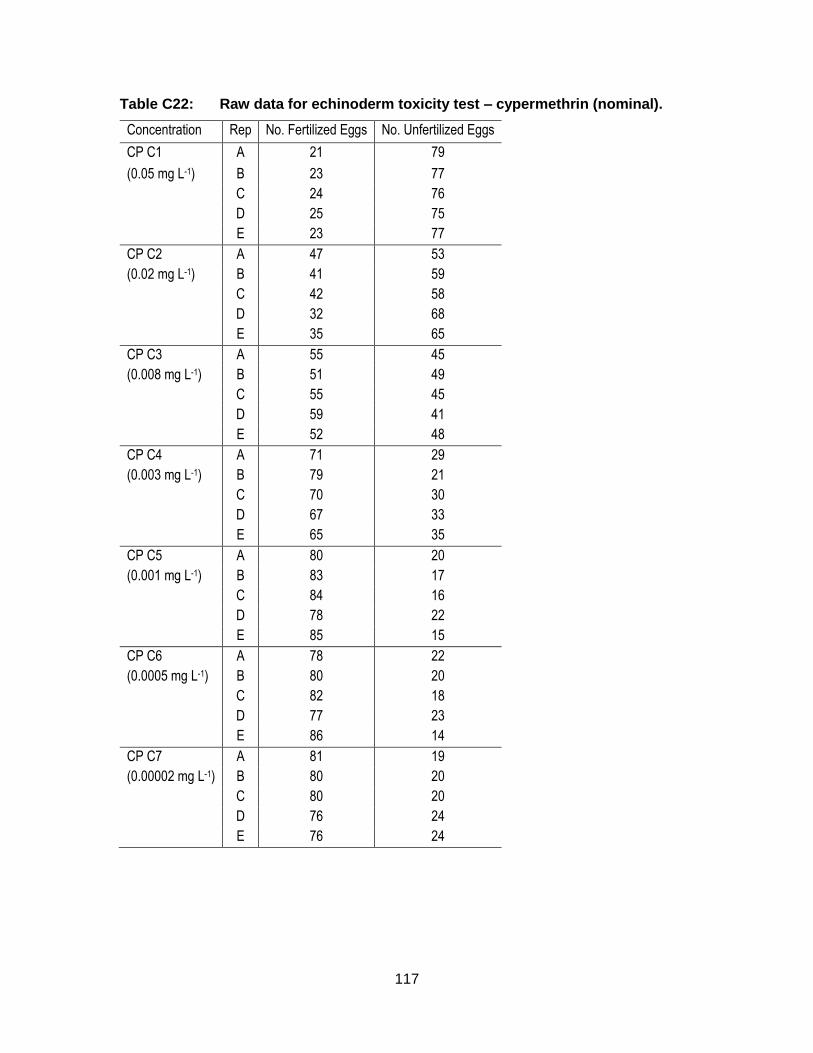
117
Table C22: Raw data for echinoderm toxicity test – cypermethrin (nominal).
Concentration Rep No. Fertilized Eggs No. Unfertilized Eggs
CP C1 A 21 79
(0.05 mg L-1) B 23 77
C 24 76
D 25 75
E 23 77
CP C2 A 47 53
(0.02 mg L-1) B 41 59
C 42 58
D 32 68
E 35 65
CP C3 A 55 45
(0.008 mg L-1) B 51 49
C 55 45
D 59 41
E 52 48
CP C4 A 71 29
(0.003 mg L-1) B 79 21
C 70 30
D 67 33
E 65 35
CP C5 A 80 20
(0.001 mg L-1) B 83 17
C 84 16
D 78 22
E 85 15
CP C6 A 78 22
(0.0005 mg L-1) B 80 20
C 82 18
D 77 23
E 86 14
CP C7 A 81 19
(0.00002 mg L-1) B 80 20
C 80 20
D 76 24
E 76 24

118
Table C23: Raw data for echinorderm toxicity test – deltamethrin (nominal).
Concentration Rep No. Fertilized Eggs No. Unfertilized Eggs
DM C1 A 51 49
(0.02 mg L-1) B 42 58
C 52 48
D 56 44
E 34 66
DM C2 A 26 74
(0.008 mg L-1) B 18 82
C 16 84
D 14 86
E 20 80
DM C3 A 79 21
(0.003 mg L-1) B 72 28
C 76 24
D 84 16
E 75 25
DM C4 A 75 25
(0.001 mg L-1) B 79 21
C 85 15
D 83 17
E 75 25
DM C5 A 75 25
(0.0005 mg L-1) B 77 23
C 78 22
D 79 21
E 85 15
DM C6 A 90 10
(0.0002 mg L-1) B 79 21
C 81 19
D 82 18
E 83 17
DM C7 A 81 19
(0.00008 mg L-1) B 81 19
C 85 15
D 89 11
E 79 21
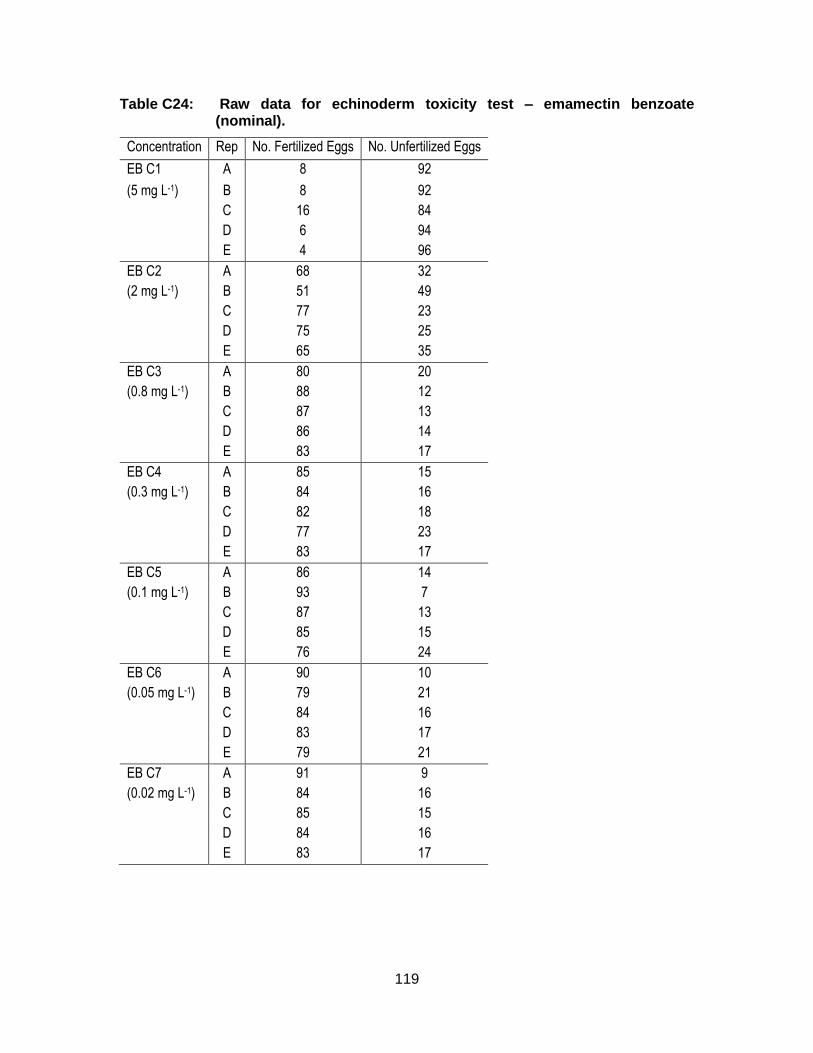
119
Table C24: Raw data for echinoderm toxicity test – emamectin benzoate (nominal).
Concentration Rep No. Fertilized Eggs No. Unfertilized Eggs
EB C1 A 8 92
(5 mg L-1) B 8 92
C 16 84
D 6 94
E 4 96
EB C2 A 68 32
(2 mg L-1) B 51 49
C 77 23
D 75 25
E 65 35
EB C3 A 80 20
(0.8 mg L-1) B 88 12
C 87 13
D 86 14
E 83 17
EB C4 A 85 15
(0.3 mg L-1) B 84 16
C 82 18
D 77 23
E 83 17
EB C5 A 86 14
(0.1 mg L-1) B 93 7
C 87 13
D 85 15
E 76 24
EB C6 A 90 10
(0.05 mg L-1) B 79 21
C 84 16
D 83 17
E 79 21
EB C7 A 91 9
(0.02 mg L-1) B 84 16
C 85 15
D 84 16
E 83 17
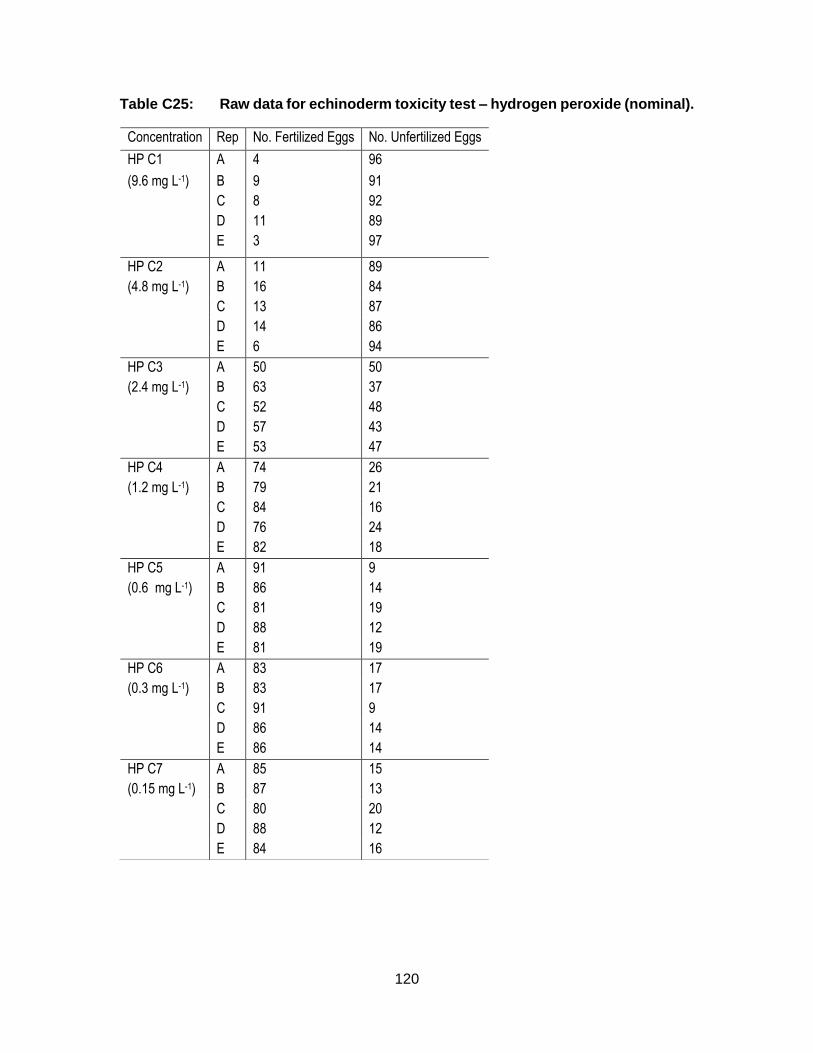
120
Table C25: Raw data for echinoderm toxicity test – hydrogen peroxide (nominal).
Concentration Rep No. Fertilized Eggs No. Unfertilized Eggs
HP C1 A 4 96
(9.6 mg L-1) B 9 91
C 8 92
D 11 89
E 3 97
HP C2 A 11 89
(4.8 mg L-1) B 16 84
C 13 87
D 14 86
E 6 94
HP C3 A 50 50
(2.4 mg L-1) B 63 37
C 52 48
D 57 43
E 53 47
HP C4 A 74 26
(1.2 mg L-1) B 79 21
C 84 16
D 76 24
E 82 18
HP C5 A 91 9
(0.6 mg L-1) B 86 14
C 81 19
D 88 12
E 81 19
HP C6 A 83 17
(0.3 mg L-1) B 83 17
C 91 9
D 86 14
E 86 14
HP C7 A 85 15
(0.15 mg L-1) B 87 13
C 80 20
D 88 12
E 84 16
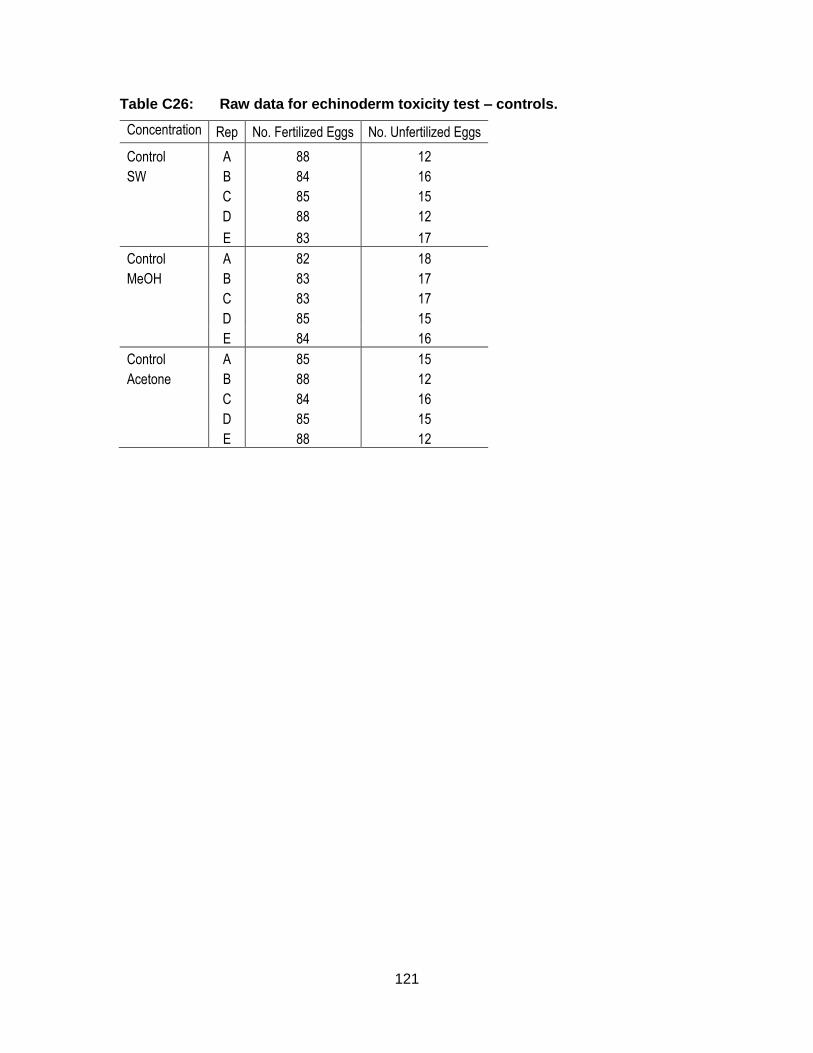
121
Table C26: Raw data for echinoderm toxicity test – controls.
Concentration Rep No. Fertilized Eggs No. Unfertilized Eggs
Control A 88 12
SW B 84 16
C 85 15
D 88 12
E 83 17
Control A 82 18
MeOH B 83 17
C 83 17
D 85 15
E 84 16
Control A 85 15
Acetone B 88 12
C 84 16
D 85 15
E 88 12