Embed Size (px)
Citation preview
Int J Artif Intell Educ (2015) 25:60–117DOI 10.1007/s40593-014-0026-8
RESEARCH ARTICLE
The Eras and Trends of Automatic Short AnswerGrading
Steven Burrows · Iryna Gurevych ·Benno Stein
Published online: 23 October 2014© International Artificial Intelligence in Education Society 2014
Abstract Automatic short answer grading (ASAG) is the task of assessing short nat-ural language responses to objective questions using computational methods. Theactive research in this field has increased enormously of late with over 80 papers fit-ting a definition of ASAG. However, the past efforts have generally been ad-hoc andnon-comparable until recently, hence the need for a unified view of the whole field.The goal of this paper is to address this aim with a comprehensive review of ASAGresearch and systems according to history and components. Our historical analysisidentifies 35 ASAG systems within 5 temporal themes that mark advancement inmethodology or evaluation. In contrast, our component analysis reviews 6 commondimensions from preprocessing to effectiveness. A key conclusion is that an era ofevaluation is the newest trend in ASAG research, which is paving the way for theconsolidation of the field.
Keywords Short answer · Automatic grading · Natural language processing
S. Burrows (�) · I. GurevychUbiquitous Knowledge Processing Lab, German Institute for International Educational Research,60486 Frankfurt, Germanye-mail: [email protected]
I. Gurevyche-mail: [email protected]
S. Burrows · I. GurevychUbiquitous Knowledge Processing Lab, Technical University of Darmstadt, 64289 Darmstadt,Germany
B. SteinWeb Technology and Information Systems, Bauhaus-Universitat Weimar, 99421 Weimar, Germanye-mail: [email protected]
Int J Artif Intell Educ (2015) 25:60–117 61
Introduction
The assessment of learning outcomes with tests and examinations can be facilitatedby many question types and grading methods. The specific question types may bedesigned as anything from simple multiple-choice questions, to questions requiringnatural language responses such as short answers or essays. The grading method maybe either manual grading by hand or automatic grading by computational methods.In this paper we focus on the short answer question type and the automatic gradingmethod. We refer to this field as automatic short answer grading, or ASAG.
The difference between say multiple choice and short answer questions is easy tocomprehend, but the difference between other question types such as short answersand essays can become blurred. Therefore we say that a short answer question isone that can be considered as meeting at least five specific criteria. First, the ques-tion must require a response that recalls external knowledge instead of requiring theanswer to be recognized from within the question. Second, the question must requirea response given in natural language. Third, the answer length should be roughlybetween one phrase and one paragraph. Fourth, the assessment of the responsesshould focus on the content instead of writing style. Fifth, the level of opennessin open-ended versus close-ended responses should be restricted with an objectivequestion design.
Concerning grading methods, some questions are more difficult to grade manu-ally than others. Indeed much variation is present when technology is applied forautomatic grading. A multiple-choice question can be considered easy to grade withcomputational methods since there is only a single correct response to each ques-tion. In contrast, grading natural language responses to short answer questions canbe considered much more difficult, as an understanding of the natural language isrequired.
Research in grading natural language responses with computational methods hasa history dating back to the early work of Page (1966). Since then, automatic gradingof natural language responses has become a large field. In addition, the techniqueshave branched depending on the question type, such as short answers versus essays.This is why we choose to focus this article solely on automatic short answer grading(ASAG).
There are numerous benefits to be obtained from automatic grading in general,automatic grading of natural language responses, and indeed ASAG. These arethemed around summative assessment (for providing grades), formative assessment(for providing feedback), and effectiveness. Concerning summative assessment, thedemands of large class sizes and assessment practices (Burrows and D’Souza 2005)require efficient and cost-effective solutions. In addition, humans make mistakeswhen grading, and consistency is needed when inter-rater agreement is imperfect thatmay result from fatigue, bias, or ordering effects (Haley et al. 2007). Another ben-efit is that the idea of automatic grading in itself may promote the formalization ofassessment criteria when not performed otherwise (Williamson et al. 2012). One mustalso consider the immediacy that automatic grading systems can provide, where testtakers would otherwise need to wait for the human marker to complete the grading(Hirschman et al. 2000). Concerning formative assessment, automatic grading is of
62 Int J Artif Intell Educ (2015) 25:60–117
interest in broader applications such as e-learning and intelligent tutoring systems.Finally concerning effectiveness, automatic grading is becoming very competitivewith human grading for both ASAG (Butcher and Jordan 2010) and AEG (automaticessay grading) (Shermis et al. 2008).
The technology of interest is still subject to open research issues. The ongoingquestion concerns the quality of the scores (Williamson et al. 2012) and faith in theprocess. Indeed, some of the aforementioned advantages do not come without prob-lems. For example, the work needed to create an automated solution often requiresmuch development time, the consistency benefit can be a liability for poorer partsof a model when the poor parts make consistent errors, and care must be takenthat patterns in system behavior are not gamed during assessment with unnaturallanguage (Williamson et al. 2012).
When considering ASAG, one must not only consider the algorithms and technol-ogy, but also the data sets and evaluation techniques that are used to measure effec-tiveness. All of these components can be considered a “pipeline” where each artifactor process feeds the next. The notion of a pipeline is well supported by several fieldsof natural language processing research including relation extraction and templatefilling (Wachsmuth et al. 2013) and efficient information extraction (Wachsmuthet al. 2011).
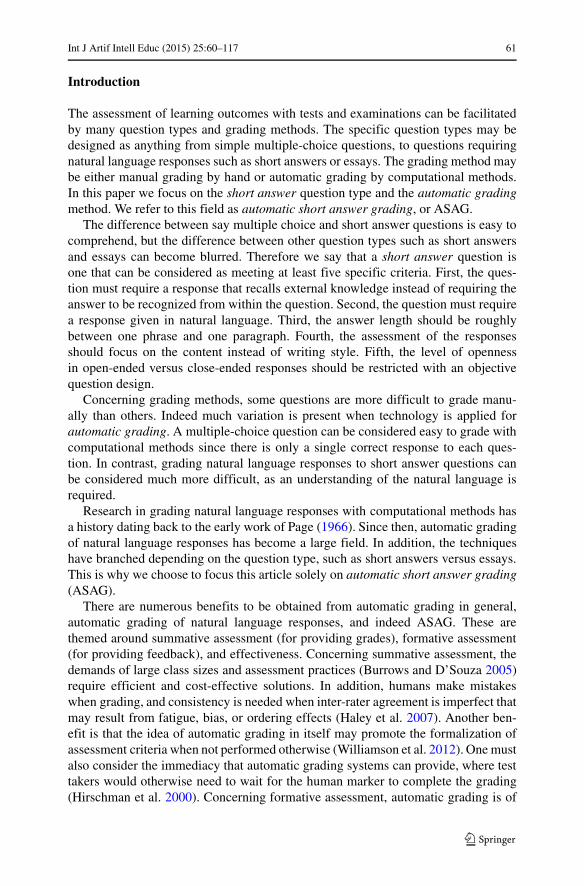
The general form of an ASAG system development pipeline is given in Fig. 1.This pipeline has 11 components comprising 6 artifacts and 5 processes, which wenow summarize. First, test or exam settings (1) with appropriate materials mustbe identified. Then one or more data sets are created (2) by gathering the ques-tions, teacher answers, and student answers together. The data sets (3) are storedon disk in a flat file, XML, or similar format. Natural language processing (NLP)techniques (4/5) are applied to generate post-processed text and statistics compris-ing of normalized word forms, annotations, numerical measurements, and similar.Some amount of the data or domain knowledge is used for model building (6)based on a grading method using machine learning, concept mapping, corpus-based methods, or information extraction techniques. The remainder of the data
Fig. 1 An ASAG system development pipeline represented by 6 artifacts (rectangles) and 5 processes(ovals)
Int J Artif Intell Educ (2015) 25:60–117 63
is then automatically graded (8) to produce a series of predictions (9) based onassigned labels or scores. These predictions are considered during model evalua-tion (10) where the outcome is the calculation of one or more measurements ofeffectiveness (11).
In putting the discussion together, there is much to say about the definitions,history, and components in ASAG. The field of ASAG is large and unique, butno review that is unified, comprehensive, and timely is available. Therefore thegoal of this survey article is to address this shortcoming along the dimensionsof definitions, history, and components. We do so with the corresponding threecontributions:
• We review and define many common question types that can be automaticallygraded, paying particular attention to short answer questions. This contributiondefines how short answer questions fit into a bigger picture described by depthof learning, broad question categories, and specific question types.
• We review 35 ASAG systems as a historical analysis. The organization comprisesour 5 “eras” of ASAG, comprising 4 methodology eras for concept mapping,information extraction, corpus-based methods, and machine learning, plus a fifthera for initiative in evaluation. This contribution demonstrates the longitudinaltrends in ASAG.
• We provide a review of the components of all systems across 6 commondimensions. In reference to the numbering of Fig. 1, these are data sets (3),natural language processing (4), model building (6), grading models (7), modelevaluation (10), and effectiveness (11). This contribution illustrates the trendsacross all of these dimensions including the recent and meaningful effectivenesscomparisons that can be made.
More broadly, there should also be interest in this article for related communitiesthat work with semantic textual similarity and notions of paraphrasing. Exam-ples are the work by Bar et al. (2011, 2012a, 2013), Burrows et al. (2013) andPotthast (2011) on text similarity and paraphrasing, and evaluation competition workby Bar et al. (2012b) on computing text similarity. This body of work complementeda competitive submission (Zesch et al. 2013) in the SemEval ’13 Task 7 competi-tion for ASAG (Dzikovska et al. 2013). Another example is that research in ASAGhas also been cast as a paraphrase recognition problem (Leacock and Chodorow2003). Therefore, the comparison of teacher and student answers in ASAG couldbe supported by the semantic textual similarity and paraphrasing communities. Inaddition to semantic textual similarity and paraphrasing, the field of intelligent tutor-ing systems can also be considered as related as a more interactive form of ASAGsystems. Example intelligent tutoring systems are AutoTutor (Graesser et al. 2005),CIRCSIM-Tutor (Evens et al. 2001), Geometry Explanation Tutor (Aleven et al.2004), and Why2-Atlas (VanLehn et al. 2002).
The next three sections of this article address the contributions listed abovefor definitions (section “An Overview of Automatic Assessment”), history (section“Historical Analysis”), and components (section “Component Analysis”) respec-tively. Lessons learned are given in the final section (section “Lessons Learned”).
64 Int J Artif Intell Educ (2015) 25:60–117
An Overview of Automatic Assessment
The literature on ASAG is vast, and there have been many publications in the lastdecade in particular. We find it necessary to precisely define the type of question weare dealing with in order to proceed. Therefore the purpose of this section is to showhow short answer questions can be distinguished from other types of questions inautomated assessment.
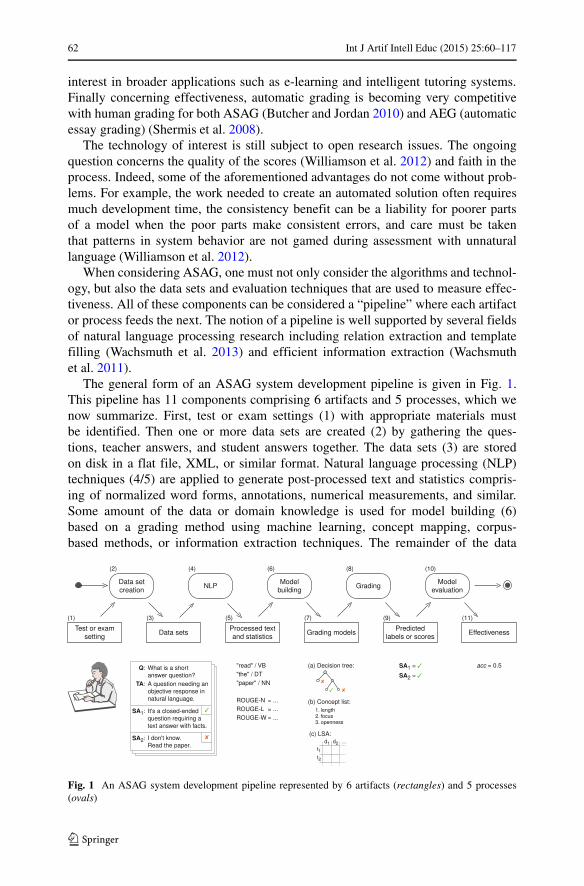
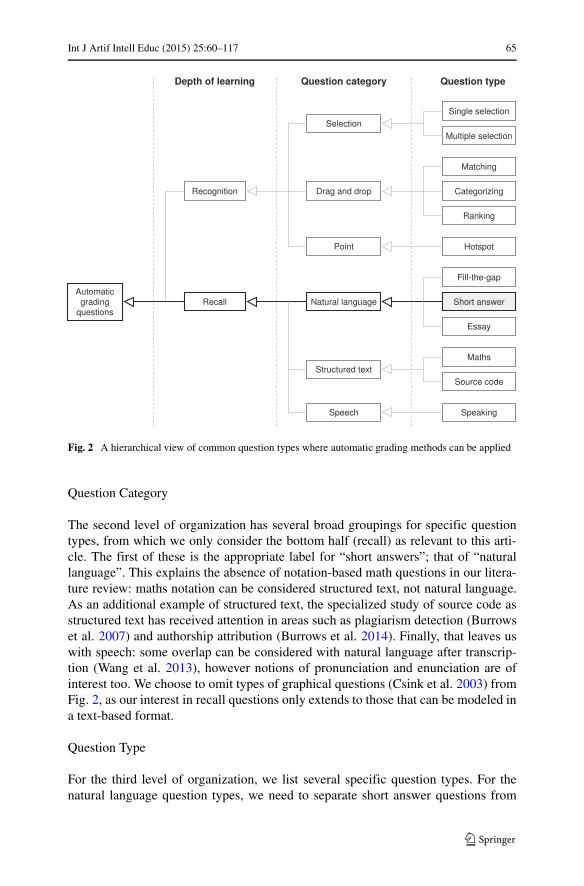
The Educational Testing Service (ETS)1 is one of the largest players in the fieldof automatic assessment. Their website contains a typology of their research in auto-mated scoring and natural language processing2 including writing content (i.e., shortanswers), writing quality (i.e.: essays), mathematics, and speech. Further typologiesinclude those of Bejar (2011) and Zenisky and Sireci (2002), providing much addi-tional detail. In contrast, Gyorgy and Vajda (2007) offer a hierarchy providing agrouping for active and passive questions, and a sub-grouping of active questions thatrequire answers as numbers or text. In summarizing these existing bodies of work,Fig. 2 provides the highlights under three “swim lanes”: “depth of learning”, “ques-tion category”, and “question type”. The figure is not intended to be exhaustive, butthe goal is to simply show sufficient and common examples to differentiate ASAGquestions from others. We now review the three swim lanes emphasizing the partsrelevant to ASAG, which are highlighted in Fig. 2.
Depth of Learning
The first level of organization concerns the depth of learning between “recognition”and “recall” questions, which is terminology supported by the literature (Gay 1980;Jordan 2009a). Alternatively, we may say closed versus open questions (Gonzalez-Barbone and Llamas-Nistal 2008). Yet another distinction is passive versus activequestions as mentioned above (Gyorgy and Vajda 2007). For recognition questions,the respondents usually only need to organize or identify some key information.In contrast, recall questions have the benefit of requiring the respondents to comeup with original answers expressed in their own way. With respect to pedagogy,recall methods represent a higher level in Bloom’s taxonomy of learning objec-tives (Krathwohl 2002). In comparison, recognition questions can be consideredas representing low-level factual knowledge (Martinez and Bennett 1992). Morepractically, recall questions are less susceptible to test taking strategies (Hirschmanet al. 2000) and guessing (Conole and Warburton 2005) compared with recognitionquestions.
For recognition questions, automatic grading is a solved problem, as the answeris always among a set of options. This is emphasized with the “Recognition” part ofFig. 2. Therefore, the momentum in automatic grading is for recall questions due tothis reason and the others above. Short answer questions fall within this category.
1http://www.ets.org2http://www.ets.org/research/topics/as nlp
Int J Artif Intell Educ (2015) 25:60–117 65
Fig. 2 A hierarchical view of common question types where automatic grading methods can be applied
Question Category
The second level of organization has several broad groupings for specific questiontypes, from which we only consider the bottom half (recall) as relevant to this arti-cle. The first of these is the appropriate label for “short answers”; that of “naturallanguage”. This explains the absence of notation-based math questions in our litera-ture review: maths notation can be considered structured text, not natural language.As an additional example of structured text, the specialized study of source code asstructured text has received attention in areas such as plagiarism detection (Burrowset al. 2007) and authorship attribution (Burrows et al. 2014). Finally, that leaves uswith speech: some overlap can be considered with natural language after transcrip-tion (Wang et al. 2013), however notions of pronunciation and enunciation are ofinterest too. We choose to omit types of graphical questions (Csink et al. 2003) fromFig. 2, as our interest in recall questions only extends to those that can be modeled ina text-based format.
Question Type
For the third level of organization, we list several specific question types. For thenatural language question types, we need to separate short answer questions from
66 Int J Artif Intell Educ (2015) 25:60–117
fill-the-gap and essay questions. The difference between these types can be fuzzy,particularly for short answers versus essays when other terminology is used such as“free-text answer” (Sargeant et al. 2004) and “constructed response” (Bennett 2011).Our three key dimensions to distinguish natural language question types are length,focus, and openness. Table 1 summarizes these dimensions, which we now discuss.
The first key dimension to separate the natural language question types is answerlength. For both short answers and essays, the answers must be sufficiently long suchthat a wide variety of unique answers and wordings can be expressed. This is not truefor fill-the-gap questions, since the solutions comprise no more than a few words. Forshort answers, the range in length should be from about one phrase (several words) upto one paragraph to be consistent with the existing literature. The examples we findstate that the length of short answers are “phrases to three to four sentences” (Siddiqiet al. 2010) or “a few words to approximately 100 words” (Sukkarieh and Stoyanchev2009). This leaves essays as defined as two or more paragraphs up to several pages.
The second key dimension is the focus of the grading technique. Here, ASAGsystems tend to focus more on content, whilst automatic essay grading (AEG) sys-tems (Shermis and Burstein 2003, 2013) tend to focus more on style (Gutl 2007;Perez-Marın 2004). This observation is supported by two ETS systems as examplesof ASAG and AEG systems called c-rater (Leacock and Chodorow 2003) and e-rater (Attali and Burstein 2006) respectively. Specifically, (Attali et al. 2008, pp. 1–2)state that the goal of c-rater is to “map student responses onto the experts’ models inorder to determine their correctness or adequacy” whilst the e-rater system is “basedon a generic model of writing that is applied to any prompt that belongs to an assess-ment”. Put another way, (Jordan and Mitchell 2009, p. 372) state that AEG systems“focus on metrics that broadly correlate with writing style, augmented with aggregatemeasures of vocabulary usage” whilst ASAG systems are “concerned with markingfor content above all else”. Yet another comparison is content versus expression andfluency (Williamson et al. 2012). An exception can be made for systems that claimto do both essay and short answer grading (Pearson Education 2010). For fill-the-gapquestions, we simply say that the focus is on specific words.
The third key dimension concerns the openness of the question. Specifically,ASAG systems require answers to objective or close-ended questions. In contrast,AEG systems require answers to subjective or open-ended questions (Leacock andChodorow 2003; Siddiqi and Harrison 2008b; Wood et al. 2006). Put another way,
Table 1 Properties that distinguish types of natural language questions
Question type
Property Fill-the-gap Short answer Essay
Length One word to a few words. One phrase to one paragraph. Two paragraphs to several pages.
Focus Words. Content. Style.
Openness Fixed. Closed. Open.
Int J Artif Intell Educ (2015) 25:60–117 67
the difference is facts and statements versus examples and opinions (Leacock andChodorow 2003). For fill-the-gap questions, we say that the responses are fixed sincethere is essentially no novelty to be expressed.
Exception: Reading Comprehension
Questions on reading comprehension do not fully comply with our pathway in Fig. 2.Reading comprehension fits our definition of “natural language” and “short answer”for the second and third swim lanes, but not “recall” for “depth of learning”. Inreading comprehension, the student is given sample text from which to formulate ananswer to a question. For example, a student might be asked why a character froma story given in a short passage performed a certain action. In this case, the stu-dent must recognize the answer from the passage given, and does not need to recallexisting knowledge.
Despite the definition mismatch, we have included a few key papers with readingcomprehension due to their relevance to ASAG. Specifically, four systems (CAM,CoMiC-DE, CoMiC-EN, CoSeC-DE, introduced in the next section) are linkedthrough the common authorship of Detmar Meurers and stem from his group’s workthat aims to link otherwise quite separate strands of ASAG research together (Ziaiet al. 2012). Another inclusion is the paper by Horbach et al. (2013) that is specifi-cally advertised as “short answer scoring”. The final paper by Madnani et al. (2013)has components common to ASAG research including many features, a well-definedscoring scale, and a familiar evaluation style.
Historical Analysis
To the best of our knowledge, two relevant survey papers are available, namely thework by Valenti et al. (2003) and Perez-Marın et al. (2009). However, these haveASAG and AEG systems mixed together. Aside from this, Ziai et al. (2012) devoteover 4 pages of their workshop paper to reviewing 12 ASAG systems, but this reviewis not complete as we demonstrate. In comparison, our historical review is intendedto be comprehensive and comprises 35 identified ASAG systems and 2 competitions.
We observe the existing ASAG systems as falling into broad themes and timeperiods, from which we model the organization of our literature review. Here, westate that each category is an “era” in the field of ASAG, to emphasize the histor-ical organization. Therefore we define an “era” as a thematically consistent set ofactivities with a particular time period. The era time periods may overlap with oth-ers, but we otherwise keep the activities as disjoint as possible. The ASAG systemsthemselves may sometimes overlap with multiple eras, in which case we refer to thedominant era.
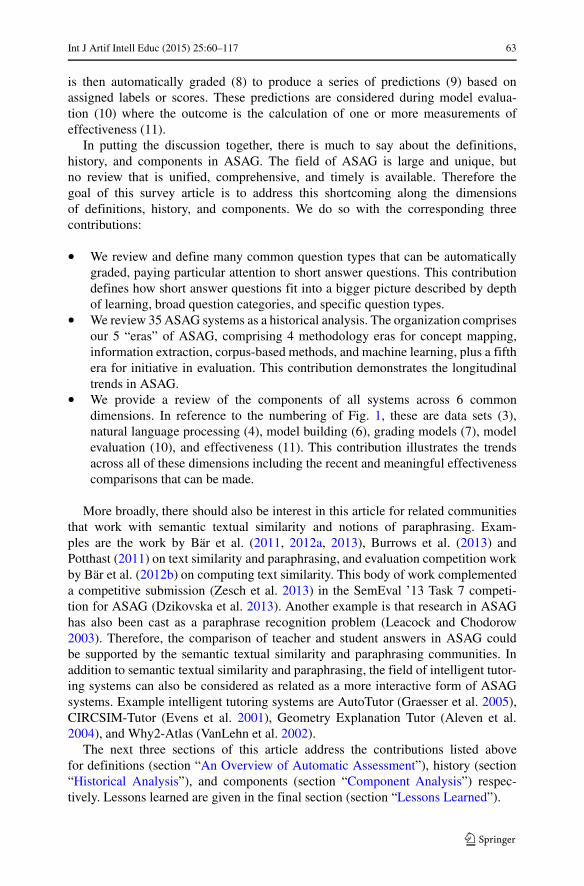
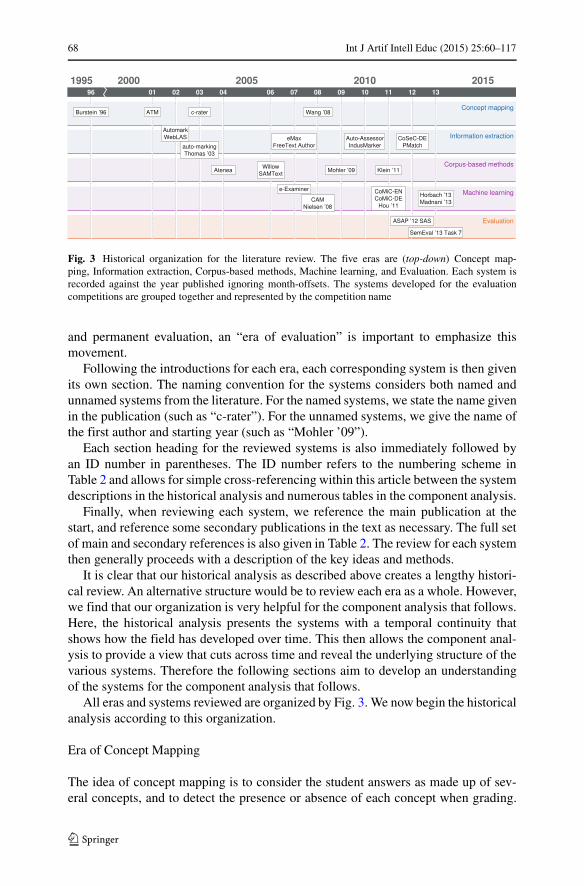
For each era, we first define and explain the key ideas as an introduction. The fiveeras are concept mapping, information extraction, corpus-based methods, machinelearning, and evaluation, as listed in Fig. 3. Based on this list, we point out thatthe first four eras are method-based, but the fifth is evaluation-based. Given thatthere is a current and big movement towards reproducibility, standardized corpora,
68 Int J Artif Intell Educ (2015) 25:60–117
Fig. 3 Historical organization for the literature review. The five eras are (top-down) Concept map-ping, Information extraction, Corpus-based methods, Machine learning, and Evaluation. Each system isrecorded against the year published ignoring month-offsets. The systems developed for the evaluationcompetitions are grouped together and represented by the competition name
and permanent evaluation, an “era of evaluation” is important to emphasize thismovement.
Following the introductions for each era, each corresponding system is then givenits own section. The naming convention for the systems considers both named andunnamed systems from the literature. For the named systems, we state the name givenin the publication (such as “c-rater”). For the unnamed systems, we give the name ofthe first author and starting year (such as “Mohler ’09”).
Each section heading for the reviewed systems is also immediately followed byan ID number in parentheses. The ID number refers to the numbering scheme inTable 2 and allows for simple cross-referencing within this article between the systemdescriptions in the historical analysis and numerous tables in the component analysis.
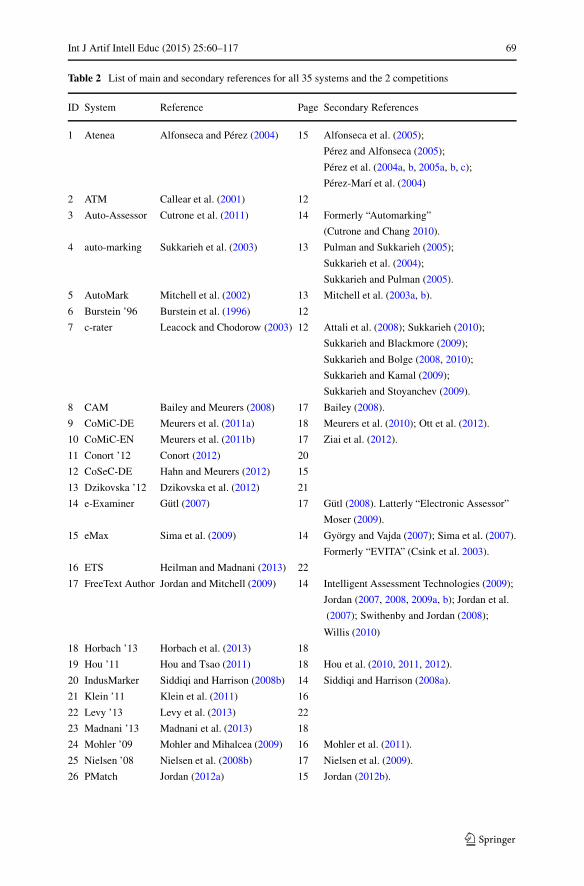
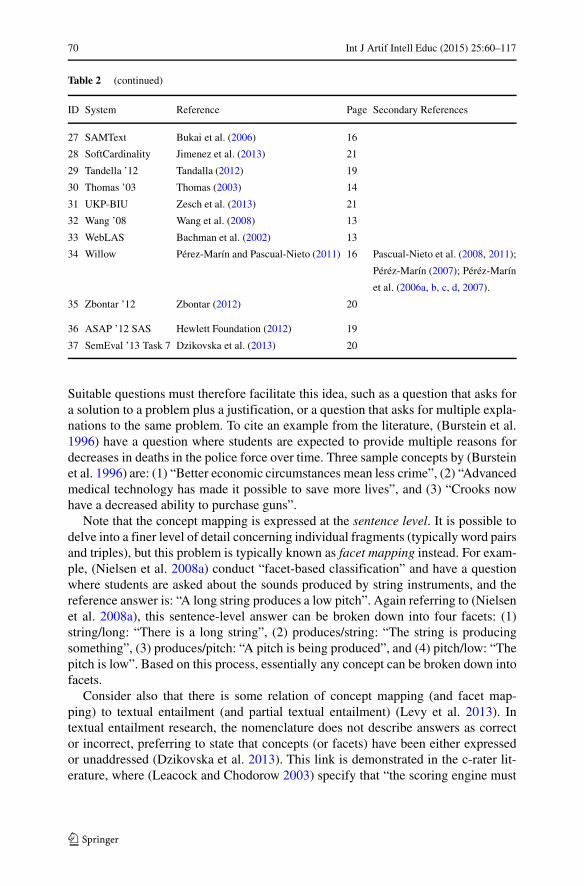
Finally, when reviewing each system, we reference the main publication at thestart, and reference some secondary publications in the text as necessary. The full setof main and secondary references is also given in Table 2. The review for each systemthen generally proceeds with a description of the key ideas and methods.
It is clear that our historical analysis as described above creates a lengthy histori-cal review. An alternative structure would be to review each era as a whole. However,we find that our organization is very helpful for the component analysis that follows.Here, the historical analysis presents the systems with a temporal continuity thatshows how the field has developed over time. This then allows the component anal-ysis to provide a view that cuts across time and reveal the underlying structure of thevarious systems. Therefore the following sections aim to develop an understandingof the systems for the component analysis that follows.
All eras and systems reviewed are organized by Fig. 3. We now begin the historicalanalysis according to this organization.
Era of Concept Mapping
The idea of concept mapping is to consider the student answers as made up of sev-eral concepts, and to detect the presence or absence of each concept when grading.
Int J Artif Intell Educ (2015) 25:60–117 69
Table 2 List of main and secondary references for all 35 systems and the 2 competitions
ID System Reference Page Secondary References
1 Atenea Alfonseca and Perez (2004) 15 Alfonseca et al. (2005);
Perez and Alfonseca (2005);
Perez et al. (2004a, b, 2005a, b, c);
Perez-Marı et al. (2004)
2 ATM Callear et al. (2001) 12
3 Auto-Assessor Cutrone et al. (2011) 14 Formerly “Automarking”
(Cutrone and Chang 2010).
4 auto-marking Sukkarieh et al. (2003) 13 Pulman and Sukkarieh (2005);
Sukkarieh et al. (2004);
Sukkarieh and Pulman (2005).
5 AutoMark Mitchell et al. (2002) 13 Mitchell et al. (2003a, b).
6 Burstein ’96 Burstein et al. (1996) 12
7 c-rater Leacock and Chodorow (2003) 12 Attali et al. (2008); Sukkarieh (2010);
Sukkarieh and Blackmore (2009);
Sukkarieh and Bolge (2008, 2010);
Sukkarieh and Kamal (2009);
Sukkarieh and Stoyanchev (2009).
8 CAM Bailey and Meurers (2008) 17 Bailey (2008).
9 CoMiC-DE Meurers et al. (2011a) 18 Meurers et al. (2010); Ott et al. (2012).
10 CoMiC-EN Meurers et al. (2011b) 17 Ziai et al. (2012).
11 Conort ’12 Conort (2012) 20
12 CoSeC-DE Hahn and Meurers (2012) 15
13 Dzikovska ’12 Dzikovska et al. (2012) 21
14 e-Examiner Gutl (2007) 17 Gutl (2008). Latterly “Electronic Assessor”
Moser (2009).
15 eMax Sima et al. (2009) 14 Gyorgy and Vajda (2007); Sima et al. (2007).
Formerly “EVITA” (Csink et al. 2003).
16 ETS Heilman and Madnani (2013) 22
17 FreeText Author Jordan and Mitchell (2009) 14 Intelligent Assessment Technologies (2009);
Jordan (2007, 2008, 2009a, b); Jordan et al.
(2007); Swithenby and Jordan (2008);
Willis (2010)
18 Horbach ’13 Horbach et al. (2013) 18
19 Hou ’11 Hou and Tsao (2011) 18 Hou et al. (2010, 2011, 2012).
20 IndusMarker Siddiqi and Harrison (2008b) 14 Siddiqi and Harrison (2008a).
21 Klein ’11 Klein et al. (2011) 16
22 Levy ’13 Levy et al. (2013) 22
23 Madnani ’13 Madnani et al. (2013) 18
24 Mohler ’09 Mohler and Mihalcea (2009) 16 Mohler et al. (2011).
25 Nielsen ’08 Nielsen et al. (2008b) 17 Nielsen et al. (2009).
26 PMatch Jordan (2012a) 15 Jordan (2012b).
70 Int J Artif Intell Educ (2015) 25:60–117
Table 2 (continued)
ID System Reference Page Secondary References
27 SAMText Bukai et al. (2006) 16
28 SoftCardinality Jimenez et al. (2013) 21
29 Tandella ’12 Tandalla (2012) 19
30 Thomas ’03 Thomas (2003) 14
31 UKP-BIU Zesch et al. (2013) 21
32 Wang ’08 Wang et al. (2008) 13
33 WebLAS Bachman et al. (2002) 13
34 Willow Perez-Marın and Pascual-Nieto (2011) 16 Pascual-Nieto et al. (2008, 2011);
Perez-Marın (2007); Perez-Marın
et al. (2006a, b, c, d, 2007).
35 Zbontar ’12 Zbontar (2012) 20
36 ASAP ’12 SAS Hewlett Foundation (2012) 19
37 SemEval ’13 Task 7 Dzikovska et al. (2013) 20
Suitable questions must therefore facilitate this idea, such as a question that asks fora solution to a problem plus a justification, or a question that asks for multiple expla-nations to the same problem. To cite an example from the literature, (Burstein et al.1996) have a question where students are expected to provide multiple reasons fordecreases in deaths in the police force over time. Three sample concepts by (Bursteinet al. 1996) are: (1) “Better economic circumstances mean less crime”, (2) “Advancedmedical technology has made it possible to save more lives”, and (3) “Crooks nowhave a decreased ability to purchase guns”.
Note that the concept mapping is expressed at the sentence level. It is possible todelve into a finer level of detail concerning individual fragments (typically word pairsand triples), but this problem is typically known as facet mapping instead. For exam-ple, (Nielsen et al. 2008a) conduct “facet-based classification” and have a questionwhere students are asked about the sounds produced by string instruments, and thereference answer is: “A long string produces a low pitch”. Again referring to (Nielsenet al. 2008a), this sentence-level answer can be broken down into four facets: (1)string/long: “There is a long string”, (2) produces/string: “The string is producingsomething”, (3) produces/pitch: “A pitch is being produced”, and (4) pitch/low: “Thepitch is low”. Based on this process, essentially any concept can be broken down intofacets.
Consider also that there is some relation of concept mapping (and facet map-ping) to textual entailment (and partial textual entailment) (Levy et al. 2013). Intextual entailment research, the nomenclature does not describe answers as corrector incorrect, preferring to state that concepts (or facets) have been either expressedor unaddressed (Dzikovska et al. 2013). This link is demonstrated in the c-rater lit-erature, where (Leacock and Chodorow 2003) specify that “the scoring engine must
Int J Artif Intell Educ (2015) 25:60–117 71
be able to recognize when a concept is expressed [emphasis added] and when it isnot”. The link is further demonstrated by (Levy et al. 2013) whom translate theirentailment expertise to ASAG grading.
Burstein ’96 (6) Burstein et al. (1996) consider hypothesis-style questions wheremultiple explanations must be given for a given hypothesis, each of which mayor may not match one of the teacher answers. Each answer can be considered aseparate concept. The applied technique is the Lexical Conceptual Structure repre-sentation (Dorr et al. 1995) whereby a concept-based lexicon and a concept grammarmust be developed from a training set before grading the hypotheses in the studentanswers.
ATM (2) ATM (Automatic Text Marker) (Callear et al. 2001) breaks down teacherand student answers into lists of minimal concepts comprising no more than a fewwords each, and counts the number of concepts in common to provide an assessmentscore. Each concept is essentially the smallest possible unit in an answer that can beassigned a weight for the purposes of grading. The weights are summed to producethe overall score.
c-rater (7) The Concept Rater (c-rater) (Leacock and Chodorow 2003) aims atmatching as many sentence-level concepts as possible between teacher and studentanswers. The matching is based on a set of rules and a canonical representationof the texts using syntactic variation, anaphora, morphological variation, synonyms,and spelling correction. Specifically, the teacher answers are entered as a separatesentence for each concept. This simplifies the assessment since only one conceptis considered at a time when grading. This technique avoids the need for an indi-rect solution, such as dividing the question into multiple parts (Jordan 2009b) andit is argued that this can lead to higher accuracy (Sukkarieh and Blackmore 2009).Furthermore, the natural language input format is advantageous compared withother systems that require expertise and use of a markup language (Sukkarieh andStoyanchev 2009).
An important development that follows is the use of automated concept-basedscoring for model building, to replace manual holistic scoring, that is described astaking 12 hours of human time per question (Sukkarieh and Stoyanchev 2009). Themanual holistic scoring required a user to manually express equivalent sentences andthe lexicon as the basis of a model. The automated method instead only requiresmanual concept-based scoring, but then the lexicon is automatically generated. Theautomatic generation of the lexicon is performed by creating a stratified sampling ofthe sentences, and selecting the lexicon based on one of several selection strategiesthat are compared empirically. Results indicate that the unweighted kappa values forthe automatically built models are “comparable” to the manually built models for11/12 scenarios. The remaining scenario had seven concepts, which was the high-est number of concepts among all scenarios, so these results suggest that furtherexperimentation may be warranted for questions with many concepts.
Later, the c-rater work regards the grading problem as textual entailment(Sukkarieh and Bolge 2008). Here, the “GoldMap” concept mapping algorithm
72 Int J Artif Intell Educ (2015) 25:60–117
(Sukkarieh and Stoyanchev 2009) uses calculations of maximum entropy (Sukkarieh2010) between teacher and student answers for grading.
Wang ’08 (32) Wang et al. (2008) compare three methods for grading earth sciencequestions in secondary education, which are based on concept mapping, machinelearning, or both. The first concept mapping method is cosine on tf.idf (term fre-quency multiplied by inverse document frequency) vectors of bag-of-words features.The second concept mapping method is a support vector machine (SVM) with bag-of-words features. Note that the second concept mapping method is remarkable asit is implemented with machine learning, and can be considered a blend of conceptmapping and machine learning. The third and final method is a pure machine learn-ing method employing SVM regression with unigrams, bigrams, and part-of-speechbigrams. Unlike the first two methods, the pure machine learning method gradesholistically, and all concepts are considered together as a single answer.
Era of Information Extraction
In the context of this article, information extraction (Cowie and Wilks 2000) is con-cerned with fact finding in student answers. Given that short answers are usuallyexpected to include specific ideas, these can be searched for and modeled by tem-plates. Simply, information extraction methods in this article can be considered as aseries of pattern matching operations such as regular expressions or parse trees. Moregenerally, information extraction techniques can extract structured data from unstruc-tured sources, such as free text, and represent the structured data as tuples for use innumerous applications.
AutoMark (5) AutoMark (Mitchell et al. 2002) performs pattern matching as a formof information extraction on parse tree representations of teacher and student answersfor grading. Two approaches are described, namely the “blind” and “moderated”approaches. The blind approach represents the best definition of ASAG in that it isfully automated. In contrast, the moderated approach includes a human-driven stepthat allows the model to be revised after grading has been performed. Therefore,the overall approach allows for optional improvement when human resources areavailable.
WebLAS (33) WebLAS (Web-based Language Assessment System) (Bachman et al.2002) identifies important segments of the teacher answers through parsed repre-sentations, and asks the teacher to confirm each and assign weights. The teacher isalso prompted to accept or reject semantically similar alternatives. Regular expres-sion matching is performed to detect the presence or absence of each segment inthe student answers. Partial grading is possible as each segment is accounted forseparately.
auto-marking (4) Auto-marking (Sukkarieh et al. 2003) uses hand-crafted patternsthat are fitted to a training set for model building. Two patterns are formed for eachquestion as each question is worth two marks. Empirical evaluation shows that the
Int J Artif Intell Educ (2015) 25:60–117 73
approach is more effective than a k-nearest neighbor baseline with bag-of-words fea-tures weighted by tf.idf. (Sukkarieh et al. 2004) also explore the idea of formingthe patterns using bootstrapping. However the amount of data is not reported, whichmakes it difficult to compare this approach to the hand-crafted approach.
Thomas ’03 (30) Thomas (Thomas 2003) addresses ASAG as a boolean patternmatching problem with thesauri support. That is, the required phrases are definedas boolean-AND expressions, and acceptable alternatives are added as boolean-ORexpressions. Awarding credit to correct solutions therefore requires a perfect match.
eMax (15) eMax (Sima et al. 2009) requires the teacher to mark-up required seman-tic elements3 of the teacher answers, accept or reject synonyms to these elements asprompted, and assign weights to each element for calculating the final score (Simaet al. 2007). The approach to grading is a combinatoric one, where all possible for-mulations are considered when pattern matching is performed. The assigned scoresare also given a confidence rating, so that difficult cases can be forwarded for manualreview.
FreeText Author (17) FreeText Author (Jordan and Mitchell 2009) (formerlyAutoMark as above) provides a graphical user interface for teacher answer input andstudent answer grading. The teacher answers are composed as syntactic-semantictemplates for the student answers to be matched against. These templates are auto-matically generated from the natural language input of teacher answers, thereforeno user expertise in natural language processing is required. Through the interface,the teacher can specify mandatory keywords from the teacher answers and selectfrom synonyms provided by thesauri support. Both acceptable and unacceptableanswers can be defined, and student answers are awarded credit according to templatematches.
Auto-Assessor (3) Auto-Assessor (Cutrone et al. 2011) focuses on grading canoni-calized single-sentence student answers based on bag-of-words coordinate matchingand synonyms with WordNet (Pedersen et al. 2004). Coordinate matching in ASAGsimply refers to matching individual terms between teacher and student answers. InAuto-Assessor, each word that matches exactly is given one point, related words fromWordNet are given partial credit, and the rest are given no credit.
IndusMarker (20) IndusMarker (Siddiqi and Harrison 2008a) is used to performword- and phrase-level pattern matching to grade student answers. This is referredto as “structure matching”. The credit-worthy phrases are defined using an XMLmarkup language called the Question Answer Markup Language. Using the “struc-ture editor”, the text and number of points can be input for each phrase.
3A “semantic element” (Sima et al. 2009) refers to a fragment of the answer and other meanings that canbe extrapolated.
74 Int J Artif Intell Educ (2015) 25:60–117
CoSeC-DE (12) CoSeC-DE (Comparing Semantics in Context) (Hahn and Meurers2012) uses the Lexical Resource Semantics (LRS) method (Richter and Sailer 2003)to create abstract representations of texts. The idea is exemplified by comparing thefollowing three sentences:
(1) “The hare beats the tortoise.”(2) “The tortoise beats the hare.”(3) “The tortoise was beaten by the hare.”
Here, (1) and (2) are equivalent according to a bag-of-words model, but (1) and(3) are equivalent under a LRS model. Specifically, LRS representations of teacherand student answers are modeled as graphs, and a threshold-based alignment isperformed to detect equivalent meanings.
PMatch (26) PMatch (Jordan 2012a) is considered a successor to FreeText Author(above) at the Open University. This system is capable of grading very short answersof up to one sentence in length. The system performs word-level pattern matchingwhere all required words, word stems, and allowed synonyms for correct answers arematched by regular expressions against the teacher answers.
Era of Corpus-Based Methods
Corpus-based methods exploit statistical properties of large document corpora.Although such methods are often used for applications with longer texts (Bukaiet al. 2006), these methods can also be useful when interpreting synonyms in shortanswers, as using only the original teacher answer vocabulary will limit the correctanswers that can be identified. A typical technique to increase the vocabulary is touse bilingual parallel corpora to analyze the frequency of term pairs being resolvedto the same common second-language translation. Then synonyms with particularlycommon translations can be incorporated into the teacher answers.
Atenea (1) Atenea (Alfonseca and Perez 2004) initially uses the BLEU (BiLingualEvaluation Understudy) metric (Papineni et al. 2002) for scoring. This metric is basedon n-gram overlap and normalized sample length. Then the [0,1] interval value isscaled to the appropriate point range. Importantly, (Alfonseca and Perez 2004) arguethat BLEU should be both precision and recall accommodating, as the original BLEUonly considers precision. The extension is referred to as ERB (Evaluating Responseswith Bleu) (Perez-Marın 2004). Atenea is shown to be more effective than coordinatematching and vector space model baselines (Perez et al. 2004a; Perez-Marın 2004).
Later, Latent Semantic Analysis (LSA) (Landauer et al. 1998) is added and aweighted combination of BLEU and LSA scores is taken instead (Perez et al. 2005a).LSA is a corpus-based approach akin to a vector space model that accommodatesfor lexical variability. The approach to combine BLEU and LSA offers a consistentimprovement compared to the previous work (Perez et al. 2005a, c). Since a weightedcombination of BLEU and LSA is taken instead of the individual features as part ofa machine learning solution, we consider Atenea as a corpus-based method.
Int J Artif Intell Educ (2015) 25:60–117 75
Willow (34) Willow (Perez-Marın and Pascual-Nieto 2011) is the successor toAtenea (described above). However, the research on ASAG is only incremental,as much of the new work takes on a pedagogic flavor instead. For example, thecurrent performance of the students is consulted to select the difficulty of new ques-tions (Perez-Marın et al. 2006c), topic suggestions are given to the students forcontinued study (Pascual-Nieto et al. 2011), and self-assessment functionality isintroduced (Pascual-Nieto et al. 2008).
SAMText (27) SAMText (Short Answer Measurement of TEXT) (Bukai et al. 2006)applies a variant of LSA based on an inverted index data structure, which is seededby content from a web crawl using topically-relevant documents. In contrast, LSAnormally uses a matrix data structure based on large corpora for modeling seman-tic relatedness. Bukai et al. (2006) argue that the inverted index and crawlingidea is more suitable for short answers compared with long answers because webcrawls can be tailored to each topic instead of trying to model all language atonce.
Mohler ’09 (24) Mohler and Mihalcea (2009) develop several systems to inves-tigate unsupervised grading methods by individually comparing eight knowledge-based and two corpus-based semantic similarity measures. The knowledge-basedmeasures are Hirst and St-Onge (1998), Jiang and Conrath (1997), Leacock andChodorow (1998), Lesk (1986), Lin (1998), Resnik (1995), shortest path (Mohlerand Mihalcea 2009), and (Wu and Palmer 1994). The two corpus-based measures areExplicit Semantic Analysis (ESA) (Gabrilovich and Markovitch 2006) and LSA.Apart from comparing these measures, (Mohler and Mihalcea 2009) also considerincorporating the best student answers with the teacher answer to expand the teacheranswer vocabulary, which they find to be effective.
Klein ’11 (21) Klein et al. (2011) implement an LSA system where the key idea isto use the student answers as the LSA model instead of general texts from anothersource. Some of the texts are then marked manually and this forms the model forautomatically grading the remainder. The key problems are to select specific textsto mark manually and determine the overall quantity. Concerning the quantity, theprocess is repeated until a specific correlation threshold is achieved. Concerning theselection, three approaches are considered: random selection, clustering, or selectingthe least similar text to those marked already. This third approach is shown to be themost effective.
The benefit of the Klein ’11 approach is that the set of submissions to bemarked manually is chosen automatically and is minimized. The disadvantage ofthe approach is apparent in the evaluation, whereby the desired effectiveness levelis only achieved after manually marking the majority of the students’ answers. Thisamounts to 83 % when all presented scenarios are summed. Another problem is thatthe method is parameter-dependent, in that the semantic space dimensionality andthe similarity threshold parameter must be determined.
76 Int J Artif Intell Educ (2015) 25:60–117
Era of Machine Learning
Machine learning systems typically utilize some number of measurements extractedfrom natural language processing techniques and similar, which are then combinedinto a single grade or score using a classification or regression model. This can besupported by a machine learning toolkit such as Weka (Hall et al. 2009). Featuresinvolving bag-of-words and n-grams are typical of this category, as are decision treesand support vector machines as representative learning algorithms.
e-Examiner (14) e-Examiner (Gutl 2007) uses ROUGE metrics (Lin 2004) asmachine learning features. These are combined as a linear regression. Much of theremainder of this work is focused on system architecture, where the flexible designallows the service to be used in a stand-alone fashion, or as a component in an existingsystem such as an e-learning platform.
CAM (8) CAM (Content Assessment Module) (Bailey and Meurers 2008) uses ak-nearest neighbor classifier and features that measure the percentage overlap of con-tent on various linguistic levels between the teacher and student answers. The typesof overlap include word unigrams and trigrams, noun-phrase chunks, text similaritythresholds, parts of speech, lemmas, and synonyms. It is also interesting to note theunusual terminology used to describe the two evaluation tasks. First, “semantic errordetection” represents a 2-way test of correctness (i.e.: binary classification). Second,“semantic error diagnosis” represents a 5-way test against an expanded set of classlabels for the negative class (i.e.: 5-class classification). Therefore the experimentsrepresent summative and formative grading schemes respectively.
Nielsen ’08 (25) Nielsen et al. (2008b) evaluate their machine learning system onthe SciEntsBank data that later became part of the SemEval ’13 Task 7 competi-tion (Dzikovska et al. 2013). The classification task is 5-way based on primary schoolscience questions for grades 3–6, with labels “understood”, “contradicted”, “self con-tradicted”, “different argument”, and “unaddressed” (these are later remapped forSemEval ’13 Task 7). In the system, the choice of features includes both lexicalizedfeatures (parts of speech, stem matches, and entailment probabilities) and syntacticfeatures (dependency relation type and edit distance). A C4.5 decision tree is usedfor classification.
CoMiC-EN (10) CoMiC-EN (Meurers et al. 2011b) and CoMiC-DE (next system)come from the Comparing Meaning in Context project (CoMiC).4 CoMiC-EN is aniteration of CAM and the implementation is similar. The main goal of CoMiC-EN isnot to necessarily be more effective than CAM, but to switch to an architecture andtoolset with sufficient flexibility for integration in intelligent tutoring systems. Theevaluation is also on the CAM data (Bailey and Meurers 2008), now called CREE(Corpus of Reading comprehension Exercises in English). The 2-way and 5-way
4http://purl.org/icall/comic
Int J Artif Intell Educ (2015) 25:60–117 77
evaluation performed with CAM is also the same, now called “binary classification”and “detailed classification”.
CoMiC-DE (9) CoMiC-DE (Meurers et al. 2011a) is essentially the German-language counterpart to CoMiC-EN. The preprocessing, feature selection, andclassification steps are all the same, with necessary changes in the toolsets for theGerman language (e.g.: using GermaNet (Hamp and Feldweg 1997) instead of Word-Net). The evaluation corpus is changed from CREE to CREG (Corpus of Readingcomprehension Exercises in German) (Meurers et al. 2010).
Hou ’11 (19) (Hou and Tsao 2011) implement a system used for providingteachers with an indicator of student progress, but there is obvious extensionfor use as a typical ASAG system. Four classes of features are extracted com-prising POS tags, term frequency, tf.idf, and entropy, which are combined withan SVM classifier. We say that the experimental setup is suited to providingteachers with a progress indicator because the 10-point marking scale has onlybeen explored coarsely in the experiments. That is, for the 2-way experiment thebuckets 0-5 and 6-10 are predicted, and for the 3-way experiment the upper bucketis split as 6-7 and 8-10. So regression may be a good option to extend the work forASAG in this setting.
Horbach ’13 (18) Horbach et al. (2013) include the reading texts from reading com-prehension questions in their data sets as their key idea. For all other types of ASAGquestions, the data comprises three components: (1) the questions, (2) the teacheranswers, and (3) the student answers. However, in reading comprehension questions,another component is available: (4) the reading texts. Horbach et al. (2013) describethis as helpful because the student answers may only refer to one part of the read-ing texts. So normally, ASAG systems exploit the relationship between (2) and (3),however in this paper the pairs (2)/(4) and (3)/(4) are also exploited.
Much of the remainder of the work is actually based on CoMiC-DE (above). Thatis, the CREG data set is re-used, and the methodology is based on global align-ment (with sentence alignment features comprising simple agreement, entropy, andalignment error in number of sentences) and the k-nearest neighbor classifier. Thenew work required additional annotation on the CREG data set to mark the sentencealignments between (2) and (4) to assist with feature extraction. However, the align-ments are also automated as an alternative approach, and these results indicate thatthe effectiveness is essentially the same or marginally better than CoMiC-DE.
Madnani ’13 (23) Madnani et al. (2013) implement a system for grading readingcomprehension questions about living standards. Each text has three paragraphs, andthe student answers specifically require one sentence giving an overall summary andthree more sentences giving a summary of each paragraph. The machine learningapproach comprises eight features (BLEU, ROUGE, measurements concerning dif-ferent dimensions of text copying, number of sentences, and counts of commonlyused discourse connector words) as input to a logistic regression classifier.
78 Int J Artif Intell Educ (2015) 25:60–117
Era of Evaluation
Unlike the preceding four eras that describe methods, the era of evaluation is method-independent. In particular, this means the use of shared corpora, so that advancementsin the field can be compared meaningfully. This also refers to competitions and eval-uation forums whereby research groups from all around the world compete againstone another on a particular problem for money or prestige.
ASAP ASAP (Automated Student Assessment Prize) is an automatic grading compe-tition series organized by the commercial competition hosting company Kaggle.5 TheKaggle community is made up of client companies and participating data scientists.The client companies pay a fee to host and get support for their particular competi-tion, and the data scientists participate freely and compete to create the most desiredsolution and possibly win a monetary prize. In return, the client companies benefitfrom having custom-created solutions created by world-leading data scientists. Thethree ASAP competitions comprise of AEG from January to April in 2012,6 ASAGfrom June to October also in 2012,7 and symbolic mathematical and logic reasoningfor charts and graphs in the future.8
ASAP ’12 SAS (36) For the ASAG offering of ASAP,9 the ten questions comprisedof varied subject matter at the high school level from arts to science. The participantswere given 1,800 student answers for training, which were randomly taken from apool of 3,000. Each student answer is associated with the score to predict and a con-fidence score. Then 6,000 student answers were used for the testing phase. Quadraticweighted kappa is used to evaluate agreement between the predicted scores and theresolved scores from 2 human judges. The top methodology papers are also avail-able, however a few participants chose to keep their code and methodology private.This resulted in a modified top-5 ranking that excludes good submissions that ranked1st, 5th, and 6th from the original leaderboard. We review the top three performingsystems from the modified ranking: Tandella ’12, Zbontar ’12, and Conort ’12.
ASAP ’12 SAS: Tandella ’12 (29) Tandalla (2012) uses a machine learning solutionwith regression. Features comprised of a set of hand-crafted expressions that givebinary measurements as to whether an important pattern is present in the answer.This implies that the system is highly fitted to the questions. An interesting ideais to include the assessments for both judges in the model even when there is dis-agreement, which would create a model that naturally favors the cases where there isagreement, whilst also taking the disagreement into account. The overall regressionmodel comprised predictions of two random forest and two gradient boosting models.
5http://www.kaggle.com6http://www.kaggle.com/c/asap-aes7http://www.kaggle.com/c/asap-sas8http://www.kaggle.com/c/asap-sas/forums/t/4266/phase-39The organizers say “short answer scoring” (SAS) instead of ASAG.
Int J Artif Intell Educ (2015) 25:60–117 79
ASAP ’12 SAS: Zbontar ’12 (35) Zbontar (2012) uses a stacking method to com-bine several models into a final ridge regression (Marquardt and Snee 1975) model.Several bag-of-words representations are formulated based on character n-grams thatcomprised just the character n-grams themselves, or in combination with some ofthe natural language processing strategies or latent semantic indexing (Papadimitriouet al. 1998). The base learners that formed the combined model are ridge regression,support vector regression, gradient boosting, random forests, and k-nearest-neighbor.(Zbontar 2012) observes that the stacking method has been successful in othercompetitions, hence the decision to implement it for the ASAP ’12 SAS competition.
ASAP ’12 SAS: Conort ’12 (11) Conort (2012) is another to use stacking. The stack-ing model uses 81 different models as features, and ordinary least squares (Hayashi2000) is used to create the final combined model. Original features include n-gramsplus counts and ratios such as characters, words, word length, verb occurrences, tran-sition words, spelling errors, and some types of punctuation. The machine learningalgorithms that are used to produce the final model were regularized general-ized linear models, support vector machines, random forests, and gradient boostingmachines.
RTE RTE is a series of competitions on recognizing textual entailment. RTE began in2005 with a corpus of 1,367 pairs of texts where the task is to determine if the hypoth-esis text can be inferred from a second given text (Dagan et al. 2006). Judgments arebinary and the corpus is class-balanced. Evaluation is based on accuracy and averageprecision of confidence-ranked submissions. Since then, variations of the competitionran annually for the next six consecutive years (Bar-Haim et al. 2006; Giampiccoloet al. 2007, 2008; Bentivogli et al. 2009, 2010, 2011). New data sets were intro-duced as well as new sub-tasks or pilot-tasks such as differentiating unaddressed andcontradicting entailment, providing justifications, entailment search, detecting novelinformation, and knowledge-base population.
RTE took a break in 2012, but returned in 2013 as a shared RTE and ASAG task.This time the RTE task is based on the notion of partial textual entailment, wherenot one but many hypotheses must be inferred or otherwise from a text. This broadidea has similarity to concept mapping in ASAG as mentioned above. This task onlyreceived one submission, and we do not review it as it is not an ASAG system bydefinition. However, the SemEval ’13 Task 7 ASAG task is reviewed extensively asfollows.
SemEval ’13 Task 7 (37) SemEval ’13 Task 7 is the Joint Student Response Anal-ysis and Eighth Recognizing Textual Entailment Challenge (Dzikovska et al. 2013),which was a part of the semantic evaluation (SemEval 2013) workshop series. Thiscompetition was the first large-scale and non-commercial ASAG competition. Thecorpora comprised data from a tutorial dialog system for high school physics (Beetle)and primary school science questions from grades 3–6 (SciEntsBank). Approxi-mately 8,000 student answers are included across all questions. A 5-way categoricalgrading scheme is defined with labels “correct”, “partially correct incomplete”, “con-tradictory”, “irrelevant”, and “non domain”. In addition, 3-way and 2-way grading
80 Int J Artif Intell Educ (2015) 25:60–117
schemes are included based upon collapsed versions of the above. Yet another dimen-sion to the data is the degree of domain adaptation (Prettenhofer and Stein 2011)required in the solutions. That is, some of the test data is for unseen answers tothe same questions, some is for unseens questions in the same domain, and therest is for questions in unseen domains. Therefore a significant advancement forASAG research is the notion of unseen domains that provides a framework to pursuesolutions that are genuinely generalizable.
We now turn to some of the specific systems, including Dzikovska ’12 (Dzikovskaet al. 2012) as the strongest baseline, three of the top entries, and Levy ’13 (Levyet al. 2013), which was created outside of the competition. In determining threestrongly performing systems to report as top entries, we consider the most difficultand novel dimensions to the competition, since there is no notion of an overall win-ner. Specifically, we concentrate on the 5-way task as being the most difficult, theunseen domains as being the most novel and generalizable part of the competition,and the macro-averaged F1 measure since accuracy and micro-averaged F1 do nothave an in-built mechanism for accommodating class imbalance. The best performingsystems by this definition are SoftCardinality1, UKP-BIU1, and ETS2 respectively.10
SemEval ’13 Task 7: Dzikovska ’12 (13) Dzikovska et al. (2012) provide simplebaseline systems for the competition. The most advanced baseline is a lexical simi-larity system based on four features computed from the Text::Similarity package:11
count of overlapping words, F1, Lesk, and cosine scores. These four features arecombined with a C4.5 decision tree.
SemEval ’13 Task 7: SoftCardinality (28) SoftCardinality (Jimenez et al. 2013) isbased on the idea of soft cardinality as an extension to classical cardinality. Usingthis idea, the system utilizes measurements of textual overlap based on the questions,teacher answers, and student answers. The measure is effectively recursive, wherebythe overlap of words based on character n-grams is the smallest unit, which is thencombined to the sentence level for words, then the passage level. Altogether 42 softcardinality features are extracted from the text. Classification is made with a J48 grafttree, and the models are improved by bagging (Breiman 1996).
SemEval ’13 Task 7: UKP-BIU (31) UKP-BIU (Zesch et al. 2013) is based on com-bining multiple textual similarity measures together using DKPro Similarity (Baret al. 2013) and BIUTEE (Stern and Dagan 2011) as established technology fortextual similarity and entailment respectively. Six families of features are usedcomprising of bag-of-words features, syntactic features, basic similarity features,semantic similarity features, spelling features, and entailment features. The mosteffective model utilizes all six feature families with a naive Bayes classifier fromWeka (Hall et al. 2009).
10Each team is allowed to submit three runs, so the subscripts here refer to the run numbers.11http://search.cpan.org/dist/Text-Similarity
Int J Artif Intell Educ (2015) 25:60–117 81
SemEval ’13 Task 7: ETS (16) ETS (Heilman and Madnani 2013) employs stacking(also seen in some top ASAP ’12 SAS systems) and domain adaptation as a techniqueto apply non-uniform weights to the features in any model. Four classes of featuresare considered that include the lexical similarity features from the competition base-line system (Dzikovska et al. 2012), an “intercept feature” used for modeling classdistribution, word and character n-gram features, and text similarity features. Thefinal model is created with a logistic regression classifier.
SemEval ’13 Task 7: Levy ’13 (22) Levy et al. (2013) implement several compet-ing solutions to partial and full textual entailment on the SemEval ’13 Task 7 dataset. This is done immediately after and outside of the competition, so this shows therecent impact of the competition for promoting comparable solutions. Here, the par-tial textual entailment work operates on the level of facets. In the evaluation, the workinvestigates if each facet is expressed or unaddressed in the student answers, and howthe knowledge can be combined for full textual entailment.
Five competing systems are implemented where partial textual entailment is ana-lyzed in terms of a bag-of-words model, lexical inference with semantically relatedwords, syntactic inference with dependency trees, disjunction of all three, and major-ity voting of all three. The majority voting implementation is most effective. Thismodel is then adapted to full textual entailment, where the answer is marked as cor-rect if all facets are expressed. It should be noted that the work assumes the existenceof a manual facet annotation process.
Component Analysis
Having completed our historical review of the literature, we now conduct a higher-level analysis according to common components. That is, we consider dimensionsacross systems, instead of focusing on one system at a time. Therefore we now reviewthe six dimensions of data sets, natural language processing, model building, grad-ing models, model evaluation, and effectiveness respectively in the subsections thatfollow. These map directly to the aforementioned artifacts and processes from Fig. 1.
Before reviewing these dimensions, we must begin by highlighting some of thegeneral organization. First, we omit some systems that have no or insufficient empir-ical contributions when reviewing the data sets, model building, model evaluation,and effectiveness. This comprises ATM, Auto-Assessor and WebLAS as having noempirical contributions, and Thomas ’03 as using a maximum of 20 student answersin experiments. Second, we also group the systems in the era of evaluation under theirrespective competition names when discussing the data sets, model building, andmodel evaluation, as these dimensions are common at the competition level. Third,it is apparent that not all data is available for the properties we wish to analyze, andmissing data are marked as “??” in our tables. Noting missing data is interesting toindicate trends of underreporting in the original work.
This section focuses on the details and trends of the components. We revisit thehighlights when concluding with “lessons learned” in the last section of this article.
82 Int J Artif Intell Educ (2015) 25:60–117
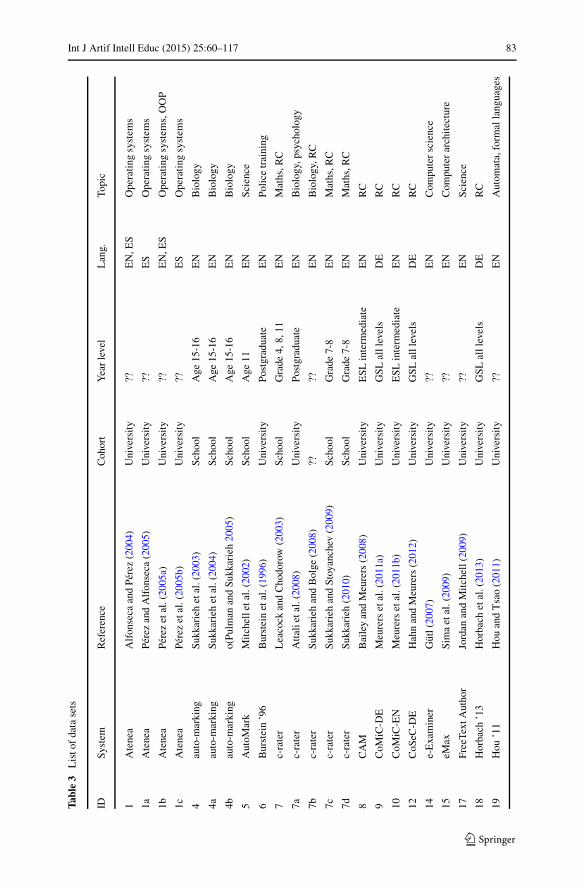
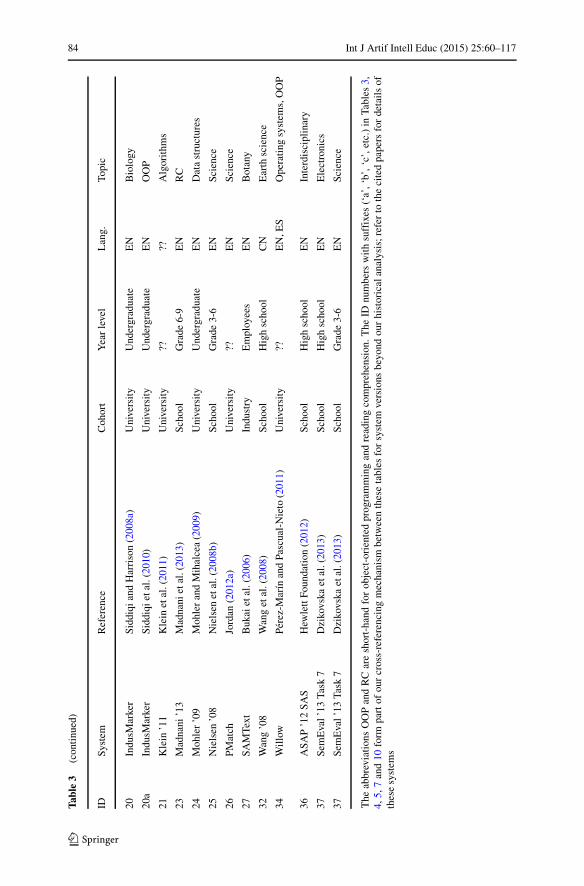
Data Sets
For the data sets dimension, we focus on qualitative properties comprising the cohort,year level, language, and topic as summarized in Table 3. Concerning the cohortfirst and only counting each system name once, we find that university data setsdominate school data sets by about double. This can be explained by the fact thatmany authors of these publications are academics using data sets from their ownteaching experiences. We also have one cohort marked as “industry” for the SAMTextsystem where the authors created their data set by requesting participation from theircolleagues.
Concerning the year level, the data varies greatly. One trend is that all non-reportedyear levels are from the university cohort. Here we hypothesize that academics usingdata sets from their own teaching experiences assume that the year level is self-evident through teaching listings on university websites and similar. Given that thishistorical data is not so easy to acquire, we recommend that more background aboutthe university course is supplied in describing data sets. We also have identifiedsome foreign-language data sets for ESL (English as a Second Language) and GSL(German as a Second Language) students. Here, the progress is measured using thenotion of language units instead of year level or age.
Concerning the language, the reviewed body of work is represented by four lan-guages: Chinese, English, German, and Spanish, with English dominating. Chineseposes an additional challenge due to the requirement of word segmentation.
Concerning the topic, the data varies greatly again. There are many topicsfrom computer science disciplines, since many developers of the systems are alsoacademics from computer science and related areas. Reading comprehension andsciences are also popular.
The other property that we examined is data availability, and from what we cansee only the data sets connected to the Mohler ’09 system, CoMiC project, andSemEval ’13 Task 7 competition are public. We note that the work to developthese open data sets is fairly recent, therefore the era of evaluation in ASAG hasa lot of room to develop. Supporting software can help too in terms of a soft-ware framework capable of providing data confidentiality so that private data setscan form part of the era of evaluation. An example is the TIRA evaluation frame-work for experiments in information retrieval and related topics (Gollub et al.2012a, b, c), which has allowed the organizers of the PAN competition series(Potthast 2011) to maintain control over data assets, whilst still providing astimulating competition.
Natural Language Processing
Natural Language Processing (NLP) techniques are required to analyze the languagein student answers. The techniques are either linguistic processing techniques thatperform textual manipulation, or statistical techniques based on the features extractedfrom them. In this section we review both categories, beginning with linguisticprocessing techniques.
Int J Artif Intell Educ (2015) 25:60–117 83
Tabl
e3
Lis
tof
data
sets
IDSy
stem
Ref
eren
ceC
ohor
tY
ear
leve
lL
ang.
Topi
c
1A
tene
aA
lfon
seca
and
Pere
z(2
004)
Uni
vers
ity
??E
N,E
SO
pera
ting
syst
ems
1aA
tene
aPe
rez
and
Alf
onse
ca(2
005)
Uni
vers
ity
??E
SO
pera
ting
syst
ems
1bA
tene
aPe
rez
etal
.(20
05a)
Uni
vers
ity
??E
N,E
SO
pera
ting
syst
ems,
OO
P
1cA
tene
aPe
rez
etal
.(20
05b)
Uni
vers
ity
??E
SO
pera
ting
syst
ems
4au
to-m
arki
ngSu
kkar
ieh
etal
.(20
03)
Scho
olA
ge15
-16
EN
Bio
logy
4aau
to-m
arki
ngSu
kkar
ieh
etal
.(20
04)
Scho
olA
ge15
-16
EN
Bio
logy
4bau
to-m
arki
ngo(
Pulm
anan
dSu
kkar
ieh
2005
)Sc
hool
Age
15-1
6E
NB
iolo
gy
5A
utoM
ark
Mit
chel
leta
l.(2
002)
Scho
olA
ge11
EN
Scie
nce
6B
urst
ein
’96
Bur
stei
net
al.(
1996
)U
nive
rsit
yPo
stgr
adua
teE
NPo
lice
trai
ning
7c-
rate
rL
eaco
ckan
dC
hodo
row
(200
3)Sc
hool
Gra
de4,
8,11
EN
Mat
hs,R
C
7ac-
rate
rA
ttal
ieta
l.(2
008)
Uni
vers
ity
Post
grad
uate
EN
Bio
logy
,psy
chol
ogy
7bc-
rate
rSu
kkar
ieh
and
Bol
ge(2
008)
????
EN
Bio
logy
,RC
7cc-
rate
rSu
kkar
ieh
and
Stoy
anch
ev(2
009)
Scho
olG
rade
7-8
EN
Mat
hs,R
C
7dc-
rate
rSu
kkar
ieh
(201
0)Sc
hool
Gra
de7-
8E
NM
aths
,RC
8C
AM
Bai
ley
and
Meu
rers
(200
8)U
nive
rsit
yE
SLin
term
edia
teE
NR
C
9C
oMiC
-DE
Meu
rers
etal
.(20
11a)
Uni
vers
ity
GSL
alll
evel
sD
ER
C
10C
oMiC
-EN
Meu
rers
etal
.(20
11b)
Uni
vers
ity
ESL
inte
rmed
iate
EN
RC
12C
oSeC
-DE
Hah
nan
dM
eure
rs(2
012)
Uni
vers
ity
GSL
alll
evel
sD
ER
C
14e-
Exa
min
erG
utl(
2007
)U
nive
rsit
y??
EN
Com
pute
rsc
ienc
e
15eM
axSi
ma
etal
.(20
09)
Uni
vers
ity
??E
NC
ompu
ter
arch
itec
ture
17Fr
eeTe
xtA
utho
rJo
rdan
and
Mit
chel
l(20
09)
Uni
vers
ity
??E
NSc
ienc
e
18H
orba
ch’1
3H
orba
chet
al.(
2013
)U
nive
rsit
yG
SLal
llev
els
DE
RC
19H
ou’1
1H
ouan
dT
sao
(201
1)U
nive
rsit
y??
EN
Aut
omat
a,fo
rmal
lang
uage
s
84 Int J Artif Intell Educ (2015) 25:60–117
Tabl
e3
(con
tinu
ed)
IDSy
stem
Ref
eren
ceC
ohor
tY
ear
leve
lL
ang.
Topi
c
20In
dusM
arke
rSi
ddiq
iand
Har
riso
n(2
008a
)U
nive
rsit
yU
nder
grad
uate
EN
Bio
logy
20a
Indu
sMar
ker
Sidd
iqie
tal.
(201
0)U
nive
rsit
yU
nder
grad
uate
EN
OO
P
21K
lein
’11
Kle
inet
al.(
2011
)U
nive
rsit
y??
??A
lgor
ithm
s
23M
adna
ni’1
3M
adna
niet
al.(
2013
)Sc
hool
Gra
de6-
9E
NR
C
24M
ohle
r’0
9M
ohle
ran
dM
ihal
cea
(200
9)U
nive
rsit
yU
nder
grad
uate
EN
Dat
ast
ruct
ures
25N
iels
en’0
8N
iels
enet
al.(
2008
b)Sc
hool
Gra
de3-
6E
NSc
ienc
e
26PM
atch
Jord
an(2
012a
)U
nive
rsit
y??
EN
Scie
nce
27SA
MTe
xtB
ukai
etal
.(20
06)
Indu
stry
Em
ploy
ees
EN
Bot
any
32W
ang
’08
Wan
get
al.(
2008
)Sc
hool
Hig
hsc
hool
CN
Ear
thsc
ienc
e
34W
illo
wPe
rez-
Mar
ınan
dPa
scua
l-N
ieto
(201
1)U
nive
rsit
y??
EN
,ES
Ope
rati
ngsy
stem
s,O
OP
36A
SAP
’12
SAS
Hew
lett
Foun
dati
on(2
012)
Scho
olH
igh
scho
olE
NIn
terd
isci
plin
ary
37Se
mE
val’
13Ta
sk7
Dzi
kovs
kaet
al.(
2013
)Sc
hool
Hig
hsc
hool
EN
Ele
ctro
nics
37Se
mE
val’
13Ta
sk7
Dzi
kovs
kaet
al.(
2013
)Sc
hool
Gra
de3-
6E
NSc
ienc
e
The
abbr
evia
tion
sO
OP
and
RC
are
shor
t-ha
ndfo
rob
ject
-ori
ente
dpr
ogra
mm
ing
and
read
ing
com
preh
ensi
on.T
heID
num
bers
wit
hsu
ffix
es(‘
a’,‘
b’,‘
c’,e
tc.)
inTa
bles
3,4,
5,7
and
10fo
rmpa
rtof
our
cros
s-re
fere
ncin
gm
echa
nism
betw
een
thes
eta
bles
for
syst
emve
rsio
nsbe
yond
our
hist
oric
alan
alys
is;r
efer
toth
eci
ted
pape
rsfo
rde
tail
sof
thes
esy
stem
s
Int J Artif Intell Educ (2015) 25:60–117 85
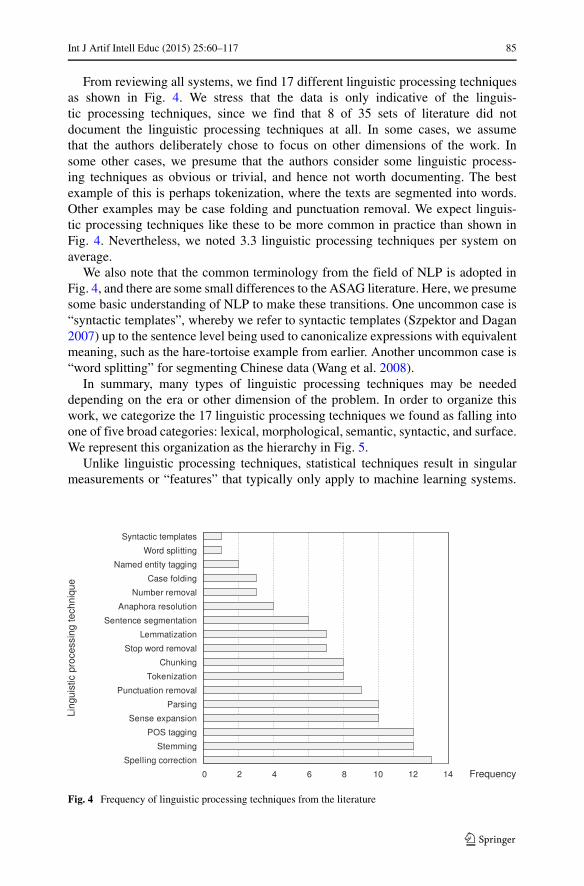
From reviewing all systems, we find 17 different linguistic processing techniquesas shown in Fig. 4. We stress that the data is only indicative of the linguis-tic processing techniques, since we find that 8 of 35 sets of literature did notdocument the linguistic processing techniques at all. In some cases, we assumethat the authors deliberately chose to focus on other dimensions of the work. Insome other cases, we presume that the authors consider some linguistic process-ing techniques as obvious or trivial, and hence not worth documenting. The bestexample of this is perhaps tokenization, where the texts are segmented into words.Other examples may be case folding and punctuation removal. We expect linguis-tic processing techniques like these to be more common in practice than shown inFig. 4. Nevertheless, we noted 3.3 linguistic processing techniques per system onaverage.
We also note that the common terminology from the field of NLP is adopted inFig. 4, and there are some small differences to the ASAG literature. Here, we presumesome basic understanding of NLP to make these transitions. One uncommon case is“syntactic templates”, whereby we refer to syntactic templates (Szpektor and Dagan2007) up to the sentence level being used to canonicalize expressions with equivalentmeaning, such as the hare-tortoise example from earlier. Another uncommon case is“word splitting” for segmenting Chinese data (Wang et al. 2008).
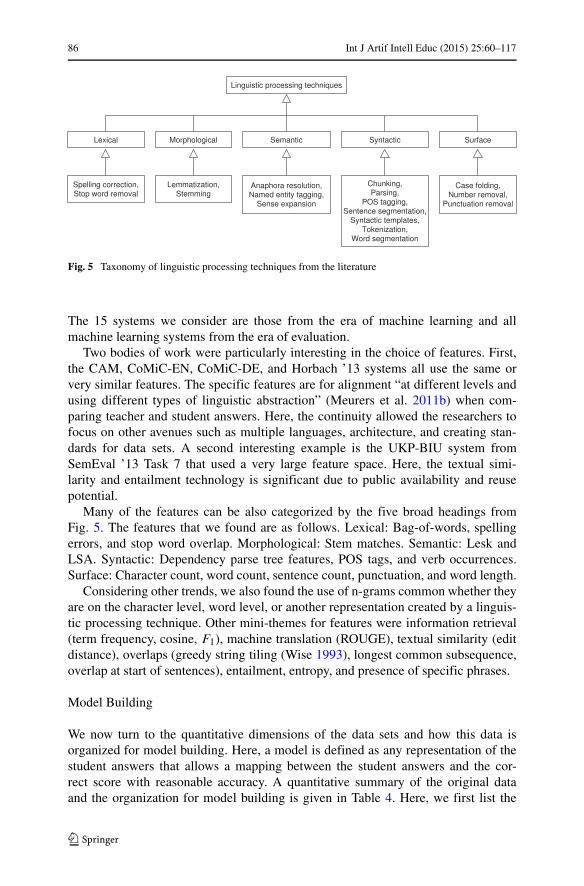
In summary, many types of linguistic processing techniques may be neededdepending on the era or other dimension of the problem. In order to organize thiswork, we categorize the 17 linguistic processing techniques we found as falling intoone of five broad categories: lexical, morphological, semantic, syntactic, and surface.We represent this organization as the hierarchy in Fig. 5.
Unlike linguistic processing techniques, statistical techniques result in singularmeasurements or “features” that typically only apply to machine learning systems.
Fig. 4 Frequency of linguistic processing techniques from the literature
86 Int J Artif Intell Educ (2015) 25:60–117
Fig. 5 Taxonomy of linguistic processing techniques from the literature
The 15 systems we consider are those from the era of machine learning and allmachine learning systems from the era of evaluation.
Two bodies of work were particularly interesting in the choice of features. First,the CAM, CoMiC-EN, CoMiC-DE, and Horbach ’13 systems all use the same orvery similar features. The specific features are for alignment “at different levels andusing different types of linguistic abstraction” (Meurers et al. 2011b) when com-paring teacher and student answers. Here, the continuity allowed the researchers tofocus on other avenues such as multiple languages, architecture, and creating stan-dards for data sets. A second interesting example is the UKP-BIU system fromSemEval ’13 Task 7 that used a very large feature space. Here, the textual simi-larity and entailment technology is significant due to public availability and reusepotential.
Many of the features can be also categorized by the five broad headings fromFig. 5. The features that we found are as follows. Lexical: Bag-of-words, spellingerrors, and stop word overlap. Morphological: Stem matches. Semantic: Lesk andLSA. Syntactic: Dependency parse tree features, POS tags, and verb occurrences.Surface: Character count, word count, sentence count, punctuation, and word length.
Considering other trends, we also found the use of n-grams common whether theyare on the character level, word level, or another representation created by a linguis-tic processing technique. Other mini-themes for features were information retrieval(term frequency, cosine, F1), machine translation (ROUGE), textual similarity (editdistance), overlaps (greedy string tiling (Wise 1993), longest common subsequence,overlap at start of sentences), entailment, entropy, and presence of specific phrases.
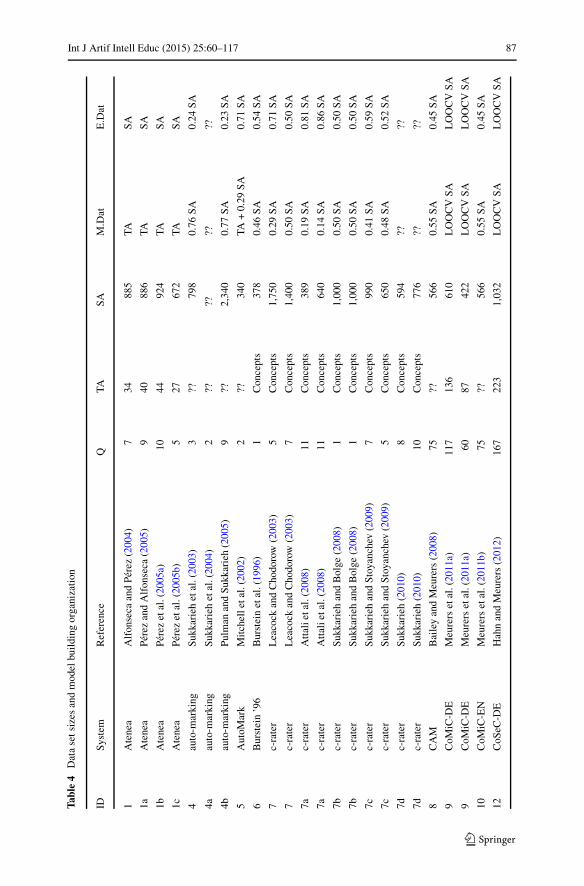
Model Building
We now turn to the quantitative dimensions of the data sets and how this data isorganized for model building. Here, a model is defined as any representation of thestudent answers that allows a mapping between the student answers and the cor-rect score with reasonable accuracy. A quantitative summary of the original dataand the organization for model building is given in Table 4. Here, we first list the
Int J Artif Intell Educ (2015) 25:60–117 87
Tabl
e4
Dat
ase
tsiz
esan
dm
odel
buil
ding
orga
niza
tion
IDSy
stem
Ref
eren
ceQ
TASA
M.D
atE
.Dat
1A
tene
aA
lfon
seca
and
Pere
z(2
004)
734
885
TASA
1aA
tene
aPe
rez
and
Alf
onse
ca(2
005)
940
886
TASA
1bA
tene
aPe
rez
etal
.(20
05a)
1044
924
TASA
1cA
tene
aPe
rez
etal
.(20
05b)
527
672
TASA
4au
to-m
arki
ngSu
kkar
ieh
etal
.(20
03)
3??
798
0.76
SA0.
24SA
4aau
to-m
arki
ngSu
kkar
ieh
etal
.(20
04)
2??
????
??
4bau
to-m
arki
ngPu
lman
and
Sukk
arie
h(2
005)
9??
2,34
00.
77SA
0.23
SA
5A
utoM
ark
Mit
chel
leta
l.(2
002)
2??
340
TA+
0.29
SA0.
71SA
6B
urst
ein
’96
Bur
stei
net
al.(
1996
)1
Con
cept
s37
80.
46SA
0.54
SA
7c-
rate
rL
eaco
ckan
dC
hodo
row
(200
3)5
Con
cept
s1,
750
0.29
SA0.
71SA
7c-
rate
rL
eaco
ckan
dC
hodo
row
(200
3)7
Con
cept
s1,
400
0.50
SA0.
50SA
7ac-
rate
rA
ttal
ieta
l.(2
008)
11C
once
pts
389
0.19
SA0.
81SA
7ac-
rate
rA
ttal
ieta
l.(2
008)
11C
once
pts
640
0.14
SA0.
86SA
7bc-
rate
rSu
kkar
ieh
and
Bol
ge(2
008)
1C
once
pts
1,00
00.
50SA
0.50
SA
7bc-
rate
rSu
kkar
ieh
and
Bol
ge(2
008)
1C
once
pts
1,00
00.
50SA
0.50
SA
7cc-
rate
rSu
kkar
ieh
and
Stoy
anch
ev(2
009)
7C
once
pts
990
0.41
SA0.
59SA
7cc-
rate
rSu
kkar
ieh
and
Stoy
anch
ev(2
009)
5C
once
pts
650
0.48
SA0.
52SA
7dc-
rate
rSu
kkar
ieh
(201
0)8
Con
cept
s59
4??
??
7dc-
rate
rSu
kkar
ieh
(201
0)10
Con
cept
s77
6??
??
8C
AM
Bai
ley
and
Meu
rers
(200
8)75
??56
60.
55SA
0.45
SA
9C
oMiC
-DE
Meu
rers
etal
.(20
11a)
117
136
610
LO
OC
VSA
LO
OC
VSA
9C
oMiC
-DE
Meu
rers
etal
.(20
11a)
6087
422
LO
OC
VSA
LO
OC
VSA
10C
oMiC
-EN
Meu
rers
etal
.(20
11b)
75??
566
0.55
SA0.
45SA
12C
oSeC
-DE
Hah
nan
dM
eure
rs(2
012)
167
223
1,03
2L
OO
CV
SAL
OO
CV
SA
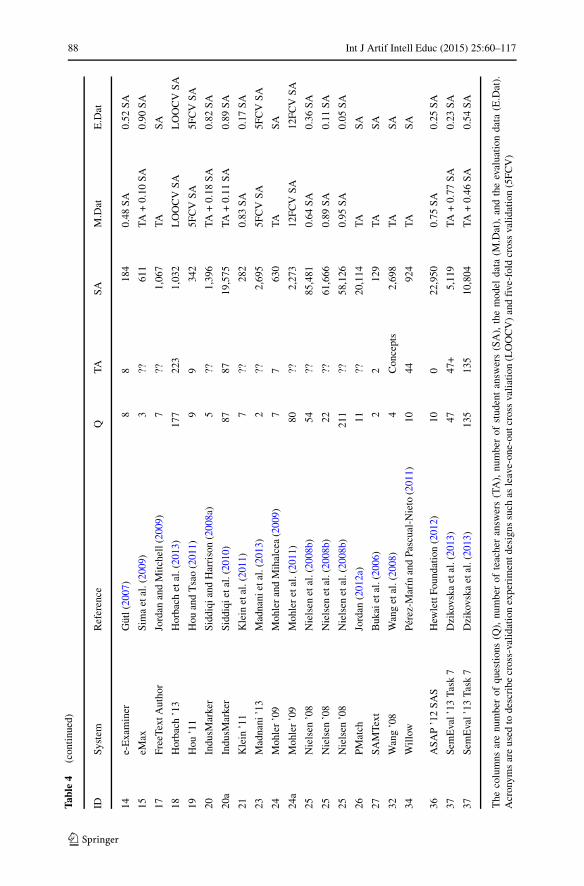
88 Int J Artif Intell Educ (2015) 25:60–117
Tabl
e4
(con
tinu
ed)
IDSy
stem
Ref
eren
ceQ
TASA
M.D
atE
.Dat
14e-
Exa
min
erG
utl(
2007
)8
818
40.
48SA
0.52
SA
15eM
axSi
ma
etal
.(20
09)
3??
611
TA+
0.10
SA0.
90SA
17Fr
eeTe
xtA
utho
rJo
rdan
and
Mit
chel
l(20
09)
7??
1,06
7TA
SA
18H
orba
ch’1
3H
orba
chet
al.(
2013
)17
722
31,
032
LO
OC
VSA
LO
OC
VSA
19H
ou’1
1H
ouan
dT
sao
(201
1)9
934
25F
CV
SA5F
CV
SA
20In
dusM
arke
rSi
ddiq
iand
Har
riso
n(2
008a
)5
??1,
396
TA+
0.18
SA0.
82SA
20a
Indu
sMar
ker
Sidd
iqie
tal.
(201
0)87
8719
,575
TA+
0.11
SA0.
89SA
21K
lein
’11
Kle
inet
al.(
2011
)7
??28
20.
83SA
0.17
SA
23M
adna
ni’1
3M
adna
niet
al.(
2013
)2
??2,
695
5FC
VSA
5FC
VSA
24M
ohle
r’0
9M
ohle
ran
dM
ihal
cea
(200
9)7
763
0TA
SA
24a
Moh
ler
’09
Moh
ler
etal
.(20
11)
80??
2,27
312
FCV
SA12
FCV
SA
25N
iels
en’0
8N
iels
enet
al.(
2008
b)54
??85
,481
0.64
SA0.
36SA
25N
iels
en’0
8N
iels
enet
al.(
2008
b)22
??61
,666
0.89
SA0.
11SA
25N
iels
en’0
8N
iels
enet
al.(
2008
b)21
1??
58,1
260.
95SA
0.05
SA
26PM
atch
Jord
an(2
012a
)11
??20
,114
TASA
27SA
MTe
xtB
ukai
etal
.(20
06)
22
129
TASA
32W
ang
’08
Wan
get
al.(
2008
)4
Con
cept
s2,
698
TASA
34W
illo
wPe
rez-
Mar
ınan
dPa
scua
l-N
ieto
(201
1)10
4492
4TA
SA
36A
SAP
’12
SAS
Hew
lett
Foun
dati
on(2
012)
100
22,9
500.
75SA
0.25
SA
37Se
mE
val’
13Ta
sk7
Dzi
kovs
kaet
al.(
2013
)47
47+
5,11
9TA
+0.
77SA
0.23
SA
37Se
mE
val’
13Ta
sk7
Dzi
kovs
kaet
al.(
2013
)13
513
510
,804
TA+
0.46
SA0.
54SA
The
colu
mns
are
num
ber
ofqu
esti
ons
(Q),
num
ber
ofte
ache
ran
swer
s(T
A),
num
ber
ofst
uden
tan
swer
s(S
A),
the
mod
elda
ta(M
.Dat
),an
dth
eev
alua
tion
data
(E.D
at).
Acr
onym
sar
eus
edto
desc
ribe
cros
s-va
lida
tion
expe
rim
entd
esig
nssu
chas
leav
e-on
e-ou
tcro
ssva
liat
ion
(LO
OC
V)
and
five
-fol
dcr
oss
vali
dati
on(5
FCV
)
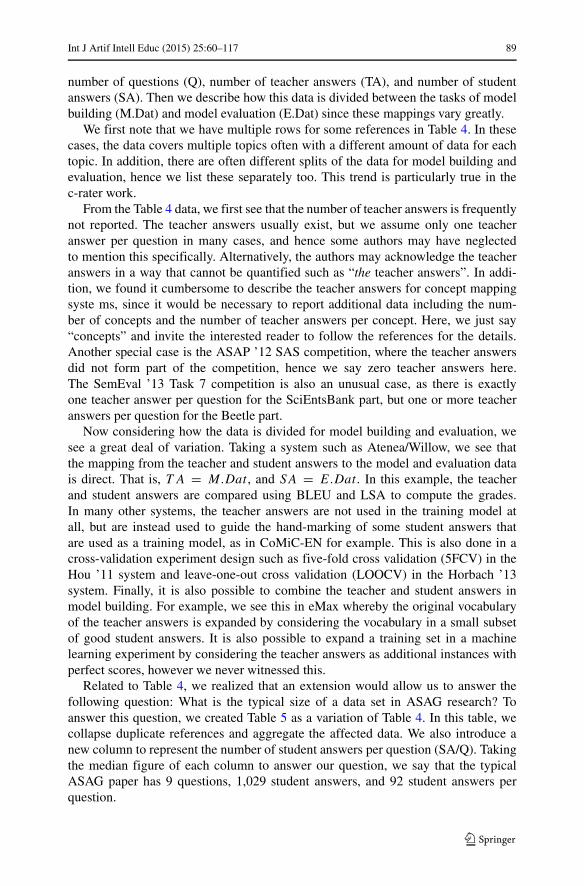
Int J Artif Intell Educ (2015) 25:60–117 89
number of questions (Q), number of teacher answers (TA), and number of studentanswers (SA). Then we describe how this data is divided between the tasks of modelbuilding (M.Dat) and model evaluation (E.Dat) since these mappings vary greatly.
We first note that we have multiple rows for some references in Table 4. In thesecases, the data covers multiple topics often with a different amount of data for eachtopic. In addition, there are often different splits of the data for model building andevaluation, hence we list these separately too. This trend is particularly true in thec-rater work.
From the Table 4 data, we first see that the number of teacher answers is frequentlynot reported. The teacher answers usually exist, but we assume only one teacheranswer per question in many cases, and hence some authors may have neglectedto mention this specifically. Alternatively, the authors may acknowledge the teacheranswers in a way that cannot be quantified such as “the teacher answers”. In addi-tion, we found it cumbersome to describe the teacher answers for concept mappingsyste ms, since it would be necessary to report additional data including the num-ber of concepts and the number of teacher answers per concept. Here, we just say“concepts” and invite the interested reader to follow the references for the details.Another special case is the ASAP ’12 SAS competition, where the teacher answersdid not form part of the competition, hence we say zero teacher answers here.The SemEval ’13 Task 7 competition is also an unusual case, as there is exactlyone teacher answer per question for the SciEntsBank part, but one or more teacheranswers per question for the Beetle part.
Now considering how the data is divided for model building and evaluation, wesee a great deal of variation. Taking a system such as Atenea/Willow, we see thatthe mapping from the teacher and student answers to the model and evaluation datais direct. That is, T A = M.Dat , and SA = E.Dat . In this example, the teacherand student answers are compared using BLEU and LSA to compute the grades.In many other systems, the teacher answers are not used in the training model atall, but are instead used to guide the hand-marking of some student answers thatare used as a training model, as in CoMiC-EN for example. This is also done in across-validation experiment design such as five-fold cross validation (5FCV) in theHou ’11 system and leave-one-out cross validation (LOOCV) in the Horbach ’13system. Finally, it is also possible to combine the teacher and student answers inmodel building. For example, we see this in eMax whereby the original vocabularyof the teacher answers is expanded by considering the vocabulary in a small subsetof good student answers. It is also possible to expand a training set in a machinelearning experiment by considering the teacher answers as additional instances withperfect scores, however we never witnessed this.
Related to Table 4, we realized that an extension would allow us to answer thefollowing question: What is the typical size of a data set in ASAG research? Toanswer this question, we created Table 5 as a variation of Table 4. In this table, wecollapse duplicate references and aggregate the affected data. We also introduce anew column to represent the number of student answers per question (SA/Q). Takingthe median figure of each column to answer our question, we say that the typicalASAG paper has 9 questions, 1,029 student answers, and 92 student answers perquestion.
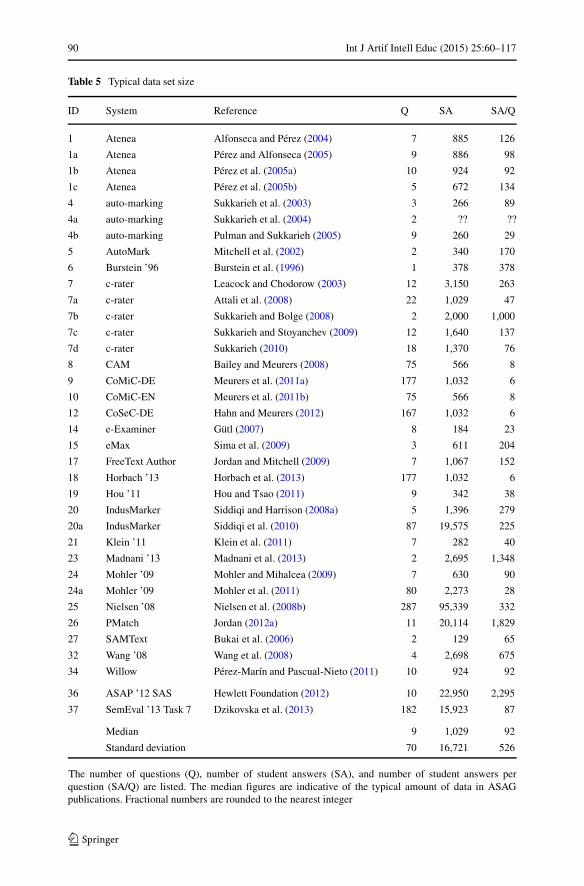
90 Int J Artif Intell Educ (2015) 25:60–117
Table 5 Typical data set size
ID System Reference Q SA SA/Q
1 Atenea Alfonseca and Perez (2004) 7 885 126
1a Atenea Perez and Alfonseca (2005) 9 886 98
1b Atenea Perez et al. (2005a) 10 924 92
1c Atenea Perez et al. (2005b) 5 672 134
4 auto-marking Sukkarieh et al. (2003) 3 266 89
4a auto-marking Sukkarieh et al. (2004) 2 ?? ??
4b auto-marking Pulman and Sukkarieh (2005) 9 260 29
5 AutoMark Mitchell et al. (2002) 2 340 170
6 Burstein ’96 Burstein et al. (1996) 1 378 378
7 c-rater Leacock and Chodorow (2003) 12 3,150 263
7a c-rater Attali et al. (2008) 22 1,029 47
7b c-rater Sukkarieh and Bolge (2008) 2 2,000 1,000
7c c-rater Sukkarieh and Stoyanchev (2009) 12 1,640 137
7d c-rater Sukkarieh (2010) 18 1,370 76
8 CAM Bailey and Meurers (2008) 75 566 8
9 CoMiC-DE Meurers et al. (2011a) 177 1,032 6
10 CoMiC-EN Meurers et al. (2011b) 75 566 8
12 CoSeC-DE Hahn and Meurers (2012) 167 1,032 6
14 e-Examiner Gutl (2007) 8 184 23
15 eMax Sima et al. (2009) 3 611 204
17 FreeText Author Jordan and Mitchell (2009) 7 1,067 152
18 Horbach ’13 Horbach et al. (2013) 177 1,032 6
19 Hou ’11 Hou and Tsao (2011) 9 342 38
20 IndusMarker Siddiqi and Harrison (2008a) 5 1,396 279
20a IndusMarker Siddiqi et al. (2010) 87 19,575 225
21 Klein ’11 Klein et al. (2011) 7 282 40
23 Madnani ’13 Madnani et al. (2013) 2 2,695 1,348
24 Mohler ’09 Mohler and Mihalcea (2009) 7 630 90
24a Mohler ’09 Mohler et al. (2011) 80 2,273 28
25 Nielsen ’08 Nielsen et al. (2008b) 287 95,339 332
26 PMatch Jordan (2012a) 11 20,114 1,829
27 SAMText Bukai et al. (2006) 2 129 65
32 Wang ’08 Wang et al. (2008) 4 2,698 675
34 Willow Perez-Marın and Pascual-Nieto (2011) 10 924 92
36 ASAP ’12 SAS Hewlett Foundation (2012) 10 22,950 2,295
37 SemEval ’13 Task 7 Dzikovska et al. (2013) 182 15,923 87
Median 9 1,029 92
Standard deviation 70 16,721 526
The number of questions (Q), number of student answers (SA), and number of student answers perquestion (SA/Q) are listed. The median figures are indicative of the typical amount of data in ASAGpublications. Fractional numbers are rounded to the nearest integer
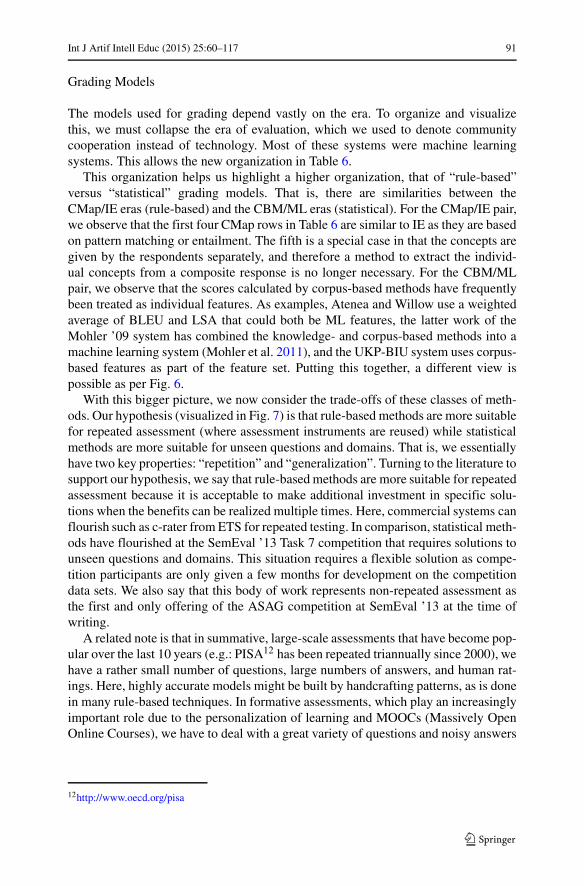
Int J Artif Intell Educ (2015) 25:60–117 91
Grading Models
The models used for grading depend vastly on the era. To organize and visualizethis, we must collapse the era of evaluation, which we used to denote communitycooperation instead of technology. Most of these systems were machine learningsystems. This allows the new organization in Table 6.
This organization helps us highlight a higher organization, that of “rule-based”versus “statistical” grading models. That is, there are similarities between theCMap/IE eras (rule-based) and the CBM/ML eras (statistical). For the CMap/IE pair,we observe that the first four CMap rows in Table 6 are similar to IE as they are basedon pattern matching or entailment. The fifth is a special case in that the concepts aregiven by the respondents separately, and therefore a method to extract the individ-ual concepts from a composite response is no longer necessary. For the CBM/MLpair, we observe that the scores calculated by corpus-based methods have frequentlybeen treated as individual features. As examples, Atenea and Willow use a weightedaverage of BLEU and LSA that could both be ML features, the latter work of theMohler ’09 system has combined the knowledge- and corpus-based methods into amachine learning system (Mohler et al. 2011), and the UKP-BIU system uses corpus-based features as part of the feature set. Putting this together, a different view ispossible as per Fig. 6.
With this bigger picture, we now consider the trade-offs of these classes of meth-ods. Our hypothesis (visualized in Fig. 7) is that rule-based methods are more suitablefor repeated assessment (where assessment instruments are reused) while statisticalmethods are more suitable for unseen questions and domains. That is, we essentiallyhave two key properties: “repetition” and “generalization”. Turning to the literature tosupport our hypothesis, we say that rule-based methods are more suitable for repeatedassessment because it is acceptable to make additional investment in specific solu-tions when the benefits can be realized multiple times. Here, commercial systems canflourish such as c-rater from ETS for repeated testing. In comparison, statistical meth-ods have flourished at the SemEval ’13 Task 7 competition that requires solutions tounseen questions and domains. This situation requires a flexible solution as compe-tition participants are only given a few months for development on the competitiondata sets. We also say that this body of work represents non-repeated assessment asthe first and only offering of the ASAG competition at SemEval ’13 at the time ofwriting.
A related note is that in summative, large-scale assessments that have become pop-ular over the last 10 years (e.g.: PISA12 has been repeated triannually since 2000), wehave a rather small number of questions, large numbers of answers, and human rat-ings. Here, highly accurate models might be built by handcrafting patterns, as is donein many rule-based techniques. In formative assessments, which play an increasinglyimportant role due to the personalization of learning and MOOCs (Massively OpenOnline Courses), we have to deal with a great variety of questions and noisy answers
12http://www.oecd.org/pisa
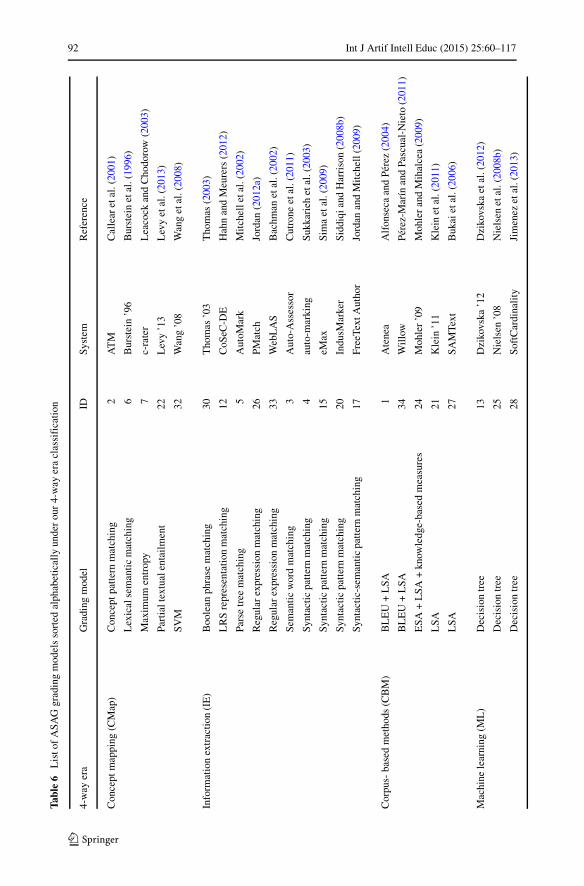
92 Int J Artif Intell Educ (2015) 25:60–117Ta
ble
6L
isto
fA
SAG
grad
ing
mod
els
sort
edal
phab
etic
ally
unde
rou
r4-
way
era
clas
sifi
cati
on
4-w
ayer
aG
radi
ngm
odel
IDSy
stem
Ref
eren
ce
Con
cept
map
ping
(CM
ap)
Con
cept
patt
ern
mat
chin
g2
AT
MC
alle
aret
al.(
2001
)
Lex
ical
sem
anti
cm
atch
ing
6B
urst
ein
’96
Bur
stei
net
al.(
1996
)
Max
imum
entr
opy
7c-
rate
rL
eaco
ckan
dC
hodo
row
(200
3)
Part
ialt
extu
alen
tail
men
t22
Lev
y’1
3L
evy
etal
.(20
13)
SVM
32W
ang
’08
Wan
get
al.(
2008
)
Info
rmat
ion
extr
acti
on(I
E)
Boo
lean
phra
sem
atch
ing
30T
hom
as’0
3T
hom
as(2
003)
LR
Sre
pres
enta
tion
mat
chin
g12
CoS
eC-D
EH
ahn
and
Meu
rers
(201
2)
Pars
etr
eem
atch
ing
5A
utoM
ark
Mit
chel
leta
l.(2
002)
Reg
ular
expr
essi
onm
atch
ing
26PM
atch
Jord
an(2
012a
)
Reg
ular
expr
essi
onm
atch
ing
33W
ebL
AS
Bac
hman
etal
.(20
02)
Sem
anti
cw
ord
mat
chin
g3
Aut
o-A
sses
sor
Cut
rone
etal
.(20
11)
Synt
acti
cpa
tter
nm
atch
ing
4au
to-m
arki
ngSu
kkar
ieh
etal
.(20
03)
Synt
acti
cpa
tter
nm
atch
ing
15eM
axSi
ma
etal
.(20
09)
Synt
acti
cpa
tter
nm
atch
ing
20In
dusM
arke
rSi
ddiq
iand
Har
riso
n(2
008b
)
Synt
acti
c-se
man
tic
patt
ern
mat
chin
g17
Free
Text
Aut
hor
Jord
anan
dM
itch
ell(
2009
)
Cor
pus-
base
dm
etho
ds(C
BM
)B
LE
U+
LSA
1A
tene
aA
lfon
seca
and
Pere
z(2
004)
BL
EU
+L
SA34
Wil
low
Pere
z-M
arın
and
Pasc
ual-
Nie
to(2
011)
ESA
+L
SA+
know
ledg
e-ba
sed
mea
sure
s24
Moh
ler
’09
Moh
ler
and
Mih
alce
a(2
009)
LSA
21K
lein
’11
Kle
inet
al.(
2011
)
LSA
27SA
MTe
xtB
ukai
etal
.(20
06)
Mac
hine
lear
ning
(ML
)D
ecis
ion
tree
13D
ziko
vska
’12
Dzi
kovs
kaet
al.(
2012
)
Dec
isio
ntr
ee25
Nie
lsen
’08
Nie
lsen
etal
.(20
08b)
Dec
isio
ntr
ee28
Soft
Car
dina
lity
Jim
enez
etal
.(20
13)
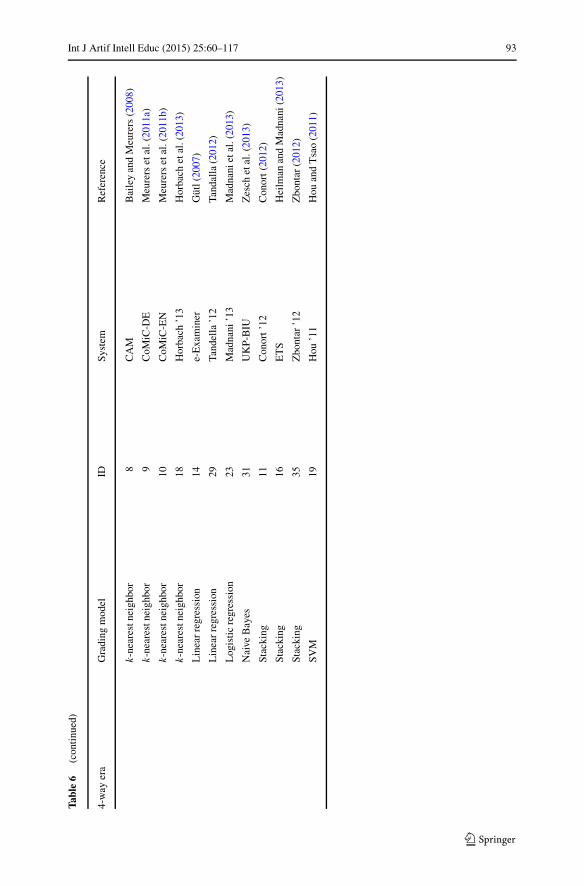
Int J Artif Intell Educ (2015) 25:60–117 93
Tabl
e6
(con
tinu
ed)
4-w
ayer
aG
radi
ngm
odel
IDSy
stem
Ref
eren
ce
k-n
eare
stne
ighb
or8
CA
MB
aile
yan
dM
eure
rs(2
008)
k-n
eare
stne
ighb
or9
CoM
iC-D
EM
eure
rset
al.(
2011
a)
k-n
eare
stne
ighb
or10
CoM
iC-E
NM
eure
rset
al.(
2011
b)
k-n
eare
stne
ighb
or18
Hor
bach
’13
Hor
bach
etal
.(20
13)
Lin
ear
regr
essi
on14
e-E
xam
iner
Gut
l(20
07)
Lin
ear
regr
essi
on29
Tand
ella
’12
Tand
alla
(201
2)
Log
isti
cre
gres
sion
23M
adna
ni’1
3M
adna
niet
al.(
2013
)
Nai
veB
ayes
31U
KP-
BIU
Zes
chet
al.(
2013
)
Stac
king
11C
onor
t’12
Con
ort(
2012
)
Stac
king
16E
TS
Hei
lman
and
Mad
nani
(201
3)
Stac
king
35Z
bont
ar’1
2Z
bont
ar(2
012)
SVM
19H
ou’1
1H
ouan
dT
sao
(201
1)
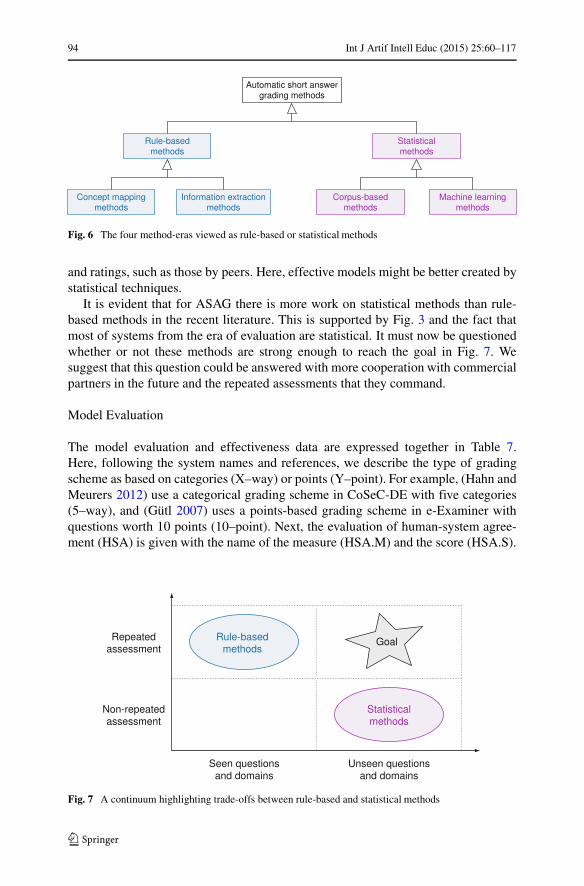
94 Int J Artif Intell Educ (2015) 25:60–117
Fig. 6 The four method-eras viewed as rule-based or statistical methods
and ratings, such as those by peers. Here, effective models might be better created bystatistical techniques.
It is evident that for ASAG there is more work on statistical methods than rule-based methods in the recent literature. This is supported by Fig. 3 and the fact thatmost of systems from the era of evaluation are statistical. It must now be questionedwhether or not these methods are strong enough to reach the goal in Fig. 7. Wesuggest that this question could be answered with more cooperation with commercialpartners in the future and the repeated assessments that they command.
Model Evaluation
The model evaluation and effectiveness data are expressed together in Table 7.Here, following the system names and references, we describe the type of gradingscheme as based on categories (X–way) or points (Y–point). For example, (Hahn andMeurers 2012) use a categorical grading scheme in CoSeC-DE with five categories(5–way), and (Gutl 2007) uses a points-based grading scheme in e-Examiner withquestions worth 10 points (10–point). Next, the evaluation of human-system agree-ment (HSA) is given with the name of the measure (HSA.M) and the score (HSA.S).
Fig. 7 A continuum highlighting trade-offs between rule-based and statistical methods
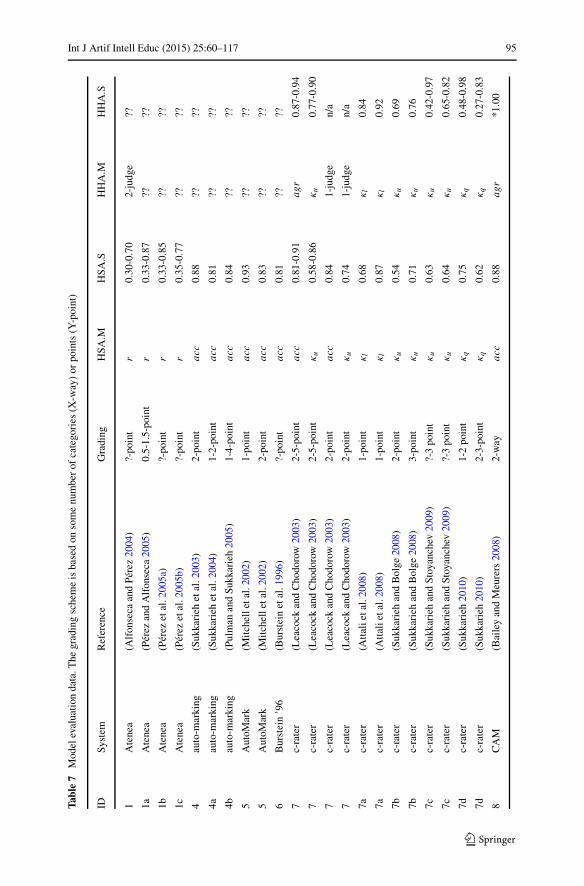
Int J Artif Intell Educ (2015) 25:60–117 95
Tabl
e7
Mod
elev
alua
tion
data
.The
grad
ing
sche
me
isba
sed
onso
me
num
ber
ofca
tego
ries
(X-w
ay)
orpo
ints
(Y-p
oint
)
IDSy
stem
Ref
eren
ceG
radi
ngH
SA.M
HSA
.SH
HA
.MH
HA
.S
1A
tene
a(A
lfon
seca
and
Pere
z20
04)
?-po
int
r0.
30-0
.70
2-ju
dge
??
1aA
tene
a(P
erez
and
Alf
onse
ca20
05)
0.5-
1.5-
poin
tr
0.33
-0.8
7??
??
1bA
tene
a(P
erez
etal
.200
5a)
?-po
int
r0.
33-0
.85
????
1cA
tene
a(P
erez
etal
.200
5b)
?-po
int
r0.
35-0
.77
????
4au
to-m
arki
ng(S
ukka
rieh
etal
.200
3)2-
poin
tacc
0.88
????
4aau
to-m
arki
ng(S
ukka
rieh
etal
.200
4)1-
2-po
int
acc
0.81
????
4bau
to-m
arki
ng(P
ulm
anan
dSu
kkar
ieh
2005
)1-
4-po
int
acc
0.84
????
5A
utoM
ark
(Mit
chel
leta
l.20
02)
1-po
int
acc
0.93
????
5A
utoM
ark
(Mit
chel
leta
l.20
02)
2-po
int
acc
0.83
????
6B
urst
ein
’96
(Bur
stei
net
al.1
996)
?-po
int
acc
0.81
????
7c-
rate
r(L
eaco
ckan
dC
hodo
row
2003
)2-
5-po
int
acc
0.81
-0.9
1agr
0.87
-0.9
4
7c-
rate
r(L
eaco
ckan
dC
hodo
row
2003
)2-
5-po
int
κu
0.58
-0.8
6κu
0.77
-0.9
0
7c-
rate
r(L
eaco
ckan
dC
hodo
row
2003
)2-
poin
tacc
0.84
1-ju
dge
n/a
7c-
rate
r(L
eaco
ckan
dC
hodo
row
2003
)2-
poin
tκu
0.74
1-ju
dge
n/a
7ac-
rate
r(A
ttal
ieta
l.20
08)
1-po
int
κl
0.68
κl
0.84
7ac-
rate
r(A
ttal
ieta
l.20
08)
1-po
int
κl
0.87
κl
0.92
7bc-
rate
r(S
ukka
rieh
and
Bol
ge20
08)
2-po
int
κu
0.54
κu
0.69
7bc-
rate
r(S
ukka
rieh
and
Bol
ge20
08)
3-po
int
κu
0.71
κu
0.76
7cc-
rate
r(S
ukka
rieh
and
Stoy
anch
ev20
09)
?-3
poin
tκu
0.63
κu
0.42
-0.9
7
7cc-
rate
r(S
ukka
rieh
and
Stoy
anch
ev20
09)
?-3
poin
tκu
0.64
κu
0.65
-0.8
2
7dc-
rate
r(S
ukka
rieh
2010
)1-
2po
int
κq
0.75
κq
0.48
-0.9
8
7dc-
rate
r(S
ukka
rieh
2010
)2-
3-po
int
κq
0.62
κq
0.27
-0.8
3
8C
AM
(Bai
ley
and
Meu
rers
2008
)2-
way
acc
0.88
agr
*1.0
0
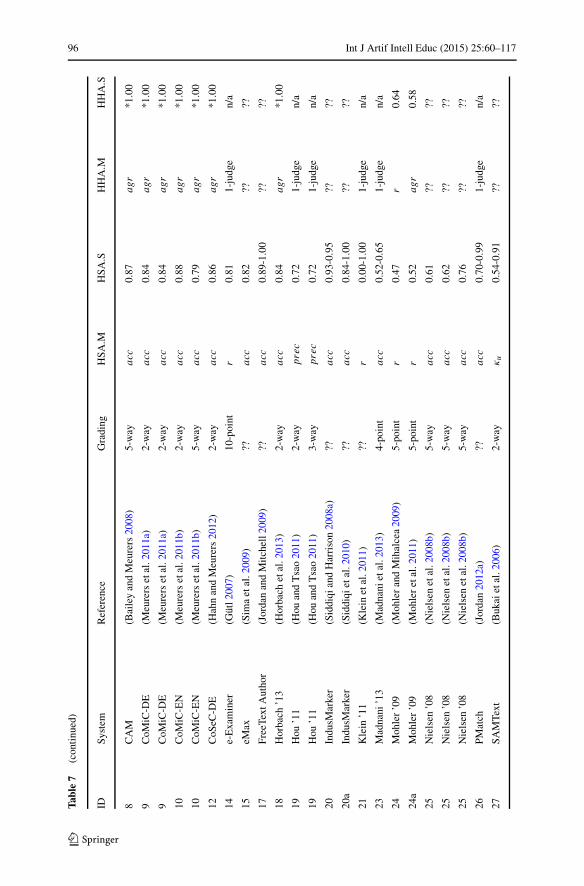
96 Int J Artif Intell Educ (2015) 25:60–117
Tabl
e7
(con
tinu
ed)
IDSy
stem
Ref
eren
ceG
radi
ngH
SA.M
HSA
.SH
HA
.MH
HA
.S
8C
AM
(Bai
ley
and
Meu
rers
2008
)5-
way
acc
0.87
agr
*1.0
0
9C
oMiC
-DE
(Meu
rers
etal
.201
1a)
2-w
ayacc
0.84
agr
*1.0
0
9C
oMiC
-DE
(Meu
rers
etal
.201
1a)
2-w
ayacc
0.84
agr
*1.0
0
10C
oMiC
-EN
(Meu
rers
etal
.201
1b)
2-w
ayacc
0.88
agr
*1.0
0
10C
oMiC
-EN
(Meu
rers
etal
.201
1b)
5-w
ayacc
0.79
agr
*1.0
0
12C
oSeC
-DE
(Hah
nan
dM
eure
rs20
12)
2-w
ayacc
0.86
agr
*1.0
0
14e-
Exa
min
er(G
utl2
007)
10-p
oint
r0.
811-
judg
en/
a
15eM
ax(S
ima
etal
.200
9)??
acc
0.82
????
17Fr
eeTe
xtA
utho
r(J
orda
nan
dM
itch
ell2
009)
??acc
0.89
-1.0
0??
??
18H
orba
ch’1
3(H
orba
chet
al.2
013)
2-w
ayacc
0.84
agr
*1.0
0
19H
ou’1
1(H
ouan
dT
sao
2011
)2-
way
prec
0.72
1-ju
dge
n/a
19H
ou’1
1(H
ouan
dT
sao
2011
)3-
way
prec
0.72
1-ju
dge
n/a
20In
dusM
arke
r(S
iddi
qian
dH
arri
son
2008
a)??
acc
0.93
-0.9
5??
??
20a
Indu
sMar
ker
(Sid
diqi
etal
.201
0)??
acc
0.84
-1.0
0??
??
21K
lein
’11
(Kle
inet
al.2
011)
??r
0.00
-1.0
01-
judg
en/
a
23M
adna
ni’1
3(M
adna
niet
al.2
013)
4-po
int
acc
0.52
-0.6
51-
judg
en/
a
24M
ohle
r’0
9(M
ohle
ran
dM
ihal
cea
2009
)5-
poin
tr
0.47
r0.
64
24a
Moh
ler
’09
(Moh
ler
etal
.201
1)5-
poin
tr
0.52
agr
0.58
25N
iels
en’0
8(N
iels
enet
al.2
008b
)5-
way
acc
0.61
????
25N
iels
en’0
8(N
iels
enet
al.2
008b
)5-
way
acc
0.62
????
25N
iels
en’0
8(N
iels
enet
al.2
008b
)5-
way
acc
0.76
????
26PM
atch
(Jor
dan
2012
a)??
acc
0.70
-0.9
91-
judg
en/
a
27SA
MTe
xt(B
ukai
etal
.200
6)2-
way
κu
0.54
-0.9
1??
??
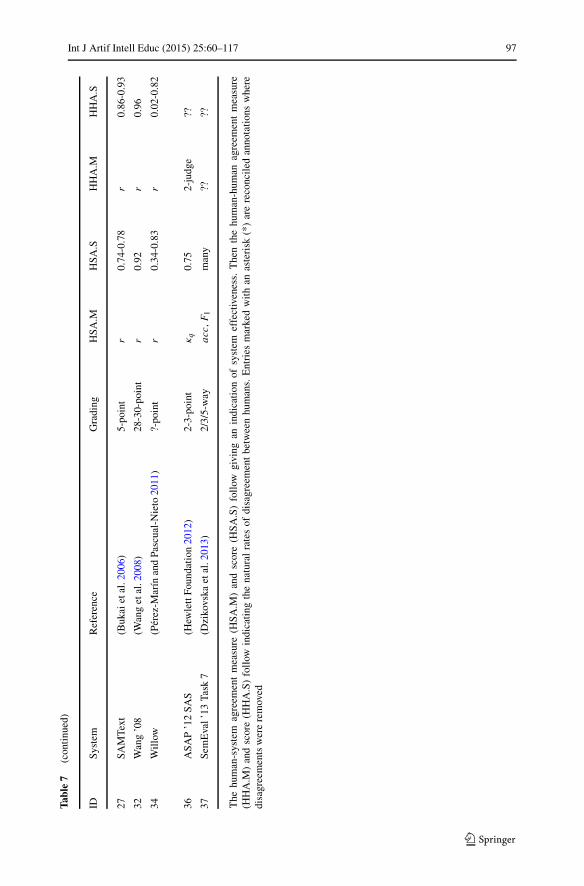
Int J Artif Intell Educ (2015) 25:60–117 97Ta
ble
7(c
onti
nued
)
IDSy
stem
Ref
eren
ceG
radi
ngH
SA.M
HSA
.SH
HA
.MH
HA
.S
27SA
MTe
xt(B
ukai
etal
.200
6)5-
poin
tr
0.74
-0.7
8r
0.86
-0.9
3
32W
ang
’08
(Wan
get
al.2
008)
28-3
0-po
int
r0.
92r
0.96
34W
illo
w(P
erez
-Mar
ınan
dPa
scua
l-N
ieto
2011
)?-
poin
tr
0.34
-0.8
3r
0.02
-0.8
2
36A
SAP
’12
SAS
(Hew
lett
Foun
dati
on20
12)
2-3-
poin
tκq
0.75
2-ju
dge
??
37Se
mE
val’
13Ta
sk7
(Dzi
kovs
kaet
al.2
013)
2/3/
5-w
ayacc,F
1m
any
????
The
hum
an-s
yste
mag
reem
ent
mea
sure
(HSA
.M)
and
scor
e(H
SA.S
)fo
llow
givi
ngan
indi
cati
onof
syst
emef
fect
iven
ess.
The
nth
ehu
man
-hum
anag
reem
ent
mea
sure
(HH
A.M
)an
dsc
ore
(HH
A.S
)fo
llow
indi
cati
ngth
ena
tura
lra
tes
ofdi
sagr
eem
ent
betw
een
hum
ans.
Ent
ries
mar
ked
wit
han
aste
risk
(*)
are
reco
ncil
edan
nota
tion
sw
here
disa
gree
men
tsw
ere
rem
oved
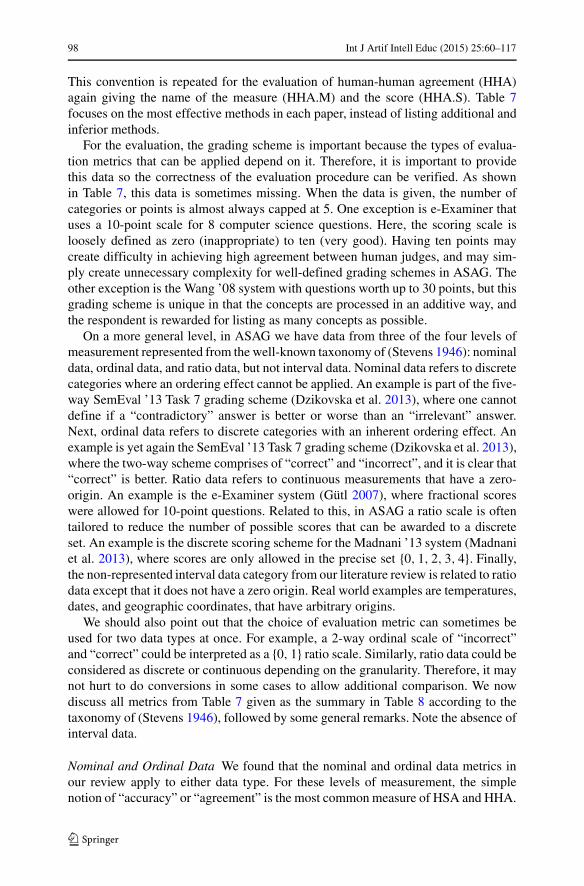
98 Int J Artif Intell Educ (2015) 25:60–117
This convention is repeated for the evaluation of human-human agreement (HHA)again giving the name of the measure (HHA.M) and the score (HHA.S). Table 7focuses on the most effective methods in each paper, instead of listing additional andinferior methods.
For the evaluation, the grading scheme is important because the types of evalua-tion metrics that can be applied depend on it. Therefore, it is important to providethis data so the correctness of the evaluation procedure can be verified. As shownin Table 7, this data is sometimes missing. When the data is given, the number ofcategories or points is almost always capped at 5. One exception is e-Examiner thatuses a 10-point scale for 8 computer science questions. Here, the scoring scale isloosely defined as zero (inappropriate) to ten (very good). Having ten points maycreate difficulty in achieving high agreement between human judges, and may sim-ply create unnecessary complexity for well-defined grading schemes in ASAG. Theother exception is the Wang ’08 system with questions worth up to 30 points, but thisgrading scheme is unique in that the concepts are processed in an additive way, andthe respondent is rewarded for listing as many concepts as possible.
On a more general level, in ASAG we have data from three of the four levels ofmeasurement represented from the well-known taxonomy of (Stevens 1946): nominaldata, ordinal data, and ratio data, but not interval data. Nominal data refers to discretecategories where an ordering effect cannot be applied. An example is part of the five-way SemEval ’13 Task 7 grading scheme (Dzikovska et al. 2013), where one cannotdefine if a “contradictory” answer is better or worse than an “irrelevant” answer.Next, ordinal data refers to discrete categories with an inherent ordering effect. Anexample is yet again the SemEval ’13 Task 7 grading scheme (Dzikovska et al. 2013),where the two-way scheme comprises of “correct” and “incorrect”, and it is clear that“correct” is better. Ratio data refers to continuous measurements that have a zero-origin. An example is the e-Examiner system (Gutl 2007), where fractional scoreswere allowed for 10-point questions. Related to this, in ASAG a ratio scale is oftentailored to reduce the number of possible scores that can be awarded to a discreteset. An example is the discrete scoring scheme for the Madnani ’13 system (Madnaniet al. 2013), where scores are only allowed in the precise set {0, 1, 2, 3, 4}. Finally,the non-represented interval data category from our literature review is related to ratiodata except that it does not have a zero origin. Real world examples are temperatures,dates, and geographic coordinates, that have arbitrary origins.
We should also point out that the choice of evaluation metric can sometimes beused for two data types at once. For example, a 2-way ordinal scale of “incorrect”and “correct” could be interpreted as a {0, 1} ratio scale. Similarly, ratio data could beconsidered as discrete or continuous depending on the granularity. Therefore, it maynot hurt to do conversions in some cases to allow additional comparison. We nowdiscuss all metrics from Table 7 given as the summary in Table 8 according to thetaxonomy of (Stevens 1946), followed by some general remarks. Note the absence ofinterval data.
Nominal and Ordinal Data We found that the nominal and ordinal data metrics inour review apply to either data type. For these levels of measurement, the simplenotion of “accuracy” or “agreement” is the most common measure of HSA and HHA.
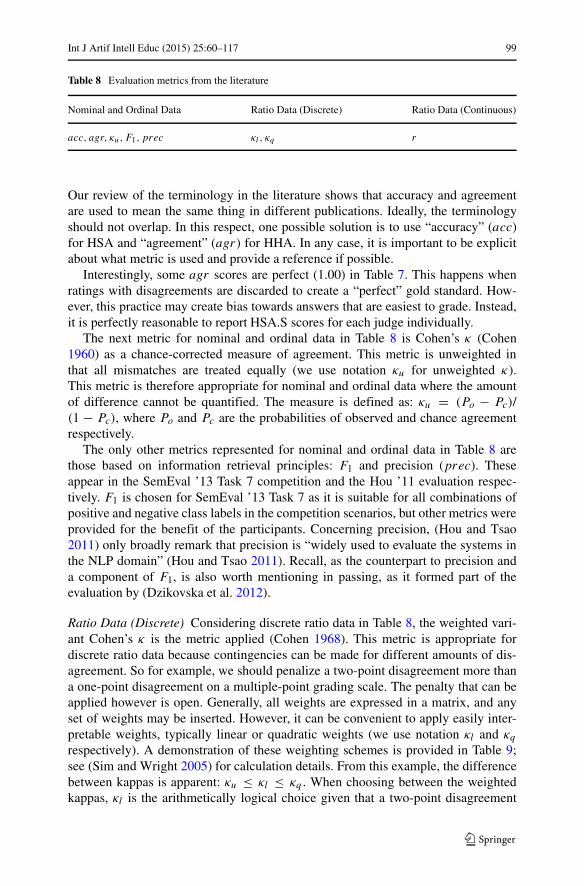
Int J Artif Intell Educ (2015) 25:60–117 99
Table 8 Evaluation metrics from the literature
Nominal and Ordinal Data Ratio Data (Discrete) Ratio Data (Continuous)
acc, agr, κu, F1, prec κl , κq r
Our review of the terminology in the literature shows that accuracy and agreementare used to mean the same thing in different publications. Ideally, the terminologyshould not overlap. In this respect, one possible solution is to use “accuracy” (acc)for HSA and “agreement” (agr) for HHA. In any case, it is important to be explicitabout what metric is used and provide a reference if possible.
Interestingly, some agr scores are perfect (1.00) in Table 7. This happens whenratings with disagreements are discarded to create a “perfect” gold standard. How-ever, this practice may create bias towards answers that are easiest to grade. Instead,it is perfectly reasonable to report HSA.S scores for each judge individually.
The next metric for nominal and ordinal data in Table 8 is Cohen’s κ (Cohen1960) as a chance-corrected measure of agreement. This metric is unweighted inthat all mismatches are treated equally (we use notation κu for unweighted κ).This metric is therefore appropriate for nominal and ordinal data where the amountof difference cannot be quantified. The measure is defined as: κu = (Po − Pc)/(1 − Pc), where Po and Pc are the probabilities of observed and chance agreementrespectively.
The only other metrics represented for nominal and ordinal data in Table 8 arethose based on information retrieval principles: F1 and precision (prec). Theseappear in the SemEval ’13 Task 7 competition and the Hou ’11 evaluation respec-tively. F1 is chosen for SemEval ’13 Task 7 as it is suitable for all combinations ofpositive and negative class labels in the competition scenarios, but other metrics wereprovided for the benefit of the participants. Concerning precision, (Hou and Tsao2011) only broadly remark that precision is “widely used to evaluate the systems inthe NLP domain” (Hou and Tsao 2011). Recall, as the counterpart to precision anda component of F1, is also worth mentioning in passing, as it formed part of theevaluation by (Dzikovska et al. 2012).
Ratio Data (Discrete) Considering discrete ratio data in Table 8, the weighted vari-ant Cohen’s κ is the metric applied (Cohen 1968). This metric is appropriate fordiscrete ratio data because contingencies can be made for different amounts of dis-agreement. So for example, we should penalize a two-point disagreement more thana one-point disagreement on a multiple-point grading scale. The penalty that can beapplied however is open. Generally, all weights are expressed in a matrix, and anyset of weights may be inserted. However, it can be convenient to apply easily inter-pretable weights, typically linear or quadratic weights (we use notation κl and κq
respectively). A demonstration of these weighting schemes is provided in Table 9;see (Sim and Wright 2005) for calculation details. From this example, the differencebetween kappas is apparent: κu ≤ κl ≤ κq . When choosing between the weightedkappas, κl is the arithmetically logical choice given that a two-point disagreement
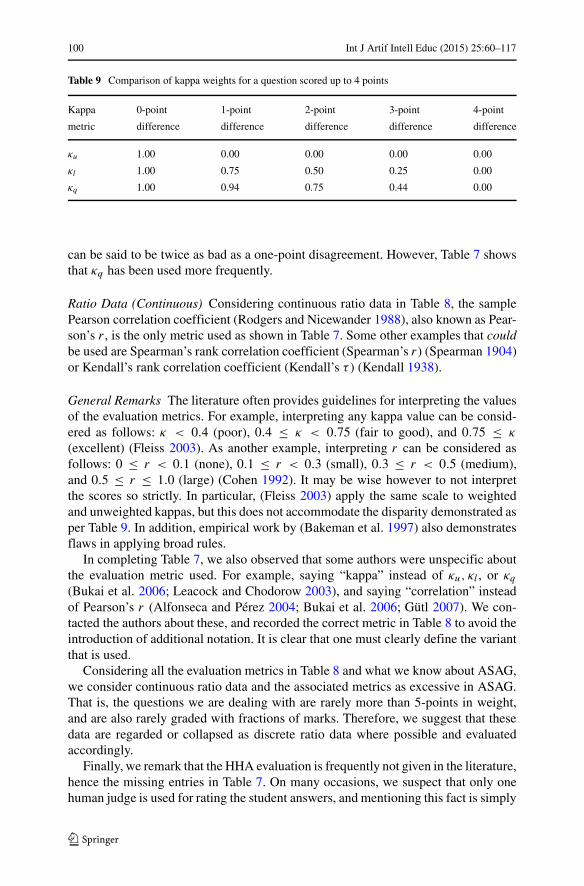
100 Int J Artif Intell Educ (2015) 25:60–117
Table 9 Comparison of kappa weights for a question scored up to 4 points
Kappa 0-point 1-point 2-point 3-point 4-point
metric difference difference difference difference difference
κu 1.00 0.00 0.00 0.00 0.00
κl 1.00 0.75 0.50 0.25 0.00
κq 1.00 0.94 0.75 0.44 0.00
can be said to be twice as bad as a one-point disagreement. However, Table 7 showsthat κq has been used more frequently.
Ratio Data (Continuous) Considering continuous ratio data in Table 8, the samplePearson correlation coefficient (Rodgers and Nicewander 1988), also known as Pear-son’s r , is the only metric used as shown in Table 7. Some other examples that couldbe used are Spearman’s rank correlation coefficient (Spearman’s r) (Spearman 1904)or Kendall’s rank correlation coefficient (Kendall’s τ ) (Kendall 1938).
General Remarks The literature often provides guidelines for interpreting the valuesof the evaluation metrics. For example, interpreting any kappa value can be consid-ered as follows: κ < 0.4 (poor), 0.4 ≤ κ < 0.75 (fair to good), and 0.75 ≤ κ
(excellent) (Fleiss 2003). As another example, interpreting r can be considered asfollows: 0 ≤ r < 0.1 (none), 0.1 ≤ r < 0.3 (small), 0.3 ≤ r < 0.5 (medium),and 0.5 ≤ r ≤ 1.0 (large) (Cohen 1992). It may be wise however to not interpretthe scores so strictly. In particular, (Fleiss 2003) apply the same scale to weightedand unweighted kappas, but this does not accommodate the disparity demonstrated asper Table 9. In addition, empirical work by (Bakeman et al. 1997) also demonstratesflaws in applying broad rules.
In completing Table 7, we also observed that some authors were unspecific aboutthe evaluation metric used. For example, saying “kappa” instead of κu, κl , or κq
(Bukai et al. 2006; Leacock and Chodorow 2003), and saying “correlation” insteadof Pearson’s r (Alfonseca and Perez 2004; Bukai et al. 2006; Gutl 2007). We con-tacted the authors about these, and recorded the correct metric in Table 8 to avoid theintroduction of additional notation. It is clear that one must clearly define the variantthat is used.
Considering all the evaluation metrics in Table 8 and what we know about ASAG,we consider continuous ratio data and the associated metrics as excessive in ASAG.That is, the questions we are dealing with are rarely more than 5-points in weight,and are also rarely graded with fractions of marks. Therefore, we suggest that thesedata are regarded or collapsed as discrete ratio data where possible and evaluatedaccordingly.
Finally, we remark that the HHA evaluation is frequently not given in the literature,hence the missing entries in Table 7. On many occasions, we suspect that only onehuman judge is used for rating the student answers, and mentioning this fact is simply
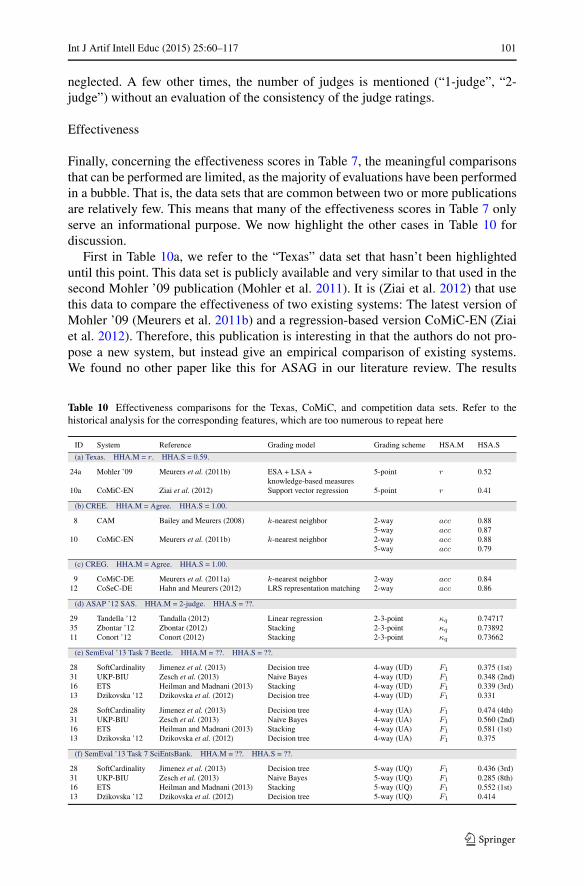
Int J Artif Intell Educ (2015) 25:60–117 101
neglected. A few other times, the number of judges is mentioned (“1-judge”, “2-judge”) without an evaluation of the consistency of the judge ratings.
Effectiveness
Finally, concerning the effectiveness scores in Table 7, the meaningful comparisonsthat can be performed are limited, as the majority of evaluations have been performedin a bubble. That is, the data sets that are common between two or more publicationsare relatively few. This means that many of the effectiveness scores in Table 7 onlyserve an informational purpose. We now highlight the other cases in Table 10 fordiscussion.
First in Table 10a, we refer to the “Texas” data set that hasn’t been highlighteduntil this point. This data set is publicly available and very similar to that used in thesecond Mohler ’09 publication (Mohler et al. 2011). It is (Ziai et al. 2012) that usethis data to compare the effectiveness of two existing systems: The latest version ofMohler ’09 (Meurers et al. 2011b) and a regression-based version CoMiC-EN (Ziaiet al. 2012). Therefore, this publication is interesting in that the authors do not pro-pose a new system, but instead give an empirical comparison of existing systems.We found no other paper like this for ASAG in our literature review. The results
Table 10 Effectiveness comparisons for the Texas, CoMiC, and competition data sets. Refer to thehistorical analysis for the corresponding features, which are too numerous to repeat here
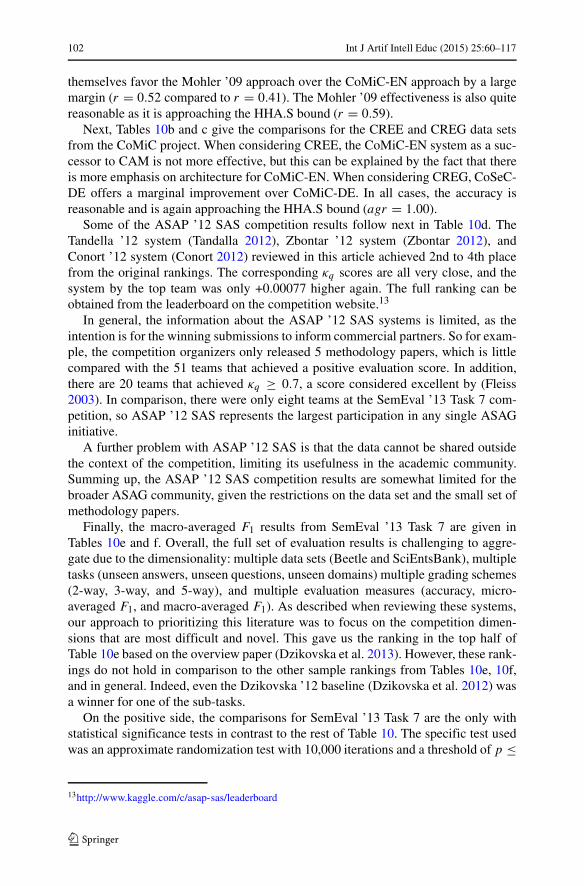
102 Int J Artif Intell Educ (2015) 25:60–117
themselves favor the Mohler ’09 approach over the CoMiC-EN approach by a largemargin (r = 0.52 compared to r = 0.41). The Mohler ’09 effectiveness is also quitereasonable as it is approaching the HHA.S bound (r = 0.59).
Next, Tables 10b and c give the comparisons for the CREE and CREG data setsfrom the CoMiC project. When considering CREE, the CoMiC-EN system as a suc-cessor to CAM is not more effective, but this can be explained by the fact that thereis more emphasis on architecture for CoMiC-EN. When considering CREG, CoSeC-DE offers a marginal improvement over CoMiC-DE. In all cases, the accuracy isreasonable and is again approaching the HHA.S bound (agr = 1.00).
Some of the ASAP ’12 SAS competition results follow next in Table 10d. TheTandella ’12 system (Tandalla 2012), Zbontar ’12 system (Zbontar 2012), andConort ’12 system (Conort 2012) reviewed in this article achieved 2nd to 4th placefrom the original rankings. The corresponding κq scores are all very close, and thesystem by the top team was only +0.00077 higher again. The full ranking can beobtained from the leaderboard on the competition website.13
In general, the information about the ASAP ’12 SAS systems is limited, as theintention is for the winning submissions to inform commercial partners. So for exam-ple, the competition organizers only released 5 methodology papers, which is littlecompared with the 51 teams that achieved a positive evaluation score. In addition,there are 20 teams that achieved κq ≥ 0.7, a score considered excellent by (Fleiss2003). In comparison, there were only eight teams at the SemEval ’13 Task 7 com-petition, so ASAP ’12 SAS represents the largest participation in any single ASAGinitiative.
A further problem with ASAP ’12 SAS is that the data cannot be shared outsidethe context of the competition, limiting its usefulness in the academic community.Summing up, the ASAP ’12 SAS competition results are somewhat limited for thebroader ASAG community, given the restrictions on the data set and the small set ofmethodology papers.
Finally, the macro-averaged F1 results from SemEval ’13 Task 7 are given inTables 10e and f. Overall, the full set of evaluation results is challenging to aggre-gate due to the dimensionality: multiple data sets (Beetle and SciEntsBank), multipletasks (unseen answers, unseen questions, unseen domains) multiple grading schemes(2-way, 3-way, and 5-way), and multiple evaluation measures (accuracy, micro-averaged F1, and macro-averaged F1). As described when reviewing these systems,our approach to prioritizing this literature was to focus on the competition dimen-sions that are most difficult and novel. This gave us the ranking in the top half ofTable 10e based on the overview paper (Dzikovska et al. 2013). However, these rank-ings do not hold in comparison to the other sample rankings from Tables 10e, 10f,and in general. Indeed, even the Dzikovska ’12 baseline (Dzikovska et al. 2012) wasa winner for one of the sub-tasks.
On the positive side, the comparisons for SemEval ’13 Task 7 are the only withstatistical significance tests in contrast to the rest of Table 10. The specific test usedwas an approximate randomization test with 10,000 iterations and a threshold of p ≤
13http://www.kaggle.com/c/asap-sas/leaderboard
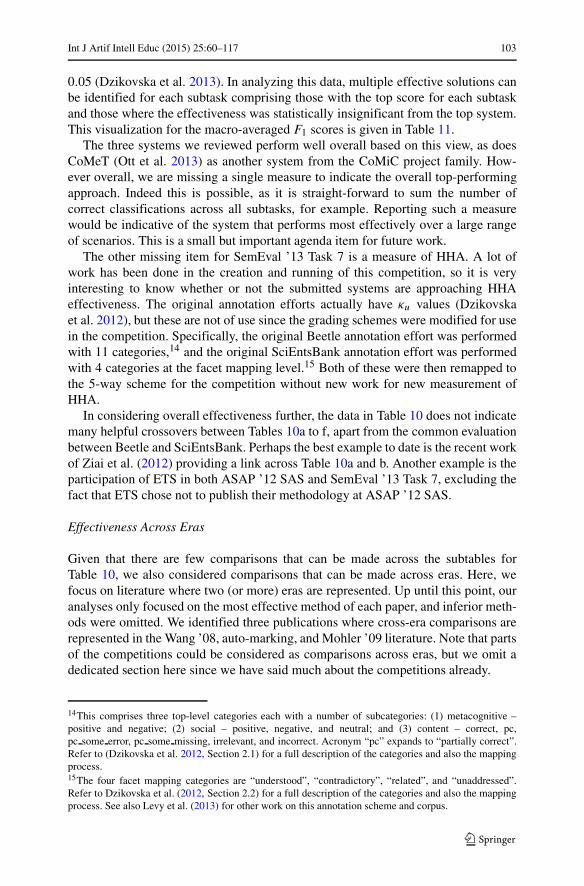
Int J Artif Intell Educ (2015) 25:60–117 103
0.05 (Dzikovska et al. 2013). In analyzing this data, multiple effective solutions canbe identified for each subtask comprising those with the top score for each subtaskand those where the effectiveness was statistically insignificant from the top system.This visualization for the macro-averaged F1 scores is given in Table 11.
The three systems we reviewed perform well overall based on this view, as doesCoMeT (Ott et al. 2013) as another system from the CoMiC project family. How-ever overall, we are missing a single measure to indicate the overall top-performingapproach. Indeed this is possible, as it is straight-forward to sum the number ofcorrect classifications across all subtasks, for example. Reporting such a measurewould be indicative of the system that performs most effectively over a large rangeof scenarios. This is a small but important agenda item for future work.
The other missing item for SemEval ’13 Task 7 is a measure of HHA. A lot ofwork has been done in the creation and running of this competition, so it is veryinteresting to know whether or not the submitted systems are approaching HHAeffectiveness. The original annotation efforts actually have κu values (Dzikovskaet al. 2012), but these are not of use since the grading schemes were modified for usein the competition. Specifically, the original Beetle annotation effort was performedwith 11 categories,14 and the original SciEntsBank annotation effort was performedwith 4 categories at the facet mapping level.15 Both of these were then remapped tothe 5-way scheme for the competition without new work for new measurement ofHHA.
In considering overall effectiveness further, the data in Table 10 does not indicatemany helpful crossovers between Tables 10a to f, apart from the common evaluationbetween Beetle and SciEntsBank. Perhaps the best example to date is the recent workof Ziai et al. (2012) providing a link across Table 10a and b. Another example is theparticipation of ETS in both ASAP ’12 SAS and SemEval ’13 Task 7, excluding thefact that ETS chose not to publish their methodology at ASAP ’12 SAS.
Effectiveness Across Eras
Given that there are few comparisons that can be made across the subtables forTable 10, we also considered comparisons that can be made across eras. Here, wefocus on literature where two (or more) eras are represented. Up until this point, ouranalyses only focused on the most effective method of each paper, and inferior meth-ods were omitted. We identified three publications where cross-era comparisons arerepresented in the Wang ’08, auto-marking, and Mohler ’09 literature. Note that partsof the competitions could be considered as comparisons across eras, but we omit adedicated section here since we have said much about the competitions already.
14This comprises three top-level categories each with a number of subcategories: (1) metacognitive –positive and negative; (2) social – positive, negative, and neutral; and (3) content – correct, pc,pc some error, pc some missing, irrelevant, and incorrect. Acronym “pc” expands to “partially correct”.Refer to (Dzikovska et al. 2012, Section 2.1) for a full description of the categories and also the mappingprocess.15The four facet mapping categories are “understood”, “contradictory”, “related”, and “unaddressed”.Refer to Dzikovska et al. (2012, Section 2.2) for a full description of the categories and also the mappingprocess. See also Levy et al. (2013) for other work on this annotation scheme and corpus.
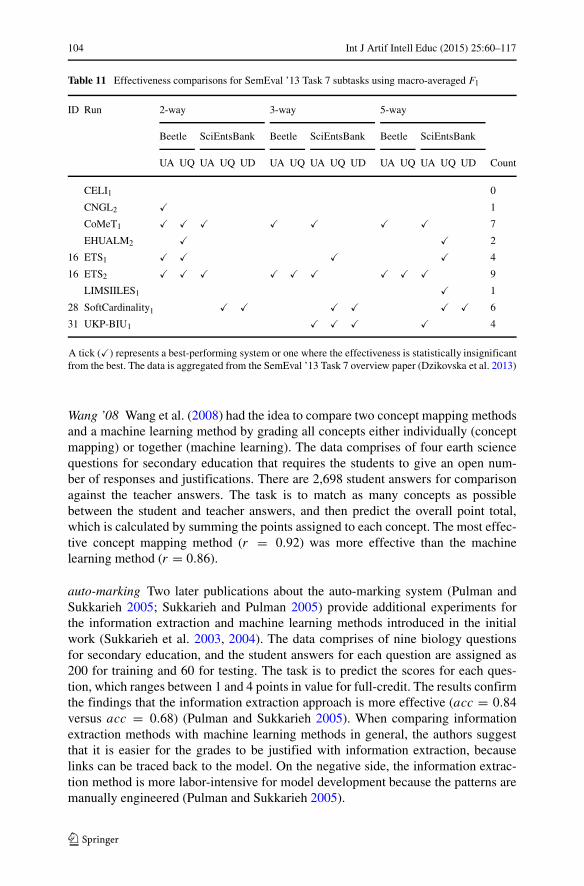
104 Int J Artif Intell Educ (2015) 25:60–117
Table 11 Effectiveness comparisons for SemEval ’13 Task 7 subtasks using macro-averaged F1
ID Run 2-way 3-way 5-way
Beetle SciEntsBank Beetle SciEntsBank Beetle SciEntsBank
UA UQ UA UQ UD UA UQ UA UQ UD UA UQ UA UQ UD Count
CELI1 0
CNGL2 � 1
CoMeT1 � � � � � � � 7
EHUALM2 � � 2
16 ETS1 � � � � 4
16 ETS2 � � � � � � � � � 9
LIMSIILES1 � 1
28 SoftCardinality1 � � � � � � 6
31 UKP-BIU1 � � � � 4
A tick (�) represents a best-performing system or one where the effectiveness is statistically insignificantfrom the best. The data is aggregated from the SemEval ’13 Task 7 overview paper (Dzikovska et al. 2013)
Wang ’08 Wang et al. (2008) had the idea to compare two concept mapping methodsand a machine learning method by grading all concepts either individually (conceptmapping) or together (machine learning). The data comprises of four earth sciencequestions for secondary education that requires the students to give an open num-ber of responses and justifications. There are 2,698 student answers for comparisonagainst the teacher answers. The task is to match as many concepts as possiblebetween the student and teacher answers, and then predict the overall point total,which is calculated by summing the points assigned to each concept. The most effec-tive concept mapping method (r = 0.92) was more effective than the machinelearning method (r = 0.86).
auto-marking Two later publications about the auto-marking system (Pulman andSukkarieh 2005; Sukkarieh and Pulman 2005) provide additional experiments forthe information extraction and machine learning methods introduced in the initialwork (Sukkarieh et al. 2003, 2004). The data comprises of nine biology questionsfor secondary education, and the student answers for each question are assigned as200 for training and 60 for testing. The task is to predict the scores for each ques-tion, which ranges between 1 and 4 points in value for full-credit. The results confirmthe findings that the information extraction approach is more effective (acc = 0.84versus acc = 0.68) (Pulman and Sukkarieh 2005). When comparing informationextraction methods with machine learning methods in general, the authors suggestthat it is easier for the grades to be justified with information extraction, becauselinks can be traced back to the model. On the negative side, the information extrac-tion method is more labor-intensive for model development because the patterns aremanually engineered (Pulman and Sukkarieh 2005).
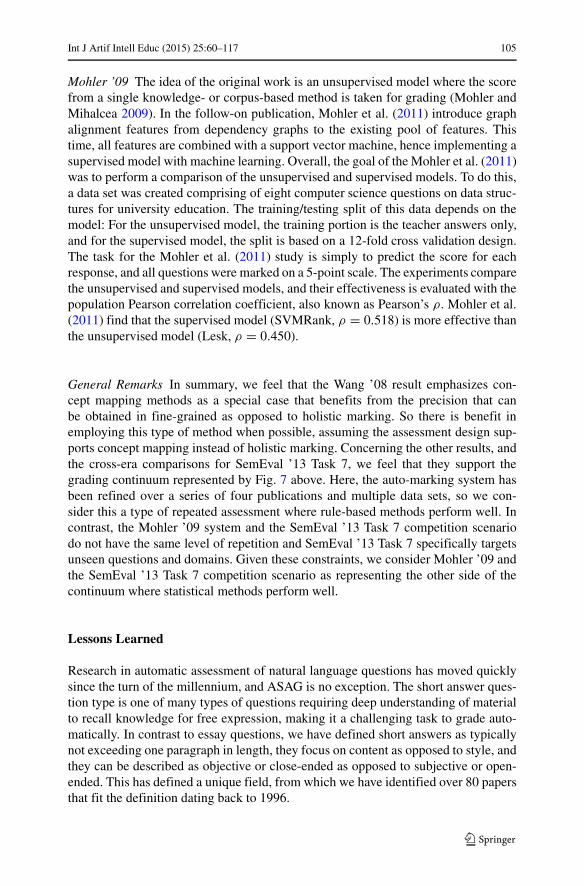
Int J Artif Intell Educ (2015) 25:60–117 105
Mohler ’09 The idea of the original work is an unsupervised model where the scorefrom a single knowledge- or corpus-based method is taken for grading (Mohler andMihalcea 2009). In the follow-on publication, Mohler et al. (2011) introduce graphalignment features from dependency graphs to the existing pool of features. Thistime, all features are combined with a support vector machine, hence implementing asupervised model with machine learning. Overall, the goal of the Mohler et al. (2011)was to perform a comparison of the unsupervised and supervised models. To do this,a data set was created comprising of eight computer science questions on data struc-tures for university education. The training/testing split of this data depends on themodel: For the unsupervised model, the training portion is the teacher answers only,and for the supervised model, the split is based on a 12-fold cross validation design.The task for the Mohler et al. (2011) study is simply to predict the score for eachresponse, and all questions were marked on a 5-point scale. The experiments comparethe unsupervised and supervised models, and their effectiveness is evaluated with thepopulation Pearson correlation coefficient, also known as Pearson’s ρ. Mohler et al.(2011) find that the supervised model (SVMRank, ρ = 0.518) is more effective thanthe unsupervised model (Lesk, ρ = 0.450).
General Remarks In summary, we feel that the Wang ’08 result emphasizes con-cept mapping methods as a special case that benefits from the precision that canbe obtained in fine-grained as opposed to holistic marking. So there is benefit inemploying this type of method when possible, assuming the assessment design sup-ports concept mapping instead of holistic marking. Concerning the other results, andthe cross-era comparisons for SemEval ’13 Task 7, we feel that they support thegrading continuum represented by Fig. 7 above. Here, the auto-marking system hasbeen refined over a series of four publications and multiple data sets, so we con-sider this a type of repeated assessment where rule-based methods perform well. Incontrast, the Mohler ’09 system and the SemEval ’13 Task 7 competition scenariodo not have the same level of repetition and SemEval ’13 Task 7 specifically targetsunseen questions and domains. Given these constraints, we consider Mohler ’09 andthe SemEval ’13 Task 7 competition scenario as representing the other side of thecontinuum where statistical methods perform well.
Lessons Learned
Research in automatic assessment of natural language questions has moved quicklysince the turn of the millennium, and ASAG is no exception. The short answer ques-tion type is one of many types of questions requiring deep understanding of materialto recall knowledge for free expression, making it a challenging task to grade auto-matically. In contrast to essay questions, we have defined short answers as typicallynot exceeding one paragraph in length, they focus on content as opposed to style, andthey can be described as objective or close-ended as opposed to subjective or open-ended. This has defined a unique field, from which we have identified over 80 papersthat fit the definition dating back to 1996.
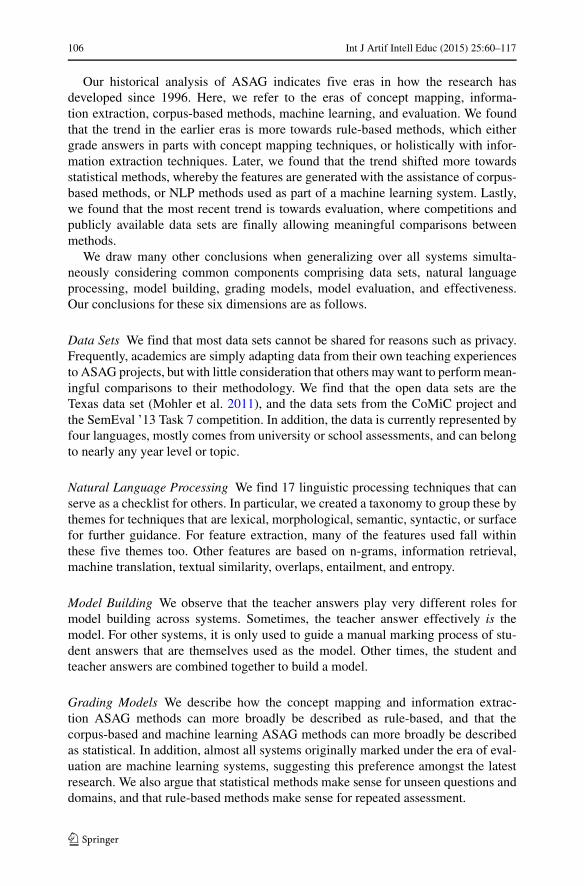
106 Int J Artif Intell Educ (2015) 25:60–117
Our historical analysis of ASAG indicates five eras in how the research hasdeveloped since 1996. Here, we refer to the eras of concept mapping, informa-tion extraction, corpus-based methods, machine learning, and evaluation. We foundthat the trend in the earlier eras is more towards rule-based methods, which eithergrade answers in parts with concept mapping techniques, or holistically with infor-mation extraction techniques. Later, we found that the trend shifted more towardsstatistical methods, whereby the features are generated with the assistance of corpus-based methods, or NLP methods used as part of a machine learning system. Lastly,we found that the most recent trend is towards evaluation, where competitions andpublicly available data sets are finally allowing meaningful comparisons betweenmethods.
We draw many other conclusions when generalizing over all systems simulta-neously considering common components comprising data sets, natural languageprocessing, model building, grading models, model evaluation, and effectiveness.Our conclusions for these six dimensions are as follows.
Data Sets We find that most data sets cannot be shared for reasons such as privacy.Frequently, academics are simply adapting data from their own teaching experiencesto ASAG projects, but with little consideration that others may want to perform mean-ingful comparisons to their methodology. We find that the open data sets are theTexas data set (Mohler et al. 2011), and the data sets from the CoMiC project andthe SemEval ’13 Task 7 competition. In addition, the data is currently represented byfour languages, mostly comes from university or school assessments, and can belongto nearly any year level or topic.
Natural Language Processing We find 17 linguistic processing techniques that canserve as a checklist for others. In particular, we created a taxonomy to group these bythemes for techniques that are lexical, morphological, semantic, syntactic, or surfacefor further guidance. For feature extraction, many of the features used fall withinthese five themes too. Other features are based on n-grams, information retrieval,machine translation, textual similarity, overlaps, entailment, and entropy.
Model Building We observe that the teacher answers play very different roles formodel building across systems. Sometimes, the teacher answer effectively is themodel. For other systems, it is only used to guide a manual marking process of stu-dent answers that are themselves used as the model. Other times, the student andteacher answers are combined together to build a model.
Grading Models We describe how the concept mapping and information extrac-tion ASAG methods can more broadly be described as rule-based, and that thecorpus-based and machine learning ASAG methods can more broadly be describedas statistical. In addition, almost all systems originally marked under the era of eval-uation are machine learning systems, suggesting this preference amongst the latestresearch. We also argue that statistical methods make sense for unseen questions anddomains, and that rule-based methods make sense for repeated assessment.
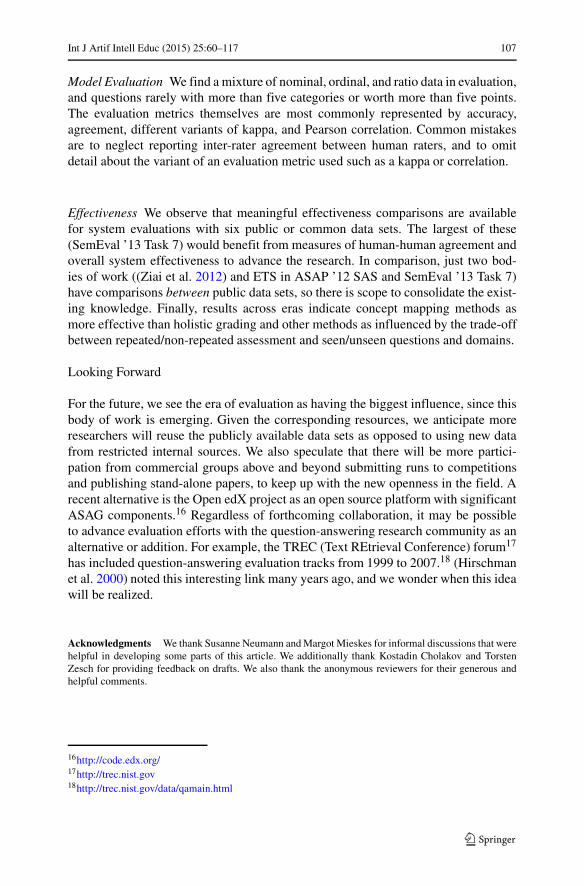
Int J Artif Intell Educ (2015) 25:60–117 107
Model Evaluation We find a mixture of nominal, ordinal, and ratio data in evaluation,and questions rarely with more than five categories or worth more than five points.The evaluation metrics themselves are most commonly represented by accuracy,agreement, different variants of kappa, and Pearson correlation. Common mistakesare to neglect reporting inter-rater agreement between human raters, and to omitdetail about the variant of an evaluation metric used such as a kappa or correlation.
Effectiveness We observe that meaningful effectiveness comparisons are availablefor system evaluations with six public or common data sets. The largest of these(SemEval ’13 Task 7) would benefit from measures of human-human agreement andoverall system effectiveness to advance the research. In comparison, just two bod-ies of work ((Ziai et al. 2012) and ETS in ASAP ’12 SAS and SemEval ’13 Task 7)have comparisons between public data sets, so there is scope to consolidate the exist-ing knowledge. Finally, results across eras indicate concept mapping methods asmore effective than holistic grading and other methods as influenced by the trade-offbetween repeated/non-repeated assessment and seen/unseen questions and domains.
Looking Forward
For the future, we see the era of evaluation as having the biggest influence, since thisbody of work is emerging. Given the corresponding resources, we anticipate moreresearchers will reuse the publicly available data sets as opposed to using new datafrom restricted internal sources. We also speculate that there will be more partici-pation from commercial groups above and beyond submitting runs to competitionsand publishing stand-alone papers, to keep up with the new openness in the field. Arecent alternative is the Open edX project as an open source platform with significantASAG components.16 Regardless of forthcoming collaboration, it may be possibleto advance evaluation efforts with the question-answering research community as analternative or addition. For example, the TREC (Text REtrieval Conference) forum17
has included question-answering evaluation tracks from 1999 to 2007.18 (Hirschmanet al. 2000) noted this interesting link many years ago, and we wonder when this ideawill be realized.
Acknowledgments We thank Susanne Neumann and Margot Mieskes for informal discussions that werehelpful in developing some parts of this article. We additionally thank Kostadin Cholakov and TorstenZesch for providing feedback on drafts. We also thank the anonymous reviewers for their generous andhelpful comments.
16http://code.edx.org/17http://trec.nist.gov18http://trec.nist.gov/data/qamain.html
108 Int J Artif Intell Educ (2015) 25:60–117
References
Aleven, V., Ogan, A., Popescu, O., Torrey, C., Koedinger, K. (2004). Evaluating the effectiveness of atutorial dialogue system for self-explanation. J.C. Lester, R.M. Vicari, F. Paraguacu (Eds.), Proceed-ings of the 7th international conference on intelligent tutoring systems volume 3220 of lecture notesin computer science (pp. 443–454). Maceio: Springer.
Alfonseca, E., & Perez, D. (2004). Automatic assessment of open ended questions with a BLEU-inspiredalgorithm and shallow NLP. In J. Vicedo, P. Martınez-Barco, Munoz, M. Saiz Noeda (Eds.), Advancesin natural language processing, volume 3230 of lecture notes in computer science (pp. 25–35). Berlin:Springer.
Alfonseca, E., Carro, R.M., Freire, M., Ortigosa, A., Perez, D., Rodriguez, P. (2005). Authoring ofadaptive computer assisted assessment of free-text answers. Educational Technology & Society,8(3), 53–65.
Attali, Y., & Burstein, J. (2006). Automated essay Scoring with e-rater V.2. The Journal of Technology,Learning, and Assessment, 4(3), 1–31.
Attali, Y., Powers, D., Freedman, M., Harrison, M., Obetz, S. (2008). Automated scoring of short-answeropen-ended GRE subject test items. Technical Report RR-08-20. Princeton: Educational TestingService.
Bachman, L.F., Carr, N., Kamei, G., Kim, M., Pan, M.J., Salvador, C., Sawaki, Y. (2002). A reliableapproach to automatic assessment of short answer free responses. In S.C. Tseng, T.E. Chen, Y.F. Liu(Eds.), Proceedings of the 19th international conference on computational linguistics, volume 2 ofCOLING ’02 (pp. 1–4). Taipei: Association for Computational Linguistics.
Bailey, S. (2008). Content assessment in intelligent computer-aided language learning: mean-ing error diagnosis for english as a second language. Ph.D. thesis, Columbus: Ohio StateUniversity.
Bailey, S., & Meurers, D. (2008). Diagnosing meaning errors in short answers to reading comprehensionquestions. In J. Tetreault, J. Burstein, R. De Felice (Eds.), Proceedings of the 3rd ACL workshop oninnovative use of NLP for building educational applications (pp. 107–115). Columbus: Associationfor Computational Linguistics.
Bakeman, R., McArthur, D., Quera, V., Robinson, B.F. (1997). Detecting sequential patterns anddetermining their reliability with fallible observers. Psychological Methods, 4(4), 357–370.
Bar, D., Zesch, T., Gurevych, I. (2011). A reflective view on text similarity. In R. Mitkov & G. Angelova(Eds.), Proceedings of the international conference on recent advances in natural language processing(pp. 515–520). Hissar: Association for Computational Linguistics.
Bar, D., Zesch, T., Gurevych, I. (2012a). Text reuse detection using a composition of text similarity mea-sures. In P. Bhattacharrya, R. Sangal, M. Kay, C. Boitet (Eds.), Proceedings of the 24th internationalconference on computational linguistics volume 1 of COLING ’12 (pp. 167–184. Mumbai: IndianInstitute of Technology Bombay.
Bar, D., Biemann, C., Gurevych, I., Zesch, T. (2012b). UKP: computing semantic textual similarity bycombining multiple content similarity measures. In S. Manandhar, D. Yuret (Eds.), Proceedings ofthe 6th international workshop on semantic evaluation (pp. 435–440). Montreal: Association forComputational Linguistics.
Bar, D., Zesch, T., Gurevych, I. (2013). DKPro similarity: an open source framework for text similarity.In H. Schuetze, P. Fung, M. Poesio (Eds.), Proceedings of the 51st annual meeting of the asso-ciation for computational linguistics. System demonstrations (pp. 121–126). Sofia: Association forComputational Linguistics.
Bar-Haim, R., Dagan, I., Dolan, B., Ferro, L., Giampiccolo, D., Magnini, B., Szpektor, I. (2006). Thesecond pascal recognising textual entailment challenge. In B. Magnini & I. Dagan (Eds.), Proceedingsof the 2nd Pascal challenges workshop on recognising textual entailment (pp. 1–9). Venice.
Bejar, I.I. (2011). A validity-based approach to quality control and assurance of automated scoring.Assessment in Education: Principles, Policy & Practice, 18(3), 319–341.
Bennett, R.E. (2011). Automated scoring of constructed-response literacy and mathematics items. Whitepaper, Educational Testing Service. Princeton.
Bentivogli, L., Dagan, I., Dang, H.T., Giampiccolo, D., Magnini, B. (2009). The fifth PASCAL recog-nizing textual entailment challenge. In Proceedings of the 2nd text analysis conference (pp. 1–15).Gaithersburg: National Institute of Standards and Technology.
Int J Artif Intell Educ (2015) 25:60–117 109
Bentivogli, L., Clark, P., Dagan, I., Giampiccolo, D. (2010). The sixth PASCAL recognizing textual entail-ment challenge. In Proceedings of the 3rd text analysis conference (pp. 1–18). Gaithersburg: NationalInstitute of Standards and Technology.
Bentivogli, L., Clark, P., Dagan, I., Giampiccolo, D. (2011). The seventh PASCAL recognizing textualentailment challenge. In Proceedings of the 4th text analysis conference (pp. 1–16). Gaithersburg:National Institute of Standards and Technology.
Breiman, L. (1996). Bagging predictors. Machine Learning, 24(2), 123–140.Bukai, O., Pokorny, R., Haynes, J. (2006). An automated short-free-text scoring system: development
and assessment. In Proceedings of the 20th interservice/industry training, simulation, and educationconference (pp. 1–11). National Training and Simulation Association.
Burrows, S., & D’Souza, D. (2005). Management of teaching in a complex setting. In J. Hurst &J. Sheard (Eds.), Proceedings of the 2nd melbourne computing education conventicle (pp. 1–8).Melbourne.
Burrows, S., Tahaghoghi, S.M.M., Zobel, J. (2007). Efficient plagiarism detection for large coderepositories. Software: Practice and Experience, 37(2), 151–175.
Burrows, S., Potthast, M., Stein, B. (2013). Paraphrase acquisition via crowdsourcing and machinelearning. ACM Transactions on Intelligent Systems and Technology, 4(3), 43:1–43:21.
Burrows, S., Uitdenbogerd, A.L., Turpin, A. (2014). Comparing techniques for authorship attribution ofsource code. Software: Practice and Experience, 44(1), 1–32.
Burstein, J., Kaplan, R., Wolff, S., Lu, C. (1996). Using lexical semantic techniques to classify free-responses. In E. Viegas (Ed.), Proceedings of the ACL SIGLEX workshop on breadth and depth ofsemantic lexicons (pp. 20–29). Santa Cruz: Association for Computational Linguistics.
Butcher, P.G., & Jordan, S.E. (2010). A comparison of human and computer marking of short free-textstudent responses. Computers & Education, 55(2), 489–499.
Callear, D., Jerrams-Smith, J., Soh, V. (2001). CAA of short non-MCQ answers. In M. Danson & C. Eabry(Eds.), Proceedings of the 5th computer assisted assessment conference (pp. 1–14). Loughborough:Loughborough University.
Cohen, J. (1960). A coefficient of agreement for nominal scales. Educational and PsychologicalMeasurement, 20(1), 37–46.
Cohen, J. (1968). Weighted kappa: nominal scale agreement with provision for scaled disagreement ofpartial credit. Psychological Bulletin, 70(4), 213–220.
Cohen, J. (1992). A power primer. Psychological Bulletin, 112(1), 155–159.Conole, G., & Warburton, B. (2005). A review of computer-assisted assessment. Journal of the Association
for Learning Technology, 13(1), 17–31.Conort, X. (2012). Short answer scoring – explanation of Gxav solution. ASAP ’12 SAS Methodology
paper, Gear Analytics.Cowie, J., & Wilks, Y. (2000). Information extraction. In R. Dale, H. Moisl, H. Somers (Eds.), Hand-
book of natural language processing, 1st edn. (Chap. 10, pp. 241–260). New York City: MarcelDekker.
Csink, L., Gyorgy, A., Raincsak, Z., Schmuck, B., Sima, D., Sziklai, Z., Szollosi, S. (2003). Intelligentassessment systems for e-learning. In F. Udrescu, I.G. Rosca , G.M. Sandulescu, R. Stroe (Eds.), Pro-ceedings of the 4th European conference on e-commerce, e-learning, e-business, e-work, e-health,e-banking, e-democracy, e-government, BB & on-line services applications, new working environ-ments, virtual institutes, and their influences on the economic and social environment E-COMM-LINE(pp. 224–229). Bucharest: R&D Institute for Automation Bucharest and Academy of EconomicStudies Bucharest.
Cutrone, L., & Chang, M. (2010). Automarking: automatic assessment of open questions. In M. Jemni, D.Sampson, Kinshuk, J.M. Spector (Eds.), Proceedings of the 10th IEEE international conference onadvanced learning technologies (pp. 143–147). Sousse: IEEE.
Cutrone, L., Chang, M., Kinshuk (2011). Auto-assessor: computerized assessment system for mark-ing student’s short-answers automatically. In: N.S. Narayanaswamy, M.S. Krishnan, Kinshuk, R.Srinivasan (Eds.), Proceedings of the 3rd IEEE international conference on technology for education(pp. 81–88). Chennai: IEEE.
Dagan, I., Glickman, O., Gan, R., Magnini, B. (2006). The PASCAL recognising textual entailment chal-lenge. In J. Quinonero-Candela, I. Dagan, B. Magnini, F. D’Alche Buc (Eds.), Machine learningchallenges, volume 3944 of lecture notes in computer science (pp. 177–190). Springer.
110 Int J Artif Intell Educ (2015) 25:60–117
Dorr, B., Hendler, J., Blanksteen, S., Migdaloff, B. (1995). On beyond syntax: use of lexical conceptualstructure for intelligent tutoring. In V.M. Holland, J. Kaplan, M. Sams (Eds.), Intelligent languagetutors, 1st edn. (pp. 289–311). Mahwah: Lawrence Erlbaum Publishers.
Dzikovska, M.O., Nielsen, R.D., Brew, C. (2012). Towards effective tutorial feedback for explanationquestions: a dataset and baselines. In J. Chu-Carroll, E. Fosler-Lussier, E. Riloff, S. Bangalore (Eds.),Proceedings of the 12th conference of the north american chapter of the association for computationallinguistics: human language technologies (pp. 200–210). Montreal: Association for ComputationalLinguistics.
Dzikovska, M.O., Nielsen, R.D., Brew, C., Leacock, C., Giampiccolo, D., Bentivogli, L., Clark, P., Dagan,I., Dang, H.T. (2013). SemEval-2013 task 7: the joint student response analysis and eighth recognizingtextual entailment challenge. In M. Diab, T. Baldwin, M. Baroni (Eds.), Proceedings of the 2nd jointconference on lexical and computational semantics (pp. 1–12). Atlanta.
Evens, M.W., Brandle, S., Chang, R.C., Freedman, R., Glass, M., Lee, Y.H., Shim, L.S., Woo, C.W.,Zhang, Y., Zhou, Y., Michael, J.A., Rovick, A.A. (2001). CIRCSIM-Tutor: an intelligent tutoringsystem using natural language dialogue, In Proceedings of the 12th midwest artificial intelligence andcognitive science conference (pp. 16–23). Oxford.
Fleiss, J.L. (2003). The measurement of interrater agreement. In J.L. Fleiss, B. Levin, M.C. Paik (Eds.),Statistical methods for rates and proportions, 3rd edn. (Chap. 18, pp. 598–626). Wiley.
Gabrilovich, E., & Markovitch, S. (2006). Overcoming the brittleness bottleneck using wikipedia: enhanc-ing text categorization with encyclopedic knowledge. In A. Cohn (Ed.), Proceedings of the 21stnational conference on artificial intelligence (Vol. 2, pp. 1301–1306). Boston: AAAI Press.
Gay, L.R. (1980). The comparative effects of multiple-choice versus short-answer tests on retention.Journal of Educational Measurement, 17(1), 45–50.
Giampiccolo, D., Magnini, B., Sommarive, V., Gan, R., Dolan, B. (2007). The third PASCAL recognizingtextual entailment challenge. In S. Sekine, K. Inui, I. Dagan, B. Dolan, D. Giampiccolo, B. Magnini(Eds.), Proceedings of the ACL-PASCAL workshop on textual entailment and paraphrasing (pp. 1–9).Prague: Association for Computational Linguistics.
Giampiccolo, D., Dang, H.T., Magnini, B., Dagan, I., Cabrio, E., Dolan, B. (2008). The fourth PASCALrecognizing textual entailment challenge. In Proceedings of the 1st text analysis conference (pp. 1–11). Gaithersburg: National Institute of Standards and Technology.
Gollub, T., Burrows, S., Stein, B. (2012a). First experiences with TIRA for reproducible evaluationin information retrieval. In A. Trotman, C.L.A. Clarke, I. Ounis, J.S. Culpepper, M.A. Cartright,S. Geva (Eds.), Proceedings of the 1st SIGIR workshop on open source information retrieval (pp. 52–55). Portland: University of Otago.
Gollub, T., Stein, B., Burrows, S. (2012b). Ousting ivory tower research: towards a web framework forproviding experiments as a service. In B. Hersh, J. Callan, Y. Maarek, M. Sanderson (Eds.), Proceed-ings of the 35th international ACM SIGIR conference on research and development in informationretrieval (pp. 1125–1126). Portland: ACM.
Gollub, T., Stein, B., Burrows, S., Hoppe, D. (2012c). TIRA: configuring, executing, and disseminatinginformation retrieval experiments. In A.M. Tjoa, S. Liddle, K.D. Schewe, X. Zhou (Eds.), Proceedingsof the 9th international workshop on text-based information retrieval at DEXA (pp. 151–155). Vienna:IEEE.
Gonzalez-Barbone, V., & Llamas-Nistal, M. (2008). eAssessment of open questions: an educator’s per-spective. In C. Traver, M. Ohland, J. Prey, T. Mitchell (Eds.), Proceedings of the 38th annual frontiersin education conference (pp. F2B–1–F2B–6). Saratoga Springs: IEEE.
Graesser, A.C., Chipman, P., Haynes, B.C., Olney, A. (2005). AutoTutor: an intelligent tutoring systemwith mixed-initiative dialogue. IEEE Transactions on Education, 48(4), 612–618.
Gutl, C. (2007). e-Examiner: towards a fully-automatic knowledge assessment tool applicable in adap-tive e-learning systems. In P.H. Ghassib (Ed.), Proceedings of the 2nd international conference oninteractive mobile and computer aided learning (pp. 1–10). Amman.
Gutl, C. (2008). Moving towards a fully automatic knowledge assessment tool. International Journal ofEmerging Technologies in Learning, 3(1), 1–11.
Gyorgy, A., & Vajda, I. (2007). Intelligent mathematics assessment in eMax. In Proceedings of the 8thAfricon conference (pp. 1–6). Windhoek: IEEE.
Hahn, M., & Meurers, D. (2012). Evaluating the meaning of answers to reading comprehension questions:a semantics-based approach. In J. Tetreault, J. Burstein, C. Leacock (Eds.), Proceedings of the 7th
Int J Artif Intell Educ (2015) 25:60–117 111
workshop on building educational applications using NLP (pp. 326–336). Montreal: Association forComputational Linguistics.
Haley, D.T., Thomas, P., Roeck, A.D., Petre, M. (2007). Measuring improvement in latent semanticanalysis-based marking systems: using a computer to mark questions about HTML. In S. Mann &Simon (Eds.), Proceedings of the 9th australasian conference on computing education, volume 66 ofACE (pp. 35–42). Ballarat: Australian Computer Society.
Hall, M., Frank, E., Holmes, G., Pfahringer, B., Reutemann, P., Witten, I.H. (2009). The WEKA datamining software: an update. SIGKDD Explorations, 11(1), 10–18.
Hamp, B., & Feldweg, H. (1997). GermaNet—a lexical-semantic net for german. In P. Vossen, G.Adriaens, N. Calzolari, A. Sanfilippo, Y. Wilks (Eds.), Proceedings of the 1st ACL workshop oninformation extraction and building of lexical semantic resources for NLP applications (pp. 9–16).Madrid: Association for Computational Linguistics.
Hayashi, F. (2000). Finite-sample properties of OLS. In Econometrics (Chap. 1, pp. 3–87). Princeton:Princeton University Press.
Heilman, M., & Madnani, N. (2013). ETS: domain adaptation and stacking for short answer scoring.In M. Diab, T. Baldwin, M. Baroni (Eds.), Proceedings of the 2nd joint conference on lexical andcomputational semantics (Vol. 2, pp. 275–279). Atlanta.
Hewlett Foundation (2012). Automated student assessment prize: phase two – short answer scoring.Kaggle Competition.
Hirschman, L., Breck, E., Light, M., Burger, J.D., Ferro, L. (2000). Automated grading of short-answertests. Intelligent Systems and their Applications, 15(5), 31–35.
Hirst, G., & St-Onge, D. (1998). Lexical chains as representations of contexts for the detection and cor-rection of malapropisms. In C. Fellbaum (Ed.), WordNet: an electronic lexical database, language,speech, and communication (Chap. 13, pp. 305–332). MIT Press.
Horbach, A., Palmer, A., Pinkal, M. (2013). Using the text to evaluate short answers for reading compre-hension exercises. In M. Diab, T. Baldwin, M. Baroni (Eds.), Proceedings of the 2nd joint conferenceon lexical and computational semantics (Vol. 1, pp. 286–295). Atlanta: Association for ComputationalLinguistics.
Hou, W.J., & Tsao, J.H. (2011). Automatic assessment of students’ free-text answers with different levels.International Journal on Artificial Intelligence Tools, 20(2), 327–347.
Hou, W.J., Tsao, J.H., Li, S.Y., Chen, L. (2010). Automatic assessment of students’ free-text answers withsupport vector machines. In M. Ali, C. Fyfe, N. Garcıa-Pedrajas, F. Herrera (Eds.), Proceedings of the23rd international conference on industrial engineering and other applications of applied intelligentsystems (Vol. 1, pp. 235–243). Cordoba: Springer.
Hou, W.-J., Tsao, J.-H., Lu, C.-S., Chen, L.-C. (2011). Free-text assessment of students’ answers withdifferent feature selections. In K. Tang & H. Koguchi (Eds.), Proceedings of the 5th international con-ference on e-commerce, e-administration, e-society, e-education, and e-technology (pp. 2489–2510).Tokyo: Knowledge Association of Taiwan and International Business Academics Consortium.
Hou, W.-J., Lu, C.-S., Chang, C.-P., Chen, H.-Y. (2012). Learning diagnosis for students’ free-text answerswith feature-based approaches. In Proceedings of the 1st international conference on informationand computer applications (Vol. 24, pp. 42–47). Hong Kong: International Association of ComputerScience and Information Technology.
Intelligent Assessment Technologies (2009). E-assessment of short-answer questions. White paper.Coatbridge.
Jiang, J.J., & Conrath, D.W. (1997). Semantic Similarity based on corpus statistics and lexical taxon-omy. In L.-S. Lee, K.-J. Chen, C.-R. Huang, R. Sproat (Eds.), Proceedings of the 10th internationalconference on research in computational linguistics (pp. 1–15). Taipei.
Jimenez, S., Becerra, C., Universitaria, C., Gelbukh, A. (2013). SOFTCARDINALITY: hierarchicaltext overlap for student response analysis. In M. Diab, T. Baldwin, M. Baroni (Eds.), Proceed-ings of the 2nd joint conference on lexical and computational semantics (Vol. 2, pp. 280–284).Atlanta.
Jordan, S. (2007). Computer based assessment with short free responses and tailored feedback. In P. Chin,K. Clark, S. Doyle, P. Goodhew, T. Madden, S. Meskin, T. Overton, J. Wilson (Eds.), Proceedings ofthe 2nd science learning and teaching conference (pp. 158–163). Keele.
Jordan, S. (2008). Online interactive assessment with short free-text questions and tailored feedback. NewDirections, 4, 17–20.
112 Int J Artif Intell Educ (2015) 25:60–117
Jordan, S. (2009a). Assessment for learning: pushing the boundaries of computer-based assessment.Practitioner Research in Higher Education, 3(1), 11–19.
Jordan, S. (2009b). Investigating the use of short free text questions in online assessment. Final projectreport, Centre for the Open Learning of Mathematics, Science, Computing and Technology, The OpenUniversity, Milton Keynes.
Jordan, S. (2012a). Short-answer e-assessment questions: five years on. In D. Whitelock, G. Wills, B.Warburton (Eds.), Proceedings of the 15th international computer assisted assessment conference(pp. 1–1). Southampton.
Jordan, S. (2012b). Student engagement with assessment and feedback: some lessons from short-answerfree-text e-assessment questions. Computers & Education, 58(2), 818–834.
Jordan, S., & Mitchell, T. (2009). e-Assessment for learning? The potential of short-answer free-textquestions with tailored feedback. British Journal of Educational Technology, 40(2), 371–385.
Jordan, S., Brockbank, B., Butcher, P. (2007). Extending the pedagogic role of online interactive assess-ment: providing feedback on short free-text responses. In Proceedings of the international onlineconference on assessment design for learner responsibility.
Kendall, M.G. (1938). A new measure of rank correlation. Biometrika, 30(1–2), 81–93.Klein, R., Kyrilov, A., Tokman, M. (2011). Automated assessment of short free-text responses in computer
science using latent semantic analysis. In G. Roßling, T. Naps, C. Spannagel (Eds.), Proceedingsof the 16th annual joint conference on innovation and technology in computer science education(pp. 158–162). Darmstadt: ACM.
Krathwohl, D.R. (2002). A revision of bloom’s taxonomy: an overview. Theory into Practice, 41(4), 212–219.
Landauer, T.K., Foltz, P.W., Laham, D. (1998). An introduction to latent semantic analysis. DiscourseProcesses, 25(2–3), 259–284.
Leacock, C., & Chodorow, M. (1998). Combining local context and WordNet sense similarity for wordsense identification. In C. Fellbaum (Ed.), WordNet: an electronic lexical database, language, speech,and communication (Chap. 11, pp. 265–284). MIT Press.
Leacock, C., & Chodorow, M. (2003). C-rater: automated scoring of short-answer questions. Computersand the Humanities, 37(4), 389–405.
Lesk, M. (1986). Automatic sense disambiguation using machine readable dictionaries: how to tell apine cone from an ice cream cone. In V.D. Buys (Ed.), Proceedings of the 5th annual internationalconference on systems documentation (pp. 24–26). Toronto: ACM.
Levy, O., Zesch, T., Dagan, I., Gurevych, I. (2013). Recognizing partial textual entailment. In H. Schuetze,P. Fung, M. Poesio (Eds.), Proceedings of the 51st annual meeting of the association for computationallinguistics (Vol. 2, pp. 451–455). Sofia: Association for Computational Linguistics.
Lin, C.-Y. (2004). ROUGE: A package for automatic evaluation of summaries. In M.F. Moens &S. Szpakowicz (Eds.), Proceedings of the 1st text summarization branches out workshop at ACL(pp. 74–81). Barcelona: Association for Computational Linguistics.
Lin, D. (1998). An information-theoretic definition of similarity. In J.W. Shavlik (Eds.), Proceedings ofthe 15th international conference on machine learning (pp. 296–304). Madison: Morgan KaufmannPublishers.
Madnani, N., Burstein, J., Sabatini, J., Reilly, T.O. (2013). Automated scoring of a summary writing taskdesigned to measure reading comprehension. In J. Tetreault, J. Burstein, C. Leacock (Eds.), Proceed-ings of the 8th workshop on innovative use of nlp for building educational applications (pp. 163–168).Atlanta: Association for Computational Linguistics.
Marquardt, D.W., & Snee, R.D. (1975). Ridge regression in practice. The American Statistician, 29(1), 3–20.
Martinez, M.E., & Bennett, R.E. (1992). A review of automatically scorable constructed-response itemtypes for large-scale assessment. Applied Measurement in Education, 5(2), 151–169.
Meurers, D., Ott, N., Ziai, R. (2010). Compiling a task-based corpus for the analysis of learner languagein context. In O. Bott, S. Featherston, I. Steiner, B. Stolterfoht, Y. Versley (Eds.), Proceedings of the4th linguistic evidence conference (pp. 214–217). Tubingen.
Meurers, D., Ziai, R., Ott, N., Kopp, J. (2011a). Evaluating answers to reading comprehension questionsin context: results for german and the role of information structure. In P. Clark, I. Dagan, K. Erk, S.Pado, S. Thater, F.M. Zanzotto (Eds.), Proceedings of the 2nd textinfer workshop on textual entailment(pp. 1–9). Edinburgh: Association for Computational Linguistics.
Int J Artif Intell Educ (2015) 25:60–117 113
Meurers, D., Ziai, R., Ott, N., Bailey, S.M. (2011b). Integrating parallel analysis modules to evaluatethe meaning of answers to reading comprehension questions. International Journal of ContinuingEngineering Education and Life-Long Learning, 21(4), 355–369.
Mitchell, T., Russell, T., Broomhead, P., Aldridge, N. (2002). Towards robust computerised marking offree-text responses. In Proceedings of the 6th computer assisted assessment conference (pp. 233–249).Loughborough.
Mitchell, T., Aldridge, N., Williamson, W., Broomhead, P. (2003a). Computer based testing of medi-cal knowledge. In Proceedings of the 7th computer assisted assessment conference (pp. 249–267).Loughborough.
Mitchell, T., Aldridge, N., Broomhead, P. (2003b). Computerised marking of short-answer free-textresponses. In Proceedings of the 29th annual conference of the international association foreducational assessment (pp. 1–16). Manchester.
Mohler, M., & Mihalcea, R. (2009). Text-to-text semantic similarity for automatic short answer grading. InA. Lascarides, C. Gardent, J. Nivre (Eds.), Proceedings of the 12th conference of the european chapterof the association for computational linguistics (pp. 567–575). Athens: Association for ComputationalLinguistics.
Mohler, M., Bunescu, R., Mihalcea, R. (2011). Learning to grade short answer questions using semanticsimilarity measures and dependency graph alignments. In D. Lin (Ed.), Proceedings of the 49th annualmeeting of the association for computational linguistics: human language technologies volume 1 ofHLT ’11 (pp. 752–762). Portland: Association for Computational Linguistics.
Moser, J.R. (2009). The electronic assessor: design and prototype of an automated free-text assessmentsystem. Master’s Thesis, Institute for Information Systems and Computer Media, Technical Universityof Graz.
Nielsen, R.D., Ward, W., Martin, J.H., Palmer, M. (2008a). Annotating students’ understanding of scienceconcepts. In N. Calzolari, K. Choukri, B. Maegaard, J. Mariani, J. Odijk, S. Piperidis, D. Tapias(Eds.), Proceedings of the 6th international conference on language resources and evaluation (pp. 1–8). Marrakech: European Language Resources Association.
Nielsen, R.D., Ward, W., Martin, J.H. (2008b). Learning to assess low-level conceptual understanding. InD. Wilson & H.C. Lane (Eds.), Proceedings of the 21st international florida artificial intelligenceresearch society conference (pp. 427–432). Coconut Grove: AAAI Press.
Nielsen, R.D., Ward, W., Martin, J.H. (2009). Recognizing entailment in intelligent tutoring systems.Natural Language Engineering, 15(4), 479–501.
Ott, N., Ziai, R., Meurers, D. (2012). Creation and analysis of a reading comprehension exercise corpus:towards evaluating meaning in context. In T. Schmidt & K. Worner (Eds.), Multilingual corpora andmultilingual corpus analysis volume 14 of hamburg studies on multilingualism (pp. 47–69). JohnBenjamins Publishing: Amsterdam.
Ott, N., Ziai, R., Hahn, M., Meurers, D. (2013). CoMeT: integrating different levels of linguistic modelingfor meaning assessment. In S. Manandhar & D. Yuret (Eds.), Proceedings of the 7th internationalworkshop on semantic evaluation (pp. 608–616). Atlanta: Association for Computational Linguistics.
Page, E.B. (1966). The imminence of grading essays by computer. Phi Delta Kappan, 47(5), 238–243.Papadimitriou, C.H., Tamaki, H., Raghavan, P., Vempala, S. (1998). Latent semantic indexing: a
probabilistic analysis. In A. Mendelson & J. Paredaens (Eds.), Proceedings of the 17th ACM SIGACT-SIGMOD-SIGART symposium on principles of database systems PODS ’98 (pp. 159–168). Seattle:ACM.
Papineni, K., Roukos, S., Ward, T., Zhu, W.-J. (2002). BLEU: a method for automatic evaluation ofmachine translation. In P. Isabelle (Ed.), In Proceedings of the 40th annual meeting of the associationfor computational linguistics (pp. 311–318). Philadelphia: Association for Computational Linguistics.
Pascual-Nieto, I., Perez-Marin, D., O’Donnell, M., Rodriguez, P. (2008). Enhancing a free-text adaptivecomputer assisted assessment system with self-assessment features. In P. Dıaz, I.A. Kinshuk, E. Mora(Eds.), Proceedings of the 8th IEEE international conference on advanced learning technologies (pp.399–401). Santander: IEEE.
Pascual-Nieto, I., Santos, O.C., Perez-Marin, D., Boticario, J.G. (2011). Extending computer assistedassessment systems with natural language processing, user modeling and recommendations based onhuman computer interaction and data mining. In T. Walsh (Ed.), Proceedings of the 22nd interna-tional joint conference on artificial intelligence, volume 3 of IJCAI ’11 (pp. 2519–2524). Barcelona:AAAI Press.
114 Int J Artif Intell Educ (2015) 25:60–117
Pearson Education (2010). Intelligent Essay Assessor (IEA) Fact Sheet. Online Brochure. http://kt.pearsonassessments.com/download/IEA-FactSheet-20100401.pdf.
Pedersen, T., Patwardhan, S., Michelizzi, J. (2004). WordNet::Similarity: measuring the relatedness ofconcepts. In D. Palmer, J. Polifroni, D. Roy (Eds.), Proceedings of the human language tech-nology conference of the north american chapter of the association for computational linguistics(Demonstration Papers) (pp. 38–41). Boston: Association for Computational Linguistics.
Perez, D., & Alfonseca, E. (2005). Adapting the automatic assessment of free-text answers to the students.In Proceedings of the 9th computer assisted assessment conference (pp. 1–12). Loughborough.
Perez, D., Alfonseca, E., Rodrıguez, P. (2004). Application of the BLEU method for evaluating free-textanswers in an e-learning environment. In M.T. Lino, M.F. Xavier, F. Ferreira, R. Costa, R. Silva (Eds.),Proceedings of the 4th international conference on language resources and evaluation (pp. 1351–1354). Lisbon.
Perez, D., Alfonseca, E., Rodrıguez, P. (2004). Upper bounds of the BLEU algorithm applied to assess-ing student essays. In Proceedings of the 30th international association for educational assessmentconference. Philadelphia.
Perez, D., Alfonseca, E., Rodrıguez, P., Gliozzo, A., Strapparava, C., Magnini, B. (2005a). About theeffects of combining latent semantic analysis with natural language processing techniques for free-textassessment. Revista Signos: Estudios de Linguıstica, 38(59), 325–343.
Perez, D., Postolache, O., Alfonseca, E., Cristea, D., Rodrıguez, P. (2005b). About the effects of usinganaphora resolution in assessing free-text student answers. In R. Mitkov (Ed.), Proceedings of the11th international conference on recent advances in natural language processing (pp. 380–386).Borovets.
Perez, D., Gliozzo, A.M., Strapparava, C., Alfonseca, E., Rodrıguez, P., Magnini, B. (2005c). Automaticassessment of students’ free-text answers underpinned by the combination of a BLEU-inspired algo-rithm and latent semantic analysis. In D. Cook, L. Holder, I. Russell, Z. Markov (Eds.), Proceedingsof the 18th international florida artificial intelligence research society conference (pp. 358–363).Clearwater Beach: AAAI Press.
Perez-Marın, D. (2004). Automatic evaluation of user’s short essays by using statistical and shallow nat-ural language processing techniques. Diploma thesis, Computer Science Department, UniversidadAutonoma of Madrid.
Perez-Marın, D. (2007). Adaptive computer assisted assessment of free-text students’ answers: anapproach to automatically generate students’ conceptual models. Ph.D. thesis, Computer ScienceDepartment, Universidad Autonoma of Madrid.
Perez-Marın, D., & Pascual-Nieto, I. (2011). Willow: a system to automatically assess students’ free-text answers by using a combination of shallow nlp techniques. International Journal of ContinuingEngineering Education and Life Long Learning, 21(2), 155–169.
Perez-Marın, D., Alfonseca, E., Rodrıguez, P. (2006a). A free-text scoring system that generates concep-tual models of the students’ knowledge with the aid of clarifying questions. In L. Aroyo & D. Dicheva(Eds.), Proceedings of the 4th international workshop on applications of semantic web technologiesfor e-learning (pp. 1–2). Dublin.
Perez-Marın, D., Alfonseca, E., Freire, M., Rodrıguez, P., Guirao, J.M., Moreno-Sandoval, A. (2006b).Automatic generation of students’ conceptual models underpinned by free-text adaptive computerassisted assessment. In R. Kinshuk, P. Koper, P. Kommers, D.S. Kirschner, W. Didderen (Eds.),Proceedings of the 6th international conference on advanced learning technologies (pp. 280–284).Kerkrade: IEEE.
Perez-Marın, D., Alfonseca, E., Rodrıguez, P. (2006c). On the dynamic adaptation of computer assistedassessment of free-text answers. In V.P. Wade, H. Ashman, B. Smyth (Eds.), Proceedings of the 4thinternational conference on adaptive hypermedia and adaptive web-based systems volume 4018 oflecture notes in computer science (pp. 374–377). Dublin.
Perez-Marın, D., Alfonseca, E., Rodrıguez, P., Pascual-Nieto, I. (2006d). Willow: automatic and adap-tive assessment of students’ free-text answers. In F. Pla (Ed.), Proceedings of the 22nd internationalconference of the spanish society for natural language processing (pp. 367–368). Zaragoza.
Perez-Marın, D., Pascual-Nieto, I., Alfonseca, E., Anguiano, E. (2007). A study on the impact of the useof an automatic and adaptive free-text assessment system during a university course. In J. Fong & F.L.Wang (Eds.), Proceedings of the workshop on blended learning ICWL ’07 (pp. 186–195). Edinburgh:Pearson.
Int J Artif Intell Educ (2015) 25:60–117 115
Perez-Marın, D., Pascual-Nieto, I., Rodrıguez, P. (2009). Computer-assisted assessment of free-textanswers. The Knowledge Engineering Review, 24(4), 353–374.
Potthast, M. (2011). Technologies for reusing text from the Web. Ph.D. thesis. Weimar: Bauhaus-Universitat Weimar.
Prettenhofer, P., & Stein, B. (2011). Cross-lingual adaptation using structural correspondence learning.Transactions on Intelligent Systems and Technology, 3, 13:1–13:22.
Pulman, S.G., & Sukkarieh, J.Z. (2005). Automatic short answer marking. In J. Burstein & C. Leacock(Eds.), Proceedings of the 2nd workshop on building educational applications using NLP (pp. 9–16).Ann Arbor: Association for Computational Linguistics.
Resnik, P. (1995). Using information content to evaluate semantic similarity in a taxonomy. InC.R. Perrault & C.S. Mellish (Eds.), Proceedings of the 14th international joint conferenceon artificial intelligence volume 1 of IJCAI ’95 (pp. 448–453). Montreal: Morgan KaufmannPublishers.
Richter, F., & Sailer, M. (2003). Basic concepts of lexical resource semantics. In A. Beckmann& N. Preining (Eds.), Proceedings of the 15th european summer school in logic language andinformation volume 5 of collegium logicum (pp. 87–143). Vienna: Kurt Godel Society.
Rodgers, J.L., & Nicewander, W.A. (1988). Thirteen ways to look at the correlation coefficient. TheAmerican Statistician, 42(1), 59–66.
Sargeant, J., McGee Wood, M., Anderson, S.M. (2004). A human-computer collaborative approach tothe marking of free text answers. In Proceedings of the 8th computer assisted assessment conference(pp. 361–370). Loughborough: Loughborough University.
Shermis, M.D., & Burstein, J. (2003). Automated essay scoring: a cross-disciplinary perspective, 1st edn.Mahwah: Lawrence Erlbaum Associates.
Shermis, M.D., & Burstein, J. (2013). Handbook of automated essay evaluation: current applications andnew directions, 1st edn. New York: Routledge New York City.
Shermis, M.D., Burstein, J., Leacock, C. (2008). Applications of computers in assessment and analysis ofwriting. In C.A. MacArthur, S. Graham, J. Fitzgerald (Eds.), Handbook of writing research, chapter27, 1st edn. (pp. 403–416). New York: Guilford Press New York City.
Siddiqi, R., & Harrison, C.J. (2008a). A systematic approach to the automated marking of short-answerquestions. In M.K. Anis, M.K. Khan, S.J.H. Zaidi (Eds.), Proceedings of the 12th internationalmultitopic conference (pp. 329–332). Karachi: IEEE.
Siddiqi, R., & Harrison, C.J. (2008b). On the automated assessment of short free-text responses. InProceedings of the 34th international association for educational assessment annual conference(pp. 1–11). Cambridge.
Siddiqi, R., Harrison, C.J., Siddiqi, R. (2010). Improving teaching and learning through automated short-answer marking. IEEE Transactions on Learning Technologies, 3(3), 237–249.
Sim, J., & Wright, C.C. (2005). The kappa statistic in reliability studies: use, interpretation, and samplesize requirements. Physical Therapy, 85(3), 257–268.
Sima, D., Schmuck, B., Szoll, S., Miklos, A. (2007). Intelligent short text assessment in eMax. InProceedings of the 8th Africon conference (pp. 1–6). Windhoek: IEEE.
Sima, D., Schmuck, B., Szoll, S., Miklos, A. (2009). Intelligent short text assessment in eMax. In I.J.Rudas, J. Fodor, J. Kacprzyk (Eds.), Towards intelligent engineering and information technologyvolume 243 of studies in computational intelligence (pp. 435–445). Springer.
Spearman, C. (1904). The proof and measurement of association between two things. The AmericanJournal of Psychology, 15(1), 72–101.
Stern, A., & Dagan, I. (2011). A confidence model for syntactically-motivated entailment proofs. InR. Mitkov & G. Angelova (Eds.), Proceedings of the 14th international conference on recentadvances in natural language processing (pp. 455–462). Hissar: Association for ComputationalLinguistics.
Stevens, S.S. (1946). On the theory of scales of measurement. Science, 103(2684), 667–680.Sukkarieh, J.Z. (2010). Using a MaxEnt classifier for the automatic content scoring of free-text responses.
In A. Mohammad-Djafari, J.-F. Bercher, P. Bessiere (Eds.), Proceedings of the international workshopon bayesian inference and maximum entropy methods in science and engineering volume 1305 of aipconference proceedings (pp. 41–18). Chamonix: American Institute of Physics.
Sukkarieh, J.Z., & Blackmore, J. (2009). c-rater: automatic content scoring for short constructed responses.In H.C. Lane & H.W. Guesgen (Eds.), Proceedings of the 22nd international conference of the floridaartificial intelligence research society (pp. 290–295). Sanibel Island: AAAI Press.
116 Int J Artif Intell Educ (2015) 25:60–117
Sukkarieh, J.Z., & Bolge, E. (2008). Leveraging c-rater’s automated scoring capability for providinginstructional feedback for short constructed responses. In B.P. Woolf, E. Aımeur, R. Nkambou, S.Lajoie (Eds.), Proceedings of the 9th international conference on intelligent tutoring systems ITS ’08(pp. 779–783). Montreal: Springer.
Sukkarieh, J.Z., & Bolge, E. (2010). Building a textual entailment suite for evaluating content scoring tech-nologies. In N. Calzolari, K. Choukri, B. Maegaard, J. Mariani, J. Odijk, S. Piperidis, M. Rosner, D.Tapias (Eds.), Proceedings of the 5th international conference on language resources and evaluation,LREC ’10 (pp. 1–8). Valletta: European Language Resources Association.
Sukkarieh, J.Z., & Kamal, J. (2009). Towards Agile and Test-Driven Development in NLP Applications.In K.B. Cohen & M. Light (Eds.), Proceedings of the workshop on software engineering, test-ing, and quality assurance for natural language processing, SETQA-NLP ’09 (pp. 42–44). Boulder:Association for Computational Linguistics.
Sukkarieh, J.Z., & Pulman, S.G. (2005). Information extraction and machine learning: auto-marking shortfree text responses to science questions. In C.-K. Looi, G.I. McCalla, B. Bredeweg, J. Breuker (Eds.),Proceedings of the 12th international conference on artificial intelligence in education, frontiers inartificial intelligence and applications (pp. 629–637). Amsterdam: IOS Press.
Sukkarieh, J.Z., & Stoyanchev, S. (2009). Automating model building in c-rater. In C. Callison-Burch &F.M. Zanzotto (Eds.), Proceedings of the 1st ACL/IJCNLP workshop on applied textual inference,TextInfer ’09 (pp. 61–69). Suntec: Association for Computational Linguistics.
Sukkarieh, J.Z., Pulman, S.G., Raikes, N. (2003). Auto-marking: using computational linguistics toscore short, free text responses. In Proceedings of the 29th annual conference of the internationalassociation for educational assessment (pp. 1–15). Manchester.
Sukkarieh, J.Z., Pulman, S.G., Raikes, N. (2004). Auto-marking 2: an update on the ucles-oxforduniversity research into using computational linguistics to score short, free text responses. In Pro-ceedings of the 30th annual conference of the international association for educational assessment.Philadelphia.
Swithenby, S., & Jordan, S. (2008). Supporting open learners by computer based assessment with shortfree-text responses and tailored feedback. In F. Welsch, F. Malpica, A. Tremante, J.V. Carrasquero,A. Oropeza (Eds.), Proceedings of the 2nd international multi-conference on society, cybernetics andinformatics IMSCI ’08. Orlando: International Institute of Informatics and Systemics.
Szpektor, I., & Dagan, I. (2007). Learning canonical forms of entailment rules. In R. Mitkov & G.Angelova (Eds.), Proceedings of the 6th international conference on recent advances in naturallanguage processing (pp. 1–6). Borovets.
Tandalla, L. (2012). Scoring short answer essays. ASAP ’12 SAS Methodology Paper.Thomas, P. (2003). The evaluation of electronic marking of examinations. In Proceedings of the 8th annual
conference on innovation and technology in computer science education, ITiCSE ’03 (pp. 50–54).Thessaloniki: ACM.
Valenti, S., Neri, F., Cucchiarelli, A. (2003). An overview of current research on automated essay grading.Journal of Information Technology Education, 2, 319–330.
VanLehn, K., Jordan, P.W., Rose, C.P., Bhembe, D., Bottner, M., Gaydos, A., Makatchev, M.,Pappuswamy, U., Ringenberg, M., Roque, A., Siler, S., Srivastava, R. (2002). The architecture ofwhy2-atlas: a coach for qualitative physics essay writing. In S.A. Cerri, G. Gouarderes, F. Paraguacu(Eds.), Proceedings of the sixth international conference on intelligent tutoring systems volume 2363of lecture notes in computer science (pp. 158–167). Biarritz: Springer.
Wachsmuth, H., Stein, B., Engels, G. (2011). Constructing efficient information extraction pipelines. InB. Berendt, A. de Vries, W. Fan, C. MacDonald, I. Ounis, I. Ruthven (Eds.), Proceedings of the 12thACM international conference on information and knowledge management, CIKM ’11 (pp. 2237–2240). Glasgow: ACM.
Wachsmuth, H., Stein, B., Engels, G. (2013). Information extraction as a filtering task. In Q. He &A. Iyengar (Eds.), In Proceedings of the 22nd ACM international conference on information andknowledge management CIKM ’13 (pp. 2049–2058). San Francisco: ACM.
Wang, H.-C., Chang, C.-Y., Li, T.-Y. (2008). Assessing creative problem-solving with automated textgrading. Computers & Education, 51(4), 1450–1466.
Wang, X., Evanini, K., Zechner, K. (2013). Coherence modeling for the automated assessment of spon-taneous spoken responses. In L. Vanderwende, H. Daume, K. Kirchhoff (Eds.), Proceedings of theconference of the North American chapter of the association for computational linguistics: humanlanguage technologies (pp. 81–819). Atlanta: Association for Computational Linguistics.
Int J Artif Intell Educ (2015) 25:60–117 117
Williamson, D.M., Xi, X., Breyer, F.J. (2012). A framework for evaluation and use of automated scoring.Educational Measurement: Issues and Practice, 31(1), 2–13.
Willis, A. (2010). Inductive logic programming to support automatic marking of student answers in freetext. Final report, Milton Keynes: COLMSCT, The Open University.
Wise, M.J. (1993). String similarity via greedy string tiling and running Karp-Rabin matching. Technicalreport, Department of Computer Science, University of Sydney.
Wood, M.M., Jones, C., Sargeant, J., Reed, P. (2006). Light-weight clustering techniques for short textanswers in HCC CAA. In M. Danson (Ed.), Proceedings of the 10th CAA international computerassisted assessment conference (pp. 291–308). Loughborough: Loughborough University.
Wu, Z., & Palmer, M. (1994). Verb semantics and lexical selection. In P. Justejovsky (Ed.) Proceedingsof the 32nd annual meeting on association for computational linguistics ACL ’94 (pp. 133–138). LasCruces: Association for Computational Linguistics.
Zbontar, J. (2012). Short answer scoring by stacking. ASAP ’12 SAS methodology paper.Zenisky, A.L., & Sireci, S.G. (2002). Technological innovations in large-scale assessment. Applied
Measurement in Education, 15(4), 337–362.Zesch, T., Levy, O., Gurevych, I., Dagan, I. (2013). UKP-BIU: similarity and entailment metrics for stu-
dent response analysis. In S. Manandhar & D. Yuret (Eds.), Proceedings of the 17th internationalworkshop on semantic evaluation (Vol. 2, pp. 285–289). Atlanta: Association for ComputationalLinguistics.
Ziai, R., Ott, N., Meurers, D. (2012). Short answer assessment: establishing links between research strands.In J. Tetreault, J. Burstein, C. Leacock (Eds.), Proceedings of the 17th workshop on the innovative useof NLP for building educational applications (pp. 190–200). Montreal: Association for ComputationalLinguistics.