Embed Size (px)
Citation preview
THE ESSENTIAL GUIDE TO
Database Monitoring
By Michael Otey
SPONSORED BY
1
One of the database administra-tors (DBAs) most important jobs is to keep the database
running smoothly, which includes quickly troubleshooting performance problems when they rear their ugly heads. To effectively troubleshoot issues, you need to quickly gather the important performance metrics and then compare them to a known base-line to identify the performance prob-lems and their causes. In this essential guide, you’ll learn how to create a mon-itoring strategy using the most impor-tant SQL Server performance metrics. You’ll also get an introduction to some of the most important tools that you can use to build your monitoring solu-tion and how to create a baseline and performance history.
Using Performance MonitorTo maintain a consistent and trouble-free operating environment, there are a
2
The Essential Guide to Database Monitoring
number of different metrics and other elements that you should regularly track. Some of them are at the operating system level and others are at the SQL Server database instance level. One of the most important system tools for monitoring your database server’s performance is Performance Monitor. You can run Performance Monitor on a Windows® Server 2008 or Windows Server 2008 R2 system by typing perfmon.exe in the Search box or from a command prompt. On a Windows Server 2012 system, you can run Performance Monitor by typing perfmon in the Start screen.
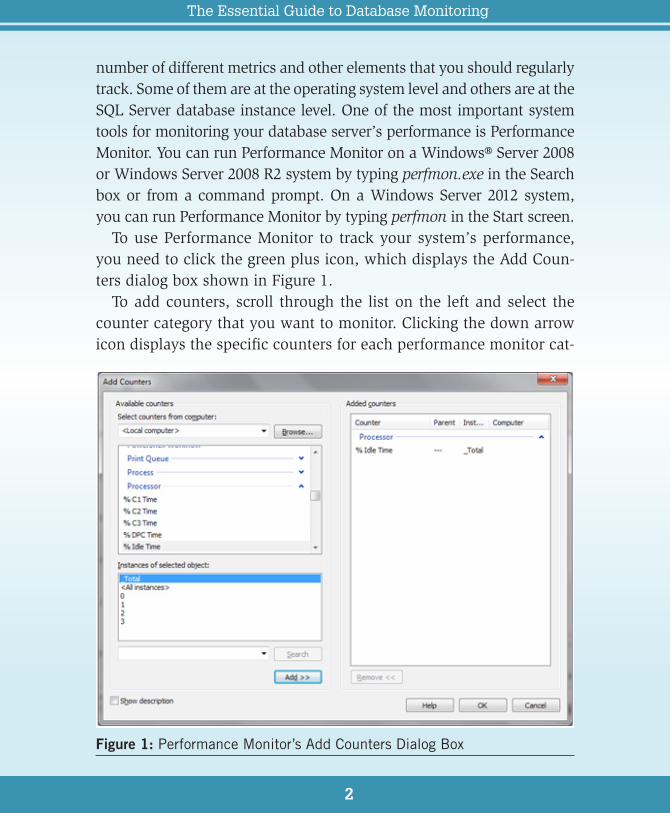
To use Performance Monitor to track your system’s performance, you need to click the green plus icon, which displays the Add Coun-ters dialog box shown in Figure 1.
To add counters, scroll through the list on the left and select the counter category that you want to monitor. Clicking the down arrow icon displays the specific counters for each performance monitor cat-
Figure 1: Performance Monitor’s Add Counters Dialog Box
3
The Essential Guide to Database Monitoring
egory. To collect statistics for a specific counter, highlight it in the list on the left and click the Add button. This will add the selected counter to the Added counters list that you can see on the right side of the Add Counters dialog box. When you’re finished adding counters, click OK. You can find more detailed information on how to use Per-formance Monitor with Windows Server 2008 and Windows Server 2008 R2 on Microsoft TechNet’s Using Performance Monitor page.
Monitoring Windows ServerTo provide good SQL Server database performance, the server that the database is running on must be performing within normal ranges. This is true no matter whether the server is a physical server or a vir-tual machine. Some of the important server-level elements that you should regularly monitor include:• CPU utilization. The most important system metric to track is
your server’s CPU utilization. The Performance Monitor counter Processor: %Processor Time tracks the time your server’s CPU is performing active work. Although it’s common to have temporary CPU spikes, if the SQL Server CPU utilization is above 80%, your system is probably CPU bound. Another important counter related to CPU utilization is System: Processor Queue Length. It measures the number of threads that are ready to process but aren’t able to get to the processors. A value 8 or less is good. A value of 12 or higher often indicates a problem. If this is the case, you need to increase processing power by adding CPUs, using faster CPUs, or reducing the system’s workload.
• Memory utilization. The server’s memory utilization is the next most important system metric to monitor. SQL Server takes advantage of system memory to execute SQL Server processes as well as to cache frequently accessed data. First, check the Mem-ory: Available Mbytes performance counter. If the value is less than 100MB, the server will probably experience memory pressure and will benefit from added memory. Another important factor to
4
The Essential Guide to Database Monitoring
check is the paging file. If the system is low on memory, there will be excessive paging activity, which will negatively impact perfor-mance. In this case, you can check the Paging File: %Usage coun-ter, which should have a value of 70% or less.
• Disk I/O. The storage subsystem can play an important role in your database server’s performance. However, if your databases are on a Storage Area Network (SAN), you should use the SAN vendor’s tools to check any performance metrics. If you’re using Direct Attached Storage (DAS), first monitor the Logical Disk: % Idle Time counter. If the value of this counter is less than 50%, the disk might be experiencing high I/O. Other important coun-ters to check are Logical Disk: Avg. Disk sec/Read and Logical Disk: Avg. Disk sec/Write. If their values are more than 15ms, you might have a disk I/O performance issue and you might consider moving the database to a different storage subsystem. As a gen-eral rule of thumb, if your database performs mostly read opera-tions, consider using a RAID 5 array. If your database performs mostly write operations, consider using a RAID 10 array. You can calculate your read/write ratio using values from the Logical Disk: Disk reads/sec and Logical Disk: writes/sec counters.
• Network utilization. Monitoring your server’s network utilization is important. Although network saturation isn’t typically a major cause of performance issues, it can be an issue particularly on a virtualization host that’s running a number of virtual machines. You should track the network utilization for all of the network adapters in the system using the Network Interface: Bytes Total/sec counter. This counter tracks the total inbound and outbound traf-fic going through each network interface.
• Disk space. Another important server-level element to track is your available disk space. This is particularly true if your SQL Server sys-tems are using DAS. You should make sure that all NTFS disks have at least 20% free space. Disk fragmentation causes NTFS volumes to become less efficient when the drives lack free space.
5
The Essential Guide to Database Monitoring
• System event logs. The Windows Server system event logs record significant events at the system and application levels. Regularly monitoring these logs can help you see if the server is experienc-ing any unusual error conditions or application failures. You can open the Event Viewer by using the Event Viewer option from the Administrative Tools menu.
Monitoring Database Performance Once you have a routine established to monitor the essential Windows Server daily system operations, the next thing you need to do is dive into the daily operations of your SQL Server database instance. When you install SQL Server, it adds a number of database-specific counters to Performance Monitor. Some of the important database elements to monitor are:• Access methods. The SQL Server Access Methods counters show
how logical database pages are being accessed. They can help you see if you need to add indexes or possibly rewrite queries. For example, the SQLServer:Access Methods:Full Scans/sec counter shows how many full table scans are being performed. Generally, this value should be at 1 or less because full table scans are I/O intensive. However, keep in mind that table scans of small tables aren’t a problem, so the optimal value will depend on the applica-tions being used. The SQLServer:Access Methods:Page Splits/sec counter can indicate that the database engine has filled an 8K page and needs to split the page in two, which is an I/O-intensive opera-tion. When a new row is added to a full index page, SQL Server moves approximately half the rows to a new page to make room for the new row. A general rule of thumb is to keep this value less than 20. If it’s higher, you might look at adjusting the index fill factor using the system stored procedure sp_configure.
• Buffer manager. Monitoring the buffer manager is critical to track-ing changes in SQL Server performance. The SQL Server buffer pool is essentially a data cache that SQL Server uses to retrieve
6
The Essential Guide to Database Monitoring
commonly accessed data. There are a number of important buf-fer manager performance counters that you should watch. The SQLServer:Buffer Manager:Buffer cache hit ratio counter shows how often SQL Server is able to get data from the buffer pool. This value should be high— over 90%. The SQLServer:Buffer Manager:Free list stalls/sec counter tracks how often SQL Server can’t get data from the buffer because the buffer is out of space. If this value is greater than 2, the system would probably benefit from additional memory. Another important counter to check is the SQLServer:Buffer Manager:Page life expectancy counter, which shows how long pages stay in memory. This value should be at least 300 (5 minutes). Lower values might indicate a need for more memory. Two other important SQLServer:Buffer Manager counters are Page reads/sec and Page writes/sec. These values should generally be less than 90—higher values could indicate a need for more memory.
• Batch requests. The SQLServer:SQL Statistics:Batch Requests/sec counter shows the number of SQL statements that are being exe-cuted per second. This counter’s value will vary greatly with each system’s workload, so you should also take into account other performance values, especially CPU utilization. Generally, a value of 1,000 or higher indicates a heavy workload. Another closely related performance counter that you should keep an eye on is SQLServer:SQL Statistics:SQL Compilations/Sec. This counter mea-sures the number of times SQL Server compiles execution plans. Compiling an execution plan is a resource-intensive operation. The number of SQL compilations per second should be compared with the number of batch requests per second.
• Memory manager. The SQLServer:Memory Manager:Memory Grants Pending counter shows the current number of processes waiting for the server to perform a workspace memory grant. The workspace memory grant increases the memory allocated to a process. This counter keeps track of the number of processes
7
The Essential Guide to Database Monitoring
that are waiting for memory before they can execute. This value should be as close to zero as possible.
• Database locks. The system’s database locks are another impor-tant database metric to monitor. To manage multiple concurrent users, the SQL Server database engine regularly needs to lock resources. The SQLServer:Locks:Lock Waits/sec counter counts the number of times per second that SQL Server isn’t able to retain a lock. Ideally, you want this count to be as close to zero as possible. Process deadlocks are another type of database activ-ity that you should monitor. Deadlocks occur when multiple processes attempt to place conflicting locks on a given resource. The SQLServer:Locks:Number of Deadlocks/sec counter tracks the deadlocks that occur in the system. Here again, it’s best if this value is zero. If your system is experiencing deadlocks, you can use SQL Server Profiler to find out more information about the queries that are being deadlocked.
• Tempdb usage. SQL Server uses the tempdb database to store internal objects such as the intermediate results of a query. SQL Server’s performance can be significantly impacted if the tempdb database runs out of disk space, so make sure the vol-ume on which tempdb is placed isn’t short on disk space. Use the SQLServer:Transactions:Free space in tempdb (KB) counter to monitor the available free space in tempdb. For best performance, consider locating tempdb on an array of its own spindles. Because tempdb experiences a large number of writes, also consider using RAID 1 or RAID 10 for the tempdb volume.
• SQL Server logs. In addition checking the Performance Monitor counters and the Windows system event logs, you should regu-larly check the SQL Server logs. The SQL Server database engine records a number of different errors and other important server warnings in the SQL Server logs. To check them, you can use SQL Server Management Studio (SSMS). In SSMS’s Object Explorer, expand the node of the server you want to monitor, expand the
8
The Essential Guide to Database Monitoring
Management node, then expand SQL Server Logs. Right-click a log and click View SQL Server Log.
Keep Your Databases Running SmoothlyRegular monitoring is the key to ensuring that your SQL Server data-bases continue to meet your performance expectations. It’s also the key to quickly and efficiently troubleshooting performance problems when they arise. This essential guide provides examples of some of the core performance metrics and other elements to monitor. With that said, this is only the start. There are many other important sys-tem and database metrics and elements that you might want to moni-tor. For more information, check out Microsoft’s free Monitor and Tune for Performance eBook.
One of the most important aspects of creating an effective monitor-ing environment is establishing performance baselines. Every server implementation is different, and performance baselines show you the normal operating range for your own SQL Server systems. A perfor-mance baseline allows you to compare performance counter values and other system metrics to a known set of values that are represen-tative of when your system is performing well. This can really help you troubleshoot problems by allowing you to pinpoint anomalies and areas where the system’s performance metric might deviate from its normal ranges. One of the most important factors for creating a truly representative performance baseline is to regularly monitor and record performance metrics throughout the day at peak workload times as well as other times. This will help you understand what’s normal for your system.
In addition to regular monitoring, there are some common sense things that you can do to help keep your SQL Server database sys-tems running smoothly. First, don't run any extraneous applications on your SQL Server systems. Second, be sure to record all of your system changes. Documenting all system configuration changes and other system-level events can help you identify and correct any unin-
9
The Essential Guide to Database Monitoring
tended consequences. Finally, take advantage of the available tools because they can help make database administration tasks easier. For instance, the Microsoft SQL Server Baseline Analyzer can help track some of the important SQL Server system metrics. Likewise, third-party monitoring tools can help you more easily automate, track, report, and troubleshoot database performance factors.
Automate SQL Server Performance Monitoring with SolarWindsBy Jennifer Kuvlesky, SolarWinds
SolarWinds® Server & Application monitor provides robust capabilities for automating collection, alerting and reporting on SQL performance issues. SolarWinds SQL server performance tool provides insights into SQL database performance as well as Windows server, virtual infrastructure, hardware health and related applica-tion performance. Read on to learn more about the capabilities and advantages of using Server & Application Monitor over Performance Monitor.
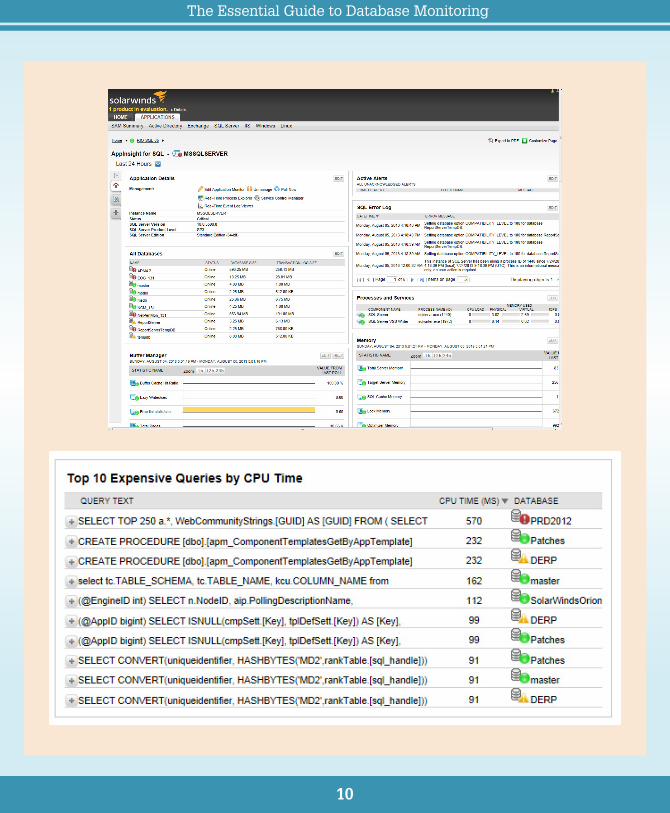
Holistic visualization of SQL performance - SolarWinds provides a holistic view of performance with out-of-the-box dashboards for database performance for each server, allowing you to drill into individual database performance to include most expensive queries. Server & Application Monitor collects well over 100 metrics per SQL instance and presents performance data in an intuitive dashboard. In the same con-sole, you can also view performance of the SQL server, Windows event logs, virtual server performance and related application performance.o SQL Server Metrics include: SQL process & service availability, buffer manager statistics, memory sta-
tistics, event logs, cache statistics, latches and locks, paging statistics, connections, sessions, SQL agent job status, disk statistics and other SQL performance metrics.
o SQL Database Metrics include: SQL query statistics, database availability, database size by file, transac-tion log size by file, storage metrics, database disk I/O, transaction log disk I/O, index fragmentation statistics, transaction statistics and tables by size.
o Windows Event Logs: The Real Time Event Viewer feature of Server & Application Monitor allows you to view Windows event logs in real time and filter logs by type, event source, and severity. From this same view you can start monitoring event logs with specific criteria like event ID, key words, user name, event type and log source.
10
The Essential Guide to Database Monitoring
11
The Essential Guide to Database Monitoring
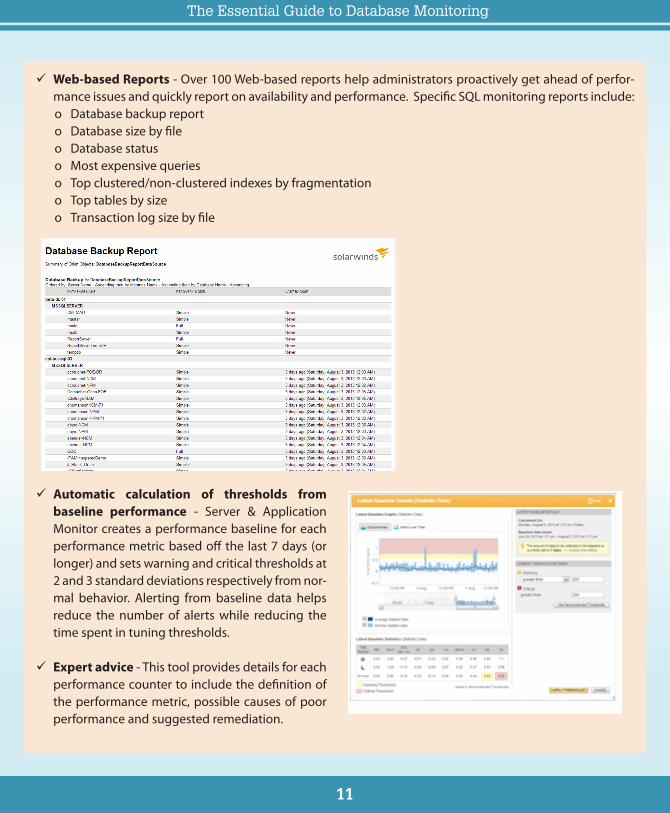
Web-based Reports - Over 100 Web-based reports help administrators proactively get ahead of perfor-mance issues and quickly report on availability and performance. Specific SQL monitoring reports include:o Database backup reporto Database size by fileo Database statuso Most expensive querieso Top clustered/non-clustered indexes by fragmentationo Top tables by sizeo Transaction log size by file
Automatic calculation of thresholds from baseline performance - Server & Application Monitor creates a performance baseline for each performance metric based off the last 7 days (or longer) and sets warning and critical thresholds at 2 and 3 standard deviations respectively from nor-mal behavior. Alerting from baseline data helps reduce the number of alerts while reducing the time spent in tuning thresholds.
Expert advice - This tool provides details for each performance counter to include the definition of the performance metric, possible causes of poor performance and suggested remediation.
12
The Essential Guide to Database Monitoring
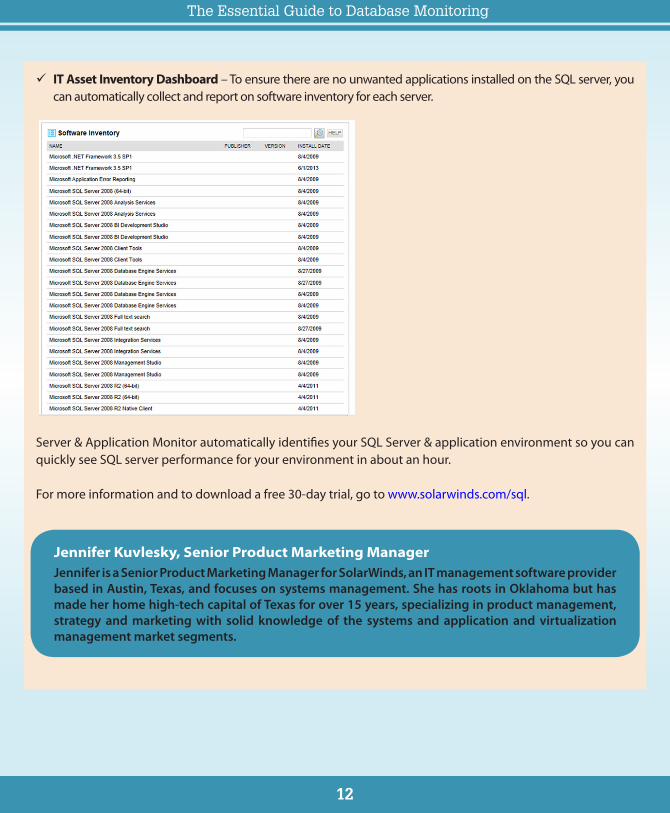
IT Asset Inventory Dashboard – To ensure there are no unwanted applications installed on the SQL server, you can automatically collect and report on software inventory for each server.
Server & Application Monitor automatically identifies your SQL Server & application environment so you can quickly see SQL server performance for your environment in about an hour.
For more information and to download a free 30-day trial, go to www.solarwinds.com/sql.
Jennifer Kuvlesky, Senior Product Marketing ManagerJennifer is a Senior Product Marketing Manager for SolarWinds, an IT management software provider based in Austin, Texas, and focuses on systems management. She has roots in Oklahoma but has made her home high-tech capital of Texas for over 15 years, specializing in product management, strategy and marketing with solid knowledge of the systems and application and virtualization management market segments.


![Escrito por: James H. Baxter [Título do documento]cdn.swcdn.net/creative/v19.0/pdf/Whitepapers/Using_Packet_Analysis...Neste documento técnico, falarei sobre o que é uma análise](https://img.pdfslide.net/doc/110x75/5adc43dd7f8b9a595f8b4d1a/escrito-por-james-h-baxter-ttulo-do-documentocdnswcdnnetcreativev190pdfwhitepapersusingpacketanalysisneste.jpg)