Embed Size (px)
Citation preview
Advances in Pediatric Research Astley et al. 2016 | 3:9 1
The essential role of growth deficiency in the diagnosis of fetal alcohol spectrum disorder Susan J. Astley 1*, Julia M. Bledsoe 1, Julian K. Davies 1
1 University of Washington, Seattle, WA, USA
Abstract Background: Laboratory studies confirm prenatal alcohol exposure (PAE) causes growth deficiency (GD). GD has traditionally been a core diagnostic feature of fetal alcohol spectrum disorders (FASD), but was removed from the Canadian and Australian FASD diagnostic guidelines in 2016. This study aimed to empirically assess the clinical role and value of GD in FASD diagnosis. Methods: Data from 1814 patients with FASD from the University of Washington Fetal Alcohol Syndrome Diagnostic & Prevention dataset were analyzed to answer the following questions: 1) Is there evidence of a causal association between PAE and GD in our clinical population? 2) Is GD sufficiently prevalent among individuals with PAE to warrant its inclusion as a diagnostic criterion? 3) Does GD aid the diagnostic team in identifying and/or predicting which individuals will be most impaired by their PAE? Results: GD significantly correlated with PAE. GD was as prevalent as the other core diagnostic features (facial and CNS abnormalities). GD occurred in all FASD diagnoses and increased in prevalence with increasing severity of diagnosis. The most prevalent form of GD was postnatal short stature. GD was as highly correlated with, and predictive of, severe brain dysfunction as the FAS facial phenotype. Individuals with GD had a two to three-fold increased risk for severe brain dysfunction. Sixty percent of patients with severe GD had severe brain dysfunction. GD accurately predicted which infants presented with severe brain dysfunction later in childhood Conclusions: GD is an essential diagnostic criterion for FASD and will remain in the FASD 4-Digit Code.
Citation: Astley SJ, Bledsoe JM, Davies JK (2016) The essential role of growth deficiency in the diagnosis of fetal alcohol spectrum disorder. Adv Pediatr Res 3:9. doi:10.12715/apr.2016.3.9
Received: September 25, 2016; Accepted: November 11, 2016; Published: December 1, 2016
Copyright: © 2016 Astley et al. This is an open access article distributed under the terms of the Creative Commons Attribution License, which permits unrestricted use, distribution, and reproduction in any medium, provided the original work is properly cited.
Competing interests: The authors have declared that no competing interests exist.
Sources of funding: The Washington State Fetal Alcohol Syndrome Diagnostic & Prevention Network is supported by the Washington State Department of Social and Health Services, Division of Behavioral Health and Recovery. * Email: [email protected]
Introduction Fetal alcohol syndrome (FAS) is a birth defect syndrome caused by maternal consumption of alcohol during pregnancy. The term FAS was first coined in 1973 [1,2], and is characterized by growth deficiency (GD), a specific cluster of minor facial anomalies, and central nervous system (CNS) structural and/or functional abnormalities. Not all individuals exposed
to and damaged by prenatal alcohol exposure (PAE) have FAS. Rather, PAE causes growth, facial, and CNS abnormalities that each present along a continuum of abnormality from mild, moderate, to severe [3,4]. Taken together, these outcomes present along a continuum of diagnoses under the umbrella of fetal alcohol spectrum disorder (FASD): FAS, partial FAS (PFAS), static encephalopathy/alcohol-exposed
Advances in Pediatric Research Astley et al. 2016 | 3:9 2
(SE/AE), and neurobehavioral disorder/alcohol-exposed (ND/AE).
GD has traditionally been a core diagnostic feature of FAS [5]. The original small group of patients from which the term was first derived was identified, in large part, because of their GD [6,7]. It is common for a new condition/syndrome to be recognized among the most severe cases. Thus, over time, it became clear that FAS was reflective of the most severe end of the fetal alcohol spectrum. Decades of laboratory and clinical-based studies unequivocally confirmed that PAE causes GD [8–12]. Nevertheless, not all individuals with PAE present with GD, and not all individuals with GD have PAE, so the question was raised as to whether GD should have been included as a core diagnostic feature of FAS.
In the 2016 revisions of the Canadian [13] and Australian [14] FASD diagnostic guidelines, GD was removed as a diagnostic criterion for FASD. The Canadian guidelines present the following justifications for removing GD:
1. Growth deficiency is neither sensitive nor sufficiently specific to indicate a diagnosis of FASD.
2. The predictive value of growth deficiency has been questioned.
3. FAS was ‘discovered’ in 1973 because a group of children referred to a clinic for growth deficiency were later found to have other features of what is now known as FAS.
The purpose of this study was to empirically assess the role and value of GD in FASD diagnosis. Laboratory studies confirm PAE causes GD. Is there evidence of a causal association between PAE and GD in our clinical population? Is GD sufficiently prevalent among individuals with PAE to warrant inclusion as a diagnostic criterion? The most debilitating aspect of FASD is CNS dysfunction. Does the presence of GD aid the clinical team in identifying and predicting which individuals will be most impaired by their PAE? The results of this study will be used to determine whether the FASD 4-Digit Diagnostic Code [3,4] described below maintains or removes GD as a core FASD diagnostic feature.
Methods Data from 1814 patients evaluated consecutively from January 1993 through December 2012 at one of the University of Washington Fetal Alcohol Syndrome Diagnostic and Prevention (WA FASDPN) clinics were used in this study. The data source was the WA FASDPN research database. All patients evaluated at the WA FASDPN clinics are invited to have their FASD clinical data entered into the WA FASDPN research database, at the time of their diagnostic evaluation, for use in future research studies. Patient/caregiver consent is obtained in accordance with University of Washington Human Subjects Division oversight and approval. All patients were diagnosed in accordance with (or upgraded to) the 2004 FASD 4-Digit Diagnostic Code [3,4].
The FASD 4-Digit Code is described in full by Astley [3,4]. Briefly, the four digits reflect the magnitude of expression of the four key diagnostic features of FASD, in the following order: 1) growth deficiency, 2) FAS facial phenotype, 3) CNS structural/functional abnormalities, and 4) prenatal alcohol exposure (Figure 2A). The magnitude of expression of each feature is ranked independently on a four-point Likert scale, with 1 reflecting complete absence of the FASD feature, and 4 reflecting a strong ‘classic’ presence of the FASD feature. Each Likert rank is specifically case-defined. A total of 102 4-Digit Codes fall broadly under the umbrella of FASD. These codes cluster under four clinically meaningful FASD diagnostic subcategories: fetal alcohol syndrome (FAS), diagnostic categories A and B; partial FAS (PFAS): diagnostic category C; static encephalopathy/alcohol-exposed (SE/AE), diagnostic categories E and F; and neurobehavioral disorder/alcohol-exposed (ND/AE), diagnostic categories G and H. Each diagnosis has a version with and without GD (Table 1).
The 4-Digit Code takes a unique approach to ranking GD, placing emphasis on height deficiency over weight deficiency. Below are the instructions provided to clinicians for how to document growth deficiency using the FASD 4-Digit Code [3].
Advances in Pediatric Research Astley et al. 2016 | 3:9 3
Table 1. FASD 4-Digit Code diagnoses with and without growth deficiency
With growth deficiency Without growth deficiency
fetal alcohol syndrome (Categories A, B)
partial fetal alcohol syndrome (Category C)
static encephalopathy / alcohol-exposed (Category E)
static encephalopathy / alcohol-exposed (Category F)
neurobehavioral disorder / alcohol-exposed (Category G)
neurobehavioral disorder / alcohol-exposed (Category H)
What type of GD are we looking for?
We are looking for GD characteristic of a teratogenic insult, not of postnatal environmental factors such as nutritional deprivation or chronic or acute illness. We want to answer the question ‘What is the patient’s growth potential after controlling for parental height and postnatal environmental influences?’ GD of teratogenic origin is likely to present as a relatively consistent impairment over a period of time (i.e., the patient’s growth follows the normal curve, but is below genetic expectation for family background). In contrast, GD caused by postnatal environmental influences is likely to present as periodic fluctuations in the curve. Separating the two growth patterns requires astute clinical judgment.
The method described below allows one to rank a patient’s overall growth pattern on a single four-point Likert scale with 1 equal to ‘normal’ and 4 equal to ‘significantly deficient’. Not all patients will have complete growth curves available; therefore, a guide is provided below to prioritize the ranking of the patient’s growth over a lifetime.
How to measure and rank growth
A. The height percentile should be age-adjusted and gender-adjusted. Because there is a significant genetic component in attained stature, adjustment for mid-parent stature is also recommended when both parents’ heights are known.
B. The weight percentile should be age-adjusted and gender-adjusted. Weight is not adjusted for height. Valid growth charts should be used. We recommend electronic computation of percentiles for increased accuracy. The FASDPN clinic uses the Hall [15] birth
weight and length growth charts for gestational age; World Health Organization (WHO) [16] height and weight growth charts for children 0–2 years of age; the WHO [16] occipital–frontal circumference (OFC) charts for children 0–5 years of age; the Centers for Disease Control (CDC) 2000 [17] height and weight growth charts for patients 2 years of age and older, and the Nellhaus [18] head circumference growth charts for children 5–18 years of age.
C. For ranking purposes, the growth record is separated into two parts:
1. Prenatal growth (birth measures)
2. Postnatal growth (all measures collected after birth, i.e. infancy through adulthood)
Select the part of the growth record with the greatest deficiency in the height percentile.
If the prenatal height percentile is lower than all postnatal height percentiles, proceed to section D for instructions on how to rank prenatal growth.
If any of the postnatal height percentiles are lower than the prenatal height percentile, select the point or consecutive points in the growth record that reflect the lowest height percentiles that cannot be attributed to postnatal environmental influences such as nutritional deprivation or chronic illness. If the height deficiency is reflected in a series of points in the growth record, as opposed to a single point, rank the level of deficiency based on the percentile range where the majority of the points fall. Proceed to section D for instructions. Table 2. Deriving the ABC-Score for growth
Circle the ABC-Scores for:
Percentile range Height Weight
£ third C C
>third and £ 10th B B
>10th A A
D. Rank the level of deficiency of the height and weight percentiles, for the part of the growth record with greatest deficiency in the height percentile by
Advances in Pediatric Research Astley et al. 2016 | 3:9 4
circling A, B, or C in the ABC-Score table at the bottom of page 1 of the FASD Diagnostic Form (Table 2).
The height and weight percentiles selected for ranking should be matched sets. For example, if the height at 10 years of age is selected for ranking, the corresponding weight percentile at 10 years of age should also be selected for ranking.
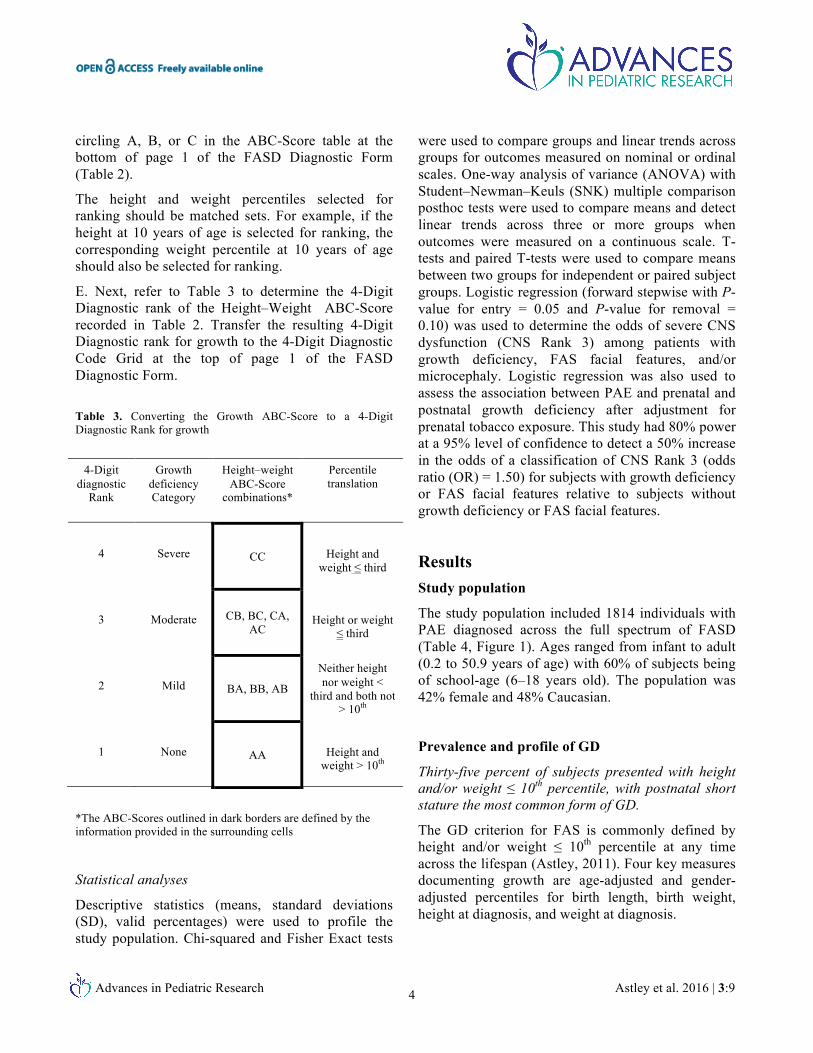
E. Next, refer to Table 3 to determine the 4-Digit Diagnostic rank of the Height–Weight ABC-Score recorded in Table 2. Transfer the resulting 4-Digit Diagnostic rank for growth to the 4-Digit Diagnostic Code Grid at the top of page 1 of the FASD Diagnostic Form.
Table 3. Converting the Growth ABC-Score to a 4-Digit Diagnostic Rank for growth
4-Digit diagnostic
Rank
Growth deficiency Category
Height–weight ABC-Score
combinations*
Percentile translation
4
Severe CC
Height and
weight ≤ third
3
Moderate CB, BC, CA,
AC
Height or weight
≤ third
2
Mild BA, BB, AB
Neither height nor weight <
third and both not > 10th
1
None AA
Height and
weight > 10th
*The ABC-Scores outlined in dark borders are defined by the information provided in the surrounding cells
Statistical analyses
Descriptive statistics (means, standard deviations (SD), valid percentages) were used to profile the study population. Chi-squared and Fisher Exact tests
were used to compare groups and linear trends across groups for outcomes measured on nominal or ordinal scales. One-way analysis of variance (ANOVA) with Student–Newman–Keuls (SNK) multiple comparison posthoc tests were used to compare means and detect linear trends across three or more groups when outcomes were measured on a continuous scale. T-tests and paired T-tests were used to compare means between two groups for independent or paired subject groups. Logistic regression (forward stepwise with P-value for entry = 0.05 and P-value for removal = 0.10) was used to determine the odds of severe CNS dysfunction (CNS Rank 3) among patients with growth deficiency, FAS facial features, and/or microcephaly. Logistic regression was also used to assess the association between PAE and prenatal and postnatal growth deficiency after adjustment for prenatal tobacco exposure. This study had 80% power at a 95% level of confidence to detect a 50% increase in the odds of a classification of CNS Rank 3 (odds ratio (OR) = 1.50) for subjects with growth deficiency or FAS facial features relative to subjects without growth deficiency or FAS facial features.
Results Study population
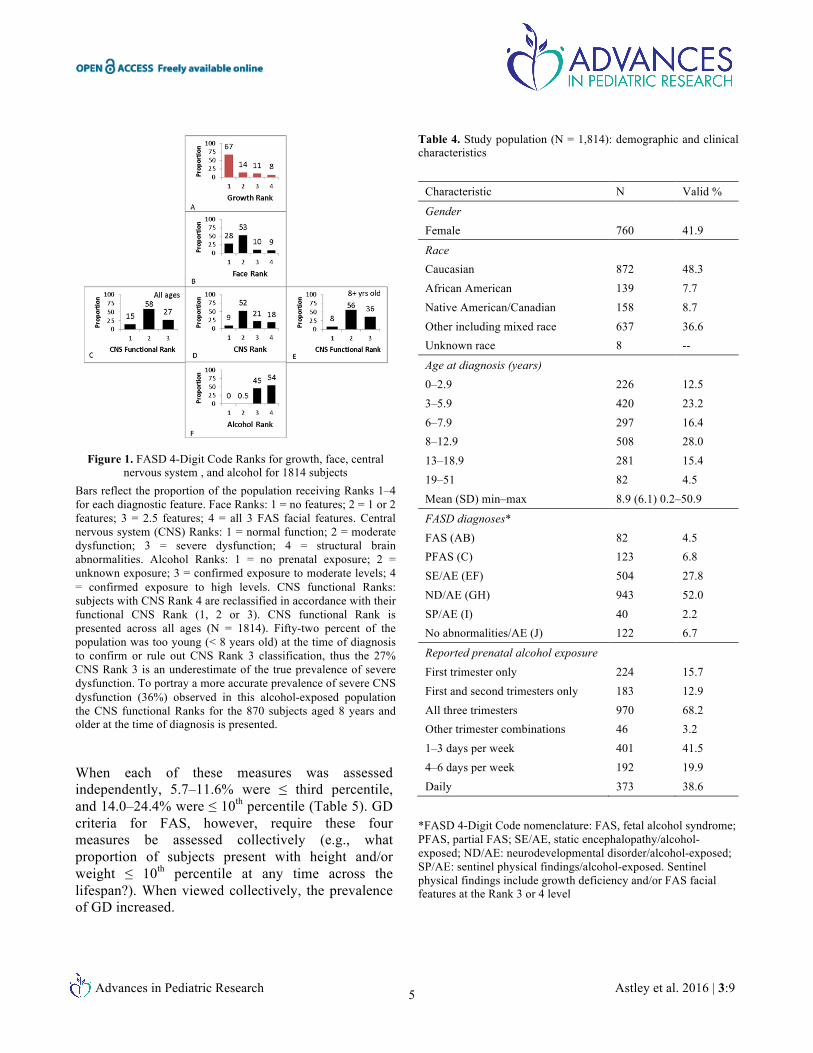
The study population included 1814 individuals with PAE diagnosed across the full spectrum of FASD (Table 4, Figure 1). Ages ranged from infant to adult (0.2 to 50.9 years of age) with 60% of subjects being of school-age (6–18 years old). The population was 42% female and 48% Caucasian.
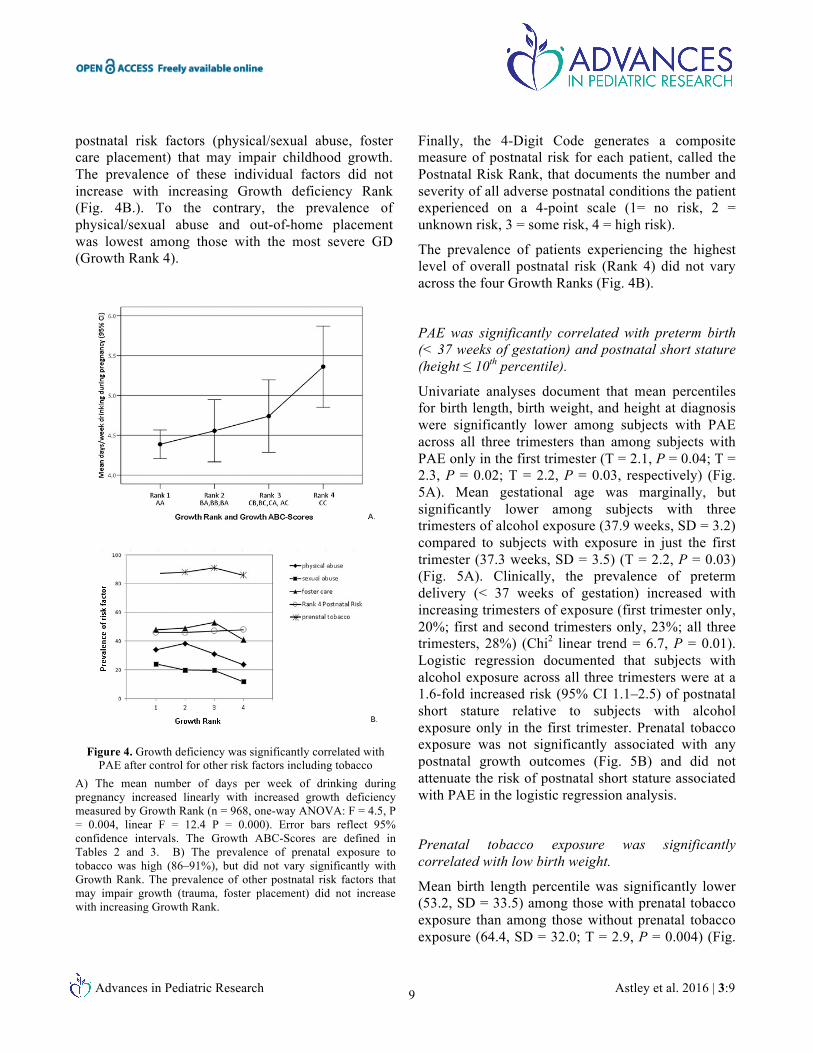
Prevalence and profile of GD
Thirty-five percent of subjects presented with height and/or weight ≤ 10th percentile, with postnatal short stature the most common form of GD.
The GD criterion for FAS is commonly defined by height and/or weight ≤ 10th percentile at any time across the lifespan (Astley, 2011). Four key measures documenting growth are age-adjusted and gender-adjusted percentiles for birth length, birth weight, height at diagnosis, and weight at diagnosis.
Advances in Pediatric Research Astley et al. 2016 | 3:9 5
Figure 1. FASD 4-Digit Code Ranks for growth, face, central
nervous system , and alcohol for 1814 subjects Bars reflect the proportion of the population receiving Ranks 1–4 for each diagnostic feature. Face Ranks: 1 = no features; 2 = 1 or 2 features; 3 = 2.5 features; 4 = all 3 FAS facial features. Central nervous system (CNS) Ranks: 1 = normal function; 2 = moderate dysfunction; 3 = severe dysfunction; 4 = structural brain abnormalities. Alcohol Ranks: 1 = no prenatal exposure; 2 = unknown exposure; 3 = confirmed exposure to moderate levels; 4 = confirmed exposure to high levels. CNS functional Ranks: subjects with CNS Rank 4 are reclassified in accordance with their functional CNS Rank (1, 2 or 3). CNS functional Rank is presented across all ages (N = 1814). Fifty-two percent of the population was too young (< 8 years old) at the time of diagnosis to confirm or rule out CNS Rank 3 classification, thus the 27% CNS Rank 3 is an underestimate of the true prevalence of severe dysfunction. To portray a more accurate prevalence of severe CNS dysfunction (36%) observed in this alcohol-exposed population the CNS functional Ranks for the 870 subjects aged 8 years and older at the time of diagnosis is presented.
When each of these measures was assessed independently, 5.7–11.6% were ≤ third percentile, and 14.0–24.4% were ≤ 10th percentile (Table 5). GD criteria for FAS, however, require these four measures be assessed collectively (e.g., what proportion of subjects present with height and/or weight ≤ 10th percentile at any time across the lifespan?). When viewed collectively, the prevalence of GD increased.
Table 4. Study population (N = 1,814): demographic and clinical characteristics
Characteristic N Valid %
Gender Female 760 41.9
Race Caucasian 872 48.3 African American 139 7.7 Native American/Canadian 158 8.7 Other including mixed race 637 36.6 Unknown race 8 --
Age at diagnosis (years) 0–2.9 226 12.5 3–5.9 420 23.2 6–7.9 297 16.4 8–12.9 508 28.0 13–18.9 281 15.4 19–51 82 4.5 Mean (SD) min–max 8.9 (6.1) 0.2–50.9
FASD diagnoses* FAS (AB) 82 4.5 PFAS (C) 123 6.8 SE/AE (EF) 504 27.8 ND/AE (GH) 943 52.0 SP/AE (I) 40 2.2 No abnormalities/AE (J) 122 6.7
Reported prenatal alcohol exposure First trimester only 224 15.7 First and second trimesters only 183 12.9 All three trimesters 970 68.2 Other trimester combinations 46 3.2 1–3 days per week 401 41.5 4–6 days per week 192 19.9 Daily 373 38.6
*FASD 4-Digit Code nomenclature: FAS, fetal alcohol syndrome; PFAS, partial FAS; SE/AE, static encephalopathy/alcohol-exposed; ND/AE: neurodevelopmental disorder/alcohol-exposed; SP/AE: sentinel physical findings/alcohol-exposed. Sentinel physical findings include growth deficiency and/or FAS facial features at the Rank 3 or 4 level
Advances in Pediatric Research Astley et al. 2016 | 3:9 6
Eighteen percent of patients presented with growth ≤ third percentile, and 35% presented with growth ≤ 10th percentile. Among the 35% with GD, the most common form of GD was postnatal short stature (69.3%) (Table 5). GD manifested differently across the lifespan (Table 6). Table 5. Profile of growth deficiency at birth and at the age of diagnosis
Growth measures Total N n Valid
% n Valid %
Gestational age < 37 weeks
1396 367 26.3 -- --
≤ third ≤ 10th
Birth length percentile 1170 90 7.6 164 14.0
Birth weight percentile 1387 79 5.7 213 15.4
Postnatal height percentile at diagnosis
1814 201 11.6 443 24.4
Postnatal weight percentile at diagnosis
1814 145 8.0 285 15.7
Height or weight percentile at birth or at diagnosis ≤ 10th percentile
1814 333 18.3 639 35.2
Growth ≤ 10th by age (years) at diagnosis
Height Weight
0.1–2.9 226 90 39.8 87 38.5
3.0–5.9 420 104 24.8 63 15.0
6.0–12.9 805 155 20.6 98 12.1
13.0–18.9 281 54 19.3 25 8.9
19.0–51.9 82 29 35.8 12 14.8
Among the 639 with height or weight ≤ 10th percentile at birth or at diagnosis
At birth At diagnosis
Proportion with height deficiency
639 164 38.2 443 69.3
Proportion with weight deficiency
639 213 41.4 285 44.6
While the majority of patients with height and/or weight deficiency presented with these deficiencies postnatally at the time of their diagnosis, 22% of
subjects with height deficiency were only height-deficient at birth, and 39% of subjects with weight deficiency were only weight-deficient at birth.
The 4-Digit Code provides a more comprehensive view of the collective pattern and magnitude of GD across the population (Fig. 2). The height and weight ABC-Scores for this population document that height deficiency ≤ 10th percentile (ABC-Scores B and C) was more prevalent (29%) than weight deficiency (20%) (Fig. 2A1, 2A2). Nineteen percent of patients presented with growth ≤ third percentile (Growth Ranks 3 and 4: height and/or weight ≤ third percentile) and 33% presented with growth ≤ 10th percentile (Growth Ranks 2, 3 and 4: height and/or weight at or below the 10th percentile) (Fig. 2C). Height and weight percentiles were rarely concordant in an individual. Only one-third of the subjects presenting with growth deficiency had both height and weight moderately (ABC-Score = BB) or severely deficient (ABC-Score = CC) (Fig. 2B).
GD was as prevalent as the other core diagnostic features of FASD (i.e. FAS facial features and CNS abnormalities).
The prevalence of Rank 3 (11%) and Rank 4 (8%) GD (Fig. 1) was near-identical to the prevalence of Rank 3 (10%) and Rank 4 (9%) expressions of the FAS facial phenotype (Fig. 1). However, not everyone with Rank 3 or 4 facial phenotypes had Rank 3 or 4 GD. Only 37% (130/349) of those with Rank 3 or 4 GD (height and/or weight ≤ third percentile) had Rank 3 or 4 facial phenotypes, and only 38% (130/340) of those with Rank 3 or 4 facial phenotypes had Rank 3 or 4 GD. In contrast, 87% (305/349) with Rank 2, 3, or 4 GD (height or weight ≤ 10th percentile) had Rank 3 or 4 facial phenotypes. The prevalence of GD ≤ 10th percentile (Growth Ranks 2, 3 and 4) (33%) is equivalent to the prevalence of severe CNS structural/functional abnormalities (CNS Ranks 3 and 4) (39%) and the prevalence of severe CNS dysfunction (CNS Rank 3) (36%) among subjects who were 8 years of age and older (Fig. 1).
Advances in Pediatric Research Astley et al. 2016 | 3:9 7
Table 6. Discordance between height and weight deficiency ≤ 10th percentile at birth and age of diagnosis
Parameter Total* Growth-deficient subgroup** N (% of total) % of growth-deficient subgroup
N N Height deficiency only
Weight deficiency only
Height and weightdeficiency
At birth 1162 243 69 (5.9) 28 79 (6.8) 33 95 (8.2) 39
At diagnosis 1814 509 224 (12.3) 44 66 (3.6) 13 219 (12.1) 43
GD atbirth only
GD at diagnosis only GD at birth and diagnosis
Height 1170 352 79 (6.8) 22 188 (16.1) 53 85 (7.3) 24
Weight 1387 351 136 (9.8) 39 138 (9.9) 39 77 (5.6) 22
*Total N reflects the number of subjects with data for both parameters being addressed in that row (e.g., At birth, 1,162 subjects had both height and weight data available at birth) **The growth-deficient subgroup reflects the number of subjects with growth deficiency ≤ 10th percentile for each parameter being addressed in that row (e.g., at birth, 243 subjects had height and/or weight ≤ 10th percentile)
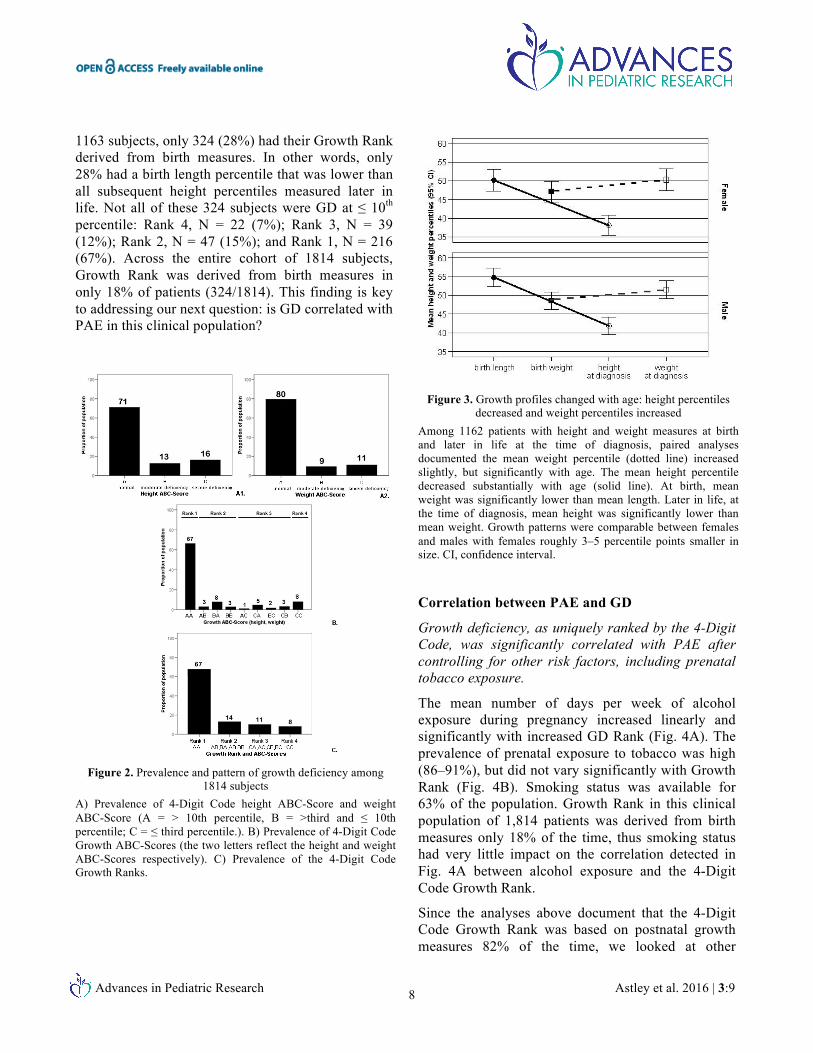
Growth profiles changed with age: height percentiles decreased and weight percentiles increased.
Among the 1162 patients with height and weight measures recorded in the FASDPN database at birth and at diagnosis, their mean birth weight percentile (48.0, SD = 31) was significantly lower than their mean birth length percentile (52.9, SD = 33) (paired T = 6.0, P = 0.000) (Fig. 3). Later in life, at the time of diagnosis, their mean weight percentile (51.0, SD = 32) was significantly higher than their mean height percentile (40.3, SD = 30) (paired T = –14.3, P = 0.000). Their mean weight percentile increased slightly but significantly by 3 percentage points after birth (paired T = 2.9, P = 0.004). In contrast, their mean height percentile decreased substantially (by 12.5 percentage points) and significantly after birth (paired T = –11.7, P = 0.000).
Growth patterns were comparable between females and males, with females being approximately 3–5 percentile points smaller in size. Of the 164 subjects with birth lengths ≤ 10th percentile, 52% had height percentiles later in life that were ≤ 10th percentile. Of the 174 subjects with birth weight ≤ 10th percentile, 37% had weight percentiles later in life that were ≤ 10th percentile.
Although FAS is defined by GD at any time across the lifespan (birth through adulthood), the 4-Digit Code Growth Rank was based on birth measures only 18% (324/1814) of the time.
FASD diagnostic guidelines, including the 4-Digit Code, allow prenatal and/or postnatal evidence of GD to meet criterion for FAS. It is important to note that when ranking growth using the 4-Digit Code, the clinician first separates the growth curve into two parts: 1) prenatal growth, i.e. birth measures; and 2) postnatal growth, i.e. all measures subsequent to birth (infancy through adulthood). Growth is then ranked based on the part of the growth curve presenting with the lowest height percentile. The 4-Digit Code emphasizes height deficiency; this is because weight gain and loss is more easily influenced by other risk factors such as nutrition and illness. Using this more prescribed approach, we queried how often the Growth Rank was derived from birth measures, and how often the birth length percentile was lower than all height percentiles measured later in life (infancy through adulthood).
Within our cohort, 1163 (64%) patients had both their birth lengths and birth weights recorded. The 4-Digit Code allows only height and weight measures taken on the same day to be used to rank growth. Of the
Advances in Pediatric Research Astley et al. 2016 | 3:9 8
1163 subjects, only 324 (28%) had their Growth Rank derived from birth measures. In other words, only 28% had a birth length percentile that was lower than all subsequent height percentiles measured later in life. Not all of these 324 subjects were GD at ≤ 10th percentile: Rank 4, N = 22 (7%); Rank 3, N = 39 (12%); Rank 2, N = 47 (15%); and Rank 1, N = 216 (67%). Across the entire cohort of 1814 subjects, Growth Rank was derived from birth measures in only 18% of patients (324/1814). This finding is key to addressing our next question: is GD correlated with PAE in this clinical population?
Figure 2. Prevalence and pattern of growth deficiency among
1814 subjects A) Prevalence of 4-Digit Code height ABC-Score and weight ABC-Score (A = > 10th percentile, B = >third and ≤ 10th percentile; C = ≤ third percentile.). B) Prevalence of 4-Digit Code Growth ABC-Scores (the two letters reflect the height and weight ABC-Scores respectively). C) Prevalence of the 4-Digit Code Growth Ranks.
Figure 3. Growth profiles changed with age: height percentiles
decreased and weight percentiles increased Among 1162 patients with height and weight measures at birth and later in life at the time of diagnosis, paired analyses documented the mean weight percentile (dotted line) increased slightly, but significantly with age. The mean height percentile decreased substantially with age (solid line). At birth, mean weight was significantly lower than mean length. Later in life, at the time of diagnosis, mean height was significantly lower than mean weight. Growth patterns were comparable between females and males with females roughly 3–5 percentile points smaller in size. CI, confidence interval.
Correlation between PAE and GD
Growth deficiency, as uniquely ranked by the 4-Digit Code, was significantly correlated with PAE after controlling for other risk factors, including prenatal tobacco exposure.
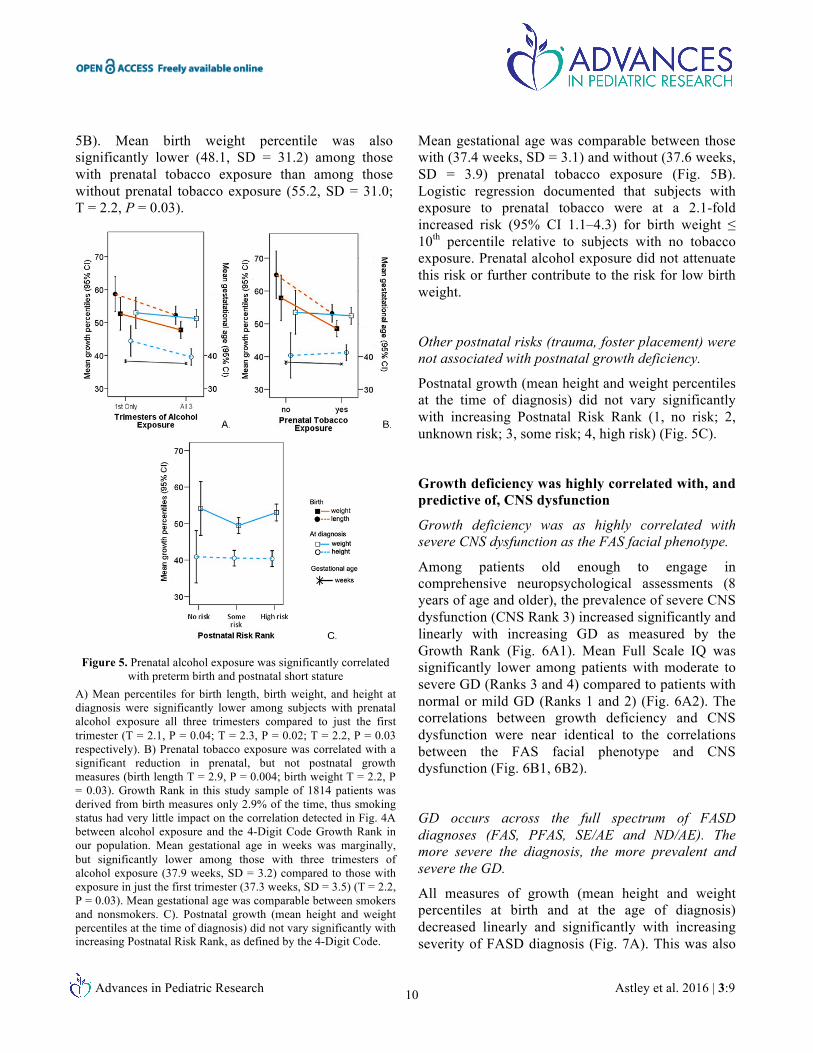
The mean number of days per week of alcohol exposure during pregnancy increased linearly and significantly with increased GD Rank (Fig. 4A). The prevalence of prenatal exposure to tobacco was high (86–91%), but did not vary significantly with Growth Rank (Fig. 4B). Smoking status was available for 63% of the population. Growth Rank in this clinical population of 1,814 patients was derived from birth measures only 18% of the time, thus smoking status had very little impact on the correlation detected in Fig. 4A between alcohol exposure and the 4-Digit Code Growth Rank.
Since the analyses above document that the 4-Digit Code Growth Rank was based on postnatal growth measures 82% of the time, we looked at other
Advances in Pediatric Research Astley et al. 2016 | 3:9 9
postnatal risk factors (physical/sexual abuse, foster care placement) that may impair childhood growth. The prevalence of these individual factors did not increase with increasing Growth deficiency Rank (Fig. 4B.). To the contrary, the prevalence of physical/sexual abuse and out-of-home placement was lowest among those with the most severe GD (Growth Rank 4).
Figure 4. Growth deficiency was significantly correlated with
PAE after control for other risk factors including tobacco A) The mean number of days per week of drinking during pregnancy increased linearly with increased growth deficiency measured by Growth Rank (n = 968, one-way ANOVA: F = 4.5, P = 0.004, linear F = 12.4 P = 0.000). Error bars reflect 95% confidence intervals. The Growth ABC-Scores are defined in Tables 2 and 3. B) The prevalence of prenatal exposure to tobacco was high (86–91%), but did not vary significantly with Growth Rank. The prevalence of other postnatal risk factors that may impair growth (trauma, foster placement) did not increase with increasing Growth Rank.
Finally, the 4-Digit Code generates a composite measure of postnatal risk for each patient, called the Postnatal Risk Rank, that documents the number and severity of all adverse postnatal conditions the patient experienced on a 4-point scale (1= no risk, 2 = unknown risk, 3 = some risk, 4 = high risk).
The prevalence of patients experiencing the highest level of overall postnatal risk (Rank 4) did not vary across the four Growth Ranks (Fig. 4B).
PAE was significantly correlated with preterm birth (< 37 weeks of gestation) and postnatal short stature (height ≤ 10th percentile).
Univariate analyses document that mean percentiles for birth length, birth weight, and height at diagnosis were significantly lower among subjects with PAE across all three trimesters than among subjects with PAE only in the first trimester (T = 2.1, P = 0.04; T = 2.3, P = 0.02; T = 2.2, P = 0.03, respectively) (Fig. 5A). Mean gestational age was marginally, but significantly lower among subjects with three trimesters of alcohol exposure (37.9 weeks, SD = 3.2) compared to subjects with exposure in just the first trimester (37.3 weeks, SD = 3.5) (T = 2.2, P = 0.03) (Fig. 5A). Clinically, the prevalence of preterm delivery (< 37 weeks of gestation) increased with increasing trimesters of exposure (first trimester only, 20%; first and second trimesters only, 23%; all three trimesters, 28%) (Chi2 linear trend = 6.7, P = 0.01). Logistic regression documented that subjects with alcohol exposure across all three trimesters were at a 1.6-fold increased risk (95% CI 1.1–2.5) of postnatal short stature relative to subjects with alcohol exposure only in the first trimester. Prenatal tobacco exposure was not significantly associated with any postnatal growth outcomes (Fig. 5B) and did not attenuate the risk of postnatal short stature associated with PAE in the logistic regression analysis.
Prenatal tobacco exposure was significantly correlated with low birth weight.
Mean birth length percentile was significantly lower (53.2, SD = 33.5) among those with prenatal tobacco exposure than among those without prenatal tobacco exposure (64.4, SD = 32.0; T = 2.9, P = 0.004) (Fig.
Advances in Pediatric Research Astley et al. 2016 | 3:9 10
5B). Mean birth weight percentile was also significantly lower (48.1, SD = 31.2) among those with prenatal tobacco exposure than among those without prenatal tobacco exposure (55.2, SD = 31.0; T = 2.2, P = 0.03).
Figure 5. Prenatal alcohol exposure was significantly correlated
with preterm birth and postnatal short stature A) Mean percentiles for birth length, birth weight, and height at diagnosis were significantly lower among subjects with prenatal alcohol exposure all three trimesters compared to just the first trimester (T = 2.1, P = 0.04; T = 2.3, P = 0.02; T = 2.2, P = 0.03 respectively). B) Prenatal tobacco exposure was correlated with a significant reduction in prenatal, but not postnatal growth measures (birth length T = 2.9, P = 0.004; birth weight T = 2.2, P = 0.03). Growth Rank in this study sample of 1814 patients was derived from birth measures only 2.9% of the time, thus smoking status had very little impact on the correlation detected in Fig. 4A between alcohol exposure and the 4-Digit Code Growth Rank in our population. Mean gestational age in weeks was marginally, but significantly lower among those with three trimesters of alcohol exposure (37.9 weeks, SD = 3.2) compared to those with exposure in just the first trimester (37.3 weeks, SD = 3.5) (T = 2.2, P = 0.03). Mean gestational age was comparable between smokers and nonsmokers. C). Postnatal growth (mean height and weight percentiles at the time of diagnosis) did not vary significantly with increasing Postnatal Risk Rank, as defined by the 4-Digit Code.
Mean gestational age was comparable between those with (37.4 weeks, SD = 3.1) and without (37.6 weeks, SD = 3.9) prenatal tobacco exposure (Fig. 5B). Logistic regression documented that subjects with exposure to prenatal tobacco were at a 2.1-fold increased risk (95% CI 1.1–4.3) for birth weight ≤ 10th percentile relative to subjects with no tobacco exposure. Prenatal alcohol exposure did not attenuate this risk or further contribute to the risk for low birth weight.
Other postnatal risks (trauma, foster placement) were not associated with postnatal growth deficiency.
Postnatal growth (mean height and weight percentiles at the time of diagnosis) did not vary significantly with increasing Postnatal Risk Rank (1, no risk; 2, unknown risk; 3, some risk; 4, high risk) (Fig. 5C).
Growth deficiency was highly correlated with, and predictive of, CNS dysfunction
Growth deficiency was as highly correlated with severe CNS dysfunction as the FAS facial phenotype.
Among patients old enough to engage in comprehensive neuropsychological assessments (8 years of age and older), the prevalence of severe CNS dysfunction (CNS Rank 3) increased significantly and linearly with increasing GD as measured by the Growth Rank (Fig. 6A1). Mean Full Scale IQ was significantly lower among patients with moderate to severe GD (Ranks 3 and 4) compared to patients with normal or mild GD (Ranks 1 and 2) (Fig. 6A2). The correlations between growth deficiency and CNS dysfunction were near identical to the correlations between the FAS facial phenotype and CNS dysfunction (Fig. 6B1, 6B2).
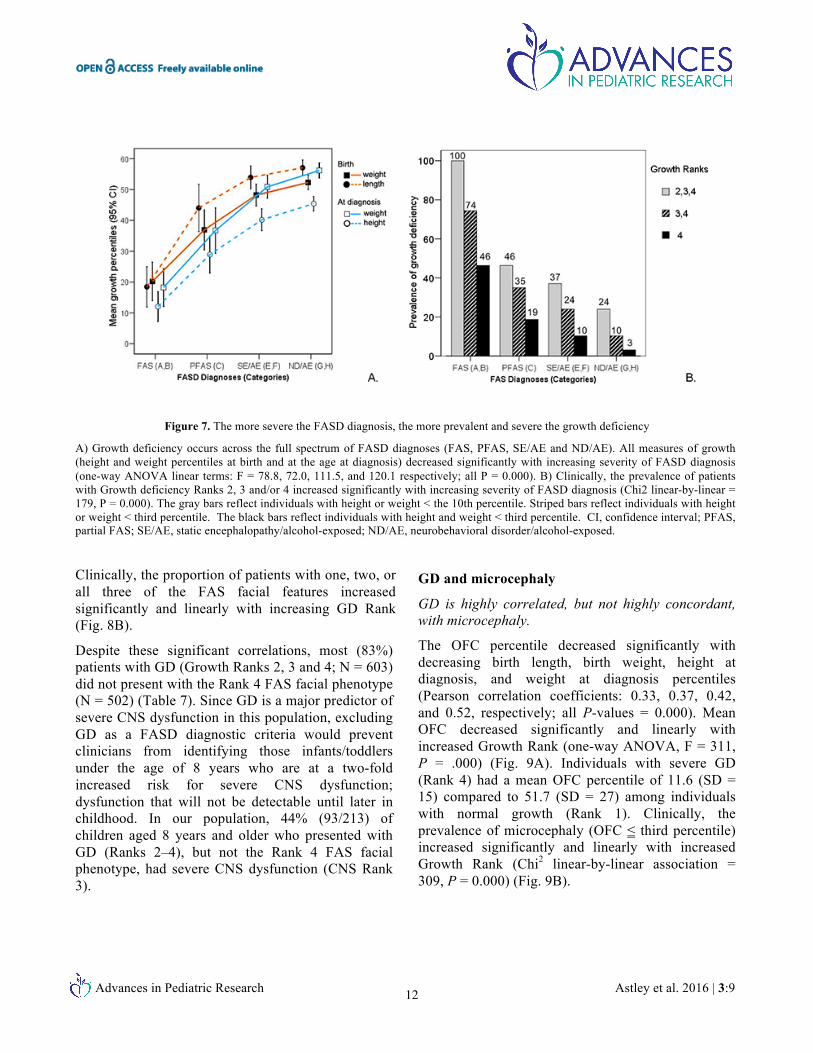
GD occurs across the full spectrum of FASD diagnoses (FAS, PFAS, SE/AE and ND/AE). The more severe the diagnosis, the more prevalent and severe the GD.
All measures of growth (mean height and weight percentiles at birth and at the age of diagnosis) decreased linearly and significantly with increasing severity of FASD diagnosis (Fig. 7A). This was also
Advances in Pediatric Research Astley et al. 2016 | 3:9 11
reflected in the Growth Rank. The prevalence of GD (Growth Ranks 2, 3 and 4) increased linearly with increasing severity of FASD diagnosis (Fig. 7B).
Figure 6. The correlation between growth deficiency and central
nervous system (CNS) dysfunction was as strong as the correlation between the FAS facial phenotype and CNS
dysfunction A1). The prevalence of severe CNS dysfunction (CNS Rank 3) increased significantly with increasing Growth Rank among those aged 8 years and older at the time of diagnosis (i.e. those old enough to have CNS function assessed) (N = 871: Chi2 linear-by-linear association = 24.8, P = 0.000). A2) The mean FSIQ among subjects with Rank 3 or 4 growth deficiency was significantly lower than among subjects with Growth Ranks 1 or 2 (one-way ANOVA: F = 7.2, P = 0.000: SNK: Ranks 3, 4 < Ranks 1, 2). B1) The prevalence of severe CNS dysfunction (CNS Rank 3) increased significantly with increasing Growth Rank among those aged 8 years and older at the time of (N = 871: Chi2 linear-by-linear association = 24.8, P = 0.000). B2) The mean FSIQ among subjects with Rank 3 or 4 FAS facial phenotypes were significantly lower than among subjects with Rank 1 or 2 facial phenotypes (one-way ANOVA: F = 3.5, P = 0.02: SNK: Ranks 3,4 < Ranks 1,2).Chi2, Chi square test; CI, confidence interval; CNS, central nervous system; FSIQ, full scale intelligence quotient; SNK Student–Newman–Keuls test.
FAS has the lowest mean growth percentiles and the highest prevalence of GD (100%) because GD is required for a diagnosis of FAS, but the PFAS, SEAE, and NDAE diagnostic criteria do not require GD (height and/or weight ≤ 10th percentile).
Nevertheless, even those with just moderate CNS dysfunction (ND/AE) presented with GD ≤ 10th percentile, albeit only half as often (24%) as those with PFAS (46%). Thus, the significant reduction in mean height and weight percentiles at birth and at the age of diagnosis with increasing severity of diagnosis (ND/AE, SE/AE and PFAS) further illustrates the correlation between growth and CNS impairment across the full spectrum of FASD.
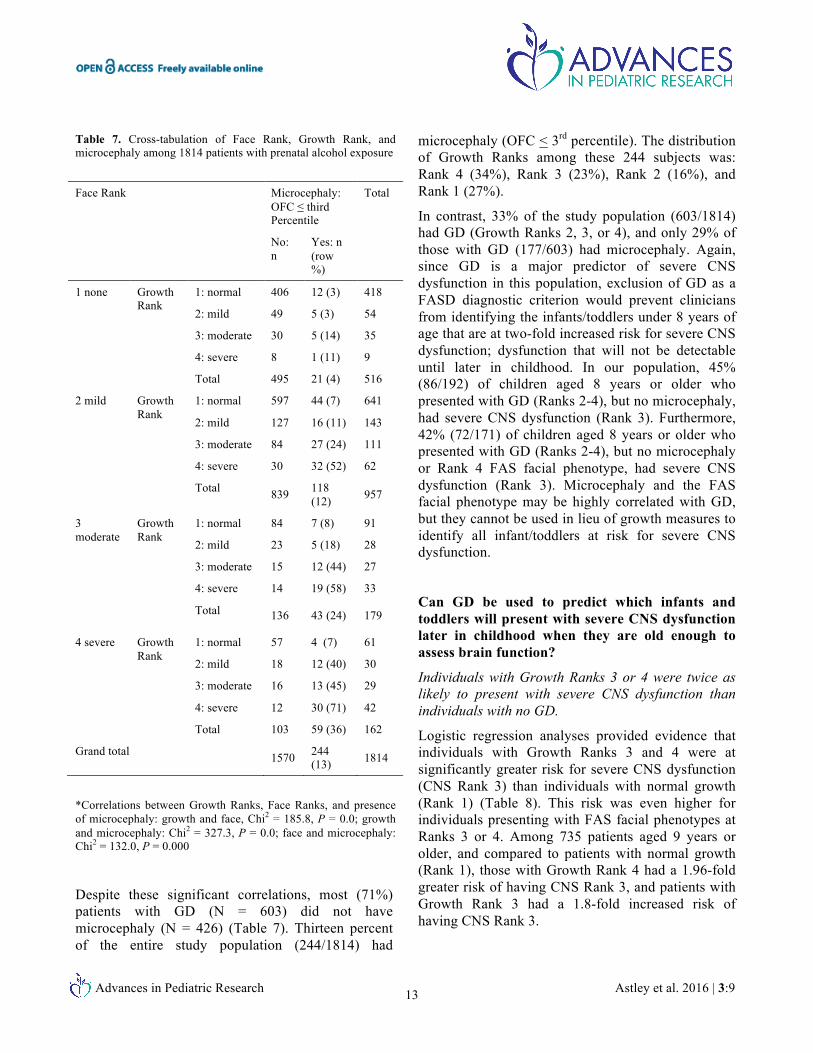
Intercorrelation and concordance of GD, the FAS facial phenotype, and microcephaly
GD is highly correlated with the FAS facial phenotype and microcephaly, but not every patient with the FAS facial phenotype and/or microcephaly has GD.
The three core physical features of FASD are GD, the FAS facial phenotype, and microcephaly.
Although the presence of these features is highly intercorrelated, they are not 100% concordant within each patient. Patients do not present with all or none of these physical features (Table 7). For example, GD ≤ 10th percentile (Ranks 2–4) was present in 26% (n = 382) of 1470 subjects who did not present with the FAS facial phenotype (Rank 4) or microcephaly (occipital–frontal circumference [OFC] ≤ third percentile). Documentation of GD Rank 2, 3, or 4 in their FASD 4-Digit Code alerts clinicians that these 382 subjects are at a two-fold increased risk for severe CNS dysfunction, despite absence of the FAS facial phenotype and microcephaly. Almost half will present with severe CNS dysfunction later in childhood. Among the 172 patients who were old enough to fully assess CNS function (≥ 8 years old), 42% presented with severe CNS dysfunction (CNS Rank 3).
GD and the FAS facial phenotype
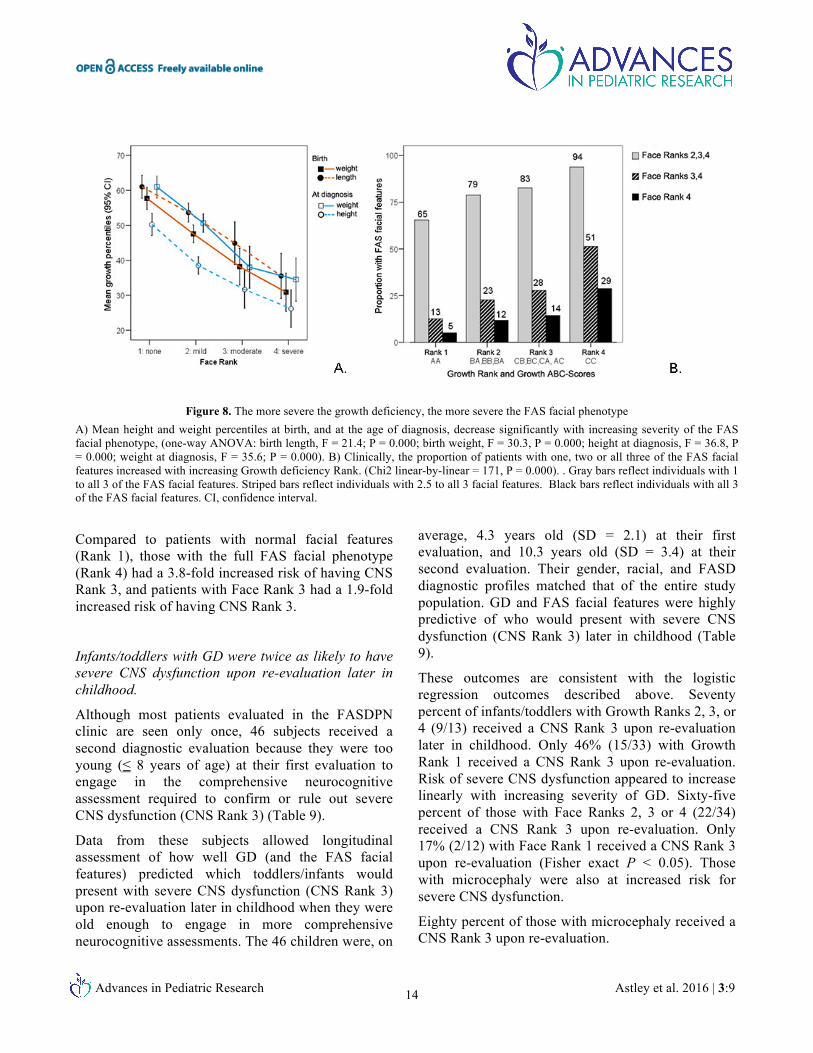
GD is highly correlated, but not highly concordant with the FAS facial phenotype. Mean height and weight percentiles at birth and at the age of diagnosis decreased significantly with increasing severity of the FAS facial features Rank (Fig. 8A).
Advances in Pediatric Research Astley et al. 2016 | 3:9 12
Figure 7. The more severe the FASD diagnosis, the more prevalent and severe the growth deficiency
A) Growth deficiency occurs across the full spectrum of FASD diagnoses (FAS, PFAS, SE/AE and ND/AE). All measures of growth (height and weight percentiles at birth and at the age at diagnosis) decreased significantly with increasing severity of FASD diagnosis (one-way ANOVA linear terms: F = 78.8, 72.0, 111.5, and 120.1 respectively; all P = 0.000). B) Clinically, the prevalence of patients with Growth deficiency Ranks 2, 3 and/or 4 increased significantly with increasing severity of FASD diagnosis (Chi2 linear-by-linear = 179, P = 0.000). The gray bars reflect individuals with height or weight < the 10th percentile. Striped bars reflect individuals with height or weight < third percentile. The black bars reflect individuals with height and weight < third percentile. CI, confidence interval; PFAS, partial FAS; SE/AE, static encephalopathy/alcohol-exposed; ND/AE, neurobehavioral disorder/alcohol-exposed.
Clinically, the proportion of patients with one, two, or all three of the FAS facial features increased significantly and linearly with increasing GD Rank (Fig. 8B).
Despite these significant correlations, most (83%) patients with GD (Growth Ranks 2, 3 and 4; N = 603) did not present with the Rank 4 FAS facial phenotype (N = 502) (Table 7). Since GD is a major predictor of severe CNS dysfunction in this population, excluding GD as a FASD diagnostic criteria would prevent clinicians from identifying those infants/toddlers under the age of 8 years who are at a two-fold increased risk for severe CNS dysfunction; dysfunction that will not be detectable until later in childhood. In our population, 44% (93/213) of children aged 8 years and older who presented with GD (Ranks 2–4), but not the Rank 4 FAS facial phenotype, had severe CNS dysfunction (CNS Rank 3).
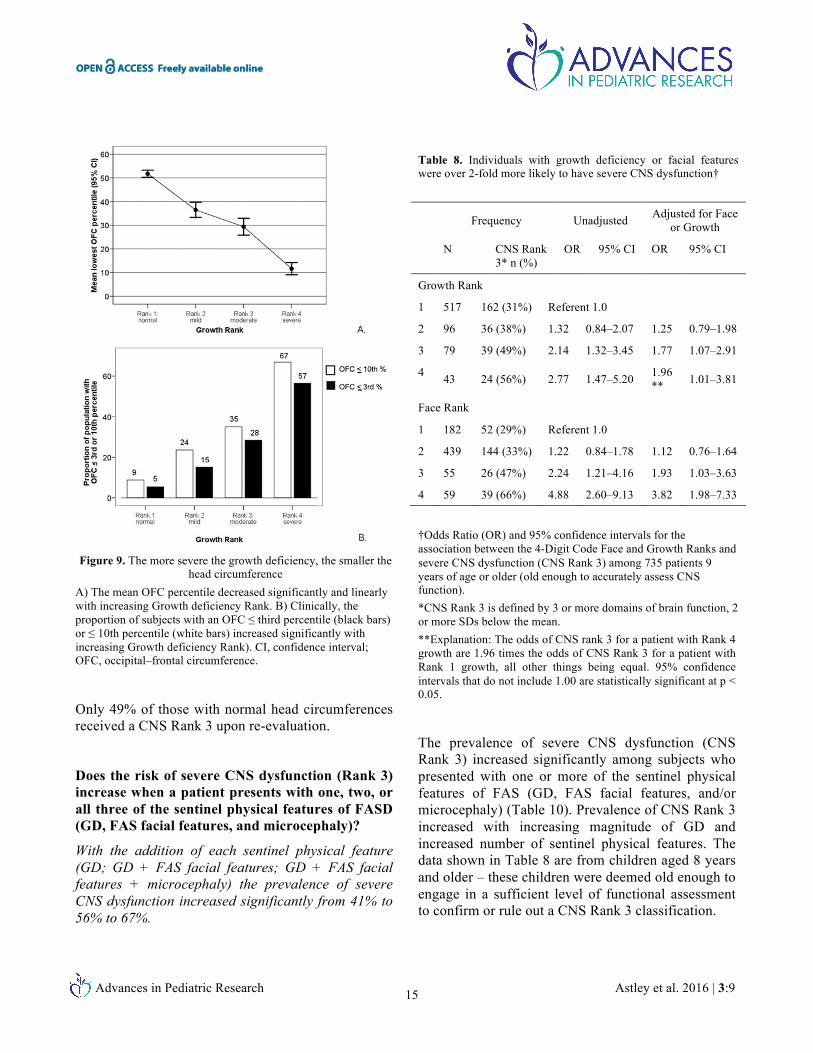
GD and microcephaly
GD is highly correlated, but not highly concordant, with microcephaly.
The OFC percentile decreased significantly with decreasing birth length, birth weight, height at diagnosis, and weight at diagnosis percentiles (Pearson correlation coefficients: 0.33, 0.37, 0.42, and 0.52, respectively; all P-values = 0.000). Mean OFC decreased significantly and linearly with increased Growth Rank (one-way ANOVA, F = 311, P = .000) (Fig. 9A). Individuals with severe GD (Rank 4) had a mean OFC percentile of 11.6 (SD = 15) compared to 51.7 (SD = 27) among individuals with normal growth (Rank 1). Clinically, the prevalence of microcephaly (OFC ≤ third percentile) increased significantly and linearly with increased Growth Rank (Chi2 linear-by-linear association = 309, P = 0.000) (Fig. 9B).
Advances in Pediatric Research Astley et al. 2016 | 3:9 13
Table 7. Cross-tabulation of Face Rank, Growth Rank, and microcephaly among 1814 patients with prenatal alcohol exposure
Face Rank Microcephaly: OFC ≤ third Percentile
Total
No: n
Yes: n (row %)
1 none Growth Rank
1: normal 406 12 (3) 418
2: mild 49 5 (3) 54
3: moderate 30 5 (14) 35
4: severe 8 1 (11) 9
Total 495 21 (4) 516
2 mild Growth Rank
1: normal 597 44 (7) 641
2: mild 127 16 (11) 143
3: moderate 84 27 (24) 111
4: severe 30 32 (52) 62
Total 839 118 (12) 957
3 moderate
Growth Rank
1: normal 84 7 (8) 91
2: mild 23 5 (18) 28
3: moderate 15 12 (44) 27
4: severe 14 19 (58) 33
Total 136 43 (24) 179
4 severe Growth Rank
1: normal 57 4 (7) 61
2: mild 18 12 (40) 30
3: moderate 16 13 (45) 29
4: severe 12 30 (71) 42
Total 103 59 (36) 162
Grand total 1570 244 (13) 1814
*Correlations between Growth Ranks, Face Ranks, and presence of microcephaly: growth and face, Chi2 = 185.8, P = 0.0; growth and microcephaly: Chi2 = 327.3, P = 0.0; face and microcephaly: Chi2 = 132.0, P = 0.000
Despite these significant correlations, most (71%) patients with GD (N = 603) did not have microcephaly (N = 426) (Table 7). Thirteen percent of the entire study population (244/1814) had
microcephaly (OFC < 3rd percentile). The distribution of Growth Ranks among these 244 subjects was: Rank 4 (34%), Rank 3 (23%), Rank 2 (16%), and Rank 1 (27%).
In contrast, 33% of the study population (603/1814) had GD (Growth Ranks 2, 3, or 4), and only 29% of those with GD (177/603) had microcephaly. Again, since GD is a major predictor of severe CNS dysfunction in this population, exclusion of GD as a FASD diagnostic criterion would prevent clinicians from identifying the infants/toddlers under 8 years of age that are at two-fold increased risk for severe CNS dysfunction; dysfunction that will not be detectable until later in childhood. In our population, 45% (86/192) of children aged 8 years or older who presented with GD (Ranks 2-4), but no microcephaly, had severe CNS dysfunction (Rank 3). Furthermore, 42% (72/171) of children aged 8 years or older who presented with GD (Ranks 2-4), but no microcephaly or Rank 4 FAS facial phenotype, had severe CNS dysfunction (Rank 3). Microcephaly and the FAS facial phenotype may be highly correlated with GD, but they cannot be used in lieu of growth measures to identify all infant/toddlers at risk for severe CNS dysfunction.
Can GD be used to predict which infants and toddlers will present with severe CNS dysfunction later in childhood when they are old enough to assess brain function?
Individuals with Growth Ranks 3 or 4 were twice as likely to present with severe CNS dysfunction than individuals with no GD.
Logistic regression analyses provided evidence that individuals with Growth Ranks 3 and 4 were at significantly greater risk for severe CNS dysfunction (CNS Rank 3) than individuals with normal growth (Rank 1) (Table 8). This risk was even higher for individuals presenting with FAS facial phenotypes at Ranks 3 or 4. Among 735 patients aged 9 years or older, and compared to patients with normal growth (Rank 1), those with Growth Rank 4 had a 1.96-fold greater risk of having CNS Rank 3, and patients with Growth Rank 3 had a 1.8-fold increased risk of having CNS Rank 3.
Advances in Pediatric Research Astley et al. 2016 | 3:9 14
Figure 8. The more severe the growth deficiency, the more severe the FAS facial phenotype A) Mean height and weight percentiles at birth, and at the age of diagnosis, decrease significantly with increasing severity of the FAS facial phenotype, (one-way ANOVA: birth length, F = 21.4; P = 0.000; birth weight, F = 30.3, P = 0.000; height at diagnosis, F = 36.8, P = 0.000; weight at diagnosis, F = 35.6; P = 0.000). B) Clinically, the proportion of patients with one, two or all three of the FAS facial features increased with increasing Growth deficiency Rank. (Chi2 linear-by-linear = 171, P = 0.000). . Gray bars reflect individuals with 1 to all 3 of the FAS facial features. Striped bars reflect individuals with 2.5 to all 3 facial features. Black bars reflect individuals with all 3 of the FAS facial features. CI, confidence interval.
Compared to patients with normal facial features (Rank 1), those with the full FAS facial phenotype (Rank 4) had a 3.8-fold increased risk of having CNS Rank 3, and patients with Face Rank 3 had a 1.9-fold increased risk of having CNS Rank 3.
Infants/toddlers with GD were twice as likely to have severe CNS dysfunction upon re-evaluation later in childhood.
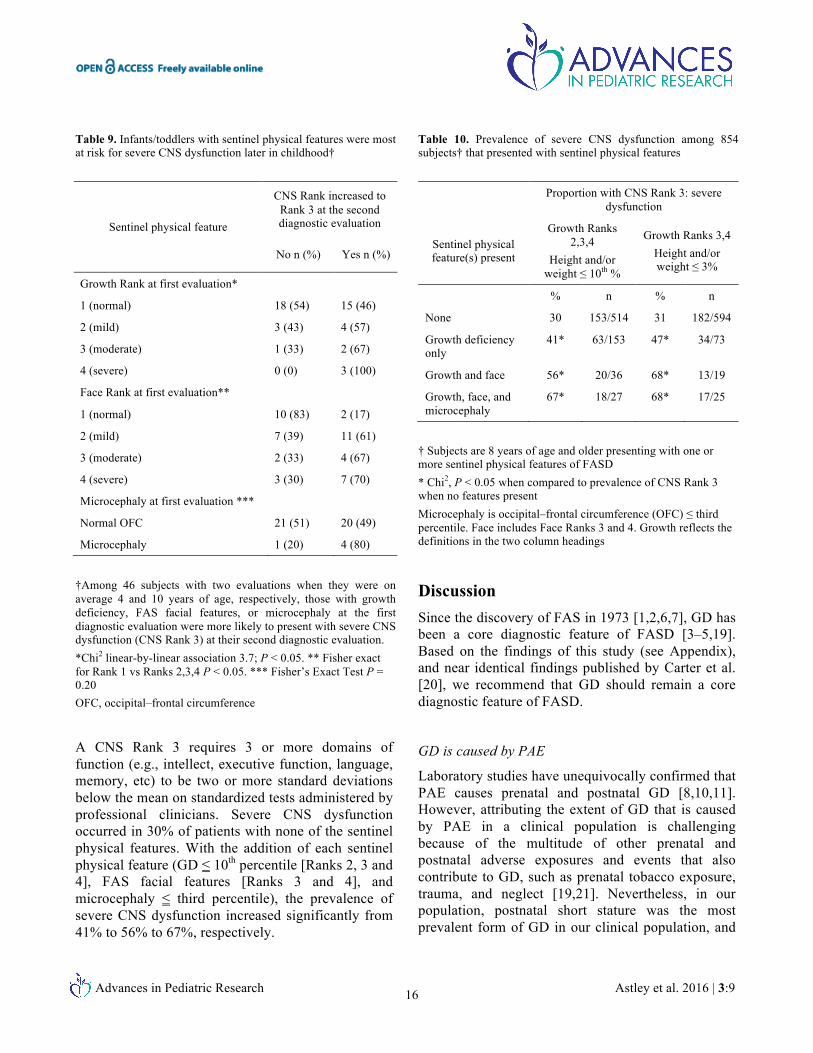
Although most patients evaluated in the FASDPN clinic are seen only once, 46 subjects received a second diagnostic evaluation because they were too young (≤ 8 years of age) at their first evaluation to engage in the comprehensive neurocognitive assessment required to confirm or rule out severe CNS dysfunction (CNS Rank 3) (Table 9).
Data from these subjects allowed longitudinal assessment of how well GD (and the FAS facial features) predicted which toddlers/infants would present with severe CNS dysfunction (CNS Rank 3) upon re-evaluation later in childhood when they were old enough to engage in more comprehensive neurocognitive assessments. The 46 children were, on
average, 4.3 years old (SD = 2.1) at their first evaluation, and 10.3 years old (SD = 3.4) at their second evaluation. Their gender, racial, and FASD diagnostic profiles matched that of the entire study population. GD and FAS facial features were highly predictive of who would present with severe CNS dysfunction (CNS Rank 3) later in childhood (Table 9).
These outcomes are consistent with the logistic regression outcomes described above. Seventy percent of infants/toddlers with Growth Ranks 2, 3, or 4 (9/13) received a CNS Rank 3 upon re-evaluation later in childhood. Only 46% (15/33) with Growth Rank 1 received a CNS Rank 3 upon re-evaluation. Risk of severe CNS dysfunction appeared to increase linearly with increasing severity of GD. Sixty-five percent of those with Face Ranks 2, 3 or 4 (22/34) received a CNS Rank 3 upon re-evaluation. Only 17% (2/12) with Face Rank 1 received a CNS Rank 3 upon re-evaluation (Fisher exact P < 0.05). Those with microcephaly were also at increased risk for severe CNS dysfunction.
Eighty percent of those with microcephaly received a CNS Rank 3 upon re-evaluation.
Advances in Pediatric Research Astley et al. 2016 | 3:9 15
Figure 9. The more severe the growth deficiency, the smaller the
head circumference A) The mean OFC percentile decreased significantly and linearly with increasing Growth deficiency Rank. B) Clinically, the proportion of subjects with an OFC ≤ third percentile (black bars) or ≤ 10th percentile (white bars) increased significantly with increasing Growth deficiency Rank). CI, confidence interval; OFC, occipital–frontal circumference.
Only 49% of those with normal head circumferences received a CNS Rank 3 upon re-evaluation.
Does the risk of severe CNS dysfunction (Rank 3) increase when a patient presents with one, two, or all three of the sentinel physical features of FASD (GD, FAS facial features, and microcephaly)?
With the addition of each sentinel physical feature (GD; GD + FAS facial features; GD + FAS facial features + microcephaly) the prevalence of severe CNS dysfunction increased significantly from 41% to 56% to 67%.
Table 8. Individuals with growth deficiency or facial features were over 2-fold more likely to have severe CNS dysfunction†
Frequency Unadjusted Adjusted for Face or Growth
N CNS Rank 3* n (%)
OR 95% CI OR 95% CI
Growth Rank
1 517 162 (31%) Referent 1.0
2 96 36 (38%) 1.32 0.84–2.07 1.25 0.79–1.98
3 79 39 (49%) 2.14 1.32–3.45 1.77 1.07–2.91
4 43 24 (56%) 2.77 1.47–5.20 1.96** 1.01–3.81
Face Rank
1 182 52 (29%) Referent 1.0
2 439 144 (33%) 1.22 0.84–1.78 1.12 0.76–1.64
3 55 26 (47%) 2.24 1.21–4.16 1.93 1.03–3.63
4 59 39 (66%) 4.88 2.60–9.13 3.82 1.98–7.33
†Odds Ratio (OR) and 95% confidence intervals for the association between the 4-Digit Code Face and Growth Ranks and severe CNS dysfunction (CNS Rank 3) among 735 patients 9 years of age or older (old enough to accurately assess CNS function). *CNS Rank 3 is defined by 3 or more domains of brain function, 2 or more SDs below the mean. **Explanation: The odds of CNS rank 3 for a patient with Rank 4 growth are 1.96 times the odds of CNS Rank 3 for a patient with Rank 1 growth, all other things being equal. 95% confidence intervals that do not include 1.00 are statistically significant at p < 0.05.
The prevalence of severe CNS dysfunction (CNS Rank 3) increased significantly among subjects who presented with one or more of the sentinel physical features of FAS (GD, FAS facial features, and/or microcephaly) (Table 10). Prevalence of CNS Rank 3 increased with increasing magnitude of GD and increased number of sentinel physical features. The data shown in Table 8 are from children aged 8 years and older – these children were deemed old enough to engage in a sufficient level of functional assessment to confirm or rule out a CNS Rank 3 classification.
Advances in Pediatric Research Astley et al. 2016 | 3:9 16
Table 9. Infants/toddlers with sentinel physical features were most at risk for severe CNS dysfunction later in childhood†
Sentinel physical feature
CNS Rank increased to Rank 3 at the second diagnostic evaluation
No n (%) Yes n (%)
Growth Rank at first evaluation*
1 (normal) 18 (54) 15 (46)
2 (mild) 3 (43) 4 (57)
3 (moderate) 1 (33) 2 (67)
4 (severe) 0 (0) 3 (100)
Face Rank at first evaluation**
1 (normal) 10 (83) 2 (17)
2 (mild) 7 (39) 11 (61)
3 (moderate) 2 (33) 4 (67)
4 (severe) 3 (30) 7 (70)
Microcephaly at first evaluation ***
Normal OFC 21 (51) 20 (49)
Microcephaly 1 (20) 4 (80)
†Among 46 subjects with two evaluations when they were on average 4 and 10 years of age, respectively, those with growth deficiency, FAS facial features, or microcephaly at the first diagnostic evaluation were more likely to present with severe CNS dysfunction (CNS Rank 3) at their second diagnostic evaluation. *Chi2 linear-by-linear association 3.7; P < 0.05. ** Fisher exact for Rank 1 vs Ranks 2,3,4 P < 0.05. *** Fisher’s Exact Test P = 0.20 OFC, occipital–frontal circumference
A CNS Rank 3 requires 3 or more domains of function (e.g., intellect, executive function, language, memory, etc) to be two or more standard deviations below the mean on standardized tests administered by professional clinicians. Severe CNS dysfunction occurred in 30% of patients with none of the sentinel physical features. With the addition of each sentinel physical feature (GD ≤ 10th percentile [Ranks 2, 3 and 4], FAS facial features [Ranks 3 and 4], and microcephaly ≤ third percentile), the prevalence of severe CNS dysfunction increased significantly from 41% to 56% to 67%, respectively.
Table 10. Prevalence of severe CNS dysfunction among 854 subjects† that presented with sentinel physical features
Proportion with CNS Rank 3: severe dysfunction
Sentinel physical feature(s) present
Growth Ranks 2,3,4
Height and/or weight ≤ 10th %
Growth Ranks 3,4 Height and/or weight ≤ 3%
% n % n
None 30 153/514 31 182/594
Growth deficiency only
41* 63/153 47* 34/73
Growth and face 56* 20/36 68* 13/19
Growth, face, and microcephaly
67* 18/27 68* 17/25
† Subjects are 8 years of age and older presenting with one or more sentinel physical features of FASD * Chi2, P < 0.05 when compared to prevalence of CNS Rank 3 when no features present Microcephaly is occipital–frontal circumference (OFC) ≤ third percentile. Face includes Face Ranks 3 and 4. Growth reflects the definitions in the two column headings
Discussion Since the discovery of FAS in 1973 [1,2,6,7], GD has been a core diagnostic feature of FASD [3–5,19]. Based on the findings of this study (see Appendix), and near identical findings published by Carter et al. [20], we recommend that GD should remain a core diagnostic feature of FASD.
GD is caused by PAE
Laboratory studies have unequivocally confirmed that PAE causes prenatal and postnatal GD [8,10,11]. However, attributing the extent of GD that is caused by PAE in a clinical population is challenging because of the multitude of other prenatal and postnatal adverse exposures and events that also contribute to GD, such as prenatal tobacco exposure, trauma, and neglect [19,21]. Nevertheless, in our population, postnatal short stature was the most prevalent form of GD in our clinical population, and
Advances in Pediatric Research Astley et al. 2016 | 3:9 17
was significantly correlated with PAE after controlling for these other risk factors.
Our findings are remarkably consistent with the literature, both past and present. For example, as far back as 1998, Habbick et al. [22] concluded, “despite retarded bone age readings, children with FAS do not show significant catch-up growth in height, although they do show relative gain in weight. Short stature can be used as a diagnostic criterion in individuals with FAS beyond childhood, whereas thinness is a less reliable feature.” More recently, in a review of growth among children prenatally exposed to drugs, Nordstrom-Klee et al. [12] report that while growth deficits caused solely by prenatal cigarette exposure are unlikely to persist beyond infancy, the effects of prenatal exposure to alcohol on growth continue well into childhood. In one study, Greene et al. [23] found PAE to negatively affect average preschool height, but not weight. This difference persisted after controlling for the use of other substances and background factors. Carter et al. [20] recently reported that, among children with heavy PAE, “children born small for gestational age (SGA) with postnatal growth restriction (height ≤ 10th percentile) were most heavily exposed. Exposure was intermediate for those born SGA with catch-up growth and lowest for those without prenatal or postnatal growth restriction. Effects on neurocognition were strongest in children with both prenatal and long-term growth restriction, more moderate in those with fetal growth restriction and postnatal catch-up, and weakest in those without growth restriction”.
The strong correlation between GD and the FAS facial features in our study provide further support that PAE is contributing to the GD observed in our clinical population. It is well understood that GD is not specific to (caused only by) PAE, but the FAS facial phenotype is. The fact that GD correlates with both the FAS Facial Rank and PAE leaves little doubt that PAE is contributing to GD in our clinical population.
GD is prevalent
Second, GD is not a rare outcome among individuals with PAE. In fact, it occurred in 33% of our clinical
population and was as prevalent as the other core diagnostic features of FASD (the FAS facial features and severe CNS dysfunction). GD also occurred across the full spectrum of FASD, not just among those with full FAS. Over the decades, clinicians, including us, have questioned whether GD should ever have been included as a diagnostic criterion, since the small group of children from whom the term FAS was coined in 1973 came from a failure-to-thrive clinic [2,6,7]. Clearly, they all had GD; but were they a representative sample of all individuals with FAS? The results of our study affirm that they were. Individuals with PAE who present with GD and the FAS facial phenotype present with the most severe CNS dysfunction. In our clinical population, 92% of patients with GD and the FAS facial phenotype also presented with severe CNS abnormalities and met the criteria for FAS. As the prevalence and severity of GD decreases, so does the prevalence and severity of the FAS facial features and CNS dysfunction. The result is a spectrum of FASD diagnoses that correlate linearly with the spectrum of GD (FAS: 100% GD; PFAS: 46% GD; SE/AE: 37% GD; ND/AE: 24% GD).
GD is highly correlated with, and predictive of, CNS dysfunction
Finally, and perhaps of greatest clinical importance, GD is highly correlated with and predictive of CNS dysfunction. Many studies have documented the correlation between GD – especially short stature – and cognitive/behavioral dysfunction [24,25]. In our clinical population with PAE, we too found highly significant linear correlations between GD (especially postnatal short stature) and CNS dysfunction – this finding is especially important when evaluating infants and toddlers with PAE. Most children with cognitive or other developmental challenges caused by PAE do not fully exhibit these challenges until they reach school-age. For example, half of the children in our clinical population diagnosed with full FAS had normal Bayley developmental scores as infants; thus, it would be a mistake to interpret their early normal development as evidence that PAE caused no harm. Although infants and toddlers are too young to engage in a comprehensive assessment of brain function, their growth and facial features are
Advances in Pediatric Research Astley et al. 2016 | 3:9 18
easily measured. This study has confirmed that GD is as powerful a predictor of severe CNS dysfunction as the FAS facial features. Infants and toddlers with PAE, normal early development, and Rank 3 or 4 GD were two to three-fold more likely to present with severe CNS dysfunction later in childhood than those without GD. Those with Rank 3 or 4 FAS facial phenotypes were two to five-fold more likely to present with severe CNS dysfunction. Those with both GD and the FAS facial features were almost assured of presenting with severe CNS dysfunction later in childhood. GD is an indispensable tool for the early identification of infants/toddlers at the highest risk for severe CNS dysfunction. Infants and toddlers with PAE who present with GD and/or the FAS facial phenotype should be referred to, and should qualify for, early intervention to mitigate this risk.
Conclusions The outcomes of this study empirically confirm and illustrate the role of GD in the diagnosis of, and early
intervention for, FASD. We will continue to include GD as a core diagnostic feature of FASD in the 4-Digit Code for the following reasons:
1. Laboratory studies confirm PAE causes GD. The 4-Digit Code Growth Rank documents GD attributable to PAE.
2. GD is not only prevalent across the full spectrum of FASD; it is as prevalent as the other core diagnostic features (e.g., the FAS facial features and CNS abnormalities).
3. GD is not only highly correlated with severe CNS dysfunction, but is highly predictive of severe CNS dysfunction. In fact, GD is so highly predictive of severe CNS dysfunction, it should be used to identify those infants/toddlers with PAE who are at high risk for severe CNS dysfunction, and qualify them for early intervention services – despite apparently normal early development.
Appendix. Summary of key findings
1. GD is as prevalent as the other core diagnostic features of FASD (the FAS facial features and CNS abnormalities).
a. 19% had GD ≤ third percentile (Growth Ranks 3 and 4)
• 19% had the FAS facial features (Face Ranks 3, 4)
• 18% had CNS structural/neurological abnormalities (CNS Rank 4)
b. 33% had GD ≤ 10th percentile (Growth Ranks 2, 3 and 4)
• 36% had severe CNS dysfunction (CNS Rank 3)
2. GD ≤ 10th percentile occurs across the full spectrum of FASD diagnoses and increases significantly in prevalence with increasing severity of diagnosis (ND/AE 24%; SE/AE 37%; PFAS 46%; FAS 100%).
3. The profile of GD changes with age, with the most prevalent form being postnatal short stature.
a. Weight is more deficient (by 5 percentile points) than length at birth.
b. Height is more deficient (by 11 percentile points) than weight later in life (infancy to adulthood).
c. The mean weight percentile increases slightly and significantly (by 3 percentage points) with age.
d. The mean height percentile decreases substantially and significantly (by 13 percentage points) with age.
e. These patterns are comparable between males and females.
4. The 4-Digit Code uses a unique method for documenting GD across a patient’s lifespan. Growth is ranked based on the section of the patient’s growth curve, prenatal (birth) or postnatal (infancy-adulthood) that has the lowest height percentile. Using this approach on the 1162 patients with growth measures at birth and diagnosis:
a. 72% of Growth Ranks were based on postnatal growth.
b. The height percentile was lowest at birth in only 28% of subjects.
Advances in Pediatric Research Astley et al. 2016 | 3:9 19
5. Although GD is caused by many risk factors including prenatal tobacco exposure, the 4-Digit Code Growth Rank uniquely captures the GD associated with PAE because:
a. Prenatal tobacco exposure impairs prenatal growth, not postnatal growth. This is reported in the literature [12] and observed in our dataset.
b. PAE impairs postnatal growth, not prenatal growth, with its greatest impact on postnatal short stature. This is reported in the literature [9] and observed in our dataset.
c. Since the 4-Digit Code ranks growth based on the age when the height percentile was lowest, this resulted in 82% of the growth ranks for 1814 subjects being derived from postnatal measures of growth. Since tobacco does not influence postnatal growth, this explains why the 4-Digit Growth Rank is significantly correlated with PAE and not with prenatal tobacco exposure in our dataset.
d. Postnatal risks (neglect, abuse, multiple home placements) did not impair postnatal height percentiles, but were associated with a slight increase in weight percentiles.
6. GD is as highly correlated with severe CNS dysfunction as the FAS facial phenotype.
a. The prevalence of severe CNS dysfunction (CNS Rank 3) increased significantly and linearly with increasing Growth Rank (Growth Rank 1 (32%); Rank 2 (39%); Rank 3 3 (49%); Rank 4 (60%)).
b. The prevalence of severe CNS dysfunction (CNS Rank 3) increased significantly and linearly with increasing Face Rank(Face Rank 1, 30%; Rank 2, 34%; Rank 3, 44%; Rank 4, 68%).
7. Growth Rank is as predictive of severe CNS dysfunction as the 4-Digit Code FAS Face Rank.
a. Individuals with Growth Ranks 3 and 4 (height and/or weight ≤ third percentile) had a two to three-fold increased risk for severe CNS dysfunction. This finding was statistically significant.
b. Individuals with Face Ranks 3 and 4 (2.5 to all 3 of the FAS facial features) had a two to five-fold increased risk for severe CNS dysfunction. This finding was statistically significant.
c. GD was especially powerful in predicting which infants/toddlers with PAE and normal early development presented with severe CNS dysfunction later in childhood.
8. GD is highly correlated, but not highly concordant, with the FAS facial phenotype and microcephaly.
a. Mean height and weight percentiles at birth, and at the age of diagnosis, decreased significantly with increasing severity of the FAS facial phenotype.
b. The prevalence and magnitude of microcephaly increased significantly with increasing magnitude of GD.
c. Despite these significant correlations, most patients with GD (83% and 71%, respectively) do not have the Rank 4 FAS facial phenotype or microcephaly. Thus, it is necessary to document GD to identify most individuals with PAE at risk for severe CNS dysfunction.
References
1. Jones K, Smith D. Recognition of the fetal alcohol syndrome in early infancy. Lancet. 1973;2:999–1001.
2. Jones KL, Smith DW, Ulleland CN, Streissguth AP. Pattern of malformation in offspring of chronic alcohol mothers. Lancet. 1973;1(7815):1267–71.
3. Astley SJ. Diagnostic guide for fetal alcohol spectrum disorders: the 4-Digit Diagnostic Code. 3rd ed. Seattle, WA, USA: University of Washington Publication Services; 2004. Available from: https://depts.washington.edu/fasdpn/pdfs/guide2004.pdf.
4. Astley SJ. Validation of the fetal alcohol spectrum disorder (FASD) 4-Digit Diagnostic Code. J Popul Ther Clin Pharmacol. 2013;20(3):e416–67.
5. Astley SJ. Diagnosing fetal alcohol spectrum disorders (FASD). In: Adubato SA, Cohen DE, editors. Prenatal alcohol use and fetal alcohol spectrum disorders: diagnosis, assessment and new directions in research and multimodal treatment. Sharjah, UAE: Bentham Science Publishers Ltd; 2011. pp. 3–29.
6. Ulleland CN. The offspring of alcoholic mothers. Ann N Y Acad Sci. 1972;197:167–9. http://depts.washington.edu/fasdpn/pdfs/ulleland.pdf
7. Ulleland CN, Wennberg RP, Igo RP, Smith NJ. The offspring of alcoholic mothers. Abstract. American Pediatric Society and Society for Pediatric Research, p. 93, 1970. http://depts.washington.edu/fasdpn/pdfs/ullelandabs.pdf
Advances in Pediatric Research Astley et al. 2016 | 3:9 20
8. Abel EL, Dintcheff BA. Effects of prenatal alcohol exposure on growth and development in rats. J Pharmacol Exp Ther. 1978;207(3):916–21.
9. Behnke M, Smith VC. Prenatal substance abuse: short- and long-term effects on the exposed fetus. Pediatrics. 2013;131(3):e1009–24.
10. Gavin CE, Kates B, Gerken LA, Rodier PM. Patterns of growth deficiency in rats exposed in utero to undernutrition, ethanol, or the neuroteratogen methylazoxymethanol (MAM). Teratology. 1994;49(2):113–21.
11. Middaugh LD, Boggan WO. Postnatal growth deficits in prenatal ethanol-exposed mice: characteristics and critical periods. Alcohol Clin Exp Res. 1991;15(6):919–26.
12. Nordstrom-Klee B, Delaney-Black V, Covington C, Ager J, Sokol R. Growth from birth onwards of children prenatally exposed to drugs. A literature review. Neurotoxicol Teratol. 2002;24:481–8.
13. Cook JL, Green CR, Lilley CM, Anderson SM, Baldwin ME, Chudley AE, et al. Fetal alcohol spectrum disorder: a guideline for diagnosis across the lifespan. CMAJ. 2016;188(3):191–7
14. Bower C, Elliott EJ, on behalf of the Steering Group. Report to the Australian Government Department of Health: Australian guide to the diagnosis of FASD. 2016. pp. 79. Available from: http://www.apsu.org.au/assets/Uploads/20160505-rep-australian-guide-to-diagnosis-of-fasd.pdf.
15. Hall JG, Froster-Iskenius UG, Allanson JE. Handbook of normal physical measurements. New York, USA: Oxford University Press; 1989.
16. WHO.int [Internet]. The WHO Child Growth Standards [accessed 2016 Aug 6]. Available from: http://www.who.int/childgrowth/en.
17. CDC.gov [Internet]. CDC Growth Charts [accessed 2016 Aug 6]. Available from: (boys) https://www.cdc.gov/growthcharts/data/set2clinical/cj41c071.pdf (girls) https://www.cdc.gov/growthcharts/data/set2clinical/cj41c072.pdf
18. Nellhaus G. Composite international and interracial graphs, head circumference, girls and boys, birth to 18 years. Pediatrics. 1968;41:106.
19. Astley SJ. Profile of the first 1,400 patients receiving diagnostic evaluations for fetal alcohol spectrum disorder at the Washington State Fetal Alcohol Syndrome Diagnostic & Prevention Network. Can J Clin Pharmacol. 2010;17(1):e132–64.
20. Carter RC, Jacobson JL, Molteno CD, Dodge NC, Meintjes EM, Jacobson SW. Fetal alcohol growth restriction and cognitive impairment. Pediatrics. 2016;138(2):e20160775.
21. Davies JK, Bledsoe JM. Prenatal alcohol and drug exposures in adoption. Pediatr Clin N Am. 2005;52:1369–93.
22. Habbick BF, Blakley PM, Houston CS, Snyder RE, Senthilselvan A, Nanson JL. Bone age and growth in fetal alcohol syndrome. Alcohol Clin Exp Res. 1998;22(6):1312–6.
23. Greene T, Ernhart CB, Sokol RJ, Martier S, Marler MR, Boyd TA, et al. Prenatal alcohol exposure and preschool physical growth: a longitudinal analysis. Alcohol Clin Exp Res. 1991;15(6):905–13.
24. Stabler B, Clopper RR, Siegel PT, Stoppani C, Compton PG, Underwood LE. Academic achievement and psychological adjustment in short children. The national cooperative growth study. J Dev Behav Pediatr. 1994;15(4):1–6.
25. Stathis SL, O’Callaghan MJ, Williams GM, Najman JM, Andersen MJ, Bor W. Behavioural and cognitive associations of short stature at 5 years. J Paediatr Child Health. 1999;35:562–7.