Embed Size (px)
Citation preview

1
The estimation of body height from ulna length in healthy adults from different
ethnic groups
Running headline: Estimating height from ulna length
Six key words: Nutritional assessment, height, ulna length, prediction, ethnic group
Authors: Angela M Madden1 PhD RD, Tatiana Tsikoura2 MSc RD, David J Stott3 DPhil
MSc
Work undertaken in the Department of Health and Human Sciences, London
Metropolitan University, London N7 8DB
Present addresses:
1School of Health and Emergency Professions, University of Hertfordshire, Hatfield AL10
9AB
2Dietetic and Nutrition Department, St. George‟s Hospital, Hornchurch, Romford, RM12
6RS
3Research Design Service (Hertfordshire), University of Hertfordshire, Hatfield AL10
9AB
Corresponding author: Dr Angela Madden, School of Health and Emergency
Professions, University of Hertfordshire, Hatfield AL10 9AB; telephone 01707 281385;
fax 01707 284977; email [email protected]
2
The estimation of body height from ulna length in healthy adults from different
ethnic groups
Abstract
Background: Assessments of nutritional status frequently incorporate a measure of
height in order to evaluate a person‟s relative thinness or fatness. As height is often
difficult to quantify, it may be predicted from alternative anthropometric measurements,
including ulna length. Little information is available about the accuracy of these
predictions in an ethnically diverse population. The aim of this study was to evaluate
published equations for predicting height from ulna length in adults from different ethnic
groups.
Method: Ulna length and standing height were measured in a gender stratified sample
of 60 Asian, 69 Black and 65 White healthy volunteers aged 21-65 years. Height was
predicted from ulna length using the MUST equations and compared against the
measured values. Linear regression analysis was used to develop equations to estimate
height from ulna length and to explore the relationship between height and ulna length in
subgroups.
Results: The mean (SD) age for Asian, Black and White men and women were 31.7
(11.0), 32.0 (10.3), 38.6 (12.5) and 26.2 (5.4), 32.6 (8.9), 35.7 (11.7) years and their
mean (SD) height was 170.9 (5.2), 178.1 (7.3), 176.3 (7.7) and 157.7 (4.7), 164.0 (5.9),
163.7 (6.2) cm respectively. Ulna length and measured height were significantly
correlated among all subgroups except Asian women (r = 0.11, P=0.57). The mean
(SD) difference between predicted and measured height showed significant
overestimates for Asian and Black men (4.0 (4.8) and 6.7 (5.3) cm) and Asian and Black
women (6.4 (4.9) and 4.4 (4.9) cm) but not for White men and women.

3
Conclusions: The MUST equations for predicting height from ulna length in healthy
adults should be used with some caution among ethnically diverse populations,
particularly in Asian women.

4
Introduction
Nutritional screening plays an important role in the identification and prevention of
malnutrition in patients in hospitals and the community (Elia, 2003). A large number of
screening tools have been proposed to facilitate this and most of them utilise a
combination of variables including clinical, dietary, biochemical and anthropometric
measurements (Green & Watson, 2005). Anthropometry, the evaluation of body
dimensions, is useful because it is an objective measure which allows an approximate
evaluation of body stores to be made, for example via body mass index (BMI = weight
/height2). Although BMI is commonly used in nutritional screening, including the
Malnutrition Universal Screening Tool (MUST) (Elia, 2003), it requires a measure of
height which might be difficult to obtain and / or of questionable accuracy (Kirk et al.
2003; Cook et al. 2005). As a result, alternative measurements for estimating height are
required. Published studies have explored the prediction of height from a range of
methods (Hickson & Frost, 2003) including knee height (Han & Lean, 1996; Ritz, 2004),
arm span (Brown et al. 2000; Mohanty et al. 2001; de Lucia et al. 2002; Zverev, 2003),
demi-span (Bassey, 1986) and ulna length (Cheng et al. 1998; Elia, 2003; Gauld et al.
2004; Agnihotri et al. 2009). The latter has been examined in children (Cheng et al.
1998; Gauld et al. 2004), young adults aged 18-28 years (Agnihotri et al. 2009) and in
adults <65 and 65 years (Elia, 2003) where the resulting MUST prediction equations
have been recommended for predicting height in the absence of actual measurements.
It is well known that anthropometric measurements, including height, can be affected by
a variety of factors including racial and ethnic differences (Steele & Chenier, 1990;
World Health Organisation, 1995; Launer & Harris, 1996; Reeves et al. 1996; Chumlea
et al. 1998; Cheng et al. 1998; Mohanty et al. 2001). These differences relate not only
to absolute anthropometric measurements, but also to the relationship between
5
variables, for example, arm span is approximately equal to height in White adults but
greater than height in Black Africans and Asians (Steele & Chenier, 1990; Reeves et al.
1996). The equations describing the relationship between ulna length and height have
been published but details about how they were derived have not been reported so the
ethnicity of the reference population is unknown. An exploration of the applicability of
the equations in adults from different ethnic groups is required if prediction equations are
to be useful in screening patients from diverse backgrounds. The aim of this study,
therefore, was to evaluate the MUST equations for predicting height from ulna length in
adults from different ethnic groups.

6
Methods
Subjects
The subjects were recruited opportunistically from staff and students at London
Metropolitan University by inviting those waiting in or passing through the main reception
area to participate. Initial inclusion criteria were ability to speak and communicate in
English and ability to stand for height and ulna measurement. Subjects with obvious
physical disabilities which might influence their height and / or bone length, for example
those in a wheel-chair, stooping or walking with a limp, were excluded. The study
details were explained and data were subsequently collected from those giving verbal
consent. Subjects were asked to provide their date of birth, gender and ethnic
background and this was recorded on an anonymous form before their height and ulna
length were measured. After all data collection was completed, the records from
subjects between the ages of 21 and 65 years were categorised into one of the following
groups based on the 2001 UK Census (Office of National Statistics, 2006) and included
in the subsequent analysis:
Asian (Bangladeshi, Indian, Pakistani)
Black (Black African, Black Caribbean)
White (English, Irish, Scottish, Welsh)
Measurements
Before collecting data from the study subjects, height and ulna length were measured
five times in 12 separate subjects to investigate the reproducibility of the method. On
the basis of the results, data were subsequently collected by measuring height once and
ulna length three times using a standardised protocol. All measurements were made
between 10.30 and 16.30 by a single observer (TT) using the same equipment.
7
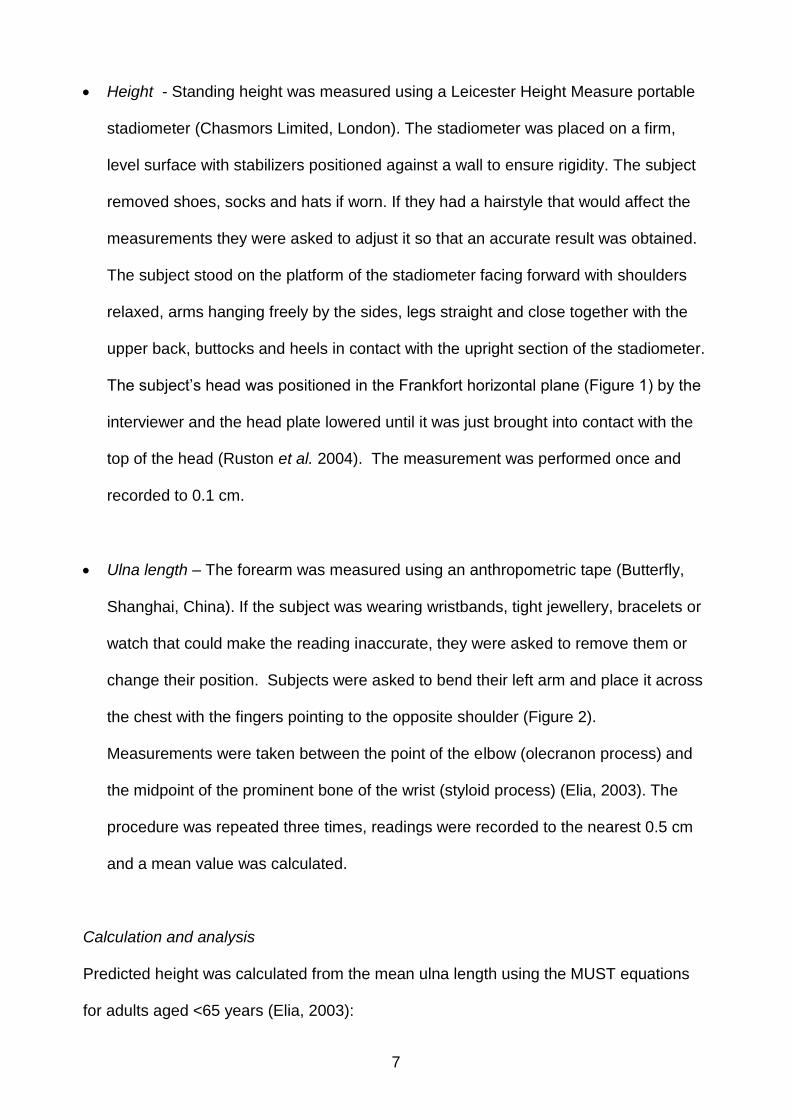
Height - Standing height was measured using a Leicester Height Measure portable
stadiometer (Chasmors Limited, London). The stadiometer was placed on a firm,
level surface with stabilizers positioned against a wall to ensure rigidity. The subject
removed shoes, socks and hats if worn. If they had a hairstyle that would affect the
measurements they were asked to adjust it so that an accurate result was obtained.
The subject stood on the platform of the stadiometer facing forward with shoulders
relaxed, arms hanging freely by the sides, legs straight and close together with the
upper back, buttocks and heels in contact with the upright section of the stadiometer.
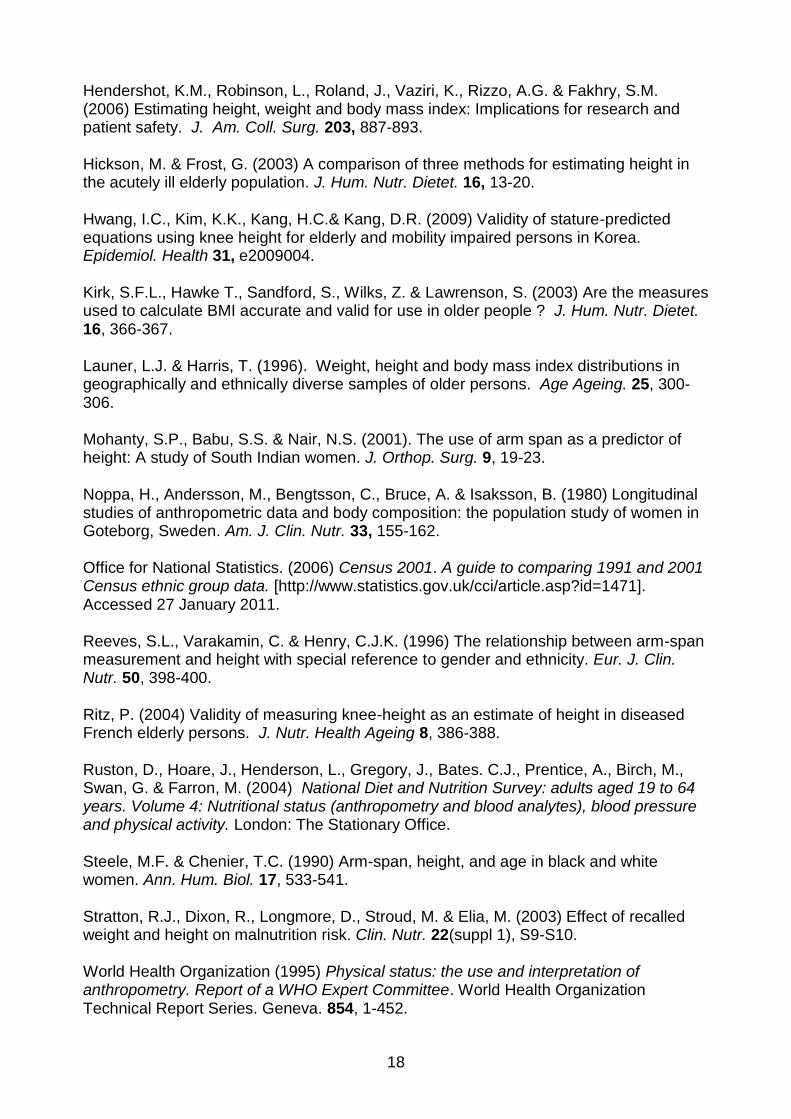
The subject‟s head was positioned in the Frankfort horizontal plane (Figure 1) by the
interviewer and the head plate lowered until it was just brought into contact with the
top of the head (Ruston et al. 2004). The measurement was performed once and
recorded to 0.1 cm.
Ulna length – The forearm was measured using an anthropometric tape (Butterfly,
Shanghai, China). If the subject was wearing wristbands, tight jewellery, bracelets or
watch that could make the reading inaccurate, they were asked to remove them or
change their position. Subjects were asked to bend their left arm and place it across
the chest with the fingers pointing to the opposite shoulder (Figure 2).
Measurements were taken between the point of the elbow (olecranon process) and
the midpoint of the prominent bone of the wrist (styloid process) (Elia, 2003). The
procedure was repeated three times, readings were recorded to the nearest 0.5 cm
and a mean value was calculated.
Calculation and analysis
Predicted height was calculated from the mean ulna length using the MUST equations
for adults aged <65 years (Elia, 2003):
8
Men: Predicted height [cm] = 79.2 + (3.60 x ulna length [cm])
Women: Predicted height [cm] = 95.6 + (2.77 x ulna length [cm])
The difference in age and measurements between subgroups was examined using one-
way analysis of variance (ANOVA). Pearson‟s correlation coefficient and simple linear
regression was used to examine the relationship between ulna length and measured
height in each subgroup. The difference between measured and predicted height was
examined within each subgroup using paired t-tests.
The study protocol was approved by the Research Ethics Committee of London
Metropolitan University, 23 August 2007.

9
Results
The measurement of both height and ulna length was reproducible in men and women
with mean coefficient of variations of 0.12 and 0.47 respectively.
Two hundred and eighty subjects agreed to participate and were measured. Data from
86 of them were subsequently excluded from the analysis either because they were
aged under 21 years and, therefore, may not have reached adult height (Noppa et al.
1980) or because they described their ethnicity as mixed or other than Asian, Black or
White. Analyses were subsequently undertaken on the remaining 194 subjects.
Summary statistics for age, measured height and ulna length for the six subgroups are
presented in Table 1. There is strong evidence of difference between the means of the
ethnic groups for ulna length and height among both men and women (Oneway ANOVA
p <0.001 for all four comparisons). Differences in mean age were highly significant
among women (Oneway ANOVA p<0.001) and also significantly different among men
(Oneway ANOVA p 0.029). The significance (≤0.05) of any paired differences (post hoc
Bonferroni correction) are given in Table 1. Asian and Black groups differ in height and
ulna length among both men and women; the same is generally true of Asian and White
groups with the exception of ulna length among women. Black and White groups differ
among men and women with respect to ulna length. Overall, the Asian subgroups
contained the youngest, least tall and shortest ulna lengths of the three ethnic groups on
the basis of mean values.
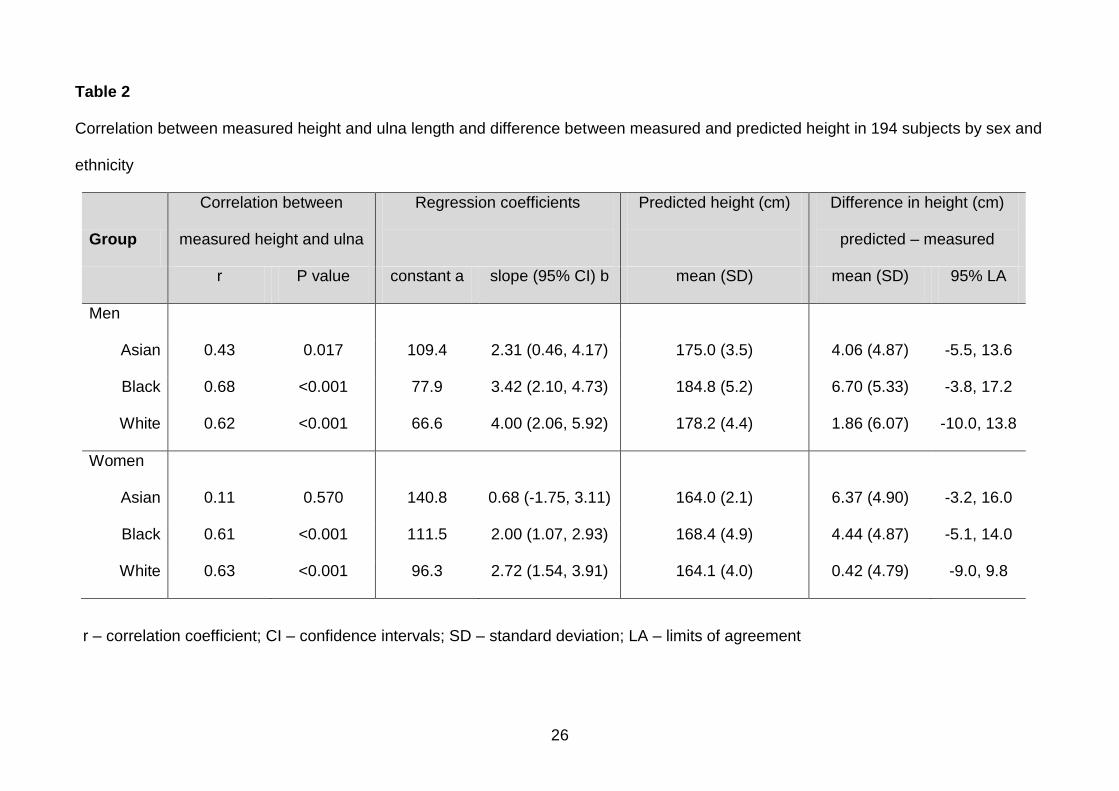
In Table 2, the relationship between measured height and ulna length and the difference
between mean measured height and predicted height calculated using the MUST
10
equations has been summarised. There was a moderately strong and significant
correlation (r>0.6) between ulna length and measured height among Black and White
subgroups for men and women. The relationship was somewhat weaker among Asian
men (r=0.43) and among Asian women was very week (r=0.11) and was not significant.
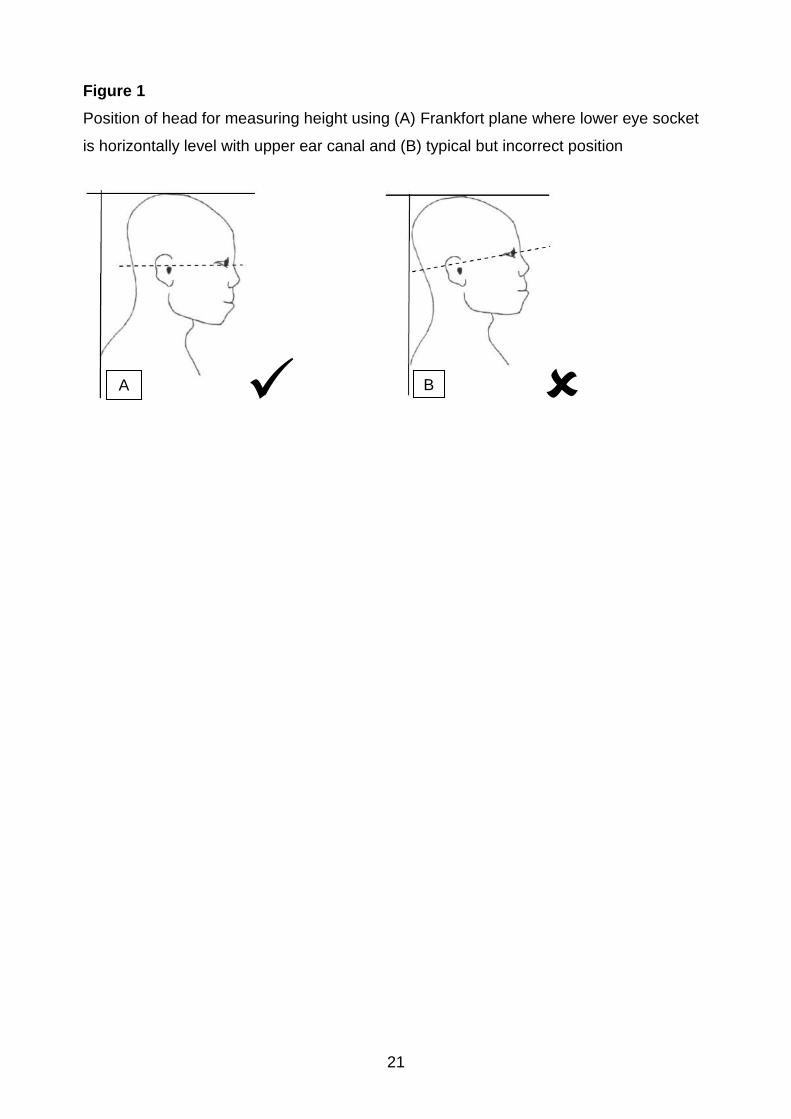
In Figure 3, the distribution of ulna length against height has been plotted separately for
each subgroup by gender and ethnicity. The dotted regression line represents the
“predicted” relationship according to the relevant MUST equation. The least-squares
best-fit regression for each subgroup is shown by the solid line. Any extension of these
regression lines beyond the limits of the data distribution must be viewed with caution.
There are several features to note. The majority of the values for Asian and Black
subgroups fall below the predicted regression. The overall trend for data from the White
subgroups is more concordant with the MUST prediction. Among the Black men, there
is evidence of a linear distribution of measured height that follows the same slope as
data from the MUST equation though typically 5 cm lower across the range of ulna
lengths. The data from the Asian subgroups, especially among the women, exhibit a
more clustered pattern. These visual patterns are supported by the regression
coefficients and the difference between the measured and predicted height in the six
subgroups (Table 2).
The predicted mean height for Asian and Black subgroups typically exceeded the
measured values by approximately 4 to 6 cm. The mean differences between measured
and predicted values for White men and women were much smaller. The slope
coefficients for the subgroups were relatively consistent with those used in the MUST
equations (3.60 for men and 2.77 for women) with the exception of Asian women where
any upward trend in increasing height with ulna length is modest and not significant.
11
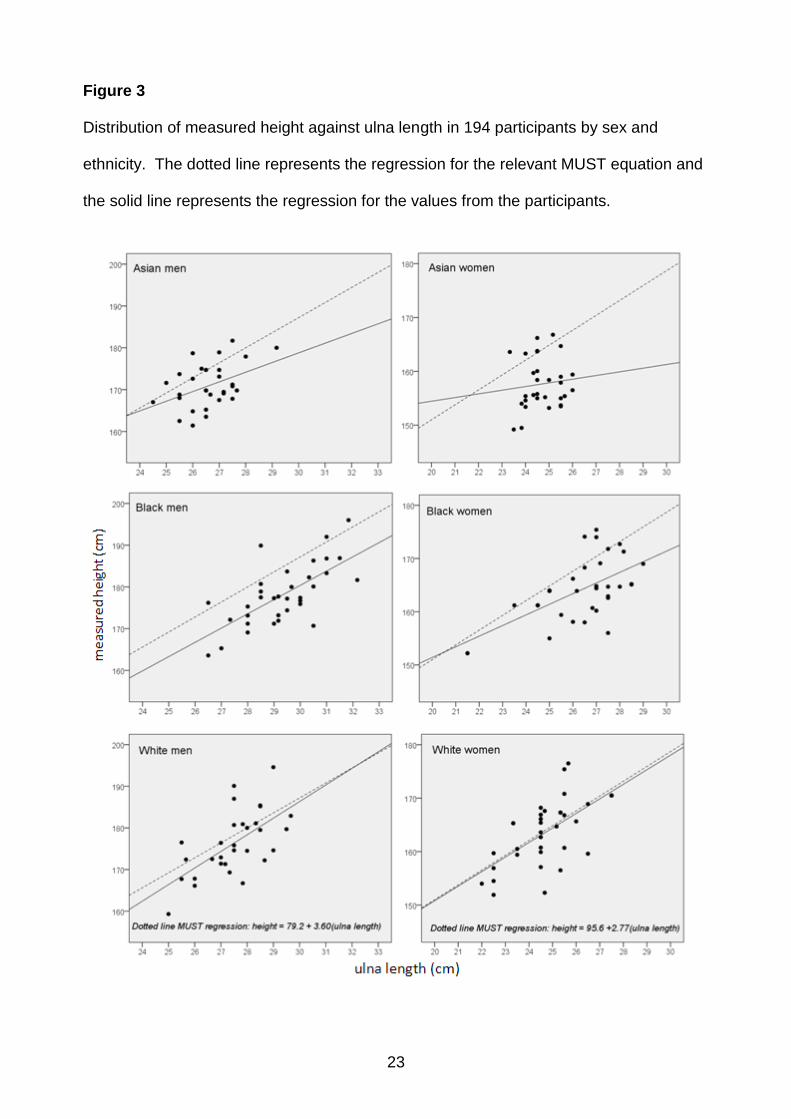
In order to explore further limitations of using ulna length to predict height, the pattern of
the difference between predicted height and measured height has been further explored.
Since the data comprises of two independent variables and not two indirect
measurements of the same variable, conventional “limits of agreement” analysis are not
directly applicable. However, the difference for each participant (predicted height minus
measured height) can be interpreted as “residuals” using the MUST equation as the
baseline for the calculation of these residuals. When plotted against ulna length it is
evident that the magnitude of these differences is not unduly affected by variations in
ulna length (Figure 4). The mean difference and the 95% “limits of agreement” (SD of
difference x 1.96) have been added to indicate that these differences are of considerable
magnitude and do not appear to be proportional to ulna length in the subgroups. The
limits of agreement are stated in Table 2.
12
Discussion
This study aimed to evaluate the MUST equations for predicting height from ulna length
in healthy adults from different ethnic groups and the results show differences in
accuracy, particularly in non-White participants. This raises some concerns about the
use of these equations in some groups of the population and, therefore, whether there is
a need to develop separate, ethnic-specific equations that would provide more accurate
predicted values. In order to address this, there is a need to consider alternative
methods of predicting height and the clinical implications of using an inaccurate
predicted height value in nutritional screening.
If a value for height cannot be obtained by measurement or calculation using a
prediction equation, a self-reported or estimated height might be used. Systematic
review of studies examining the accuracy of self-reported height has identified an overall
tendency to overestimate true height, probably reflecting societal norms to value tallness
(Gorber et al. 2007). The studies included examined diverse populations using different
methodologies and the degree of disparity between reported and measured values
varied considerably. In nutritional screening, if a patient is unable or too ill to self-report
their height, this may be estimated by a healthcare professional. However, in a study of
110 patients attending an emergency department, Hendershot et al. (2006) reported that
only 41% of healthcare professionals were able to estimate patients‟ height to within
2.54 cm of measured values compared to 53% of patients themselves. This compares
favourably with the results from the present study, where height predicted using the
MUST equations was within 2.54 cm of individual measured values in only 30%, 15%
and 30% of Asian, Black and White men and 17%, 37% and 49% of Asian, Black and
White women respectively. Stratton et al. (2003) found that using self-reported height
and weight in MUST screening of patients with a mean age of 56 ± 15 years and BMI of
13
27.9 ± 5.7 kg.m-2 was unlikely to alter the malnutrition risk category although similar
investigations are needed in older patients and those with lower BMI values.
A number of alternative methods for predicting height have been proposed. Regression
equations derived from knee height have been most commonly explored in different
ethnic groups including non-Hispanic White, non-Hispanic Black and Mexican-American
adults aged 60 years and over (Chumlea et al. 1998), Korean adults (Hwang et al. 2009)
and Caucasian adults aged 30-55 years (Cereda et al 2010) all of which have been
cross validated. Chumlea et al. (1998) did not present data for the differences between
height measured and predicted using their equations in a total validation population of
approximately 2375 adults but stated that the root mean square error values varied
between 3.45 for Mexican-American women and 4.18 for non-Hispanic white women.
Hwang et al. (2009) reported mean differences between measured and predicted height
of less than 1 cm in all validation subgroups (total number 1022) with intraclass
correlations between 0.88 (0.83-0.91) for post-menopausal women and 0.92 (0.92-0.94)
for men. The differences between height measured and predicted by Cereda et al.
(2010) was also very small (<1 cm) in a validation population sample of 120 with root
mean square error value of 3.2 and 95% confidence intervals of -6.1 and 6.5 cm
(combined data for men and women). This range is greater, i.e. less precise, than in
any of the groups in the present study although the difference is smaller, i.e. more
accurate, than observed in Asian or Black men or women (see Table 2).
The clinical implications of the results from the present study can be explored by
extrapolating „worse case scenarios‟ in hypothetical screening. We found that ulna
length ranged from 23.3 to 26.0 cm. among Asian women and that it was weakly
associated with measured height. If we apply this range of ulna lengths to an Asian
14
woman weighing 50 kg and with a measured height of 157.7 cm (i.e. study mean value
from Table 1) her calculated BMI would range between 17.8 and 19.5 instead of the true
value of 20.1 kg.m-2, i.e. she would be identified as under nourished when she may not
be. However, if an Asian woman with the same measured height and weighing 75 kg
was screened using a value for height predicted from the study data, her calculated BMI
would range between 26.7 and 29.3 instead of the true value of 30.2 kg.m-2, i.e. she
would not be categorised as obese when she actually is. These two opposite
hypothetical situations use standard World Health Organization BMI cut off points, which
may not be appropriate in an Asian population (World Health Organization, 2004), but
illustrate the potential consequences that may arise when inappropriate height prediction
equations are used and in this case, how Asian women may be over-diagnosed as
under nourished while some who are overweight or obese may not be identified.
No prediction formula derived from regression equations will be able to provide
estimates that are 100% accurate and the practicality of the method for collecting data
must be weighed against potential inaccuracies. The prediction of height from ulna
length offers some advantages over the use of knee height measurement, particularly in
bed-bound patients where correct positioning of the leg may be difficult (Cook et al.
2005), and it may be more acceptable for the person being measured to bare their fore
arm rather than lower leg and foot . An ulna length can be measured using a standard
anthropometric tape which is cheaper and more available than an anthropometric
calliper that has been used for knee height in some studies (Chumlea et al. 1998,
Cereda et al. 2010).
The participants studied in the present investigation, which has a small sample size
compared to other anthropometric validation studies, were recruited from a population
15
which can be considered as predominantly healthy because they were attending a
university to study or work. Clearly, these are neither a representative sample of the
whole population or of the people who are most likely to be undergo nutritional screening
and this is a significant limitation. As a result, the numerical data from the present study
should not be extrapolated and used to „correct‟ predicted values of height obtained from
the MUST equations in a hospitalised population. However, it is reasonable to conclude
that the absence of a significant relationship between ulna length and height observed in
the Asian women who participated might be found in other groups of Asian women. As
such, further studies are required to develop more accurate equations using ulna length
in a non-White population and to explore alternatives to ulna length in Asian women.
In conclusion, the findings from this study indicate that the MUST equations for
predicting height from ulna length in adults provide useful estimates of height in White
healthy volunteers but overestimate height in Asian and Black healthy volunteers. The
absence of a significant relationship between measured height and ulna length raise
particular concern about the use of prediction equations in Asian women.

16
Acknowledgements
The authors are grateful to the healthy volunteers who participated in the study.
17
References
Agnohotri, A.K., Kachhwaha, S., Jowaheer, V. & Singh, A.P. (2009) Estimating stature from percutaneous length of tibia and ulna in Indo-Mauritian population. Forensic Sci. Int. 187, 109.e1-109.e3. Bassey, E.J. (1986) Demi-span as a measure of skeletal size. Ann. Hum. Biol. 13, 499-502. Brown, J.K., Whittemore, K.T. & Knapp, T.R. (2000) Is arm span an accurate measure of height in young and middle-age adults ? Clin. Nurs. Res. 9, 84-94. Cereda, E., Bertoli, S., Battezzati, A. (2010) Height prediction formula for middle-aged (30-55 y) Caucasians. Nutrition 26, 1075-1081. Cheng, J.C., Leung, S.S., Chiu, BS., Tse, P.W., Lee, CW., Chan, A.K., Xia, G., Leung, A.K. & Xu, Y.Y. (1998) Can we predict body height form segmental bone length measurements? A study of 3,647 children. J. Pediatr. Orthop. 18, 387-393. Chumlea, W.C., Guo, S.S., Wholihan, K., Cockram, D., Kuczmarski, R.J. & Johnson, C.L. (1998) Stature prediction equations for elderly non-Hispanic white, non-Hispanic black, and Mexican-American persons developed from NHANES III data. J. Am. Diet. Assoc. 98, 137-142. Cook, Z., Kirk, S., Lawrenson, S. & Sandford, S. (2005) Use of BMI in the assessment of malnutrition in older subjects: reflecting on practice. Proc. Nutr. Soc. 64, 313-317. de Lucia E., Lemma, F., Tesfaye, F., Demisse, T. & Ismail., S (2002) The use of armspan measurement to assess the nutritional status of adults in four Ethiopian ethnic groups. Eur. J. Clin. Nutr. 56, 91-95. Elia, M. (2003) The ‘MUST’ Report. Nutritional Screening of Adults: A Multidisciplinary Responsibility. Development and Use of the ‘Malnutrition Universal Screening Tool’ (‘MUST’) for adults. Malnutrition Advisory Group (MAG), a Standing Committee of the British Association of Parenteral and Enteral Nutrition (BAPEN). Redditch: BAPEN. Gauld, L.M., Kappers, J., Carlin, J.B. & Robertson, C.F. (2004) Height prediction from ulna length. Dev. Med. Child Neurol. 46, 475-480. Gorber, S.C., Tremblay, M., Moher, D.& Gorber, B. (2007) A comparison of direct vs self-report measures for assessing height, weight and body mass index: a systematic review. Obes. Rev. 8, 307-326. Green, S.M. & Watson, R. (2005) Nutritional screening / assessment tools for use by nurses: a comprehensive literature review. J. Adv. Nurs. 50, 69-83. Han, T.S. & Lean, M.E. (1996) Lower leg length as an index of stature in adults. Int. J. Obes. Relat. Metab. Disord. 20, 21-27.
18
Hendershot, K.M., Robinson, L., Roland, J., Vaziri, K., Rizzo, A.G. & Fakhry, S.M. (2006) Estimating height, weight and body mass index: Implications for research and patient safety. J. Am. Coll. Surg. 203, 887-893. Hickson, M. & Frost, G. (2003) A comparison of three methods for estimating height in the acutely ill elderly population. J. Hum. Nutr. Dietet. 16, 13-20. Hwang, I.C., Kim, K.K., Kang, H.C.& Kang, D.R. (2009) Validity of stature-predicted equations using knee height for elderly and mobility impaired persons in Korea. Epidemiol. Health 31, e2009004. Kirk, S.F.L., Hawke T., Sandford, S., Wilks, Z. & Lawrenson, S. (2003) Are the measures used to calculate BMI accurate and valid for use in older people ? J. Hum. Nutr. Dietet. 16, 366-367. Launer, L.J. & Harris, T. (1996). Weight, height and body mass index distributions in geographically and ethnically diverse samples of older persons. Age Ageing. 25, 300-306. Mohanty, S.P., Babu, S.S. & Nair, N.S. (2001). The use of arm span as a predictor of height: A study of South Indian women. J. Orthop. Surg. 9, 19-23. Noppa, H., Andersson, M., Bengtsson, C., Bruce, A. & Isaksson, B. (1980) Longitudinal studies of anthropometric data and body composition: the population study of women in Goteborg, Sweden. Am. J. Clin. Nutr. 33, 155-162. Office for National Statistics. (2006) Census 2001. A guide to comparing 1991 and 2001 Census ethnic group data. [http://www.statistics.gov.uk/cci/article.asp?id=1471]. Accessed 27 January 2011. Reeves, S.L., Varakamin, C. & Henry, C.J.K. (1996) The relationship between arm-span measurement and height with special reference to gender and ethnicity. Eur. J. Clin. Nutr. 50, 398-400. Ritz, P. (2004) Validity of measuring knee-height as an estimate of height in diseased French elderly persons. J. Nutr. Health Ageing 8, 386-388. Ruston, D., Hoare, J., Henderson, L., Gregory, J., Bates. C.J., Prentice, A., Birch, M., Swan, G. & Farron, M. (2004) National Diet and Nutrition Survey: adults aged 19 to 64 years. Volume 4: Nutritional status (anthropometry and blood analytes), blood pressure and physical activity. London: The Stationary Office. Steele, M.F. & Chenier, T.C. (1990) Arm-span, height, and age in black and white women. Ann. Hum. Biol. 17, 533-541. Stratton, R.J., Dixon, R., Longmore, D., Stroud, M. & Elia, M. (2003) Effect of recalled weight and height on malnutrition risk. Clin. Nutr. 22(suppl 1), S9-S10. World Health Organization (1995) Physical status: the use and interpretation of anthropometry. Report of a WHO Expert Committee. World Health Organization Technical Report Series. Geneva. 854, 1-452.

19
World Health Organization (2004) Appropriate body-mass index for Asian populations and its implications for policy and intervention strategies. Lancet 363, 157-163. Zverev, Y.P. (2003) Relationship between arm span and stature in Malawian adults. Ann. Hum. Biol. 30, 739-743.

20
Conflict of interest, source of funding and authorship
The authors declare that there are no conflicts of interest.
No external funding was received to undertake this study.
AMM conceived the original idea, contributed to study design and drafted the
manuscript.
TT contributed to study design, undertook all the data collection and contributed to the
analysis and manuscript.
DJS undertook the data analysis and contributed to the manuscript.
21
Figure 1
Position of head for measuring height using (A) Frankfort plane where lower eye socket
is horizontally level with upper ear canal and (B) typical but incorrect position
A B

22
Figure 2
The position of the forearm for measuring ulna length
23
Figure 3
Distribution of measured height against ulna length in 194 participants by sex and
ethnicity. The dotted line represents the regression for the relevant MUST equation and
the solid line represents the regression for the values from the participants.
24
Figure 4
The difference between predicted and measured height plotted against ulna length in
194 participants by sex and ethnicity. The dotted lines represent the mean difference
and 95% “limits of agreement” (i.e. ± 1.96 standard deviations).

25
Table 1
Age and measured height and ulna length in 194 subjects by sex and ethnicity
Group n
Age (years) Measured height (cm) Ulna length (cm)
mean (SD) range mean (SD) mean (SD)
Men
Asian 30 31.7 (11.0) 21-55 170.9 (5.2) 26.6 (1.0)
Black 34 32.0 (10.3) 21-58 178.1 (7.3) 29.3 (1.5)
White 30 38.6 (12.5) 21-62 176.3 (7.7) 27.5 (1.2)
Significance
AB<0.001; AW=0.009 AB<0.001; AW=0.021; BW<0.001
Women
Asian 30 26.2 (5.4) 21-45 157.7 (4.7) 24.7 (0.7)
Black 35 32.6 (8.9) 21-57 164.0 (5.9) 26.3 (1.8)
White 35 35.7 (11.7) 21-61 163.7 (6.2) 24.7 (1.4)
Significance
AB=0.018; AW<0.001 AB<0.001; AW<0.001 AB<0.001; BW<0.001
Significance: ANOVA (Bonferroni post hoc test), AB – Asian-Black; AW – Asian-White; BW Black-White.
26
Table 2
Correlation between measured height and ulna length and difference between measured and predicted height in 194 subjects by sex and
ethnicity
Group
Correlation between
measured height and ulna
Regression coefficients
Predicted height (cm)
Difference in height (cm)
predicted – measured
r P value constant a slope (95% CI) b mean (SD) mean (SD) 95% LA
Men
Asian 0.43 0.017 109.4 2.31 (0.46, 4.17) 175.0 (3.5) 4.06 (4.87) -5.5, 13.6
Black 0.68 <0.001 77.9 3.42 (2.10, 4.73) 184.8 (5.2) 6.70 (5.33) -3.8, 17.2
White 0.62 <0.001 66.6 4.00 (2.06, 5.92) 178.2 (4.4) 1.86 (6.07) -10.0, 13.8
Women
Asian 0.11 0.570 140.8 0.68 (-1.75, 3.11) 164.0 (2.1) 6.37 (4.90) -3.2, 16.0
Black 0.61 <0.001 111.5 2.00 (1.07, 2.93) 168.4 (4.9) 4.44 (4.87) -5.1, 14.0
White 0.63 <0.001 96.3 2.72 (1.54, 3.91) 164.1 (4.0) 0.42 (4.79) -9.0, 9.8
r – correlation coefficient; CI – confidence intervals; SD – standard deviation; LA – limits of agreement