Embed Size (px)
Citation preview
69
The Euro Monitor 2010Indicators for Balanced Growth

2
Allia
nz E
cono
mic
Rese
arch
& C
orpo
rate
Dev
elop
men
t
3
Dr. Michael Heise Stephanie Lindeck Ann-Katrin Petersen Dr. Rolf Schneider Katrin Voegeli
The Euro Monitor 2010Indicators for Balanced Growth

4
Allia
nz E
cono
mic
Rese
arch
& C
orpo
rate
Dev
elop
men
t

5
Introduction ........................................................................06
How can balanced growth be measured? ..................12
Overall ranking and results .............................................16
Box: Productivity and employment ..............................38
Conclusion and outlook ...................................................46
Appendix .............................................................................50
Content
6
Allia
nz E
cono
mic
Rese
arch
& C
orpo
rate
Dev
elop
men
t
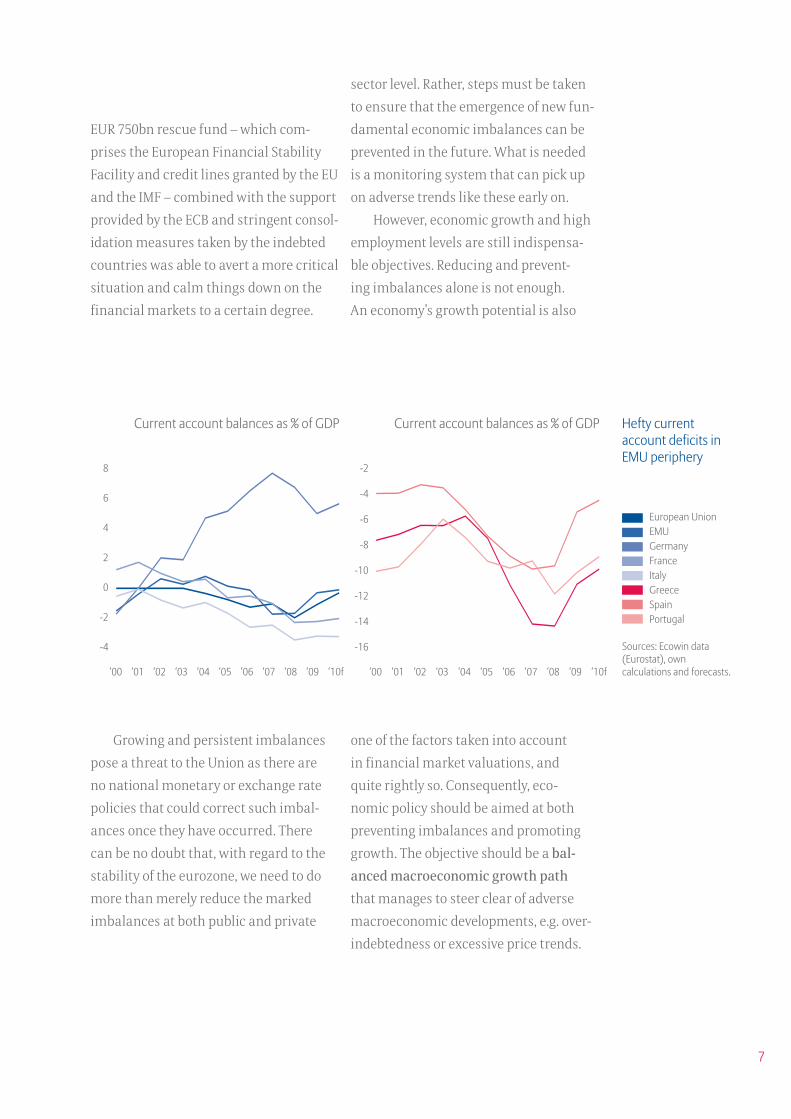
Eleven years after its inception, European
Monetary Union is undergoing a severe
test. To be sure, the eurozone has brought
much prosperity in its wake. Not only
did many countries see their nominal
borrowing costs cut roughly in half as a
result of EMU membership. A record 16
million jobs were created in EMU’s first
decade, outpacing job growth in other
mature economies, including the United
States.1 But the debt crisis in a number of
EMU countries has brutally exposed the
vulnerability of the single currency area.
Although some EMU economies have
seen strong growth since the launch of
the euro, this has masked the sometimes
considerable macroeconomic imbal-
ances that have arisen. In some member
states on the geographical periphery of
the euro area, for example, a miscellany
of effects including a surge in demand,
comparatively high inflation and a
severe erosion of price competitiveness
has resulted in persistently high current
account deficits as is shown in the graph
on p. 7. The economic crisis of 2008/2009
lifted the veil on the fact that, behind
the hefty external imbalances of these
EMU countries, the domestic economies
were dancing on very thin ice indeed.
The economic crisis forced member
state governments to ratchet up their
spending in order to support the econo-
my and the financial system and accept
a steep rise in new borrowing. This left
those countries whose state finances
were already in a poor state before the
economic crisis in a particular predica-
ment. The financial markets increasingly
questioned their ability to service the
groaning debt burden in the long run.
As the debt crisis that came to a head
this spring has shown, domestic econom-
ic problems affecting specific countries
not only make the countries affected
more vulnerable in economic and fiscal
policy terms. The spillover effects on the
EMU’s close-knit financial markets mean
that these problems also pose a risk to
other member states, and thus for the
single currency area as a whole. Only the
Introduction
1 European Commission, EMU@10: Successes and Challenges after 10 Years of Economic and Monetary Union, European Economy 2/2008.
7
EUR 750bn rescue fund – which com-
prises the European Financial Stability
Facility and credit lines granted by the EU
and the IMF – combined with the support
provided by the ECB and stringent consol-
idation measures taken by the indebted
countries was able to avert a more critical
situation and calm things down on the
financial markets to a certain degree.
sector level. Rather, steps must be taken
to ensure that the emergence of new fun-
damental economic imbalances can be
prevented in the future. What is needed
is a monitoring system that can pick up
on adverse trends like these early on.
However, economic growth and high
employment levels are still indispensa-
ble objectives. Reducing and prevent-
ing imbalances alone is not enough.
An economy’s growth potential is also
Growing and persistent imbalances
pose a threat to the Union as there are
no national monetary or exchange rate
policies that could correct such imbal-
ances once they have occurred. There
can be no doubt that, with regard to the
stability of the eurozone, we need to do
more than merely reduce the marked
imbalances at both public and private
one of the factors taken into account
in financial market valuations, and
quite rightly so. Consequently, eco-
nomic policy should be aimed at both
preventing imbalances and promoting
growth. The objective should be a bal-
anced macroeconomic growth path
that manages to steer clear of adverse
macroeconomic developments, e.g. over-
indebtedness or excessive price trends.
‘00 ‘01 ‘02 ‘03 ‘04 ‘05 ‘06 ‘07 ‘08 ‘09 ‘10f
Current account balances as % of GDPCurrent account balances as % of GDP Hefty current account deficits in EMU periphery
Sources: Ecowin data (Eurostat), own calculations and forecasts.
-2
-4
-6
-8
-10
-12
-14
-16
‘00 ‘01 ‘02 ‘03 ‘04 ‘05 ‘06 ‘07 ‘08 ‘09 ‘10f
8
6
4
2
0
-2
-4
European UnionEMUGermanyFranceItalyGreeceSpainPortugal
8
Allia
nz E
cono
mic
Rese
arch
& C
orpo
rate
Dev
elop
men
t
In the 2000 Lisbon Agenda, the EU
set itself the objective of becoming the
world’s most dynamic, competitive and
knowledge-based economic region by
2010. We have been monitoring the extent
to which the Lisbon Agenda targets have
been met over the past few years in the
European Growth and Jobs Monitor pub-
lication. Although the EU has clocked up
a number of successes – on the employ-
ment front the EU has outperformed the
US, for example – the main objectives set
by the Agenda have not been met. This
was partly because the objectives were
too ambitious, but also because, like most
other economic regions, Europe was hit
by the most severe economic crisis in dec-
ades in 2008/2009. The EU has developed
the Europe 2020 strategy to succeed the
Lisbon Agenda. Europe 2020 is an agenda
for employment and smart, sustainable
and inclusive growth based on five core
EU objectives and a number of key indica-
tors (such as the rate of employment, R&D
spending, proportion of renewable energy
sources, the completion of tertiary educa-
tion, population at risk of poverty, etc.).
These are important indicators of
sustainable growth that pave the way to
economic, social and ecological moderni-
sation within the EU. Nonetheless, they
can only go some way to ensuring the
sort of balanced macroeconomic growth
process that is needed to foster the sta-
bility of the European Monetary Union.
Given the critical impact that the domes-
tic problems affecting specific countries
had on the entire single currency area,
there is a real need for an effective
macroeconomic monitoring and early-
warning system aimed at ensuring
balanced growth devoid of imbalances
in order to flag up the sort of adverse
developments that resulted in the eu-
rozone debt crisis at an early stage.
This, of course, is also the aim of the
recent proposals to improve the Stabil-
ity and Growth Pact (SGP) and its new
complement, the Excessive Imbalance
Procedure (EIP) . From an economic
perspective, it is without a doubt not
sufficient to measure imbalances just
through the current account balance.
The objective of the Euro Monitor, which
is calculated for all EMU member states,
is to deliver a highly comprehensive
set of indicators for balanced growth.
9
What then does the Euro Monitor tell us today?
In the Euro Monitor 2010
the following results stand out:
• Above all – and as a matter of top
priority – the EMU needs new sources
of growth if the euro is to be a truly
stable currency. In the medium term,
the eurozone would need at least 2%
real growth per annum to reduce debt
and unemployment substantially.
At present, we forecast growth in 2011
of 1.7%.
• Primarily as a result of the economic
downturn in 2008/2009, all of the
eurozone countries – except Ger-
many and Malta – have seen their
overall measure of balanced growth
decline since 2005. Today, none of
the 16 countries of the eurozone can
claim to be on a fully sustainable
path for overall balanced growth.
In fact, 13 of the 16 countries are all
in the mid-level rating group of the
Euro Monitor, indicating that the
overwhelming majority of eurozone
countries is mired at more or less the
same overall mediocre performance
level. No country – not even Germany
– can count itself a top performer in
2010, and two countries – Greece and
Ireland – perform extremely poorly
when measured for balanced growth.
Portugal’s and Spain’s performance is
only marginally better. An additional
exogenous shock could quickly push
them down into the bottom group.
• While most eurozone countries are in
roughly the same medium range po-
sition on measures of “fiscal sustain-
ability” as well as “ jobs, productivity
and resource efficiency”, there remain
deep and possibly dangerous diver-
gences in the all-important categories
of “competitiveness and domestic de-
mand” and “private and foreign debt”.
10
Allia
nz E
cono
mic
Rese
arch
& C
orpo
rate
Dev
elop
men
t
• Ireland, which ranks No. 15 in the
Euro Monitor, just ahead of Greece
(No. 16), is in a particularly bad
position. In the last couple of years,
Ireland has experienced steep down-
grades in “fiscal sustainability”,
“jobs, productivity and resource
efficiency” and “private and foreign
debt”. Only in the category of com-
petitiveness has Ireland seen an
improvement. Based on the criteria
laid out in the Euro Monitor, Ireland,
alongside Greece, is one of the coun-
tries that today endangers the cred-
ibility of the euro area the most.
• Belgium, which ranks No. 6 and
achieves a score of 5.6 (out of 10.0)
down from 6.4 in 2005, needs to watch
out as regards its fiscal-sustainability
situation. With close to 100% of debt
as a percentage of GDP, growth that
is projected at only 1.3% next year
and an ongoing crisis to form a new
government, the country is carrying
potentially dangerous levels of bor-
rowing in a politically fragile context.
This shows that further countries
other than Greece, Ireland, Portugal,
Spain and Italy need to pay greater
attention to their debt situation.
• At the other end of the scale, Aus-
tria, Germany, Luxembourg and the
Netherlands perform fairly well but,
as the Euro Monitor measure of bal-
anced growth shows, they all could do
more to boost their domestic demand
growth. In addition, Austria, Germany
and the Netherlands need to improve
their debt-to-GDP ratios which in all
cases exceed the Maastricht ceiling of
60%. Moreover, the Netherlands gets
a poor rating for its government
deficit, while Luxembourg could do
better on the unit labour cost front.
11
• France does relatively poorly, rank-
ing No. 8, a sobering outcome for
one of Europe’s most important
economies. It performs particularly
poorly in five indicators tracked in
the Euro Monitor: general govern-
ment deficit (rating of 2, where it ties
with Portugal and Greece), unem-
ployment rate (rating of 3, where it
is tied with Portugal), labour pro-
ductivity, share of global merchan-
dise trade and debt-to-GDP-ratio of
non-financial corporations. It also
has a merely average performance
in most other indicators, with the
exception of unit labour costs, where
its No. 3 position and score of 8 put
it well above the eurozone average.
• For the most part, Italy is rated in
the lower to middling section in 2010
and should not therefore be counted
among the circle of vulnerable EMU
countries such as Greece, Ireland,
Spain and Portugal. However, Italy
lags clearly behind the other major
eurozone economies, Germany and
France, who outperform Italy on
most counts. With a poor score in
seven out of 15 indicators and a
high rating in only one (resource
efficiency), Italy especially needs to
improve its debt-to-GDP level and
medium-term labour productivity.
• Slovakia and Slovenia prove to be
hidden champions, ranking Nos. 5
and 6, respectively, an encouraging
result for two relative newcomers
to the euro area. They both perform
well as regards government debt-
to-GDP ratios, the interest burden,
expansion of global merchandise
trade shares and current account
balances. Nevertheless, the level
of private and foreign debt should
be a concern in both countries.
12
Allia
nz E
cono
mic
Rese
arch
& C
orpo
rate
Dev
elop
men
t
The Euro Monitor – published jointly by
Allianz SE and the Lisbon Council – is
intended to be an annual macroeco-
nomic scorecard that will evaluate EMU
countries on their ability to achieve bal-
anced macroeconomic growth, which, in
turn, will allow the countries in question
to deliver prosperity to their people and
contribute to the strength and stability
of the entire euro area. Identifying the
standards used to measure this is more
than merely an academic exercise. Given
the influence that the financial mar-
kets have over the stability of individual
member states and, as a result, over the
euro area as a whole, the criteria must
by definition rely heavily on macroeco-
nomic data which financial markets
consider to be material. We believe that a
whole number of aspects come into play
when determining whether or not an
economy is achieving balanced growth.2
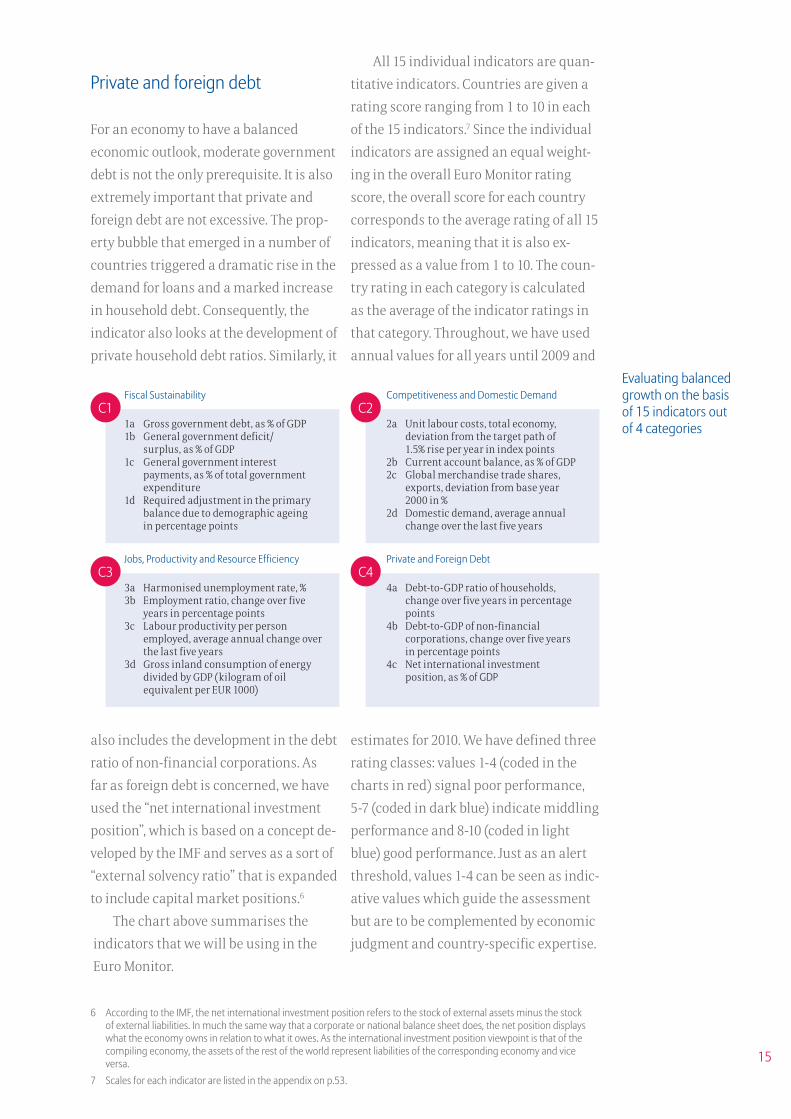
As a result, we have come up with
15 quantitative indicators, which are
themselves divided into four catego-
ries. The four thematic categories in
which the indicators are gathered are:
• Fiscal sustainability
• Competitiveness and
domestic demand
• Jobs, productivity and
resource efficiency
• Private and foreign debt
A country’s performance in these
four areas is of critical importance in
determining the trust that country
will enjoy on financial markets and
thus for the level of the risk premiums
it will be demanded to pay by those
markets. Financial markets are very
precise in the way they make distinc-
tions. Dodgy state finances are certainly
more likely to be tolerated in the case
of a country which enjoys high produc-
tivity and employment growth than in
a country with a stalling economy.
How can balanced growth be measured?
2 Given the turbulent events that have shaped the past few years and the resulting confounding factors, we have opted not to perform a regression analysis. The composition of the Euro Monitor may evolve over time owing to changing threats to macroeconomic stability or advances in data availability.
13
Fiscal sustainability
It is impossible to find one single indica-
tor to measure the solidity of government
finances. Although the massive statisti-
cal corrections made to the borrowing
requirement were the focal point of the
debate that raged at the beginning of
the Greek insolvency crisis, it is unlikely
that the reaction of the markets would
have been as drastic if government debt
levels had not been quite as high to begin
with. We believe that new borrowing and
existing debt are the two indicators of
state finances that the financial markets
keep a closest eye on. Nevertheless, high
debt levels do not necessarily translate
into a considerable interest burden for
a country’s budget if investors are pre-
pared to lend the government money at a
low interest rate, as in the case of Japan,
for example. As a result, the indicator
includes the ratio of interest payments
to the budget as a whole as a measure of
the extent to which sovereign debt can
be financed. “Sustainability relates to
the ability of a government to assume
the financial burden of its debt currently
and in the future.”3 So when assessing
state finances, it is important to bear in
mind that demographic change will place
additional burdens on the state’s shoul-
ders, burdens that will result in higher
government debt in the longer run. This
burden, known as implicit government
debt, varies from country to country
depending on the specific demographic
trends but also, and in particular, on the
structure of the national pension sys-
tems. As a result, we have included the
need to adjust state finances to reflect the
ageing population as another indicator
under the “fiscal sustainability” category.
This is based on a sub-component of the
European Commission’s Sustainability
Gap Indicator – the required adjustment
due to the long-term changes in gov-
ernment expenditure. This component
sheds light on the additional adjustment
required to finance the increase in public
expenditure due to ageing up to 2060.
Competitiveness and domestic demand
When an economy becomes less competi-
tive, it is more prone to imbalances, and
moreover, loses growth potential in the
longer term. We believe that the “compet-
itiveness” category is just as important in
ensuring balanced growth as the “fiscal
sustainability” category. The current
account balance is the main indicator of
external equilibrium. The markets inter-
pret hefty deficits as pointing towards
a lack of competitiveness. However, the
current account balance should not only
be seen in terms of competitiveness.
Although a member state with a current
account surplus might benefit from its
competitive export sector, its internal
demand might leave something to be
desired which in turn would enlarge the
3 European Commission: Sustainability Report 2009, European Economy 9, p. 9.
14
Allia
nz E
cono
mic
Rese
arch
& C
orpo
rate
Dev
elop
men
t
gap between deficit and surplus euro-
zone countries. Moreover, growth reliant
solely on exports is possibly an indica-
tion of an imbalanced growth path. We
therefore include medium-term domestic
growth, measured as the average annual
change in domestic demand over the
last five years, in our set of indicators.
The main reason behind a loss of
competitiveness tends to lie in unfavour-
able cost developments. Divergent wage
trends, for example, are likely to be one
of the main causes behind competitive
differences and external imbalances
within the euro area. Consequently, we
have used wage costs per unit of produc-
tion as one of the individual indicators
for assessing price competitiveness.
This assessment looks at the differ-
ence between actual unit wage costs
and a stable development rate of 1.5%
expressed in index points.4 But a lack of
competitiveness is not only caused by
cost disadvantages. The root can also lie
in a lack of product innovation or a less
attractive product range. We have there-
fore used the development of a country’s
global trade share as a further individual
indicator, because this parameter par-
ticularly reflects changes in the qual-
ity and structure of the goods offered
by a country on the global markets.
Jobs, productivity and resource efficiency
A country’s economic performance is tied
to its growth in employment and labour
productivity. The financial markets gen-
erally consider countries boasting higher
economic growth to be better equipped
to tackle debt problems. This has prompt-
ed us to include the development in the
employment rate and labour productiv-
ity per employee in the indicator. In this
respect, we believe that a medium-term
assessment showing the percentage
change within a five-year period makes
the most sense. We have chosen the
unemployment rate as a further labour
market indicator, because it is still the
main parameter signalling imbalances
on the labour market. Nowadays, eco-
nomic efficiency is no longer measured
in terms of labour productivity alone. The
efficient use of resources has become a
quality attribute for an economy, espe-
cially given that scarcer resources can
translate into higher cost burdens.5 As a
result, we have included the energy inten-
sity of aggregate output in the indicator.
4 Labour costs are the major domestic inflation determinant. The target path of a 1.5% increase in labour costs per year is approximately consistent with the ECB’s price stability norm (close to but below 2%) if rising commodity prices which result in further inflation pressures are taken into account.
5 See Janez Potocnik: Resource Efficiency as a Driver of Growth and Jobs, The 2010 Jean-Jacques Rousseau Lecture, deliv-ered at the Lisbon Council on 23 March 2010.
15
Private and foreign debt
For an economy to have a balanced
economic outlook, moderate government
debt is not the only prerequisite. It is also
extremely important that private and
foreign debt are not excessive. The prop-
erty bubble that emerged in a number of
countries triggered a dramatic rise in the
demand for loans and a marked increase
in household debt. Consequently, the
indicator also looks at the development of
private household debt ratios. Similarly, it
Evaluating balanced growth on the basis of 15 indicators out of 4 categories
C1
C3
C2
C4
Fiscal Sustainability
1a Gross government debt, as % of GDP1b General government deficit/ surplus, as % of GDP 1c General government interest payments, as % of total government expenditure1d Required adjustment in the primary balance due to demographic ageing in percentage points
Jobs, Productivity and Resource Efficiency
3a Harmonised unemployment rate, %3b Employment ratio, change over five years in percentage points3c Labour productivity per person employed, average annual change over the last five years3d Gross inland consumption of energy divided by GDP (kilogram of oil equivalent per EUR 1000)
Competitiveness and Domestic Demand
2a Unit labour costs, total economy, deviation from the target path of 1.5% rise per year in index points2b Current account balance, as % of GDP2c Global merchandise trade shares, exports, deviation from base year 2000 in %2d Domestic demand, average annual change over the last five years
Private and Foreign Debt
4a Debt-to-GDP ratio of households, change over five years in percentage points4b Debt-to-GDP of non-financial corporations, change over five years in percentage points4c Net international investment position, as % of GDP
also includes the development in the debt
ratio of non-financial corporations. As
far as foreign debt is concerned, we have
used the “net international investment
position”, which is based on a concept de-
veloped by the IMF and serves as a sort of
“external solvency ratio” that is expanded
to include capital market positions.6
The chart above summarises the
indicators that we will be using in the
Euro Monitor.
All 15 individual indicators are quan-
titative indicators. Countries are given a
rating score ranging from 1 to 10 in each
of the 15 indicators.7 Since the individual
indicators are assigned an equal weight-
ing in the overall Euro Monitor rating
score, the overall score for each country
corresponds to the average rating of all 15
indicators, meaning that it is also ex-
pressed as a value from 1 to 10. The coun-
try rating in each category is calculated
as the average of the indicator ratings in
that category. Throughout, we have used
annual values for all years until 2009 and
estimates for 2010. We have defined three
rating classes: values 1-4 (coded in the
charts in red) signal poor performance,
5-7 (coded in dark blue) indicate middling
performance and 8-10 (coded in light
blue) good performance. Just as an alert
threshold, values 1-4 can be seen as indic-
ative values which guide the assessment
but are to be complemented by economic
judgment and country-specific expertise.
6 According to the IMF, the net international investment position refers to the stock of external assets minus the stock of external liabilities. In much the same way that a corporate or national balance sheet does, the net position displays what the economy owns in relation to what it owes. As the international investment position viewpoint is that of the compiling economy, the assets of the rest of the world represent liabilities of the corresponding economy and vice versa.
7 Scales for each indicator are listed in the appendix on p.53.
16
Allia
nz E
cono
mic
Rese
arch
& C
orpo
rate
Dev
elop
men
t
Overall ranking
As described above, the Euro Monitor
evaluates the extent to which an EMU
country is achieving balanced macroeco-
nomic growth and thus contributing to
the stability of the euro area. The overall
score represents the average rating over
all 15 indicators included in the Moni-
tor, enabling us to highlight and com-
pare individual country performance.
The results for 2010 in the table on
p. 17 paint a clear picture: After signifi-
cant improvements on what was a weak
performance for many years, Germany
has acquired the first place, achieving an
average rating over all indicators
of 7.4 – a good score, but still not high
enough to rank it among what would be
“good performers” under more normal
economic circumstances. It is closely fol-
lowed by Austria in second place, with an
average rating of 7.3, while Luxembourg
and the Netherlands come in joint third
with an overall rating of 7.0. Not surpris-
ingly, EMU countries that dominated the
sovereign debt crisis this spring come in
at the bottom of the list, reflecting their
poor balanced growth. Greece weighs
in at No. 16, based on a league-lagging
score of 2.9. Ireland comes in at No. 15
with a score of 3.5, Spain is No. 14 with a
score of 4.0 and Portugal is No.13 with
a score of 4.1. Italy, often counted among
this circle of vulnerable EMU countries,
performs moderately (4.9) in 2010,
coming in at No.10, ahead of Cyprus
(No.12) and Malta (No.11).
Analysing the overall ratings over
time offers valuable pointers as to wheth-
er member countries have either caught
up with, maintained or lost track of their
balanced growth path. The graphs on
pp. 18-19 compare the development of the
overall ratings from 2005 to 2010 of the
three biggest EMU countries in terms of
GDP – Germany, France and Italy –
along with Portugal, Spain, Ireland and
Greece as the four countries whose fi-
nancial and economic situation has been
perceived as distinctly problematic
by financial markets since the beginning
of this year.
Overall ranking and results
Rank2010
EMU Member State
Average Rating 2010
Rank 2009
Average Rating 2009
Rank 2005
Average Rating 2005
1 DE Germany 7.4 1 7.4 7 7.0
2 AT Austria 7.3 2 7.3 4 7.4
3 LU Luxembourg 7.0 3 7.3 1 8.5
3 NL Netherlands 7.0 4 6.9 6 7.1
5 SK Slovakia 5.9 5 6.0 9 6.4
6 BE Belgium 5.6 6 5.9 9 6.4
6 SL Slovenia 5.6 7 5.8 3 7.8
8 FI Finland 5.5 8 5.7 5 7.4
8 FR France 5.5 8 5.7 8 6.9
10 IT Italy 4.9 12 4.8 13 6.1
11 MT Malta 4.9 10 5.3 16 4.6
12 CY Cyprus 4.6 11 4.8 11 6.3
13 PT Portugal 4.1 14 4.1 15 4.9
14 ES Spain 4.0 13 4.3 12 6.2
15 IE Ireland 3.5 15 3.9 2 8.3
16 GR Greece 2.9 16 3.5 14 5.2
17
As can be seen, with the exception of
Germany, all of these countries have suf-
fered a downgrade since 2005. Germany
not only scored 7.0 in 2005 and 7.4 in
2010 but also saw the most improvement
before the economic crisis hit. In 2005,
Germany was only ranked No. 7 in the
Euro Monitor, but it had climbed to No. 1
by 2009 – based largely on sounder fiscal
management, improving competitiveness
and overdue structural reforms – and
has maintained this position in 2010. In
contrast, Ireland has experienced the
steepest downgrade, falling precipitously
from the No. 2 spot in 2005 (with an
overall score of 8.3) to the No. 15 place in
2010, with an overall score of 3.5. In fact,
Ireland was downgraded in three of the
four categories, the exception being com-
petitiveness. This is partly due to
the fact that Ireland not only experienced
the severest recession in the euro area
Rank2010
EMU Member State
Average Rating 2010
Rank 2009
Average Rating 2009
Rank 2005
Average Rating 2005
1 DE Germany 7.4 1 7.4 7 7.0
2 AT Austria 7.3 2 7.3 4 7.4
3 LU Luxembourg 7.0 3 7.3 1 8.5
3 NL Netherlands 7.0 4 6.9 6 7.1
5 SK Slovakia 5.9 5 6.0 9 6.4
6 BE Belgium 5.6 6 5.9 9 6.4
6 SL Slovenia 5.6 7 5.8 3 7.8
8 FI Finland 5.5 8 5.7 5 7.4
8 FR France 5.5 8 5.7 8 6.9
10 IT Italy 4.9 12 4.8 13 6.1
11 MT Malta 4.9 10 5.3 16 4.6
12 CY Cyprus 4.6 11 4.8 11 6.3
13 PT Portugal 4.1 14 4.1 15 4.9
14 ES Spain 4.0 13 4.3 12 6.2
15 IE Ireland 3.5 15 3.9 2 8.3
16 GR Greece 2.9 16 3.5 14 5.2
Euro Monitor Ranking 2010
18
Allia
nz E
cono
mic
Rese
arch
& C
orpo
rate
Dev
elop
men
t
but also suffers from a towering budget
deficit that is set to become even worse in
2010 as Ireland grapples to keep its banks
afloat. Greece by contrast was ranked
low throughout. In 2005 the country was
No. 14 with a score of 5.2. But it has fallen
to the bottom of the ranking since 2008.
Spain has also moved down slightly,
ranking No. 12 in 2005 with a score of 6.2,
today it ranks No. 14 with a score of 4.0.
Analysing the ratings over time
raises the question of whether the Euro
Monitor might serve as a leading indica-
tor. Indeed, those countries endanger-
ing the stability of the euro area in 2010
had already been hovering in the lower
range before the sovereign debt crisis
struck. Spain, Ireland and Greece have
been slipping gradually since 2005.
Notably, Portugal managed to hold
its rating of below but close to 5 until
2008, but was attributed poor balanced
growth thereafter. Ireland, in turn, has
been declining sharply from 2005 to
2008. This departure from the balanced
growth path especially in Greece, Ireland
and Spain, had it been spotted earlier,
could have acted as a warning signal
to politicians and financial markets.
2005 2006 2007 2008 2009 2010f
Average over all indicatorsEuro Monitor rating over time
Sources: Ecowin data (Eurostat), own
calculations and forecasts.
GermanyFrance
Italy
10
9
8
7
6
5
4
3
2
1
19
In the following chapters we take
a detailed look at the ratings in the
four different categories and underly-
ing individual indicators, enabling us
to make a more differentiated analysis
of how the economic fundamentals
of each member country are affect-
ing their balanced growth path.
Average over all indicators
Sources: Ecowin data (Eurostat), own calculations and forecasts.
Euro Monitor rating over time
10
9
8
7
6
5
4
3
2
1
2005 2006 2007 2008 2009 2010f
GreeceSpainPortugalIreland
20
Allia
nz E
cono
mic
Rese
arch
& C
orpo
rate
Dev
elop
men
t
Fiscal sustainability
In the category of fiscal sustainability we
look at four indicators to devise an overall
rating for each of the 16 eurozone
members: the government debt level,
the net lending/borrowing position, the
interest burden and the required
adjustment in the primary balance due
to demographic ageing.
After a marked deterioration in 2008,
EMU public finances took a further
hammering in 2009. This was the result
both of the deep recessions endured
across the region during 2008 and 2009
and the fiscal stimulus packages enacted
by eurozone governments to counter
the downward spiral. Those member
countries on an unsustainable path prior
to the crisis were particularly badly hit.
In terms of fiscal sustainability
Luxembourg achieves the highest rating
in 2010 (7.0). The small country performs
well on three of the four fiscal sustain-
ability indicators, the exception being
indicator 1d, the required adjustment in
the primary balance due to the long-term
change in age-related costs. Slovakia and
Finland also do well, tied at No. 2 with
an average score of 6.5. They are followed
closely by Austria and Germany both
ranked at No. 4 (with an average category
rating of 6.0), and Slovenia at No. 5
(with a score of 5.8). As Greece for years
charted a very expansionary fiscal
policy course that ultimately plunged
the country into the current debt crisis,
the Greek lack of fiscal sustainability
is reflected in its No. 16 ranking, based
on a dismal score of 1.3. Belgium and
Ireland, meanwhile, weigh in at No.14
and 15, with scores of 3.8 and 3.5 re-
spectively, putting them in the poor
performance group as well. In the end,
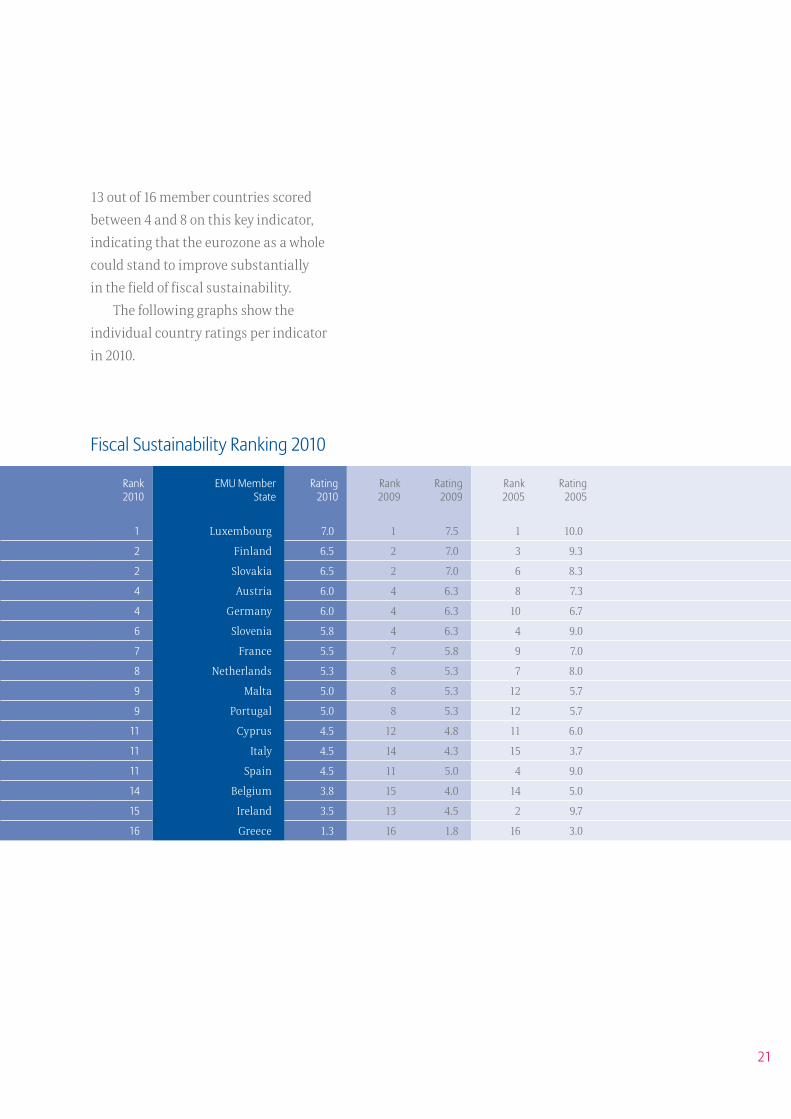
Rank 2010
EMU Member State
Rating 2010
Rank 2009
Rating 2009
Rank 2005
Rating 2005
1 Luxembourg 7.0 1 7.5 1 10.0
2 Finland 6.5 2 7.0 3 9.3
2 Slovakia 6.5 2 7.0 6 8.3
4 Austria 6.0 4 6.3 8 7.3
4 Germany 6.0 4 6.3 10 6.7
6 Slovenia 5.8 4 6.3 4 9.0
7 France 5.5 7 5.8 9 7.0
8 Netherlands 5.3 8 5.3 7 8.0
9 Malta 5.0 8 5.3 12 5.7
9 Portugal 5.0 8 5.3 12 5.7
11 Cyprus 4.5 12 4.8 11 6.0
11 Italy 4.5 14 4.3 15 3.7
11 Spain 4.5 11 5.0 4 9.0
14 Belgium 3.8 15 4.0 14 5.0
15 Ireland 3.5 13 4.5 2 9.7
16 Greece 1.3 16 1.8 16 3.0
21
13 out of 16 member countries scored
between 4 and 8 on this key indicator,
indicating that the eurozone as a whole
could stand to improve substantially
in the field of fiscal sustainability.
The following graphs show the
individual country ratings per indicator
in 2010.
Rank 2010
EMU Member State
Rating 2010
Rank 2009
Rating 2009
Rank 2005
Rating 2005
1 Luxembourg 7.0 1 7.5 1 10.0
2 Finland 6.5 2 7.0 3 9.3
2 Slovakia 6.5 2 7.0 6 8.3
4 Austria 6.0 4 6.3 8 7.3
4 Germany 6.0 4 6.3 10 6.7
6 Slovenia 5.8 4 6.3 4 9.0
7 France 5.5 7 5.8 9 7.0
8 Netherlands 5.3 8 5.3 7 8.0
9 Malta 5.0 8 5.3 12 5.7
9 Portugal 5.0 8 5.3 12 5.7
11 Cyprus 4.5 12 4.8 11 6.0
11 Italy 4.5 14 4.3 15 3.7
11 Spain 4.5 11 5.0 4 9.0
14 Belgium 3.8 15 4.0 14 5.0
15 Ireland 3.5 13 4.5 2 9.7
16 Greece 1.3 16 1.8 16 3.0
Fiscal Sustainability Ranking 2010
22
Allia
nz E
cono
mic
Rese
arch
& C
orpo
rate
Dev
elop
men
t
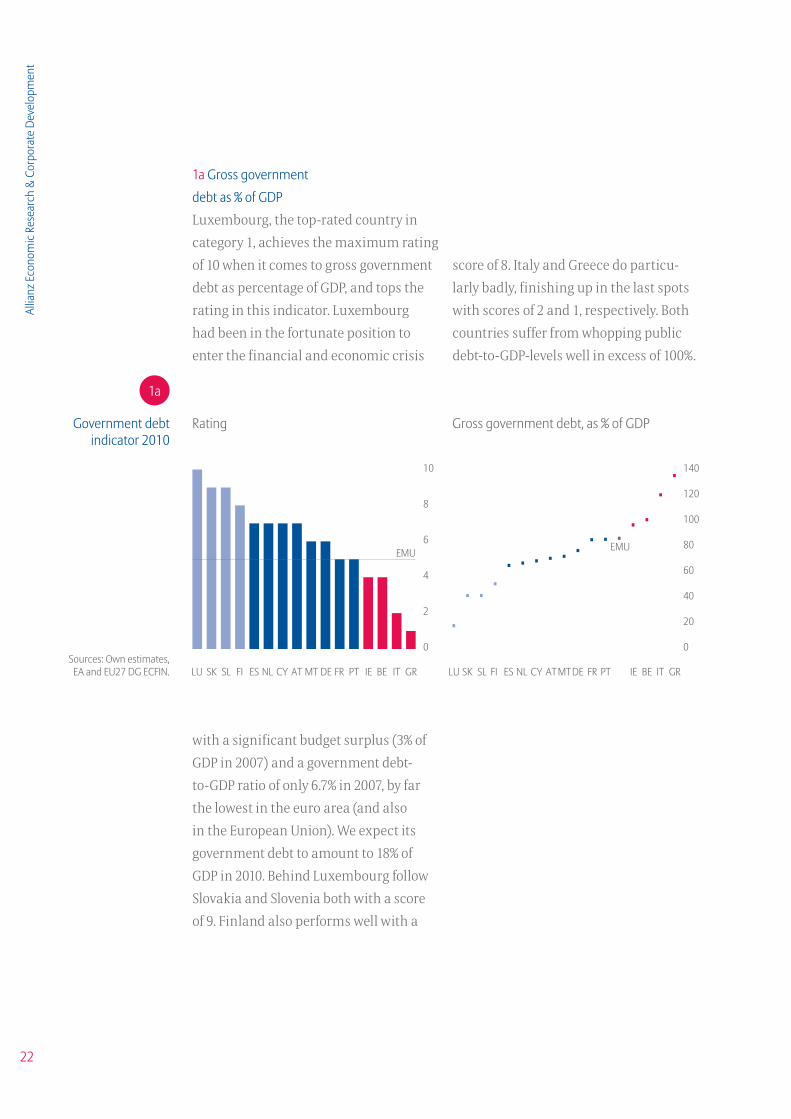
1a Gross government
debt as % of GDP
Luxembourg, the top-rated country in
category 1, achieves the maximum rating
of 10 when it comes to gross government
debt as percentage of GDP, and tops the
rating in this indicator. Luxembourg
had been in the fortunate position to
enter the financial and economic crisis
LU SK SL FI ES NL CY AT MT DE FR PT IE BE IT GR
Gross government debt, as % of GDP RatingGovernment debt indicator 2010
140
120
100
80
60
40
20
0
EMU
LU SK SL FI ES NL CY AT MT DE FR PT IE BE IT GR
EMU
Sources: Own estimates, EA and EU27 DG ECFIN.
10
8
6
4
2
0
1a
score of 8. Italy and Greece do particu-
larly badly, finishing up in the last spots
with scores of 2 and 1, respectively. Both
countries suffer from whopping public
debt-to-GDP-levels well in excess of 100%.
with a significant budget surplus (3% of
GDP in 2007) and a government debt-
to-GDP ratio of only 6.7% in 2007, by far
the lowest in the euro area (and also
in the European Union). We expect its
government debt to amount to 18% of
GDP in 2010. Behind Luxembourg follow
Slovakia and Slovenia both with a score
of 9. Finland also performs well with a
23
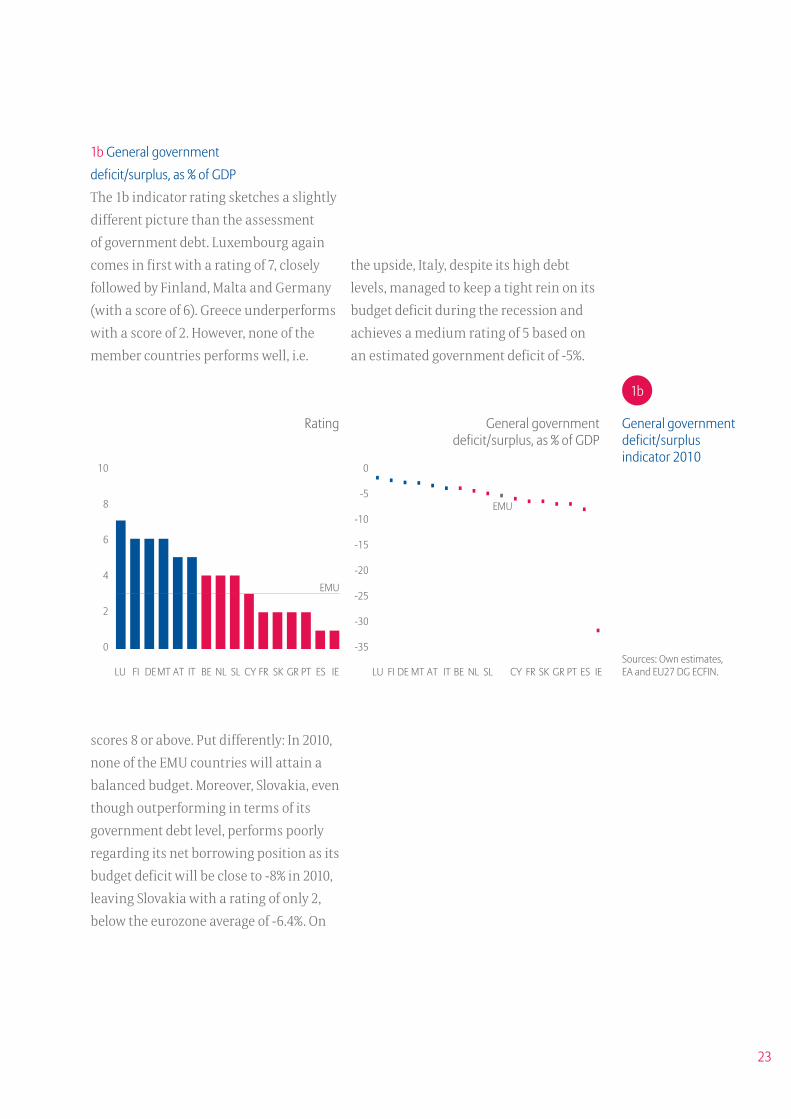
1b General government
deficit/surplus, as % of GDP
The 1b indicator rating sketches a slightly
different picture than the assessment
of government debt. Luxembourg again
comes in first with a rating of 7, closely
followed by Finland, Malta and Germany
(with a score of 6). Greece underperforms
with a score of 2. However, none of the
member countries performs well, i.e.
LU FI DE MT AT IT BE NL SL CY FR SK GR PT ES IE
EMU
General government deficit/surplus, as % of GDP
Rating General government deficit/surplus indicator 2010
Sources: Own estimates, EA and EU27 DG ECFIN.
0
-5
-10
-15
-20
-25
-30
-35
LU FI DE MT AT IT BE NL SL CY FR SK GR PT ES IE
EMU
10
8
6
4
2
0
1b
scores 8 or above. Put differently: In 2010,
none of the EMU countries will attain a
balanced budget. Moreover, Slovakia, even
though outperforming in terms of its
government debt level, performs poorly
regarding its net borrowing position as its
budget deficit will be close to -8% in 2010,
leaving Slovakia with a rating of only 2,
below the eurozone average of -6.4%. On
the upside, Italy, despite its high debt
levels, managed to keep a tight rein on its
budget deficit during the recession and
achieves a medium rating of 5 based on
an estimated government deficit of -5%.
24
Allia
nz E
cono
mic
Rese
arch
& C
orpo
rate
Dev
elop
men
t
4 and Greece with a score of 1. Whereas
Luxembourg’s interest payments
account for only 1.2% of government
expenditure, the Greek figure comes in
at approximately 11% , well above the
expected euro area average of 5.8%.
LU FI SL SK NL ES FR DE IE AT CY PT BE MT IT GR
General government interest payments, as % of total government expenditure
RatingGoverment interest payments
indicator 201012
10
8
6
4
2
0
EMU
LU FI SL SK NL ES FR DE IE AT CY PT BE MT IT GR
EMU
Source: Own estimates.
10
8
6
4
2
0
1c
1c General government
interest payments as % of total
government expenditure
When it comes to handling the interest
burden, Luxembourg and Finland lead
the way with a top score of 10. They are
closely followed by Slovakia and Slovenia
(with a score of 9) as well as France,
membership. Reflecting their substantial
government debt burden, the Italian
and Greek government interest payments
as a percentage of total government
expenditure are very high, leaving them
in the two last spots, Italy with a score of
the Netherlands and Spain (with a score
of 8). Apart from Luxembourg, where
the interest burden was consistently
low, all these countries have reduced
their interest burden considerably from
1999 onwards, spurred by the decline
in borrowing costs resulting from EMU
25
1d Required adjustment in the
primary balance8 due to demographic
ageing in percentage points
Indicator 1d quantifies the additional
adjustment in the primary balance
required to finance the increase in public
expenditure due to ageing up to 2060. It is
based on a sub-component of the Euro-
pean Commission’s Sustainability Gap
Indicator 1.9 The country rating differs
budgetary positions might imply that
fiscal policy is unsustainable, their long-
term costs of ageing are not projected to
be particularly elevated by the European
Commission. In Portugal, for instance, a
recent pension reform has done much to
improve sustainability. By contrast, Fin-
land and Luxembourg face unfavourable
demographics; their projected increase
in age-related expenditure is substantial.
Mainly driven by an increase in pension
expenditure, Luxembourg will have to
cope with the second highest adjustment
due to the long-term cost of ageing in the
European Union, after only Greece.10
8 The primary balance is defined as the difference between revenue and expenditure minus interest payments on outstanding debt.
9 It should be noted that values for 2007-2008 are interpolated estimates. In addition, no pension projections were available for Greece so that the rise in age-related expenditure is underestimated in 2006-2008.
10 See European Commission: Sustainability Report 2009, European Economy 9, p. 120.
PT FR IT SK DE AT MT BE ES FI IE NL CY SL LU GR
EMU
Rating Required adjustment in the primary balance due to demographic ageing
Required adjustment in primary balance indicator 2010
Source: Own estimates.
8
6
4
2
0
PT FR IT SK DE AT MT BE ES FI IE NL CY SL LU GR
EMU
10
8
6
4
2
0
1d
markedly from the first three indicators
of category 1. France, Italy and Portugal
lead the field with ratings of 7, whereas in
the poor performance section this time
we find Finland, normally a top perform-
er in the fiscal sustainability category,
tied with Belgium, Spain, Ireland and the
Netherlands with a score of 2, and Lux-
embourg with a score of 1. Even though
the French, Italian and Portuguese initial
26
Allia
nz E
cono
mic
Rese
arch
& C
orpo
rate
Dev
elop
men
t
Competitiveness and domestic demand
As was revealed by the eurozone crisis,
structural problems in several euro area
countries are mainly driven by a lack of
competitiveness. To measure competi-
tiveness, the Euro Monitor makes use of
three indicators, namely unit labour
costs, the current account balance and
global merchandise trade shares. The
competitiveness indicators are comple-
mented by our assessment of domestic
growth, thus taking account of its influ-
ence on the current account balance.
Germany and Austria top the cat-
egory, taking Nos. 1 and 2 spots. Thanks
particularly to wage moderation,
Germany generates the highest average
over the four contributing indicators,
Competitiveness and Domestic Demand Ranking 2010
Rank 2010
EMU Member State
Rating 2010
Rank 2009
Rating 2009
Rank 2005
Rating 2005
1 Germany 8.5 1 8.5 5 8.0
2 Austria 8.3 2 8.3 2 9.0
3 Netherlands 8.0 3 8.0 5 8.0
3 Slovakia 8.0 5 7.5 12 6.8
5 Belgium 7.5 4 7.8 3 8.5
6 Luxembourg 7.3 5 7.5 1 9.3
7 Slovenia 6.8 7 6.8 5 8.0
8 France 6.3 8 6.3 5 8.0
9 Finland 6.0 9 6.0 3 8.5
10 Spain 5.3 10 5.5 10 7.0
11 Italy 4.8 11 4.8 9 7.3
12 Ireland 4.5 13 4.3 10 7.0
13 Portugal 4.3 14 4.0 15 5.0
14 Cyprus 4.0 14 4.0 13 6.5
14 Malta 4.0 12 4.5 16 3.8
16 Greece 3.3 14 4.0 13 6.5
27
with a rating of 8.5 in 2010, closely fol-
lowed by Austria which scores 8.3. In
the high performance group we also
find the Netherlands and Slovakia, tied
for the No. 3 spot. In contrast, Greece,
Malta and Cyprus show an alarmingly
bad performance in our competitive-
ness/domestic demand-category com-
ing in at Nos. 16, 14 and 14 respectively.
It is interesting to note that, concerning
the three competitiveness indicators,
Ireland is back on track again, having
experienced a severe erosion in com-
petitiveness during 2006-2008. A quite
similar picture can be drawn for Spain.
On the downside, the Monitor shows
that France, Italy and above all Greece
have lost competitiveness over time.
Let us now have a detailed look
at the individual country ratings per
indicator in 2010.
Rank 2010
EMU Member State
Rating 2010
Rank 2009
Rating 2009
Rank 2005
Rating 2005
1 Germany 8.5 1 8.5 5 8.0
2 Austria 8.3 2 8.3 2 9.0
3 Netherlands 8.0 3 8.0 5 8.0
3 Slovakia 8.0 5 7.5 12 6.8
5 Belgium 7.5 4 7.8 3 8.5
6 Luxembourg 7.3 5 7.5 1 9.3
7 Slovenia 6.8 7 6.8 5 8.0
8 France 6.3 8 6.3 5 8.0
9 Finland 6.0 9 6.0 3 8.5
10 Spain 5.3 10 5.5 10 7.0
11 Italy 4.8 11 4.8 9 7.3
12 Ireland 4.5 13 4.3 10 7.0
13 Portugal 4.3 14 4.0 15 5.0
14 Cyprus 4.0 14 4.0 13 6.5
14 Malta 4.0 12 4.5 16 3.8
16 Greece 3.3 14 4.0 13 6.5
28
Allia
nz E
cono
mic
Rese
arch
& C
orpo
rate
Dev
elop
men
t
DE AT FI FR BE NL PT IE MT ES IT GR SK LU CY SL
EMU
DE AT FI FR BE NL PT IE MT ES IT GR SK LU CY SL
EMU
2a Unit labour costs, deviation
from the target path of 1.5% rise
per year in index points
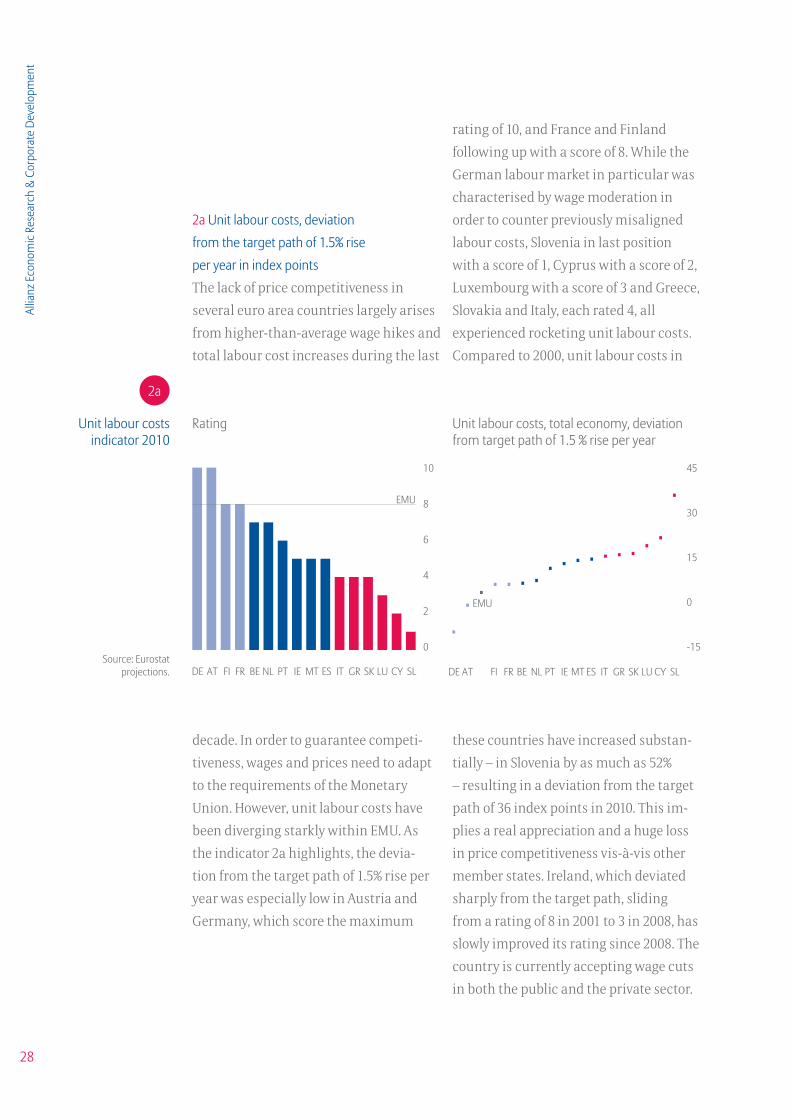
The lack of price competitiveness in
several euro area countries largely arises
from higher-than-average wage hikes and
total labour cost increases during the last
rating of 10, and France and Finland
following up with a score of 8. While the
German labour market in particular was
characterised by wage moderation in
order to counter previously misaligned
labour costs, Slovenia in last position
with a score of 1, Cyprus with a score of 2,
Luxembourg with a score of 3 and Greece,
Slovakia and Italy, each rated 4, all
experienced rocketing unit labour costs.
Compared to 2000, unit labour costs in
Rating Unit labour costs, total economy, deviation from target path of 1.5 % rise per year
Unit labour costs indicator 2010
45
30
15
0
-15Source: Eurostat
projections.
10
8
6
4
2
0
2a
decade. In order to guarantee competi-
tiveness, wages and prices need to adapt
to the requirements of the Monetary
Union. However, unit labour costs have
been diverging starkly within EMU. As
the indicator 2a highlights, the devia-
tion from the target path of 1.5% rise per
year was especially low in Austria and
Germany, which score the maximum
these countries have increased substan-
tially – in Slovenia by as much as 52%
– resulting in a deviation from the target
path of 36 index points in 2010. This im-
plies a real appreciation and a huge loss
in price competitiveness vis-à-vis other
member states. Ireland, which deviated
sharply from the target path, sliding
from a rating of 8 in 2001 to 3 in 2008, has
slowly improved its rating since 2008. The
country is currently accepting wage cuts
in both the public and the private sector.
29
NL DE LU AT BE FI IE FR SL SK IT ES MT CY PT GR
2b Current account balance,
as % of GDP11
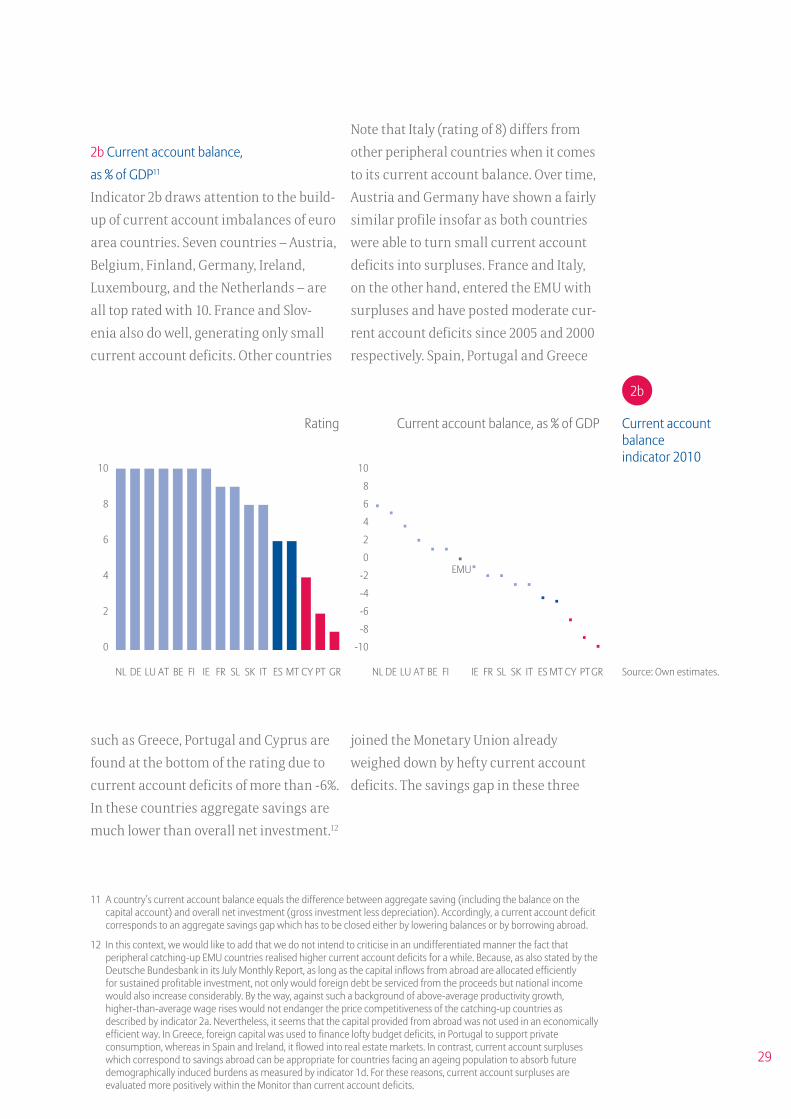
Indicator 2b draws attention to the build-
up of current account imbalances of euro
area countries. Seven countries – Austria,
Belgium, Finland, Germany, Ireland,
Luxembourg, and the Netherlands – are
all top rated with 10. France and Slov-
enia also do well, generating only small
current account deficits. Other countries
Note that Italy (rating of 8) differs from
other peripheral countries when it comes
to its current account balance. Over time,
Austria and Germany have shown a fairly
similar profile insofar as both countries
were able to turn small current account
deficits into surpluses. France and Italy,
on the other hand, entered the EMU with
surpluses and have posted moderate cur-
rent account deficits since 2005 and 2000
respectively. Spain, Portugal and Greece
11 A country’s current account balance equals the difference between aggregate saving (including the balance on the capital account) and overall net investment (gross investment less depreciation). Accordingly, a current account deficit corresponds to an aggregate savings gap which has to be closed either by lowering balances or by borrowing abroad.
12 In this context, we would like to add that we do not intend to criticise in an undifferentiated manner the fact that peripheral catching-up EMU countries realised higher current account deficits for a while. Because, as also stated by the Deutsche Bundesbank in its July Monthly Report, as long as the capital inflows from abroad are allocated efficiently for sustained profitable investment, not only would foreign debt be serviced from the proceeds but national income would also increase considerably. By the way, against such a background of above-average productivity growth, higher-than-average wage rises would not endanger the price competitiveness of the catching-up countries as described by indicator 2a. Nevertheless, it seems that the capital provided from abroad was not used in an economically efficient way. In Greece, foreign capital was used to finance lofty budget deficits, in Portugal to support private consumption, whereas in Spain and Ireland, it flowed into real estate markets. In contrast, current account surpluses which correspond to savings abroad can be appropriate for countries facing an ageing population to absorb future demographically induced burdens as measured by indicator 1d. For these reasons, current account surpluses are evaluated more positively within the Monitor than current account deficits.
NL DE LU AT BE FI IE FR SL SK IT ES MT CY PT GR
EMU
Current account balance, as % of GDPRating Current account balance indicator 2010
Source: Own estimates.
10
8
6
4
2
0
-2
-4
-6
-8
-10
10
8
6
4
2
0
2b
such as Greece, Portugal and Cyprus are
found at the bottom of the rating due to
current account deficits of more than -6%.
In these countries aggregate savings are
much lower than overall net investment.12
joined the Monetary Union already
weighed down by hefty current account
deficits. The savings gap in these three
30
Allia
nz E
cono
mic
Rese
arch
& C
orpo
rate
Dev
elop
men
t
Rating Global merchandise trade shares, exports, deviation from base year 2000 in %
Global merchandise trade shares
indicator 2010150
120
90
60
30
0
-30
-60
Source: Own estimates.
10
8
6
4
2
0
2c
SK SL LU NL DE AT BE ES PT IT GR FR IE CY FI MT
EMU
SK SL LU NL DE AT BE ES PT IT GR FR IE CY FI MT
EMU
peripheral countries as well as in Ireland
rose sharply in the period from 2004 to
2008. It is interesting to note that, since
the launch of the euro, the current ac-
count balance of the eurozone as a whole
has fluctuated only between small defi-
cits and moderate surpluses. Although
the recession has led to a narrowing of
current account differences, cyclical
effects alone will not suffice to achieve a
sustained correction of the imbalances.
ropean countries Slovakia and Slovenia as
well as Luxembourg head the table with
maximum ratings of 10. Although their
trade shares are small in absolute terms
– Slovakia’s exports account for 0.44% and
Slovenia’s for 0.20% of global merchandise
trade – compared to base year 2000 Slo-
vakia’s share in global merchandise trade
2c Global merchandise
trade shares, exports, deviation
from base year 2000 in %
The last indicator contributing to our
assessment of competitiveness measures
is the development of global merchandise
trade shares. When it comes to the devia-
tion of global merchandise trade shares
from base year 2000 in %, the Eastern Eu-
shot up by an extraordinary 140% and
Slovenia’s by 47%. The Netherlands does
well too with a score of 9, followed by Aus-
tria and long-time export world champi-
on Germany (rated 8). In contrast, Cyprus,
Finland and Malta, all rated with 1, as
well as in Ireland and France, both rated
at 2, have seen their trade shares slip
since 2000. Malta’s global merchandise
trade share has shrivelled by as much
as 60% and Finland’s by around 37%.
31
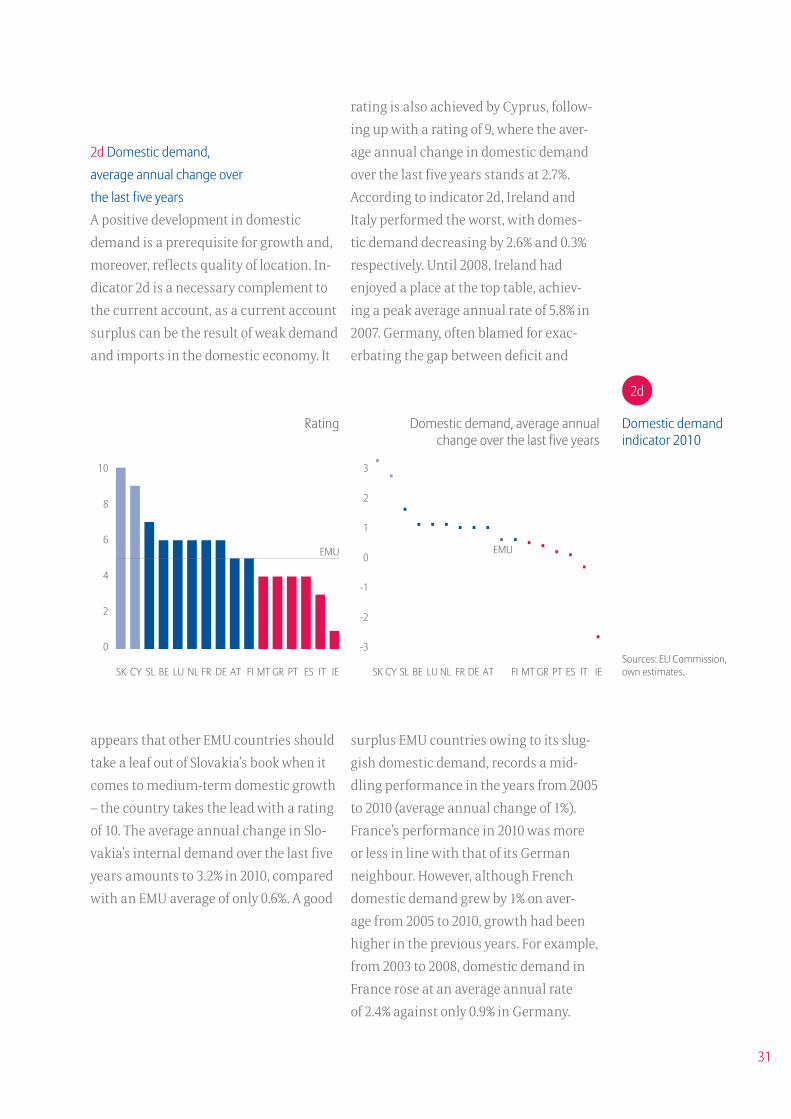
rating is also achieved by Cyprus, follow-
ing up with a rating of 9, where the aver-
age annual change in domestic demand
over the last five years stands at 2.7%.
According to indicator 2d, Ireland and
Italy performed the worst, with domes-
tic demand decreasing by 2.6% and 0.3%
respectively. Until 2008, Ireland had
enjoyed a place at the top table, achiev-
ing a peak average annual rate of 5.8% in
2007. Germany, often blamed for exac-
erbating the gap between deficit and
SK CY SL BE LU NL FR DE AT FI MT GR PT ES IT IE
EMU
Domestic demand, average annual change over the last five years
Rating Domestic demand indicator 2010
Sources: EU Commission, own estimates.
3
2
1
0
-1
-2
-3
SK CY SL BE LU NL FR DE AT FI MT GR PT ES IT IE
EMU
10
8
6
4
2
0
2d
2d Domestic demand,
average annual change over
the last five years
A positive development in domestic
demand is a prerequisite for growth and,
moreover, reflects quality of location. In-
dicator 2d is a necessary complement to
the current account, as a current account
surplus can be the result of weak demand
and imports in the domestic economy. It
appears that other EMU countries should
take a leaf out of Slovakia’s book when it
comes to medium-term domestic growth
– the country takes the lead with a rating
of 10. The average annual change in Slo-
vakia’s internal demand over the last five
years amounts to 3.2% in 2010, compared
with an EMU average of only 0.6%. A good
surplus EMU countries owing to its slug-
gish domestic demand, records a mid-
dling performance in the years from 2005
to 2010 (average annual change of 1%).
France’s performance in 2010 was more
or less in line with that of its German
neighbour. However, although French
domestic demand grew by 1% on aver-
age from 2005 to 2010, growth had been
higher in the previous years. For example,
from 2003 to 2008, domestic demand in
France rose at an average annual rate
of 2.4% against only 0.9% in Germany.
32
Allia
nz E
cono
mic
Rese
arch
& C
orpo
rate
Dev
elop
men
t
Jobs, productivity and resource efficiency
The third catergory in the Euro Monitor
is also composed of four indicators. The
unemployment rate, employment ratio,
labour productivity and inland consump-
tion of energy take account of the balance
and efficiency in production of GDP.
Similar to the overall performance
in the Euro Monitor rating, Austria, the
Netherlands and Germany score the
best in this category, coming in at Nos.
1, 2 and 3 respectively. Meanwhile Por-
tugal, Ireland and Spain bring up the
rear at Nos. 14, 15 and 16 respectively.
The EMU member states overall show a
low middling performance with 15 out
of 16 countries scoring between 4 and 8
points. Considering that the category is
taking account of mid-term economic
growth it is obvious that this relatively
low rating is a direct effect of the global
economic crisis. The slump in output and
business activity clobbered employment
and labour productivity. The summed up
ratings of all EMU countries for category
3 suffered from the biggest downgrad-
ing from 2008 to 2009 observed in any
category and any years between 2005
and 2010. Before the recession the “jobs,
productivity and resource efficiency”
ratings had been moving steadily, if
unspectacularly, upwards. Ireland was
the odd man out. Having come in at No.
1 in this category until 2007 with an
average category rating of 8.8, its score
of 4.3 in 2010 left Ireland at No. 15, a
precipitous fall. The story is similar for
Greece that started on the same level as
Netherlands and Austria, rated 6.8, 6.3
and 6.5 respectively in 2005, but tum-
bled to the No. 10 position with a score
Rank 2010
EMU Member State
Rating 2010
Rank 2009
Rating 2009
Rank 2005
Rating 2005
1 Austria 7.8 1 7.8 4 6.5
2 Netherlands 7.3 2 7.3 6 6.3
3 Germany 6.8 3 6.5 12 5.0
4 Luxembourg 6.0 4 6.3 6 6.3
5 Malta 5.8 5 6.0 14 4.8
6 Slovenia 5.5 7 5.8 2 6.8
7 Cyprus 5.3 7 5.8 6 6.3
8 Belgium 5.0 9 5.5 14 4.8
8 Italy 5.0 11 5.0 4 6.5
10 Finland 4.8 13 4.8 11 5.3
10 France 4.8 11 5.0 9 6.0
10 Greece 4.8 5 6.0 2 6.8
10 Slovakia 4.8 10 5.3 14 4.8
14 Portugal 4.5 13 4.8 12 5.0
15 Ireland 4.3 15 4.5 1 8.8
16 Spain 3.5 16 4.0 10 5.8
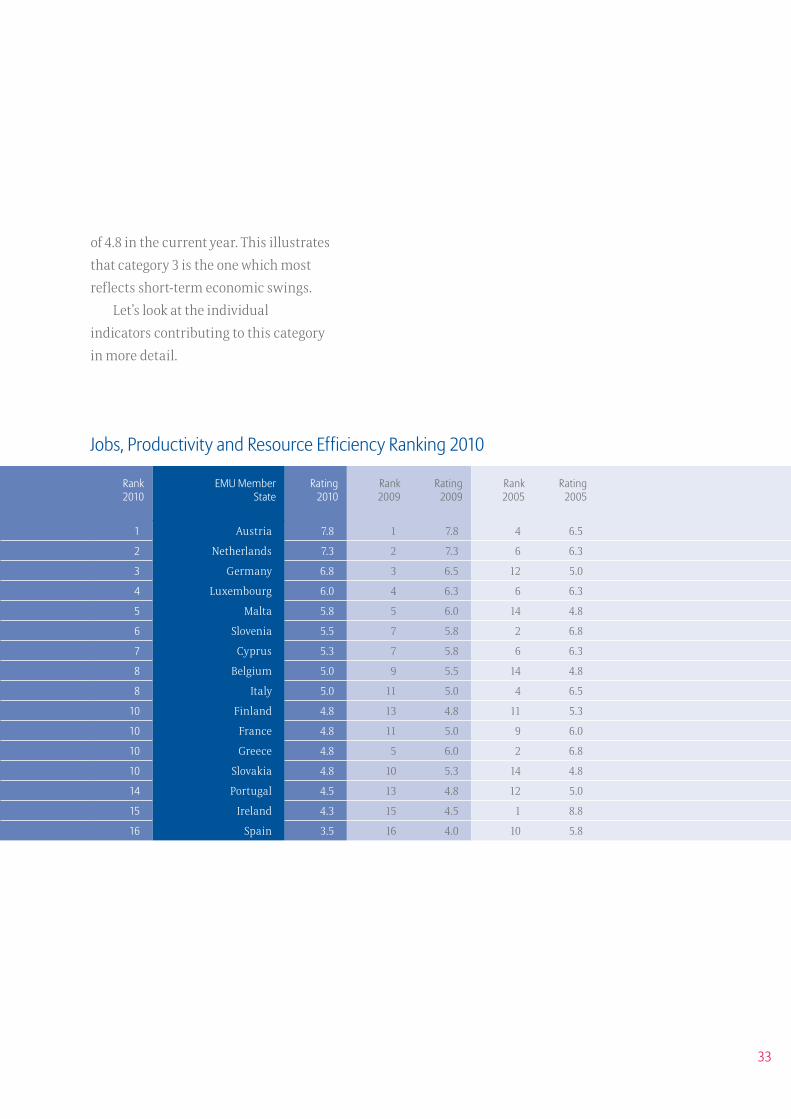
33
of 4.8 in the current year. This illustrates
that category 3 is the one which most
reflects short-term economic swings.
Let’s look at the individual
indicators contributing to this category
in more detail.
Jobs, Productivity and Resource Efficiency Ranking 2010
Rank 2010
EMU Member State
Rating 2010
Rank 2009
Rating 2009
Rank 2005
Rating 2005
1 Austria 7.8 1 7.8 4 6.5
2 Netherlands 7.3 2 7.3 6 6.3
3 Germany 6.8 3 6.5 12 5.0
4 Luxembourg 6.0 4 6.3 6 6.3
5 Malta 5.8 5 6.0 14 4.8
6 Slovenia 5.5 7 5.8 2 6.8
7 Cyprus 5.3 7 5.8 6 6.3
8 Belgium 5.0 9 5.5 14 4.8
8 Italy 5.0 11 5.0 4 6.5
10 Finland 4.8 13 4.8 11 5.3
10 France 4.8 11 5.0 9 6.0
10 Greece 4.8 5 6.0 2 6.8
10 Slovakia 4.8 10 5.3 14 4.8
14 Portugal 4.5 13 4.8 12 5.0
15 Ireland 4.3 15 4.5 1 8.8
16 Spain 3.5 16 4.0 10 5.8
34
Allia
nz E
cono
mic
Rese
arch
& C
orpo
rate
Dev
elop
men
t
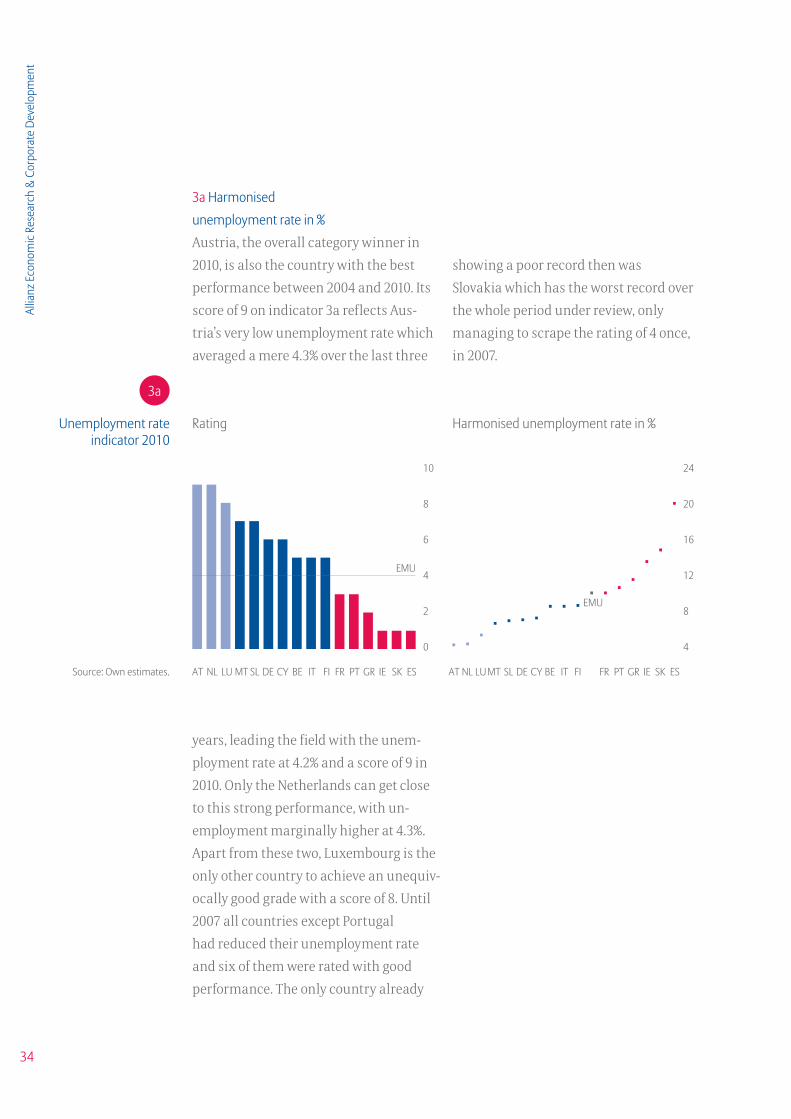
3a Harmonised
unemployment rate in %
Austria, the overall category winner in
2010, is also the country with the best
performance between 2004 and 2010. Its
score of 9 on indicator 3a reflects Aus-
tria’s very low unemployment rate which
averaged a mere 4.3% over the last three
showing a poor record then was
Slovakia which has the worst record over
the whole period under review, only
managing to scrape the rating of 4 once,
in 2007.
Harmonised unemployment rate in % RatingUnemployment rate indicator 2010
24
20
16
12
8
4
Source: Own estimates.
10
8
6
4
2
0
3a
AT NL LU MT SL DE CY BE IT FI FR PT GR IE SK ES
EMU
AT NL LU MT SL DE CY BE IT FI FR PT GR IE SK ES
EMU
years, leading the field with the unem-
ployment rate at 4.2% and a score of 9 in
2010. Only the Netherlands can get close
to this strong performance, with un-
employment marginally higher at 4.3%.
Apart from these two, Luxembourg is the
only other country to achieve an unequiv-
ocally good grade with a score of 8. Until
2007 all countries except Portugal
had reduced their unemployment rate
and six of them were rated with good
performance. The only country already
35
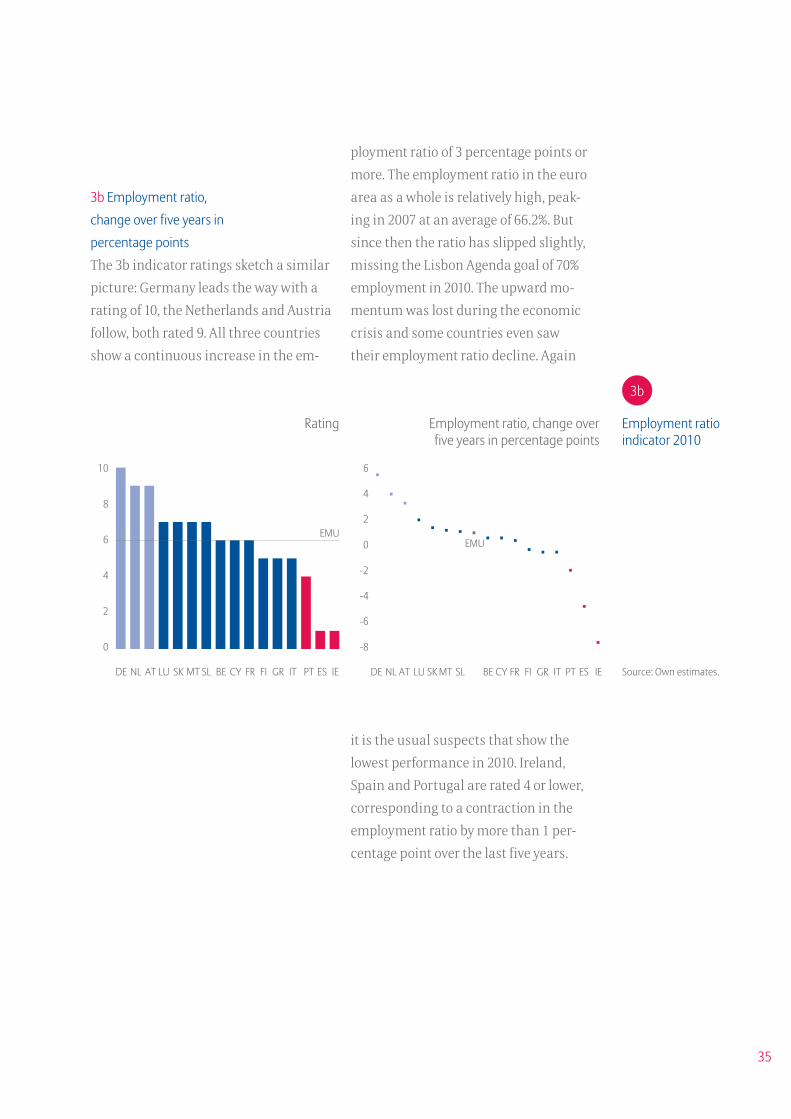
3b Employment ratio,
change over five years in
percentage points
The 3b indicator ratings sketch a similar
picture: Germany leads the way with a
rating of 10, the Netherlands and Austria
follow, both rated 9. All three countries
show a continuous increase in the em-
ployment ratio of 3 percentage points or
more. The employment ratio in the euro
area as a whole is relatively high, peak-
ing in 2007 at an average of 66.2%. But
since then the ratio has slipped slightly,
missing the Lisbon Agenda goal of 70%
employment in 2010. The upward mo-
mentum was lost during the economic
crisis and some countries even saw
their employment ratio decline. Again
DE NL AT LU SK MT SL BE CY FR FI GR IT PT ES IE
EMU
Employment ratio, change over five years in percentage points
Rating Employment ratio indicator 2010
Source: Own estimates.
6
4
2
0
-2
-4
-6
-8
DE NL AT LU SK MT SL BE CY FR FI GR IT PT ES IE
EMU
10
8
6
4
2
0
3b
it is the usual suspects that show the
lowest performance in 2010. Ireland,
Spain and Portugal are rated 4 or lower,
corresponding to a contraction in the
employment ratio by more than 1 per-
centage point over the last five years.
36
Allia
nz E
cono
mic
Rese
arch
& C
orpo
rate
Dev
elop
men
t
3c Labour productivity per
person employed, average annual
change over the last five years
Indicator 3c – accounting for growth
in labour productivity – shows a differ-
ent pattern. This time Slovakia comes
out on top and is the only country rated
with good performance. In the poor
performance section this time we find
prominently fought to keep employ-
ment as steady as possible by enhancing
short-time work to bridge the slump in
business activity, countries with less
robust economies saw unemployment
rates soar. Therefore, these countries
did not experience the same slowdown
Rating Labour productivity per person employed, average annual change over the last five years
Labour productivity indicator 2010
4
3
2
1
0
-1
Source: Own estimates.
10
8
6
4
2
0
3c
SK ES SL GR IE CY PT NL AT FI FR BE MT DE IT LU
EMU
SK ES SL GR IE CY PT NL AT FI FR BE MT DE IT LU
EMU
the core European member states while
the peripheral countries achieve mid-
dling performance with rates of 5 and 6.
This is the upside of a trade-off between
unemployment and labour productivity
(see box on productivity and employment
on p. 38). While, for example, Germany
in labour productivity growth. In the
course of economic recovery this trend
will go into reverse, with productivity
growth rising again in the core countries.
Italy’s performance is noteworthy.
Throughout the whole period from 2004
to 2010 the average change over the last
five years was negative, resulting in an
overall decrease in labour productivity
per person employed of 3%. The stubborn-
ness of this trend is especially striking.
37
IE AT IT DE LU FR GR NL ES PT MT BE FI CY SL SK
Rating Gross inland consumption of energy divided by GDP (kilogram of
oil equivalent per 1000 Euro)
Inland consumption of energy indicator 2010
Source: Own estimates.
500
400
300
200
100
0
IE AT IT DE LU FR GR NL ES PT MT BE FI CY SL SK
10
8
6
4
2
0
3d
3d Inland consumption
of energy divided by GDP
Indicator 3d, which looks at the level of
energy intensity, is the least vulnerable to
short-term changes in the category as it
is influenced by long-term technologies
and investments. Over the whole period
from 2005 to 2010 Ireland shows the low-
est level of energy consumption per GDP
and therefore again enjoys the highest
performance, there is plenty of room for
improvement. Although Slovakia has
recorded the biggest reduction (down 34%
since 2004), with energy consumption
per GDP nearly five times that of leader
Ireland it still has a long way to go.
Cyprus also stands out as a laggard
on the energy intensity front, having
achieved a reduction of only 2.5%
since 2004.
rating; it also tops the table in 2010. Most
EMU member states show a middling to
good performance and in EMU as a whole
energy consumption has been reduced
by 14.8% since 2004. But, with many
countries still registering only middling
Productivity and employment are the two key determinants driving economic growth. However, the relationship between the two is complex and not always beneficial.
An increase in productivity, leading to more output produced with the same amount of input, can stem either from higher labour productivity or from general technologi-cal progress. Generally, this leads to decreasing prices, increasing sales and higher employment. On the other hand, an increase in productivity will lead to a reduction in employment if the additional output cannot be sold on the market. The reverse influence of employment on productivity comes to the fore in a crisis.
For some decades, labour productivity has tended to grow more slowly in the euro area than in Japan and the USA. But, after a slow start to the new millennium, euro area labour productivity growth accelerated to a modest speed. This small but steady rise in productivity by 1% p.a. was accompanied by an increase in employment and therefore acknowledged as a trend accomplished by structural improvements. The economic crisis brought this increase to a halt. A fall in GDP is usually followed by a decrease in employment. However, labour markets tend to react with a time lag. This, in turn, results in a period during which output shrinks faster than input in terms of employees. Therefore labour productivity (GDP per employee) falls, too.
When people lose their job a wealth of specific knowledge and skills is also lost. This reduc-tion in labour quality has an impact on individual productivity and can inhibit reco-vering growth after the economic turnaround. Where possible, therefore, employ-ers try to keep employees on the payroll, absorbing the cost of excess capacity for a while in order to return more quickly to positive growth rates once demand picks up again. A crisis also leads to a temporary reduction in R&D investment. Therefore, in the wake of the crisis the euro area is likely to experience slower medium-term productivity growth.
Spain stands out as a special case: given the large share of temporary employees in the ove-rall workforce, the labour market reacted extremely swiftly to the slump in business activity. The increase in Spain’s labour productivity since 2008 stems from the inor-dinate decrease in employment, which has far outstripped the decline in output.
Productivity and employment
Employment, y-o-y, in %
Labour productivity per employee, y-o-y, in %
Germany Spain
Source: Eurostat.
2007 2008 2009 2010
4
2
0
-2
-4
-6
-8
2007 2008 2009 2010
4
2
0
-2
-4
-6
-8
40
Allia
nz E
cono
mic
Rese
arch
& C
orpo
rate
Dev
elop
men
t
Private and foreign debt
For a country to achieve balanced growth,
avoiding excessive private and foreign
debt is inalienable. The Euro Monitor
measures private and foreign debt with
the help of three indicators: the develop-
ment of the debt-to-GDP ratio of house-
holds, the development of the debt-to-GDP
ratio of non-financial corporations and,
last but not least, the net international
investment position as percent of GDP.
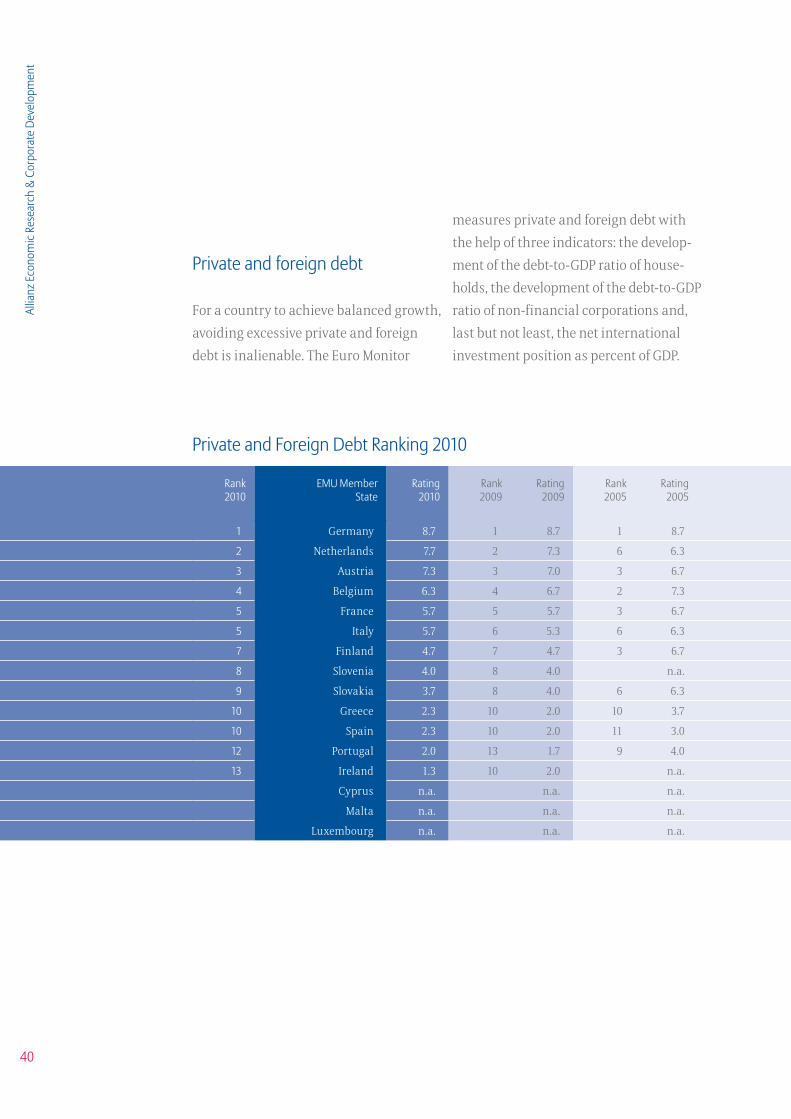
Private and Foreign Debt Ranking 2010
Rank 2010
EMU Member State
Rating 2010
Rank 2009
Rating 2009
Rank 2005
Rating 2005
1 Germany 8.7 1 8.7 1 8.7
2 Netherlands 7.7 2 7.3 6 6.3
3 Austria 7.3 3 7.0 3 6.7
4 Belgium 6.3 4 6.7 2 7.3
5 France 5.7 5 5.7 3 6.7
5 Italy 5.7 6 5.3 6 6.3
7 Finland 4.7 7 4.7 3 6.7
8 Slovenia 4.0 8 4.0 n.a.
9 Slovakia 3.7 8 4.0 6 6.3
10 Greece 2.3 10 2.0 10 3.7
10 Spain 2.3 10 2.0 11 3.0
12 Portugal 2.0 13 1.7 9 4.0
13 Ireland 1.3 10 2.0 n.a.
Cyprus n.a. n.a. n.a.
Malta n.a. n.a. n.a.
Luxembourg n.a. n.a. n.a.
4113 Because of insufficient data, Cyprus, Luxembourg and Malta are excluded in category 4. Data for Luxembourg is avail-able for indicator 4c.
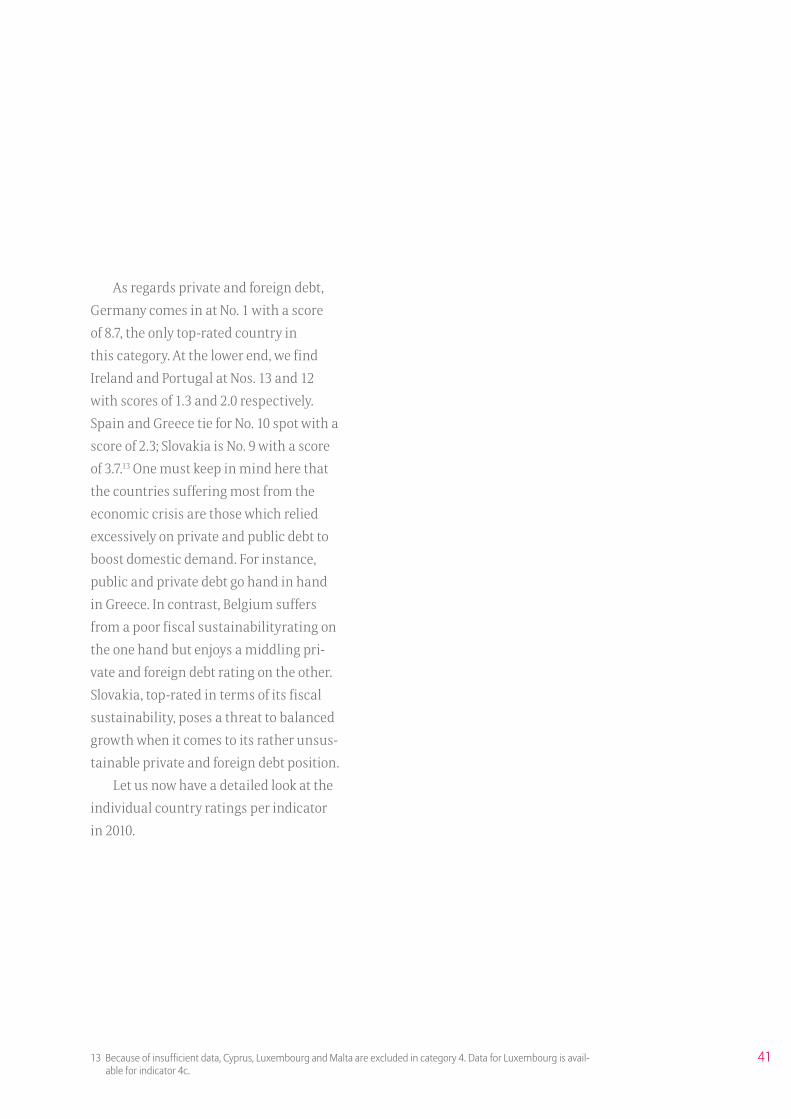
As regards private and foreign debt,
Germany comes in at No. 1 with a score
of 8.7, the only top-rated country in
this category. At the lower end, we find
Ireland and Portugal at Nos. 13 and 12
with scores of 1.3 and 2.0 respectively.
Spain and Greece tie for No. 10 spot with a
score of 2.3; Slovakia is No. 9 with a score
of 3.7.13 One must keep in mind here that
the countries suffering most from the
economic crisis are those which relied
excessively on private and public debt to
boost domestic demand. For instance,
public and private debt go hand in hand
in Greece. In contrast, Belgium suffers
from a poor fiscal sustainabilityrating on
the one hand but enjoys a middling pri-
vate and foreign debt rating on the other.
Slovakia, top-rated in terms of its fiscal
sustainability, poses a threat to balanced
growth when it comes to its rather unsus-
tainable private and foreign debt position.
Let us now have a detailed look at the
individual country ratings per indicator
in 2010.
Rank 2010
EMU Member State
Rating 2010
Rank 2009
Rating 2009
Rank 2005
Rating 2005
1 Germany 8.7 1 8.7 1 8.7
2 Netherlands 7.7 2 7.3 6 6.3
3 Austria 7.3 3 7.0 3 6.7
4 Belgium 6.3 4 6.7 2 7.3
5 France 5.7 5 5.7 3 6.7
5 Italy 5.7 6 5.3 6 6.3
7 Finland 4.7 7 4.7 3 6.7
8 Slovenia 4.0 8 4.0 n.a.
9 Slovakia 3.7 8 4.0 6 6.3
10 Greece 2.3 10 2.0 10 3.7
10 Spain 2.3 10 2.0 11 3.0
12 Portugal 2.0 13 1.7 9 4.0
13 Ireland 1.3 10 2.0 n.a.
Cyprus n.a. n.a. n.a.
Malta n.a. n.a. n.a.
Luxembourg n.a. n.a. n.a.
42
Allia
nz E
cono
mic
Rese
arch
& C
orpo
rate
Dev
elop
men
t
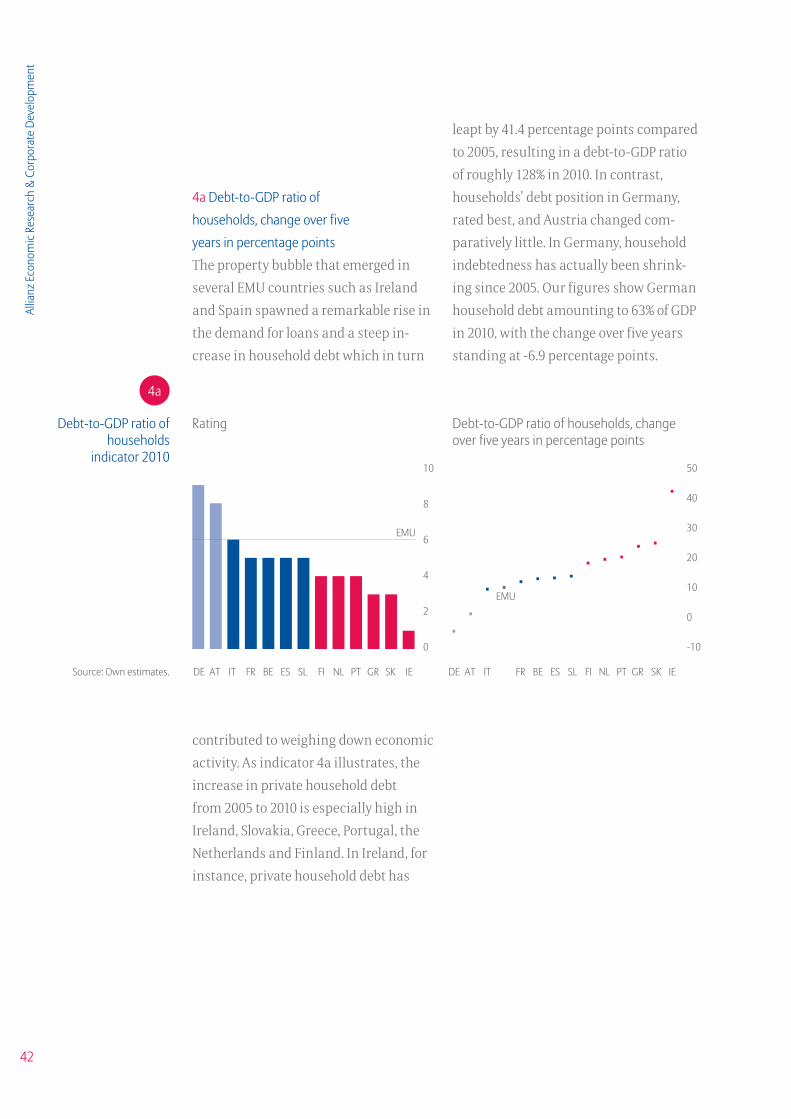
4a Debt-to-GDP ratio of
households, change over five
years in percentage points
The property bubble that emerged in
several EMU countries such as Ireland
and Spain spawned a remarkable rise in
the demand for loans and a steep in-
crease in household debt which in turn
leapt by 41.4 percentage points compared
to 2005, resulting in a debt-to-GDP ratio
of roughly 128% in 2010. In contrast,
households’ debt position in Germany,
rated best, and Austria changed com-
paratively little. In Germany, household
indebtedness has actually been shrink-
ing since 2005. Our figures show German
household debt amounting to 63% of GDP
in 2010, with the change over five years
standing at -6.9 percentage points.
Rating Debt-to-GDP ratio of households, change over five years in percentage points
Debt-to-GDP ratio of households
indicator 201050
40
30
20
10
0
-10
Source: Own estimates.
10
8
6
4
2
0
4a
DE AT IT FR BE ES SL FI NL PT GR SK IE
EMU
DE AT IT FR BE ES SL FI NL PT GR SK IE
EMU
contributed to weighing down economic
activity. As indicator 4a illustrates, the
increase in private household debt
from 2005 to 2010 is especially high in
Ireland, Slovakia, Greece, Portugal, the
Netherlands and Finland. In Ireland, for
instance, private household debt has
43
indebtedness. Compared to 2005,
Finland’s debt-to-GDP ratio of non-
financial corporations shot up by
more than 100 percentage points,
whereas in the Netherlands it declined
by around 7 percentage points.
4b Debt-to-GDP ratio of
non-financial corporations14, change
over five years in percentage points
Indicator 4d covers the development
of non-financial corporations’ debt-to-
GDP ratios. On this indicator, a worrying
9 out of the 13 countries covered are rated
at or below 4, the exception being the
Netherlands, which is leading with a top
rating of 9. It is interesting to note that
private debt in the Netherlands is split:
While the level of household indebted-
ness is fairly high and expanding, non-
financial corporations’ indebtedness is
high, but contracting. In contrast, Spain,
Portugal, Ireland and Greece have to
cope not only with high and rising levels
of private household debt, but also with
record-level and growing corporate
14 Non-financial corporations comprise all private and public corporate enterprises that produce goods or provide non-financial services to the market.
NL DE AT SK BE FR IT GR FI SL ES PT IE
Rating Debt-to-GDP ratio of non-financial corporations, change over
five years in percentage points
Debt-to-GDP ratio non-financial corporations indicator 2010
Source: Own estimates.
110
90
70
50
30
100
-10
NL DE AT SK BE FR IT GR FI SL ES PT IE
10
8
6
4
2
0
4b
EMU
EMU
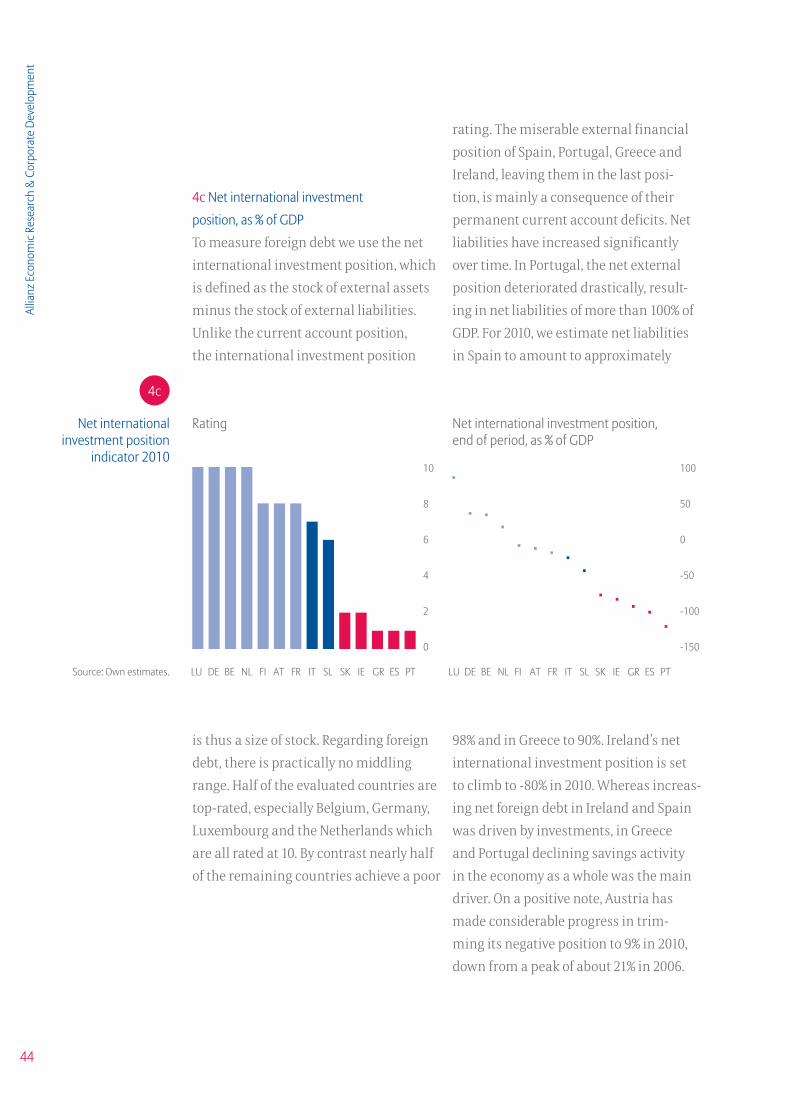
44
Allia
nz E
cono
mic
Rese
arch
& C
orpo
rate
Dev
elop
men
t
Rating Net international investment position, end of period, as % of GDP
Net international investment position
indicator 2010100
50
0
-50
-100
-150
Source: Own estimates.
10
8
6
4
2
0
4c
LU DE BE NL FI AT FR IT SL SK IE GR ES PT LU DE BE NL FI AT FR IT SL SK IE GR ES PT
4c Net international investment
position, as % of GDP
To measure foreign debt we use the net
international investment position, which
is defined as the stock of external assets
minus the stock of external liabilities.
Unlike the current account position,
the international investment position
rating. The miserable external financial
position of Spain, Portugal, Greece and
Ireland, leaving them in the last posi-
tion, is mainly a consequence of their
permanent current account deficits. Net
liabilities have increased significantly
over time. In Portugal, the net external
position deteriorated drastically, result-
ing in net liabilities of more than 100% of
GDP. For 2010, we estimate net liabilities
in Spain to amount to approximately
is thus a size of stock. Regarding foreign
debt, there is practically no middling
range. Half of the evaluated countries are
top-rated, especially Belgium, Germany,
Luxembourg and the Netherlands which
are all rated at 10. By contrast nearly half
of the remaining countries achieve a poor
98% and in Greece to 90%. Ireland’s net
international investment position is set
to climb to -80% in 2010. Whereas increas-
ing net foreign debt in Ireland and Spain
was driven by investments, in Greece
and Portugal declining savings activity
in the economy as a whole was the main
driver. On a positive note, Austria has
made considerable progress in trim-
ming its negative position to 9% in 2010,
down from a peak of about 21% in 2006.

45
46
Allia
nz E
cono
mic
Rese
arch
& C
orpo
rate
Dev
elop
men
t
If the credibility of the common currency
is to be preserved, sustainable and bal-
anced growth in the individual countries
is essential. The Euro Monitor enables us
to evaluate the extent to which an EMU
country is achieving balanced macroeco-
nomic growth and hence contributing
to a stable development of the eurozone
economy and its currency. In a very dif-
ferentiated manner, with the help of four
categories comprising 15 indicators, we
can keep track of what kind of risks or
opportunities the country-specific funda-
mentals pose for the eurozone as a whole.
The turbulence surrounding Greece
and other peripheral EMU member states
is reflected in the risk premiums on the
financial markets. Risk premiums on
Greek government bonds, as well as on
the bonds of a number of other euro area
states, have soared. The chart on p. 47,
looking at the yield spreads of selected
eurozone government bonds over the
German benchmark, underlines that, in
general, the risk evaluation of financial
markets is similar to our results pre-
sented above. Nevertheless, the measures
taken by politicians to avert the sover-
eign debt crisis and address underlying
structural problems are clearly not being
sufficiently honoured by the markets.
As the Euro Monitor would have
indicated prior to the sovereign debt
crisis that peripheral countries such
as Greece and Ireland had lost track of
their balanced growth paths, we believe
it has merit as an early warning tool. In
2008, an alarming 8 out of 15 indicators
for both Greece and Spain were flashing
red, highlighting the macroeconomic
risks. But not only the Greek and Span-
ish unbalanced growth would have been
picked up by the Euro Monitor: Ireland
achieved low ratings in 7 out of 15 indica-
tors in 2008. We therefore hope that the
Euro Monitor will be helpful in discover-
ing emerging imbalances and thereby
assist the more intensive surveillance
that is planned in the new governance
framework. Even more, we hope that, in
the wake of consolidation efforts and
economic reforms, ratings will improve
and signal more balanced growth in
the future.
Conclusion and outlook
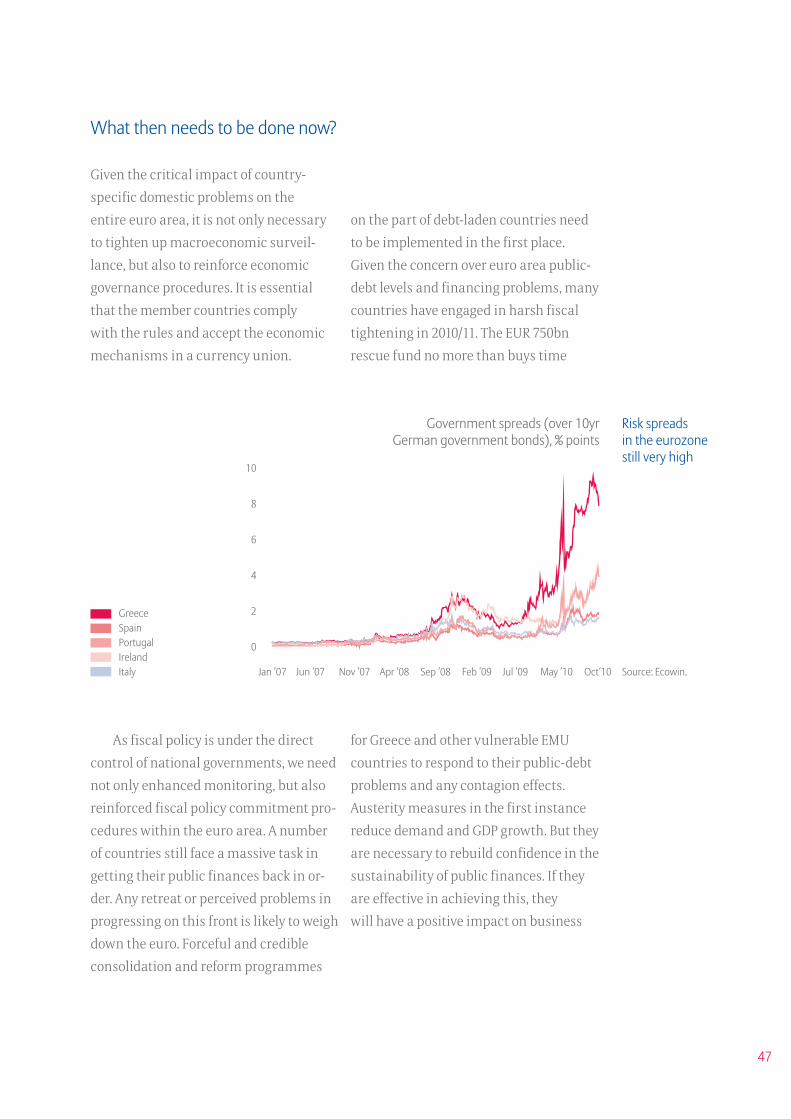
47
Jan ’07 Jun ’07 Nov ’07 Apr ’08 Sep ’08 Feb ’09 Jul ’09 May ’10 Oct’10
Government spreads (over 10yr German government bonds), % points
Source: Ecowin.
Risk spreads in the eurozone still very high
10
8
6
4
2
0
GreeceSpainPortugalIrelandItaly
What then needs to be done now?
Given the critical impact of country-
specific domestic problems on the
entire euro area, it is not only necessary
to tighten up macroeconomic surveil-
lance, but also to reinforce economic
governance procedures. It is essential
that the member countries comply
with the rules and accept the economic
mechanisms in a currency union.
on the part of debt-laden countries need
to be implemented in the first place.
Given the concern over euro area public-
debt levels and financing problems, many
countries have engaged in harsh fiscal
tightening in 2010/11. The EUR 750bn
rescue fund no more than buys time
for Greece and other vulnerable EMU
countries to respond to their public-debt
problems and any contagion effects.
Austerity measures in the first instance
reduce demand and GDP growth. But they
are necessary to rebuild confidence in the
sustainability of public finances. If they
are effective in achieving this, they
will have a positive impact on business
As fiscal policy is under the direct
control of national governments, we need
not only enhanced monitoring, but also
reinforced fiscal policy commitment pro-
cedures within the euro area. A number
of countries still face a massive task in
getting their public finances back in or-
der. Any retreat or perceived problems in
progressing on this front is likely to weigh
down the euro. Forceful and credible
consolidation and reform programmes
48
Allia
nz E
cono
mic
Rese
arch
& C
orpo
rate
Dev
elop
men
t
expectations and medium-term growth.
This is all the more true if they are ac-
companied by structural reforms. The
scope of structural reforms could certain-
ly be extended in most member countries.
For years now, the Stability and
Growth Pact (SGP) – which was supposed
to enforce fiscal discipline – has been re-
peatedly breached without consequences.
To be absolutely sure that fiscal aberra-
tions are not seen again, the Stability Pact
rules and implementation mechanisms
need to be improved. The primary goal of
a wide-ranging reform of the SGP
must be to reduce eurozone debt levels,
which will average close to 85% of GDP
this year, way above the 60% limit. In
addition, sanctions should kick in au-
tomatically if a country strays off track.
It makes no sense to impose sanctions
once disaster has already struck.
The fiscal tightening however needs
to be complemented by policy measures
targeting the other categories covered
by the Euro Monitor. There is a press-
ing need for improvement not only with
regard to state finances, but first and
foremost in the fields of structural com-
petitiveness and productivity as well.
In this context, we appreciate
the legislative package adopted by the EU
Commission in September, containing
widespread reinforcement of economic
governance in the EU and the euro area.15
The legislative package is made up
of six pieces of legislation. Four proposals
deal with fiscal issues, including a wide-
ranging reform of the SGP. According to
the Commission, the SGP is to become
more rule-based. Furthermore, sanc-
tions are to be the normal consequence
to expect for countries in breach of their
commitments. Apart from tackling fiscal
issues, the EU Commission’s legislative
package includes two new regulations
aimed at detecting and addressing
effectively emerging macroeconomic
imbalances within the EU and the euro
area. For eurozone countries with se-
vere imbalances or imbalances that
put at risk the functioning of EMU, the
Economic and Financial Affairs Coun-
cil (ECOFIN) intends not only to adopt
preventive recommendations but also
to open a so-called Excessive Imbalance
Procedure (EIP). We think that the EIP
proposed by the EU Commission provides
a good tool for preventing and correcting
imbalances. Just as in the fiscal field, a
country will have to pay a fine if it repeat-
edly fails to act on European Commis-
sion recommendations to address its
excessive macroeconomic imbalances.
15 http://ec.europa.eu/economy_finance/articles/eu_economic_situation/2010-09-eu_economic_governance_proposals_en.htm.

49
The efforts currently evident on the
economic policy front are going in the
right direction and will strengthen the
euro in the long term. Nevertheless,
we must keep in mind that new sources of
growth will be equally important – if
not more important – to the survival of
the eurozone in the long run. Political
leaders must not assume that a new,
improved governance structure will
solve the current crisis, as the underlying
imbalances that have been highlighted in
the Euro Monitor will take resolute
action, decisive leadership and com-
mon determination to resolve.

50
Allia
nz E
cono
mic
Rese
arch
& C
orpo
rate
Dev
elop
men
t
appendix
51
Scaling
For each indicator the countries
are rated on a scale from 1 to 10:
• Ratings from 1 to 4 are con-
sidered poor performance
• Ratings from 5 to 7 are consid-
ered middling performance
• Ratings from 8 to 10 are con-
sidered good performance
The scales define which value is
translated into what rating score. For ex-
ample on indicator 1a a gross government
debt ratio which is greater than
or equal to 60% but smaller than 70% is
rated with 7. So the Netherlands, which
reported a gross government debt
ratio of 60.9% in 2009, is rated with 7 for
that year, while in 2008 it achieved
a rating of 8 in line with a debt ratio
of 58.2%.
On the following pages the scales for
each indicator are listed as well as
the Euro Monitor country ratings for 2010
to 2005.
52
Allia
nz E
cono
mic
Rese
arch
& C
orpo
rate
Dev
elop
men
t
1a Gross government debt, as % of GDP
% Rating40 > x 10
50 > x ≥ 40 9
60 > x ≥ 50 8
70 > x ≥ 60 7
80 > x ≥ 70 6
90 > x ≥ 80 5
100 > x ≥ 90 4
110 > x ≥100 3
120 > x ≥110 2
x ≥120 1
2a Unit labour costs, total economy, deviation from the target path of 1.5% rise per year in index points
index points Rating0 > x 10
3 > x ≥ 0 9
6 > x ≥ 3 8
9 > x ≥ 6 7
12 > x ≥ 9 6
15 > x ≥ 12 5
18 > x ≥ 15 4
21 > x ≥ 18 3
24 > x ≥ 21 2
x ≥ 24 1
1b General government deficit/ surplus, as % of GDP
% Ratingx ≥ 0 10
0 > x ≥-1 9
-1 > x ≥-2 8
-2 > x ≥-3 7
-3 > x ≥-4 6
-4 > x ≥-5 5
-5 > x ≥-6 4
-6 > x ≥-7 3
-7 > x ≥-8 2
-8 > x 1
2b Current account balance, as % of GDP
% Ratingx ≥-1 10
-1 > x ≥-2 9
-2 > x ≥-3 8
-3 > x ≥-4 7
-4 > x ≥-5 6
-5 > x ≥-6 5
-6 > x ≥-7 4
-7 > x ≥-8 3
-8 > x ≥-9 2
-9 > x 1
1c General government interest payments, as % of total govern-ment expenditure
% Rating3 > x 10
4 > x ≥ 3 9
5 > x ≥ 4 8
6 > x ≥ 5 7
7 > x ≥ 6 6
8 > x ≥ 7 5
9 > x ≥ 8 4
10 > x ≥ 9 3
11 > x ≥ 10 2
x ≥ 11 1
2c Global merchandise trade shares, exports, deviation from base year 2000 in percent
% Ratingx ≥ 10 10
10 > x ≥ 5 9
5 > x ≥ 0 8
0 > x ≥-5 7
-5 > x ≥-10 6
-10 > x ≥-15 5
-15 > x ≥-20 4
-20 > x ≥-25 3
-25 > x ≥-30 2
-30 >x 1
1d Required adjustment in the primary balance due to demographic ageing in percentage points
%-points Rating0.0 > x 10
0.5 > x ≥ 0.0 9
1.0 > x ≥ 0.5 8
1.5 > x ≥ 1.0 7
2.0 > x ≥ 1.5 6
2.5 > x ≥ 2.0 5
3.0 > x ≥ 2.5 4
3.5 > x ≥ 3.0 3
4.0 > x ≥ 3.5 2
x ≥ 4.0 1
2d Domestic demand, Index 2000=100, average annual change over the last five years
% Ratingx ≥ 3 10
3.0 > x ≥ 2.5 9
2.5 > x ≥ 2.0 8
2.0 > x ≥ 1.5 7
1.5 > x ≥ 1.0 6
1.0 > x ≥ 0.5 5
0.5 > x ≥ 0.0 4
0.0 > x ≥-0.5 3
-0.5 > x ≥-1.0 2
-1.0 > x 1
Indicator Rating Spectrum
53
3a Harmonised unemployment rate, %
% Rating4 > x 10
5 > x ≥ 4 9
6 > x ≥ 5 8
7 > x ≥ 6 7
8 > x ≥ 7 6
9 > x ≥ 8 5
10 > x ≥ 9 4
11 > x ≥ 10 3
12 > x ≥ 11 2
x ≥ 12 1
4a Debt-to-GDP ratio of households, change over five years in per-centage points
%-points Rating-10 > x 10
-5 > x ≥-10 9
0 > x ≥-5 8
5 > x ≥ 0 7
10 > x ≥ 5 6
15 > x ≥ 10 5
20 > x ≥ 15 4
25 > x ≥ 20 3
30 > x ≥ 25 2
x ≥ 30 1
3b Employment ratio, change over five years in percentage points
%-points Ratingx ≥ 4 10
4 > x ≥ 3 9
3 > x ≥ 2 8
2 > x ≥ 1 7
1 > x ≥ 0 6
0 > x ≥-1 5
-1 > x ≥-2 4
-2 > x ≥-3 3
-3 > x ≥-4 2
-4 > x 1
4b Debt-to-GDP of non-financial corporations, change over five years in percentage points
%-points Rating-10 > x 10
-5 > x ≥-10 9
0 > x ≥-5 8
5 > x ≥ 0 7
10 > x ≥ 5 6
15 > x ≥ 10 5
20 > x ≥ 15 4
25 > x ≥ 20 3
30 > x ≥ 25 2
x ≥ 30 1
3c Labour productivity per person employed, average annual change over the last five years
% Ratingx ≥3 10
3.0 > x ≥ 2.5 9
2.5 > x ≥ 2.0 8
2.0 > x ≥ 1.5 7
1.5 > x ≥ 1.0 6
1.0 > x ≥ 0.5 5
0.5 > x ≥ 0.0 4
0.0 > x ≥-0.5 3
-0.5 > x ≥-1.0 2
-1.0 > x 1
4c Net international investment position, as % of GDP
% Ratingx ≥20 10
20 > x ≥ 0 9
0 > x ≥-20 8
-20 > x ≥-30 7
-30 > x ≥-40 6
-40 > x ≥-50 5
-50 > x ≥-60 4
-60 > x ≥-70 3
-70 > x ≥-80 2
-80 > x 1
3d Gross inland consump-tion of energy divided by GDP (kilogram of oil equivalent per EUR 1000)
kg/EUR 1000 Rating100 > x 10
120 > x ≥ 100 9
140 > x ≥ 120 8
160 > x ≥ 140 7
180 > x ≥ 160 6
200 > x ≥ 180 5
220 > x ≥ 200 4
240 > x ≥ 220 3
260 > x ≥ 240 2
x ≥ 260 1
54
Allia
nz E
cono
mic
Rese
arch
& C
orpo
rate
Dev
elop
men
t
Euro Monitor 2005-2010 Country Rating 2010
Coun
try C
ode
Euro
pean
Mon
etar
y Un
ion
Mem
ber S
tate
s
(1a)
Gov
ernm
ent d
ebt
(1b)
Gov
ernm
ent d
efici
t/ su
rplu
s
(1c)
Gov
ernm
ent i
nter
est p
aym
ents
(1d)
Req
uire
d ad
just
men
t in
the
prim
ary b
alan
ce
(2a)
Uni
t lab
our c
osts
(2b)
Cur
rent
acc
ount
bal
ance
(2c)
Glo
bal m
erch
andi
se tr
ade
shar
e
(2d)
Dom
estic
dem
and
(3a)
Une
mpl
oym
ent r
ate
(3b)
Em
ploy
men
t rat
io
(3c)
Labo
ur p
rodu
ctiv
ity
(3d)
Inla
nd co
nsum
ptio
n of
ene
rgy
(4a)
Deb
t-to-
GDP
ratio
of h
ouse
hold
s
(4b)
Deb
t-to-
GDP
of n
on-fi
n co
rpor
atio
ns
(4c)
Inte
rnat
iona
l inve
stm
ent p
ositi
on
Sum
ove
r all i
ndic
ator
s
Num
ber o
f ind
icat
ors o
bser
ved
(C1)
Fisc
al S
usta
inab
ility
= su
m 1a
-1d
/ obs
1a -
1d
(C2)
Com
petit
ivene
ss an
d do
mes
tic d
eman
d =
sum
2a
- 2d
/ obs
2a
- 2d
(C3)
Jobs
, Pro
duct
ivity
and
Reso
urce
Effic
ienc
y =
sum
3a
- 3d
/ obs
3a
- 3d
(C4)
Priv
ate
and
Fore
ign
Debt
=
sum
4a-
4c /
obs 4
a- 4
c
Mon
itor R
atin
g =
sum
/ ob
s
Euro
Mon
itor R
ankin
g
1a 1b 1c 1d 2a 2b 2c 2d 3a 3b 3c 3d 4a 4b 4c sum obs C1 C2 C3 C4 EM10 Rank
DE Germany 6 6 7 5 10 10 8 6 6 10 4 7 9 7 10 111 15 6.0 8.5 6.8 8.7 7.40 1.
AT Austria 7 5 7 5 10 10 8 5 9 9 5 8 8 6 8 110 15 6.0 8.3 7.8 7.3 7.33 2.
LU Luxembourg 10 7 10 1 3 10 10 6 8 7 2 7 # # 10 91 13 7.0 7.3 6.0 # 7.00 3.
NL Netherlands 7 4 8 2 7 10 9 6 9 9 5 6 4 9 10 105 15 5.3 8.0 7.3 7.7 7.00 3.
SK Slovakia 9 2 9 6 4 8 10 10 1 7 10 1 3 6 2 88 15 6.5 8.0 4.8 3.7 5.87 5.
BE Belgium 4 4 5 2 7 10 7 6 5 6 4 5 5 4 10 84 15 3.8 7.5 5.0 6.3 5.60 6.
SL Slovenia 9 4 9 1 1 9 10 7 7 7 6 2 5 1 6 84 15 5.8 6.8 5.5 4.0 5.60 6.
FI Finland 8 6 10 2 8 10 1 5 5 5 5 4 4 2 8 83 15 6.5 6.0 4.8 4.7 5.53 8.
FR France 5 2 8 7 8 9 2 6 3 6 4 6 5 4 8 83 15 5.5 6.3 4.8 5.7 5.53 8.
IT Italy 2 5 4 7 4 8 4 3 5 5 2 8 6 4 7 74 15 4.5 4.8 5.0 5.7 4.93 10.
MT Malta 6 6 5 3 5 6 1 4 7 7 4 5 # # # 59 12 5.0 4.0 5.8 # 4.92 11.
CY Cyprus 7 3 7 1 2 4 1 9 6 6 5 4 # # # 55 12 4.5 4.0 5.3 # 4.58 12.
PT Portugal 5 2 6 7 6 2 5 4 3 4 5 6 4 1 1 61 15 5.0 4.3 4.5 2.0 4.07 13.
ES Spain 7 1 8 2 5 6 6 4 1 1 6 6 5 1 1 60 15 4.5 5.3 3.5 2.3 4.00 14.
IE Ireland 4 1 7 2 5 10 2 1 1 1 6 9 1 1 2 53 15 3.5 4.5 4.3 1.3 3.53 15.
GR Greece 1 2 1 1 4 1 4 4 2 5 6 6 3 3 1 44 15 1.3 3.3 4.8 2.3 2.93 16.
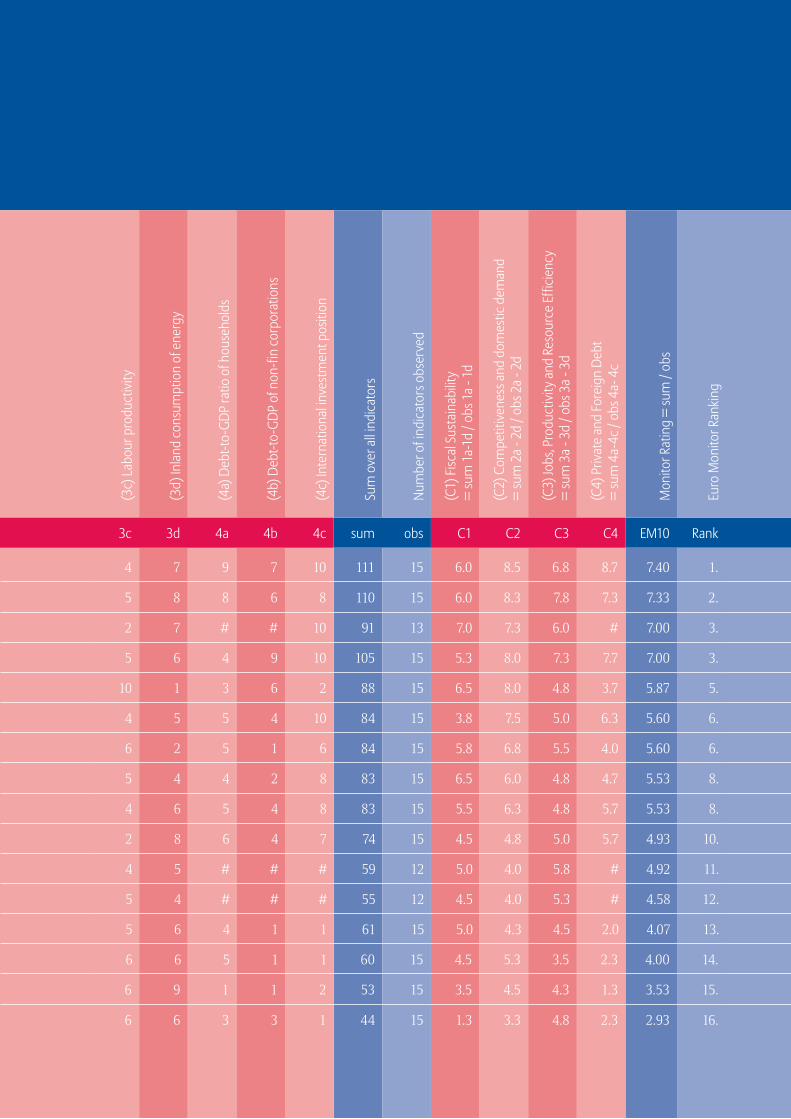
55
Euro Monitor 2005-2010 Country Rating 2010
Coun
try C
ode
Euro
pean
Mon
etar
y Un
ion
Mem
ber S
tate
s
(1a)
Gov
ernm
ent d
ebt
(1b)
Gov
ernm
ent d
efici
t/ su
rplu
s
(1c)
Gov
ernm
ent i
nter
est p
aym
ents
(1d)
Req
uire
d ad
just
men
t in
the
prim
ary b
alan
ce
(2a)
Uni
t lab
our c
osts
(2b)
Cur
rent
acc
ount
bal
ance
(2c)
Glo
bal m
erch
andi
se tr
ade
shar
e
(2d)
Dom
estic
dem
and
(3a)
Une
mpl
oym
ent r
ate
(3b)
Em
ploy
men
t rat
io
(3c)
Labo
ur p
rodu
ctiv
ity
(3d)
Inla
nd co
nsum
ptio
n of
ene
rgy
(4a)
Deb
t-to-
GDP
ratio
of h
ouse
hold
s
(4b)
Deb
t-to-
GDP
of n
on-fi
n co
rpor
atio
ns
(4c)
Inte
rnat
iona
l inve
stm
ent p
ositi
on
Sum
ove
r all i
ndic
ator
s
Num
ber o
f ind
icat
ors o
bser
ved
(C1)
Fisc
al S
usta
inab
ility
= su
m 1a
-1d
/ obs
1a -
1d
(C2)
Com
petit
ivene
ss an
d do
mes
tic d
eman
d =
sum
2a
- 2d
/ obs
2a
- 2d
(C3)
Jobs
, Pro
duct
ivity
and
Reso
urce
Effic
ienc
y =
sum
3a
- 3d
/ obs
3a
- 3d
(C4)
Priv
ate
and
Fore
ign
Debt
=
sum
4a-
4c /
obs 4
a- 4
c
Mon
itor R
atin
g =
sum
/ ob
s
Euro
Mon
itor R
ankin
g
1a 1b 1c 1d 2a 2b 2c 2d 3a 3b 3c 3d 4a 4b 4c sum obs C1 C2 C3 C4 EM10 Rank
DE Germany 6 6 7 5 10 10 8 6 6 10 4 7 9 7 10 111 15 6.0 8.5 6.8 8.7 7.40 1.
AT Austria 7 5 7 5 10 10 8 5 9 9 5 8 8 6 8 110 15 6.0 8.3 7.8 7.3 7.33 2.
LU Luxembourg 10 7 10 1 3 10 10 6 8 7 2 7 # # 10 91 13 7.0 7.3 6.0 # 7.00 3.
NL Netherlands 7 4 8 2 7 10 9 6 9 9 5 6 4 9 10 105 15 5.3 8.0 7.3 7.7 7.00 3.
SK Slovakia 9 2 9 6 4 8 10 10 1 7 10 1 3 6 2 88 15 6.5 8.0 4.8 3.7 5.87 5.
BE Belgium 4 4 5 2 7 10 7 6 5 6 4 5 5 4 10 84 15 3.8 7.5 5.0 6.3 5.60 6.
SL Slovenia 9 4 9 1 1 9 10 7 7 7 6 2 5 1 6 84 15 5.8 6.8 5.5 4.0 5.60 6.
FI Finland 8 6 10 2 8 10 1 5 5 5 5 4 4 2 8 83 15 6.5 6.0 4.8 4.7 5.53 8.
FR France 5 2 8 7 8 9 2 6 3 6 4 6 5 4 8 83 15 5.5 6.3 4.8 5.7 5.53 8.
IT Italy 2 5 4 7 4 8 4 3 5 5 2 8 6 4 7 74 15 4.5 4.8 5.0 5.7 4.93 10.
MT Malta 6 6 5 3 5 6 1 4 7 7 4 5 # # # 59 12 5.0 4.0 5.8 # 4.92 11.
CY Cyprus 7 3 7 1 2 4 1 9 6 6 5 4 # # # 55 12 4.5 4.0 5.3 # 4.58 12.
PT Portugal 5 2 6 7 6 2 5 4 3 4 5 6 4 1 1 61 15 5.0 4.3 4.5 2.0 4.07 13.
ES Spain 7 1 8 2 5 6 6 4 1 1 6 6 5 1 1 60 15 4.5 5.3 3.5 2.3 4.00 14.
IE Ireland 4 1 7 2 5 10 2 1 1 1 6 9 1 1 2 53 15 3.5 4.5 4.3 1.3 3.53 15.
GR Greece 1 2 1 1 4 1 4 4 2 5 6 6 3 3 1 44 15 1.3 3.3 4.8 2.3 2.93 16.

56
Allia
nz E
cono
mic
Rese
arch
& C
orpo
rate
Dev
elop
men
t
Euro Monitor 2005-2010 Country Rating 2009
Coun
try C
ode
Euro
pean
Mon
etar
y Un
ion
Mem
ber S
tate
s
(1a)
Gov
ernm
ent d
ebt
(1b)
Gov
ernm
ent d
efici
t/ su
rplu
s
(1c)
Gov
ernm
ent i
nter
est p
aym
ents
(1d)
Req
uire
d ad
just
men
t in
the
prim
ary b
alan
ce
(2a)
Uni
t lab
our c
osts
(2b)
Cur
rent
acc
ount
bal
ance
(2c)
Glo
bal m
erch
andi
se tr
ade
shar
e
(2d)
Dom
estic
dem
and
(3a)
Une
mpl
oym
ent r
ate
(3b)
Em
ploy
men
t rat
io
(3c)
Labo
ur p
rodu
ctiv
ity
(3d)
Inla
nd co
nsum
ptio
n of
ene
rgy
(4a)
Deb
t-to-
GDP
ratio
of h
ouse
hold
s
(4b)
Deb
t-to-
GDP
of n
on-fi
n co
rpor
atio
ns
(4c)
Inte
rnat
iona
l inve
stm
ent p
ositi
on
Sum
ove
r all i
ndic
ator
s
Num
ber o
f ind
icat
ors o
bser
ved
(C1)
Fisc
al S
usta
inab
ility
= su
m 1a
-1d
/ obs
1a -
1d
(C2)
Com
petit
ivene
ss an
d do
mes
tic d
eman
d =
sum
2a
- 2d
/ obs
2a
- 2d
(C3)
Jobs
, Pro
duct
ivity
and
Reso
urce
Effic
ienc
y =
sum
3a
- 3d
/ obs
3a
- 3d
(C4)
Priv
ate
and
Fore
ign
Debt
=
sum
4a-
4c /
obs 4
a- 4
c
Mon
itor R
atin
g =
sum
/ ob
s
Euro
Mon
itor R
ankin
g
1a 1b 1c 1d 2a 2b 2c 2d 3a 3b 3c 3d 4a 4b 4c sum obs C1 C2 C3 C4 EM10 Rank
DE Germany 6 7 7 5 10 10 9 5 6 10 3 7 9 7 10 111 15 6.3 8.5 6.5 8.7 7.40 1.
AT Austria 7 6 7 5 9 10 8 6 9 10 4 8 7 6 8 110 15 6.3 8.3 7.8 7.0 7.33 2.
LU Luxembourg 10 9 10 1 3 10 10 7 8 8 2 7 # # 10 95 13 7.5 7.5 6.3 # 7.31 3.
NL Netherlands 7 4 8 2 6 10 10 6 10 9 4 6 3 9 10 104 15 5.3 8.0 7.3 7.3 6.93 4.
SK Slovakia 10 3 9 6 3 7 10 10 1 9 10 1 2 7 3 91 15 7.0 7.5 5.3 4.0 6.07 5.
BE Belgium 4 4 6 2 7 10 8 6 6 7 4 5 5 5 10 89 15 4.0 7.8 5.5 6.7 5.93 6.
SL Slovenia 10 4 10 1 1 9 10 7 8 7 6 2 5 1 6 87 15 6.3 6.8 5.8 4.0 5.80 7.
FI Finland 9 7 10 2 6 10 2 6 5 6 4 4 3 3 8 85 15 7.0 6.0 4.8 4.7 5.67 8.
FR France 6 2 8 7 7 9 3 6 4 6 4 6 5 4 8 85 15 5.8 6.3 5.0 5.7 5.67 8.
MT Malta 7 6 5 3 5 6 1 6 7 7 5 5 # # # 63 12 5.3 4.5 6.0 # 5.25 10.
CY Cyprus 8 3 7 1 3 2 1 10 8 6 5 4 # # # 58 12 4.8 4.0 5.8 # 4.83 11.
IT Italy 2 4 4 7 4 7 5 3 6 5 2 7 5 4 7 72 15 4.3 4.8 5.0 5.3 4.80 12.
ES Spain 8 1 9 2 4 5 7 6 1 4 5 6 4 1 1 64 15 5.0 5.5 4.0 2.0 4.27 13.
PT Portugal 6 1 7 7 5 1 6 4 4 4 5 6 3 1 1 61 15 5.3 4.0 4.8 1.7 4.07 14.
IE Ireland 7 1 8 2 4 7 3 3 2 2 5 9 1 1 4 59 15 4.5 4.3 4.5 2.0 3.93 15.
GR Greece 2 1 3 1 3 1 5 7 4 7 7 6 2 3 1 53 15 1.8 4.0 6.0 2.0 3.53 16.

57
Euro Monitor 2005-2010 Country Rating 2009
Coun
try C
ode
Euro
pean
Mon
etar
y Un
ion
Mem
ber S
tate
s
(1a)
Gov
ernm
ent d
ebt
(1b)
Gov
ernm
ent d
efici
t/ su
rplu
s
(1c)
Gov
ernm
ent i
nter
est p
aym
ents
(1d)
Req
uire
d ad
just
men
t in
the
prim
ary b
alan
ce
(2a)
Uni
t lab
our c
osts
(2b)
Cur
rent
acc
ount
bal
ance
(2c)
Glo
bal m
erch
andi
se tr
ade
shar
e
(2d)
Dom
estic
dem
and
(3a)
Une
mpl
oym
ent r
ate
(3b)
Em
ploy
men
t rat
io
(3c)
Labo
ur p
rodu
ctiv
ity
(3d)
Inla
nd co
nsum
ptio
n of
ene
rgy
(4a)
Deb
t-to-
GDP
ratio
of h
ouse
hold
s
(4b)
Deb
t-to-
GDP
of n
on-fi
n co
rpor
atio
ns
(4c)
Inte
rnat
iona
l inve
stm
ent p
ositi
on
Sum
ove
r all i
ndic
ator
s
Num
ber o
f ind
icat
ors o
bser
ved
(C1)
Fisc
al S
usta
inab
ility
= su
m 1a
-1d
/ obs
1a -
1d
(C2)
Com
petit
ivene
ss an
d do
mes
tic d
eman
d =
sum
2a
- 2d
/ obs
2a
- 2d
(C3)
Jobs
, Pro
duct
ivity
and
Reso
urce
Effic
ienc
y =
sum
3a
- 3d
/ obs
3a
- 3d
(C4)
Priv
ate
and
Fore
ign
Debt
=
sum
4a-
4c /
obs 4
a- 4
c
Mon
itor R
atin
g =
sum
/ ob
s
Euro
Mon
itor R
ankin
g
1a 1b 1c 1d 2a 2b 2c 2d 3a 3b 3c 3d 4a 4b 4c sum obs C1 C2 C3 C4 EM10 Rank
DE Germany 6 7 7 5 10 10 9 5 6 10 3 7 9 7 10 111 15 6.3 8.5 6.5 8.7 7.40 1.
AT Austria 7 6 7 5 9 10 8 6 9 10 4 8 7 6 8 110 15 6.3 8.3 7.8 7.0 7.33 2.
LU Luxembourg 10 9 10 1 3 10 10 7 8 8 2 7 # # 10 95 13 7.5 7.5 6.3 # 7.31 3.
NL Netherlands 7 4 8 2 6 10 10 6 10 9 4 6 3 9 10 104 15 5.3 8.0 7.3 7.3 6.93 4.
SK Slovakia 10 3 9 6 3 7 10 10 1 9 10 1 2 7 3 91 15 7.0 7.5 5.3 4.0 6.07 5.
BE Belgium 4 4 6 2 7 10 8 6 6 7 4 5 5 5 10 89 15 4.0 7.8 5.5 6.7 5.93 6.
SL Slovenia 10 4 10 1 1 9 10 7 8 7 6 2 5 1 6 87 15 6.3 6.8 5.8 4.0 5.80 7.
FI Finland 9 7 10 2 6 10 2 6 5 6 4 4 3 3 8 85 15 7.0 6.0 4.8 4.7 5.67 8.
FR France 6 2 8 7 7 9 3 6 4 6 4 6 5 4 8 85 15 5.8 6.3 5.0 5.7 5.67 8.
MT Malta 7 6 5 3 5 6 1 6 7 7 5 5 # # # 63 12 5.3 4.5 6.0 # 5.25 10.
CY Cyprus 8 3 7 1 3 2 1 10 8 6 5 4 # # # 58 12 4.8 4.0 5.8 # 4.83 11.
IT Italy 2 4 4 7 4 7 5 3 6 5 2 7 5 4 7 72 15 4.3 4.8 5.0 5.3 4.80 12.
ES Spain 8 1 9 2 4 5 7 6 1 4 5 6 4 1 1 64 15 5.0 5.5 4.0 2.0 4.27 13.
PT Portugal 6 1 7 7 5 1 6 4 4 4 5 6 3 1 1 61 15 5.3 4.0 4.8 1.7 4.07 14.
IE Ireland 7 1 8 2 4 7 3 3 2 2 5 9 1 1 4 59 15 4.5 4.3 4.5 2.0 3.93 15.
GR Greece 2 1 3 1 3 1 5 7 4 7 7 6 2 3 1 53 15 1.8 4.0 6.0 2.0 3.53 16.

58
Allia
nz E
cono
mic
Rese
arch
& C
orpo
rate
Dev
elop
men
t
Euro Monitor 2005-2010 Country Rating 2008
Coun
try C
ode
Euro
pean
Mon
etar
y Un
ion
Mem
ber S
tate
s
(1a)
Gov
ernm
ent d
ebt
(1b)
Gov
ernm
ent d
efici
t/ su
rplu
s
(1c)
Gov
ernm
ent i
nter
est p
aym
ents
(1d)
Req
uire
d ad
just
men
t in
the
prim
ary b
alan
ce
(2a)
Uni
t lab
our c
osts
(2b)
Cur
rent
acc
ount
bal
ance
(2c)
Glo
bal m
erch
andi
se tr
ade
shar
e
(2d)
Dom
estic
dem
and
(3a)
Une
mpl
oym
ent r
ate
(3b)
Em
ploy
men
t rat
io
(3c)
Labo
ur p
rodu
ctiv
ity
(3d)
Inla
nd co
nsum
ptio
n of
ene
rgy
(4a)
Deb
t-to-
GDP
ratio
of h
ouse
hold
s
(4b)
Deb
t-to-
GDP
of n
on-fi
n co
rpor
atio
ns
(4c)
Inte
rnat
iona
l inve
stm
ent p
ositi
on
Sum
ove
r all i
ndic
ator
s
Num
ber o
f ind
icat
ors o
bser
ved
(C1)
Fisc
al S
usta
inab
ility
= su
m 1a
-1d
/ obs
1a -
1d
(C2)
Com
petit
ivene
ss an
d do
mes
tic d
eman
d =
sum
2a
- 2d
/ obs
2a
- 2d
(C3)
Jobs
, Pro
duct
ivity
and
Reso
urce
Effic
ienc
y =
sum
3a
- 3d
/ obs
3a
- 3d
(C4)
Priv
ate
and
Fore
ign
Debt
=
sum
4a-
4c /
obs 4
a- 4
c
Mon
itor R
atin
g =
sum
/ ob
s
Euro
Mon
itor R
ankin
g
1a 1b 1c 1d 2a 2b 2c 2d 3a 3b 3c 3d 4a 4b 4c sum obs C1 C2 C3 C4 EM10 Rank
AT Austria 7 9 7 6 10 10 9 7 10 9 6 8 7 7 8 120 15 7.3 9.0 8.3 7.3 8.00 1.
LU Luxembourg 10 10 10 1 5 10 10 10 9 7 5 7 # # 10 104 13 7.8 8.8 7.0 # 8.00 1.
DE Germany 7 10 6 6 10 10 9 5 6 10 5 7 10 8 10 119 15 7.3 8.5 7.0 9.3 7.93 3.
NL Netherlands 8 10 8 2 8 10 9 8 10 9 7 6 4 9 9 117 15 7.0 8.8 8.0 7.3 7.80 4.
FI Finland 10 10 10 2 9 10 4 10 7 8 8 4 4 3 8 107 15 8.0 8.3 6.8 5.0 7.13 5.
SK Slovakia 10 7 9 7 5 4 10 10 4 10 10 1 3 8 4 102 15 8.3 7.3 6.3 5.0 6.80 6.
BE Belgium 5 8 5 2 8 8 8 9 6 9 5 5 6 5 10 99 15 5.0 8.3 6.3 7.0 6.60 7.
SL Slovenia 10 8 10 1 1 4 10 10 9 10 10 2 6 1 6 98 15 7.3 6.3 7.8 4.3 6.53 8.
FR France 7 6 7 6 8 9 2 8 6 7 6 6 5 4 8 95 15 6.5 6.8 6.3 5.7 6.33 9.
CY Cyprus 9 10 6 1 5 1 1 10 10 7 6 4 # # # 70 12 6.5 4.3 6.8 # 5.83 10.
MT Malta 7 5 5 5 6 5 1 9 8 6 6 5 # # # 68 12 5.5 5.3 6.3 # 5.67 11.
IT Italy 3 7 2 7 5 7 5 5 7 8 3 7 5 4 7 82 15 4.8 5.5 6.3 5.3 5.47 12.
IE Ireland 9 2 9 2 3 5 1 10 7 8 5 9 1 1 4 76 15 5.5 4.8 7.3 2.0 5.07 13.
ES Spain 10 5 9 2 4 1 7 10 2 10 4 6 3 1 1 75 15 6.5 5.5 5.5 1.7 5.00 14.
PT Portugal 7 7 6 5 6 1 6 7 6 6 6 5 3 2 1 74 15 6.3 5.0 5.8 2.0 4.93 15.
GR Greece 4 2 3 1 5 1 5 10 6 9 8 6 2 4 2 68 15 2.5 5.3 7.3 2.7 4.53 16.

59
Euro Monitor 2005-2010 Country Rating 2008
Coun
try C
ode
Euro
pean
Mon
etar
y Un
ion
Mem
ber S
tate
s
(1a)
Gov
ernm
ent d
ebt
(1b)
Gov
ernm
ent d
efici
t/ su
rplu
s
(1c)
Gov
ernm
ent i
nter
est p
aym
ents
(1d)
Req
uire
d ad
just
men
t in
the
prim
ary b
alan
ce
(2a)
Uni
t lab
our c
osts
(2b)
Cur
rent
acc
ount
bal
ance
(2c)
Glo
bal m
erch
andi
se tr
ade
shar
e
(2d)
Dom
estic
dem
and
(3a)
Une
mpl
oym
ent r
ate
(3b)
Em
ploy
men
t rat
io
(3c)
Labo
ur p
rodu
ctiv
ity
(3d)
Inla
nd co
nsum
ptio
n of
ene
rgy
(4a)
Deb
t-to-
GDP
ratio
of h
ouse
hold
s
(4b)
Deb
t-to-
GDP
of n
on-fi
n co
rpor
atio
ns
(4c)
Inte
rnat
iona
l inve
stm
ent p
ositi
on
Sum
ove
r all i
ndic
ator
s
Num
ber o
f ind
icat
ors o
bser
ved
(C1)
Fisc
al S
usta
inab
ility
= su
m 1a
-1d
/ obs
1a -
1d
(C2)
Com
petit
ivene
ss an
d do
mes
tic d
eman
d =
sum
2a
- 2d
/ obs
2a
- 2d
(C3)
Jobs
, Pro
duct
ivity
and
Reso
urce
Effic
ienc
y =
sum
3a
- 3d
/ obs
3a
- 3d
(C4)
Priv
ate
and
Fore
ign
Debt
=
sum
4a-
4c /
obs 4
a- 4
c
Mon
itor R
atin
g =
sum
/ ob
s
Euro
Mon
itor R
ankin
g
1a 1b 1c 1d 2a 2b 2c 2d 3a 3b 3c 3d 4a 4b 4c sum obs C1 C2 C3 C4 EM10 Rank
AT Austria 7 9 7 6 10 10 9 7 10 9 6 8 7 7 8 120 15 7.3 9.0 8.3 7.3 8.00 1.
LU Luxembourg 10 10 10 1 5 10 10 10 9 7 5 7 # # 10 104 13 7.8 8.8 7.0 # 8.00 1.
DE Germany 7 10 6 6 10 10 9 5 6 10 5 7 10 8 10 119 15 7.3 8.5 7.0 9.3 7.93 3.
NL Netherlands 8 10 8 2 8 10 9 8 10 9 7 6 4 9 9 117 15 7.0 8.8 8.0 7.3 7.80 4.
FI Finland 10 10 10 2 9 10 4 10 7 8 8 4 4 3 8 107 15 8.0 8.3 6.8 5.0 7.13 5.
SK Slovakia 10 7 9 7 5 4 10 10 4 10 10 1 3 8 4 102 15 8.3 7.3 6.3 5.0 6.80 6.
BE Belgium 5 8 5 2 8 8 8 9 6 9 5 5 6 5 10 99 15 5.0 8.3 6.3 7.0 6.60 7.
SL Slovenia 10 8 10 1 1 4 10 10 9 10 10 2 6 1 6 98 15 7.3 6.3 7.8 4.3 6.53 8.
FR France 7 6 7 6 8 9 2 8 6 7 6 6 5 4 8 95 15 6.5 6.8 6.3 5.7 6.33 9.
CY Cyprus 9 10 6 1 5 1 1 10 10 7 6 4 # # # 70 12 6.5 4.3 6.8 # 5.83 10.
MT Malta 7 5 5 5 6 5 1 9 8 6 6 5 # # # 68 12 5.5 5.3 6.3 # 5.67 11.
IT Italy 3 7 2 7 5 7 5 5 7 8 3 7 5 4 7 82 15 4.8 5.5 6.3 5.3 5.47 12.
IE Ireland 9 2 9 2 3 5 1 10 7 8 5 9 1 1 4 76 15 5.5 4.8 7.3 2.0 5.07 13.
ES Spain 10 5 9 2 4 1 7 10 2 10 4 6 3 1 1 75 15 6.5 5.5 5.5 1.7 5.00 14.
PT Portugal 7 7 6 5 6 1 6 7 6 6 6 5 3 2 1 74 15 6.3 5.0 5.8 2.0 4.93 15.
GR Greece 4 2 3 1 5 1 5 10 6 9 8 6 2 4 2 68 15 2.5 5.3 7.3 2.7 4.53 16.

60
Allia
nz E
cono
mic
Rese
arch
& C
orpo
rate
Dev
elop
men
t
Euro Monitor 2005-2010 Country Rating 2007
Coun
try C
ode
Euro
pean
Mon
etar
y Un
ion
Mem
ber S
tate
s
(1a)
Gov
ernm
ent d
ebt
(1b)
Gov
ernm
ent d
efici
t/ su
rplu
s
(1c)
Gov
ernm
ent i
nter
est p
aym
ents
(1d)
Req
uire
d ad
just
men
t in
the
prim
ary b
alan
ce
(2a)
Uni
t lab
our c
osts
(2b)
Cur
rent
acc
ount
bal
ance
(2c)
Glo
bal m
erch
andi
se tr
ade
shar
e
(2d)
Dom
estic
dem
and
(3a)
Une
mpl
oym
ent r
ate
(3b)
Em
ploy
men
t rat
io
(3c)
Labo
ur p
rodu
ctiv
ity
(3d)
Inla
nd co
nsum
ptio
n of
ene
rgy
(4a)
Deb
t-to-
GDP
ratio
of h
ouse
hold
s
(4b)
Deb
t-to-
GDP
of n
on-fi
n co
rpor
atio
ns
(4c)
Inte
rnat
iona
l inve
stm
ent p
ositi
on
Sum
ove
r all i
ndic
ator
s
Num
ber o
f ind
icat
ors o
bser
ved
(C1)
Fisc
al S
usta
inab
ility
= su
m 1a
-1d
/ obs
1a -
1d
(C2)
Com
petit
ivene
ss an
d do
mes
tic d
eman
d =
sum
2a
- 2d
/ obs
2a
- 2d
(C3)
Jobs
, Pro
duct
ivity
and
Reso
urce
Effic
ienc
y =
sum
3a
- 3d
/ obs
3a
- 3d
(C4)
Priv
ate
and
Fore
ign
Debt
=
sum
4a-
4c /
obs 4
a- 4
c
Mon
itor R
atin
g =
sum
/ ob
s
Euro
Mon
itor R
ankin
g
1a 1b 1c 1d 2a 2b 2c 2d 3a 3b 3c 3d 4a 4b 4c sum obs C1 C2 C3 C4 EM10 Rank
LU Luxembourg 10 10 10 1 7 10 10 10 9 6 7 7 # # 10 107 13 7.8 9.3 7.3 # 8.23 1.
AT Austria 8 9 7 7 10 10 10 8 9 9 6 7 7 7 8 122 15 7.8 9.5 7.8 7.3 8.13 2.
DE Germany 7 10 6 6 10 10 10 5 5 10 6 7 9 8 10 119 15 7.3 8.8 7.0 9.0 7.93 3.
NL Netherlands 9 10 8 3 8 10 9 7 10 7 7 6 3 9 9 115 15 7.5 8.5 7.5 7.0 7.67 4.
FI Finland 10 10 9 3 10 10 6 10 7 7 9 3 4 6 7 111 15 8.0 9.0 6.5 5.7 7.40 5.
SK Slovakia 10 8 8 7 6 5 10 10 2 10 10 1 4 8 5 104 15 8.3 7.8 5.8 5.7 6.93 6.
IE Ireland 10 10 10 2 4 5 2 10 9 10 7 9 1 6 8 103 15 8.0 5.3 8.8 5.0 6.87 7.
SL Slovenia 10 10 9 1 3 6 10 10 9 9 10 2 6 1 7 103 15 7.5 7.3 7.5 4.7 6.87 7.
BE Belgium 5 9 4 2 9 10 9 8 6 8 6 5 6 4 10 101 15 5.0 9.0 6.3 6.7 6.73 9.
FR France 7 7 7 6 8 10 3 9 5 7 6 6 4 6 8 99 15 6.8 7.5 6.0 6.0 6.60 10.
IT Italy 3 8 2 7 6 8 7 6 7 9 3 7 5 4 7 89 15 5.0 6.8 6.5 5.3 5.93 11.
MT Malta 7 7 5 6 7 4 1 10 7 5 6 5 # # # 70 12 6.3 5.5 5.8 # 5.83 12.
CY Cyprus 8 10 5 1 6 1 1 10 10 8 5 4 # # # 69 12 6.0 4.5 6.8 # 5.75 13.
ES Spain 10 10 8 2 5 1 8 10 5 10 3 5 2 1 2 82 15 7.5 6.0 5.8 1.7 5.47 14.
GR Greece 4 4 3 4 6 1 6 10 5 9 9 6 2 5 1 75 15 3.8 5.8 7.3 2.7 5.00 15.
PT Portugal 7 7 6 3 7 1 7 6 5 4 6 5 3 4 1 72 15 5.8 5.3 5.0 2.7 4.80 16.
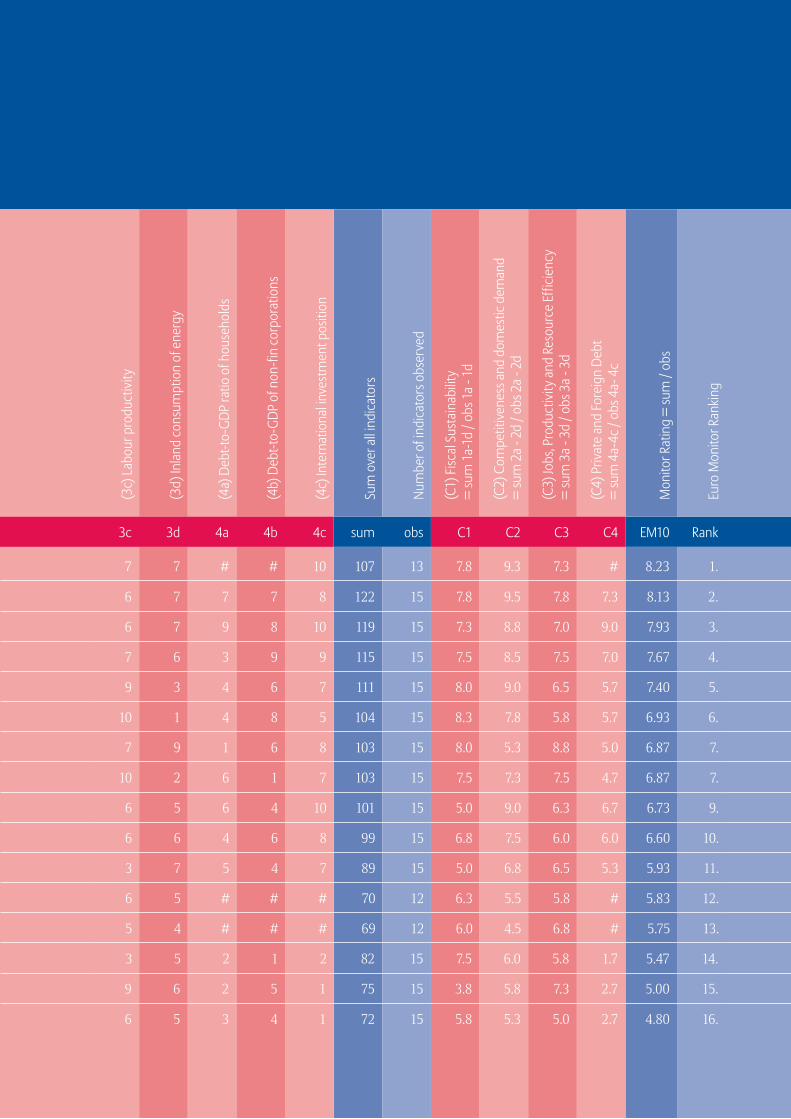
61
Euro Monitor 2005-2010 Country Rating 2007
Coun
try C
ode
Euro
pean
Mon
etar
y Un
ion
Mem
ber S
tate
s
(1a)
Gov
ernm
ent d
ebt
(1b)
Gov
ernm
ent d
efici
t/ su
rplu
s
(1c)
Gov
ernm
ent i
nter
est p
aym
ents
(1d)
Req
uire
d ad
just
men
t in
the
prim
ary b
alan
ce
(2a)
Uni
t lab
our c
osts
(2b)
Cur
rent
acc
ount
bal
ance
(2c)
Glo
bal m
erch
andi
se tr
ade
shar
e
(2d)
Dom
estic
dem
and
(3a)
Une
mpl
oym
ent r
ate
(3b)
Em
ploy
men
t rat
io
(3c)
Labo
ur p
rodu
ctiv
ity
(3d)
Inla
nd co
nsum
ptio
n of
ene
rgy
(4a)
Deb
t-to-
GDP
ratio
of h
ouse
hold
s
(4b)
Deb
t-to-
GDP
of n
on-fi
n co
rpor
atio
ns
(4c)
Inte
rnat
iona
l inve
stm
ent p
ositi
on
Sum
ove
r all i
ndic
ator
s
Num
ber o
f ind
icat
ors o
bser
ved
(C1)
Fisc
al S
usta
inab
ility
= su
m 1a
-1d
/ obs
1a -
1d
(C2)
Com
petit
ivene
ss an
d do
mes
tic d
eman
d =
sum
2a
- 2d
/ obs
2a
- 2d
(C3)
Jobs
, Pro
duct
ivity
and
Reso
urce
Effic
ienc
y =
sum
3a
- 3d
/ obs
3a
- 3d
(C4)
Priv
ate
and
Fore
ign
Debt
=
sum
4a-
4c /
obs 4
a- 4
c
Mon
itor R
atin
g =
sum
/ ob
s
Euro
Mon
itor R
ankin
g
1a 1b 1c 1d 2a 2b 2c 2d 3a 3b 3c 3d 4a 4b 4c sum obs C1 C2 C3 C4 EM10 Rank
LU Luxembourg 10 10 10 1 7 10 10 10 9 6 7 7 # # 10 107 13 7.8 9.3 7.3 # 8.23 1.
AT Austria 8 9 7 7 10 10 10 8 9 9 6 7 7 7 8 122 15 7.8 9.5 7.8 7.3 8.13 2.
DE Germany 7 10 6 6 10 10 10 5 5 10 6 7 9 8 10 119 15 7.3 8.8 7.0 9.0 7.93 3.
NL Netherlands 9 10 8 3 8 10 9 7 10 7 7 6 3 9 9 115 15 7.5 8.5 7.5 7.0 7.67 4.
FI Finland 10 10 9 3 10 10 6 10 7 7 9 3 4 6 7 111 15 8.0 9.0 6.5 5.7 7.40 5.
SK Slovakia 10 8 8 7 6 5 10 10 2 10 10 1 4 8 5 104 15 8.3 7.8 5.8 5.7 6.93 6.
IE Ireland 10 10 10 2 4 5 2 10 9 10 7 9 1 6 8 103 15 8.0 5.3 8.8 5.0 6.87 7.
SL Slovenia 10 10 9 1 3 6 10 10 9 9 10 2 6 1 7 103 15 7.5 7.3 7.5 4.7 6.87 7.
BE Belgium 5 9 4 2 9 10 9 8 6 8 6 5 6 4 10 101 15 5.0 9.0 6.3 6.7 6.73 9.
FR France 7 7 7 6 8 10 3 9 5 7 6 6 4 6 8 99 15 6.8 7.5 6.0 6.0 6.60 10.
IT Italy 3 8 2 7 6 8 7 6 7 9 3 7 5 4 7 89 15 5.0 6.8 6.5 5.3 5.93 11.
MT Malta 7 7 5 6 7 4 1 10 7 5 6 5 # # # 70 12 6.3 5.5 5.8 # 5.83 12.
CY Cyprus 8 10 5 1 6 1 1 10 10 8 5 4 # # # 69 12 6.0 4.5 6.8 # 5.75 13.
ES Spain 10 10 8 2 5 1 8 10 5 10 3 5 2 1 2 82 15 7.5 6.0 5.8 1.7 5.47 14.
GR Greece 4 4 3 4 6 1 6 10 5 9 9 6 2 5 1 75 15 3.8 5.8 7.3 2.7 5.00 15.
PT Portugal 7 7 6 3 7 1 7 6 5 4 6 5 3 4 1 72 15 5.8 5.3 5.0 2.7 4.80 16.
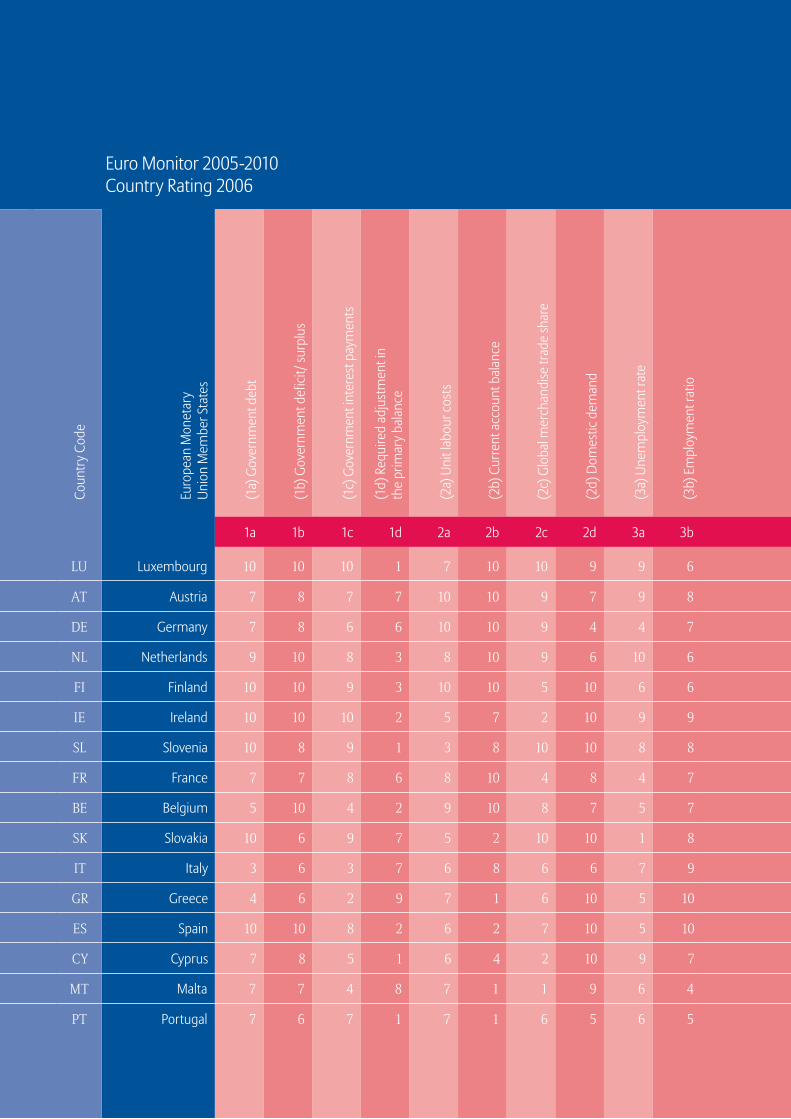
62
Allia
nz E
cono
mic
Rese
arch
& C
orpo
rate
Dev
elop
men
t
Euro Monitor 2005-2010 Country Rating 2006
Coun
try C
ode
Euro
pean
Mon
etar
y Un
ion
Mem
ber S
tate
s
(1a)
Gov
ernm
ent d
ebt
(1b)
Gov
ernm
ent d
efici
t/ su
rplu
s
(1c)
Gov
ernm
ent i
nter
est p
aym
ents
(1d)
Req
uire
d ad
just
men
t in
the
prim
ary b
alan
ce
(2a)
Uni
t lab
our c
osts
(2b)
Cur
rent
acc
ount
bal
ance
(2c)
Glo
bal m
erch
andi
se tr
ade
shar
e
(2d)
Dom
estic
dem
and
(3a)
Une
mpl
oym
ent r
ate
(3b)
Em
ploy
men
t rat
io
(3c)
Labo
ur p
rodu
ctiv
ity
(3d)
Inla
nd co
nsum
ptio
n of
ene
rgy
(4a)
Deb
t-to-
GDP
ratio
of h
ouse
hold
s
(4b)
Deb
t-to-
GDP
of n
on-fi
n co
rpor
atio
ns
(4c)
Inte
rnat
iona
l inve
stm
ent p
ositi
on
Sum
ove
r all i
ndic
ator
s
Num
ber o
f ind
icat
ors o
bser
ved
(C1)
Fisc
al S
usta
inab
ility
= su
m 1a
-1d
/ obs
1a -
1d
(C2)
Com
petit
ivene
ss an
d do
mes
tic d
eman
d =
sum
2a
- 2d
/ obs
2a
- 2d
(C3)
Jobs
, Pro
duct
ivity
and
Reso
urce
Effic
ienc
y =
sum
3a
- 3d
/ obs
3a
- 3d
(C4)
Priv
ate
and
Fore
ign
Debt
=
sum
4a-
4c /
obs 4
a- 4
c
Mon
itor R
atin
g =
sum
/ ob
s
Euro
Mon
itor R
ankin
g
1a 1b 1c 1d 2a 2b 2c 2d 3a 3b 3c 3d 4a 4b 4c sum obs C1 C2 C3 C4 EM10 Rank
LU Luxembourg 10 10 10 1 7 10 10 9 9 6 6 6 # # 10 104 13 7.8 9.0 6.8 # 8.00 1.
AT Austria 7 8 7 7 10 10 9 7 9 8 6 7 6 8 7 116 15 7.3 9.0 7.5 7.0 7.73 2.
DE Germany 7 8 6 6 10 10 9 4 4 7 6 7 9 8 10 111 15 6.8 8.3 6.0 9.0 7.40 3.
NL Netherlands 9 10 8 3 8 10 9 6 10 6 6 6 2 9 9 111 15 7.5 8.3 7.0 6.7 7.40 3.
FI Finland 10 10 9 3 10 10 5 10 6 6 8 2 3 6 8 106 15 8.0 8.8 5.5 5.7 7.07 5.
IE Ireland 10 10 10 2 5 7 2 10 9 9 8 9 1 5 8 105 15 8.0 6.0 8.8 4.7 7.00 6.
SL Slovenia 10 8 9 1 3 8 10 10 8 8 10 1 6 4 8 104 15 7.0 7.8 6.8 6.0 6.93 7.
FR France 7 7 8 6 8 10 4 8 4 7 6 6 5 6 9 101 15 7.0 7.5 5.8 6.7 6.73 8.
BE Belgium 5 10 4 2 9 10 8 7 5 7 6 4 6 6 10 99 15 5.3 8.5 5.5 7.3 6.60 9.
SK Slovakia 10 6 9 7 5 2 10 10 1 8 10 1 4 8 3 94 15 8.0 6.8 5.0 5.0 6.27 10.
IT Italy 3 6 3 7 6 8 6 6 7 9 3 7 5 5 7 88 15 4.8 6.5 6.5 5.7 5.87 11.
GR Greece 4 6 2 9 7 1 6 10 5 10 8 6 3 6 1 84 15 5.3 6.0 7.3 3.3 5.60 12.
ES Spain 10 10 8 2 6 2 7 10 5 10 3 5 2 1 3 84 15 7.5 6.3 5.8 2.0 5.60 12.
CY Cyprus 7 8 5 1 6 4 2 10 9 7 4 4 # # # 67 12 5.3 5.5 6.0 # 5.58 14.
MT Malta 7 7 4 8 7 1 1 9 6 4 6 5 # # # 65 12 6.5 4.5 5.3 # 5.42 15.
PT Portugal 7 6 7 1 7 1 6 5 6 5 5 5 4 7 2 74 15 5.3 4.8 5.3 4.3 4.93 16.

63
Euro Monitor 2005-2010 Country Rating 2006
Coun
try C
ode
Euro
pean
Mon
etar
y Un
ion
Mem
ber S
tate
s
(1a)
Gov
ernm
ent d
ebt
(1b)
Gov
ernm
ent d
efici
t/ su
rplu
s
(1c)
Gov
ernm
ent i
nter
est p
aym
ents
(1d)
Req
uire
d ad
just
men
t in
the
prim
ary b
alan
ce
(2a)
Uni
t lab
our c
osts
(2b)
Cur
rent
acc
ount
bal
ance
(2c)
Glo
bal m
erch
andi
se tr
ade
shar
e
(2d)
Dom
estic
dem
and
(3a)
Une
mpl
oym
ent r
ate
(3b)
Em
ploy
men
t rat
io
(3c)
Labo
ur p
rodu
ctiv
ity
(3d)
Inla
nd co
nsum
ptio
n of
ene
rgy
(4a)
Deb
t-to-
GDP
ratio
of h
ouse
hold
s
(4b)
Deb
t-to-
GDP
of n
on-fi
n co
rpor
atio
ns
(4c)
Inte
rnat
iona
l inve
stm
ent p
ositi
on
Sum
ove
r all i
ndic
ator
s
Num
ber o
f ind
icat
ors o
bser
ved
(C1)
Fisc
al S
usta
inab
ility
= su
m 1a
-1d
/ obs
1a -
1d
(C2)
Com
petit
ivene
ss an
d do
mes
tic d
eman
d =
sum
2a
- 2d
/ obs
2a
- 2d
(C3)
Jobs
, Pro
duct
ivity
and
Reso
urce
Effic
ienc
y =
sum
3a
- 3d
/ obs
3a
- 3d
(C4)
Priv
ate
and
Fore
ign
Debt
=
sum
4a-
4c /
obs 4
a- 4
c
Mon
itor R
atin
g =
sum
/ ob
s
Euro
Mon
itor R
ankin
g
1a 1b 1c 1d 2a 2b 2c 2d 3a 3b 3c 3d 4a 4b 4c sum obs C1 C2 C3 C4 EM10 Rank
LU Luxembourg 10 10 10 1 7 10 10 9 9 6 6 6 # # 10 104 13 7.8 9.0 6.8 # 8.00 1.
AT Austria 7 8 7 7 10 10 9 7 9 8 6 7 6 8 7 116 15 7.3 9.0 7.5 7.0 7.73 2.
DE Germany 7 8 6 6 10 10 9 4 4 7 6 7 9 8 10 111 15 6.8 8.3 6.0 9.0 7.40 3.
NL Netherlands 9 10 8 3 8 10 9 6 10 6 6 6 2 9 9 111 15 7.5 8.3 7.0 6.7 7.40 3.
FI Finland 10 10 9 3 10 10 5 10 6 6 8 2 3 6 8 106 15 8.0 8.8 5.5 5.7 7.07 5.
IE Ireland 10 10 10 2 5 7 2 10 9 9 8 9 1 5 8 105 15 8.0 6.0 8.8 4.7 7.00 6.
SL Slovenia 10 8 9 1 3 8 10 10 8 8 10 1 6 4 8 104 15 7.0 7.8 6.8 6.0 6.93 7.
FR France 7 7 8 6 8 10 4 8 4 7 6 6 5 6 9 101 15 7.0 7.5 5.8 6.7 6.73 8.
BE Belgium 5 10 4 2 9 10 8 7 5 7 6 4 6 6 10 99 15 5.3 8.5 5.5 7.3 6.60 9.
SK Slovakia 10 6 9 7 5 2 10 10 1 8 10 1 4 8 3 94 15 8.0 6.8 5.0 5.0 6.27 10.
IT Italy 3 6 3 7 6 8 6 6 7 9 3 7 5 5 7 88 15 4.8 6.5 6.5 5.7 5.87 11.
GR Greece 4 6 2 9 7 1 6 10 5 10 8 6 3 6 1 84 15 5.3 6.0 7.3 3.3 5.60 12.
ES Spain 10 10 8 2 6 2 7 10 5 10 3 5 2 1 3 84 15 7.5 6.3 5.8 2.0 5.60 12.
CY Cyprus 7 8 5 1 6 4 2 10 9 7 4 4 # # # 67 12 5.3 5.5 6.0 # 5.58 14.
MT Malta 7 7 4 8 7 1 1 9 6 4 6 5 # # # 65 12 6.5 4.5 5.3 # 5.42 15.
PT Portugal 7 6 7 1 7 1 6 5 6 5 5 5 4 7 2 74 15 5.3 4.8 5.3 4.3 4.93 16.

64
Allia
nz E
cono
mic
Rese
arch
& C
orpo
rate
Dev
elop
men
t
Euro Monitor 2005-2010 Country Rating 2005
Coun
try C
ode
Euro
pean
Mon
etar
y Un
ion
Mem
ber S
tate
s
(1a)
Gov
ernm
ent d
ebt
(1b)
Gov
ernm
ent d
efici
t/ su
rplu
s
(1c)
Gov
ernm
ent i
nter
est p
aym
ents
(1d)
Req
uire
d ad
just
men
t in
the
prim
ary b
alan
ce
(2a)
Uni
t lab
our c
osts
(2b)
Cur
rent
acc
ount
bal
ance
(2c)
Glo
bal m
erch
andi
se tr
ade
shar
e
(2d)
Dom
estic
dem
and
(3a)
Une
mpl
oym
ent r
ate
(3b)
Em
ploy
men
t rat
io
(3c)
Labo
ur p
rodu
ctiv
ity
(3d)
Inla
nd co
nsum
ptio
n of
ene
rgy
(4a)
Deb
t-to-
GDP
ratio
of h
ouse
hold
s
(4b)
Deb
t-to-
GDP
of n
on-fi
n co
rpor
atio
ns
(4c)
Inte
rnat
iona
l inve
stm
ent p
ositi
on
Sum
ove
r all i
ndic
ator
s
Num
ber o
f ind
icat
ors o
bser
ved
(C1)
Fisc
al S
usta
inab
ility
= su
m 1a
-1d
/ obs
1a -
1d
(C2)
Com
petit
ivene
ss an
d do
mes
tic d
eman
d =
sum
2a
- 2d
/ obs
2a
- 2d
(C3)
Jobs
, Pro
duct
ivity
and
Reso
urce
Effic
ienc
y =
sum
3a
- 3d
/ obs
3a
- 3d
(C4)
Priv
ate
and
Fore
ign
Debt
=
sum
4a-
4c /
obs 4
a- 4
c
Mon
itor R
atin
g =
sum
/ ob
s
Euro
Mon
itor R
ankin
g
1a 1b 1c 1d 2a 2b 2c 2d 3a 3b 3c 3d 4a 4b 4c sum obs C1 C2 C3 C4 EM10 Rank
LU Luxembourg 10 10 10 # 7 10 10 10 9 6 4 6 # # 10 102 12 10.0 9.3 6.3 # 8.50 1.
IE Ireland 10 10 9 # 6 7 5 10 9 9 8 9 # # 7 99 12 9.7 7.0 8.8 # 8.25 2.
SL Slovenia 10 8 9 # 3 9 10 10 7 9 10 1 # # 8 94 12 9.0 8.0 6.8 # 7.83 3.
AT Austria 7 8 7 # 10 10 10 6 8 6 5 7 6 7 7 104 14 7.3 9.0 6.5 6.7 7.43 4.
FI Finland 9 10 9 # 10 10 5 9 5 6 7 3 4 8 8 103 14 9.3 8.5 5.3 6.7 7.36 5.
NL Netherlands 8 9 7 # 8 10 9 5 9 6 5 5 2 9 8 100 14 8.0 8.0 6.3 6.3 7.14 6.
DE Germany 7 6 7 # 10 10 9 3 3 6 5 6 8 8 10 98 14 6.7 8.0 5.0 8.7 7.00 7.
FR France 7 7 7 # 9 10 5 8 4 8 6 6 6 5 9 97 14 7.0 8.0 6.0 6.7 6.93 8.
BE Belgium 4 7 4 # 9 10 9 6 5 6 5 3 7 5 10 90 14 5.0 8.5 4.8 7.3 6.43 9.
SK Slovakia 10 7 8 # 5 2 10 10 1 7 10 1 5 9 5 90 14 8.3 6.8 4.8 6.3 6.43 9.
CY Cyprus 7 7 4 # 5 5 6 10 8 9 4 4 7 # # 76 12 6.0 6.5 6.3 # 6.33 11.
ES Spain 9 10 8 # 7 3 8 10 4 10 4 5 3 2 4 87 14 9.0 7.0 5.8 3.0 6.21 12.
IT Italy 3 5 3 # 7 9 7 6 6 10 3 7 5 6 8 85 14 3.7 7.3 6.5 6.3 6.07 13.
GR Greece 3 4 2 # 7 3 6 10 4 9 9 5 3 6 2 73 14 3.0 6.5 6.8 3.7 5.21 14.
PT Portugal 7 3 7 # 7 1 7 5 6 5 5 4 4 5 3 69 14 5.7 5.0 5.0 4.0 4.93 15.
MT Malta 6 7 4 # 7 2 1 5 6 5 4 4 # # # 51 11 5.7 3.8 4.8 # 4.64 16.

65
Euro Monitor 2005-2010 Country Rating 2005
Coun
try C
ode
Euro
pean
Mon
etar
y Un
ion
Mem
ber S
tate
s
(1a)
Gov
ernm
ent d
ebt
(1b)
Gov
ernm
ent d
efici
t/ su
rplu
s
(1c)
Gov
ernm
ent i
nter
est p
aym
ents
(1d)
Req
uire
d ad
just
men
t in
the
prim
ary b
alan
ce
(2a)
Uni
t lab
our c
osts
(2b)
Cur
rent
acc
ount
bal
ance
(2c)
Glo
bal m
erch
andi
se tr
ade
shar
e
(2d)
Dom
estic
dem
and
(3a)
Une
mpl
oym
ent r
ate
(3b)
Em
ploy
men
t rat
io
(3c)
Labo
ur p
rodu
ctiv
ity
(3d)
Inla
nd co
nsum
ptio
n of
ene
rgy
(4a)
Deb
t-to-
GDP
ratio
of h
ouse
hold
s
(4b)
Deb
t-to-
GDP
of n
on-fi
n co
rpor
atio
ns
(4c)
Inte
rnat
iona
l inve
stm
ent p
ositi
on
Sum
ove
r all i
ndic
ator
s
Num
ber o
f ind
icat
ors o
bser
ved
(C1)
Fisc
al S
usta
inab
ility
= su
m 1a
-1d
/ obs
1a -
1d
(C2)
Com
petit
ivene
ss an
d do
mes
tic d
eman
d =
sum
2a
- 2d
/ obs
2a
- 2d
(C3)
Jobs
, Pro
duct
ivity
and
Reso
urce
Effic
ienc
y =
sum
3a
- 3d
/ obs
3a
- 3d
(C4)
Priv
ate
and
Fore
ign
Debt
=
sum
4a-
4c /
obs 4
a- 4
c
Mon
itor R
atin
g =
sum
/ ob
s
Euro
Mon
itor R
ankin
g
1a 1b 1c 1d 2a 2b 2c 2d 3a 3b 3c 3d 4a 4b 4c sum obs C1 C2 C3 C4 EM10 Rank
LU Luxembourg 10 10 10 # 7 10 10 10 9 6 4 6 # # 10 102 12 10.0 9.3 6.3 # 8.50 1.
IE Ireland 10 10 9 # 6 7 5 10 9 9 8 9 # # 7 99 12 9.7 7.0 8.8 # 8.25 2.
SL Slovenia 10 8 9 # 3 9 10 10 7 9 10 1 # # 8 94 12 9.0 8.0 6.8 # 7.83 3.
AT Austria 7 8 7 # 10 10 10 6 8 6 5 7 6 7 7 104 14 7.3 9.0 6.5 6.7 7.43 4.
FI Finland 9 10 9 # 10 10 5 9 5 6 7 3 4 8 8 103 14 9.3 8.5 5.3 6.7 7.36 5.
NL Netherlands 8 9 7 # 8 10 9 5 9 6 5 5 2 9 8 100 14 8.0 8.0 6.3 6.3 7.14 6.
DE Germany 7 6 7 # 10 10 9 3 3 6 5 6 8 8 10 98 14 6.7 8.0 5.0 8.7 7.00 7.
FR France 7 7 7 # 9 10 5 8 4 8 6 6 6 5 9 97 14 7.0 8.0 6.0 6.7 6.93 8.
BE Belgium 4 7 4 # 9 10 9 6 5 6 5 3 7 5 10 90 14 5.0 8.5 4.8 7.3 6.43 9.
SK Slovakia 10 7 8 # 5 2 10 10 1 7 10 1 5 9 5 90 14 8.3 6.8 4.8 6.3 6.43 9.
CY Cyprus 7 7 4 # 5 5 6 10 8 9 4 4 7 # # 76 12 6.0 6.5 6.3 # 6.33 11.
ES Spain 9 10 8 # 7 3 8 10 4 10 4 5 3 2 4 87 14 9.0 7.0 5.8 3.0 6.21 12.
IT Italy 3 5 3 # 7 9 7 6 6 10 3 7 5 6 8 85 14 3.7 7.3 6.5 6.3 6.07 13.
GR Greece 3 4 2 # 7 3 6 10 4 9 9 5 3 6 2 73 14 3.0 6.5 6.8 3.7 5.21 14.
PT Portugal 7 3 7 # 7 1 7 5 6 5 5 4 4 5 3 69 14 5.7 5.0 5.0 4.0 4.93 15.
MT Malta 6 7 4 # 7 2 1 5 6 5 4 4 # # # 51 11 5.7 3.8 4.8 # 4.64 16.

66
Allia
nz E
cono
mic
Rese
arch
& C
orpo
rate
Dev
elop
men
t

Imprint
Published byAllianz SE
Economic Research & Corporate Development
60329 Frankfurt/Main
Chief Economist and Principal AuthorDr. Michael Heise
In cooperation withThe Lisbon Council
1040 Brussels
President, Co-FounderPaul Hofheinz
AuthorsStephanie Lindeck
Ann-Katrin Petersen
Dr. Rolf Schneider
Katrin Voegeli
EditingAlexander Maisner OBE
Ann Mettler
Designschmitt. kommunikation, [email protected]
ContactAllianz Economic Research & Corporate Development
Tel: +49 69 263-57 789
Fax: + 49 69 263-18 791
www.group-economics.allianz.com
The Lisbon Council
Tel: +32 2 647-95 75
Fax: +32 2 640-98 28
www.lisboncouncil.net
DisclaimerThe information contained in this issue has been carefully researched and checked by Allianz or reliable third parties.
However, Allianz and any third party do not assume liability for the accuracy, completeness and up-to-dateness of
the contents. The authors’ opinions are not necessarily those of Allianz or the Lisbon Council. Statements do not constitute
any offer or recommendation of certain investments, even if individual issuers and securities are mentioned.
Information given in this issue is no substitute for specific investment advice based on the situation of the individual
investor. For personalised investment advice please contact Allianz.


![OUTPERFORM [V] INITIATION](https://img.pdfslide.net/doc/110x75/6189e5c61eda5f71d25deb98/outperform-v-initiation.jpg)