Embed Size (px)
Citation preview
The Evaluation of Defects in the Aluminium Extrusion Process Through
Quality Tools
N. CARVALHO, A. CORREIA, F. DE ALMEIDA
ESTG - School of Technology and Management
P. Porto - Polytechnic of Porto
Rua do Curral - Margaride, 4610-156 Felgueiras
PORTUGAL
[email protected], [email protected], [email protected]
Abstract: - In the aluminium industry, the chain of processes is long and involves different operations, starting
with operations related to the extractive industry and ending with the piece of aluminium that would be sold. To
make this process solid, viable and competitive, companies involved need to base their decisions on a
consistent set of data, which enables them to obtain workable information throughout the process and thereby
reduce, or eliminate, the percentage of defects that occur.
During the aluminium extrusion, defects are largely responsible for decreasing the quality of the finished
product (profiles) which requires the duplication of work. Thus, defects lead to increased production costs,
delays in delivery and increase of the scrap percentage.
This work, resorting data previously collected in an industry in this area, aims to classify and quantify the
defects that occur throughout the extrusion process. To identify the causes, to correct possible deviations, to
find solutions and improvements are used several quality tools in particular: Brainstorming, Pareto Diagram,
Ishikawa Diagram, Histogram and Control Chart.
Above all, the purpose of using these tools is to provide operators and managers with adequate indicators,
which allow the control of the production process and the identification of critical extrusion variables or others,
responsible for excess waste, defects and, consequently, in order to increase productivity.
During the execution of this work, the defects of the extrusion process were typified and quantified, and whose
causes and possible corrective actions were studied. Through the obtained results, it is clear that the "bubble"
defect represents a very significant part of the total defects studied, which revealed the pertinence of the
monitoring of this defect.
During the study we conclude that there are several variables, which affect the appearance of the "bubble"
defect. Then, some control charts of the main variables are performed, in particular for the time at the
maximum extrusion pressure and the temperature of the container.
Key-Words: - Extrusion, Aluminium, Statistical Process Control, Quality Control
1 Introduction The economy internationalization combined with
the growing demand for aluminium by the world's
major powers is leading to an increase in
competition and competitiveness among companies
involved in aluminium extrusion.
Nowadays, the product of a company has
competition from several companies around the
world since we live in a digital era where the media
and transportation create a global market [1]. As a
result, companies are forced to develop new
processes with a focus on how they manage the raw
material to the finished product and how they create
a stable relationship with the customer. This way of
thinking is crucial to ensure that companies can
build sustainable and durable businesses and that
their products are sold in the present and future.
However, the probability of companies surviving
and developing is affected if there is no constant
concern for the continuous improvement of their
processes, aiming at reducing costs and waste.
Clearly, combating waste is a goal to be achieved
[2]. One way to identify waste is to keep the process
under control, and to control it, you need to know
the whole process. Since "keeping under control is
knowing how to locate the problem, analyse the
process, standardize and establish control items in
such a way that the problem never happens again"
[3]. This is the only way to increase productivity,
because "to produce more and more and/or better
with less and less" [3].
In this way, the reduction of the level of quality
defects and the manufacture of high quality products
do not result from the inspection activities but
WSEAS TRANSACTIONS on ENVIRONMENT and DEVELOPMENT N. Carvalho, A. Correia, F. De Almeida
E-ISSN: 2224-3496 1 Volume 14, 2018

fundamentally from the improvement activities
process, making them more efficient, simpler, safer
and, fundamentally, with less nonconformities,
minimizing the quantity of scrap [4].
In the same line of some authors, which defines the
concept of quality as being a consumer oriented
approach and that this should be the starting point
for an organization that wants continuous quality
improvement [5]. On the other hand, associate the
concept of quality with the concept of management
and assign two definitions to it [6].
Quality defined through the level of consumer
satisfaction (products according to specifications, or
quality such as absence of defects (fewer defects =
less costs) [7]. In order to meet the customer’s
needs, and to guarantee the delivery of the product
according to its requirements, it is necessary to find
solutions that allow the collection of information,
along the entire production chain, and their analysis
and use to a better decision-making. This can help
companies to improve their operational efficiency
and overall the quality of the product. Of the many
Process Control (PC) tools available to ensure better
quality control and optimum quality, Statistical
Process Control (SPC) allows to optimize and
monitor quality using the data created throughout
the entire productive process.
The PC in its broadest sense is a collection of
production methods, concepts, and management
practices that can be used throughout the
organization. The SPC resorts itself to the use of
statistical signs to identify sources of variation,
improve performance and maintain control of
production at higher quality levels.
By using this type of quality tools, the critical points
of each process can be determined. Thus, the
identification of causes or potential causes that lead
to the appearance of the defects, and the capacity of
its detection, can help the definition and
implementation of corrective solutions and
preventive actions, which intend to eliminate the
causes or potential causes of failure.
This work is based on data collected in the company
ADLA Aluminium Extrusion S. A., and it is
justified by the need of the company to constantly
adapt to new markets and customer requirements,
and to find better strategies in the conduct of
operations/processes. This need arises from the
verification of the existence of a high quantity of
scrap, coming from defects in the extrusion.
Through the application of quality tools, it is
intended to contribute to the reduction of the
variability of processes and products quality and,
consequently, to reduce production costs.
In the particular case of the aluminium extrusion
industry, whose waste/scrap represents significant
costs for the company, it was considered appropriate
to implement a program to improve the quality of
the process, based on the following objectives:
1. To define which types of nonconformities
have the most impact on performance indexes and
are most critical to the process.
2. To Identify the causes of nonconformities
and to study possible corrective actions.
Thus, some quality tools were applied throughout
this work, namely: Brainstorming, Pareto Diagram,
Ishikawa Diagram, Histogram and Control Chart.
2 Quality Tools The increase of information in an organization
generates a growth in the need to apply tools that
can compile and process data, in order to support
effective decision making [8].
Quality tools are techniques that are used to define,
to measure, to analyse and to propose solutions to
problems that interfere with the good performance
of the work processes [9].
According to Professor Ishikawa, 95% of a
company's problems can be solved with the basic
quality tools, and the key to problem solving lies in
the ability to identify the problem and to use the
appropriate tools, based on the nature of the
problem and quickly communicate the solution to
others [10].
Quality Tools consist of simple means for problem
solving and can be used by all employees,
promoting teamwork, since their visualization
allows the understanding of all.
Although there are a great variety of quality tools,
the most important are the seven basic quality tools,
suggested by Ishikawa, namely [11]:
1. Cause and effect diagrams;
2. Pareto Charts;
3. Check sheets;
4. Flowcharts;
5. Histograms;
6. Scatter plots.
7. Control charts.
These techniques are usually referred as "the
magnificent seven" (MS), since they are an
important part of quality control, some of them, in
particular, are designed by SPC [12]. The SPC is,
therefore, a set of statistical methods, included in the
quality control tools. From the MS, for example, the
Pareto Charts tools, Check Sheets, Histograms,
Scatterplots and Control Charts are considered SPC,
since they involve statistical techniques. The SPC,
as well as the other quality tools, consist in a set of
WSEAS TRANSACTIONS on ENVIRONMENT and DEVELOPMENT N. Carvalho, A. Correia, F. De Almeida
E-ISSN: 2224-3496 2 Volume 14, 2018
methodologies, which are usually called Control or
Quality Management (QM) methodologies.
QM was born in the United States of America, but
the Japanese were the ones who first understood its
value, they imported it and implemented it. It was
ignored for decades in America, while it helped
Japan to become the world leader in quality. Only in
the last two dozen years the West has rediscovered
the SPC, to start the conquest for quality
improvement [13].
The SPC comprises a powerful set of problem
solving tools, which are very useful in order to
ensure the stability of a given process and to
promote the improvement of its capacity by
reducing its variability [14]. This concept was
introduced by Walter A. Shewhart, in the 1920s,
when he proposed graphs or charts as the first tool
to monitor the variability of a process [12].
This concept is of particular interest to industries,
because of their applicability in monitoring the
variability of manufacturing processes and
consequently in the reduction of nonconforming
products. Control chats involves the inspection of a
random sample of the output of a process, and
decides if the process is producing products with
characteristics that are within a predetermined
range.
The SPC allows us to know if the process is
working correctly or not [12]. Although, however
well designed the productive process may be, it will
always be subjected to a natural variability which,
when coupled with external factors, causes the
process to be out of control [12].
Therefore, it is imperative to implement techniques
to control the process, for example control charts, to
monitor its stability, to reduce variability if
necessary, and to determine if it is able to produce
according to specifications [12].
Some of the QM techniques, in particular those used
in this work, are briefly described below.
2.1 Cause and effect diagrams and
Brainstorming In any study of a problem, the effect - as a particular
defect or a particular process failure, is generally
known. Cause and effect analysis can be used to
trigger all possible contributing factors or causes of
the effect. This technique includes the use of cause
and effect diagrams and brainstorming.
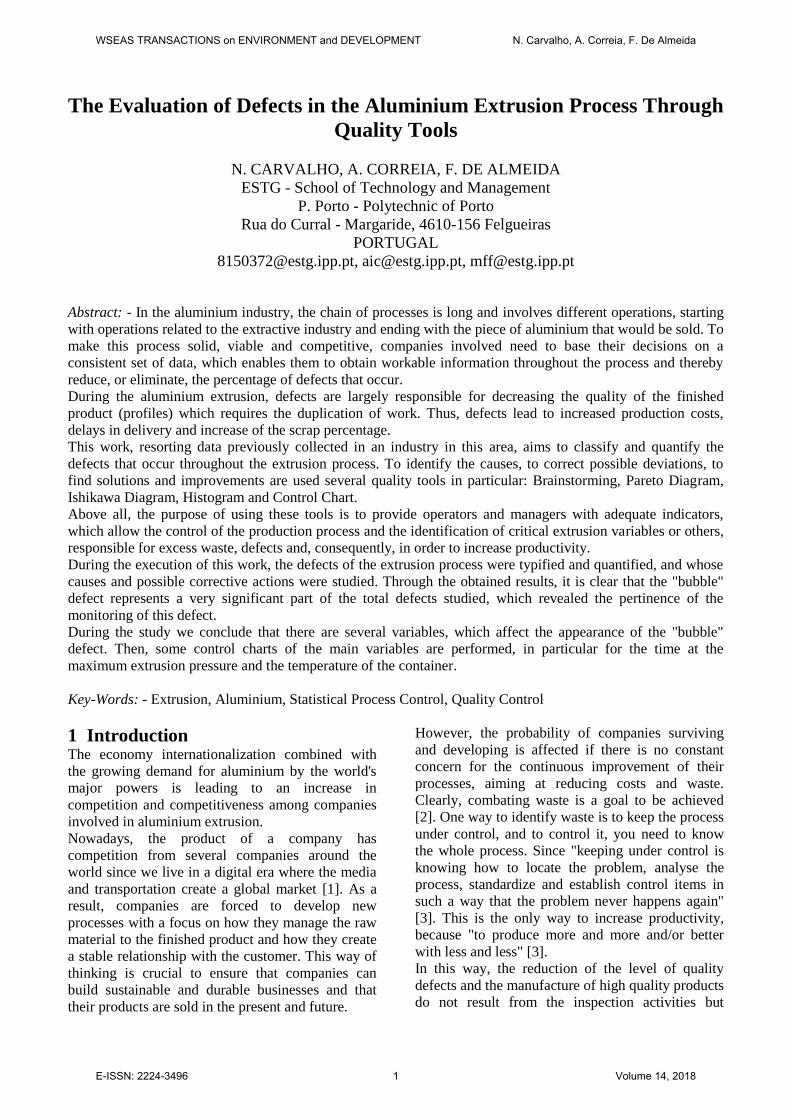
The Cause and Effect Diagram, also known as the
Ishikawa Diagram or Fishbone Diagram, is a
systematic way of listing and organizing all possible
causes of a quality effect or problem [15]. It consists
in the organization and presentation of ideas about
possible reasons for a priority problem and its main
effects, and works as the basis for finding solutions.
A horizontal arrow represents the effect. Arrows
inclined towards the horizontal arrow present the
main causes and horizontal arrows that touch the
relevant main arrow of the cause, as shown in Fig. 1
represent the secondary causes.
Fig. 1 – Cause and effect diagram [15]
2.2 Pareto Charts To solve the unequal distribution of wealth in
Europe, Pareto invented these graphs / diagrams,
usually referred as Pareto Diagram or Pareto Chart.
He exposed the universal law called "80-20 law,"
which states that 80 percent of anything is attributed
to 20 percent of its causes.
The Pareto diagram is a chart that organizes the data
in descending order from left to right. The steps
involved in its construction are the follows [15]:
1. Define the objectives and gather the necessary
data.
2. Calculate the frequency distribution.
3. Sort the categories and calculate the cumulative
distribution.
4. Draw the bars and the cumulative curve.
In the horizontal axis the different categories of
defects are considered and in the vertical axis, the
percentage accumulated. Categories can represent
problems, causes and/or nonconformities. The
purpose of this diagram is to highlight the problem,
which must be examined first, because, it is the
cause of the major number of problems.
The use of Pareto analysis is an infinite process,
since it can be used to measure the progress of
corrective action. It also helps to improve safety, to
reduce waste, to conserve energy, to reduce costs,
etc., analyzing the problems by different data groups
and analyzing the before and after impact of the
changes [15].
WSEAS TRANSACTIONS on ENVIRONMENT and DEVELOPMENT N. Carvalho, A. Correia, F. De Almeida
E-ISSN: 2224-3496 3 Volume 14, 2018

Fig. 2 – Pareto Chart for causes of default rejections [1]
Fig. 2 illustrates a Pareto Chart for causes of
rejection due to defects caused during extrusion [1].
In this graph, it is observed that the most observed
causes are lines, corresponding to about 40% of the
defects verified. The 80% of rejections are reached
in the fifth verified cause, in a set of 13. In this case,
5/13 represents about 38% of the causes accounting
for 80% of rejections, which is not exactly in
accordance with the "80-20 law", but effectively
few "reasons" justify a larger part of the rejections,
as Pareto said.
2.3 Check sheets Check sheets are cross-reference tables or tables
where occurrences are recorded. These instruments
help with the recording of data and their subsequent
analysis. They are considered the simplest quality
control tools, for their simplicity.
By using this technique, it is possible to save time,
because its read is easier, when compared with the
direct reading of the data. For a better understanding
of the state of the process, it is essential to collect
data (both current and historical) of the process
under analysis, thus, check sheets are very useful in
this process of data collection [12].
Table 1 presents an example of a check sheet, used
in surveying the occurrence of defects in the
monthly production of a factory. These types of
sheets allow analyzing evidences of eventual
production problems.
Table 1 – Check sheet example
Defect type Month
January February
Bubbles 100 80
Lines 50 70
Crinkles 50 50
For example, according to this table it can be seen
that the production of "Bubbles" type defects is the
most frequent. Besides that, it decreased in January,
while the "Lines" type defect has increased. This
may indicate the resolution of one problem and the
increase of another. Therefore, the check sheet has
great application for surveying and checking data
and facts
2.4 Flowcharts The flowchart illustrated in Fig. 3 consists in a
representation, which shows all phases of a process
or procedure. It identifies the process flow as well as
the interaction between the process steps. It can help
to identify potential control points [12].
In this way the Flowchart is a tool that helps
individuals to have a precise notion of the entire
process, properly structured and that is easy to
visualize. In these charts are illustrated the set of
tasks, variables, inputs and outputs that are the basis
of the elaboration of a product. "The descriptions
that define the process should enable its
understanding and provide the basis for any critical
examination necessary for the development of
improvements. It is essential the process
descriptions to be precise, clear, and concise. " [16 ].
Fig. 3 illustrates a flowchart and some of the forms
used in its construction and the meaning.
Fig. 3 – Flowchart example [15].
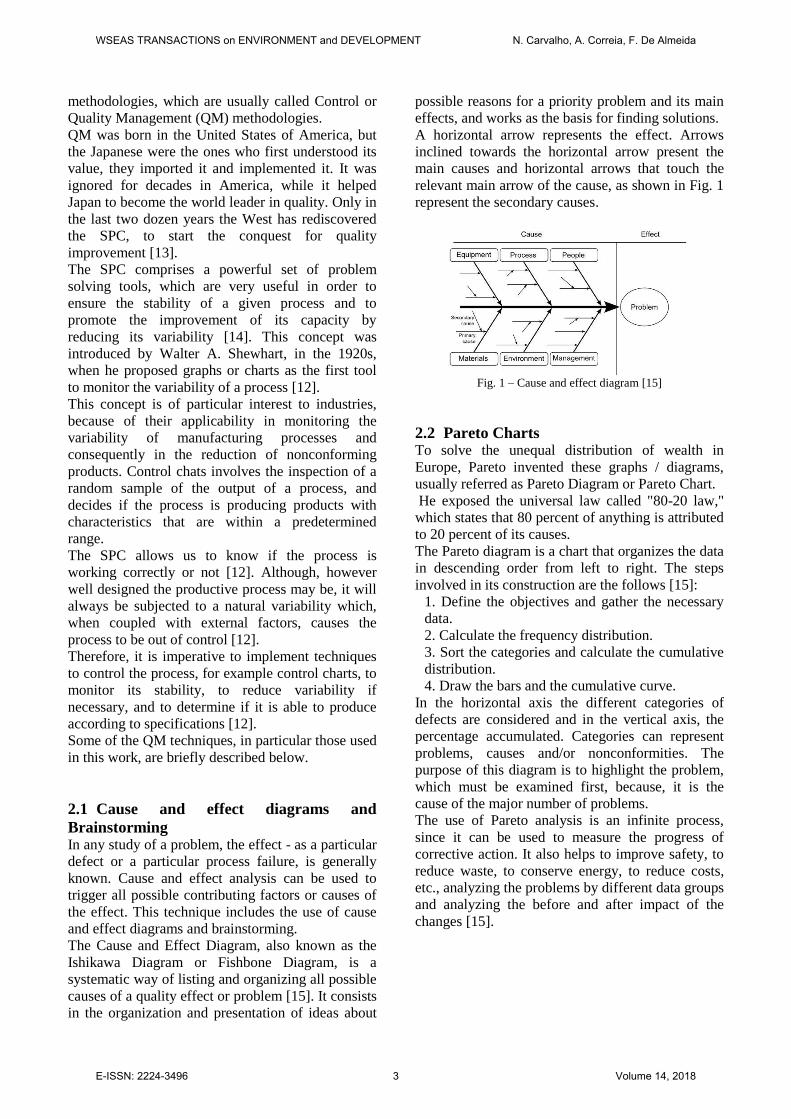
2.5 Histograms The histogram is one of the quality statistical tools
and it is used to graphically represent a large
amount of numerical data (see an example in Fig.
4).
WSEAS TRANSACTIONS on ENVIRONMENT and DEVELOPMENT N. Carvalho, A. Correia, F. De Almeida
E-ISSN: 2224-3496 4 Volume 14, 2018
Analyzing the histogram, it is possible to identify
longer-occurring data ranges and interpret this
information easily and simpler than following a
large table or a report with only numbers and/or
values [17]. The Histogram is a bar graph used to
represent the variation of a set of data grouped into
contiguous classes. It aims is to quickly identify the
patterns of variability inherent in a given process
depending on the form of its distribution, in order to
investigate the possible determinants.
Fig. 4 – Histogram example [12].
2.6 Scatter plots Scatter plots are very useful in identifying a
potential relationship between two variables. The
data are collected in pairs of coordinates (yi, xi), for
i = 1, 2, ..., N. The shape of the scatter diagram
usually indicates which type of relationship can
exist between the two variables [12]. In other words, the scatter diagram shows what
happens to the values of a (dependent) variable Y
when the values of a (independent) variable X
increases. A practical example of what has been said
is when it is intended to evaluate whether there is a
relationship between the increase in the number of
defects with the increase in the extrusion
temperature.
As can be seen from the analysis of Fig. 5, the set of
points in the scatter diagram reveals whether or not
there is a strong or weak, positive or negative
correlation between the variables [16]. In the two
scatter plots in the left, we observe a linear
correlation between the variables. In the first case
positive, and negative in the second. The last (in the
right) scatter plot do not indicates the existence of
any correlation between the variables.
Fig. 5 – Types of correlation [18].
2.7 Control charts A control chart or control chart is a graphical
representation of a quality characteristic that is
recorded over certain time intervals [19].
The graph shows information of the mean value of
the process ( X ), represented by a center line and
two other reference lines, respectively representing
the Upper Control Limit (LSC) and Lower Control
Limit (LIC).
To assume that a process is under statistical control,
all samples must be included in the zone defined by
the limits [19]. If one or more points are outside the
range, the process is said to be out of control.
However, there are exceptions even when the
process is controlled. These situations are identified
when the points present a systematic and not
random behavior. In this case it is considered that
there should be a special cause for the occurrence.
When a special cause is detected, the reason for its
existence must be ascertained and corrective actions
must be taken.
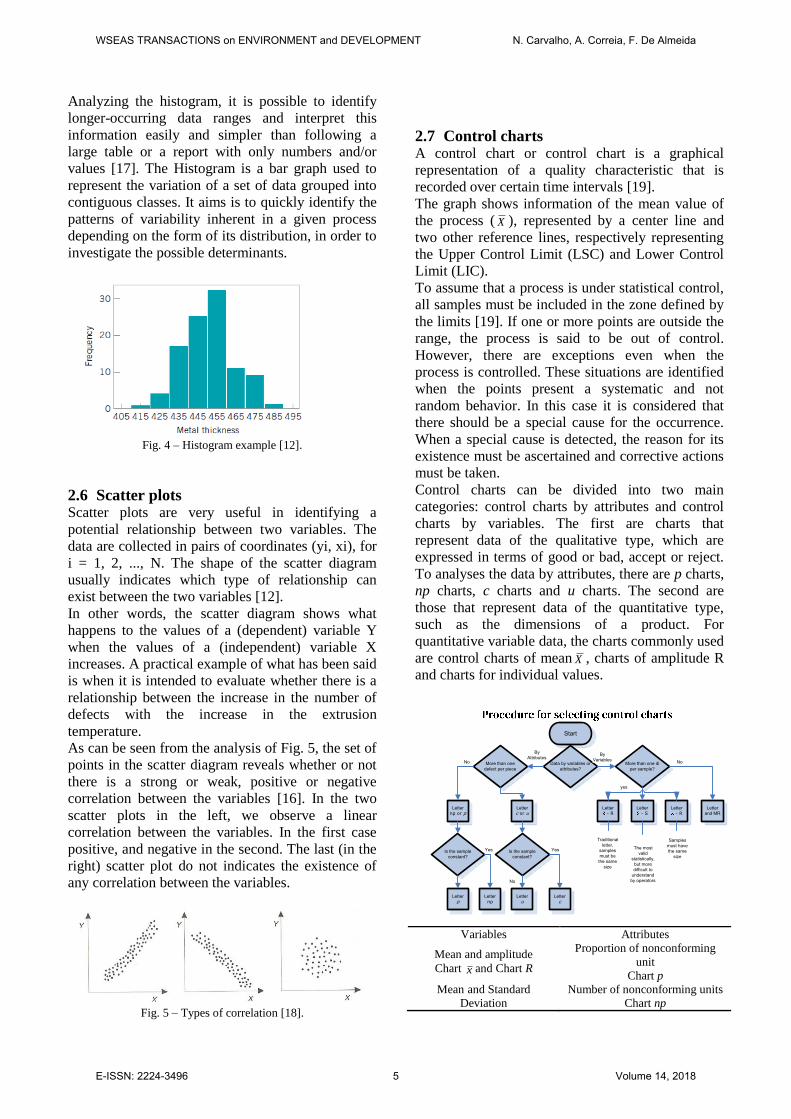
Control charts can be divided into two main
categories: control charts by attributes and control
charts by variables. The first are charts that
represent data of the qualitative type, which are
expressed in terms of good or bad, accept or reject.
To analyses the data by attributes, there are p charts,
np charts, c charts and u charts. The second are
those that represent data of the quantitative type,
such as the dimensions of a product. For
quantitative variable data, the charts commonly used
are control charts of mean X , charts of amplitude R
and charts for individual values.
Start
Data by variables or attributes?
More than one di per sample?
By Variables
Letter- R
Letter- R
Letter- S
Letter and MR
No
Samples must have the same
size
The most valid
statistically, but more difficult to
understand by operators
Traditional letter,
samples must be the same
size
yes
More than one defect per piece
By Attributes
Letterc or u
Is the sample constant?
Letteru
Letter c
Yes
No
Letternp or p
Is the sample constant?
No
Letterp
Letternp
Yes
Variables Attributes
Mean and amplitude
Chart x and Chart R
Proportion of nonconforming
unit
Chart p
Mean and Standard
Deviation
Number of nonconforming units
Chart np
WSEAS TRANSACTIONS on ENVIRONMENT and DEVELOPMENT N. Carvalho, A. Correia, F. De Almeida
E-ISSN: 2224-3496 5 Volume 14, 2018

Chart x and Chart S
Median and Amplitude
Chart x~ and Chart R Number of defects
Chart C
Individual observations and
Moving Amplitudes
Charts X e Charts MR
MR Number of defects per unit
Chart u
Fig. 1 – Types of control charts and selection process (Adapted
from [13])
Although there are more types of control charts,
these are the simplest and most used ones, and the
selection of the control charts most appropriate for
each situation can be driven by the scheme
presented in Fig. 6.
2.7.1 Control charts by variables According to the features and data to be worked on,
different control charts may be applied. Next, will
be identified the types of charts by variables and
also the sequence for their construction, according
with [12].
Charts of mean X and amplitude R
The chart X is used to control continuous type
variables (physical measurements, for example),
assuming that the quality characteristic follows a
normal distribution with mean μ and standard
deviation σ.
Since in practice the parameters μ and σ are not
known, then available estimates X and S, using
formulas (1) and (2), should be used
n
i
iXn
X1
1 (1) and
2
11
1)XX(
nS
n
i
i
(2)
where,
X = Mean sample;
S = Standard deviation sample;
iX = i-th element of the sample i with i=1, 2, 3, …n;
n = number of elements or sample size.
Knowing that X it is normally distributed, with
mean µ and standard deviation n
x
. If Z
defined as:
n
XZ
Z follows a standard distribution with mean 0 and
standard deviation 1, i.e., Z ~ N (0,1).
As the process analysis is performed by sampling,
the estimation of the mean and the variability of the
process is performed through an interval structure,
which provides an interval in which the true mean
and population variability are assumed.
Since we do not know for sure where the true
population parameter is, a probabilistic assignment
of the interval at which the true value might be,
should be used.
This interval is called the confidence interval, and
the associated confidence is 1 - , where is the
probability of error. A confidence interval of 100 (1
- )% is established from two limits, and the
probability of the true value of the parameter being
included within the interval is 100 (1 - )% [20].
In the SPC, 99.73% confidence intervals are usually
used. For example, to construct a confidence
interval of 99.73% for the mean, we can calculate
the limits L (lower) and U (upper), such that:
PL U = 99,73%
The confidence limits of 100 (1 - )% are calculated
using the normal distribution.
nZX
nZX //
212
where Z/2 represents the quantile of the
standardized normal distribution corresponding to
the probability of the error /2.
For confidence intervals of 99.73% we have:
nX
nX
33
The limits of the confidence interval can be
considered as limits of the control chart X . Then the
limits of the control chart X are:
nZXLSC /
21 e
nZXLIC /
2
Generally, it is used 3σ (three standard deviations)
for the n
Z /
2
value. In that case, the central line
and the control limits of this chart are:
3 XLSC (3)
XLC (4) and
3 XLSC (5)
To calculate the control limits, and considering the
existence of multiple samples, the amplitude is
calculated initially (R = max Xi - min Xi) and the
mean X for each sample, and then the mean
amplitudes and the mean sample means are
calculated as follows:
n
R...RRC n 21
n
X...XXX n 21
Therefore, the variability is estimated using the
mean amplitudes within each sample to ensure that
it is associated only with the common causes. Thus,
it is not correct to estimate the variance using the
WSEAS TRANSACTIONS on ENVIRONMENT and DEVELOPMENT N. Carvalho, A. Correia, F. De Almeida
E-ISSN: 2224-3496 6 Volume 14, 2018

standard formula of standard deviation (S) applied
on the set of all the data, because in this way the
variance estimate could be associated with common
causes (within samples) and special causes (between
samples).
Once having calculated X and R, the control limits
of the means are calculated considering the
extension of six standard deviations of the means
(three for each side), which according to the Normal
distribution comprises 99.73% of the sample mean
values.
Formulas (3) and (5) can be represented only by:
,XCLX
3
where the formula with the sign "-" is equivalent to
formula (3) and with the sign "+" is equivalent to
formula (5), being:
nX
Replacing this expression in the previous equation
results in:
,n
XCL
3
where the variability of the individual values is
estimated from the mean of the subgroup
amplitudes, using the estimate:
,d
R
z
where d2 is a constant that depends on the size of the
sample, whose3 values are in Table 6.
Table 6 – Values of constants D4, D3, d2, A2 used in the
construction of control charts
n 2 3 4 5 6 7 8 9 10 15 20
D4 3.27 2.57 2.28 2.11 2.00 1.92 1.86 1.82 1.78 1.65 1.59
D3 0 0 0 0 0 0.08 0.14 0.18 0.22 0.35 0.42
d2 1.13 1.69 2.06 2.33 2.53 2.70 2.85 2.97 3.08 3.47 3.74
A2 1.88 1.02 0.73 0.58 0.48 0.42 0.37 0.34 0.31 0.22 0.18
Replacing this expression in the previous equation
yields:
2
3dn
RXCL
and being it is obtained the control limits for the
means:
RAXCL 2 (6)
where A2 is a constant that depends on the sample
size, whose values are shown in Table 6.
The control limits for the amplitudes are calculated
as follows:
RR RCL 3 (7)
where:
.d
RddR
2
33
Replacing this expression into equation (7), it is
obtained:
2
33d
RdRCLR (8)
Considering
2
34 31
d
dD e
2
34 31
d
dD in equation
(8), it is obtained the control limits for the
amplitudes:
RDLSCR 4
RDLICR 3
Where D4 and D3 are constants that depend on the
sample size, whose values are presented in Table 6.
2.7.2 Process capacity The purpose of the capacity calculation is to
determine whether the process is capable of
producing products within the specification
tolerances. To study the capacity of the process it is
necessary to know the specifications [21].
Producing according to these specifications is the
main focus of the study of process capability and
also a guarantee of process and product quality of
any company. Specification limits (upper – LSE and
lower – LIE) are the areas on either side of the
centerline, or mean, of data plotted on a control
chart that meets customer requirements for a
product or service. This area may be larger or
smaller than the area defined by the control limits. If
a process undergoes centralization changes and/or
an increase in process dispersion, it may yield
production outside the specification limits.
Capacity process studies are followed by the
application of control charts and their realization
depends on the positive validation that the process is
under statistical control.
These studies result in process capability indices,
which are numerical measures that relate aspects
inherent to the fulfilment of specification limits.
Many process capability indices can be applied,
such as Cp e Cpk [22].
The calculation of the capability index Cp can be
done by the following formula:
6
LIELSECp
where: σ – process standard deviation;
LSE – Specific upper limit;
LIE – Specific lower limit.
The capacity of the process is then characterized
taking into account the value obtained for the index
Cp, as described in the Table 7.
WSEAS TRANSACTIONS on ENVIRONMENT and DEVELOPMENT N. Carvalho, A. Correia, F. De Almeida
E-ISSN: 2224-3496 7 Volume 14, 2018

Table 7 – Reference values for classification of the process by
índex Cp
Capacity Index Value Process
< 1 Unable
1 a 1.33 Acceptable
> 1.33 Able
However, Cp does not take into account the
centrality of the process, for instance, it does not
take into account the position of the mean relatively
to the specification limits. For this reason, should be
considered the Capacity Index Cpk that is given by:
Cpk = min ((Cpk)I , (Cpk)s),
where Cpk
3
LIE and (Cpk)S
3
LSE
Some observation can be made regarding the
indexes Cp e Cpk [12] (also illustrated in Figure 17):
• Index Cpk, which measures the actual
capacity of the process, is always less than or equal
to the Cp index, which measures the maximum
capacity of the process when it is centred;
• Index Cpk, is less than index Cp when the
process is off centre and is equal to Cp when the
process is centred;
• The Cpk > 1 is necessary for the customer
specification to contemplate 6 σ - 99.73% of the
products produced and that the defective fraction is
0.27%.
Fig. 7 – Relationship between Cp e Cpk [12].
3 The Usage of Quality Tools in the
Company ADLA, S.A. The commitment to programs directed to improve
the quality of processes is increasingly an attitude to
adopt, in order to face the current time strong
competition in all sectors and markets. It is
necessary to move towards optimized
manufacturing processes to increase
competitiveness, reduce scrap/nonconformities and
maximize profits.
3.1. The company ADLA Aluminium Extrusion S. A., is a young
company (constituted in 2011) dedicated and
specialized in the development and production of
aluminium profiles. It is a national company, which
manufactures aluminium profiles, whose application
includes engineering, architecture and industry
works in general. Inserted in a demanding market,
its main pillars are quality (ISO 9001: 2008 certified
company since 2013), innovation, technology and
environment (company certified according to ISO
14001: 2008 since 2016).
This company appears as the productive link and
exporter of the business group to which it belongs,
integrating, in view of the existing situation, the
productive part and the international side. In this
sense, ADLA has as its mission:
"To provide, for the global market, innovative,
differentiated and high-quality products in the field
of aluminium extrusion, having as guiding principle
the continuous improvement of its reality."
3.2. Data collection and Methodology In order to carry out this study we used the analysis
of several data sources, namely, company
documents and fact sheets. In an initial phase, an
evaluation of the types of nonconformities with
higher occurrence was carried out, through a data
collection with eight months of production (data
presented summary in table 8).
Next, a diagnosis was made, trying to observe
possible variations of the extrusion parameters
during the last productions. After analyzing the
results, a set of measurements/changes (to be carried
out in future extrusions) will be implemented. Some
extrusion conditions are crucial, namely extrusion
speed, container temperature, bead length and bead
heating temperature, which the experiment "points"
indicates that they allow to optimize the process,
reducing the number of nonconformity and
consequently the percentage of scrap from each
extrusion/production. These assumptions are
verified in the previous paper, where the available
data about extrusion parameters are studied, as well
as, the relationship between them and their impact
on the quantity of scrap produced.
WSEAS TRANSACTIONS on ENVIRONMENT and DEVELOPMENT N. Carvalho, A. Correia, F. De Almeida
E-ISSN: 2224-3496 8 Volume 14, 2018
In support of this whole process, a theoretical
framework was used resorting to a literature review
on the key concepts addressed, that is, a theoretical
development of the aluminium extrusion process,
Statistical Process Control and other quality tools.
According to the different stages of this study,
multiple quality tools were used. The flowchart to
represent the production process, the Pareto diagram
to identify the major cause of defect rejection
(nonconformities), the Ishikawa diagram to identify
and structure the possible causes that give rise to the
various defects, among others.
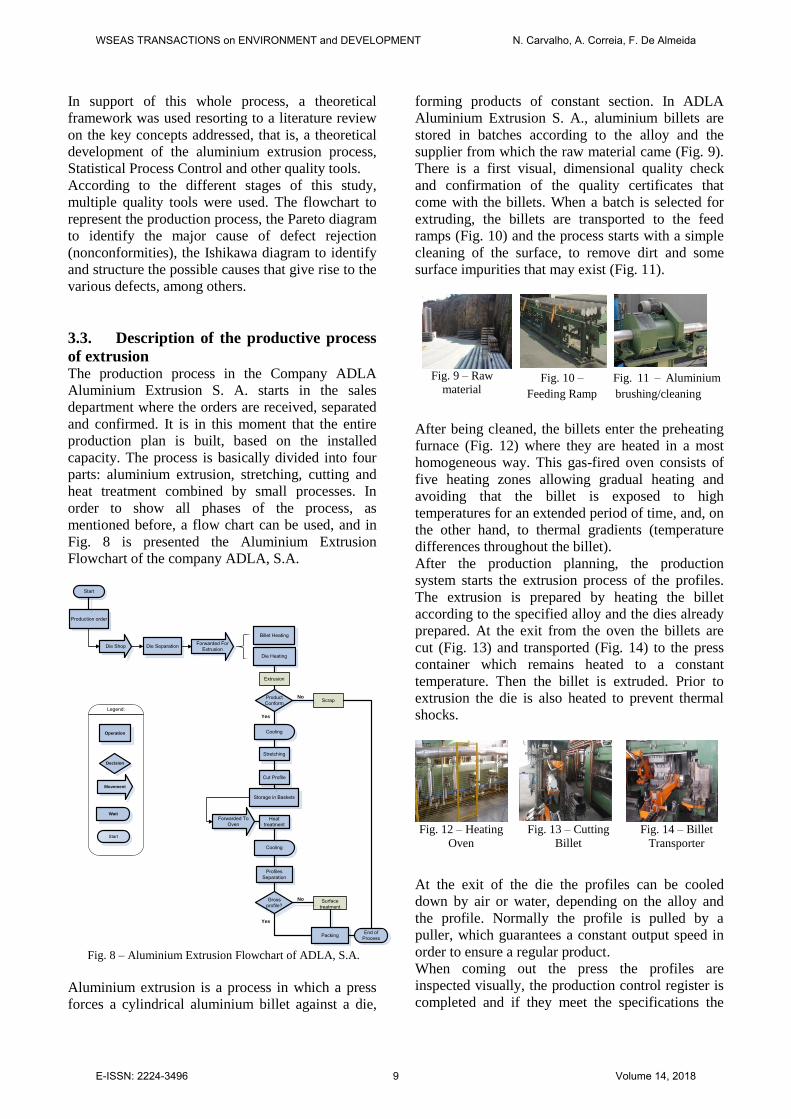
3.3. Description of the productive process
of extrusion The production process in the Company ADLA
Aluminium Extrusion S. A. starts in the sales
department where the orders are received, separated
and confirmed. It is in this moment that the entire
production plan is built, based on the installed
capacity. The process is basically divided into four
parts: aluminium extrusion, stretching, cutting and
heat treatment combined by small processes. In
order to show all phases of the process, as
mentioned before, a flow chart can be used, and in
Fig. 8 is presented the Aluminium Extrusion
Flowchart of the company ADLA, S.A.
Start
Production order
Die Shop Die Separation Forwarded For Extrusion
Billet Heating
Die Heating
Extrusion
Product Conform Scrap
No
Cooling
Stretching
Cut Profile
Yes
Storage in Baskets
Forwarded To Oven
Heat treatment
Cooling
Profiles Separation
Gross profile?
Surface treatment
No
Packing
Yes
End of Process
Operation
Decision
Movement
Wait
Start
Legend:
Fig. 8 – Aluminium Extrusion Flowchart of ADLA, S.A.
Aluminium extrusion is a process in which a press
forces a cylindrical aluminium billet against a die,
forming products of constant section. In ADLA
Aluminium Extrusion S. A., aluminium billets are
stored in batches according to the alloy and the
supplier from which the raw material came (Fig. 9).
There is a first visual, dimensional quality check
and confirmation of the quality certificates that
come with the billets. When a batch is selected for
extruding, the billets are transported to the feed
ramps (Fig. 10) and the process starts with a simple
cleaning of the surface, to remove dirt and some
surface impurities that may exist (Fig. 11).
Fig. 9 – Raw
material Fig. 10 –
Feeding Ramp
Fig. 11 – Aluminium
brushing/cleaning
After being cleaned, the billets enter the preheating
furnace (Fig. 12) where they are heated in a most
homogeneous way. This gas-fired oven consists of
five heating zones allowing gradual heating and
avoiding that the billet is exposed to high
temperatures for an extended period of time, and, on
the other hand, to thermal gradients (temperature
differences throughout the billet).
After the production planning, the production
system starts the extrusion process of the profiles.
The extrusion is prepared by heating the billet
according to the specified alloy and the dies already
prepared. At the exit from the oven the billets are
cut (Fig. 13) and transported (Fig. 14) to the press
container which remains heated to a constant
temperature. Then the billet is extruded. Prior to
extrusion the die is also heated to prevent thermal
shocks.
Fig. 12 – Heating
Oven
Fig. 13 – Cutting
Billet
Fig. 14 – Billet
Transporter
At the exit of the die the profiles can be cooled
down by air or water, depending on the alloy and
the profile. Normally the profile is pulled by a
puller, which guarantees a constant output speed in
order to ensure a regular product.
When coming out the press the profiles are
inspected visually, the production control register is
completed and if they meet the specifications the
WSEAS TRANSACTIONS on ENVIRONMENT and DEVELOPMENT N. Carvalho, A. Correia, F. De Almeida
E-ISSN: 2224-3496 9 Volume 14, 2018

production order continues. Otherwise, they are
rejected, the nonconformity is recorded and
forwarded to the quality department.
In the same production series, the profiles are
extruded continuously, being cut with hot saw (Fig.
15) to each billet that is pressed. This cut is
precisely made from the area where a billet joins the
previous one. The profile, already cut, is attached at
both ends and is stretched (Fig. 16), so that it is
straight and without curvatures. The zones next to
the splicing of the billets are eliminated (scrap),
since they are zones of great heterogeneity. After
passing in the stretcher (Fig. 17), the bars are cut
(Fig. 14) into bars of lower length and placed in
containers (Fig. 18) which are transported to the
aging furnaces (Fig.19), if the profiles are aged, or
for shipment.
Fig. 15 – Hot Saw Fig. 16 – Stretcher Fig. 17 – Final Saw
Fig. 18 – Containers Fig. 19 – Aging furnaces
The profiles, after aging, can also undergo an
anodizing or lacquering surface treatment, according
to the customer's requirements. The initial
conditions of the billet are crucial for good
extrudability and for a final product with the desired
properties and qualities, from mechanical properties,
to response to subsequent heat treatments and
surface treatments, to surface quality and adhesion
of paints or coatings
3.4. Description of nonconformities in the
extrusion production process From the data collection and the direct observations
of the extrusion process, several situations were
recorded that contribute to the occurrence of
nonconformities (NC). In the phases of the extrusion
process there are several criteria that must be
respected, namely in terms of their production order
specifications and process conditions. These criteria
are often neglected by operators, which entails a
series of failures that run along the process.
It commonly occurs that only when the product gets
to the end of the production line it is when the NC in
these products are verified, which is problematic
both financially and for the fulfilment of deadlines.
According to the production manager, the main
point in the extrusion preparation stage is the lack of
temperature control.
The execution of this control is of fundamental
importance because if the temperature of the billet
and the tool (matrix) does not reach approximately
460°C the quality of the product will be affected. It
also stresses the importance of checking the
conditions of use of the machine, before starting the
process, in order to avoid failures that can be easily
prevented by preventive maintenance, such as: air
retention in the press, excessive lubrication in the
pressure discs, and leakage. This lack of
temperature control and machine maintenance may
be responsible for the appearance of bubbles in the
profiles (one of the most common defect types in
the ADLA Aluminium Extrusion S. A. extrusion
process).
Table 1 – Checklist for the types of NC observed in ADLA,
S.A.
Type of defects Total Accumulated value
(€)
Accumulated
%
Blisters 15116.76 15116.76 37.69
Scratches/Damages 13906.55 29023.31 72.36
Out of Angle 2786.85 31810.16 79.31
Lines 2429.72 34239.88 85.37
Wrinkle 2422.77 36662.65 91.41
Hole B. 1253.19 37915.84 94.53
Concavity 804.09 38719.92 96.54
Rough Surf 665.41 39385.34 98.19
Twist/Bends 551.42 39936.76 99.57
Convexity 172.80 40109.56 100.00
Total 40109.56
In the process of stretching (traction of the profiles),
inspection of the measurements and the use of the
squares are often neglected by the operators, leading
to the occurrence of dimensional errors and the
products out of miter. During the direct observation
of the process it was identified that the cutting stage
is one of the most important in the quality control of
this process, because it is at this stage that
measurement errors usually occur, causing the
wrong cutting and the surplus in excess of ends.
These wrongly cut products/profiles are sent to
scrap because they are out of standard size and
cannot be reused.
Another very important factor for the creation of
scrap is the accommodation of the profiles in the
transport baskets, in which the criterion of
WSEAS TRANSACTIONS on ENVIRONMENT and DEVELOPMENT N. Carvalho, A. Correia, F. De Almeida
E-ISSN: 2224-3496 10 Volume 14, 2018

packaging according to the dimensions of these
products must be respected. The accommodation of
heavy profiles on the lighter profiles results in a
direct kneading of the profiles. Based on the reports
of NC obtained in the company, it was possible to
identify ten NC and then determine the frequency of
occurrence, as well as the percentage and
significance in kilograms of nonconforming product
of each one, in the period of time analyzed.
3.5. Data analysis through quality tools 3.5.1 Main Nonconformities and Causes
Based on the information extracted from the Check
Sheet the Pareto Diagram (Fig. 20) was made for the
higher frequencies of NC. The diagram orders the
frequency of occurrences of a particular
characteristic to be measured, from highest to
lowest, and provides the information in a way that
allows the concentration of efforts for improvement
in areas where the greatest gains can be obtained.
Thus, the "Bubbles" defect, which represents 38%
of the NC, is the most representative failure found
during the process.
Fig. 20– Pareto diagram for NC in ADLA, S.A.
Based on the classification of the bubbles, as the
most significant and recurrent non-conformity in the
process, together with the person in charge of
production, press workers and quality control, a
brainstorming was done to elaborate the Ishikawa
Diagram or Cause and Effect Diagram to explore
the causes of non-compliance. The resulting
diagram is shown in Fig.21.
Fig. 20 – Cause and Effect Diagram NC “Blisters”
In the course of the brainstorming, the team
members assigned values on a scale of 1 to 5 for the
causes raised (representing 1 = very shocking cause
and 5 = negligible cause) so that it was still possible
to identify, among the causes mentioned, which
were the most significant ones were bubbles, and
the results presented in Table 10 were obtained. The
levels of this scale are described in Table 9.
Table 9 – Rating scale of the causes for NC "Bubbles/Blisters"
Rating Scale
Very
Important Important Significant
Little
Important
Insignificant
Important
1 2 3 4 5
Table 10 – Classification of the causes for NC "Bubbles/Blisters
Method Evaluation Machine Evaluation
Time at maximum
pressure 1 Decompression cycle 1
Aluminium Brushing 3 Press Alignment 2
Temperature control at
profile output 2 Maintenance 3
Billet temperature
control 2 Lack of Lubrication 3
Container temperature
control 1
Average 1.80 Average 2.50
Environment Manpower
Lack of organization 3 Untrained workers aluminium extrusion
2
Cleaning 4 Poorly motivated staff
familiarized with the process and Machinery
4
Low Technical Level 2
Average 3.50 Average 2.67
Measure Material
Without temperature sensors calibration
5 Low quality alloy 1
Billets with problems 3
Average 5.00 Average 2.00
WSEAS TRANSACTIONS on ENVIRONMENT and DEVELOPMENT N. Carvalho, A. Correia, F. De Almeida
E-ISSN: 2224-3496 11 Volume 14, 2018

Fig. 22– Causes of the NC "Bubbles"
Based on the data collected, we created the graph in
Fig. 32. From the chart, it can be observed that the
causes related to the method were those evaluated
with greater impact for the occurrence of NC under
study. This analysis reinforces what was observed
during the data collection, by means of the direct
observation of the extrusion of the profiles. Thus, it
will be essential to control temperatures as well as
the maximum pressure time, which as can be seen in
Table 10 are the most scored causes.
3.5.2 Extrusion variables that most affect the
appearance of the "Bubble" defect During the extrusion process there are several
variables that directly affect the quality of the
extruded profiles. After analyzing the causes that
most affect the appearance of the "Bubble" defect,
the target variables of study/control are: The time at
the maximum extrusion pressure and the
temperature of the container - as can be seen in
Table 10 are the most relevant causes. Thus, these
variables were monitored using control charts.
Before that, a brief description of each is given.
After analyzing the extrusion process, and selecting
the target study variables to be controlled the control
limits and the mean for each sample were
calculated. Once the appropriate samples for the
correct implementation of the control charts were
collected. The control charts of the mean ( X ) and
Amplitude (R) were considered. These charts allow
having a perspective of the variability of the
samples over time. Thus, we can say whether the
process is controlled or not.
3.5.2.1 Time at maximum pressure
The time at maximum pressure can be defined as the
time at which the hydraulic pressure remains at its
maximum value [23]. It also underlines that during
the extrusion cycle, and after the billet is inside the
container and after the press touches the billet, the
hydraulic pressure should reach a value of
approximately 211 Bar and remain at this pressure
for 4 to 8 seconds. This gives time for the billet
deformation inside the container, thus giving rise to
the plastic deformation of the metal.
Fig. 23 shows a graph, typical for aluminium alloys,
where it is possible to observe the extrusion pressure
as a function of the piston movement. In the graph
could identifies six main stages that occur during the
extrusion of a billet [24]. Region A shows that the
load in extrusion initially increases very rapidly as
the billet upsets to fit the container. There is a
further increase in pressure (region B) until the
extrusion begins. In this process, the structure is
heterogeneous with progressively increasing
dislocation and sub grain density mainly
concentrated in the die region. In C, peak pressure
region, a peak appears because a greater dislocation
density is required to reach steady state extrusion
than is required to maintain it. After the peak
pressure has been reached, the extrusion pressure
falls as the billet length decreases. In the extrusion,
the process is characterized by the absence of
friction between the billet surface and the container.
The macrostructural and microstructural changes are
complex and contain second phases, which include
precipitates and solutes that hinder dislocation
movement.
Fig. 23 – Extrusion pressure chart [26].
Analyzing the control charts means and amplitudes,
through Fig. 24 and Fig. 25, it is possible to observe
that, for the variable under study (time in the
maximum pressure), the process does not present an
adequate statistical behavior. It can be inferred that
the process is out of statistical control, indicating the
presence of special causes of variation. Evidence for
this assertion is easily seen in Fig. 25, where it can
be seen that there are points outside the control
limits.
WSEAS TRANSACTIONS on ENVIRONMENT and DEVELOPMENT N. Carvalho, A. Correia, F. De Almeida
E-ISSN: 2224-3496 12 Volume 14, 2018

Fig. 24 – Average Chart ( X ) - Time at Maximum Pressure
Fig. 25 – Amplitude Chart (R) – Time at Maximum Pressure
3.5.2.2 Container Temperature
The ever-increasing pressure for higher productivity
and recovery at the extrusion press demands better
tooling and knowledge of tooling system providers.
Containers (illustrated in Fig. 19) are probably the
most misunderstood press tooling. A container does
more than just contain billets at high pressure and
high temperature during extrusion. They affect
surface, shape, and dimensions of the profile and
also the life of the dummy block, liner, mantle and
container housing, and the energy bill. Most
importantly, the goal for the container is to have
temperature stability of the liner, not temperature
uniformity of the mantle [25].
During extrusion, there is a tremendous amount of
heat generated in the container, from the contact
between the heated billet and the container, which
causes a thermal exchange between them. It is then
necessary to heat and control the temperature of the
container in order to minimize this exchange. The
temperature of the container should be in a range
between 20 and 50ºC lower than the temperature of
the billet. This temperature, in spite of allowing a
small thermal exchange, increases the friction
between the billet and the container, causing the
impurities and oxides of the billet surface to be
retained in the bead (process discard) at the end of
the extrusion. The heat generated depends on the
various variables, such as the billet length, the billet
temperature, type of alloy, speed of extrusion and
extrusion ratio [23].
Next, we present the control charts (charts of
average temperatures and temperature amplitudes)
referring to the temperature of the container.
Fig. 26 – Average chart (R) – Container temperature
Fig. 27 – Amplitude chart (R) – Container temperature
From the analysis of the Fig. 26 and Fig. 27 it will
be seen that in general the values are within the
control limits.
4 Conclusion This work had as main goal the usage and
implementation of quality tools, in particular
statistical control of processes tools, in order to
reduce the variability of the process and in this way
to reduce the amount of scrap produced. An analysis
and examination of the main defects that may arise
due to poor use of extrusion parameters, was also
performed. This challenge assumes a high level of
motivated demand, fundamentally for quality
standards and the need for a decrease in
manufacturing costs and an increase in productivity.
During the process control, routinely collected data
are used and this information is available in a
practical way, so that all the employees involved
can improve the process. With this idea in mind, it is
extremely important to develop a new culture in the
company that allows the motivation and cooperation
of all in the search for continuous improvement of
the whole process. Therefore, the SPC effect will
have a great impact on quality and productivity
indicators, adding many gains to the organization,
effectively reflecting the company's objectives. So
the cost of implementing these improvements in
WSEAS TRANSACTIONS on ENVIRONMENT and DEVELOPMENT N. Carvalho, A. Correia, F. De Almeida
E-ISSN: 2224-3496 13 Volume 14, 2018
quality and productivity is almost insignificant, but
the profits can be huge. In the course of this work, a
plan was defined that aimed to determine the main
defects detected during the extrusion process and
the study of possible causes. Thus, it was concluded
from the examination of the critical defects recorded
during the extrusion process that the defects in the
blisters represented around 38% of the defects
recorded in the productions of the period under
analysis. In order to find a response to the high
percentage of this defect, a cause and effect diagram
was developed to represent the relationship between
an effect and all possible causes that may be
contributing to this defect. This type of tool,
together with the brainstorming sessions take
possible to indicate corrective actions.
From proposed actions, Time at the maximum
pressure and Container Temperature control charts
are presented. During the execution of these charts,
there were points outside the control limits, with
respect to the variable "Time at Maximum Pressure"
justifying the need of intervention.
In order to minimize the possibility of points outside
the control limits, it is necessary to periodically train
the employees in order to raise awareness of the
consequences of not having a systemic visualization
of this type of data. To have greater and better
control over the temperatures and times of these two
variables, a recording and monitoring system that is
coupled to the extrusion press is suggested and that
automatically creates an alert whenever the
specification limits are exceeded. This is a highly
recommended measure, because through it the
operator can read the results in a simple and
intuitive way.
References:
[1] Arif, A. F.; Sheikh, A. K. (2005). Extrusion
Product Quality Using Some SPC Tools.
Conference Paper, (September 2015).
[2] Soccol, A. P., O custo da não-qualidade: um
estudo de caso em uma empresa do ramo
automobilístico CEPPG, Nº.25, 2, 2011,
pp.130 - 146
[3] Campos, V. F. TQC Controle da Qualidade
Total, Estilo Japonês – 9ª Ed, 1999.
[4] Nogueira, L. J. M., Melhoria da Qualidade
através de Sistemas Poka – Yoke, 2010.
Retrieved from https://repositorio-
aberto.up.pt/bitstream/10216/59614/1/0001413
04.pdf
[5] Pires, A. R., Sistemas de Gestão da Qualidade,
Edições Silabo, 2ª Ed, 2016.
[6] Juran, J. M., Godfrey, A. B. Juran’s Quality
Control Handbook. McGrawHill, 1998
[7] Júnior, J. D. F. S., Aplicação de métodos
estatísticos para o controlo e melhoria do
processo: produção de rolhas técnicas de
cortiça, PhD Thesis, University Nova de
Lisboa, 2014.
[8] Pacheco, M. C. S., O uso das ferramentas da
qualidade nas organizações Portuguesas, PhD
Thesis, University of Minho, 2012.
[9] Sanches, C.; Meireles, M. Proposta de Modelo
Para Obter Relação Funcional Entre Causas e
Efeitos. In: Iberoamerican Academy
Conference. 2013.
[10] Mengesha, Y; Singh, A. P; Amedie, W. Y.
Quality Improvement Using Statistical Process
Control Tools in Glass Bottles Manufacturing
Company. International Journal for Quality
Research, Vol.7, Nº1, 2013, pp.107-126.
[11] Tarı́, J. J.; Sabater, V. Quality tools and
techniques: Are they necessary for quality
management? International Journal of
Production Economics, Vol. 92, Nº.3, 2004, pp.
267-280.
[12] Montgomery, D. C., Introduction to statistical
Quality Control. (John Wiley, Ed.) (6th ed.).
Jefferson City, 2009.
[13] Godina, R., Controlo estatístico do processo:
um estudo de caso numa empresa na área da
indústria automóvel, PhD Thesis. Universidade
da Beira Interior, 2013.
[14] Marques, P. A., Cardeira, C., & Paranhos, P.
(2016). Controlo Estatístico de Processo em
Contextos “Short Run”: Modelo de Decisão,
137–166.
[15] Mystica, A. (2015). International journal of
research in commerce & management
statistical process control. Retrieved from
http://ijrcm.org.in/
[16] Oakland, J. S. (1991). Total quality
management. Heinemann Professional, 1989).
[17] Kurokawa, E., et al. Utilizando o histograma
como uma ferramenta estatística de análise da
produção de água tratada de Goiânia. In:
XXVIII Congresso Interamericano de
Ingeniería Sanitária e Ambiente, 2002.
[18] Santos, A. N.; TEIXEIRA, A., Gestão da
qualidade: de Deming ao modelo de excelência
da EFQM. Lisboa: Edições Sílabo, 2007.
[19] Teófilo, R. M. S., Implementação de controlo
estatístico a um processo de injeção de
plásticos, PhD Thesis, University Nova de
Lisboa 2014
[20] Ribeiro, J. L. D., Caten, C. S. ten. (2012).
Série monográfica Qualidade Controle
WSEAS TRANSACTIONS on ENVIRONMENT and DEVELOPMENT N. Carvalho, A. Correia, F. De Almeida
E-ISSN: 2224-3496 14 Volume 14, 2018
Estatístico do Processo. Controle Estatístico do
Processo, 2012.
[21] Oliveira, JB de, et al. Análise da capacidade de
um processo: Um estudo de caso baseado nos
indicadores CP e CPK. Anais. XXI ENEGEP–
Encontro Nacional de Engenharia de Produção,
Belo Horizonte, UFMG, Brasil, 2011.
[22] Fernandes, D. (2013). Diana Elisabete Vilaça
Fernandes, Contributo para a melhoria da
qualidade de processos de extrusão na indústria
de cabos elétricos, PhD Thesis, University of
Minho, 2014.
[23] Lopes, J. (2011). Aplicação de CEP em
Variáveis de Extrusão de Aluminio.
[24] Meng, C. (2010). Effect of Preheating
Condition on Strength of AA6060 Aluminium
Alloy for Extrusion. School of Engineering,
MSc(March), 136.
[25] Robbins, B. P. (2014). The Extrusion Press
Container: Thermal Stability of the Liner Not
Uniformity of the Container Mantle,
(December).
WSEAS TRANSACTIONS on ENVIRONMENT and DEVELOPMENT N. Carvalho, A. Correia, F. De Almeida
E-ISSN: 2224-3496 15 Volume 14, 2018