Embed Size (px)
Citation preview
E L S E V I E R ISA Transactions 35 (1996) 25-32
ISA TRANSACTIONS ®
The evaluation of safety instrumented systems - - past the hype
Paul Gruhn Industrial Control Services, 16400-A Park Row, Houston, TX 77084-5015, USA
tools to peer
Abstract
Just as there are many different levels of risk in many different process facilities, there are many different ways of designing safety instrumented systems. Questions abound as to which technology should be used (electric, electronic, or programmable), what level of redundancy is appropriate (single, dual, or triple), how often should systems be tested (monthly, quarterly, yearly, or once per shutdown) and what type of field devices should be used (discrete, analog, smart, redundant, etc). Debate continues as to how one even makes these choices (past experience, qualitative judgment, quantitative analysis, etc). Current national and international draft standards (as well as existing guidelines) on the design of safety instrumented systems are performance oriented, rather than prescriptive. The ISA draft standard, for example, identifies three "safety integrity levels" and cites performance requirements for each level. Simply put, different levels of risk require different levels of safety system performance. This is in line with recent national legislation (29 CFR 1910.119) on process safety management which states that users must "determine and document that systems are designed and operating in a safe manner" (emphasis added). This paper will review the use of one engineering tool currently available for analyzing the performance of safety control systems, and how the information obtained may be used to help develop company standards for the design of these systems. © 1996 Elsevier Science Ltd.
Keywords: Safety shutdown systems; Reliability; Availability; Risk; PLCs
1. Introduct ion
Users and engineering firms are faced with a problem - - there are so many choices to make in the design of safety instrumented systems (also referred to as shutdown and interlock systems) that it is causing considerable consternation. It might be com- pared to walking into an electronics store with the intention of buying a " p l a i n and s imple" CD player, but finding a bewildering array of over 200 choices from 30 different manufacturers varying in price from $125 to $1000. And as if that weren ' t enough, suppose that each manufacturer had their own sales- man in the store, each doing his best to convince you
that his company ' s product was the best. When faced with too many choices, it becomes difficult to decide at all.
I t ' s often easier to ask a trusted friend what he bought, and then say " W e l l .... if i t ' s good enough for him . . ." .
There are a huge variety of systems available for safety related control systems - - hardwired relays, hardwired solid state systems, as well as single, dual, and triple programmable (software based) systems. Some systems are "genera l purpose" , some are " p u r p o s e des igned" specifically for safety. Some vendors have only one product to offer, while others have mult iple systems to choose from. Is one system
0019-0578/96/$15.00 + 0.00 © 1996 Elsevier Science Ltd. All rights reserved. PII: S0019-0578(96)00004-3
26 P. Gruhn / ISA Transactions 35 (1996) 25-32
always the best? Does the choice of system depend upon the application? How does one even decide?
2. The problem
Table 1 illustrates the problem. Considering just one technology (microprocessor) and the various de- sign options available, which system is "be s t " ? It is important to realize that since safety systems can fail in (at least) two ways, there are two categories for "bes t " . A safety system should not suffer nuisance trips and shut the plant down when nothing is actu- ally wrong. Good performance in this mode equates to high plant production rates. A safety system must also function when actually required. It is possible to have the plant producing product, however the safety system might be off in an endless loop. This sort of failure naturally poses a safety concern. So, referring back to Table 1, which system is "be s t " as far as (a) the fewest nuisance trips, and (b) the best safety performance? Is one system the best in both modes?
Many issues are not even addressed in Table 1. For example, what type of sensor should be used; discrete switches, analog transmitters, smart trans- mitters? Also, there are many different "dua l" con- figurations; 1 out of 2 (1oo2) where only one chan- nel is required to generate a shutdown; 2 out of 2 (2oo2) where both channels are required to generate a shutdown; hot back-up, where only one channel is on-line at a time; or 2oo2 reverting to lool in the event of a failure.
If making such a choice were "easy" , then the different groups writing standards would have been done long ago. As it is, the ISA SP84 group has been an ongoing effort for more than 10 years. If you ask 10 different people which of the above systems were "bes t " , you might easily get 10 differ- ent answers, even among committee members! Just how is one expected to make such decision?
3. Quantitative analysis tools
The field of engineering is a quantitative disci- pline. Decisions involving the sizing of valves, tur- bines, pipe, etc. are all based on quantitative calcula- tions. It would hardly be acceptable to buy a million dollar compressor by looking past your thumb and declaring, "Eh, looks about right to me!" There would be little reassurance knowing the seat belts and air bag system in your car were chosen merely because the designers said, "Well.. .that 's what our vendor recommended".
The author must admit that the reluctance of some to accept a quantitative viewpoint regarding the anal- ysis of safety systems is understandable. For exam- ple:
In order to evaluate the reliability of systems, one needs failure rate data. Meaningful data is difficult, or sometimes impossible, to come by. The data that does exist frequently spans two orders of magnitude. A mean time between failure (MTBF) spanning from 5 to 500 years, admittedly, is not very helpful.
Table 1 Which system is "bes t "?
Sensor Logic Diagnostic Common Final element Manual test configuration configuration coverage cause configuration interval
Single Single 99% 1% Single Weekly Dual Single 90% 10% Single Monthly Triple Single 80% 1% Dual Yearly Single Dual 95% 1% Single Weekly Dual Dual 95% 1% Dual Monthly Single Triple 99% 10% Single Yearly Dual Triple 95 % 1% Single Monthly Triple Triple 99% 1% Dual Yearly Triple Triple 95% 10% Dual Weekly
Diagnostic coverage: The percentage of dangerous (fail to function) failures that the system can recognize on its own. Common cause: The percentage of failures that may impact the entire redundant system (e.g. power or software bug). Manual test interval: Automatic testing is imperfect, therefore systems must be periodically tested manually.
P. Gruhn lISA Transactions 35 (1996)25-32 27
What assumptions and simplifications were made in the analysis? For example, neglecting common cause and imperfect manual testing may throw an answer off three orders of magnitude. The modeling assumptions have far more of an impact than the level of detail or complexity of any particular method. Reliability models are like captured foreign spies, if you torture them long enough, they'll tell you any- thing.
Some models are simple enough to do with a hand calculator. Others are more complex and re- quire the use of a personal computer. One should never be impressed, however, with calculated results merely because it comes from a computer. The virtue of a computer is speed, not intelligence.
There are a number of " tools" currently available for the analysis of control systems. Some engineers use fault trees, others use control system HAZOPs (Hazard and Operability Study), or reliability block diagrams, or Markov models, to name just a few. Each has its strengths, and each its weaknesses. This author prefers the use of Markov models for the analysis of safety control systems, combined with fault trees for the analysis of the entire system (field devices and the process). Markov models easily ac- count for imperfect automatic and manual testing, common cause, redundant configurations, repair rates and much more. Reference [1] develops algebraic solutions for Markov models (and has been available for 14 years).
The following case studies were all run using a specialized modeling program [2]. The length limita- tions of this paper prohibit a full discussion of the program and the basis of its calculations. The follow- ing discussions and use of only the final calculated results of the program is not meant to imply any degree of "black magic" or that the theory is overly complex. The math is simple (algebra) and the pro- gram is intended for the masses, not just for "clever number crunchers' '.
4. Meaningful metrics
In order to evaluate systems, one needs a yard- stick to measure by. There have been many different performance terms used over the years, unfortu- nately, some of them only made the situation worse.
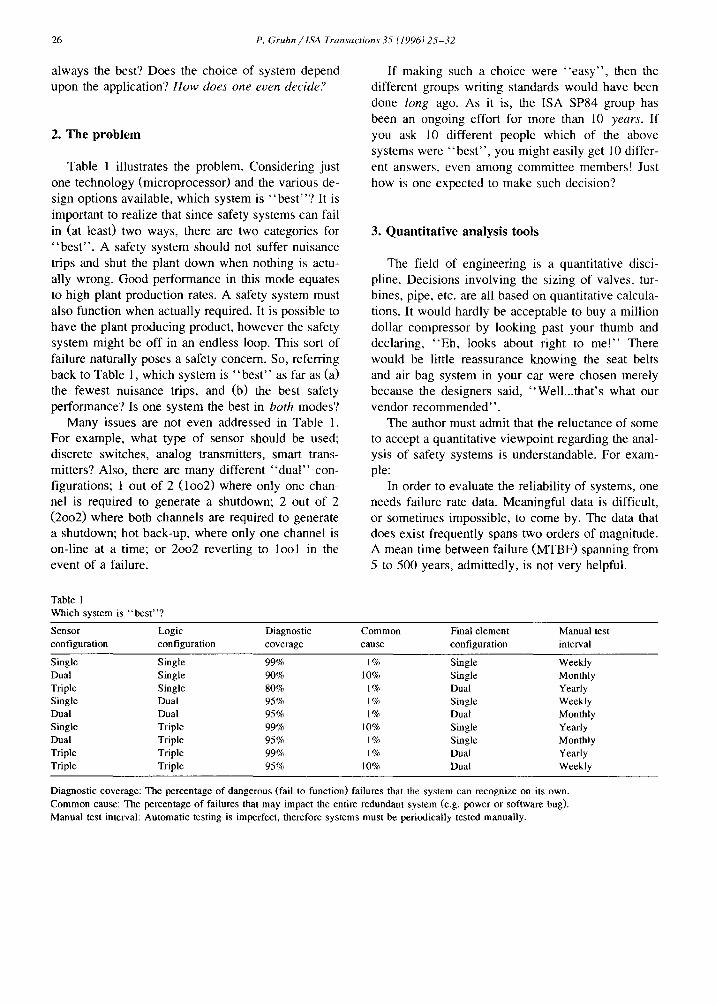
Safety system suffers inhibiting Plant is running, safety failure; plant~. "available', the system is functional; safety system isnot. ~ b o t h are "available'.
Safety system suffers initiating failure (nuisance trip) and shuts down plant" both are not "available'.
Fig. l. Confusion caused by the term availability.
Even within the SP84 committee, there has been little agreement even on this topic, and the terms used have changed every few years.
A common performance term is Availability. While the term is simple to understand, it is difficult to relate to and is potentially misleading. Most logic boxes have availability numbers very close to 100% (e.g. 99.995%). This may sound wonderful, but what does it really mean? Most people want to know how often the control system will fail. In other words, how many years between failures. It is easier to relate to a nuisance trip once every 6 months (on average), or once every 60 years, than an availability of 99.995%. This paper will use the term nuisance trip rate to describe the performance in the safe, nuisance trip failure mode.
When referring to the dangerous, or fail to func- tion, performance of a system, the term availability is also difficult to relate to. This is because different people mean different things when they use the term "availability". For example, if the safety system is off in an endless loop, or if an I / O point is stuck on, the safety system is unavailable to do its intended function. But since this failure is not revealed and does not shut the plant down, the plant is still
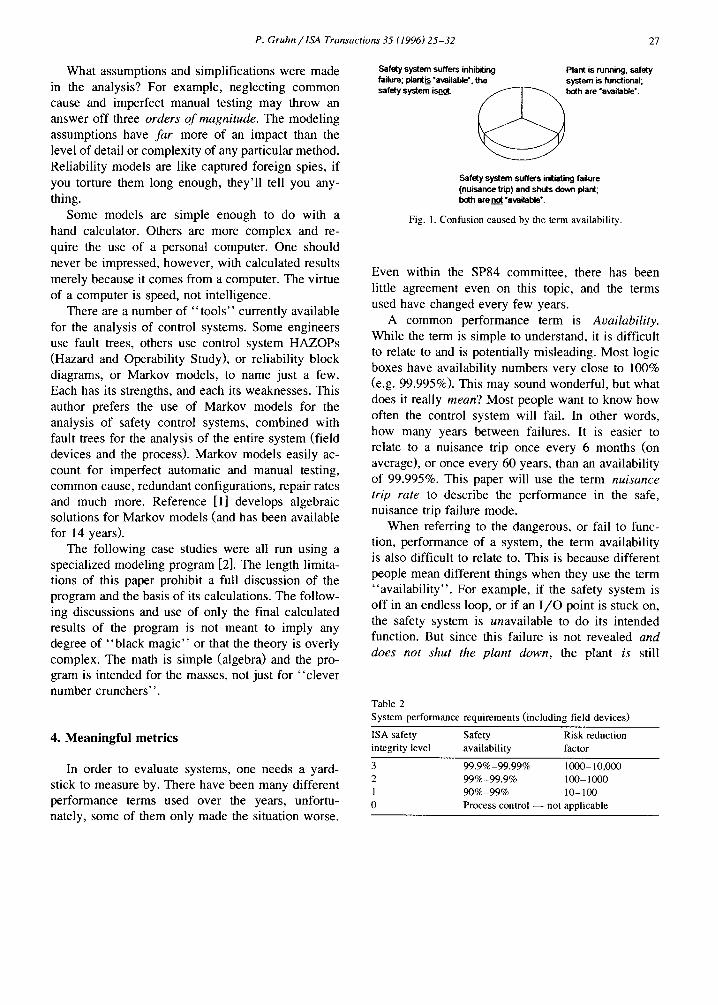
Table 2 System performance requirements (including field devices)
ISA safety Safety Risk reduction integrity level availability factor
3 99.9% -99.99% 1000-10,000 2 99%-99.9% 100-1000 1 90%-99% 10-100 0 Process control - - not applicable
28 P. Gruhn / ISA Transactions 35 (1996) 25-32
Acceptable Risk Level
~ . . . . .
Risk inherent in the process
R i s k ,-
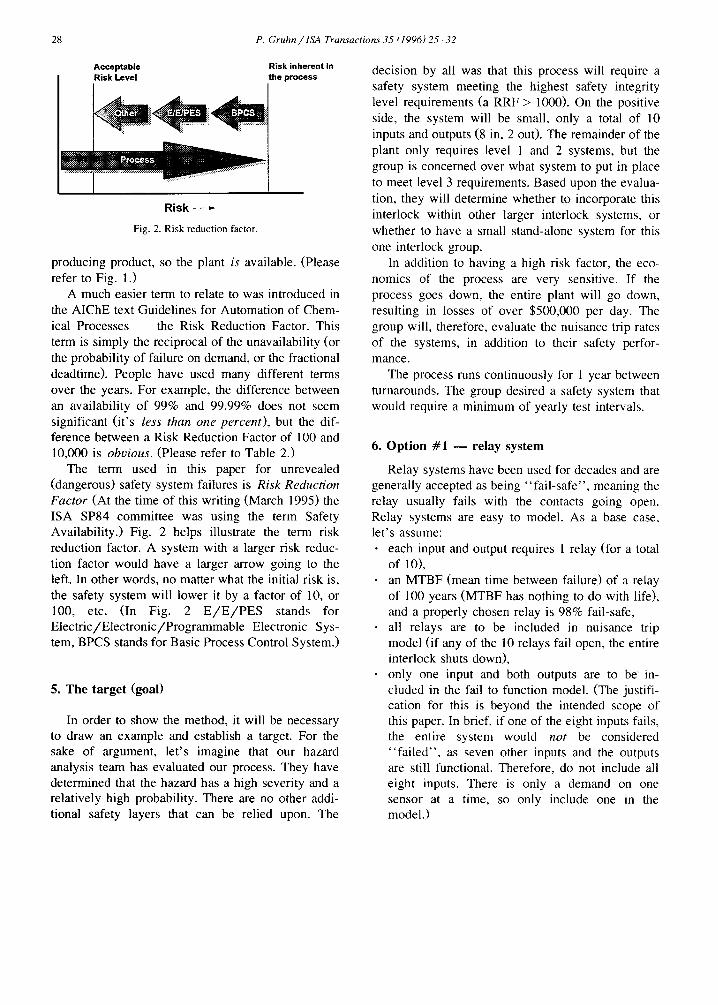
Fig. 2. Risk reduction factor.
producing product, so the plant is available. (Please refer to Fig. 1.)
A much easier term to relate to was introduced in the AIChE text Guidelines for Automation of Chem- ical Processes - - the Risk Reduction Factor. This term is simply the reciprocal of the unavailability (or the probability of failure on demand, or the fractional deadtime). People have used many different terms over the years. For example, the difference between an availability of 99% and 99.99% does not seem significant (it's less than one percent) , but the dif- ference between a Risk Reduction Factor of 100 and 10,000 is obvious. (Please refer to Table 2.)
The term used in this paper for unrevealed (dangerous) safety system failures is Risk Reduction Factor (At the time of this writing (March 1995) the ISA SP84 committee was using the term Safety Availability.) Fig. 2 helps illustrate the term risk reduction factor. A system with a larger risk reduc- tion factor would have a larger arrow going to the left. In other words, no matter what the initial risk is, the safety system will lower it by a factor of 10, or 100, etc. (In Fig. 2 E / E / P E S stands for Electric/Electronic/Programmable Electronic Sys- tem, BPCS stands for Basic Process Control System.)
5. The target (goal)
In order to show the method, it will be necessary to draw an example and establish a target. For the sake of argument, let's imagine that our hazard analysis team has evaluated our process. They have determined that the hazard has a high severity and a relatively high probability. There are no other addi- tional safety layers that can be relied upon. The
decision by all was that this process will require a safety system meeting the highest safety integrity level requirements (a RRF > 1000). On the positive side, the system will be small, only a total of 10 inputs and outputs (8 in, 2 out). The remainder of the plant only requires level 1 and 2 systems, but the group is concerned over what system to put in place to meet level 3 requirements. Based upon the evalua- tion, they will determine whether to incorporate this interlock within other larger interlock systems, or whether to have a small stand-alone system for this one interlock group.
In addition to having a high risk factor, the eco- nomics of the process are very sensitive. If the process goes down, the entire plant will go down, resulting in losses of over $500,000 per day. The group will, therefore, evaluate the nuisance trip rates of the systems, in addition to their safety perfor- mance.
The process runs continuously for 1 year between turnarounds. The group desired a safety system that would require a minimum of yearly test intervals.
6. Option #1 - - relay system
Relay systems have been used for decades and are generally accepted as being "fail-safe", meaning the relay usually fails with the contacts going open. Relay systems are easy to model. As a base case, let's assume:
each input and output requires 1 relay (for a total of 10), an MTBF (mean time between failure) of a relay of 100 years (MTBF has nothing to do with life), and a properly chosen relay is 98% fail-safe, all relays are to be included in nuisance trip model (if any of the 10 relays fail open, the entire interlock shuts down), only one input and both outputs are to be in- cluded in the fail to function model. (The justifi- cation for this is beyond the intended scope of this paper. In brief, if one of the eight inputs fails, the entire system would not be considered "failed", as seven other inputs and the outputs are still functional. Therefore, do not include all eight inputs. There is only a demand on one sensor at a time, so only include one in the model.)
P. Gruhn / ISA Transactions 35 (1996) 25-32 29
• repair rate = 4 hours, • manual test interval = 12 months, • field devices will not be included in the scope
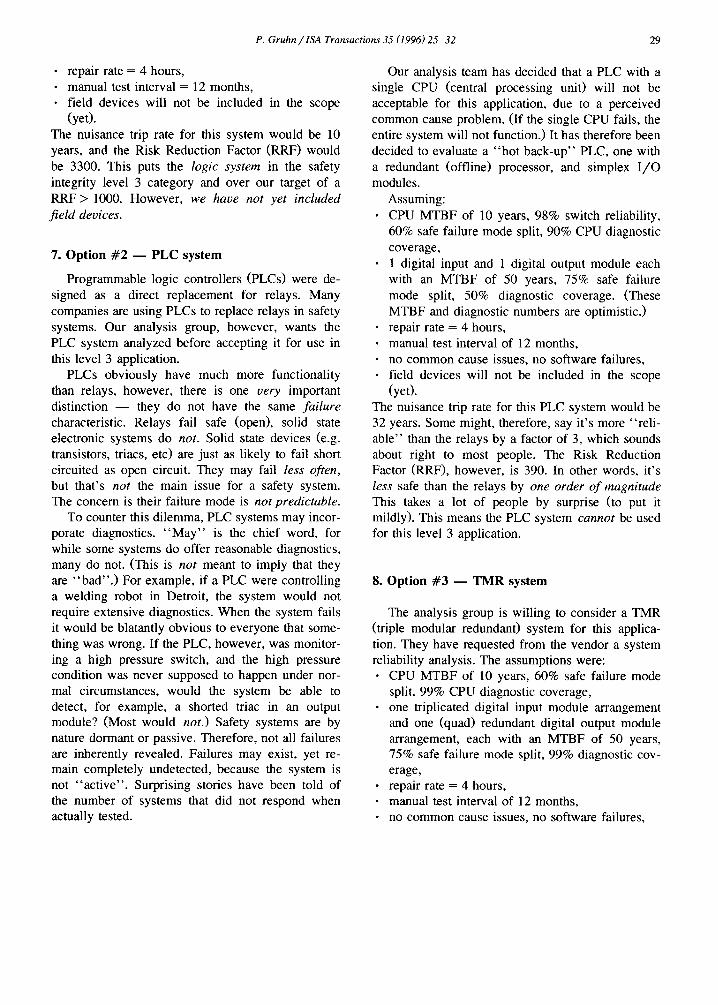
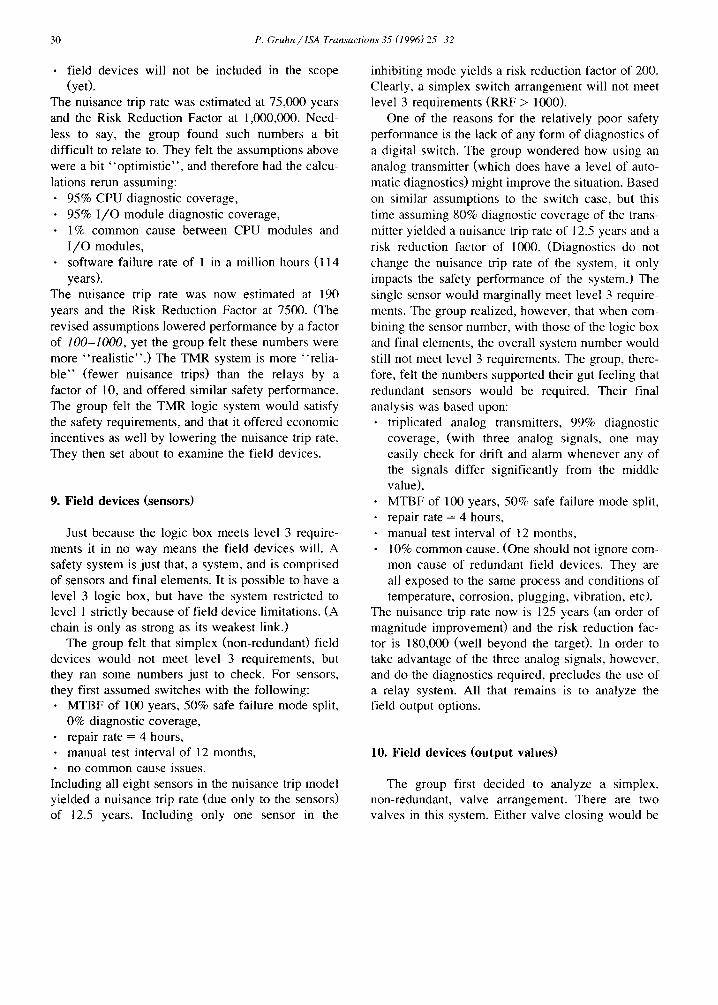
(yet). The nuisance trip rate for this system would be 10 years, and the Risk Reduction Factor (RRF) would be 3300. This puts the logic system in the safety integrity level 3 category and over our target of a RRF > 1000. However, we have not yet included
f ie ld devices.
7. Opt ion # 2 - - P L C system
Programmable logic controllers (PLCs) were de- signed as a direct replacement for relays. Many companies are using PLCs to replace relays in safety systems. Our analysis group, however, wants the PLC system analyzed before accepting it for use in this level 3 application.
PLCs obviously have much more functionality than relays, however, there is one very important distinction - - they do not have the same fa i lure characteristic. Relays fail safe (open), solid state electronic systems do not. Solid state devices (e.g. transistors, triacs, etc) are just as likely to fail short circuited as open circuit. They may fail less often, but that's not the main issue for a safety system. The concern is their failure mode is not predictable.
To counter this dilemma, PLC systems may incor- porate diagnostics. " M a y " is the chief word, for while some systems do offer reasonable diagnostics, many do not. (This is not meant to imply that they are " b a d " . ) For example, if a PLC were controlling a welding robot in Detroit, the system would not require extensive diagnostics. When the system fails it would be blatantly obvious to everyone that some- thing was wrong. If the PLC, however, was monitor- ing a high pressure switch, and the high pressure condition was never supposed to happen under nor- mal circumstances, would the system be able to detect, for example, a shorted triac in an output module? (Most would not.) Safety systems are by nature dormant or passive. Therefore, not all failures are inherently revealed. Failures may exist, yet re- main completely undetected, because the system is not "ac t ive" . Surprising stories have been told of the number of systems that did not respond when actually tested.
Our analysis team has decided that a PLC with a single CPU (central processing unit) will not be acceptable for this application, due to a perceived common cause problem. (If the single CPU fails, the entire system will not function.) It has therefore been decided to evaluate a " h o t back-up" PLC, one with a redundant (offline) processor, and simplex I / O modules.
Assuming: • CPU MTBF of l0 years, 98% switch reliability,
60% safe failure mode split, 90% CPU diagnostic coverage,
• 1 digital input and 1 digital output module each with an MTBF of 50 years, 75% safe failure mode split, 50% diagnostic coverage. (These MTBF and diagnostic numbers are optimistic.)
• repair rate = 4 hours, • manual test interval of 12 months, • no common cause issues, no software failures, • field devices will not be included in the scope
(yet). The nuisance trip rate for this PLC system would be 32 years. Some might, therefore, say it 's more "reli- able" than the relays by a factor of 3, which sounds about right to most people. The Risk Reduction Factor (RRF), however, is 390. In other words, it 's less safe than the relays by one order o f magnitude This takes a lot of people by surprise (to put it mildly). This means the PLC system cannot be used for this level 3 application.
8. Option # 3 - - TMR system
The analysis group is willing to consider a TMR (triple modular redundant) system for this applica- tion. They have requested from the vendor a system reliability analysis. The assumptions were: • CPU MTBF of 10 years, 60% safe failure mode
split, 99% CPU diagnostic coverage, • one triplicated digital input module arrangement
and one (quad) redundant digital output module arrangement, each with an MTBF of 50 years, 75% safe failure mode split, 99% diagnostic cov- erage,
• repair rate = 4 hours, • manual test interval of 12 months, • no common cause issues, no software failures,
30 P. Gruhn/lSA Transactions 35 (1996) 25 32
field devices will not be included in the scope (yet).
The nuisance trip rate was estimated at 75,000 years and the Risk Reduction Factor at 1,000,000. Need- less to say, the group found such numbers a bit difficult to relate to. They felt the assumptions above were a bit "opt imis t ic" , and therefore had the calcu- lations rerun assuming: • 95% CPU diagnostic coverage, • 95% I / O module diagnostic coverage,
1% common cause between CPU modules and I / O modules,
• software failure rate of 1 in a million hours (114 years).
The nuisance trip rate was now estimated at 190 years and the Risk Reduction Factor at 7500. (The revised assumptions lowered performance by a factor of 100-1000, yet the group felt these numbers were more "real is t ic".) The TMR system is more "relia- b le" (fewer nuisance trips) than the relays by a factor of 10, and offered similar safety performance. The group felt the TMR logic system would satisfy the safety requirements, and that it offered economic incentives as well by lowering the nuisance trip rate. They then set about to examine the field devices.
9. Field devices (sensors)
Just because the logic box meets level 3 require- ments it in no way means the field devices will. A safety system is just that, a system, and is comprised of sensors and final elements. It is possible to have a level 3 logic box, but have the system restricted to level 1 strictly because of field device limitations. (A chain is only as strong as its weakest link.)
The group felt that simplex (non-redundant) field devices would not meet level 3 requirements, but they ran some numbers just to check. For sensors, they first assumed switches with the following: • MTBF of 100 years, 50% safe failure mode split,
0% diagnostic coverage, • repair rate = 4 hours, • manual test interval of 12 months, • no common cause issues.
Including all eight sensors in the nuisance trip model yielded a nuisance trip rate (due only to the sensors) of 12.5 years. Including only one sensor in the
inhibiting mode yields a risk reduction factor of 200. Clearly, a simplex switch arrangement will not meet level 3 requirements (RRF > 1000).
One of the reasons for the relatively poor safety performance is the lack of any form of diagnostics of a digital switch. The group wondered how using an analog transmitter (which does have a level of auto- matic diagnostics) might improve the situation. Based on similar assumptions to the switch case, but this time assuming 80% diagnostic coverage of the trans- mitter yielded a nuisance trip rate of 12.5 years and a risk reduction factor of 1000. (Diagnostics do not change the nuisance trip rate of the system, it only impacts the safety performance of the system.) The single sensor would marginally meet level 3 require- ments. The group realized, however, that when com- bining the sensor number, with those of the logic box and final elements, the overall system number would still not meet level 3 requirements. The group, there- fore, felt the numbers supported their gut feeling that redundant sensors would be required. Their final analysis was based upon:
triplicated analog transmitters, 99% diagnostic coverage, (with three analog signals, one may easily check for drift and alarm whenever any of the signals differ significantly from the middle value), MTBF of 100 years, 50% safe failure mode split, repair rate = 4 hours, manual test interval of 12 months, 10% common cause. (One should not ignore com- mon cause of redundant field devices. They are all exposed to the same process and conditions of temperature, corrosion, plugging, vibration, etc).
The nuisance trip rate now is 125 years (an order of magnitude improvement) and the risk reduction fac- tor is 180,000 (well beyond the target). In order to take advantage of the three analog signals, however, and do the diagnostics required, precludes the use of a relay system. All that remains is to analyze the field output options.
10. Field devices (output values)
The group first decided to analyze a simplex, non-redundant, valve arrangement. There are two valves in this system. Either valve closing would be
P. Gruhn / ISA Transactions 35 (1996) 25-32 31
considered a nuisance trip, and both valves must work in order to prevent a hazard. Therefore, both valves must be included in the initiating and inhibit- ing performance models . Assuming: • non-intelligent solenoids and valves, 0% diagnos-
tic coverage, • MTBF of 50 years, 50% safe failure mode split,
• repair rate = 4 hours, • manual test interval of 12 months.
The nuisance trip rate due to the valves is 25 years, and the risk reduction factor is 50. This will only meet level 1 requirements, so another alternative must be chosen. The group considered dual block and bleed valves for each output (a 1 oo2 - - one out
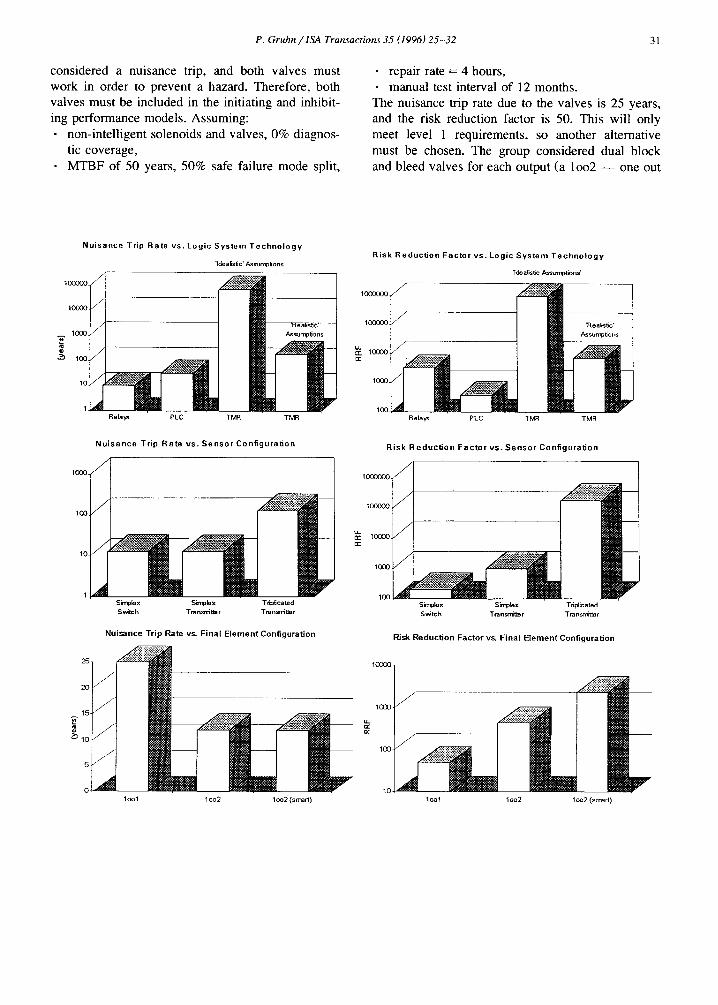
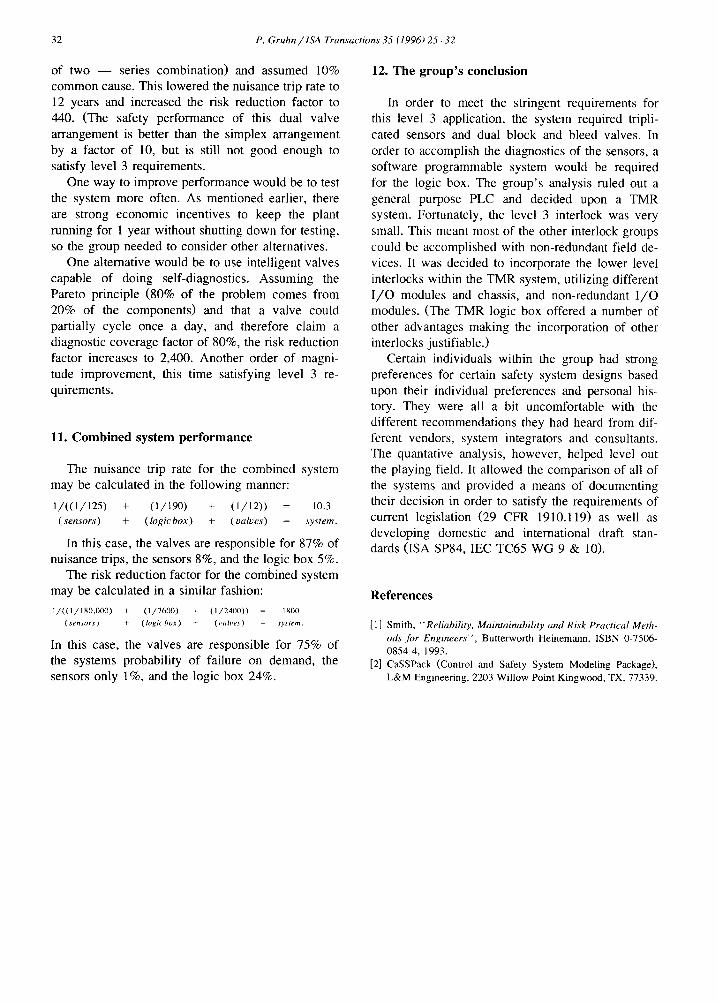
N u i s a n c e Tr ip R a t e vs. L o g i c S y s t e m T e c h n o l o g y
Idealistic* Assun~ons
tO00OO.
10600.
1000.
~-~ 100.
Relays PLC
i
Assun~6or
TMR TMR
R i s k R e d u c t i o n F a c t o r vs . Log ic S y s t e m T e c h n o l o g y
1de alislic Assun~6ons'
1£K)(X)O ! "Roa!is~c' Assurr~fions
IO0 Relays PLC TMR TMR
N u i s a n c e Tr ip R a t e vs . S e n s o r C o n f i g u r a t i o n R isk R e d u c t i o n F a c t o r vs . S e n s o r C o n f i g u r a t i o n
1000.
100.
tO.
~ ~ " ~
| , | , Simplex Simplex Ttiplica ted S~tch Transrtitte r Transr~tter
Nuisance Trip Rate vs. F inal E l e m e n t Configurat ion
IO(03OOO
10,3OOO
1<xx~o
I0<30
IOO Simplex S~nplax Sv~tch T~n~tlar
I m
Tnp~icated T~n~r
Risk Reduct ion Factor vs. F inal E lement Configurat ion
25
20-
15- ~Z
I0 :
0
f
/
f
I~1 I~2
V loo2 (sma~)
100C ~
1(3(
1(
lool loo2 loo2 (smart)
32 P. Gruhn / ISA Transactions 35 (1996) 2 5 - 3 2
of two - - series combination) and assumed 10% common cause. This lowered the nuisance trip rate to 12 years and increased the risk reduction factor to 440. (The safety performance of this dual valve arrangement is better than the simplex arrangement by a factor of 10, but is still not good enough to satisfy level 3 requirements.
One way to improve performance would be to test the system more often. As mentioned earlier, there are strong economic incentives to keep the plant running for 1 year without shutting down for testing, so the group needed to consider other alternatives.
One alternative would be to use intelligent valves capable of doing self-diagnostics. Assuming the Pareto principle (80% of the problem comes from 20% of the components) and that a valve could partially cycle once a day, and therefore claim a diagnostic coverage factor of 80%, the risk reduction factor increases to 2,400. Another order of magni- tude improvement, this time satisfying level 3 re- quirements.
11. Combined system performance
The nuisance trip rate for the combined system may be calculated in the following manner:
1 / ( ( 1 / 1 2 5 ) + (1 /190) + (1 /12 ) ) = 10.3
(sensors) + ( log icbox ) + (va lves ) = system.
In this case, the valves are responsible for 87% of nuisance trips, the sensors 8%, and the logic box 5%.
The risk reduction factor for the combined system may be calculated in a similar fashion:
1/((1/180.000) + (1/7600) + (1/2400)) 1800 (sensors) + ( logic box) + (valve~) system.
In this case, the valves are responsible for 75% of the systems probability of failure on demand, the sensors only 1%, and the logic box 24%.
12. The group's conclusion
In order to meet the stringent requirements for this level 3 application, the system required tripli- cated sensors and dual block and bleed valves. In order to accomplish the diagnostics of the sensors, a software programmable system would be required for the logic box. The group's analysis ruled out a general purpose PLC and decided upon a TMR system. Fortunately, the level 3 interlock was very small. This meant most of the other interlock groups could be accomplished with non-redundant field de- vices. It was decided to incorporate the lower level interlocks within the TMR system, utilizing different I / O modules and chassis, and non-redundant I / O modules. (The TMR logic box offered a number of other advantages making the incorporation of other interlocks justifiable.)
Certain individuals within the group had strong preferences for certain safety system designs based upon their individual preferences and personal his- tory. They were all a bit uncomfortable with the different recommendations they had heard from dif- ferent vendors, system integrators and consultants. The quantative analysis, however, helped level out the playing field. It allowed the comparison of all of the systems and provided a means of documenting their decision in order to satisfy the requirements of current legislation (29 CFR 1910.119) as well as developing domestic and international draft stan- dards (ISA SP84, IEC TC65 WG 9 & 10).
References
[1] Smith, "'Reliability, Maintainabili ty and Risk Practical Meth- ods for Engineers" , Butterworth Heinemann, ISBN 0-7506- 0854-4, 1993.
[2] CaSSPack (Control and Safety System Modeling Package), L&M Engineering, 2203 Willow Point Kingwood, TX, 77339.