Embed Size (px)
Citation preview
Contract No.: 500-95-0047 (09) MPR Reference No.: 8756-420
The Evaluation of the Medicare Coordinated Care Demonstration: Findings for the First Two Years March 21, 2007 Randall Brown Deborah Peikes Arnold Chen Judy Ng Jennifer Schore Clara Soh
Submitted to:
Centers for Medicare & Medicaid Services Office of Strategic Planning C3-20-17 7500 Security Boulevard Baltimore, MD 21244
Project Officer:
Carol Magee
Submitted by:
Mathematica Policy Research, Inc. P.O. Box 2393 Princeton, NJ 08543-2393 Telephone: (609) 799-3535 Facsimile: (609) 799-0005
Project Director:
Randall Brown
The analyses upon which this publication is based were performed under Contract Number 500-95-0047, entitled �Managed Care Research and Demonstration Task Order Contracts,� sponsored by the Centers for Medicare & Medicaid Services, Department of Health and Human Services.

iii
ACKNOWLEDGEMENTS
This report has benefited greatly from the cooperation, insights and support of many people. First among these are three CMS staff: Carol Magee (our project officer), Cynthia Mason (the project officer for the demonstration), and Renee Mentnech (the director of CMS�s Research and Evaluations Group in the Office of Research, Development and Information). Their helpful comments, wise counsel, and collegial attitudes greatly enriched the report and our experience in producing it. We also thank the directors and staff of the 15 demonstration programs evaluated here. Their willingness to discuss the estimates of their program�s effectiveness and give their opinions on the likely reasons for its successes or shortcomings enhanced our ability to assess what features really lead to effective care coordination. Finally, we thank our numerous colleagues at Mathematica Policy Research, whose assiduous programming, reviewing, editing, and typing were essential and greatly appreciated. Any remaining errors are the authors� own. The opinions reflected herein are those of the authors, and do not necessarily reflect the opinions of CMS, the U.S. Department of Health and Human Services, or the programs evaluated.


v
CONTENTS
Chapter Page
EXECUTIVE SUMMARY........................................................................................ xvii I INTRODUCTION ..........................................................................................................1
A. COSTS OF CHRONIC CARE AND SHORTCOMINGS OF THE HEALTH
SYSTEM..................................................................................................................2 B. INTERVENTIONS TO IMPROVE CHRONIC CARE AND THEIR
EFFECTIVENESS...................................................................................................4 C. MEDICARE DEMONSTRATIONS AND INITIATIVES TO IMPROVE
OUTCOMES FOR BENEFICIARIES WITH CHRONIC ILLNESSES ................7 1. Precursors to the MCCD................................................................................10 2. The MCCD.....................................................................................................10 3. Other CMS Disease Management Initiatives.................................................13
D. PURPOSE OF AND METHODOLOGY FOR THIS REPORT ...........................15 E. THE REST OF THIS REPORT.............................................................................16
II DEMONSTRATION PROGRAM STRUCTURE AND KEY FEATURES ...............17
A. PROGRAM STRUCTURE, EXPERIENCE, AND RELATIONSHIP WITH
PHYSICIANS........................................................................................................17 1. Program Host Organizations..........................................................................18 2. Program Service Areas and Target Populations ............................................18 3. Host Organizations� Experience with Care Coordination .............................21 4. Host Organizations� Relationship to Patients� Physicians.............................21
B. PROGRAM INTERVENTIONS...........................................................................24
1. Care Coordinators� Qualifications, Training, and Caseloads ........................27 2. Assessment and Care Planning ......................................................................30 3. Monitoring .....................................................................................................30

CONTENTS (continued)
Chapter Page
vi
II (continued) 4. Patient Education ...........................................................................................35 5. Communication and Care Coordination ........................................................38 6. Service and Resource Arranging ...................................................................44 7. Efforts to Engage Physicians .........................................................................46 8. Data Systems and Reporting ..........................................................................53 9. Summary ........................................................................................................57
C. QUANTITATIVE SCORING OF INTERVENTION FEATURES .....................59
1. Scoring Approach ..........................................................................................59 2. Rating Score Results ......................................................................................63
III WHO ENROLLED IN THE DEMONSTRATION?....................................................71
A. PATIENT IDENTIFICATION..............................................................................71 B. ENROLLMENT AFTER 2 YEARS......................................................................76
1. Patient Enrollment .........................................................................................76 2. Patient Disenrollment.....................................................................................79 3. Patients� Characteristics.................................................................................81
C. PARTICIPATING PATIENTS AND ELIGIBLE NONPARTICIPATING
BENEFICIARIES..................................................................................................87 D. COMPARISON OF TREATMENT AND CONTROL GROUP MEMBERS .....95 E. SUMMARY...........................................................................................................99
IV PATIENTS� AND PHYSICIANS� PERCEPTIONS ABOUT CARE
COORDINATION AND ITS EFFECTS...................................................................101 A. PATIENTS� SATISFACTION............................................................................102
1. Receipt of Care Coordination and Satisfaction with Care Coordinator.......105 2. Satisfaction with Health Care ......................................................................110

CONTENTS (continued)
Chapter Page
vii
IV (continued) B. PHYSICIANS� SATISFACTION .......................................................................112
1. Effects on Physicians� Practice ....................................................................116 2. Effects on Patients� Self-Management.........................................................118 3. Effects on Service Arrangement ..................................................................120 4. Effects on Care Coordination.......................................................................120 5. Effects on Physician-Patient Relations ........................................................122 6. Effects on Patient Outcomes and Service Use .............................................125 7. Care Coordinators� Clinical Judgment and Competence.............................127 8. Overall Rating..............................................................................................129
V PROGRAM EFFECTS ON PATIENTS� KNOWLEDGE AND BEHAVIOR,
UNMET NEEDS, AND QUALITY OF CARE .........................................................131 A. DATA SOURCES ...............................................................................................132
1. Patient Survey ..............................................................................................132 2. Medicare Claims Data..................................................................................132
B. RECEIPT OF EDUCATION...............................................................................133 C. HEALTH KNOWLEDGE AND HEALTH BEHAVIORS ................................136 D. UNMET NEEDS .................................................................................................137 E. QUALITY OF CARE..........................................................................................139 F. FUNCTIONING, HEALTH STATUS, AND WELL-BEING............................145 G. SUMMARY.........................................................................................................148
VI SHORT-TERM EFFECTS ON MEDICARE EXPENDITURES AND
SERVICE USE ...........................................................................................................151 A. TREATMENT-CONTROL DIFFERENCES IN MEDICARE
EXPENDITURES AND SERVICE USE............................................................152
CONTENTS (continued)
Chapter Page
viii
VI (continued) B. COST NEUTRALITY.........................................................................................168
1. Tests of Cost Neutrality for the Year Following Enrollment
in the Study ..................................................................................................172 2. Tests of Cost Neutrality Over the 25 Months Since
Program Startup ...........................................................................................176 VII SUMMARY AND CONCLUSION............................................................................183
A. NO SINGLE FACTOR STANDS OUT AS KEY TO A SUCCESSFUL
INTERVENTION................................................................................................184 B. THE FINDINGS FOR THE FIRST 2 YEARS ARE NOT HIGHLY
FAVORABLE, BUT THEY COULD IMPROVE ..............................................188 C. THE FINAL REPORT WILL COVER 4 PROGRAM YEARS .........................189
REFERENCES............................................................................................................191
APPENDIX A: SUPPLEMENTAL TABLES FOR CHAPTER II: DEMONSTRATION PROGRAM STRUCTURE AND KEY FEATURES.............................................................................A.1
APPENDIX B: SCORING METHODOLOGY AND ASSESSMENT FORM ........B.1 APPENDIX C: SUPPLEMENTAL TABLES FOR CHAPTER V: PROGRAM
EFFECTS ON PATIENTS� KNOWLEDGE, BEHAVIOR, UNMET NEEDS, AND QUALITY OF CARE...............................C.1
ix
TABLES
Table Page
II.1 CARE COORDINATORS� CONTACTS FOR ANY PURPOSE DURING THE YEAR AFTER RANDOM ASSIGNMENT, AMONG 1ST-YEAR ENROLLEES.......................................................................................... 26
II.2 CARE COORDINATORS� CONTACTS FOR ASSESSMENT AND ROUTINE MONITORING DURING THE YEAR AFTER RANDOM ASSIGNMENT, AMONG 1ST-YEAR ENROLLEES.............................................. 34
II.3 CARE COORDINATORS� CONTACTS FOR EDUCATION DURING THE YEAR AFTER RANDOM ASSIGNMENT, AMONG 1ST-YEAR ENROLLEES.......................................................................................... 39
II.4 CARE COORDINATORS� CONTACTS TO ARRANGE FOR SERVICES DURING THE YEAR AFTER RANDOM ASSIGNMENT, AMONG 1ST-YEAR ENROLLEES.......................................................................................... 45
II.5 PROGRAMS� PROVISION OF GOODS AND SERVICES DURING THE YEAR AFTER RANDOM ASSIGNMENT, AMONG 1ST-YEAR ENROLLEES.......................................................................................... 47
II.6 INTER-RATER CONSISTENCY FOR PROGRAM DOMAINS, AS ASSESSED BY INTRACLASS CORRELATION COEFFICIENTS....................... 62
II.7 DEMONSTRATION PROGRAMS IN DESCENDING ORDER OF RATING SCORES FOR EACH DOMAIN ............................................................... 64
III.1 TARGET ENROLLMENTS VERSUS ACTUAL ENROLLMENTS AFTER TWO YEARS................................................................................................ 72
III.2 PROGRAM ENROLLMENTS AND DISENROLLMENTS DURING THE 1ST YEAR OF OPERATIONS.................................................................................. 80
III.3 DEMONSTRATION PARTICIPANTS� AGES AND OTHER DEMOGRAPHIC CHARACTERISTICS.................................................................. 82
III.4 DEMONSTRATION PARTICIPANTS, BY MEDICARE STATUS AND DIAGNOSIS ..................................................................................................... 85
III.5 NUMBER OF PARTICIPANTS AND COMPARABLE NONPARTICIPANTS BY CLAIMS DATA............................................................. 89

TABLES (continued)
Table Page
x
III.6 COMPARISON OF PARTICIPANTS AND COMPARABLE NONPARTICIPANTS BY CLAIMS DATA............................................................. 91
III.7 PREENROLLMENT CHARACTERISTICS OF TREATMENT AND CONTROL GROUPS RANDOMIZED DURING THE 1ST YEAR OF PROGRAM OPERATIONS....................................................................................... 96
IV.1 SAMPLE SIZES AND RESPONSE RATES FOR THE PATIENT SURVEY ...... 104
IV.2 PERCENTAGE REPORTING THAT A CARE COORDINATOR HELPED TO ARRANGE CARE ............................................................................................. 105
IV.3 TREATMENT GROUP PATIENTS� RATINGS OF CARE COORDINATORS ON SUPPORT AND SERVICE ARRANGEMENT............... 107
IV.4 TREATMENT GROUP PATIENTS� RATINGS OF CARE COORDINATORS ON EDUCATION AND ABILITY TO IMPROVE ADHERENCE ....................................................................................... 108
IV.5 SUMMARY OF ESTIMATED EFFECTS ON PATIENTS� SATISFACTION-WITH-CARE MEASURES...................................................................................... 111
IV.6 ILLUSTRATIVE OUTCOMES FOR PATIENTS� SATISFACTION WITH HEALTH CARE....................................................................................................... 113
IV.7 SAMPLE SIZES AND RESPONSE RATES FOR THE PHYSICIAN SURVEY ............................................................................................ 115
IV.8 PHYSICIANS� PERCEPTIONS ABOUT PROGRAM EFFECTS ON MEDICAL PRACTICE............................................................................................ 117
IV.9 PHYSICIANS� PERCEPTIONS ABOUT PROGRAM EFFECTS ON PATIENTS� SELF-MANAGEMENT...................................................................... 119
IV.10 PHYSICIANS� PERCEPTIONS ABOUT PROGRAM EFFECTS ON SERVICE ARRANGING......................................................................................... 121
IV.11 PHYSICIANS� PERCEPTIONS ABOUT PROGRAM EFFECTS ON CARE COORDINATION ........................................................................................ 123
IV.12 PHYSICIANS� PERCEPTIONS ABOUT PROGRAM EFFECTS ON PHYSICIAN-PATIENT RELATIONS.................................................................... 124
TABLES (continued)
Table Page
xi
IV.13 PHYSICIANS� PERCEPTIONS ABOUT PROGRAM EFFECTS ON PATIENTS� OUTCOMES AND SERVICE USE ................................................... 126
IV.14 PHYSICIANS� PERCEPTIONS ABOUT CARE COORDINATORS� CLINICAL COMPETENCE .................................................................................... 128
IV.15 PHYSICIANS� OVERALL PERCEPTIONS ABOUT PROGRAMS..................... 130
V.1 SUMMARY OF TREATMENT-CONTROL DIFFERENCES IN PARTICIPANTS� SELF-REPORTED RECEIPT OF HEALTH EDUCATION .......................................................................................... 135
V.2 SUMMARY OF TREATMENT-CONTROL DIFFERENCES IN PARTICIPANTS� SELF-REPORTED KNOWLEDGE AND BEHAVIOR........... 138
V.3 SUMMARY OF TREATMENT-CONTROL DIFFERENCES IN PARTICIPANTS� SELF-REPORTED SERVICE ARRANGEMENT AND UNMET NEEDS............................................................................................. 140
V.4 SUMMARY OF TREATMENT-CONTROL DIFFERENCES IN GENERAL AND DISEASE-SPECIFIC PREVENTIVE CARE FOR PARTICIPANTS.................................................................................. 141
V.5 SUMMARY OF TREATMENT-CONTROL DIFFERENCES IN GENERAL AND DISEASE-SPECIFIC POTENTIALLY PREVENTABLE HOSPITALIZATIONS AMONG PARTICIPANTS.................. 144
V.6 SUMMARY OF TREATMENT-CONTROL DIFFERENCES IN MEASURES OF PARTICIPANTS� FUNCTIONING: SELF-REPORTED ABILITY TO PERFORM SELECTED ACTIVITIES OF DAILY LIVING INDEPENDENTLY ........................................ 146
V.7 SUMMARY OF TREATMENT-CONTROL DIFFERENCES IN PARTICIPANTS� SELF-REPORTED HEALTH STATUS AND WELL-BEING ................................................................................................ 147
VI.1 HOSPITAL USE FOR 1ST-YEAR ENROLLEES DURING THE YEAR AFTER RANDOM ASSIGNMENT ........................................................................ 155
VI.2 AVERAGE MONTHLY MEDICARE EXPENDITURES AND NUMBER OF HOSPITALIZATIONS, CUMULATIVE THROUGH MONTH 25 OF PROGRAM OPERATIONS............................................................................... 158

TABLES (continued)
Table Page
xii
VI.3 PHYSICIAN SERVICES AND PROCEDURES FOR 1ST-YEAR ENROLLEES DURING THE YEAR AFTER RANDOM ASSIGNMENT...................................................................................... 162
VI.4 USE OF HOSPITAL OUTPATIENT DEPARTMENT SERVICES FOR 1ST-YEAR ENROLLEES DURING THE YEAR AFTER RANDOM ASSIGNMENT...................................................................................... 163
VI.5 OUTPATIENT ER USE FOR 1ST-YEAR ENROLLEES DURING THE YEAR AFTER RANDOM ASSIGNMENT.................................................... 164
VI.6 MORTALITY RATE FOR 1ST-YEAR ENROLLEES DURING THE YEAR AFTER RANDOM ASSIGNMENT.................................................... 165
VI.7 MEDICARE EXPENDITURES FOR 1ST-YEAR ENROLLEES DURING THE YEAR AFTER RANDOM ASSIGNMENT ................................... 167
VI.8 PRECISION OF ESTIMATES OF PROGRAM EFFECTS ON MEDICARE EXPENDITURES............................................................................... 171
VI.9 COST NEUTRALITY DURING THE 1ST YEAR AFTER RANDOMIZATION, AMONG 1ST-YEAR ENROLLEES.................................... 173
VI.10 COST NEUTRALITY DURING THE 1ST 25 CALENDAR MONTHS OF PROGRAM OPERATIONS..................................................................................... 177
VI.11 A COMPARISON OF COST NEUTRALITY OVER THE 25 MONTHS SINCE PROGRAM STARTUP AND OVER THE YEAR AFTER ENROLLMENT ....................................................................................................... 182

xiii
FIGURES
Figure Page
II.1 THE MCCD SERVICE AREAS .................................................................................20
VI.1 COST NEUTRALITY DURING THE FIRST 25 CALENDAR MONTHS OF PROGRAM OPERATIONS..................................................................................... 179

xv
EXHIBITS
Exhibit Page
I.1 COMMON FEATURES OF MOST SUCCESSFUL CARE COORDINATION PROGRAMS ................................................................................................................ 6
I.2 CURRENT AND PLANNED DEMONSTRATIONS AND EVALUATIONS TO IMPROVE CARE FOR BENEFICIARIES WITH CHRONIC ILLNESSES ....... 8
II.1 PROGRAM HOSTS, TARGET DIAGNOSES, AND SERVICE USE REQUIREMENTS...................................................................................................... 19
II.2 DEMONSTRATION PROGRAM PROTOTYPES AND PHYSICIAN LINKS ...... 22
II.3 CARE COORDINATORS� QUALIFICATIONS, TRAINING, AND CASELOADS............................................................................................................. 28
II.4 KEY FEATURES OF ASSESSMENT, CARE PLANNING, AND MONITORING........................................................................................................... 31
II.5 KEY FEATURES OF PATIENT EDUCATION....................................................... 36
II.6 KEY FEATURES OF EFFORTS TO IMPROVE COMMUNICATION AND COORDINATION...................................................................................................... 40
II.7 PROGRAMS� EXPECTATIONS OF THEIR PHYSICIANS................................... 49
II.8 PROGRAMS� APPROACHES TO ENGAGING PHYSICIANS ............................. 51
II.9 DATA SYSTEMS AND REPORTING ..................................................................... 54
II.10 QUINTILES OF DEMONSTRATION PROGRAMS� RATING SCORES, BY DOMAIN .................................................................................................................... 67

xvii
EXECUTIVE SUMMARY
Care for beneficiaries with chronic illnesses, such as heart disease and diabetes, is a major expense to the Medicare program, and a major detriment to beneficiaries� quality of life. For example, just under one-half of all beneficiaries in 1997 were treated for one or more of eight categories of chronic illnesses, and they accounted for three-fourths of all Medicare spending in 1998 (Brown et al. 2004) Furthermore, beneficiaries often have multiple chronic illnesses, which compounds the cost and complexity of their care. The 12 percent with three or more of the eight chronic health problems accounted for one-third of all Medicare spending. Coordinating the care these patients require is difficult, because patients with chronic illnesses see an average of 11 different physicians per year (Anderson 2002). Despite these alarming statistics, many of the acute health problems caused by chronic illnesses can be prevented if (1) patients are provided with medical care that is consistent with recommended standards; (2) patients adhere to recommended diet, medication, exercise, and self-care regimens; and (3) providers communicate better with each other and with patients. A number of small pilot programs designed to improve patients� adherence to treatment regimens and physicians� adherence to professional guidelines have been found to be effective in improving patient outcomes and reducing costs (see reviews by Chen et al. 2000; Wagner et al. 2001). This potential has led many health maintenance organizations and indemnity insurers to develop their own programs or to contract with disease management or case management providers for such programs (see Villagra and Ahmed 2004 for evidence of the effectiveness of disease management for diabetic patients in a managed care setting). However, the Medicare fee-for-service program does not cover such services.
The Medicare Coordinated Care Demonstration (MCCD) tests whether case management
and disease management programs can lower costs and improve patient outcomes and well-being in the Medicare fee-for-service population. In January 2002, the Centers for Medicare & Medicaid Services (CMS) selected 15 demonstration programs in a competitive awards process, under which each was allowed to define its own intervention and target population, within broad parameters. Each program began enrolling patients between April and September of that year and was authorized to operate for 4 years. Beneficiaries who agree to participate are randomly assigned by the evaluator, Mathematica Policy Research, Inc., to either the treatment group, which received the intervention, or the control group. Both groups continued to obtain their traditional Medicare�covered services from fee-for-service providers in the usual manner.
This report synthesizes findings from the first 2 years of the demonstration programs�
operations, focusing on program impacts over the first year after enrollment for beneficiaries who enrolled during the first year, and over the first 25 months of operations for all enrollees. Findings presented include program-specific estimates of impacts on (1) survey-based measures of patients� health status, knowledge, behavior, satisfaction with their health care, quality of care, and quality of life; and (2) claims-based measures of patients� Medicare service use and expenditures, and the quality of care received. The report links differences across programs in these impacts to differences in the interventions and the target populations in order to draw inferences about �what works� and �for whom.� This synthesis of findings draws on an earlier
xviii
report to Congress that described the types of programs and beneficiaries participating in the demonstrations, the interventions the programs have implemented, and how well patients and physicians like the programs (Brown et al. 2004). This report updates that information and adds analyses of Medicare service use and expenditures and a scoring methodology developed specifically for this evaluation to rate the quality of each program�s intervention on several dimensions.
The findings in brief indicate that patients and physicians were generally very satisfied with
the program, but few programs had statistically detectable effects on patients� behavior or use of Medicare services. Treating only statistically significant treatment-control differences as evidence of program effects, the results show:
• Few effects on beneficiaries� overall satisfaction with care
• An increase in the percentage of beneficiaries reporting they received health education
• No clear effects on patients� adherence or self-care
• Favorable effects for only two programs each on: the quality of preventive care, the number of preventable hospitalizations, and patients� well-being
• A small but statistically significant reduction (about 2 percentage points) across all programs combined in the proportion of patients hospitalized during the year after enrollment
• Reduced number of hospitalizations for only 1 of the 15 programs over the first 25 months of program operations
• No reduction in expenditures for Medicare Part A and B services for any program
Despite the absence of statistically significant treatment-control differences in Medicare expenditures for traditional services, it is possible that some of the programs are cost neutral to date. This could be true because the large variation in Medicare expenditures and the small number of beneficiaries enrolled in some programs make it difficult to draw definitive conclusions�for nine programs, treatment-control differences over the first 25 months of operations are not statistically different from zero, but they are also not significantly different from the average fee paid to the programs. Based on the patterns of differences in hospitalizations, Medicare Part A and B expenditures, and total Medicare expenditures including the care coordination fees, six of the programs are not cost neutral, four probably are not, and five may be cost neutral, over their first 25 months of operations.
The results presented here are not the final word on the programs� impacts�changing
ingrained behaviors of physicians and patients and improving communications among non-integrated fee-for-service providers are all difficult tasks to achieve. Furthermore, even if achieved, such improvements in the processes of care may not yield statistically discernable improvements in patients� well-being or reductions in Medicare costs over the first 2 years of

xix
program operations. Thus, the estimates presented here may differ from those that will be observed over the full 4 years of operations. Nonetheless, this report provides (to our knowledge) the largest single random assignment study to date of disease management/case management programs, and only the second evaluation ever conducted of such programs in a Medicare fee-for-service setting (the first was Schore et al. 1999).
A. WHAT TYPES OF PROGRAMS AND BENEFICIARIES ARE PARTICIPATING?
The 15 MCCD programs were selected from 58 proposals responding to CMS�s solicitation. Programs� hosts had to have experience operating a disease management or case management program that had been shown to reduce hospitalizations or costs in some population or setting. CMS took this approach to maximize the potential for showing, in a time-limited demonstration, that successful care coordination programs used in other settings (typically managed care) could be implemented in a Medicare fee-for-service environment. Each program is offered only to patients living in its catchment area and meeting its approved eligibility criteria�typically, having a particular chronic illness. (Some programs further restrict enrollment to patients who have had a hospitalization during the year or 2 years preceding enrollment.)
In return for providing the care coordination intervention described in its CMS-approved
operational protocol, each program receives a negotiated monthly payment for each beneficiary who chooses to enroll and is randomized to the treatment group. Payments to the programs range from $50 per enrollee per month for low-risk patients with one or more of several chronic illnesses in one program to $437 per month for the first 9 months for all patients with congestive heart failure (CHF) enrolled in another program. The negotiated rates were based on the programs� estimates of the cost of their interventions; however, to increase the likelihood that each program would generate net savings to CMS, the rates also were tied to the projected costs of the programs� proposed target populations. If a 20-percent savings in these projected Medicare costs would not be enough to offset the cost of the intervention, either a program restricted the proposed target population to higher-risk cases (such as beneficiaries with a recent hospitalization) or CMS reduced the proposed program payment to meet this constraint. Five programs had monthly fees exceeding $300; six had fees below $175.
The evaluation�s 2004 report to Congress on the MCCD showed that the 15 selected
programs varied widely in their organizational structures, target populations, and interventions, and that they had varied levels of success in recruiting patients (Brown et al. 2004). The participating organizations include five commercial disease management vendors, three hospitals, three academic medical centers, an integrated delivery system, a hospice, a long-term care facility, and a retirement community (see Table 1). The programs operate in 16 states (mostly in the northeast and Midwest) and in the District of Columbia; five serve beneficiaries living in sparsely populated rural areas. The programs also vary widely in the numbers and types of chronic conditions they target, with six programs targeting only a single condition, three serving patients with less-specific problems (for example, high-risk patients identified from administrative data by an algorithm), and the six other programs falling between these two extremes. Ten programs required that a patient have a hospitalization for the target condition in the year (or less) prior to enrollment.

xx
TAB
LE 1
CA
RE
CO
OR
DIN
ATI
ON
PR
OG
RA
MS
PAR
TIC
IPA
TIN
G IN
TH
E EV
ALU
ATI
ON
Hos
t Org
aniz
atio
n
(Ave
rage
Mon
thly
Fee
) O
rgan
izat
ion
Type
Se
rvic
e A
rea
Targ
eted
Dia
gnos
es
Num
ber E
ver
Enro
lled
Afte
r 12
and
24 M
onth
s
Med
icar
e Ex
pend
iture
s pe
r Mon
th D
urin
g Y
ear
Bef
ore
Enro
llmen
t
Prog
ram
s Sta
rtin
g in
Apr
il 20
02
Car
le F
ound
atio
n ($
159)
In
tegr
ated
del
iver
y sy
stem
R
ural
cou
ntie
s in
east
ce
ntra
l Illi
nois
and
wes
t ce
ntra
l Ind
iana
Hea
rt co
nditi
ons,
diab
etes
, chr
onic
lung
dis
ease
2,
283
2,64
2 $5
21
Cen
VaN
et ($
80)
Car
e co
ordi
natio
n pr
ovid
er
Ric
hmon
d, V
irgin
ia
Hea
rt co
nditi
ons,
diab
etes
, chr
onic
lung
dis
ease
, ce
rebr
ovas
cula
r dis
ease
1,
074
1,30
5 $9
53
Cha
rlest
own
Ret
irem
ent
Com
mun
ity ($
244)
R
etire
men
t co
mm
unity
3
retir
emen
t co
mm
uniti
es in
the
Bal
timor
e ar
ea
Hea
rt co
nditi
ons,
diab
etes
, CO
PD
430
802
$1,1
59
Hea
lth Q
ualit
y Pa
rtner
s ($1
08)
Car
e co
ordi
natio
n pr
ovid
er
East
ern
Penn
sylv
ania
(r
ural
) H
eart
cond
ition
s, di
abet
es, a
sthm
a, m
oder
ate
to se
vere
hy
perli
pide
mia
or h
yper
tens
ion
498
1,14
0 $4
14
Med
ical
Car
e D
evel
opm
ent
($29
7)
Hos
pita
l con
sorti
um
Rur
al a
reas
of M
aine
H
eart
cond
ition
s 39
3 87
6 $1
,718
Mer
cy M
edic
al C
ente
r/Nor
th
Iow
a ($
257)
H
ospi
tal
Rur
al a
reas
of I
owa
CH
F, c
hron
ic lu
ng d
isea
se, l
iver
dis
ease
, stro
ke, v
ascu
lar
dise
ase,
rena
l fai
lure
62
7 86
5 $1
,315
Prog
ram
s Sta
rtin
g in
Jun
e 20
02
Ave
ra R
esea
rch
Inst
itute
/Ave
ra M
cKen
nan
Hos
pita
l and
Uni
vers
ity H
ealth
C
ente
r ($3
16)
Hos
pita
l R
ural
cou
ntie
s in
Iow
a,
Min
neso
ta, N
ebra
ska,
an
d So
uth
Dak
ota
CH
F 31
8 62
4 $1
,615
Cor
Solu
tions
($44
4)
Car
e co
ordi
natio
n pr
ovid
er
Har
ris C
ount
y (H
oust
on),
Texa
s C
HF
671
2,16
2 $2
,644
Geo
rget
own
Uni
vers
ity
Med
ical
Sch
ool (
$320
) A
cade
mic
inst
itutio
n W
ashi
ngto
n, D
C, a
nd
parts
of M
aryl
and
and
Virg
inia
CH
F 10
8 19
9 $2
,530
Jew
ish
Hom
e an
d H
ospi
tal
Life
care
Sys
tem
($31
7)
Long
-term
car
e pr
ovid
er
Man
hatta
n, N
ew Y
ork
City
H
eart
cond
ition
s, di
abet
es, c
hron
ic lu
ng d
isea
se, c
ance
r, liv
er d
isea
se, s
troke
or o
ther
cer
ebro
vasc
ular
dis
ease
, ps
ycho
tic d
isor
der,
maj
or d
epre
ssiv
e or
anx
iety
dis
orde
r, A
lzhe
imer
�s d
isea
se o
r oth
er c
ogni
tive
impa
irmen
t
543
766
$1,4
50
Uni
vers
ity o
f Mar
ylan
d M
edic
al S
choo
l ($3
50)
Aca
dem
ic in
stitu
tion
Bal
timor
e C
HF
58
137
$3,2
99
Prog
ram
s Sta
rtin
g in
Jul
y T
hrou
gh S
epte
mbe
r 20
02
Hos
pice
of t
he V
alle
y ($
224)
H
ospi
ce
Mar
icop
a C
ount
y,
Ariz
ona
(gre
ater
Ph
oeni
x)
CH
F, C
OPD
, can
cer,
neur
olog
ical
con
ditio
ns
470
814
$2,1
74
QM
ed ($
96)
Car
e co
ordi
natio
n pr
ovid
er
2 co
untie
s in
north
ern
Cal
iforn
ia
CA
D
1,40
4 1,
454
$507
Was
hing
ton
Uni
vers
ity S
choo
l of
Med
icin
e ($
173)
A
cade
mic
inst
itutio
n w
ith c
are
coor
dina
tion
prov
ider
St. L
ouis
, Mis
sour
i H
igh-
risk
patie
nts w
ho a
re c
linic
ally
uns
tabl
e , t
arge
ted
thro
ugh
prop
rieta
ry a
lgor
ithm
1,
425
2,03
8 $2
,263
Qua
lity
Onc
olog
y, In
c. ($
140)
C
are
coor
dina
tion
prov
ider
B
row
ard
Cou
nty,
Fl
orid
a (M
iam
i) C
ance
r 63
14
1 $2
,885
CA
D =
cor
onar
y ar
tery
dis
ease
; CH
F =
cong
estiv
e he
art f
ailu
re; C
OPD
= c
hron
ic o
bstru
ctiv
e pu
lmon
ary
dise
ase.

xxi
The mix of patients enrolled varied across programs on some characteristics, but on others the programs were quite similar.
• The most common primary conditions of program patients were CHF (29 percent of
enrollees), coronary artery disease (CAD) (24 percent), and diabetes (13 percent)
• Four programs drew a high proportion of beneficiaries who were older than age 85, and one program targeted and enrolled a high proportion of younger beneficiaries with disabilities
• Compared with all Medicare beneficiaries, the programs� patients generally were substantially more highly educated and had higher incomes
• Most programs enrolled relatively few black or Hispanic patients, few patients younger than age 65, and few patients who also were enrolled in Medicaid
Many of the programs had unexpected difficulty enrolling the target number of patients, with only four exceeding the first-year target of 686 patients that was set by Mathematica Policy Research, Inc. as being the minimum necessary for the evaluation (although two others had over 600; see Table 1). Several programs enrolled less than one-half their targeted number of patients for the first year, citing initial overestimates of the number of eligible patients from their referral sources, physicians� failure to encourage their patients to enroll, high patient refusal rates, and limited care coordinator time to both recruit patients and serve those already enrolled. The programs that were most successful in enrolling patients were those that had a close relationship with physicians before the demonstration started and those with access to databases (such as clinic or hospital records) to identify potentially eligible patients. By the end of the second year, 12 of the 15 programs had over 600 enrollees.
Most of the programs succeeded in enrolling patients with serious chronic illnesses, but a
few programs enrolled relatively healthy patients. Preenrollment Medicare expenditures averaged more than $2,000 per month during the year preceding enrollment for first-year participants in six programs, but less than $600 per month for three other programs (average Medicare expenditures for noninstitutionalized beneficiaries nationally was $505 per month in 2002). The programs with low-cost enrollees are likely to have difficulty achieving large enough savings to offset the cost of their interventions. In one-half (eight) of the programs, enrolled patients had an average of one or more hospitalizations per year during the 2 years before enrollment. (Three of these programs averaged two hospitalizations per patient per year.) In 13 of the programs, the enrolled patients had higher costs than did diagnostically eligible nonparticipants in the same geographic area during that year. However, the two programs whose enrollees had the lowest preenrollment Medicare costs (about $500 per month) enrolled patients with preenrollment costs and admission rates that were lower than those of eligible nonparticipants. The program with the greatest preenrollment discrepancy between participants and nonparticipants enrolled sizable numbers of beneficiaries it identified as eligible through chart reviews, but many of these enrollees did not meet diagnostic eligibility criteria according to claims data examined here, for the year prior to enrollment.

xxii
B. WHAT INTERVENTIONS ARE THE PROGRAMS DELIVERING, AND HOW ARE THEY DOING IT?
The 15 programs differed widely in both how they implemented their care coordination interventions with patients and their involvement with patients� physicians and other providers. Information about the interventions came from interviews with program staff as well as data recorded by care managers on their contacts with patients. Interviews were conducted at three points: by telephone at 3 months after enrollment began; during in-person visits 6 months after the telephone interviews; and by telephone again, roughly 3 years after startup.
The programs differed in their relative emphasis on four major vehicles for achieving better
outcomes for patients: improving patients� adherence to treatment and self-care regimens, improving coordination and communication among providers, improving physician practice, and increasing access to support services. All but 1 of the 15 programs stressed patient education to improve adherence and coordination, but most devoted less attention to convincing physicians to change their practices or to improving access to support services.
The programs varied greatly in their approach to care coordination. They differed on the
mode and intensity of contacts, staff credentials, ratio of staff to patients, method of monitoring, patient education methods, and approaches to improving communications between physicians and patients and among physicians.
All but two programs required all their care coordinators to be registered nurses, but
caseload size varied widely. Thirteen programs required care coordinators also to have specific experience with cardiac, geriatric, medical-surgical, or community nursing. Caseload sizes ranged from a low of 36 patients per care coordinator to a high of 200.
All programs began care coordination with assessments of patients’ needs and condition,
after which they developed patient care plans. Of the 15 programs, 12 conducted at least part of their assessment in person, even though most of their invention was conducted over the telephone. Ten programs initiated their assessments within 3 weeks after enrollment on average. Only one program (Jewish Home and Hospital) took longer than 6 weeks on average to begin its assessment. The assessments culminated in care plans to fill the gaps in the patients� knowledge and treatment. These plans were developed collaboratively with patients and, when appropriate, with the patients� families.
Most (12) of the programs contacted patients one to three times per month on average
(mostly by telephone), but 2 had more frequent contacts. Six of the programs averaged 1.2 to 1.5 contacts per patient per month during the first year after enrollment; another six averaged between 2.2 and 2.9. Avera, however, contacted patients over 8 times per month on average. The great majority of contacts were by telephone, except in Mercy, whose care coordinators conducted over two-thirds of their contacts in person. Patients initiated about 10 percent or less of the contacts in most programs.
Six programs used home telemonitoring devices, although three of these did so on a very
limited basis. Electronic devices transmitted patients� weights, other clinical indicators, and symptom reports to their care coordinators on a daily basis. A seventh program provided
xxiii
ambulatory ischemia monitoring. In addition, 13 programs required care coordinators to contact all of their patients at least monthly by telephone or in person.
All but one program provided patient education; almost all used standard curricula and
had processes for assessing the effectiveness of the education. Over 85 percent of enrollees in the 14 programs featuring patient education (only the University of Maryland did not) received contacts for educational purposes during their first year in the program. The educational materials were part of electronic databases for some of the programs, and some assessed patients to identify specific learning barriers. Programs assessed effectiveness by reviewing clinical indicators or home monitoring data for evidence of improving health or relied on patients� self-reported behavior changes or responses to questions about their knowledge.
Most programs sought to improve communication between patients and providers by
training patients, and they sent physicians regular written reports on patients. Some programs taught patients to take prepared lists of questions to their office visits, while others gave them schedules of tests they should be receiving. While most programs communicated with patients� physicians via written reports, one held formal conferences with participating physicians and one had its quality manager visit physicians to discuss adherence to evidence-based practice, using data obtained from ambulatory ischemia monitoring and physicians� medical records to make their point. Five programs had care coordinators practice in the same location as physicians, enhancing the coordinators� ability to communicate face-to-face with them. Seven programs arranged to have hospitals notify care coordinators when the hospital admitted program enrollees or had their care coordinators review hospital or emergency room (ER) admission lists.
Programs sought to minimize the burden on patients’ physicians. Only four of the
programs listed improvement of provider practice as one of their approaches for improving patient health. They did so mostly by providing recommendations for specific patients when treatment plans deviated from evidence-based guidelines. One program, however, provided education about such guidelines and offered physicians incentives to participate. Some programs used opinion leaders or advisory boards to encourage physicians� active participation, paying either a monthly stipend per patient ($20 to $30 typically) or paying for participation in meetings or for delivery of medical records.
The programs devoted relatively little attention to increasing patients’ access to needed
support services. All but one program provided such assistance, such as referring patients to transportation services or home-delivered meals, but only five ever did so for more than one-half their patients.
Programs varied widely in the sophistication of their electronic systems to manage data on
patients and program activities. Thirteen programs used these systems to support their work with patients. Among those, 11 generated reports from those systems reminding coordinators about when to contact patients, and 12 used the systems to provide reports on patients� clinical indicators and outcomes.
While information on what programs are doing as their interventions and how they do it can
be useful for understanding why some programs are more effective than others, it may be more important to know how heavily they focus on particular dimensions of care coordination and

xxiv
how well designed the interventions are on these dimensions. On the surface, many of the programs in this demonstration appear to implement quite similar interventions, yet in-depth discussions with the programs reveal a number of important differences in the intensity of their intended efforts to provide patient education or service arrangement or other possible components of their intervention. To address this issue, the evaluation developed a scoring algorithm for rating each program�s interventions on 10 separate domains:
• Program Staffing
• Initial Assessment
• Patient Education
• Improving Communication and Coordination
• Improving Provider Practice
• Service and Resource Arrangement
• Information Technology and Electronic Records
• Ongoing Monitoring
• Quality Management and Outcome Measurement
These ratings were developed independently of the survey and claims data on program
outcomes, and without regard to data on contacts supplied by the programs. Researchers scoring the programs relied solely on the information collected during in-person and telephone discussions with the programs about their intervention; estimates of program impacts were not shared with scorers until after they had completed their ratings. Scores were normalized to range from 0 (intervention did not address this domain) to 100 (intervention was extremely well-designed on this domain).
Programs varied widely on each of these domains, especially Quality Management and
Outcome Measurement, for which scores ranged from 5 to 91, and Improving Provider Practice, which ranged from 0 to 77. Scores varied less widely across programs on the Problem Identification and the Initial Assessment domains. Average scores were highest for the Initial Assessment and the Monitoring domains, and lowest on average for Improving Provider Practice, reflecting the lesser attention given to this area by most of the programs.
While individual programs often scored extremely well on some domains and poorly on
others (at times because a particular domain was not part of its intervention), a few programs had high scores on several domains and others had consistently low ratings across most of the domains. Carle was scored in the top quintile of programs (the 3 highest) on 6 of the 10 domains, and Mercy and Quality Oncology each had 4 scores in the top quintile. The Jewish Home and Hospital and the University of Maryland scored in the bottom quintile on nine and seven of the domains, respectively. Yet both of these programs scored in the top quintile on one domain each. The importance of these rankings is not to identify those programs that do particularly well or poorly across measures, but to determine whether having strong designs in certain domains is consistently associated with having favorable impacts on Medicare costs or the quality of care.
xxv
C. HOW DO PATIENTS AND PHYSICIANS LIKE AND RESPOND TO THE PROGRAMS?
Survey data collected on patients in the 12 programs with over 300 enrollees by the end of their first year and on enrollees� physicians in all 15 programs suggest that the programs are popular with both patients and physicians. The patient surveys generally were conducted 7 to 12 months after patients enrolled. Physicians were surveyed in two waves, once about 12 to 15 months after the program in which their patients were enrolled began operations, and a second wave about 18 to 21 months after program startup.
About two-thirds of treatment group patients on average across programs were aware of
the program; 15 percent of control group members also reported receiving some care management. Most treatment group members were aware they were receiving care coordination although the percentage varied widely across programs, ranging from only 30 percent in QMed to 81 percent in Mercy saying �yes� when asked, �During the past 12 months, did someone like a nurse, social worker or geriatric nurse help arrange or coordinate your health care?� Thus, the programs generally were successful in establishing a relationship with the patients. However, 3 to 28 percent of the control group also answered �yes� to this question, suggesting that the interventions are not the only source of professional care coordination assistance available in the programs� service areas. Among those saying they received this type of assistance, those in the treatment group generally reported higher levels of satisfaction with the help received. Nonetheless, the fact that about one-third of treatment group members did not report receiving care coordination and that some control group members reported they did receive such assistance makes it more difficult for the programs to demonstrate a significant impact on the treatment group.
Treatment group patients were generally very satisfied with the care coordination they
received. Coordinators were rated on four different dimensions�support and monitoring, knowledge and ability to get answers, ability to explain adherence to recommended self-care, and help arranging services�each with three or four specific indicators. About one-third to one-half of the patients surveyed rated their coordinators as excellent on the 14 indicators examined, and most of the rest rated them as �very good.� Very few patients (less than 10 percent in nearly all instances) rated the programs as only fair or poor on any of the measures. Care coordinators received especially high marks on indicators of the emotional support and monitoring they offered, especially their �caring attitude,� with over 60 percent of the patients on average giving their programs an excellent rating. Patients also rated programs highly on staying in touch (over one-half rating it excellent, on average). Patients gave somewhat lower, but still quite positive, ratings on average for programs� including them and their families in decisions, and for helping them cope with their illness and avoid complications.
Patients were somewhat less impressed with the help they received from programs in
arranging appointments or services. Across most programs, about 35 to 40 percent of the patients gave an excellent rating. Exceptions include Carle�s higher ratings, and two programs that received markedly lower ratings (the same two programs with low marks on support and monitoring). Substantial minorities of patients (10 to 24 percent) gave the programs a fair or poor rating on this domain. These less favorable ratings are likely to be due to most programs� focusing their attention more on monitoring and education than on arranging services.
xxvi
Patients had high praise for the care coordinators’ knowledge. Over one-half the patients
on average rated care coordinators� knowledge as excellent, and only two programs had less than 43 percent giving an excellent rating. About 40 to 43 percent of patients on average rated their programs� care coordinators as excellent on their ability to explain symptoms or get physicians to answer questions or help them to identify early warning symptoms; these rates were similar across most programs.
Finally, a modest proportion of patients gave excellent ratings to care coordinators� ability to
explain recommended diet, medication, and exercise regimens. Of all the measures, patients were least likely to give coordinators very high marks on their ability to explain exercise regimens (although few patients rated the programs as fair or poor). The somewhat less enthusiastic ratings on these measures may be due to care coordinators� focusing their education efforts less intensely on exercise than on other patient behaviors.
Overall, a consistent pattern emerges from these numerous patient ratings of the care
coordination interventions, with Health Quality Partners consistently receiving notably higher marks than other programs. These high patient ratings were consistent with the evaluation�s scoring results, in which Health Quality Partners had the highest score of the 15 programs on patient education and ranked among the top on monitoring as well. Carle and Avera also were rated highly on some patient survey measures, especially those related to providing emotional support and service arrangement. Avera�s high ratings on explaining early warning signs is consistent with the scoring algorithm�s strong ranking of this program (third highest) on patient monitoring and its use of home telemonitoring, which likely generated follow-up conversations between care coordinators and patients about heart failure and symptoms. Carle�s high ratings from patients on getting answers from physicians is consistent with its top score among all programs on improving communications and coordination among providers and the relatively close relationship its program staff had with their patients� physicians. Carle�s patients� high ratings of the program on service arrangement is also consistent with Carle having one of the top three scores on service arrangement in the scoring algorithm.
Most of the programs received high ratings from their patients’ physicians on most
dimensions, although there were clear differences across the dimensions and across programs. Physicians were asked to rate the programs on numerous factors, including their effects on the physician�s practice (medical practice, time and paperwork burden, and financial impact if any), patients� education and behavior, service arrangements for patients, care coordination, physicians� relationship with patients, and patient outcomes and behavior. Physicians were also asked to rate care coordinators� clinical competence.
Program physicians widely agreed that the programs made things easier overall for patients
and did a good job of monitoring and followup, but they were not always as positive about the usefulness of program reports (42 percent responded these were �very useful�) or about the programs� effects on other aspects of their practice. Table 2 illustrates the wide range of responses across programs. Similar wide variation across measures and programs occurred in each of the other categories.
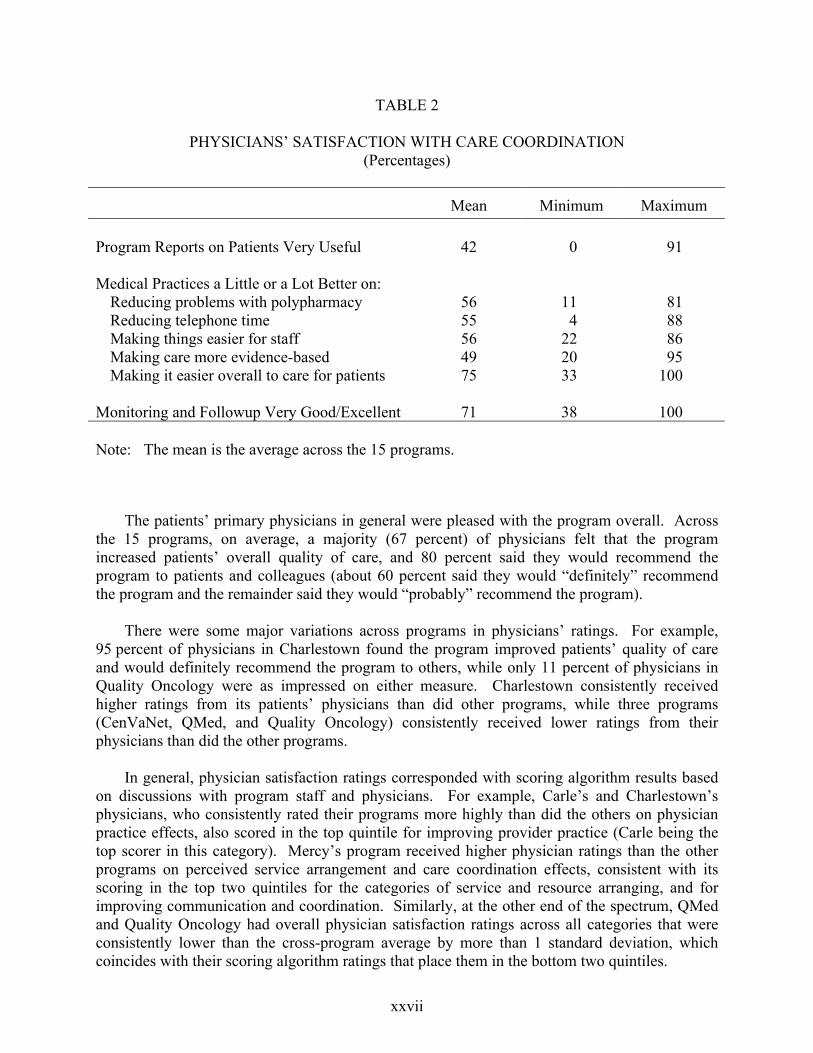
xxvii
TABLE 2
PHYSICIANS� SATISFACTION WITH CARE COORDINATION (Percentages)
Mean Minimum Maximum Program Reports on Patients Very Useful 42 0 91 Medical Practices a Little or a Lot Better on:
Reducing problems with polypharmacy 56 11 81 Reducing telephone time 55 4 88 Making things easier for staff 56 22 86 Making care more evidence-based 49 20 95 Making it easier overall to care for patients 75 33 100
Monitoring and Followup Very Good/Excellent 71 38 100 Note: The mean is the average across the 15 programs.
The patients� primary physicians in general were pleased with the program overall. Across the 15 programs, on average, a majority (67 percent) of physicians felt that the program increased patients� overall quality of care, and 80 percent said they would recommend the program to patients and colleagues (about 60 percent said they would �definitely� recommend the program and the remainder said they would �probably� recommend the program).
There were some major variations across programs in physicians� ratings. For example,
95 percent of physicians in Charlestown found the program improved patients� quality of care and would definitely recommend the program to others, while only 11 percent of physicians in Quality Oncology were as impressed on either measure. Charlestown consistently received higher ratings from its patients� physicians than did other programs, while three programs (CenVaNet, QMed, and Quality Oncology) consistently received lower ratings from their physicians than did the other programs.
In general, physician satisfaction ratings corresponded with scoring algorithm results based
on discussions with program staff and physicians. For example, Carle�s and Charlestown�s physicians, who consistently rated their programs more highly than did the others on physician practice effects, also scored in the top quintile for improving provider practice (Carle being the top scorer in this category). Mercy�s program received higher physician ratings than the other programs on perceived service arrangement and care coordination effects, consistent with its scoring in the top two quintiles for the categories of service and resource arranging, and for improving communication and coordination. Similarly, at the other end of the spectrum, QMed and Quality Oncology had overall physician satisfaction ratings across all categories that were consistently lower than the cross-program average by more than 1 standard deviation, which coincides with their scoring algorithm ratings that place them in the bottom two quintiles.

xxviii
Few significant differences were observed between treatment and control group members
on satisfaction with the process of care. Despite the generally favorable rating that treatment group patients and physicians gave to most of the programs� care coordination efforts, the treatment group did not consistently report higher satisfaction than control group members with indicators of the quality of the health care they received from the various providers they saw. The indicators include ratings of the degree of choice in treatment that patients feel they have, the extent to which providers keep in touch with each other, the explanations received from specialists, explanations of side effects, explanations of treatments, explanations of tests, and the quickness of receiving test results. The treatment group members were significantly more likely than the control group members to report feeling they had a choice in the treatment of their condition in only 1 of the 12 programs included in the survey (Avera). Differences favoring the treatment group occurred most often for providers keeping in touch (5 of the 12 programs). Treatment group members in four of the programs also gave more favorable ratings than the corresponding control group on explanation of treatments. Satisfaction with explanations of side effects and explanations from specialists were significantly greater for the treatment than the control group for only two and three of the programs, respectively, and with explanation of tests for only one. None of the programs had impacts on the timeliness with which test results were delivered, according to the treatment-control differences.
A few programs appeared to have more impact than others on patients� satisfaction with
their overall care. Avera�s and Mercy�s treatment groups each gave significantly higher ratings than their control groups on three of the six measures. Three programs had significant differences on two of the six measures, and three programs had significant effects on one of the measures. The four other programs included in the survey had no discernable effect on patients� satisfaction with care.
D. HOW DO THE PROGRAMS AFFECT ADHERENCE AND QUALITY OF CARE?
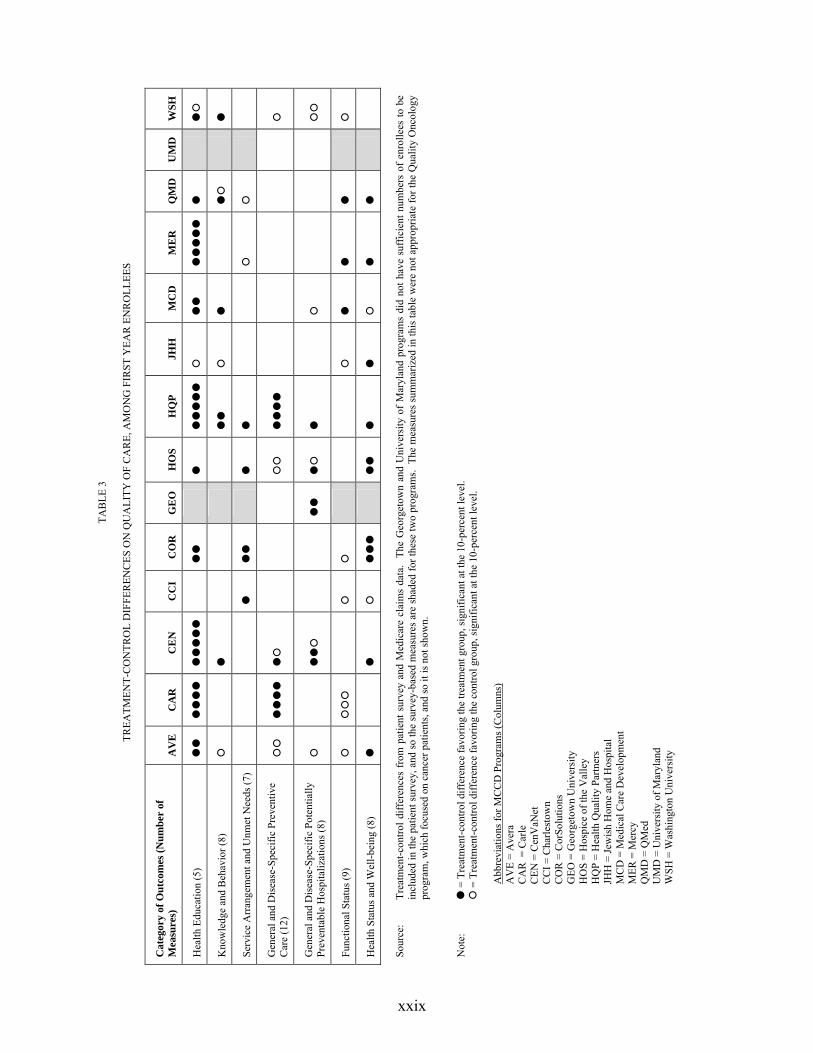
The care coordination programs were expected to improve patients� adherence to recommendations and their quality of care, which, in turn, was expected to lead to improvements in patients� health and well-being. The evaluation compared the treatment and control groups� receipt of health education, knowledge and behavior about self-care, quality of care, and health status and well-being to determine whether the programs had the intended effects. Measures of preventive care and preventable hospitalizations over the year after enrollment were constructed from Medicare claims data for all first-year enrollees enrolled in 14 programs. (The measures were not appropriate for Quality Oncology, which targeted patients with cancer.) The analysis also draws on the patient survey responses to examine receipt of education, knowledge, behavior, adherence, receipt of care, and functioning. Table 3 summarizes the results.
Overall, the programs appeared to have no consistent discernible effect across numerous
measures of behaviors and outcomes except receipt of health education. While there were isolated treatment-control differences for a few outcomes for a few programs, there was no pattern suggesting that the programs, as a group or individually, had true effects in any area besides receipt of health education. Favorable effects were observed for 1 or 2 measures of health status and well-being (out of the 9 examined) for 8 of the 12 programs.
xxix
TAB
LE 3
TREA
TMEN
T-C
ON
TRO
L D
IFFE
REN
CES
ON
QU
ALI
TY O
F C
AR
E, A
MO
NG
FIR
ST Y
EAR
EN
RO
LLEE
S
Cat
egor
y of
Out
com
es (N
umbe
r of
M
easu
res)
A
VE
C
AR
C
EN
C
CI
CO
R
GE
O
HO
S H
QP
JHH
M
CD
M
ER
Q
MD
U
MD
W
SH
Hea
lth E
duca
tion
(5)
!! !!!! !!!!!
!!
!
!!!!! #
!!
!!!!! !
!#
Kno
wle
dge
and
Beh
avio
r (8)
#
!
!!
#
!
!#
!
Serv
ice
Arr
ange
men
t and
Unm
et N
eeds
(7)
!
!!
!
!
#
#
Gen
eral
and
Dis
ease
-Spe
cific
Pre
vent
ive
Car
e (1
2)
## !!!! !#
##
!!!!
#
Gen
eral
and
Dis
ease
-Spe
cific
Pot
entia
lly
Prev
enta
ble
Hos
pita
lizat
ions
(8)
#
!!#
!!
!#
!
#
##
Func
tiona
l Sta
tus (
9)
#
###
#
#
#
!
!
!
#
Hea
lth S
tatu
s and
Wel
l-bei
ng (8
) !
!
#
!!!
!!
!
!
#
!
!
Sour
ce:
Trea
tmen
t-con
trol d
iffer
ence
s fr
om p
atie
nt s
urve
y an
d M
edic
are
clai
ms
data
. Th
e G
eorg
etow
n an
d U
nive
rsity
of
Mar
ylan
d pr
ogra
ms
did
not h
ave
suff
icie
nt n
umbe
rs o
f en
rolle
es to
be
incl
uded
in th
e pa
tient
sur
vey,
and
so th
e su
rvey
-bas
ed m
easu
res
are
shad
ed fo
r the
se tw
o pr
ogra
ms.
The
mea
sure
s sum
mar
ized
in th
is ta
ble
wer
e no
t app
ropr
iate
for t
he Q
ualit
y O
ncol
ogy
prog
ram
, whi
ch fo
cuse
d on
can
cer p
atie
nts,
and
so it
is n
ot sh
own.
N
ote:
!
= T
reat
men
t-con
trol d
iffer
ence
favo
ring
the
treat
men
t gro
up, s
igni
fican
t at t
he 1
0-pe
rcen
t lev
el.
#
= T
reat
men
t-con
trol d
iffer
ence
favo
ring
the
cont
rol g
roup
, sig
nific
ant a
t the
10-
perc
ent l
evel
.
Abb
revi
atio
ns fo
r MC
CD
Pro
gram
s (C
olum
ns)
AV
E =
Ave
ra
CA
R =
Car
le
CEN
= C
enV
aNet
C
CI =
Cha
rlest
own
CO
R =
Cor
Solu
tions
G
EO =
Geo
rget
own
Uni
vers
ity
HO
S =
Hos
pice
of t
he V
alle
y H
QP
= H
ealth
Qua
lity
Partn
ers
JHH
= Je
wis
h H
ome
and
Hos
pita
l M
CD
= M
edic
al C
are
Dev
elop
men
t M
ER =
Mer
cy
QM
D =
QM
ed
UM
D =
Uni
vers
ity o
f Mar
ylan
d W
SH =
Was
hing
ton
Uni
vers
ity

xxx
The large effects on health education did not lead to effects on self-reported knowledge, adherence, or health-related behaviors. The treatment groups in all but 1 of the 12 surveyed programs were significantly more likely than their corresponding control groups to report having received education on health behaviors. The most common effects were on receipt of education about diet and exercise, followed by the receipt of health educational materials, education on recognizing when to seek urgent care, and education on the importance of medication adherence.
Four of the programs (Carle, CenVaNet, Health Quality Partners, and Mercy) had favorable
treatment-control differences across four or more of the five measures of patient education examined. Despite the treatment group members being more likely to say they had received health education, there were no effects for any of the 12 programs on patients� self-reported adherence to diet, exercise, or taking medications. Only scattered favorable effects were observed on self-reported understanding of healthy behaviors, but these were too sporadic to suggest meaningful effects for all but one or two programs. Across measures, four programs (Carle, CenVaNet, Health Quality Partners, and CorSolutions) had somewhat more favorable treatment-control differences than the other programs.
The programs had no discernable effects on service arrangements or unmet needs. While
treatment group members in all 12 programs included in the survey were more likely than control group members to report receiving care coordination services (not included in Table 3), as intended, only 3 programs exhibited significant favorable treatment-control differences on other measures of unmet needs or service arrangements. Furthermore, two programs each had one outcome measure for which the control group had significantly better outcomes than the treatment group.
Only two programs appear to have made clear improvements in the quality of preventive
care (Carle and Health Quality Partners), or to have reduced the number of preventable hospitalizations (Georgetown and Hospice of the Valley). The treatment groups were more likely than the control groups in Carle and Health Quality Partners to receive vaccination and (for women) screening mammography, and recommended blood and urine tests among beneficiaries with diabetes and coronary disease. Georgetown and Hospice of the Valley had significantly fewer �preventable� hospitalizations per beneficiary overall in their treatment groups than in the respective control groups. (Potentially preventable hospitalizations are inpatient admissions for common, acute medical conditions that, in the consensus of expert clinicians, generally should not progress to requiring inpatient care if treated in a timely fashion with adequate outpatient primary care; see Kozak et al. 2001.)
Only two programs (CorSolutions and Hospice of the Valley) had favorable effects on
multiple measures of patient well-being, and these were only for selected measures. The treatment groups in those two programs were significantly more likely to report feeling their condition placed less of a burden on family than were the control groups (both programs), feeling calm and peaceful (in CorSolutions only), and having less pain (in Hospice of the Valley only). However, even these two programs had a favorable effect on only two or three of the eight measures of well-being that were examined. In addition, only three programs had a favorable treatment-control difference on any of the nine survey-based measures of functioning (for example, ability to eat independently), and, for six programs, the treatment group reported significantly worse health status on one or more measures. However, it is difficult to conceive of a mechanism by which programs would adversely affect patients� functioning. Furthermore, one

xxxi
should expect about one-half the sites to have one significant negative estimate out of the nine measures used just by chance. Finally, there is no evidence of adverse effects on other health outcomes. Thus, these scattered treatment-control differences showing worse functioning for the treatment group than the control group are interpreted as chance differences, rather than as evidence that six of the programs have caused patients� functioning to decline.
E. HOW DO THE PROGRAMS AFFECT MEDICARE SERVICE USE AND COST?
By improving patient adherence, the timeliness of response to worsening symptoms, or other aspects of the quality of care, care coordination programs are expected to reduce hospitalizations, the key factor in reducing Medicare expenditures for beneficiaries with chronic illnesses. On the one hand, the need for emergency room care and other expensive Medicare services that often follow hospitalizations (such as that provided by skilled nursing facilities and home health agencies) may also be reduced. On the other hand, some types of service use and expenditures could increase if the programs increase patients� visits to physicians for preventive care or to address symptom exacerbations. To measure these effects, the evaluation compared the treatment and control groups in each program on Medicare service utilization and expenditures. The measures were constructed for the year after enrollment for patients enrolled during the first year of program operations, and for all patients during the programs� first 25 months of operations.
Only 1 of the 15 programs (Mercy) showed a statistically significant reduction in
hospitalizations, and none of the programs had significantly lower expenditures for Medicare Part A and Part B services. In eight other programs, the treatment group had fewer hospitalizations than controls during the first 25 months of program operations, but the observed differences could not be attributed with confidence to the intervention, rather than to chance. Four of these programs had 10 to 18 percent fewer hospitalizations among treatment group members than among control group members, but none of these differences were statistically significant. Furthermore, there was no difference in Medicare expenditures for two of these programs and the other two had very few enrollees. However, hospitalizations and Medicare expenditures were 14 and 21 percent higher, respectively, for the treatment than the control group in the Charlestown program, the only program for which a statistically significant difference in expenditures was observed. For the first year after enrollment, for all programs combined, the treatment group had 2 percent fewer patients admitted to the hospital, a statistically significant difference, but the differences in both the number of hospitalizations and Medicare expenditures were very small and not significantly different from zero.
The treatment group�s significantly (27 percent) lower hospitalization rate in Mercy did not
result in a statistically significant difference in Medicare expenditures, although expenditures were 13 percent lower for the treatment group over the 25-month period since startup. Medicare expenditures for Part A and B services were lower for the treatment group than the control group by at least 10 percent in two other programs (Georgetown and QMed), but neither difference was close to being statistically significant.
Cost neutrality cannot be rejected for some of the programs. These results suggest that
none of the demonstration programs is cost neutral�that is, none has generated statistically significant evidence of savings in Medicare expenditures that could offset the fees paid to the

xxxii
program. However, that conclusion is less clear when one considers the large variance in the estimates. That is, while the evaluation cannot reject the hypothesis that savings in Medicare Part A and B expenditures are zero, for some programs it also cannot reject the hypothesis that savings are large enough to cover the average fee paid to the programs for care coordination. For six programs (shown in the bottom panel of Table 4), cost neutrality can be rejected statistically�net costs have increased for these programs. For the nine other programs, the evaluation cannot formally reject the hypothesis that total average Medicare expenditures per month for the treatment group, including the care coordination fee, are equal to expenditures for the control group (cost neutrality). However, for the four programs with small (less than 10 percent) treatment-control differences in hospitalization or expenditures on Part A and B services, cost neutrality seems unlikely. Failure to reject the cost neutrality hypothesis in these cases may be due to low statistical power resulting from small sample sizes and high variance of Medicare expenditures. Four other programs, however, have treatment-control differences in hospital admissions of 10 percent or greater, and (in two cases) differences in Part A and B expenditures that are large enough to essentially offset the fees. The difference in hospitalizations is smaller for a fifth program (QMed), but the fee for this program is quite low and is almost fully offset by the treatment group�s 12 percent lower Medicare expenditures for traditional services. Thus, these five programs may actually be generating savings in Part A and B expenditures that are sufficient to offset the program fees. However, the estimates are too imprecise at this time for the evaluation to definitively conclude that there are such savings, or that they are large enough to cover the average fee paid for care coordination.
F. SYNTHESIZING THE FINDINGS: WHAT WORKS, AND WHAT DOESN’T?
Given that few of the programs have shown convincing evidence to date of reducing beneficiaries� need for hospitalizations and saving money or of improving the quality of care received, there is relatively little assessment that can be done yet of �what works.� The one program for which there were statistically significant estimates of reductions in hospital use (Mercy Medical Center in Iowa) differed from the other programs in that it had by far the highest proportion of contacts conducted in person (two-thirds), and it excelled at Problem Identification and Care Planning, Patient Education, and Improving Communications and Coordination between patients and physicians. The program also had large impacts on patient education, as judged from the patient survey, and was rated highly by the patients� physicians.
In the evaluation�s follow-up discussions with the programs, Mercy�s staff attributed the
reductions in hospitalizations they achieved primarily to getting patients to see their physicians quickly when symptoms worsened or problems arose. By identifying looming problems before they became severe and convincing patients of the urgency of seeing a physician (or contacting physicians directly on behalf of patients when necessary), Mercy staff felt they were able to prevent the patients� health from deteriorating to the point where a hospital admission would be necessary. They felt this preventive effect typically arose through quickly getting patients on needed medications or different dosages of their current medications.
The four other programs for which the treatment group had 10 to 20 percent fewer
hospitalizations than the control group (although these differences were not statistically significant) also scored highly on one or more domains. For example, Georgetown and Health Quality Partners both scored in the top quintile on Initial Assessment. Quality Oncology scored

xxxiii
TABLE 4
TREATMENT-CONTROL DIFFERENCES IN HOSPITALIZATIONS AND MEDICARE EXPENDITURES, WITH AND WITHOUT PROGRAM FEES, OVER
THE 1ST 25 MONTHS OF PROGRAM OPERATIONS (Percentages)
Monthly Medicare Expenditures
Annual Number of
Hospitalizations Without Care
Coordination Fees Including Care Coordination
May Be Cost Neutral Mercy Medical Center -27 -13 8 Quality Oncology -18 -2 0 Hospice of the Valley -14 0 9 Georgetown University -12 -12 1 QMed -4 -12 1
Probably Not Cost Neutral CorSolutions -5 -8 4 University of Maryland -1 0 10 Jewish Home and Hospital 0 -6 8 Medical Care Development 1 -2 9
Not Cost Neutral Health Quality Partners -10 0 17 Carle Foundation -4 -1 21 Avera 4 -5 14 CenVaNet 4 6 14 Washington University 6 4 12 Charlestown 14 21 44
Overall -4 -2 11
Note: Bolded italicized numbers denote statistically significant treatment-control differences at the 10-percent
level for hospitalizations and Medicare expenditures without fees, and at the 20-percent level for expenditures including care coordination fees. Negative estimates imply that hospitalizations or Medicare expenditures (with or without the fee included) are lower for the treatment group, a favorable outcome. Positive estimates suggest that the treatment group used more services and cost Medicare more than the control group.
xxxiv
in the top quintile on four domains�Staffing, Information Technology, Ongoing Monitoring, and Quality Management.
Programs that seemed to improve preventive care (Carle and Health Quality Partners) also
scored well on patient survey indicators and tended to receive high ratings on the scoring algorithm for various aspects of their interventions. Carle scored higher than all other programs on 5 of the 10 indicators. Health Quality Partners scored at the top on patient education. However, neither of these programs generated reductions in Medicare expenditures for traditional services; thus, both significantly increased net costs to Medicare. This lack of reduction in expenditures may be due in part to the fact that patients in these two programs had far lower preenrollment Medicare expenditures than all but one of the other programs.
Programs that exhibited no effects on hospitalizations, costs, or quality-of-care indicators
gave a range of reasons why they were unable to reduce the need for hospitalizations. Reasons included the still-short time frame over which the analysis was conducted; the belief that some of their patients were either too debilitated or not sick enough to benefit from their interventions; and the belief that physicians in their service areas had an intractable tendency to send patients to the emergency room, which is more expensive, rather than to find time for office visits when patients exhibited worsening symptoms.
Looking across the characteristics of the five programs most likely to be cost neutral over
the first 2 years of operation and the two that appear to have improved the quality of care seems to confirm the finding in Chen et al. (2000) that no single program feature or characteristic seems to be associated with a greater likelihood of program �success.� Nor does the absence of a particular feature seem to doom a program to relative failure. However, how well programs perform their functions (based on information obtained from program staff and assessed by the evaluator) does appear to be associated with program success.
While no firm conclusions can be drawn as yet about which MCCD programs really are
effective (because samples are still relatively small and the follow-up period relatively short), those programs that are most promising to date share few common structural features. Two of the programs with the most success in improving quality (Health Quality Partners and Carle) operate in rural areas, as does Mercy, the sole program with statistically significant effects on the number of hospitalizations. Yet Avera and Medical Care Development also operate in rural areas and show no such promising results to date. Two of the programs with the most favorable expenditure results (Quality Oncology and Georgetown) have fewer than 100 treatment group members�Medical Care Development is the only other program serving fewer than 300 patients. However, the results for these two programs may be due more to the imprecision of the estimates than to the excellence of the interventions. The five other relatively promising programs have substantially more patients. All four programs whose care coordinators have average caseloads of 50 or fewer patients are among the most effective programs, but the three other relatively effective programs have average caseloads in the highest range (over 75 patients). Three of the five programs operated by commercial disease management programs were among the seven promising programs, but the four other promising programs had hospitals, clinics, or academic medical centers as hosts. Other program characteristics examined seem equally unrelated to whether a program was one of the more effective seven.
How well designed programs were on various dimensions appeared to have a somewhat
stronger association with performance than did structural characteristics. Strong performance in
xxxv
any particular domain does not appear to be necessary or sufficient for a program to be relatively successful. However, there are some clear patterns of association between how programs scored on the 10 domains examined and the programs� ability to improve quality or generate reasonably favorable expenditure comparisons. The domains most strongly associated with the promising programs are Staffing (the five programs with the highest ratings on staffing were all among the seven most promising programs), Improving Communications and Coordination (five of the six top programs on this domain were promising programs), Patient Education (four of the top five programs were promising), and Quality Management and Outcome Measurement (four of the top five programs were promising). Characteristics decidedly not associated with stronger quality or cost performance included Improving Provider Practice, Service and Resource Arranging, Information Technology, and (perhaps surprisingly) Ongoing Monitoring. For each of these characteristics, only one or two of the five top-rated programs were among the seven programs classified as most promising to date.
Finally, the characteristics of the patients enrolled appeared to be unrelated to the relative
success of the programs to date. Three of the seven promising programs targeted patients with a single disease; the other four targeted multiple diseases. All three of the programs that enrolled patients with average preenrollment Medicare expenditures of under $600 per month were among the top seven performers, but three others of the top performers were among the six programs whose patients had average expenditures in excess of $2,000 per month. None of the other patient characteristics examined (age, education, income, race) appeared to be related to programs� likelihood of success.
The current findings suggest that hiring excellent staff and performing certain key functions
well are the most important determinants of the likelihood that a program might successfully improve patient outcomes or save enough in Medicare expenditures to cover the cost of its intervention. The results to date are thus consistent with findings from Chen et al. (2000) that a few factors were common to most successful programs, including hiring well-trained, experienced nurses with at least a baccalaureate degree, but many other factors, such as having sophisticated electronic health records, were not required.
G. LONGER FOLLOWUP AND MORE OBSERVATIONS ARE NEEDED FOR DEFINITIVE FINDINGS
Due to the small sample sizes, the high variability in Medicare costs, and (for some programs) the small amount of savings required to cover the cost of the intervention, there remains uncertainty over whether nine of the programs generate savings, and if so, whether they are large enough to offset the fees. We cannot conclude with confidence that any of the programs generate savings in Medicare expenditures on the normal Part A and B services, because none of the estimated treatment-control differences are significantly different from zero. However, we also cannot conclude with confidence that these programs increase net costs to CMS. That is, there is a nontrivial possibility that these programs do generate enough savings in Medicare Part A and B expenditures to offset the modest program fees (typically 2 to 13 percent of the Part A and B expenditures), despite the fact that none of the estimates of such savings are statistically significant. The wide confidence intervals around the estimated savings in Part A and B expenditures encompass both zero (implying no effect) and the average fee paid (implying savings large enough to offset the fee). The conservative inference is that the programs were not
xxxvi
cost neutral over the first 25 months, but there is a substantial possibility, given that the statistical power to detect true net savings in these nine programs ranges from only 11 percent to 77 percent, that such a conclusion is not correct for some of the programs. Furthermore, effects may yet emerge for some programs as the program and patients gain more experience and as any cumulative effects of the interventions on patient and provider behavior begin to be reflected in outcomes.
Although none of the impact estimates available at this time suggest that the demonstration
programs are having large effects on patients� behaviors or outcomes, effects on Medicare service use and expenditures might be observed when the full 4 years of data on all patients become available. Physicians have been responding favorably to the programs�an important factor, given the widespread recognition that few care coordination programs are likely to succeed without significant cooperation and reinforcement from patients� physicians (Chen et al. 2000; Schore et al. 1999). Even more important, patients appear to have formed a bond with their care coordinators, and to trust their judgment.
The absence of large effects on the patient adherence measures may be somewhat
discouraging for programs, but it does not necessarily imply that the programs are having no effect on patients� behavior. Relative to the control group, patients of several programs reported better access to information and appointments and better communication among their providers. Furthermore, the finding that program patients were not significantly more likely to report eating a healthy diet or exercising regularly may have a positive explanation�it is possible that, as a result of program education, the treatment group had higher standards as to what constitutes �healthy� or �regular.� If that is true, their actual adherence may be better than the control group�s, but the survey measures reported here may not reflect it. In addition, in many cases, behavioral change takes time; some changes do not occur until patients have experienced an adverse event that makes them recognize the value of adhering to advice from their physicians or care coordinators. Programs report that they expect it to take a few years to observe changes in patients� behavior and the effects of those behaviors on the patients� health and service use. The observed improvements in preventive care in some programs also may not result in lower hospitalizations or costs for a few years. Thus, there is reason to believe that some programs may have effects over the longer run.
The final evaluation report will assess the effectiveness of the demonstration programs by
estimating program impacts on Medicare service use, expenditures, and quality of care over the first 4 years of program operations. The report will also describe the features of the program or target populations associated with effectiveness (if any). CMS has extended the end dates by 2 years to 2008, for the 11 demonstration programs that requested extensions. The four other programs will end in 2006 as originally planned. CMS granted the extensions because the Balanced Budget Act of 1997 authorizes CMS to continue any programs that are found to be cost-effective after the demonstration ends. The Act defines cost-effectiveness as either (1) reducing Medicare expenditures, or (2) not increasing Medicare expenditures while increasing the quality of services furnished and beneficiaries� and providers� satisfaction. The new end dates allow 11 of the demonstration programs to continue operating until the final evaluation findings are available. This extension allows any of the programs that the final evaluation report finds to be cost-effective to remain operating, rather than shutting down in 2006 and having to restart later.

1
I. INTRODUCTION
Chronic medical conditions contribute disproportionately to rising health care costs,
morbidity, and mortality among Medicare beneficiaries. The definition of chronic illness is the
subject of considerable debate, but it is generally accepted that a chronic disease (1) is persistent
and incurable, although controllable with treatment; (2) if uncontrolled, leads to repeated acute
health crises and hospitalizations and induces steady physical deterioration; and (3) requires
substantial, sustained efforts by patients and providers to control (Brown et al. 2005). Disease
management and case management interventions, which have been implemented widely in both
the commercial sector and managed care plans, seek to provide better care for the millions of
people with chronic conditions, thereby improving the health and quality of life of these patients
and reducing their health care costs. A number of demonstrations testing the effectiveness of
different types of disease management interventions for Medicare beneficiaries have been
sponsored by the Centers for Medicare & Medicaid Services (CMS).
This congressionally mandated report describes the findings from the evaluation by
Mathematica Policy Research, Inc. (MPR) of the 15 programs participating in the Medicare
Coordinated Care Demonstration (MCCD); the evaluation was mandated by the Balanced
Budget Act of 1997. The report covers the experiences of the programs during their first 2 years
of operations and presents detailed descriptions of the programs� interventions; experiences with
enrollment and disenrollment; and estimated effects on patients� quality of care, satisfaction, and
Medicare service use and expenditures. The findings across the 15 programs are then
synthesized to draw inferences about what program features appear to be associated with
improved patient outcomes and lower Medicare expenditures.

2
A. COSTS OF CHRONIC CARE AND SHORTCOMINGS OF THE HEALTH SYSTEM
Chronic conditions can have severe adverse effects on the quality of the lives of both people
who have the conditions and their caregivers, and, as many researchers have shown, the cost of
treating those conditions is disproportionately high. Medicare beneficiaries with five or more
chronic conditions accounted for two-thirds of total 1999 Medicare spending ($167 billion),
roughly half of which was for inpatient hospital care (U.S. Department of Health and Human
Services 2003; Anderson and Horvath 2002). Between 1990 and 1998, the age/sex-adjusted rate
of hospital admissions among people aged 65 or older for 12 preventable conditions rose
15 percent (Kozak et al. 2001). Furthermore, from 1992 to 2000, there have been no reductions
in the rates of preventable hospitalizations for congestive heart failure (CHF) (McCall et al.
2004); CHF is the leading cause of hospitalization among Medicare beneficiaries.
Nearly 80 percent of beneficiaries in the top quartile of 2001 Medicare spending were
diagnosed as having at least one of seven chronic conditions: (1) asthma, (2) chronic obstructive
pulmonary disease, (3) chronic renal failure, (4) CHF, (5) coronary artery disease (CAD),
(6) diabetes, or (7) senility. Nearly one-half (48 percent) had more than one of those conditions
(Congressional Budget Office 2005). Spending for the top quartile accounted for 88 percent of
Medicare fee-for-service expenditures, and most of that spending was concentrated in the top
5 percent of beneficiaries, who accounted for 48 percent of total expenditures (Medicare
Payment Advisory Commission 2004; Figure 2.1). Brown et al. (2005) found that nearly
one-half of Medicare beneficiaries in 1997 were treated for one or more of eight, often chronic,
conditions: (1) anemia, (2) CAD, (3) cancer, (4) diabetes, (5) heart disease, (6) liver/kidney
problems, (7) pulmonary disease, or (8) stroke. In 1998, the average annual cost to Medicare for
beneficiaries in this group was roughly $8,500, more than three times the average for
beneficiaries without any of the conditions ($2,700). Costs for this group accounted for three-
fourths of total Medicare costs for that year.

3
The current fee-for-service health care system does not support the substantial and sustained
efforts required of patients and providers to manage chronic illnesses effectively. The system
was originally developed to treat short-term acute conditions, and it currently focuses on the
provision of services by individual providers, rather than on the coordination of services among
providers. It does not pay for the time-consuming, ongoing education that many patients must
receive if they are to adhere to their physicians� treatment recommendations. The system also
does not pay for professionals to coordinate care across the numerous providers that chronically
ill patients typically see, nor does it pay for providers to adopt electronic health records that
might help to coordinate care, reduce duplicated tests, avoid prescription errors and interactions,
and prompt providers when follow-up care is required (Moreno 2005).
The current Medicare fee-for-service system does not reward physicians and other providers
for adhering to evidence-based guidelines for chronic care treatment (nor does it penalize them
for failing to adhere). Physician reimbursement under the current system is based on the
numbers and types of Medicare-covered procedures that are performed, rather than on adherence
to practice guidelines, which is more difficult to measure. For example, one study examining
care received by nearly 7,000 people in 12 metropolitan areas concluded that �Americans get
substandard care for their ailments about half the time� and noted that care for diabetes was
particularly poor (Kerr et al. 2004). Similarly, a study of elderly people with heart disease
enrolled in two managed care plans found that these patients received appropriate care only
55 percent of the time, and that those with dementia or malnutrition received it only 31 percent
of the time, because �providers overlook some common problems of old age� (Wenger et al.
2003). Providers, many of whom already are familiar with evidence-based treatment guidelines,
would benefit from reminders to adhere to the guidelines for all their patients, mechanisms that
encourage them to communicate with each other and that facilitate the sharing of test results on
their patients (for example, between emergency room physicians and cardiologists), and systems

4
to measure care outcomes in order to identify and remedy care gaps (Lowenstein 2005). A
former director of CMS�s Office of Research Development and Information summarized several
key barriers to better care for Medicare beneficiaries with chronic illnesses: poor data collection
and tracking, lack of prescription drug coverage, decentralized program administration, difficulty
communicating with beneficiaries, and difficulty integrating physicians into the improvement
process (Guterman 2004).
B. INTERVENTIONS TO IMPROVE CHRONIC CARE AND THEIR EFFECTIVENESS
A wide variety of �disease management� or �case management� programs have been found
to improve the delivery of chronic care (Villagra and Ahmed 2004; Bodenheimer et al. 2002;
Chen et al. 2000). However, many others have been shown to have no impacts, leading to
considerable debate over the effectiveness of such programs in general (Congressional Budget
Office 2004). Many of these programs are operated by providers of disease management
services or by hospitals or other entities that serve people with chronic illnesses. Most of the
programs that have been assessed with any methodological rigor have served a small number of
patients. The successful programs have been shown to have a number of features in common.
Many rely on two methods to improve patients� health and reduce the likelihood of
hospitalization: (1) patient education on treatment regimens and self-care recommendations, and
on the importance of adhering to them; and (2) telephone or in-person monitoring of patients�
symptoms, adherence, and self-care between physician office visits (see, for example, Riegel et
al. 2002; Rich et al. 1995; Wasson et al. 1992). Some programs have shown that encouraging
physicians to use evidence-based practices and feeding back to them patient information
obtained during monitoring calls or home visits have both reduced medical costs and improved
care delivery (see, for example, Sidorov et al. 2002; West et al. 1997). Many of the most
5
successful programs also develop mechanisms to improve communication across providers, such
as team meetings, telephone updates by case managers, and the sharing of medical records,
thereby reducing the fragmentation of care and the amount of conflicting advice given to patients
(Chen et al. 2000). Finally, successful programs sometimes help patients to follow treatment
regimens by guiding them to (or providing) support services and care-related goods that the
patients may not have realized were available, such as pharmacy assistance, subsidized
transportation, home-delivered meals, and pill cassettes and other medication scheduling aids
(Brown et al. 2001). More specifically, research during the past decade suggests (but by no
means shows conclusively) that successful care coordination programs typically share some
broad features: effective patient identification; a well-designed, evidence-based, structured
intervention; highly qualified staff; physician buy-in; and financial incentives aligned with
program goals (Exhibit I.1) (Chen et al. 2000).
Another approach to improving the care of chronic conditions is to base patient support in
physicians� offices. The underlying rationale is that, for most patients, the physician is the
primary link to the current health care system. Like disease management, the �chronic care
model,� as it is known, aims to improve patient self-management by communicating with
patients in their homes; unlike disease management, however, it also calls for physicians to
reorganize their office practices to focus more on chronic, rather than acute, illnesses. This focus
is achieved by providing patients who have chronic conditions with self-management support
(such as patient education); employing multidisciplinary teams that include nonphysician staff;
providing case management for the most seriously ill or frailest patients; and developing clinical
information support systems that remind physicians to use evidence-based practice guidelines,
and that can provide the teams with feedback about their performance (Casalino 2005). A
review of 39 chronic care model programs for patients with diabetes showed that 32 improved at

6
EXHIBIT I.1
COMMON FEATURES OF MOST SUCCESSFUL CARE COORDINATION PROGRAMS
______________________________________________________________________________
Targeting High-Risk People. People with recognized high-cost diagnoses, such as heart failure, but also those with prevalent geriatric syndromes, such as physical inactivity, falls, depression, incontinence, misuse of medications, and undernutrition (Fox 2000; Rector and Venus 1999)
Having a Comprehensive, Structured Intervention Adaptable to Individual Patients • Multifaceted assessment whose end product is a written care plan that can be used to
monitor a patient�s progress toward specific long- and short-term goals, and that is updated and revised as the patient�s condition changes (Chen et al. 2000)
• Process for providing aggregate- and patient-level feedback to care coordinators, program leaders, and physicians about patient outcomes to enable the program to modify or intensify the intervention if it appears that it is not having the expected effect on intermediate or ultimate outcome indicators (Chen et al. 2000)
• Patient education combining provision of factual information with techniques to help patients to change self-care behaviors and better manage their care, as well as addressing affective issues related to chronic illness, such as depression (Aubry 2000; Williams 1999; Lorig et al. 1999; Vernarec 1999; Roter et al. 1998)
• Structures and procedures for integrating fragmented care and for facilitating communication among providers, to address the complexities posed by patients with several comorbid conditions and, when necessary, to arrange for community services (Chen et al. 2000; Hagland 2000; Bodenheimer 1999)
Having Highly Trained Staff and Actively Involved Providers. Disease managers who are at least baccalaureate-prepared nurses or who have case management or community nursing experience. Active support and involvement of patients� physicians to encourage the patients� cooperation with disease managers, and to respond to disease managers� requests when urgent patient problems arise (Chen et al. 2000; Schore et al. 1999)
Using Financial Incentives. To compel programs to look for creative ways to meet patients� goals, and to reduce total health care costs by reducing preventable hospital stays (Schore et al. 1999) ______________________________________________________________________________
7
least one patient process or outcome measure (Bodenheimer et al. 2002). A review of 27 chronic
care model programs for patients with asthma, diabetes, or heart failure showed that 18 reduced
the patients� health service use and costs (Bodenheimer et al. 2002). Despite these positive
outcomes, the chronic care model has the disadvantage of requiring that physician practices have
the financial resources to make the necessary organizational changes, even though the current
health care financing system does not explicitly provide those resources.
Although managed care plans have embraced disease management as a means of improving
care for enrollees with chronic illnesses, it is unclear whether disease management and care
coordination programs can improve health outcomes for and reduce the Medicare costs of their
chronically ill beneficiaries. Specifically, disease management might fail to work if
interventions aimed at altering patients� or physicians� behaviors either do not change the
behaviors or, if they do change them, do so in ways that do not lead to changes in service use.
Even if the programs do work, it still is necessary to understand how best to implement disease
management or care coordination programs in a fee-for-service setting. Additional research also
is necessary to assess the relative importance of specific disease management features (such as
patient identification, patient engagement, the use of multiple clinical guidelines, and the
integration of disease management with physician practice), as well as to identify best practices
for those features (Villagra and Ahmed 2004).
C. MEDICARE DEMONSTRATIONS AND INITIATIVES TO IMPROVE OUTCOMES FOR BENEFICIARIES WITH CHRONIC ILLNESSES
CMS is currently funding or is planning to fund a series of important demonstrations,
evaluations, and studies to expand the evidence base on whether and how disease management,
case management, and other care coordination interventions can improve care for Medicare
beneficiaries with chronic illness in its fee-for-service program. Exhibit I.2 summarizes the
features of those demonstrations.

8
EXH
IBIT
I.2
C
UR
REN
T A
ND
PLA
NN
ED D
EMO
NST
RA
TIO
NS
AN
D E
VA
LUA
TIO
NS
TO IM
PRO
VE
CA
RE
FOR
BEN
EFIC
IAR
IES
WIT
H C
HR
ON
IC IL
LNES
SES
Prog
ram
(O
pera
tiona
l Per
iod)
D
emon
stra
tion
Iden
tific
atio
n of
Pot
entia
l En
rolle
es
Elig
ible
B
enef
icia
ries
Vol
unte
er
(Opt
-In
Mod
el)
Num
ber o
f Ben
efic
iarie
s Pa
rtici
patin
g
(Num
ber o
f Site
s)
Qua
lity
and
Satis
fact
ion
Perf
orm
ance
C
riter
ia
Prog
ram
C
arrie
s Fi
nanc
ial
Ris
k
Ran
dom
ly
Ass
igne
d Tr
eatm
ent
Gro
up?
Med
icar
e C
oord
inat
ed C
are
Dem
onst
ratio
n (2
002�
2008
)
Yes
Pr
ovid
er a
nd se
lf-re
ferr
al
Yes
20
,088
as o
f 9/2
4/05
(1
5)
No
No
Yes
Info
rmat
ics f
or D
iabe
tes
Educ
atio
n an
d Te
lem
edic
ine
(200
0�20
08)
Yes
Pr
ovid
er a
nd se
lf-re
ferr
al
Yes
2,
164
as o
f 9/3
0/05
(2
) N
o N
o Y
es
Med
icar
e D
isea
se
Man
agem
ent D
emon
stra
tion
(200
4�20
08)
Yes
C
MS
prov
ides
nam
es;
prov
ider
and
self-
refe
rral
Y
es
25,9
21 a
s of 9
/24/
05
(3)
Yes
a Y
esb
Yes
Life
Mas
ters
Dem
onst
ratio
n Pr
ogra
m
(200
5�20
08)
Yes
C
MS
prov
ides
nam
es o
f du
al e
ligib
les
No
30,3
75 a
s of A
ugus
t 200
5 (1
) Y
esa
Yes
c Y
es
Med
icar
e H
ealth
Sup
port
Prog
ram
(for
mer
ly, t
he
Chr
onic
Car
e Im
prov
emen
t Pr
ojec
t) (2
004�
2009
)
No
CM
S pr
ovid
es n
ames
; all
in g
eogr
aphi
c ar
ea w
ho
mee
t crit
eria
are
cov
ered
No
180,
000
(exp
ecte
d)
(9)
Yes
d Y
esc
Yes
Med
icar
e Ph
ysic
ian
Gro
up
Prac
tice
Dem
onst
ratio
n (2
005�
2008
)
Yes
C
MS
prov
ides
nam
es o
f el
igib
le b
enef
icia
ries
per P
GP
No
5,00
0 ph
ysic
ians
; mor
e th
an 2
00,0
00 M
edic
are
fee-
for-
serv
ice
bene
ficia
ries
(10)
Yes
e N
o N
o
Med
icar
e Li
fest
yle
Mod
ifica
tion
Prog
ram
D
emon
stra
tion
(199
9�20
06)
Yes
Pr
ovid
er a
nd se
lf-re
ferr
al
Yes
U
p to
3,6
00
(18)
N
o N
o N
o
Med
icar
e C
are-
Man
agem
ent
for H
igh-
Cos
t Ben
efic
iarie
s (2
005�
2008
)
Yes
C
MS
prov
ides
nam
es
base
d on
cla
ims d
ata
Yes
A
t lea
st 2
5,00
0 (e
xpec
ted)
(6)
Yes
f Y
esg
Yes
End-
Stag
e R
enal
Dis
ease
M
anag
emen
t (2
005�
2009
)
Yes
Pr
ovid
er a
nd se
lf-re
ferr
al
Yes
TB
D
Yes
h Y
es
No
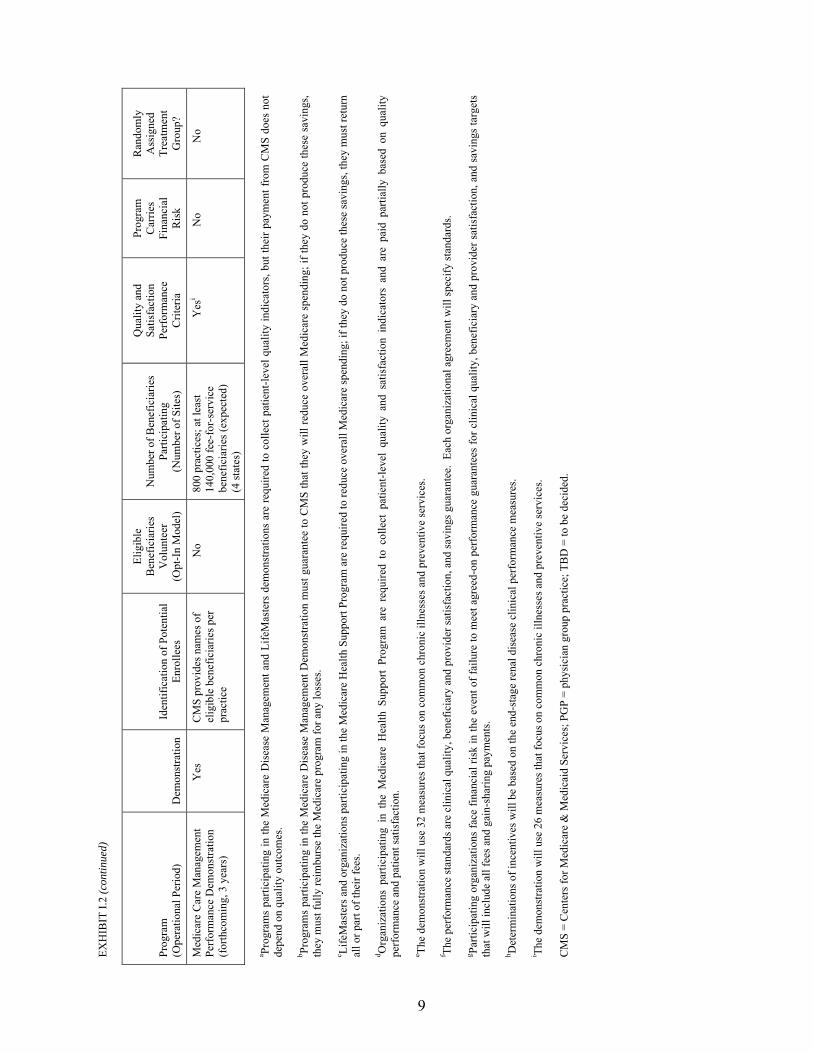
EXH
IBIT
I.2
(con
tinue
d)
9
Prog
ram
(O
pera
tiona
l Per
iod)
D
emon
stra
tion
Iden
tific
atio
n of
Pot
entia
l En
rolle
es
Elig
ible
B
enef
icia
ries
Vol
unte
er
(Opt
-In
Mod
el)
Num
ber o
f Ben
efic
iarie
s Pa
rtici
patin
g
(Num
ber o
f Site
s)
Qua
lity
and
Satis
fact
ion
Perf
orm
ance
C
riter
ia
Prog
ram
C
arrie
s Fi
nanc
ial
Ris
k
Ran
dom
ly
Ass
igne
d Tr
eatm
ent
Gro
up?
Med
icar
e C
are
Man
agem
ent
Perf
orm
ance
Dem
onst
ratio
n (f
orth
com
ing,
3 y
ears
)
Yes
C
MS
prov
ides
nam
es o
f el
igib
le b
enef
icia
ries p
er
prac
tice
No
800
prac
tices
; at l
east
14
0,00
0 fe
e-fo
r-se
rvic
e be
nefic
iarie
s (ex
pect
ed)
(4 st
ates
)
Yes
i N
o N
o
a Prog
ram
s pa
rtici
patin
g in
the
Med
icar
e D
isea
se M
anag
emen
t and
Life
Mas
ters
dem
onst
ratio
ns a
re re
quire
d to
col
lect
pat
ient
-leve
l qua
lity
indi
cato
rs, b
ut th
eir p
aym
ent f
rom
CM
S do
es n
ot
depe
nd o
n qu
ality
out
com
es.
b Prog
ram
s pa
rtici
patin
g in
the
Med
icar
e D
isea
se M
anag
emen
t Dem
onst
ratio
n m
ust g
uara
ntee
to C
MS
that
they
will
redu
ce o
vera
ll M
edic
are
spen
ding
; if t
hey
do n
ot p
rodu
ce th
ese
savi
ngs,
they
mus
t ful
ly re
imbu
rse
the
Med
icar
e pr
ogra
m fo
r any
loss
es.
c Life
Mas
ters
and
org
aniz
atio
ns p
artic
ipat
ing
in th
e M
edic
are
Hea
lth S
uppo
rt Pr
ogra
m a
re re
quire
d to
redu
ce o
vera
ll M
edic
are
spen
ding
; if t
hey
do n
ot p
rodu
ce th
ese
savi
ngs,
they
mus
t ret
urn
all o
r par
t of t
heir
fees
. d O
rgan
izat
ions
par
ticip
atin
g in
the
Med
icar
e H
ealth
Sup
port
Prog
ram
are
req
uire
d to
col
lect
pat
ient
-leve
l qu
ality
and
sat
isfa
ctio
n in
dica
tors
and
are
pai
d pa
rtial
ly b
ased
on
qual
ity
perf
orm
ance
and
pat
ient
satis
fact
ion.
e Th
e de
mon
stra
tion
will
use
32
mea
sure
s tha
t foc
us o
n co
mm
on c
hron
ic il
lnes
ses a
nd p
reve
ntiv
e se
rvic
es.
f The
perf
orm
ance
stan
dard
s are
clin
ical
qua
lity,
ben
efic
iary
and
pro
vide
r sat
isfa
ctio
n, a
nd sa
ving
s gua
rant
ee.
Each
org
aniz
atio
nal a
gree
men
t will
spec
ify st
anda
rds.
g Parti
cipa
ting
orga
niza
tions
face
fina
ncia
l ris
k in
the
even
t of f
ailu
re to
mee
t agr
eed-
on p
erfo
rman
ce g
uara
ntee
s fo
r clin
ical
qua
lity,
ben
efic
iary
and
pro
vide
r sat
isfa
ctio
n, a
nd s
avin
gs ta
rget
s th
at w
ill in
clud
e al
l fee
s and
gai
n-sh
arin
g pa
ymen
ts.
h Det
erm
inat
ions
of i
ncen
tives
will
be
base
d on
the
end-
stag
e re
nal d
isea
se c
linic
al p
erfo
rman
ce m
easu
res.
i The
dem
onst
ratio
n w
ill u
se 2
6 m
easu
res t
hat f
ocus
on
com
mon
chr
onic
illn
esse
s and
pre
vent
ive
serv
ices
. C
MS
= C
ente
rs fo
r Med
icar
e &
Med
icai
d Se
rvic
es; P
GP
= ph
ysic
ian
grou
p pr
actic
e; T
BD
= to
be
deci
ded.
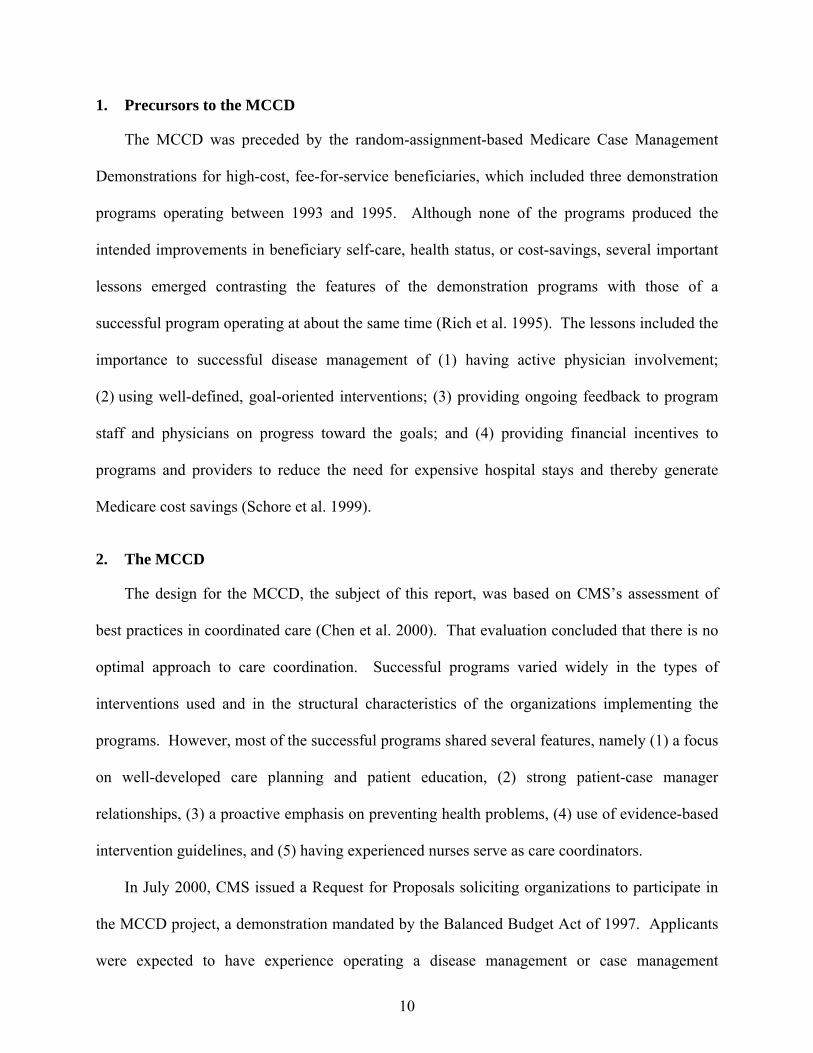
10
1. Precursors to the MCCD
The MCCD was preceded by the random-assignment-based Medicare Case Management
Demonstrations for high-cost, fee-for-service beneficiaries, which included three demonstration
programs operating between 1993 and 1995. Although none of the programs produced the
intended improvements in beneficiary self-care, health status, or cost-savings, several important
lessons emerged contrasting the features of the demonstration programs with those of a
successful program operating at about the same time (Rich et al. 1995). The lessons included the
importance to successful disease management of (1) having active physician involvement;
(2) using well-defined, goal-oriented interventions; (3) providing ongoing feedback to program
staff and physicians on progress toward the goals; and (4) providing financial incentives to
programs and providers to reduce the need for expensive hospital stays and thereby generate
Medicare cost savings (Schore et al. 1999).
2. The MCCD
The design for the MCCD, the subject of this report, was based on CMS�s assessment of
best practices in coordinated care (Chen et al. 2000). That evaluation concluded that there is no
optimal approach to care coordination. Successful programs varied widely in the types of
interventions used and in the structural characteristics of the organizations implementing the
programs. However, most of the successful programs shared several features, namely (1) a focus
on well-developed care planning and patient education, (2) strong patient-case manager
relationships, (3) a proactive emphasis on preventing health problems, (4) use of evidence-based
intervention guidelines, and (5) having experienced nurses serve as care coordinators.
In July 2000, CMS issued a Request for Proposals soliciting organizations to participate in
the MCCD project, a demonstration mandated by the Balanced Budget Act of 1997. Applicants
were expected to have experience operating a disease management or case management
11
program, and to present some evidence that they had been able to reduce hospitalizations or
costs. CMS took this approach to maximize the potential for showing, in a time-limited
demonstration, that a successful care coordination program could be adapted effectively to a
Medicare fee-for-service environment and population. Of the 58 proposals submitted, 15 were
selected as demonstration sites.
The 15 demonstration programs all serve chronically ill Medicare beneficiaries, but they
target different diseases and have developed widely differing interventions. The demonstration
allowed the programs to design their own interventions (which typically included patient
education to improve adherence to treatment recommendations), and to define appropriate target
populations (which included beneficiaries with diabetes, heart failure, and other types of heart
disease, as well as other conditions associated with morbidity or frailty in elderly people).
The MCCD evaluation has three goals. The evaluation is intended to (1) provide CMS with
unbiased estimates of the ability of the 15 demonstration programs to provide better and more
cost-effective care for chronically ill Medicare beneficiaries; (2) assess the extent to which the
effectiveness of care coordination depends on patient and program characteristics; and
(3) provide guidance on the feasibility, desirability, and possible structure of a Medicare
coordinated care benefit.
The demonstration is now in its third year. The MCCD programs originally were authorized
to operate for 4 full years, and to enroll new patients through the 42nd month. However, the end
date has been extended to 2008 for 11 programs that requested an extension. The extension was
granted because the legislation requiring the demonstration authorizes the continuation of any
programs that are shown to lower net costs to Medicare or to improve quality and beneficiary
and provider satisfaction without increasing net costs to Medicare. The new end dates allow the
11 demonstration programs to continue operating until the evaluation findings are available.
12
This change allows any of the programs that are found to be effective to remain operating rather
than shutting down in 2006 and then having to restart later.
During the demonstration, programs are paid a capitated rate per month for each patient who
is enrolled in the treatment group until the patient dies or disenrolls. The rates in the first year
varied from $50 to $437 across the 15 programs.1 In return for the capitation payment, programs
must provide the intervention that was described in their operational protocols approved by and
established with CMS, but they are not required to guarantee costs savings for the
Medicare program.
The programs started enrolling patients between April and September of 2002, after
receiving approval from the Office of Management and Budget. Six programs started enrolling
in April, five started in June, one did so in July, two began in August, and one began in
September. In each program, Medicare beneficiaries who expressed an interest in participating
in the demonstration and who met the program�s eligibility criteria were randomly assigned (by
MPR) to either the treatment group, which received the intervention as well as their normal
Medicare benefits, or to the control group, which received only their normal Medicare benefits.
The evaluation estimates the effect of the demonstration programs by comparing outcomes for
the treatment and control groups. The impact analyses test whether the programs (1) reduce
Medicare payments and service use, (2) improve the quality of care, and (3) improve patients�
and physicians� satisfaction. The analysis of Medicare payments estimates program impacts on
costs to the Medicare program (including care coordination program costs) and program impacts
on Medicare service use. The analysis of the quality of care assesses the care delivery process
1 Five programs have multiple rates. The rate that is applicable for a particular patient depends on the patient�s
diagnosis, acuity level, or length of time in the program.
13
and the clinical outcomes of Medicare beneficiaries. In the satisfaction analysis, both patients�
satisfaction and physicians� satisfaction are covered.
3. Other CMS Disease Management Initiatives
A number of other CMS demonstrations also will provide estimates of program
effectiveness. The Medicare Disease Management Demonstration, which began in 2004, was
authorized by Section 121 of the Benefits Improvement and Protection Act of 2000. That
demonstration requires that its three demonstration programs target beneficiaries with advanced-
stage diabetes, CAD, or heart failure. The demonstration intervention includes both disease
management (as defined by each program) and a pharmacy benefit that covers nearly all
prescription drugs, and that charges modest patient copayments. (Its design pre-dates legislation
for the Medicare prescription drug benefit that will begin in 2006.) In addition, the three
participating demonstration programs must guarantee savings for Medicare (although the amount
of savings is not specified, so this requirement is essentially that a program be cost neutral). The
demonstration is being evaluated using a random assignment design.
CMS also is testing larger-scale �population-based� approaches to delivering disease
management, on the grounds that these approaches would be more operationally efficient: CMS
could hold a single entity accountable for improving health and for reducing costs for all
Medicare beneficiaries who reside in a particular geographic area and who have a particular
illness. Furthermore, holding a single disease management provider accountable for all
beneficiaries in a defined population would eliminate concerns about favorable selection (that is,
that a program would enroll patients who would be most likely to adhere to recommendations
14
and, therefore, most likely to have favorable outcomes).2 With a population-based approach,
however, the task for the provider changes from that of identifying beneficiaries who want the
services to that of encouraging all patients with the target condition (and their physicians) to
participate, including patients who initially decline or who are difficult to contact (for example,
because the program is unable to obtain their telephone numbers). Two initiatives, the
LifeMasters Demonstration Program and the Medicare Health Support Program (formerly known
as the Chronic Care Improvement Program), are currently testing a population-based approach.
The LifeMasters program targets beneficiaries who are dually eligible for Medicare and
Medicaid; live in Florida; and have severe CAD, CHF, or diabetes. CMS�s evaluation contractor
identifies all beneficiaries eligible for LifeMasters based on program-provided criteria and
randomly assigns them to either the treatment group (which has the opportunity to receive the
program�s disease management intervention) or the control group (which does not). The
program is then responsible for engaging and providing disease management services to all
eligible beneficiaries in the treatment group in exchange for a monthly payment for each of those
beneficiaries. The program is required to be cost neutral and must share any net reductions in
Medicare costs with CMS.
The Medicare Health Support Program, which is expected to operate in nine sites located in
nine states and the District of Columbia, targets beneficiaries with CHF or diabetes. Two key
features distinguish this pilot program from previous demonstrations. First, its scale is much
larger. The selected sites must operate in regions that, together, encompass 10 percent of all
2 If a program is paid based on savings generated, its incentive is to enroll patients in whom it is most likely to
be able to induce the desired behavior changes (sometimes referred to as �low-hanging fruit�). Patients� self-selection behavior is likely to exacerbate these tendencies, as the patients most likely to enroll voluntarily are those who are most open to accepting the program�s advice. A population-based approach forces programs to engage all patients in the target group, and to seek ways to improve their outcomes.

15
beneficiaries in the fee-for-service Medicare program; each site is expected to identify at least
30,000 eligible beneficiaries. Second, the sites will have clear performance targets for quality,
cost savings, and patient satisfaction, and they will be at risk for all fees if they fail to meet their
targets. Sites in previous demonstrations (the Medicare Disease Management Demonstration and
LifeMasters Demonstration Program) are at risk only for fees.
D. PURPOSE OF AND METHODOLOGY FOR THIS REPORT
This report is a synthesis of findings covering the first 25 months of the MCCD programs,
about halfway through the demonstration. The goals of the evaluation are to estimate the
impacts of each of the 15 programs, and to assess which program features appear to be
associated with program success. The first report to Congress provided a preliminary synthesis
of findings from the first year of the demonstration programs� operations (Brown et al. 2004). It
described the programs and beneficiaries participating in the demonstrations, the interventions
that the programs implemented, and early feedback from physicians and patients about the
programs. At that time, it was too early to produce estimates of program effects on enrolled
patients� service use or costs, as an insufficient number of observations were available, and data
were available for only the first 6 months of program operations. This report presents treatment-
control differences for outcomes measured over the first year after the month of enrollment for
beneficiaries who enrolled during the programs� first year; it also presents estimates of
treatment-control differences, by calendar month, over the first 25 months of operations. The
report also describes the methods that the programs used to recruit beneficiaries, the
characteristics of the first-year program enrollees, the nature and focus of the programs�
interventions, and the relative intensity and quality of the interventions. The findings are
summarized in the study�s Second Report to Congress (Brown et al. 2006).
16
Data are drawn from several sources. Program descriptions from the evaluation�s
implementation analysis are based primarily on information from site visits, telephone
interviews, review of program documents, and analysis of data that the programs provided
specifically for the evaluation. The participation analysis and treatment-control differences
presented in this report are based on Medicare enrollment and claims data available through
June 2005. Additional measures of the processes of care, quality of care, patient symptoms and
well-being, and satisfaction with care are based on surveys of patients and physicians conducted
by MPR by telephone. A final report to Congress, due in 2008, will present findings on
program impacts on quality, use, and cost of care provided over the full 4-year demonstration
period, based on claims data.
E. THE REST OF THIS REPORT
Chapter II compares the key features of the 15 demonstration programs as planned and as
implemented and scores each of the 15 in terms of how well designed it is on 10 different
dimensions. Chapter III describes the demonstration enrollees and analyzes participation and
disenrollment patterns. Chapter IV presents patients� and physicians� perceptions about the
programs. Chapter V describes treatment-control differences in the processes and quality of
care, as well as in health status, and Chapter VI estimates the treatment-control differences in
Medicare service use and expenditures. Chapter VII synthesizes the lessons from the study to
date and describes the content and timing of the third evaluation report.

17
II. DEMONSTRATION PROGRAM STRUCTURE AND KEY FEATURES
Nearly all of the program hosts for the Medicare Coordinated Care Demonstration (MCCD)
were experienced providers of disease management or case management interventions that had
some evidence of having reduced hospitalizations or costs.3 For the demonstration, each host
was free to select a target patient population, and, based on its previous experience, to design
interventions to improve patients� health and reduce costs in the fee-for-service Medicare
program. Although the 15 programs shared some features, such as conducting initial patient
assessments and regularly monitoring patients� symptoms, they differed in many important
ways�who they targeted, how they provided patient education, and the extent to which they
involved physicians in their programs, to name just a few.
This chapter describes the organizations that hosted the 15 demonstration programs. It then
summarizes key program intervention features and presents data that each program collected for
the demonstration describing care coordinator contacts with patients randomly assigned to the
demonstration treatment group (referred to in this chapter simply as �patients�). It concludes
with a discussion of an approach for assigning quantitative �scores� or ratings for the features of
each program�s intervention.
A. PROGRAM STRUCTURE, EXPERIENCE, AND RELATIONSHIP WITH PHYSICIANS
The MCCD programs were hosted by a diverse range of organizations that differed both in
their level of experience delivering the specific interventions offered to demonstration program
3 This evidence generally consisted of pre- and postintervention studies, studies comparing enrolled patients
with historical controls, or studies comparing enrolled patients with groups of roughly comparable patients. Patients in the studies were most often insured by commercial or Medicare managed care health plans.
18
target populations and in their existing links to the community of physicians who would be
serving their patients. Previous experience is likely to facilitate the ability of a program to
generate favorable effects quickly; pre-existing links may affect the extent to which a program
enjoys critical support from patients� physicians.
1. Program Host Organizations
Program hosts included a wide variety of provider and organizational types. The program
hosts consisted of five commercial disease management providers, three hospitals, three
academic medical centers, one integrated delivery system, a hospice, a retirement community,
and a long-term care facility (Exhibit II.1).
2. Program Service Areas and Target Populations
The programs served patients in 16 states and in the District of Columbia, from Maine to
Arizona, and from northern California to south Florida (Figure II.1). Four programs served
patients primarily in rural areas; the other 11 served patients in cities and suburbs.
Six of the 15 programs targeted only a single condition. Four of the six targeted congestive
heart failure (CHF), one targeted coronary artery disease (CAD), and one targeted cancer
(Exhibit II.1). Another program targeted CAD and CHF. Each of the eight remaining programs
targeted several diagnoses. Three of the eight cast particularly wide nets by targeting many
diagnoses or by targeting beneficiaries who were frail or otherwise considered to be at high risk
for hospitalization.
Most of the programs excluded certain types of beneficiaries, including people with medical
conditions that were unrelated to the programs� target diagnoses and the treatment of which
might dominate the treatment for the target diagnoses (such as end-stage renal disease), those
who had terminal illnesses, and those who had conditions or limitations that would make it

19
EXH
IBIT
II.1
PRO
GR
AM
HO
STS,
TA
RG
ET D
IAG
NO
SES,
AN
D S
ERV
ICE
USE
REQ
UIR
EMEN
TS
Ave
ra
Car
le
Cen
VaN
et
Cha
rles-
tow
n C
orSo
lutio
ns
Geo
rge-
tow
n
Hea
lth
Qua
lity
Partn
ers
Hos
pice
of
the
Val
ley
Jew
ish
Hom
e &
H
ospi
tal
Med
ical
C
are
Dev
elop
men
t M
ercy
Q
Med
Q
ualit
y O
ncol
ogy
Uni
vers
ity
of
Mar
ylan
d W
ashi
ngto
n U
nive
rsity
Num
ber
of
Prog
ram
s
Hos
t Org
aniz
atio
n T
ype
DM
/CC
Pr
ovid
er
X
X
X
X
X
5 H
ospi
tal
X
X
X
3 A
cade
mic
X
X
X
3
Oth
era
X
X
X
X
4
Tar
gete
d D
iagn
oses
C
HF
X
X
X
X
X
X
X
X
X
X
X
X
12
O
ther
H
eart
Dis
ease
sb
X
X
X
X
X
X
X
7
CO
PD/
Ast
hma
X
X
X
X
X
X
X
7 D
iabe
tes
X
X
X
X
X
5 C
ance
r
X
X
X
3
Stro
ke
X
X
X
3 D
emen
tia
X
X
2
Ren
al
Failu
re
X
1 O
ther
c
X
X
X
X
X
X
6 Se
rvic
e U
se R
equi
rem
ents
d H
ospi
tal,
Targ
et
Dia
gnos
is
X
X
X
X
X
X
6
Hos
pita
l, A
ny
Dia
gnos
is
X
X
X
X
4
Oth
er
Serv
ice
Use
X
X
X
3
Non
e
X
X
X
X
4 a O
ther
org
aniz
atio
ns in
clud
e an
inte
grat
ed d
eliv
ery
syst
em (C
arle
), a
retir
emen
t com
mun
ity (C
harle
stow
n), a
hos
pice
(Hos
pice
of t
he V
alle
y), a
nd a
long
-term
car
e fa
cilit
y (J
ewis
h H
ome
and
Hos
pita
l).
b Oth
er h
eart
dise
ases
incl
ude
coro
nary
arte
ry d
isea
se, a
trial
fibr
illat
ion,
isch
emic
hea
rt di
seas
e, a
nd h
yper
tens
ive
hear
t dis
ease
. c O
ther
dia
gnos
es in
clud
e ce
rebr
ovas
cula
r dis
ease
(Cen
VaN
et);
hype
rtens
ion
and
hype
rlipi
dem
ia (H
ealth
Qua
lity
Partn
ers)
; Par
kins
on�s
dis
ease
and
am
yotro
phic
late
ral s
cler
osis
(Hos
pice
of t
he V
alle
y);
liver
dis
ease
, oth
er c
ereb
rova
scul
ar d
isea
se, p
sych
otic
dis
orde
rs, a
nd m
ajor
dep
ress
ion
(Jew
ish
Hom
e an
d H
ospi
tal);
and
oth
er c
ereb
rova
scul
ar d
isea
se a
nd li
ver d
isea
se (M
ercy
). T
o id
entif
y pa
tient
s, W
ashi
ngto
n U
nive
rsity
use
d a
prop
rieta
ry a
lgor
ithm
dev
elop
ed b
y its
dem
onst
ratio
n pa
rtner
, Sta
tusO
ne, t
o ta
rget
Med
icar
e be
nefic
iarie
s w
ho w
ere
likel
y to
bec
ome
clin
ical
ly u
nsta
ble,
and
to re
quire
ho
spita
lizat
ion
durin
g th
e ne
xt 1
2 m
onth
s. d Se
rvic
e us
e is
requ
ired
durin
g th
e ye
ar b
efor
e en
rollm
ent w
ith th
e fo
llow
ing
exce
ptio
ns:
hosp
italiz
atio
n co
uld
be d
urin
g th
e 2
year
s bef
ore
enro
llmen
t (C
harle
stow
n), a
nd h
ospi
taliz
atio
n m
ust b
e w
ithin
th
e la
st 6
0 da
ys (M
edic
al C
are
Dev
elop
men
t). S
ee A
ppen
dix
Exhi
bit A
.1 fo
r add
ition
al d
etai
l on
serv
ice
use
requ
irem
ents
.
CH
F =
cong
estiv
e he
art f
ailu
re; C
OPD
= c
hron
ic o
bstru
ctiv
e pu
lmon
ary
dise
ase;
DM
/CC
= d
isea
se m
anag
emen
t or c
are
coor
dina
tion.

20
Geo
rget
own
QM
ed
Hos
pice
Car
le
Cen
VaN
et
HQ
P
Cha
rles
tow
n
MC
D
Mer
cyA
vera
Was
hing
ton
Uni
vers
ity
JHH
U o
f Md
Qua
lity
Onc
olog
y
Cor
Solu
tions
FIG
UR
E II
.1
TH
E M
CC
D S
ERV
ICE
AR
EAS
Hos
pice
= H
ospi
ce o
f th
e V
alle
y; H
QP
= H
ealth
Qua
lity
Partn
ers;
JH
H =
Jew
ish
Hom
e an
d H
ospi
tal
Life
care
Sys
tem
; MC
D =
Med
ical
Car
e D
evel
opm
ent;
U o
f Md
= U
nive
rsity
of M
aryl
and.

21
difficult for them to benefit from a program�s intervention (such as dementia or a serious mental
disorder). (See Appendix Exhibits A.1 and A.2 for detailed descriptions of the programs�
eligibility criteria.)
3. Host Organizations’ Experience with Care Coordination
The Centers for Medicare & Medicaid Services (CMS) selected demonstration hosts that
were experienced providers of care coordination, disease management, or related services to
maximize the chances that the hosts would be able to become operational quickly, and that they
would succeed at improving patient health. Most hosts (12 of 15) had provided disease
management or care coordination in programs that served as prototypes to their demonstration
programs (Exhibit II.2). The remaining three had provided cardiac rehabilitation or web-based
telemedicine or had provided consultation services to a disease management program.
Most of the hosts had experience primarily with patients in managed care. Only 4 of the
15 prototype programs had served patients in the fee-for-service sector. Managed care typically
affords providers more influence with patients� physicians and access to medical records than is
usually available in the fee-for-service sector. The fragmented care typically found in the fee-
for-service sector can present difficulties for programs whose staff expect to obtain patients�
clinical data from medical records, or to easily gain the support of physicians.
4. Host Organizations’ Relationship to Patients’ Physicians
The literature has found that physician support is critical to care coordination efforts in
terms of both encouraging patients� initial participation and validating the advice that care
coordinators provide to patients (Chen et al. 2000). Physician support also is key to facilitating
communications between care coordinators and physicians, to establishing the credibility of care
coordinators in the eyes of the physicians, and to fostering physicians� trust in the care
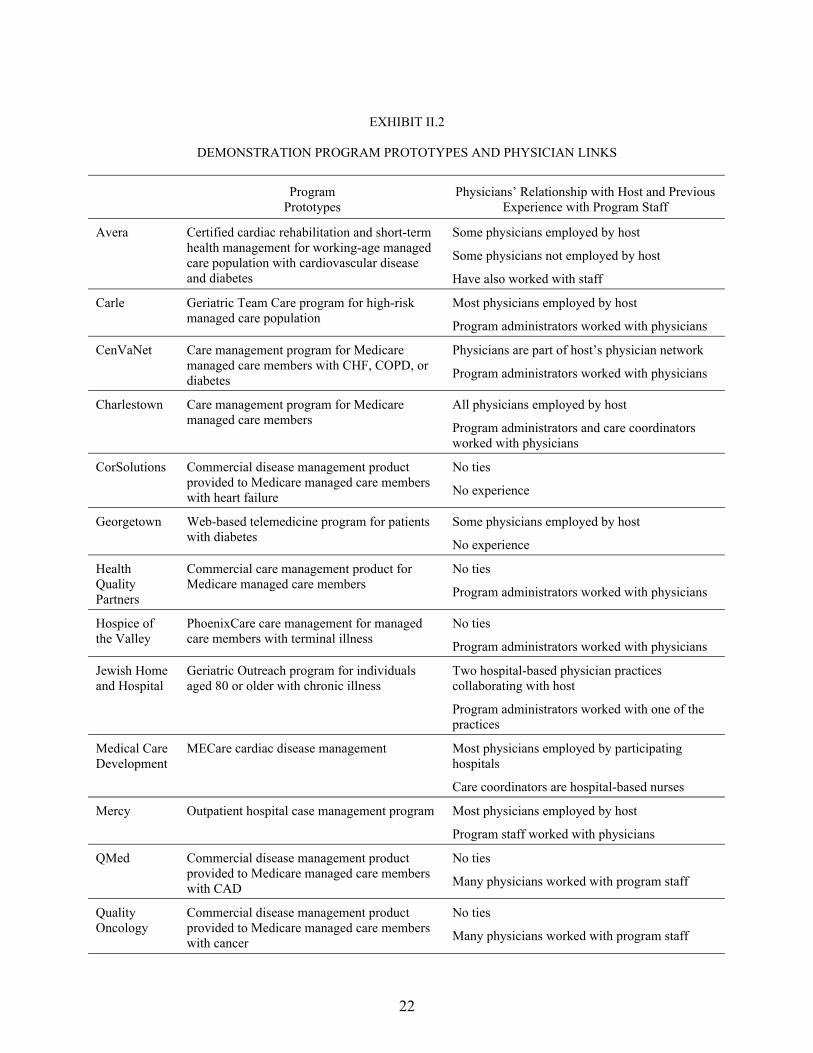
22
EXHIBIT II.2
DEMONSTRATION PROGRAM PROTOTYPES AND PHYSICIAN LINKS
Program Prototypes
Physicians� Relationship with Host and Previous Experience with Program Staff
Avera Certified cardiac rehabilitation and short-term health management for working-age managed care population with cardiovascular disease and diabetes
Some physicians employed by host
Some physicians not employed by host
Have also worked with staff
Carle Geriatric Team Care program for high-risk managed care population
Most physicians employed by host
Program administrators worked with physicians
CenVaNet Care management program for Medicare managed care members with CHF, COPD, or diabetes
Physicians are part of host�s physician network
Program administrators worked with physicians
Charlestown Care management program for Medicare managed care members
All physicians employed by host
Program administrators and care coordinators worked with physicians
CorSolutions Commercial disease management product provided to Medicare managed care members with heart failure
No ties
No experience
Georgetown Web-based telemedicine program for patients with diabetes
Some physicians employed by host
No experience
Health Quality Partners
Commercial care management product for Medicare managed care members
No ties
Program administrators worked with physicians
Hospice of the Valley
PhoenixCare care management for managed care members with terminal illness
No ties
Program administrators worked with physicians
Jewish Home and Hospital
Geriatric Outreach program for individuals aged 80 or older with chronic illness
Two hospital-based physician practices collaborating with host
Program administrators worked with one of the practices
Medical Care Development
MECare cardiac disease management Most physicians employed by participating hospitals
Care coordinators are hospital-based nurses
Mercy Outpatient hospital case management program Most physicians employed by host
Program staff worked with physicians
QMed Commercial disease management product provided to Medicare managed care members with CAD
No ties
Many physicians worked with program staff
Quality Oncology
Commercial disease management product provided to Medicare managed care members with cancer
No ties
Many physicians worked with program staff

EXHIBIT II.2 (continued)
23
Program Prototypes
Physicians� Relationship with Host and Previous Experience with Program Staff
University of Maryland
Consultants to disease management program for managed care members with heart failure operated by home health agency
No ties
No experience
Washington University
Care management for high-risk Medicare managed care members developed jointly with StatusOne, a commercial disease management provider (and the university�s partner for this demonstration)
All physicians employed by host
Program administrators and care coordinators worked with physicians
CAD = coronary artery disease; CHF = congestive heart failure; COPD = chronic obstructive pulmonary disease.
24
coordinators. Credibility and trust enable physicians to feel comfortable about sharing important
patient information with care coordinators, asking care coordinators to intervene with patients
when necessary, and responding to issues that care coordinators have raised.
As discussed in detail in this chapter, programs can take a number of steps to build
relationships between physicians and care coordinators. However, they may have a head start if
program staff and patient physicians already have established organizational links, such as a
shared employer (for example, if the host is a medical center), or if the physicians are familiar
with the program�s administrative staff or care coordinators. Both circumstances increase the
likelihood that physicians and program staff share a common vision of patient care, and they may
give the programs some leverage over physicians� behavior (for example, in encouraging
physicians to refer patients or to cooperate with care coordinators).
For most of the programs (9 of 15), at least some physicians were employed by either the
program host or organizations affiliated with the host for the demonstration (Exhibit II.2).
Physicians of patients in 12 of the 15 programs had worked previously with program leadership
or care coordinators. In only two programs were physicians neither affiliated with program hosts
nor familiar with staff.
B. PROGRAM INTERVENTIONS
The demonstrations are not a test of a single intervention in 15 sites, but rather, a test of
15 different interventions. CMS decided on this design because it found that successful
programs shared some common features, but did not necessarily follow a common approach
(Chen et al. 2000). Care coordination is predicated on the belief that the failure of patients and
physicians to properly manage chronic illnesses results in uncontrolled symptoms and acute
exacerbations that could have been avoided, but instead, lead to expensive treatment. All of the
MCCD programs shared the broad goal of improving patient health as a means of reducing the

25
need for emergency room (ER), inpatient hospital, and other acute care services. Each program
started with a comprehensive patient assessment for each patient, followed by a plan for
addressing the patient�s knowledge and care gaps and a process for ensuring that gaps would
be filled.
The program interventions collectively took four basic approaches to improving patient
health: (1) improving adherence to treatment recommendations, usually through patient
education; (2) improving communication and coordination, including identifying worsening
symptoms before they required hospital care; (3) improving physician practice; and
(4) increasing access to support services. The programs varied, however, as to whether they
focused on a particular approach or approaches, and, if so, the extent of their focus.
The programs also differed in the mode and intensity of their contacts with patients who
enrolled during their first year of operations. Most programs (11 of 15) contacted patients once
or twice per month during the patients� first year after random assignment, with 6 of the
11 averaging 1.2 to 1.5 contacts per month and the other 5 averaging 2.2 to 2.6 contacts per
month (Table II.1). Three programs contacted their patients substantially more frequently,
between four and eight times per month. Each of these three programs used home telemonitors
(as discussed in section 3 below), and some portion of those contacts were likely for the purpose
of inquiring about out-of-range monitor readings. It appears that the remaining program
contacted patients only about once every 2 months. (Staff from the program speculated that care
coordinators were not recording all their patient contacts.) Care coordinators (rather than
patients) initiated most contacts (between 73 and 98 percent) during the patients� first year, and
most contacts were by telephone for most programs. Seven programs also provided over one-
fourth of their contacts in person; the program with the highest proportion provided nearly
70 percent of its contacts in person (56 percent in patients� homes and 13 percent in other
locations, such as clinics and physicians� offices).
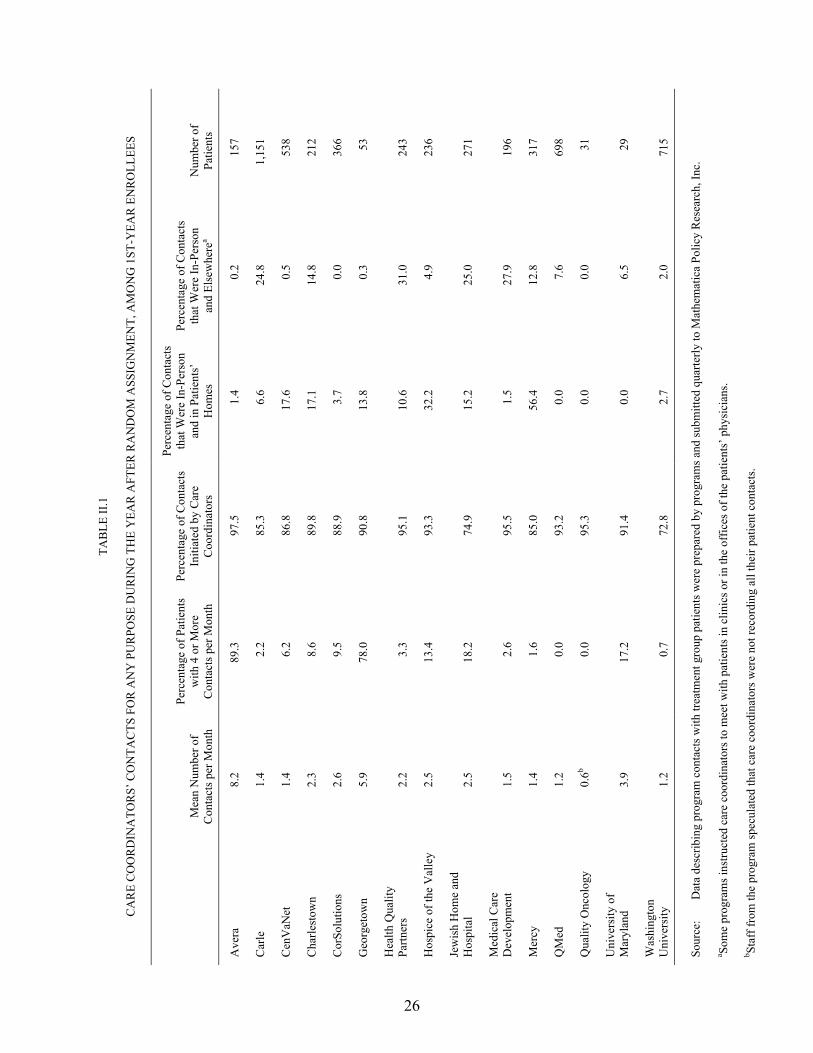
26
TAB
LE II
.1
CA
RE
CO
OR
DIN
ATO
RS�
CO
NTA
CTS
FO
R A
NY
PU
RPO
SE D
UR
ING
TH
E Y
EAR
AFT
ER R
AN
DO
M A
SSIG
NM
ENT,
AM
ON
G 1
ST-Y
EAR
EN
RO
LLEE
S
Mea
n N
umbe
r of
Con
tact
s per
Mon
th
Perc
enta
ge o
f Pat
ient
s w
ith 4
or M
ore
Con
tact
s per
Mon
th
Perc
enta
ge o
f Con
tact
s In
itiat
ed b
y C
are
Coo
rdin
ator
s
Perc
enta
ge o
f Con
tact
s th
at W
ere
In-P
erso
n an
d in
Pat
ient
s�
Hom
es
Perc
enta
ge o
f Con
tact
s th
at W
ere
In-P
erso
n an
d El
sew
here
a N
umbe
r of
Patie
nts
Ave
ra
8.2
89.3
97
.5
1.4
0.2
157
Car
le
1.4
2.2
85.3
6.
6 24
.8
1,15
1
Cen
VaN
et
1.4
6.2
86.8
17
.6
0.5
538
Cha
rlest
own
2.3
8.6
89.8
17
.1
14.8
21
2
Cor
Solu
tions
2.
6 9.
5 88
.9
3.7
0.0
366
Geo
rget
own
5.9
78.0
90
.8
13.8
0.
3 53
Hea
lth Q
ualit
y Pa
rtner
s 2.
2 3.
3 95
.1
10.6
31
.0
243
Hos
pice
of t
he V
alle
y 2.
5 13
.4
93.3
32
.2
4.9
236
Jew
ish
Hom
e an
d H
ospi
tal
2.5
18.2
74
.9
15.2
25
.0
271
Med
ical
Car
e D
evel
opm
ent
1.5
2.6
95.5
1.
5 27
.9
196
Mer
cy
1.4
1.6
85.0
56
.4
12.8
31
7
QM
ed
1.2
0.0
93.2
0.
0 7.
6 69
8
Qua
lity
Onc
olog
y 0.
6b 0.
0 95
.3
0.0
0.0
31
Uni
vers
ity o
f M
aryl
and
3.9
17.2
91
.4
0.0
6.5
29
Was
hing
ton
Uni
vers
ity
1.2
0.7
72.8
2.
7 2.
0 71
5 So
urce
: D
ata
desc
ribin
g pr
ogra
m c
onta
cts w
ith tr
eatm
ent g
roup
pat
ient
s wer
e pr
epar
ed b
y pr
ogra
ms a
nd su
bmitt
ed q
uarte
rly to
Mat
hem
atic
a Po
licy
Res
earc
h, In
c.
a Som
e pr
ogra
ms i
nstru
cted
car
e co
ordi
nato
rs to
mee
t with
pat
ient
s in
clin
ics o
r in
the
offic
es o
f the
pat
ient
s� p
hysi
cian
s. b St
aff f
rom
the
prog
ram
spec
ulat
ed th
at c
are
coor
dina
tors
wer
e no
t rec
ordi
ng a
ll th
eir p
atie
nt c
onta
cts.
27
1. Care Coordinators’ Qualifications, Training, and Caseloads
All but two of the programs required their care coordinators to be experienced registered
nurses (RNs) (Exhibit II.3). Of the two programs, one also used social workers as care
coordinators, and the other used experienced licensed practical nurses as well as RNs. Three of
the programs that required care coordinators to be RNs also required them to be at least
baccalaureate-prepared. Almost all of the programs required previous nursing experience in
specific areas, most commonly cardiac care, community nursing (such as home health, public
health, or hospice nursing), geriatric care, or medical-surgical nursing.
The intensity and types of training that the programs provided to incoming care coordinators
varied substantially. All but two offered formal (classroom) orientation that varied in length
from a couple of days to 4 weeks. One of the two programs without formal orientation (the
smallest program) employed only one care coordinator; because this care coordinator was a
nurse practitioner with 30 years of cardiac care experience who had helped to design the
program, she did not need orientation. The other program that did not provide formal orientation
was small and trained its care coordinators solely by offering 6 to 8 months of mentoring. Seven
of the 13 programs with formal orientation followed up the orientation with a period of
mentoring by either the care coordination supervisor or a more experienced care coordinator.
Average caseloads also varied widely. Care coordinators at 4 programs had caseloads of
50 or fewer patients; the smallest average caseload was 36 patients. (Two of the four programs
intentionally had small caseloads, whereas the other two were smaller than planned because they
enrolled so few patients.) Seven programs had average caseloads of 60 to 90 patients per care
coordinator, and 3 had caseloads of more than 90; the largest had a caseload of 200 patients per
care coordinator. The 15th program relied on local care coordinators who contacted patients
primarily by telephone, but who could meet face-to-face with patients if necessary, as well as on
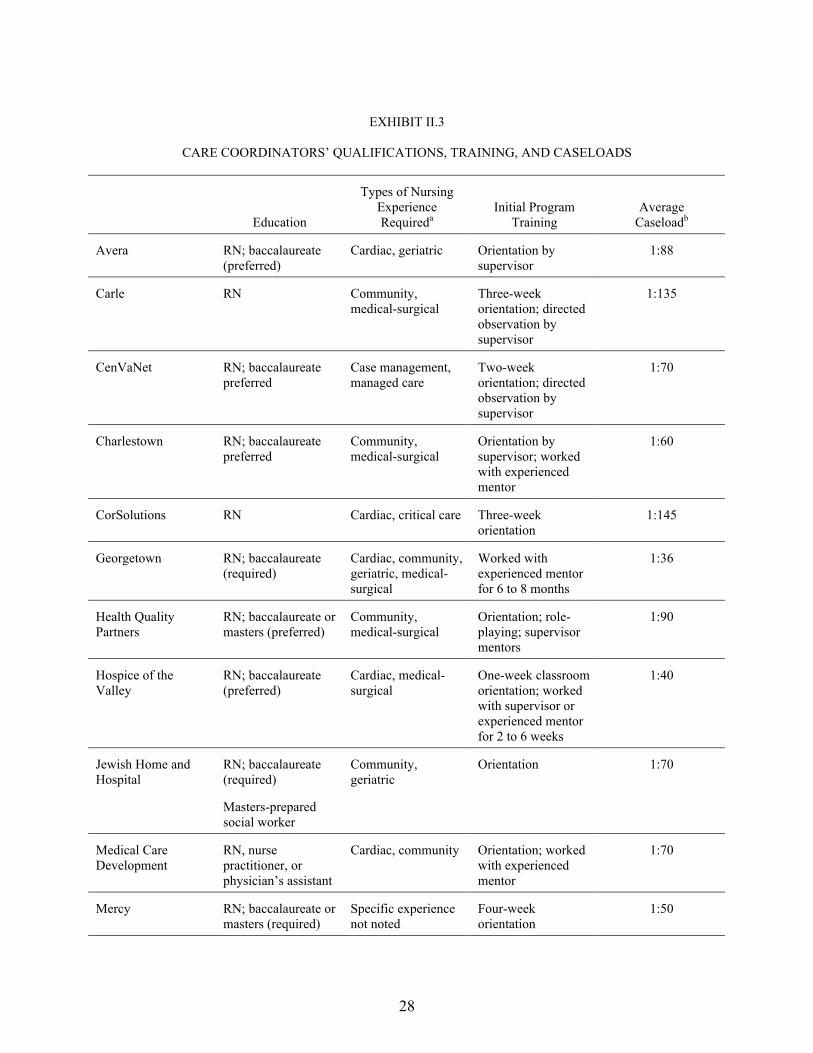
28
EXHIBIT II.3
CARE COORDINATORS� QUALIFICATIONS, TRAINING, AND CASELOADS
Education
Types of Nursing Experience Requireda
Initial Program Training
Average Caseloadb
Avera RN; baccalaureate (preferred)
Cardiac, geriatric Orientation by supervisor
1:88
Carle RN Community, medical-surgical
Three-week orientation; directed observation by supervisor
1:135
CenVaNet RN; baccalaureate preferred
Case management, managed care
Two-week orientation; directed observation by supervisor
1:70
Charlestown RN; baccalaureate preferred
Community, medical-surgical
Orientation by supervisor; worked with experienced mentor
1:60
CorSolutions RN Cardiac, critical care Three-week orientation
1:145
Georgetown RN; baccalaureate (required)
Cardiac, community, geriatric, medical-surgical
Worked with experienced mentor for 6 to 8 months
1:36
Health Quality Partners
RN; baccalaureate or masters (preferred)
Community, medical-surgical
Orientation; role-playing; supervisor mentors
1:90
Hospice of the Valley
RN; baccalaureate (preferred)
Cardiac, medical-surgical
One-week classroom orientation; worked with supervisor or experienced mentor for 2 to 6 weeks
1:40
Jewish Home and Hospital
RN; baccalaureate (required)
Masters-prepared social worker
Community, geriatric
Orientation 1:70
Medical Care Development
RN, nurse practitioner, or physician�s assistant
Cardiac, community Orientation; worked with experienced mentor
1:70
Mercy RN; baccalaureate or masters (required)
Specific experience not noted
Four-week orientation
1:50

EXHIBIT II.3 (continued)
29
Education
Types of Nursing Experience Requireda
Initial Program Training
Average Caseloadb
QMed RN or experienced licensed practical nurse
Specific experience not noted
Orientation 1:200
Quality Oncology RN Case management, community, oncology
Two-week orientation; close oversight by supervisor for 6 months
1:40
University of Maryland
Nurse practitioner Cardiac None noted 1:71
Washington Universityc
RN Chronic care Two-day orientation 1:50 for local 1:100 for telephone
aCommunity nursing includes home health, hospice, and public health nursing. bBased on program staffs� reports of actual average caseloads after about 2 years of operations. cThe Washington University program uses St. Louis-based nurses who can see patients in person if necessary and StatusOne telephone call center nurses. RN = registered nurse.
30
telephone call center-based care coordinators. The average caseloads of the local care
coordinators and the center-based care coordinators were 50 patients and
100 patients, respectively.
2. Assessment and Care Planning
All programs began care coordination with a comprehensive patient assessment�a review
of each new patient�s medical and health service use history, current health, medications, health
habits, functional status, and finances designed to identify the patient�s barriers to improved
health, and to determine his or her needs. Of the 15 programs, 10 conducted at least part of their
assessments in person despite the fact that most of their interventions were conducted largely by
telephone (Exhibit II.4). Nine programs expected to complete patient assessments within
2 weeks of enrollment, and four expected to complete them within 1 week. In fact, all but four
programs came within 1 week, on average, of meeting their goals for timely assessment (data not
shown). One program took more than 3 months, on average, to begin to assess patients. The
program�s staff reported that difficulty hiring care coordinators and scheduling assessment
appointments with patients led to the delay.
All the programs used information from the assessments to develop written patient care
plans that included patient goals, as well as care coordinator and patient activities required to
meet those goals (Exhibit II.4). Programs updated care plans when patients met their current
goals or experienced changes in health status or adverse events.
3. Monitoring
All 15 programs routinely monitored patients by telephone; a number also monitored them
in person and with home telemonitoring devices (Exhibit II.4). Planned minimum monitoring
frequency was difficult to categorize because, for some programs, it varied across patients (by

31
EXH
IBIT
II.4
KEY
FEA
TUR
ES O
F A
SSES
SMEN
T, C
AR
E PL
AN
NIN
G, A
ND
MO
NIT
OR
ING
A
sses
smen
t M
ode
Expe
cted
Wee
ks to
A
sses
smen
t W
ritte
n C
are
Plan
D
evel
oped
C
are
Plan
Upd
ate
Circ
umst
ance
s R
outin
e M
onito
ring
Mod
e
Expe
cted
M
onito
ring
Freq
uenc
ya Te
lem
onito
ring
Use
d (N
ame)
b
Ave
ra
In p
erso
n M
axim
um o
f 2
Yes
C
hang
e in
pat
ient
�s
stat
us; p
atie
nt m
et
goal
s
Tele
phon
e W
eekl
y fo
r firs
t 6
mon
ths;
twic
e m
onth
ly th
erea
fter
Yes
(Hom
Med
)
Car
le
Tele
phon
e pr
imar
ily
Max
imum
of 2
Y
es
Cha
nge
in p
atie
nt�s
st
atus
Te
leph
one
prim
arily
In
per
son
in c
linic
or
at h
ome
Wee
kly
to
quar
terly
by
tele
phon
e; in
pe
rson
as n
eces
sary
No
Cen
VaN
et
In p
erso
n M
axim
um o
f 2
Yes
C
hang
e in
pat
ient
�s
stat
us o
r eve
ry
6 m
onth
s
Tele
phon
e pr
imar
ily
In p
erso
n
At l
east
mon
thly
by
tele
phon
e; a
t lea
st
ever
y 6
mon
ths i
n pe
rson
Yes
(Hea
lth
Bud
dy)
Cha
rlest
own
Tele
phon
e pr
imar
ily
Max
imum
of 2
Y
es
Patie
nt m
et g
oals
Te
leph
one
prim
arily
In
per
son
at h
ome
or p
hysi
cian
vis
it
Dai
ly to
mon
thly
N
o
Cor
Solu
tions
In
per
son
and
tele
phon
ec Le
ss th
an 1
Y
es
Patie
nt m
et g
oals
Te
leph
one
Ever
y 2
wee
ks fo
r fir
st fe
w m
onth
s;
mon
thly
ther
eafte
r
No
Geo
rget
own
In p
erso
n M
axim
um o
f 2
Yes
A
fter a
dver
se e
vent
or
eve
ry 1
2 m
onth
s Te
leph
one
prim
arily
In
per
son
at h
ome
At l
east
mon
thly
Y
es (H
omM
ed)
Hea
lth Q
ualit
y Pa
rtner
s Te
leph
one
prim
arily
d
In p
erso
n at
hom
e fo
r hig
h-ris
k pa
tient
s
Max
imum
of 2
Y
es (e
xcep
t for
lo
wes
t-ris
k pa
tient
s)
At e
ach
cont
act
Tele
phon
e pr
imar
ily
In p
erso
n fo
r hig
h-
or m
oder
ate-
risk
patie
nts
At l
east
mon
thly
N
o
Hos
pice
of t
he
Val
ley
In p
erso
n M
axim
um o
f 1
Yes
C
hang
e in
pat
ient
�s
stat
us; p
atie
nt m
et
goal
s
Tele
phon
e an
d in
pe
rson
A
s nec
essa
ry
durin
g fir
st
6 m
onth
s; a
t lea
st
mon
thly
ther
eafte
r
No
Jew
ish
Hom
e an
d H
ospi
tal
In p
erso
n M
axim
um o
f 2
Yes
A
t car
e co
ordi
nato
r�s
disc
retio
ne
Tele
phon
e an
d in
pe
rson
A
t lea
st m
onth
ly
Yes
(Vite
rion)
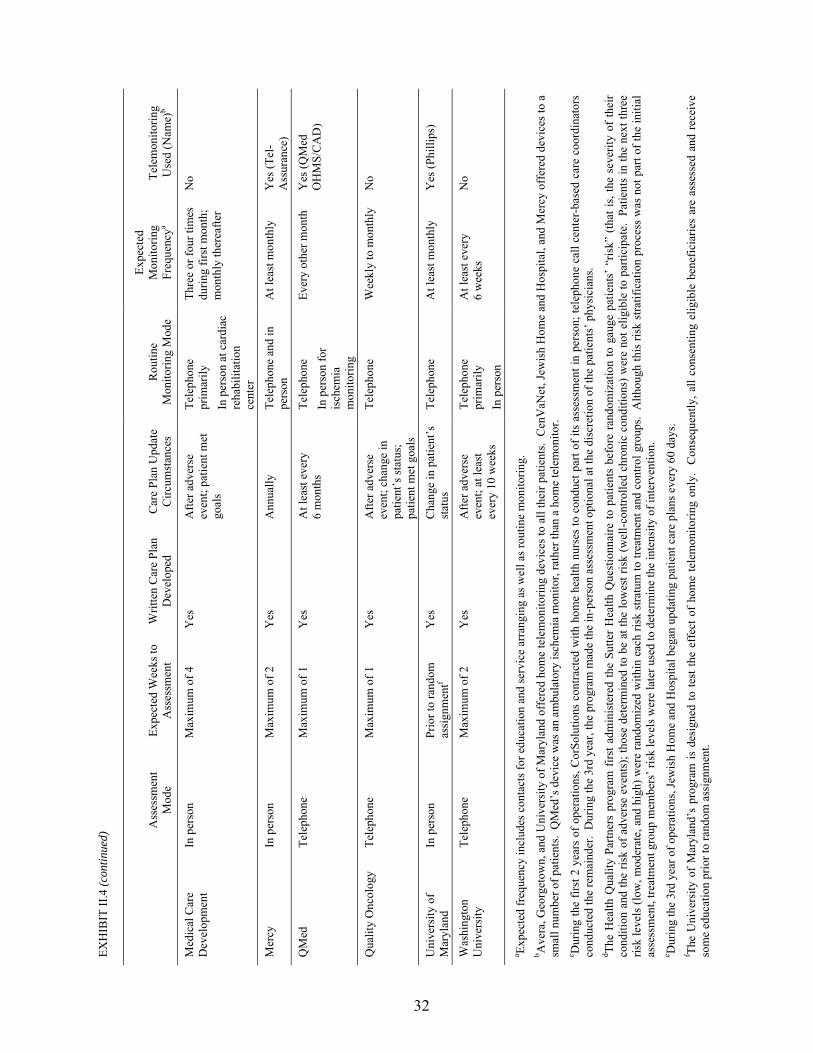
EXH
IBIT
II.4
(con
tinue
d)
32
A
sses
smen
t M
ode
Expe
cted
Wee
ks to
A
sses
smen
t W
ritte
n C
are
Plan
D
evel
oped
C
are
Plan
Upd
ate
Circ
umst
ance
s R
outin
e M
onito
ring
Mod
e
Expe
cted
M
onito
ring
Freq
uenc
ya Te
lem
onito
ring
Use
d (N
ame)
b
Med
ical
Car
e D
evel
opm
ent
In p
erso
n M
axim
um o
f 4
Yes
A
fter a
dver
se
even
t; pa
tient
met
go
als
Tele
phon
e pr
imar
ily
In p
erso
n at
car
diac
re
habi
litat
ion
cent
er
Thre
e or
four
tim
es
durin
g fir
st m
onth
; m
onth
ly th
erea
fter
No
Mer
cy
In p
erso
n M
axim
um o
f 2
Yes
A
nnua
lly
Tele
phon
e an
d in
pe
rson
A
t lea
st m
onth
ly
Yes
(Tel
-A
ssur
ance
)
QM
ed
Tele
phon
e M
axim
um o
f 1
Yes
A
t lea
st e
very
6
mon
ths
Tele
phon
e In
per
son
for
isch
emia
m
onito
ring
Ever
y ot
her m
onth
Y
es (Q
Med
O
HM
S/C
AD
)
Qua
lity
Onc
olog
y Te
leph
one
Max
imum
of 1
Y
es
Afte
r adv
erse
ev
ent;
chan
ge in
pa
tient
�s st
atus
; pa
tient
met
goa
ls
Tele
phon
e W
eekl
y to
mon
thly
N
o
Uni
vers
ity o
f M
aryl
and
In p
erso
n Pr
ior t
o ra
ndom
as
sign
men
tf Y
es
Cha
nge
in p
atie
nt�s
st
atus
Te
leph
one
At l
east
mon
thly
Y
es (P
hilli
ps)
Was
hing
ton
Uni
vers
ity
Tele
phon
e M
axim
um o
f 2
Yes
A
fter a
dver
se
even
t; at
leas
t ev
ery
10 w
eeks
Tele
phon
e pr
imar
ily
In p
erso
n
At l
east
eve
ry
6 w
eeks
N
o
a Expe
cted
freq
uenc
y in
clud
es c
onta
cts f
or e
duca
tion
and
serv
ice
arra
ngin
g as
wel
l as r
outin
e m
onito
ring.
b A
vera
, Geo
rget
own,
and
Uni
vers
ity o
f Mar
ylan
d of
fere
d ho
me
tele
mon
itorin
g de
vice
s to
all t
heir
patie
nts.
Cen
VaN
et, J
ewis
h H
ome
and
Hos
pita
l, an
d M
ercy
off
ered
dev
ices
to a
sm
all n
umbe
r of p
atie
nts.
QM
ed�s
dev
ice
was
an
ambu
lato
ry is
chem
ia m
onito
r, ra
ther
than
a h
ome
tele
mon
itor.
c Dur
ing
the
first
2 y
ears
of o
pera
tions
, Cor
Solu
tions
con
tract
ed w
ith h
ome
heal
th n
urse
s to
con
duct
par
t of i
ts a
sses
smen
t in
pers
on; t
elep
hone
cal
l cen
ter-
base
d ca
re c
oord
inat
ors
cond
ucte
d th
e re
mai
nder
. D
urin
g th
e 3r
d ye
ar, t
he p
rogr
am m
ade
the
in-p
erso
n as
sess
men
t opt
iona
l at t
he d
iscr
etio
n of
the
patie
nts�
phy
sici
ans.
d The
Hea
lth Q
ualit
y Pa
rtner
s pr
ogra
m f
irst a
dmin
iste
red
the
Sutte
r H
ealth
Que
stio
nnai
re to
pat
ient
s be
fore
ran
dom
izat
ion
to g
auge
pat
ient
s� �
risk�
(th
at is
, the
sev
erity
of
thei
r co
nditi
on a
nd th
e ris
k of
adv
erse
eve
nts)
; tho
se d
eter
min
ed to
be
at th
e lo
wes
t ris
k (w
ell-c
ontro
lled
chro
nic
cond
ition
s) w
ere
not e
ligib
le to
par
ticip
ate.
Pat
ient
s in
the
next
thre
e ris
k le
vels
(low
, mod
erat
e, a
nd h
igh)
wer
e ra
ndom
ized
with
in e
ach
risk
stra
tum
to tr
eatm
ent a
nd c
ontro
l gro
ups.
Alth
ough
this
risk
stra
tific
atio
n pr
oces
s w
as n
ot p
art o
f the
initi
al
asse
ssm
ent,
treat
men
t gro
up m
embe
rs� r
isk
leve
ls w
ere
late
r use
d to
det
erm
ine
the
inte
nsity
of i
nter
vent
ion.
e D
urin
g th
e 3r
d ye
ar o
f ope
ratio
ns, J
ewis
h H
ome
and
Hos
pita
l beg
an u
pdat
ing
patie
nt c
are
plan
s eve
ry 6
0 da
ys.
f The
Uni
vers
ity o
f M
aryl
and�
s pr
ogra
m is
des
igne
d to
test
the
effe
ct o
f ho
me
tele
mon
itorin
g on
ly.
Con
sequ
ently
, all
cons
entin
g el
igib
le b
enef
icia
ries
are
asse
ssed
and
rec
eive
so
me
educ
atio
n pr
ior t
o ra
ndom
ass
ignm
ent.

33
formally or informally assessed level of patient risk) or over time (for example, frequently for an
initial period and at least monthly thereafter). However, only two programs did not require at
least monthly monitoring. Routine monitoring included discussion of symptoms and other health
issues and the provision of emotional support. In 11 of the 15 programs, almost all patients
enrolling during the first year of operations (98 percent or more) had at least one contact for
routine monitoring during the first year after enrollment (Table II.2). (Some patients had no
monitoring contacts because they died or disenrolled shortly after enrollment.) Programs varied
widely as to whether their care coordinators provided emotional support to patients. Seven
programs recorded providing emotional support to roughly three-fourths or more of their
patients, whereas five recorded providing it to fewer than one-third of their patients.
Six programs provided patients with home telemonitoring devices that transmitted weights,
other clinical indicators, and responses to patients� questions about symptoms to their care
coordinators each day (Exhibit II.4).4 Three of those programs offered the devices to all their
patients. Between 88 and 97 percent of the three programs� patients had contacts with care
coordinators to discuss abnormal results (out-of-range telemonitor readings or laboratory
results). The three other programs used the devices on a more limited basis, either for only a few
patients or for a short trial period.
4 Another program (Mercy) provided telemonitoring through a computerized system that automatically dialed
patients at specified intervals and asked pre-recorded questions to which patients responded by pressing numbers on their telephone keypads. This system did not require patients to have any devices at home.
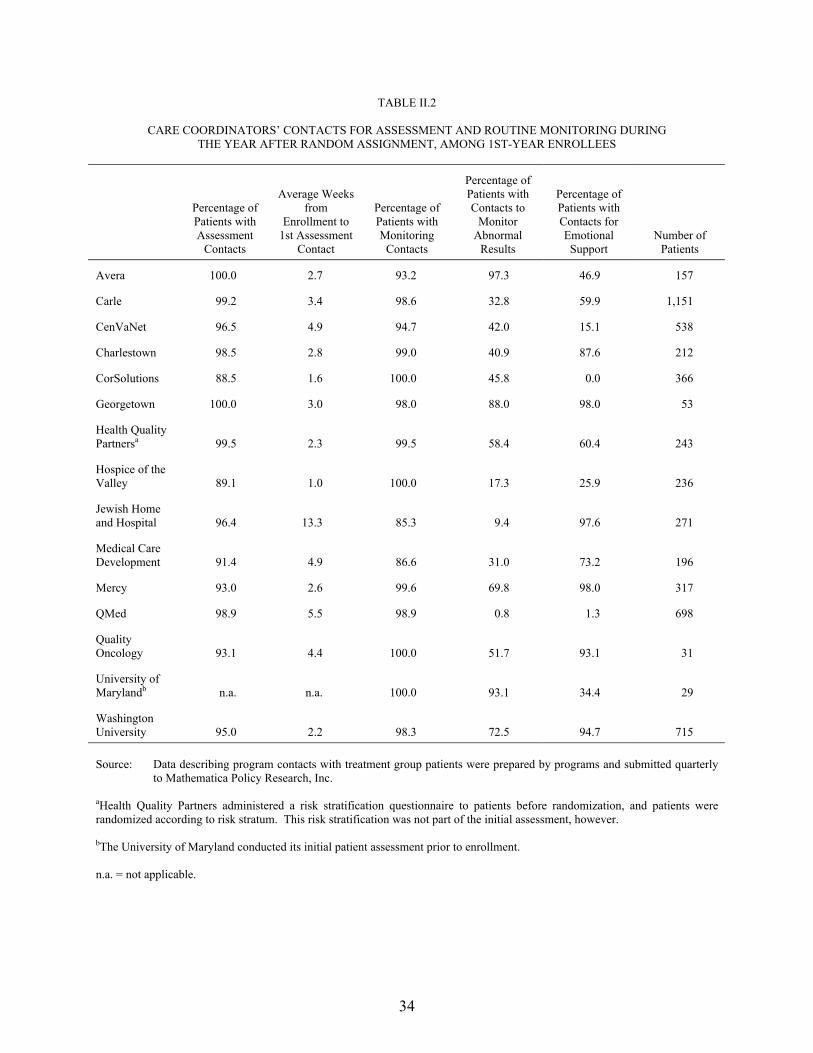
34
TABLE II.2
CARE COORDINATORS� CONTACTS FOR ASSESSMENT AND ROUTINE MONITORING DURING THE YEAR AFTER RANDOM ASSIGNMENT, AMONG 1ST-YEAR ENROLLEES
Percentage of Patients with Assessment
Contacts
Average Weeks from
Enrollment to 1st Assessment
Contact
Percentage of Patients with Monitoring
Contacts
Percentage of Patients with Contacts to
Monitor Abnormal
Results
Percentage of Patients with Contacts for Emotional Support
Number of Patients
Avera 100.0 2.7 93.2 97.3 46.9 157
Carle 99.2 3.4 98.6 32.8 59.9 1,151
CenVaNet 96.5 4.9 94.7 42.0 15.1 538
Charlestown 98.5 2.8 99.0 40.9 87.6 212
CorSolutions 88.5 1.6 100.0 45.8 0.0 366
Georgetown 100.0 3.0 98.0 88.0 98.0 53
Health Quality Partnersa 99.5 2.3 99.5 58.4 60.4 243
Hospice of the Valley 89.1 1.0 100.0 17.3 25.9 236
Jewish Home and Hospital 96.4 13.3 85.3 9.4 97.6 271
Medical Care Development 91.4 4.9 86.6 31.0 73.2 196
Mercy 93.0 2.6 99.6 69.8 98.0 317
QMed 98.9 5.5 98.9 0.8 1.3 698
Quality Oncology 93.1 4.4 100.0 51.7 93.1 31
University of Marylandb n.a. n.a. 100.0 93.1 34.4 29
Washington University 95.0 2.2 98.3 72.5 94.7 715 Source: Data describing program contacts with treatment group patients were prepared by programs and submitted quarterly
to Mathematica Policy Research, Inc. aHealth Quality Partners administered a risk stratification questionnaire to patients before randomization, and patients were randomized according to risk stratum. This risk stratification was not part of the initial assessment, however. bThe University of Maryland conducted its initial patient assessment prior to enrollment. n.a. = not applicable.

35
4. Patient Education
All but one of the programs used patient education as the cornerstone of their approach to
improving patients� health5 (Exhibit II.5). Among the 14 programs that did include patient
education, care coordinators were the staff primarily responsible for providing that service. Ten
programs supplemented education by referring patients to community-based education programs,
including workshops held at local hospitals, many of which were led by specialized staff, such as
diabetes educators, pharmacists, or nutritionists.
As RNs, most of the care coordinators had received basic education that included instruction
on how to provide patient education. In addition, many care coordinators had experience as
community nurses, whose practice emphasizes patient education. Despite this background, nine
programs provided additional training to incoming care coordinators on how to educate patients,
which varied substantially in intensity and type of training. Five of the nine programs included
patient education training as a part of their regular orientation for all new care coordinators.
Four programs provided more-focused training on communication techniques,
lifestyle/behavioral change, or learning theory.
All but 1 of the 14 programs that provided patient education used a standard curriculum
based on nationally published guidelines. The curricula and educational materials were part of
the electronic care coordination databases of five of the programs, which then guided care
coordinators� educational contacts with patients. Six programs assessed patients individually on
their need for education and learning barriers (such as low literacy or cognitive limitation) and
then customized their educational interventions based on acuity, cognitive ability, or readiness to
5 The 15th program differed markedly from the others in that its goal was to test home telemonitoring as a
means of improving the health of patients with CHF. Thus, it neither provided education or coordination nor referred patients for support services.
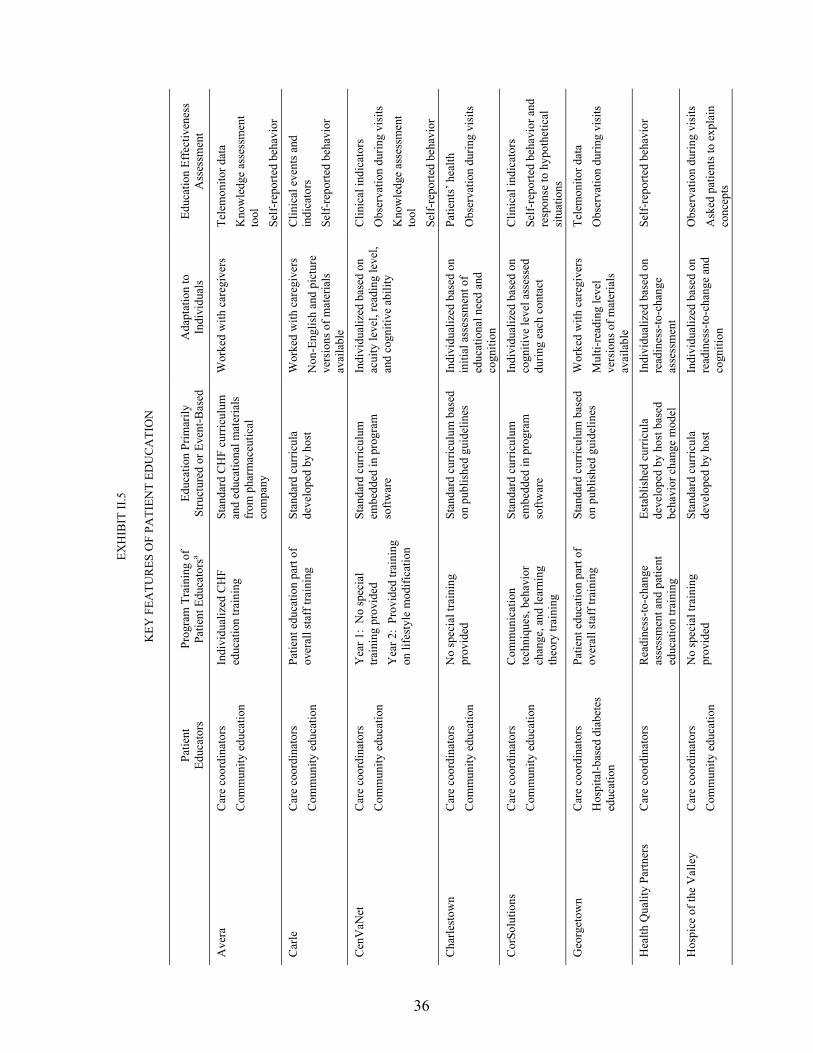
36
EXH
IBIT
II.5
KEY
FEA
TUR
ES O
F PA
TIEN
T ED
UC
ATI
ON
Pa
tient
Ed
ucat
ors
Prog
ram
Tra
inin
g of
Pa
tient
Edu
cato
rsa
Educ
atio
n Pr
imar
ily
Stru
ctur
ed o
r Eve
nt-B
ased
A
dapt
atio
n to
In
divi
dual
s Ed
ucat
ion
Effe
ctiv
enes
s A
sses
smen
t
Ave
ra
Car
e co
ordi
nato
rs
Com
mun
ity e
duca
tion
Indi
vidu
aliz
ed C
HF
educ
atio
n tra
inin
g St
anda
rd C
HF
curr
icul
um
and
educ
atio
nal m
ater
ials
fr
om p
harm
aceu
tical
co
mpa
ny
Wor
ked
with
car
egiv
ers
Tele
mon
itor d
ata
Kno
wle
dge
asse
ssm
ent
tool
Se
lf-re
porte
d be
havi
or
Car
le
Car
e co
ordi
nato
rs
Com
mun
ity e
duca
tion
Patie
nt e
duca
tion
part
of
over
all s
taff
trai
ning
St
anda
rd c
urric
ula
deve
lope
d by
hos
t W
orke
d w
ith c
areg
iver
s N
on-E
nglis
h an
d pi
ctur
e ve
rsio
ns o
f mat
eria
ls
avai
labl
e
Clin
ical
eve
nts a
nd
indi
cato
rs
Self-
repo
rted
beha
vior
Cen
VaN
et
Car
e co
ordi
nato
rs
Com
mun
ity e
duca
tion
Yea
r 1:
No
spec
ial
train
ing
prov
ided
Y
ear 2
: Pr
ovid
ed tr
aini
ng
on li
fest
yle
mod
ifica
tion
Stan
dard
cur
ricul
um
embe
dded
in p
rogr
am
softw
are
Indi
vidu
aliz
ed b
ased
on
acui
ty le
vel,
read
ing
leve
l, an
d co
gniti
ve a
bilit
y
Clin
ical
indi
cato
rs
Obs
erva
tion
durin
g vi
sits
K
now
ledg
e as
sess
men
t to
ol
Self-
repo
rted
beha
vior
Cha
rlest
own
Car
e co
ordi
nato
rs
Com
mun
ity e
duca
tion
No
spec
ial t
rain
ing
prov
ided
St
anda
rd c
urric
ulum
bas
ed
on p
ublis
hed
guid
elin
es
Indi
vidu
aliz
ed b
ased
on
initi
al a
sses
smen
t of
educ
atio
nal n
eed
and
cogn
ition
Patie
nts�
hea
lth
Obs
erva
tion
durin
g vi
sits
Cor
Solu
tions
C
are
coor
dina
tors
C
omm
unity
edu
catio
n C
omm
unic
atio
n te
chni
ques
, beh
avio
r ch
ange
, and
lear
ning
th
eory
trai
ning
Stan
dard
cur
ricul
um
embe
dded
in p
rogr
am
softw
are
Indi
vidu
aliz
ed b
ased
on
cogn
itive
leve
l ass
esse
d du
ring
each
con
tact
Clin
ical
indi
cato
rs
Self-
repo
rted
beha
vior
and
re
spon
se to
hyp
othe
tical
si
tuat
ions
Geo
rget
own
Car
e co
ordi
nato
rs
Hos
pita
l-bas
ed d
iabe
tes
educ
atio
n
Patie
nt e
duca
tion
part
of
over
all s
taff
trai
ning
St
anda
rd c
urric
ulum
bas
ed
on p
ublis
hed
guid
elin
es
Wor
ked
with
car
egiv
ers
Mul
ti-re
adin
g le
vel
vers
ions
of m
ater
ials
av
aila
ble
Tele
mon
itor d
ata
Obs
erva
tion
durin
g vi
sits
Hea
lth Q
ualit
y Pa
rtner
s C
are
coor
dina
tors
R
eadi
ness
-to-c
hang
e as
sess
men
t and
pat
ient
ed
ucat
ion
train
ing
Esta
blis
hed
curr
icul
a de
velo
ped
by h
ost b
ased
be
havi
or c
hang
e m
odel
Indi
vidu
aliz
ed b
ased
on
read
ines
s-to
-cha
nge
asse
ssm
ent
Self-
repo
rted
beha
vior
Hos
pice
of t
he V
alle
y C
are
coor
dina
tors
C
omm
unity
edu
catio
n N
o sp
ecia
l tra
inin
g pr
ovid
ed
Stan
dard
cur
ricul
a de
velo
ped
by h
ost
Indi
vidu
aliz
ed b
ased
on
read
ines
s-to
-cha
nge
and
cogn
ition
Obs
erva
tion
durin
g vi
sits
A
sked
pat
ient
s to
expl
ain
conc
epts
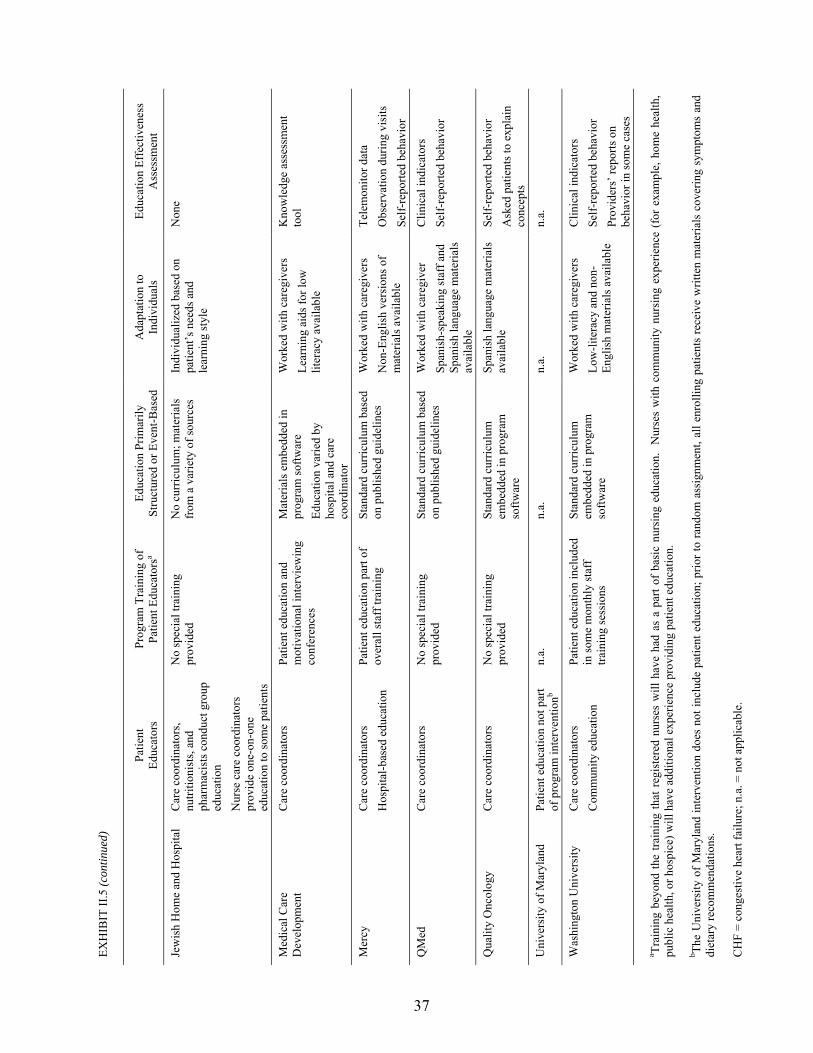
EXH
IBIT
II.5
(con
tinue
d)
37
Pa
tient
Ed
ucat
ors
Prog
ram
Tra
inin
g of
Pa
tient
Edu
cato
rsa
Educ
atio
n Pr
imar
ily
Stru
ctur
ed o
r Eve
nt-B
ased
A
dapt
atio
n to
In
divi
dual
s Ed
ucat
ion
Effe
ctiv
enes
s A
sses
smen
t
Jew
ish
Hom
e an
d H
ospi
tal
Car
e co
ordi
nato
rs,
nutri
tioni
sts,
and
phar
mac
ists
con
duct
gro
up
educ
atio
n N
urse
car
e co
ordi
nato
rs
prov
ide
one-
on-o
ne
educ
atio
n to
som
e pa
tient
s
No
spec
ial t
rain
ing
prov
ided
N
o cu
rric
ulum
; mat
eria
ls
from
a v
arie
ty o
f sou
rces
In
divi
dual
ized
bas
ed o
n pa
tient
�s n
eeds
and
le
arni
ng st
yle
Non
e
Med
ical
Car
e D
evel
opm
ent
Car
e co
ordi
nato
rs
Patie
nt e
duca
tion
and
mot
ivat
iona
l int
ervi
ewin
g co
nfer
ence
s
Mat
eria
ls e
mbe
dded
in
prog
ram
softw
are
Educ
atio
n va
ried
by
hosp
ital a
nd c
are
coor
dina
tor
Wor
ked
with
car
egiv
ers
Lear
ning
aid
s for
low
lit
erac
y av
aila
ble
Kno
wle
dge
asse
ssm
ent
tool
Mer
cy
Car
e co
ordi
nato
rs
Hos
pita
l-bas
ed e
duca
tion
Patie
nt e
duca
tion
part
of
over
all s
taff
trai
ning
St
anda
rd c
urric
ulum
bas
ed
on p
ublis
hed
guid
elin
es
Wor
ked
with
car
egiv
ers
Non
-Eng
lish
vers
ions
of
mat
eria
ls a
vaila
ble
Tele
mon
itor d
ata
Obs
erva
tion
durin
g vi
sits
Se
lf-re
porte
d be
havi
or
QM
ed
Car
e co
ordi
nato
rs
No
spec
ial t
rain
ing
prov
ided
St
anda
rd c
urric
ulum
bas
ed
on p
ublis
hed
guid
elin
es
Wor
ked
with
car
egiv
er
Span
ish-
spea
king
staf
f and
Sp
anis
h la
ngua
ge m
ater
ials
av
aila
ble
Clin
ical
indi
cato
rs
Self-
repo
rted
beha
vior
Qua
lity
Onc
olog
y C
are
coor
dina
tors
N
o sp
ecia
l tra
inin
g pr
ovid
ed
Stan
dard
cur
ricul
um
embe
dded
in p
rogr
am
softw
are
Span
ish
lang
uage
mat
eria
ls
avai
labl
e Se
lf-re
porte
d be
havi
or
Ask
ed p
atie
nts t
o ex
plai
n co
ncep
ts
Uni
vers
ity o
f Mar
ylan
d Pa
tient
edu
catio
n no
t par
t of
pro
gram
inte
rven
tionb
n.a.
n.
a.
n.a.
n.
a.
Was
hing
ton
Uni
vers
ity
Car
e co
ordi
nato
rs
Com
mun
ity e
duca
tion
Patie
nt e
duca
tion
incl
uded
in
som
e m
onth
ly st
aff
train
ing
sess
ions
Stan
dard
cur
ricul
um
embe
dded
in p
rogr
am
softw
are
Wor
ked
with
car
egiv
ers
Low
-lite
racy
and
non
-En
glis
h m
ater
ials
ava
ilabl
e
Clin
ical
indi
cato
rs
Self-
repo
rted
beha
vior
Pr
ovid
ers�
repo
rts o
n be
havi
or in
som
e ca
ses
a Trai
ning
bey
ond
the
train
ing
that
reg
iste
red
nurs
es w
ill h
ave
had
as a
par
t of
basi
c nu
rsin
g ed
ucat
ion.
N
urse
s w
ith c
omm
unity
nur
sing
exp
erie
nce
(for
exa
mpl
e, h
ome
heal
th,
publ
ic h
ealth
, or h
ospi
ce) w
ill h
ave
addi
tiona
l exp
erie
nce
prov
idin
g pa
tient
edu
catio
n.
b The
Uni
vers
ity o
f Mar
ylan
d in
terv
entio
n do
es n
ot in
clud
e pa
tient
edu
catio
n; p
rior t
o ra
ndom
ass
ignm
ent,
all e
nrol
ling
patie
nts
rece
ive
writ
ten
mat
eria
ls c
over
ing
sym
ptom
s an
d di
etar
y re
com
men
datio
ns.
CH
F =
cong
estiv
e he
art f
ailu
re; n
.a. =
not
app
licab
le.

38
change. Seven included caregivers in their education interventions if care coordinators were
having difficulty educating patients directly.
All but one of the programs providing education had developed processes for assessing the
effectiveness of the education. Eight programs reviewed clinical indicators or home
telemonitoring data in order to determine whether the health of their patients was improving�
the ultimate goal of patient education. The six others relied on patients� self-reports of behavior
change (such as improvement in diet or medication adherence), direct observation of patients
during care coordinators� visits, or the administration of a knowledge assessment tool.
Almost all the patients at the 14 programs providing education who enrolled during the first
year of operations (85 percent or more) had a contact for education during the first year after
random assignment (Table II.3). Care coordinators also explained tests, procedures, and
medications to patients. Care coordinators for all but one program explained medications to at
least one-half their patients during the patients� first year in the program; the care coordinators of
eight of those programs explained medications to at least 80 percent of the patients. Care
coordinators for nine programs explained tests or procedures to at least one-half their patients
during the first year.
5. Communication and Care Coordination
Patients in a fee-for-service environment often receive care that is poorly coordinated across
providers and settings. Of the 15 programs in the demonstration, 14 considered an important
aspect of their interventions to be improving communication and coordination between providers
and patients, either by teaching patients to do this themselves, or by doing it for them
(Exhibit II.6). Twelve of the 14 programs taught patients how to manage their conditions
themselves, and how to communicate more effectively with their physicians. They used a
variety of techniques, including encouraging patients to take lists of questions to physician
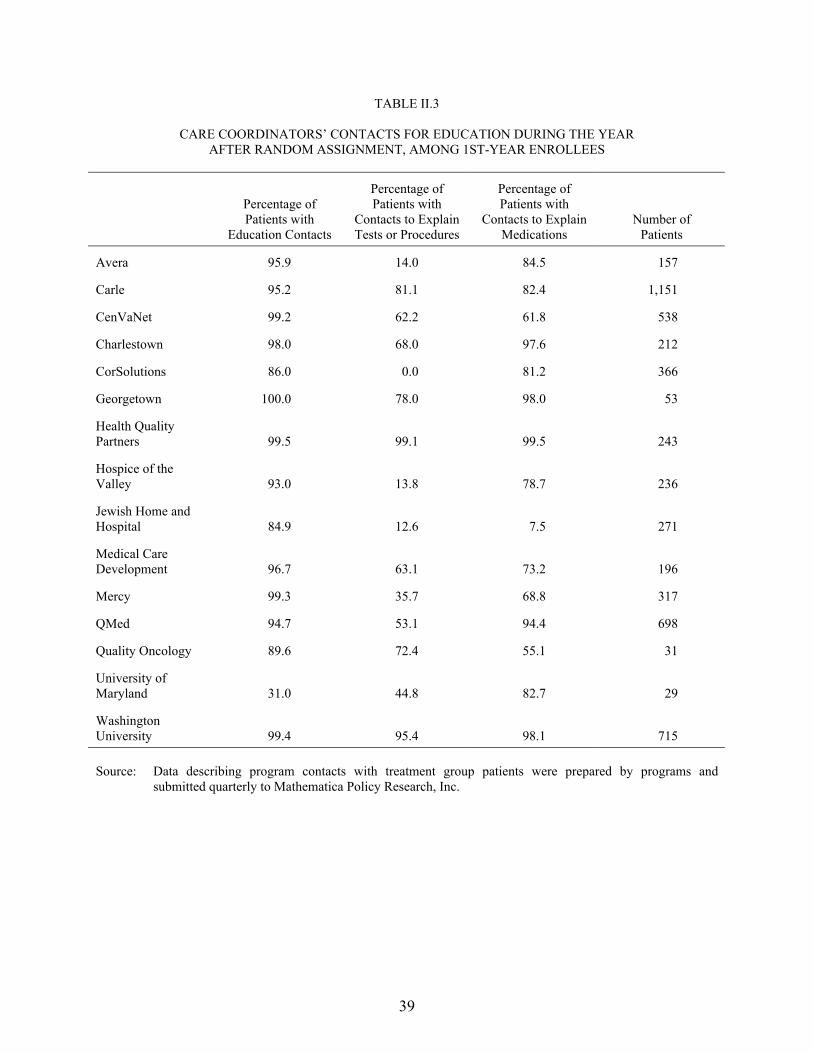
39
TABLE II.3
CARE COORDINATORS� CONTACTS FOR EDUCATION DURING THE YEAR AFTER RANDOM ASSIGNMENT, AMONG 1ST-YEAR ENROLLEES
Percentage of Patients with
Education Contacts
Percentage of Patients with
Contacts to Explain Tests or Procedures
Percentage of Patients with
Contacts to Explain Medications
Number of Patients
Avera 95.9 14.0 84.5 157
Carle 95.2 81.1 82.4 1,151
CenVaNet 99.2 62.2 61.8 538
Charlestown 98.0 68.0 97.6 212
CorSolutions 86.0 0.0 81.2 366
Georgetown 100.0 78.0 98.0 53
Health Quality Partners 99.5 99.1 99.5 243
Hospice of the Valley 93.0 13.8 78.7 236
Jewish Home and Hospital 84.9 12.6 7.5 271
Medical Care Development 96.7 63.1 73.2 196
Mercy 99.3 35.7 68.8 317
QMed 94.7 53.1 94.4 698
Quality Oncology 89.6 72.4 55.1 31
University of Maryland 31.0 44.8 82.7 29
Washington University 99.4 95.4 98.1 715 Source: Data describing program contacts with treatment group patients were prepared by programs and
submitted quarterly to Mathematica Policy Research, Inc.
40
EXH
IBIT
II.6
KEY
FEA
TUR
ES O
F EF
FOR
TS T
O IM
PRO
VE
CO
MM
UN
ICA
TIO
N A
ND
CO
OR
DIN
ATI
ON
Ta
ught
Pat
ient
s or
Coo
rdin
ates
for
Patie
nts
Had
Reg
ular
For
mal
C
omm
unic
atio
ns w
ith
Phys
icia
ns
Had
Info
rmal
C
omm
unic
atio
ns w
ith
Phys
icia
ns
Prov
ided
Co-
Loca
tion
and/
or C
asel
oad
Allo
catio
na
Had
Rol
e in
Ens
urin
g A
dher
ence
to
Trea
tmen
t Gui
delin
es
Proc
ess f
or L
earn
ing
Abo
ut A
dver
se E
vent
s
Ave
ra
Prim
arily
taug
ht
patie
nts
Prog
ram
tele
mon
itor
trend
repo
rts
Tele
phon
e, fa
x as
ne
cess
ary
Nei
ther
Ph
ysic
ian
rem
inde
d ab
out p
reve
ntiv
e ca
re
Phys
icia
n se
nt p
atie
nt
med
icat
ion
inve
ntor
y
Mis
sing
tele
mon
itor
read
ings
Car
le
Prim
arily
taug
ht
patie
nts
Con
fere
nces
bet
wee
n ca
re c
oord
inat
or a
nd
phys
icia
n at
leas
t an
nual
ly, s
omet
imes
in
clud
ed p
atie
nt
Reg
ular
in-p
erso
n co
ntac
t, te
leph
one
B
oth
Phys
icia
n no
tifie
d if
devi
ated
from
gu
idel
ines
Car
e co
ordi
nato
rs a
ble
to o
rder
test
s
Emai
l ale
rts
conc
erni
ng a
ll pa
tient
en
coun
ters
in C
arle
sy
stem
Cen
VaN
et
Prim
arily
taug
ht
patie
nts
Prog
ram
car
e pl
ans
Upd
ates
on
patie
nts�
pr
ogre
ss a
t lea
st
annu
ally
Tele
phon
e fo
r urg
ent
patie
nt p
robl
ems
Nei
ther
Pa
tient
s rec
eive
d st
anda
rd-o
f-ca
re c
ards
to
ena
ble
them
to
rem
ind
phys
icia
ns
abou
t nec
essa
ry c
are
Patie
nts�
/car
egiv
ers�
se
lf-re
ports
Cha
rlest
own
Prim
arily
coo
rdin
ated
fo
r pat
ient
s Pr
ogra
m c
are
plan
s R
egul
ar in
-per
son
cont
act,
emai
l C
o-lo
catio
n: y
es
Cas
eloa
d al
loca
tion:
no
Dis
cuss
ed o
n a
patie
nt-b
y-pa
tient
ba
sis
A v
arie
ty o
f hos
t co
mm
unity
-gen
erat
ed
repo
rts
Patie
nts�
self-
repo
rts
Cor
Solu
tions
Pr
imar
ily ta
ught
pa
tient
s Pa
tient
sum
mar
ies
ever
y 90
day
s Te
leph
one
for u
rgen
t pa
tient
pro
blem
s C
o-lo
catio
n: n
o
Cas
eloa
d al
loca
tion:
ye
s
Patie
nt su
mm
ary
high
light
ed d
evia
tions
fr
om g
uide
lines
Patie
nts�
self-
repo
rts
Geo
rget
own
Prim
arily
taug
ht
patie
nts
Prog
ram
tele
mon
itor
trend
repo
rts
Tele
phon
e fo
r urg
ent
patie
nt p
robl
ems
Nei
ther
M
ultid
isci
plin
ary
team
re
view
ed c
ases
and
m
akes
trea
tmen
t su
gges
tions
Mis
sing
tele
mon
itor
read
ings
EXH
IBIT
II.6
(con
tinue
d)
41
Ta
ught
Pat
ient
s or
Coo
rdin
ates
for
Patie
nts
Had
Reg
ular
For
mal
C
omm
unic
atio
ns w
ith
Phys
icia
ns
Had
Info
rmal
C
omm
unic
atio
ns w
ith
Phys
icia
ns
Prov
ided
Co-
Loca
tion
and/
or C
asel
oad
Allo
catio
na
Had
Rol
e in
Ens
urin
g A
dher
ence
to
Trea
tmen
t Gui
delin
es
Proc
ess f
or L
earn
ing
Abo
ut A
dver
se E
vent
s
Hea
lth Q
ualit
y Pa
rtner
s Pr
imar
ily ta
ught
pa
tient
s In
itial
ass
essm
ent
Enco
unte
r rep
ort a
fter
each
pat
ient
con
tact
Occ
asio
nal i
n-pe
rson
co
ntac
t, te
leph
one
Bot
h In
itial
ass
essm
ent
incl
uded
re
com
men
datio
ns fo
r ca
re
Dis
cuss
ed o
n a
patie
nt-b
y-pa
tient
ba
sis
Patie
nts�
/car
egiv
ers�
se
lf-re
ports
Yea
r 2:
bega
n re
view
ing
hosp
ital
adm
issi
ons d
ata
Hos
pice
of t
he V
alle
y Pr
imar
ily ta
ught
pa
tient
s Pa
tient
sum
mar
ies
ever
y 6
mon
ths
Patie
nt o
ffic
e vi
sits
, te
leph
one
Co-
loca
tion:
no
Cas
eloa
d al
loca
tion:
ye
s
Dis
cuss
on
a pa
tient
-by
-pat
ient
bas
is
Patie
nts�
self-
repo
rts
Jew
ish
Hom
e an
d H
ospi
tal
Prim
arily
coo
rdin
ated
fo
r pat
ient
s Y
ear 1
: qu
arte
rly
upda
tes s
ent t
o so
me
phys
icia
ns
Yea
r 2:
upda
tes s
ent
to a
ll ph
ysic
ians
as
nece
ssar
y
Tele
phon
e, e
mai
l for
ur
gent
pat
ient
pr
oble
ms
Nei
ther
N
one
One
par
ticip
atin
g ho
spita
l not
ified
pr
ogra
m
Patie
nts�
self-
repo
rts
for t
hose
refe
rred
from
ot
her h
ospi
tals
Med
ical
Car
e D
evel
opm
ent
Prim
arily
taug
ht
patie
nts
Patie
nt su
mm
arie
s pe
riodi
cally
In
per
son
durin
g ho
spita
l rou
nds
Bot
h Pa
tient
s rec
eive
d he
alth
che
cklis
ts to
en
able
them
to re
min
d ph
ysic
ians
abo
ut
nece
ssar
y ca
re
Dai
ly re
view
s of
hosp
ital i
npat
ient
and
em
erge
ncy
room
list
s
Patie
nts�
self-
repo
rts
Mer
cy
Prim
arily
taug
ht
patie
nts
Patie
nts�
cha
nge-
of-
stat
us re
ports
Te
leph
one
prim
arily
, in
per
son
for c
linic
-ba
sed
care
co
ordi
nato
rs
Bot
h Pa
tient
s tau
ght t
o re
min
d ph
ysic
ians
ab
out n
eces
sary
car
e
Rev
iew
s of h
ospi
tal
emer
genc
y ro
om li
sts
Patie
nts�
self-
repo
rts
QM
ed
Prim
arily
taug
ht
patie
nts
Rep
orts
with
isch
emia
m
onito
ring
resu
lts
ever
y 6
mon
ths
Prog
ram
qua
lity
man
ager
vis
ited
phys
icia
n pr
actic
es
Tele
phon
e fo
r urg
ent
patie
nt p
robl
ems
Nei
ther
Is
chem
ia m
onito
ring
repo
rt co
mpa
res
clin
ical
out
com
es w
ith
treat
men
t gui
delin
es
and
note
s dev
iatio
ns
Patie
nts�
self-
repo
rts
Phys
icia
ns� c
hart
revi
ews

EXH
IBIT
II.6
(con
tinue
d)
42
Ta
ught
Pat
ient
s or
Coo
rdin
ates
for
Patie
nts
Had
Reg
ular
For
mal
C
omm
unic
atio
ns w
ith
Phys
icia
ns
Had
Info
rmal
C
omm
unic
atio
ns w
ith
Phys
icia
ns
Prov
ided
Co-
Loca
tion
and/
or C
asel
oad
Allo
catio
na
Had
Rol
e in
Ens
urin
g A
dher
ence
to
Trea
tmen
t Gui
delin
es
Proc
ess f
or L
earn
ing
Abo
ut A
dver
se E
vent
s
Qua
lity
Onc
olog
y Pr
imar
ily ta
ught
pa
tient
s N
one
Tele
phon
e, fa
x fo
r pa
tient
pro
blem
s N
eith
er
Dis
cuss
ed o
n a
patie
nt-b
y-pa
tient
ba
sis
Patie
nts�
/car
egiv
ers�
se
lf-re
ports
Uni
vers
ity o
f M
aryl
and
Coo
rdin
atin
g ca
re n
ot
part
of p
rogr
am
inte
rven
tion
Non
e Te
leph
one,
em
ail f
or
urge
nt p
atie
nt
prob
lem
s
Co-
loca
tion:
no
Cas
eloa
d al
loca
tion:
ye
s
Non
e M
issi
ng te
lem
onito
r re
adin
gs
Was
hing
ton
Uni
vers
ity
Prim
arily
taug
ht
patie
nts
Non
e W
ritte
n up
date
s for
pa
tient
s abo
ut w
hom
ca
re c
oord
inat
ors w
ere
conc
erne
d
Tele
phon
e, fa
x fo
r ur
gent
pat
ient
pr
oble
ms
Nei
ther
D
iscu
ssed
on
a pa
tient
-by-
patie
nt
basi
s
Prog
ram
softw
are
prov
ided
rem
inde
rs
abou
t rec
omm
ende
d ca
re
Parti
cipa
ting
hosp
ital
notif
ied
prog
ram
Patie
nts�
/car
egiv
ers�
se
lf-re
ports
a Car
e co
ordi
nato
rs w
orke
d in
the
sam
e lo
catio
n as
pat
ient
s ph
ysic
ians
; pat
ient
s w
ere
assi
gned
to c
are
coor
dina
tors
suc
h th
at a
ll of
a p
hysi
cian
�s p
atie
nts
wer
e as
sign
ed to
just
one
ca
re c
oord
inat
or.

43
appointments, providing patients with clinical guidelines or schedules of tests that they should be
receiving regularly, and educating patients to make more-informed decisions about treatment
options. The remaining 2 of the 14 programs sought to improve coordination by having care
coordinators do so on behalf of patients.
Most of the programs (12 of the 15) directly communicated with physicians either through
regular written reports or, less frequently, through regular face-to-face meetings. Ten of the
12 sent to the physicians the patients� care plans, home telemonitor trend reports, or patients�
health status summaries. One program held formal conferences with participating physicians.
One had its quality manager visit physicians to discuss adherence to evidence-based practice
guidelines in the context of patients� home monitoring data trends. Finally, all of the programs
contacted physicians via telephone, fax, or email to discuss urgent patient problems. Care
coordinators for six programs also had the opportunity for informal, in-person contacts
with physicians.
The ease with which care coordinators were able to communicate with physicians also
depended on whether the care coordinators and physicians were physically located in the same
place (co-location), as well as on whether care coordinators were assigned to monitor all the
patients of particular physicians (caseload allocation). An organizational link between program
hosts and physicians facilitated placing care coordinators in or near physicians� offices. Care
coordinators for five programs worked in the same physical location as their patients� physicians
all or some of the time; of these, only one program had no organizational link to the physicians.
Most of the programs (13 of 15) viewed assisting physicians in adhering to evidence-based
treatment guidelines as a part of their approach to improving patients� health, although they did
so in different ways. Five programs either had care coordinators remind physicians about
necessary tests or suggested treatment changes that they sent to the physicians. Three programs
44
prompted patients to remind physicians about necessary care. The other five had care
coordinators diplomatically discuss deviations from guidelines with physicians on a patient-by-
patient basis.
An important shortcoming of fee-for-service care is that, when adverse events befall patients
(for example, unplanned hospital admissions or ER visits), no single provider takes responsibility
for determining the cause of the event and for developing strategies for avoiding its repetition.
The demonstration programs established a variety of processes to learn about and address
adverse events. Programs that provided patients with home telemonitors received the timeliest
notification of adverse events. The failure of a patient to transmit a daily reading from his or her
device signaled the care coordinator to call the patient or the patient�s emergency contact; during
the call, the care coordinator would have been able to determine whether the patient had been to
the hospital. Eight programs received notifications of patient admissions from participating
hospitals or providers or reviewed hospital admissions logs. Four programs relied solely on
patients� or caregivers� reports of adverse events, but any program that did not contact patients
frequently might not receive the reports until weeks after the events had occurred.
6. Service and Resource Arranging
Programs also sought to improve patients� health by increasing the patients� access to
support services that are not covered by Medicare (such as home care; transportation; certain
equipment and supplies; and disease-specific, diet, or smoking-cessation support groups).
Although none of the programs considered improving access to such non-Medicare covered
support services a primary focus of their efforts, they recognized that the availability of support
services could be crucial for at least some of their patients. Thus, all but one program assessed
patients� needs for non-Medicare support services or additional Medicare-covered services
during the patients� first year in the program through contacts to identify these needs (Table II.4).
45
TABLE II.4
CARE COORDINATORS� CONTACTS TO ARRANGE FOR SERVICES DURING THE YEAR AFTER RANDOM ASSIGNMENT, AMONG 1ST-YEAR ENROLLEES
Percentage of Patients with
Contacts to Identify Medicare Service
Needs
Percentage of Patients with
Contacts to Identify Non-Medicare Service Needs
Percentage of Patients with
Contacts to Monitor Service Receipt
Number of Patients
Avera 13.4 2.6 59.7 157
Carle 83.2 97.2 29.9 1,151
CenVaNet 24.6 43.7 28.6 538
Charlestown 67.1 50.0 70.9 212
CorSolutions 0.0 66.2 17.3 366
Georgetown 4.0 10.0 92.0 53
Health Quality Partners 16.4 11.1 19.3 243
Hospice of the Valley 3.4 35.0 11.2 236
Jewish Home and Hospital 21.3 80.6 41.8 271
Medical Care Development 30.4 12.8 32.6 196
Mercy 8.6 99.3 16.5 317
QMed 0.2 9.2 9.5 698
Quality Oncology 17.2 17.2 89.6 31
University of Maryland 0.0 0.0 3.4 29
Washington University 28.1 35.9 72.1 715 Source: Data describing program contacts with treatment group patients were prepared by programs and
submitted quarterly to Mathematica Policy Research, Inc.

46
However, only five programs did so for more than half their patients (Table II.4). Of the
15 programs, 11 reported that they either had funds to pay for the home telemonitoring devices
that were part of their interventions or had more limited funds to pay for other goods and
services (or planned to provide them directly) (Table II.5). In fact, other than those who received
the telemonitors, few program patients received goods and services during their first year in the
program. One program paid for monitored exercise for roughly 30 percent of its patients;
another program with a telephonic intervention paid home health nurses to conduct in-person
assessments for almost two-thirds of its patients and provided medication cassettes for about
40 percent of its patients (Table II.5).
Access to prescription drugs is particularly important to chronic disease management, as
even beneficiaries with drug coverage may have needs that exceed their coverage. Two
programs had allocated limited funds to help patients to close drug coverage gaps.6 In addition,
one-half of CorSolutions�s treatment group was randomly assigned to a separate arm of the
study, under which they could receive coverage of all prescription medications if they had
income less than 200 percent of the federal poverty level and lacked other prescription drug
coverage. However, the program purchased prescription drugs for only 36 treatment group
members (roughly 20 percent of the patients randomly assigned to the prescription
coverage arm).
7. Efforts to Engage Physicians
Although most of the programs recognized physicians as a critical part of a patient�s
healthcare team, most programs tried to minimize the burden that their interventions placed on
6 Staff from these two programs (Georgetown and QMed) noted that their programs had limited funds to pay
for medications related to the programs� primary diagnoses; Table II.5 shows that Georgetown paid for medications for 6 percent of its patients during their first year in the program, but that QMed made no such purchases. Although Washington University staff reported they had not allocated funds to purchase goods or services for its patients, Table II.5 suggests that they did in fact purchase medications for 7 percent of them.
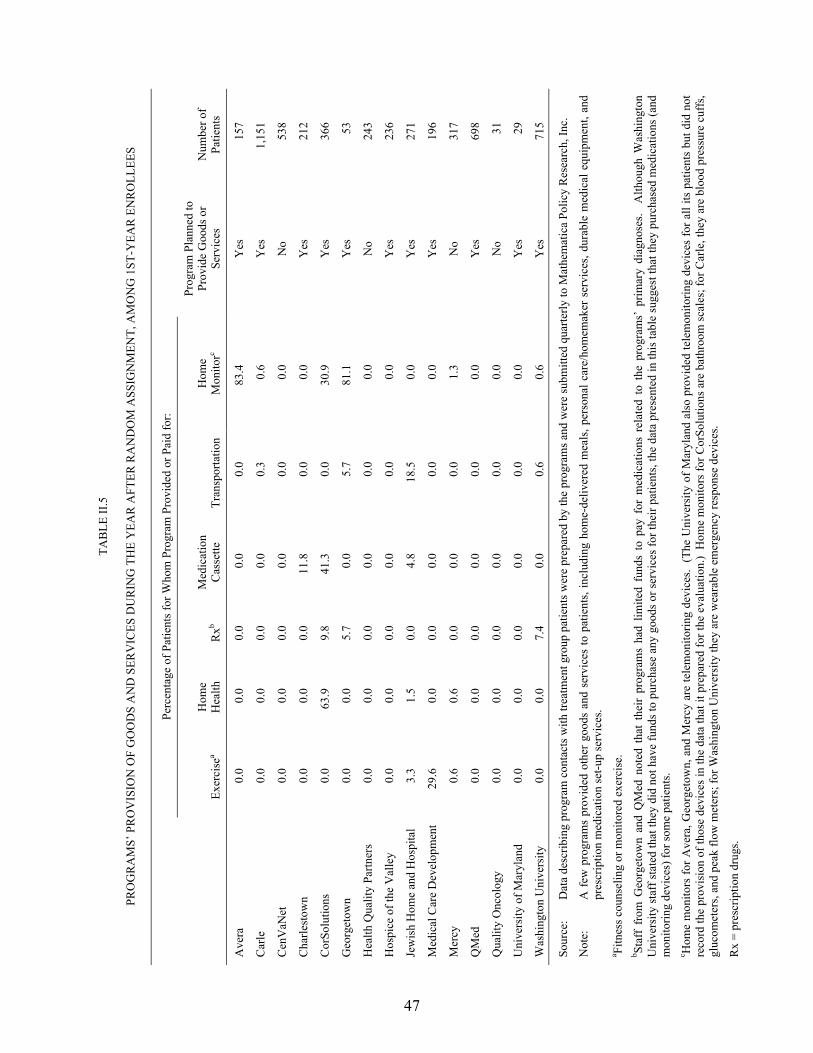
47
TAB
LE II
.5
PRO
GR
AM
S� P
RO
VIS
ION
OF
GO
OD
S A
ND
SER
VIC
ES D
UR
ING
TH
E Y
EAR
AFT
ER R
AN
DO
M A
SSIG
NM
ENT,
AM
ON
G 1
ST-Y
EAR
EN
RO
LLEE
S
Pe
rcen
tage
of P
atie
nts f
or W
hom
Pro
gram
Pro
vide
d or
Pai
d fo
r:
Exer
cise
a H
ome
H
ealth
R
xb M
edic
atio
n C
asse
tte
Tran
spor
tatio
n H
ome
M
onito
rc
Prog
ram
Pla
nned
to
Prov
ide
Goo
ds o
r Se
rvic
es
Num
ber o
f Pa
tient
s
Ave
ra
0.0
0.0
0.0
0.0
0.0
83.4
Y
es
157
Car
le
0.0
0.0
0.0
0.0
0.3
0.6
Yes
1,
151
Cen
VaN
et
0.0
0.0
0.0
0.0
0.0
0.0
No
538
Cha
rlest
own
0.0
0.0
0.0
11.8
0.
0 0.
0 Y
es
212
Cor
Solu
tions
0.
0 63
.9
9.8
41.3
0.
0 30
.9
Yes
36
6
Geo
rget
own
0.0
0.0
5.7
0.0
5.7
81.1
Y
es
53
Hea
lth Q
ualit
y Pa
rtner
s 0.
0 0.
0 0.
0 0.
0 0.
0 0.
0 N
o 24
3
Hos
pice
of t
he V
alle
y 0.
0 0.
0 0.
0 0.
0 0.
0 0.
0 Y
es
236
Jew
ish
Hom
e an
d H
ospi
tal
3.3
1.5
0.0
4.8
18.5
0.
0 Y
es
271
Med
ical
Car
e D
evel
opm
ent
29.6
0.
0 0.
0 0.
0 0.
0 0.
0 Y
es
196
Mer
cy
0.6
0.6
0.0
0.0
0.0
1.3
No
317
QM
ed
0.0
0.0
0.0
0.0
0.0
0.0
Yes
69
8
Qua
lity
Onc
olog
y 0.
0 0.
0 0.
0 0.
0 0.
0 0.
0 N
o 31
Uni
vers
ity o
f Mar
ylan
d 0.
0 0.
0 0.
0 0.
0 0.
0 0.
0 Y
es
29
Was
hing
ton
Uni
vers
ity
0.0
0.0
7.4
0.0
0.6
0.6
Yes
71
5
Sour
ce:
Dat
a de
scrib
ing
prog
ram
con
tact
s with
trea
tmen
t gro
up p
atie
nts w
ere
prep
ared
by
the
prog
ram
s and
wer
e su
bmitt
ed q
uarte
rly to
Mat
hem
atic
a Po
licy
Res
earc
h, In
c.
Not
e:
A f
ew p
rogr
ams
prov
ided
oth
er g
oods
and
ser
vice
s to
pat
ient
s, in
clud
ing
hom
e-de
liver
ed m
eals
, per
sona
l car
e/ho
mem
aker
ser
vice
s, du
rabl
e m
edic
al e
quip
men
t, an
d pr
escr
iptio
n m
edic
atio
n se
t-up
serv
ices
. a Fi
tnes
s cou
nsel
ing
or m
onito
red
exer
cise
. b St
aff
from
Geo
rget
own
and
QM
ed n
oted
tha
t th
eir
prog
ram
s ha
d lim
ited
fund
s to
pay
for
med
icat
ions
rel
ated
to
the
prog
ram
s� p
rimar
y di
agno
ses.
Alth
ough
Was
hing
ton
Uni
vers
ity st
aff s
tate
d th
at th
ey d
id n
ot h
ave
fund
s to
purc
hase
any
goo
ds o
r ser
vice
s for
thei
r pat
ient
s, th
e da
ta p
rese
nted
in th
is ta
ble
sugg
est t
hat t
hey
purc
hase
d m
edic
atio
ns (a
nd
mon
itorin
g de
vice
s) fo
r som
e pa
tient
s. c H
ome
mon
itors
for A
vera
, Geo
rget
own,
and
Mer
cy a
re te
lem
onito
ring
devi
ces.
(The
Uni
vers
ity o
f Mar
ylan
d al
so p
rovi
ded
tele
mon
itorin
g de
vice
s fo
r all
its p
atie
nts
but d
id n
ot
reco
rd th
e pr
ovis
ion
of th
ose
devi
ces i
n th
e da
ta th
at it
pre
pare
d fo
r the
eva
luat
ion.
) H
ome
mon
itors
for C
orSo
lutio
ns a
re b
athr
oom
scal
es; f
or C
arle
, the
y ar
e bl
ood
pres
sure
cuf
fs,
gluc
omet
ers,
and
peak
flow
met
ers;
for W
ashi
ngto
n U
nive
rsity
they
are
wea
rabl
e em
erge
ncy
resp
onse
dev
ices
.
Rx
= pr
escr
iptio
n dr
ugs.
48
physicians. Only four programs adopted direct improvement of provider practice as an approach
to improving patient health (Exhibit II.7). They did so either by comparing the physicians�
treatment plans with evidence-based guidelines and feeding back recommendations to the
physicians or, in the case of one program, by directly providing both education about treatment
guidelines and incentives to participate in that education.
Rather than trying to affect clinical practice directly, most programs regarded themselves as
the physicians� �eyes and ears� outside office visits. Almost every program (14 out of the 15)
asked physicians to review potential patients for program appropriateness, although only
one-half of the programs expected physicians to actively refer or encourage their patients to
participate in the demonstration. All of the programs expected physicians to respond to requests
from care coordinators when contacted about specific urgent patient problems, but only four
programs expected physicians to call care coordinators with new information about their
patients. Most of the programs that expected physicians to actively encourage patients to enroll
or to initiate contacts with care coordinators were largely disappointed and had to find strategies
to compensate (for example, by devoting more time to encouraging potential patients themselves
or relying on patients� self-reports of important health-related events). Only five programs asked
physicians to provide care coordinators with standing orders to order routine tests or recommend
changes in medication dosages for their patients.
Programs engaged in a variety of strategies to achieve physicians� support of and active
participation in their care coordination efforts (Exhibit II.8). Five programs used physician
opinion leaders to increase awareness of their programs, and to encourage physicians to
participate. Three programs developed physician advisory boards that were responsible for
either assisting with program design or eliciting feedback to improve the intervention. Nine
programs paid physicians for their participation. Four programs provided a modest per patient
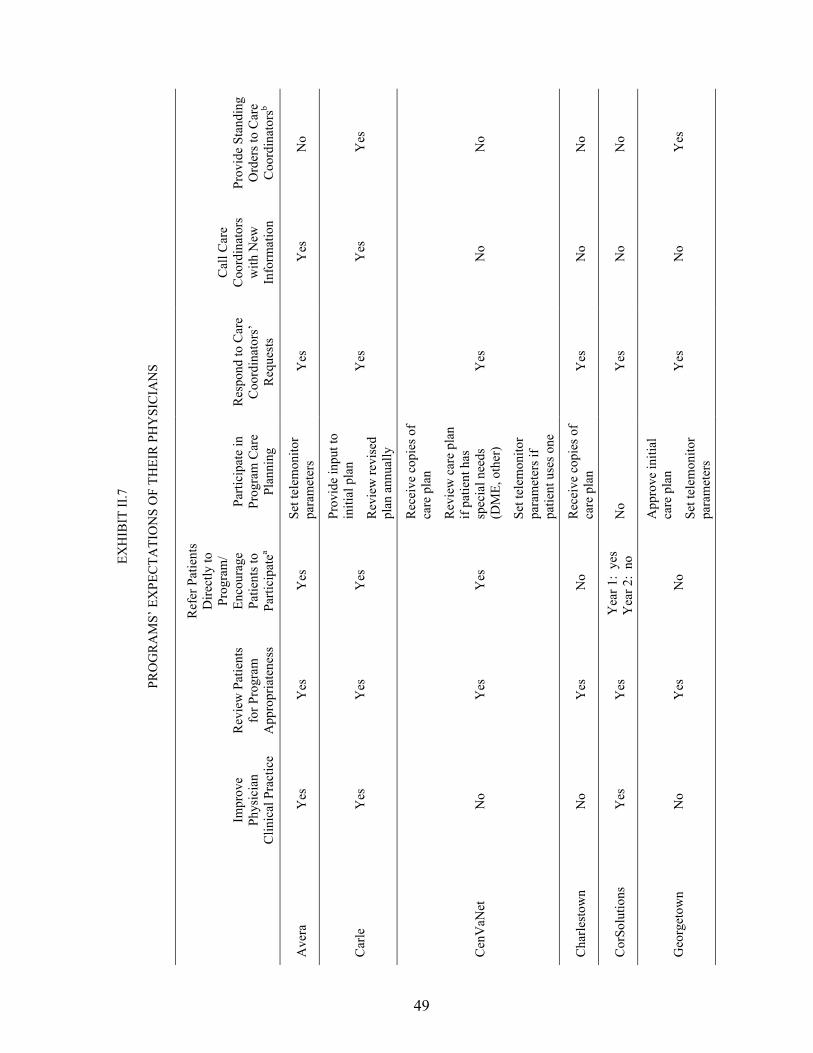
49
EXH
IBIT
II.7
PRO
GR
AM
S� E
XPE
CTA
TIO
NS
OF
THEI
R P
HY
SIC
IAN
S
Impr
ove
Phys
icia
n C
linic
al P
ract
ice
Rev
iew
Pat
ient
s fo
r Pro
gram
A
ppro
pria
tene
ss
Ref
er P
atie
nts
Dire
ctly
to
Prog
ram
/ En
cour
age
Patie
nts t
o Pa
rtici
pate
a
Parti
cipa
te in
Pr
ogra
m C
are
Plan
ning
Res
pond
to C
are
Coo
rdin
ator
s�
Req
uest
s
Cal
l Car
e C
oord
inat
ors
with
New
In
form
atio
n
Prov
ide
Stan
ding
O
rder
s to
Car
e C
oord
inat
orsb
Ave
ra
Yes
Y
es
Yes
Se
t tel
emon
itor
para
met
ers
Yes
Y
es
No
Car
le
Yes
Y
es
Yes
Prov
ide
inpu
t to
initi
al p
lan
Rev
iew
revi
sed
plan
ann
ually
Yes
Y
es
Yes
Cen
VaN
et
No
Yes
Y
es
Rec
eive
cop
ies o
f ca
re p
lan
Rev
iew
car
e pl
an
if pa
tient
has
sp
ecia
l nee
ds
(DM
E, o
ther
)
Set t
elem
onito
r pa
ram
eter
s if
patie
nt u
ses o
ne
Yes
N
o N
o
Cha
rlest
own
No
Yes
N
o R
ecei
ve c
opie
s of
care
pla
n Y
es
No
No
Cor
Solu
tions
Y
es
Yes
Y
ear 1
: ye
s Y
ear 2
: no
N
o Y
es
No
No
Geo
rget
own
No
Yes
N
o
App
rove
initi
al
care
pla
n
Set t
elem
onito
r pa
ram
eter
s
Yes
N
o Y
es

EXH
IBIT
II.7
(con
tinue
d)
50
Impr
ove
Phys
icia
n C
linic
al P
ract
ice
Rev
iew
Pat
ient
s fo
r Pro
gram
A
ppro
pria
tene
ss
Ref
er P
atie
nts
Dire
ctly
to
Prog
ram
/ En
cour
age
Patie
nts t
o Pa
rtici
pate
a
Parti
cipa
te in
Pr
ogra
m C
are
Plan
ning
Res
pond
to C
are
Coo
rdin
ator
s�
Req
uest
s
Cal
l Car
e C
oord
inat
ors
with
New
In
form
atio
n
Prov
ide
Stan
ding
O
rder
s to
Car
e C
oord
inat
orsb
Hea
lth Q
ualit
y Pa
rtner
s N
o Y
es
No
No
Yes
N
o N
o
Hos
pice
of t
he
Val
ley
No
No
Yes
N
o Y
es
No
Yes
Jew
ish
Hom
e an
d H
ospi
tal
No
Yes
Y
es
Set t
elem
onito
r pa
ram
eter
s if
patie
nt u
ses o
ne
Yes
Y
es
No
Med
ical
Car
e D
evel
opm
ent
No
Yes
Y
es
No
Yes
N
o N
o
Mer
cy
No
Yes
N
o R
evie
w in
itial
pl
an a
nd re
vise
d pl
an a
nnua
lly
Yes
N
o Y
es
QM
ed
Yes
Y
es
Yes
N
o Y
es
Yes
Y
ear 1
: no
Y
ear 2
: ye
s
Qua
lity
Onc
olog
y N
o Y
es
No
No
Yes
N
o N
o
Uni
vers
ity o
f M
aryl
and
No
Yes
Y
es
No
Yes
N
o N
oc
Was
hing
ton
Uni
vers
ity
No
Yes
N
o N
o Y
es
No
No
a A n
otat
ion
of �
yes�
in th
is c
olum
n in
dica
tes t
hat t
he p
rogr
am e
xpec
ted
phys
icia
ns to
be
maj
or so
urce
s of p
atie
nt re
ferr
als o
r to
take
an
activ
e ro
le in
enc
oura
ging
pa
tient
s to
enro
ll an
d pa
rtici
pate
. A
ll pr
ogra
ms a
ccep
ted
patie
nts r
efer
red
by p
hysi
cian
s eve
n if
they
did
not
exp
ect t
he p
rogr
ams t
o be
maj
or re
ferr
al so
urce
s. b St
andi
ng o
rder
s inc
lude
d th
ose
to o
rder
rout
ine
test
s or t
o re
com
men
d m
edic
atio
n do
sage
cha
nges
to p
atie
nts (
mos
t com
mon
ly, f
or d
iure
tics)
. c Th
e U
nive
rsity
of M
aryl
and�
s car
e co
ordi
nato
r is a
nur
se p
ract
ition
er; a
s suc
h, sh
e ha
s the
aut
horit
y to
cha
nge
a pa
tient
�s m
edic
atio
n do
sage
.
DM
E =
dura
ble
med
ical
equ
ipm
ent.
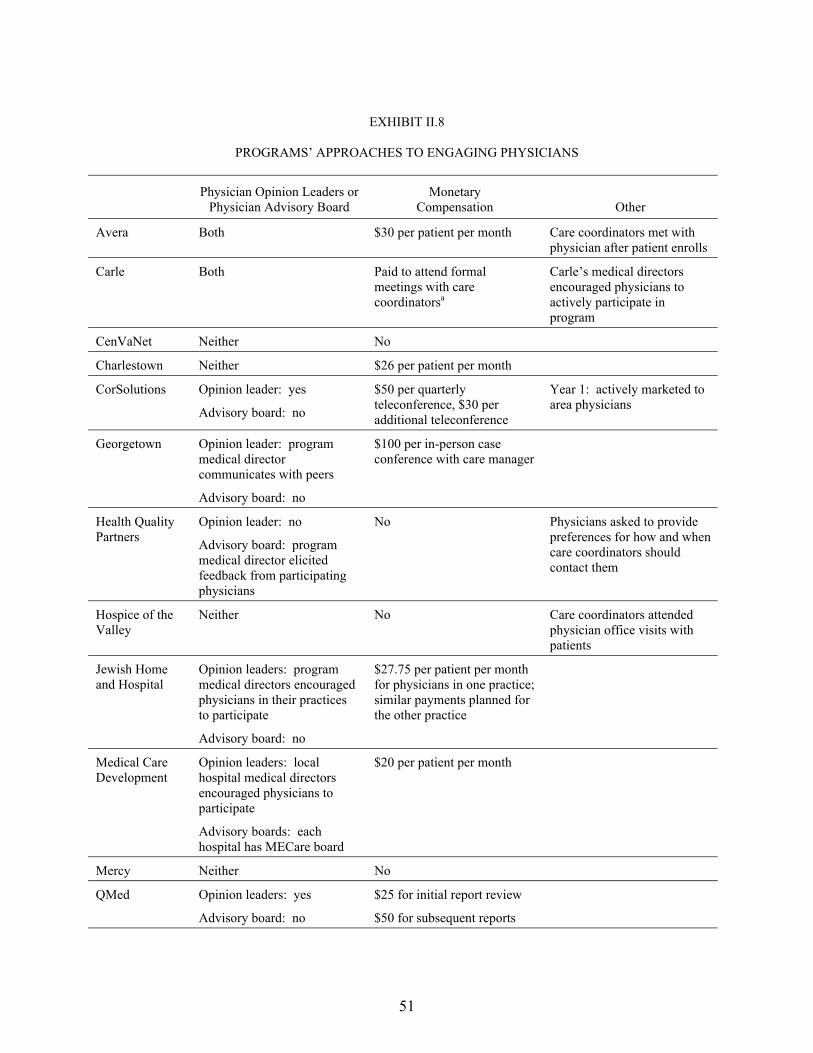
51
EXHIBIT II.8
PROGRAMS� APPROACHES TO ENGAGING PHYSICIANS
Physician Opinion Leaders or Physician Advisory Board
Monetary Compensation Other
Avera Both $30 per patient per month Care coordinators met with physician after patient enrolls
Carle Both Paid to attend formal meetings with care coordinatorsa
Carle�s medical directors encouraged physicians to actively participate in program
CenVaNet Neither No
Charlestown Neither $26 per patient per month
CorSolutions Opinion leader: yes
Advisory board: no
$50 per quarterly teleconference, $30 per additional teleconference
Year 1: actively marketed to area physicians
Georgetown Opinion leader: program medical director communicates with peers
Advisory board: no
$100 per in-person case conference with care manager
Health Quality Partners
Opinion leader: no
Advisory board: program medical director elicited feedback from participating physicians
No Physicians asked to provide preferences for how and when care coordinators should contact them
Hospice of the Valley
Neither No Care coordinators attended physician office visits with patients
Jewish Home and Hospital
Opinion leaders: program medical directors encouraged physicians in their practices to participate
Advisory board: no
$27.75 per patient per month for physicians in one practice; similar payments planned for the other practice
Medical Care Development
Opinion leaders: local hospital medical directors encouraged physicians to participate
Advisory boards: each hospital has MECare board
$20 per patient per month
Mercy Neither No
QMed Opinion leaders: yes
Advisory board: no
$25 for initial report review
$50 for subsequent reports
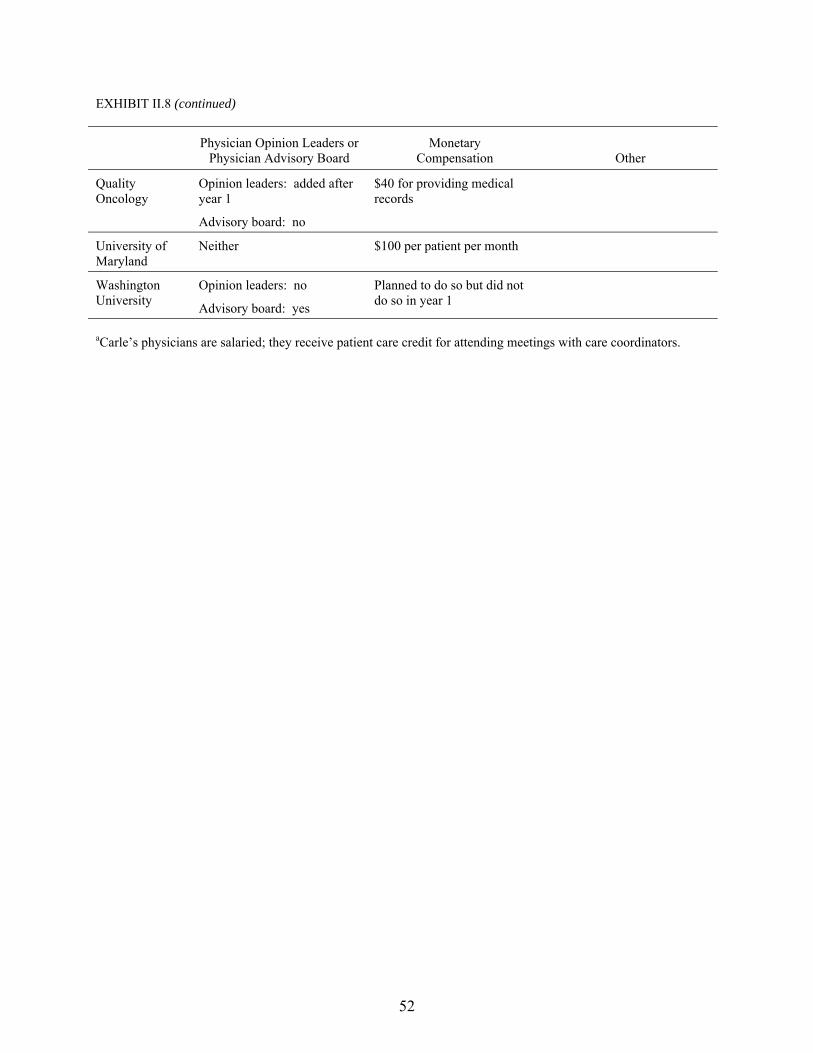
EXHIBIT II.8 (continued)
52
Physician Opinion Leaders or Physician Advisory Board
Monetary Compensation Other
Quality Oncology
Opinion leaders: added after year 1
Advisory board: no
$40 for providing medical records
University of Maryland
Neither $100 per patient per month
Washington University
Opinion leaders: no
Advisory board: yes
Planned to do so but did not do so in year 1
aCarle�s physicians are salaried; they receive patient care credit for attending meetings with care coordinators.
53
per month stipend ranging from $20 to $30, and one paid physicians $100 per month. Four
others paid physicians between $30 and $100 for specific tasks, such as reviewing reports,
participating in teleconferences, providing medical records, or meeting with care managers in
person.
8. Data Systems and Reporting
Each program had some type of electronic system to manage data on patient enrollment and
program activities, although the amount of data stored on and sophistication of the systems
varied widely (Exhibit II.9). Four programs whose hosts (or collaborating partners) were disease
management providers used the systems developed for their commercial clients. Six programs
purchased commercial case management software products (Canopy®, HomeWorks®,
InformaCare®, or Clinical Management System®). Four either used databases they had
developed for previous case management projects or developed databases specifically for the
demonstration (for example, using Microsoft Access). The remaining program, whose
intervention was simply to provide home telemonitoring, relied on the data system associated
with the telemonitor for its electronic recordkeeping needs. In addition to these primary data
systems, six programs had access to systems that provided additional patient information, access
to medical records, email alerts about medical encounters, and information on potential
drug interactions.
The extent to which care coordinators used data systems with their daily work and program
administrators used the systems to generate management reports varied across the 15 programs.
Care coordinators in 12 of the 15 programs regularly used the primary data systems to support
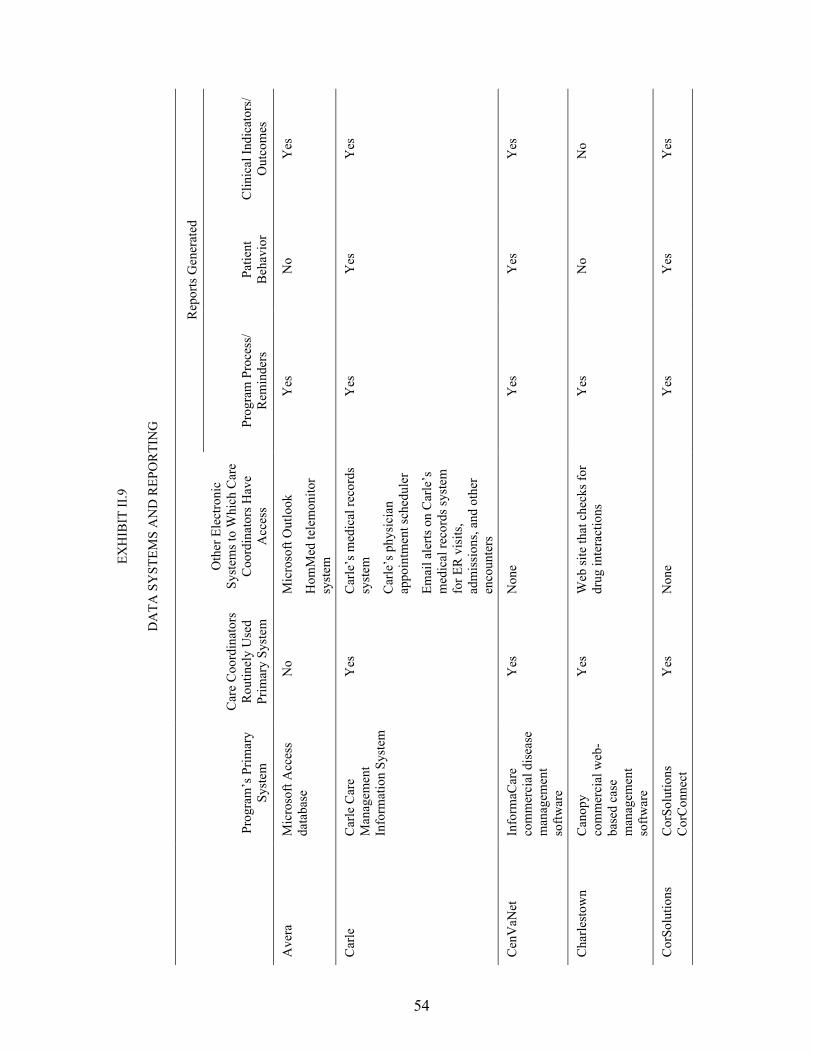
54
EXH
IBIT
II.9
DA
TA S
YST
EMS
AN
D R
EPO
RTI
NG
Rep
orts
Gen
erat
ed
Pr
ogra
m�s
Prim
ary
Syst
em
Car
e C
oord
inat
ors
Rou
tinel
y U
sed
Prim
ary
Syst
em
Oth
er E
lect
roni
c Sy
stem
s to
Whi
ch C
are
Coo
rdin
ator
s Hav
e A
cces
s Pr
ogra
m P
roce
ss/
Rem
inde
rs
Patie
nt
Beh
avio
r C
linic
al In
dica
tors
/ O
utco
mes
Ave
ra
Mic
roso
ft A
cces
s da
taba
se
No
Mic
roso
ft O
utlo
ok
Hom
Med
tele
mon
itor
syst
em
Yes
N
o Y
es
Car
le
Car
le C
are
Man
agem
ent
Info
rmat
ion
Syst
em
Yes
C
arle
�s m
edic
al re
cord
s sy
stem
Car
le�s
phy
sici
an
appo
intm
ent s
ched
uler
Emai
l ale
rts o
n C
arle
�s
med
ical
reco
rds s
yste
m
for E
R v
isits
, ad
mis
sion
s, an
d ot
her
enco
unte
rs
Yes
Y
es
Yes
Cen
VaN
et
Info
rmaC
are
com
mer
cial
dis
ease
m
anag
emen
t so
ftwar
e
Yes
N
one
Yes
Y
es
Yes
Cha
rlest
own
Can
opy
com
mer
cial
web
-ba
sed
case
m
anag
emen
t so
ftwar
e
Yes
W
eb si
te th
at c
heck
s for
dr
ug in
tera
ctio
ns
Yes
N
o N
o
Cor
Solu
tions
C
orSo
lutio
ns
Cor
Con
nect
Y
es
Non
e Y
es
Yes
Y
es
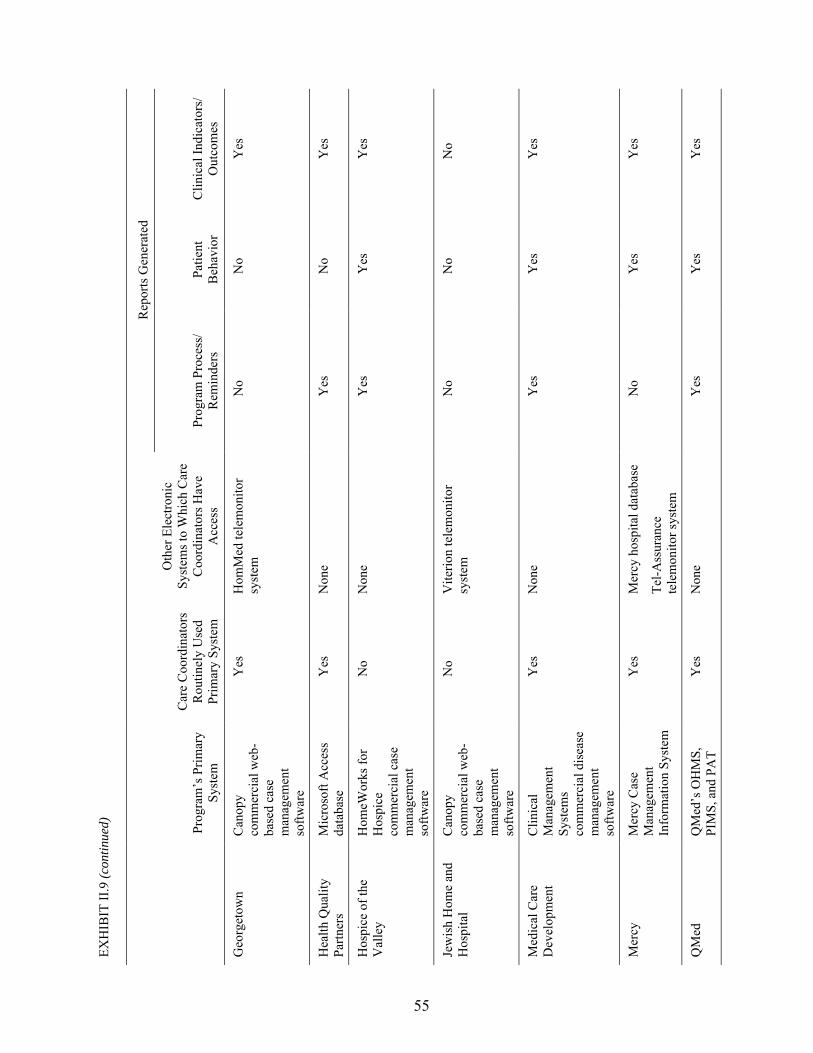
EXH
IBIT
II.9
(con
tinue
d)
55
Rep
orts
Gen
erat
ed
Pr
ogra
m�s
Prim
ary
Syst
em
Car
e C
oord
inat
ors
Rou
tinel
y U
sed
Prim
ary
Syst
em
Oth
er E
lect
roni
c Sy
stem
s to
Whi
ch C
are
Coo
rdin
ator
s Hav
e A
cces
s Pr
ogra
m P
roce
ss/
Rem
inde
rs
Patie
nt
Beh
avio
r C
linic
al In
dica
tors
/ O
utco
mes
Geo
rget
own
Can
opy
com
mer
cial
web
-ba
sed
case
m
anag
emen
t so
ftwar
e
Yes
H
omM
ed te
lem
onito
r sy
stem
N
o N
o Y
es
Hea
lth Q
ualit
y Pa
rtner
s M
icro
soft
Acc
ess
data
base
Y
es
Non
e Y
es
No
Yes
Hos
pice
of t
he
Val
ley
Hom
eWor
ks fo
r H
ospi
ce
com
mer
cial
cas
e m
anag
emen
t so
ftwar
e
No
Non
e Y
es
Yes
Y
es
Jew
ish
Hom
e an
d H
ospi
tal
Can
opy
com
mer
cial
web
-ba
sed
case
m
anag
emen
t so
ftwar
e
No
Vite
rion
tele
mon
itor
syst
em
No
No
No
Med
ical
Car
e D
evel
opm
ent
Clin
ical
M
anag
emen
t Sy
stem
s co
mm
erci
al d
isea
se
man
agem
ent
softw
are
Yes
N
one
Yes
Y
es
Yes
Mer
cy
Mer
cy C
ase
Man
agem
ent
Info
rmat
ion
Syst
em
Yes
M
ercy
hos
pita
l dat
abas
e
Tel-A
ssur
ance
te
lem
onito
r sys
tem
No
Yes
Y
es
QM
ed
QM
ed�s
OH
MS,
PI
MS,
and
PA
T Y
es
Non
e Y
es
Yes
Y
es

EXH
IBIT
II.9
(con
tinue
d)
56
Rep
orts
Gen
erat
ed
Pr
ogra
m�s
Prim
ary
Syst
em
Car
e C
oord
inat
ors
Rou
tinel
y U
sed
Prim
ary
Syst
em
Oth
er E
lect
roni
c Sy
stem
s to
Whi
ch C
are
Coo
rdin
ator
s Hav
e A
cces
s Pr
ogra
m P
roce
ss/
Rem
inde
rs
Patie
nt
Beh
avio
r C
linic
al In
dica
tors
/ O
utco
mes
Qua
lity
Onc
olog
y Q
ualit
y O
ncol
ogy
Inte
grat
ed C
are
Man
agem
ent
Syst
em
Yes
N
one
Yes
Y
es
Yes
Uni
vers
ity o
f M
aryl
and
Phili
ps te
lem
onito
r sy
stem
Y
es
Non
e N
o N
o Y
es
Was
hing
ton
Uni
vers
ity
Stat
usO
ne
Car
eLin
k ca
se
man
agem
ent
softw
are
Yes
N
one
Yes
N
o N
o
ER =
em
erge
ncy
room
; O
HM
S =
On-
line
Hea
lth M
anag
emen
t Sy
stem
; PA
T =
Patie
nt A
utom
ated
Tra
ckin
g Sy
stem
; PI
MS
= Pa
tient
and
Inf
orm
atio
n M
anag
emen
t Sys
tem
.

57
their work with patients, whereas those in the 3 other programs relied largely on paper records.7
Eleven programs used their data systems to produce reports reminding care coordinators about
when to contact patients, or when patients might be due for tests or treatment. Eight programs
used their data systems to produce reports on patient behavior, and 12 programs had data systems
capable of producing reports on clinical indicators and patient outcomes.
9. Summary
Although each of the programs provided a unique intervention, they shared several common
features that the literature associates with success in improving patient health and in reducing
health care costs. All the program interventions began with a comprehensive patient assessment,
and all of them regularly monitored patients� symptoms either through the use of home
monitoring devices or through regular contact with care coordinators, most of whom were
experienced RNs. Almost all the programs (14 of 15) included patient education as an integral
part of their interventions, and they attempted to decrease care fragmentation through a variety of
means. The strategies included (1) teaching patients to communicate more effectively with their
physicians, (2) encouraging physicians to adhere to evidence-based treatment guidelines, and
(3) helping patients to avoid repeated adverse events. Finally, although relatively few patients
who enrolled in the demonstration required support services or health-related goods, most of the
programs had the capacity to identify the need for additional goods and services, and to help
patients to arrange for their receipt.
7 The three other programs also maintained electronic databases that recorded program activities and/or
information on treatment group members, but the databases were used to monitor program performance; they were not electronic medical records useful for daily patient management. Nurse case managers in these programs thus relied on paper records and separately entered data into the databases.
58
Although all the programs had prior experience with care coordination or disease
management, each of the program hosts differed in the amount of experience it had with fee-for-
service Medicare, as well as in its organizational ties to patients� physicians. Programs with less
experience providing services to fee-for-service patients often had to devote significant staff time
and resources to modifying their outreach and intervention strategies, because they had less
leverage over physicians and less access to medical records and other data than they did in their
managed care contracts. Programs without an organizational link to patients� physicians had to
spend more time marketing to local physicians, and cultivating the physicians� support. In the
absence of that support, program staff had to tailor program interventions to the reality of
minimal physician involvement.
Programs also differed in their ability to identify and respond to patients� problems. Those
that provided patients with telemonitors had the advantage of timely notification of worsening
symptoms, ER visits, or hospital admissions. Thus, they were able to ensure that patients with
worsening symptoms saw their physicians promptly, which helped to avert hospitalization.
When patients did have adverse events, the absence of a daily reading served as a notification to
the programs that the events had occurred; program staff were therefore able to contact the
patients immediately on release from the hospital to make certain that the patients understood
instructions from hospital staff, as well as to identify strategies to minimize the chances of a
recurrence of the event. Nevertheless, staff of one program that used telemonitors expressed
concern that patients were becoming dependent on the devices, and they tried to teach the
patients how to self-monitor symptoms without using the devices.
The programs differed in their capacity to meet face-to-face with patients. Although all the
programs had a telephonic component, some included in-person visits for assessment or ongoing
monitoring. In-person contact provided care coordinators with an opportunity to glean additional

59
information about the patients� health status, cognitive ability, and capacity to live safely at home
that they might not have been able to obtain over the telephone.
Although almost all of the programs provided education as a means of improving patients�
adherence to physicians� treatment recommendations, the literature has not identified one
approach to patient education that is uniformly considered to be �the most effective.� Some of
the programs primarily provided factual information about target conditions and common
comorbidities and taught patients appropriate self-care techniques for their conditions. Other
programs adopted lessons from learning theories about readiness to change and approaches to
health behavior modification and applied them to their education interventions. A few programs
took the former approach during their first year of operations but began to consider the latter as
potentially more effective and thus modified their interventions during their second year. This
change in strategies could result in different program effects over time.
Finally, although a few programs made concerted, systematic efforts to improve physician
clinical practice, most tried to minimize the burden they placed on physicians and made few
demands on the physicians� time. For the most part, care coordinators contacted physicians only
about specific and urgent patient problems. The programs also tried to minimize paperwork and
requests to review documents or to meet with program staff. Only one program provided
additional education to physicians; the effort was facilitated by the fact that the program host was
an integrated health system that employed the participating physicians.
C. QUANTITATIVE SCORING OF INTERVENTION FEATURES
1. Scoring Approach
In addition to developing qualitative descriptions of program interventions, the evaluation
sought an approach that would allow the program features and components, such as patient
education or service arrangement, to be assigned numerical �scores.� Examining the correlations
60
between these scores on the one hand and impacts on outcomes on the other would theoretically
help to identify the features most likely to lead to program success.
The evaluator developed a structured assessment form (contained in Appendix B) for
research team members to score the programs according to specified intervention features. The
form asked questions about 10 domains (listed in Table II.6) chosen on the basis of previous
research (Chen et al. 2000). Most questions asked about the presence or absence of specific
program characteristics related to each domain. For example, under the Program Staffing
domain, a question asked whether care coordinators were required to be RNs, and under the
Patient Education domain, a question asked whether the program used a curriculum for patient
education. However, the form also contained Likert scale questions that sought scorers�
judgments on how well program components appeared to meet the needs of the target population
both on an absolute basis and in relation to services available to enrollees in the absence of the
program. As noted, these scores were meant to be quantitative descriptors. Several programs
were expected to have low scores in one or more areas, as they had designed interventions that
intentionally did not emphasize certain aspects of care coordination. (For example, several
programs did not view improvement of provider practice as a focus of their interventions.)
To standardize responses, the form contained detailed definitions of terms and instructions
on where to find the information for each question. The sources of information were program
documents (ranging from the original program proposals to subsequent memos, care manager
training materials, and protocols), notes from the evaluator�s telephone and site visit interviews,
and previous evaluation reports and program profiles prepared from these materials. Because
these scores are based on the descriptions of program features as conveyed by documents and
program staff, they portray the extent and intensity of the actual implementation of these
elements only incompletely. The survey data of participants (presented in Chapters IV and V),
61
and of physicians (Chapter IV), in which respondents reported their perceptions of whether
certain processes of care occurred, provide additional information on implementation of program
features and thus complement the scores presented here. The correlations of the scores with
impact estimates from participant survey data are examined in Chapter VII.
Answers within each domain were summed so that higher scores indicated a greater number
of features, greater apparent intensity of those features, or both. The scores were rescaled to a
0-to-100 range. Scores for all 10 domains were summed to produce a combined score, also
converted to a 0-to-100 range.
Each program was assessed independently by two research team members from a pool of
five scorers. (Thus, not all 15 programs were assessed by the same 2 raters.) Scorers were not
permitted to see the impact estimates for programs they were scoring. It is important to assess
the degree to which scorers� subjectivity might have contributed to observed variation in the
scores. A standard approach to quantitating scorers� consistency in assessing programs is to
calculate a statistic called the �intraclass correlation coefficient� (McGraw and Wong 1996;
Shrout and Fleiss 1979). The intraclass correlation coefficient measures the proportion of the
total variation in scores that is due to variation between the subjects being scored (care
coordination programs in this case), as opposed to that due to variation between scorers. The
maximum possible value of an intraclass correlation coefficient is 1, indicating that all variation
in scores is due to program variation (and none to inter-rater variability). Intraclass correlation
coefficients as close to 1 as possible are thus desirable. A conventional classification scheme is
to call intraclass correlation coefficient values from 0.8 to 1.0 �excellent,� from 0.6 to
0.8 �good,� from 0.4 to 0.6 �moderate,� and 0.4 or less �fair to poor� (Landis and Koch 1977).
Table II.6 shows the intraclass correlation coefficients for each of the domains. (Appendix
B contains additional details on the calculation of the intraclass correlation coefficients.) Four
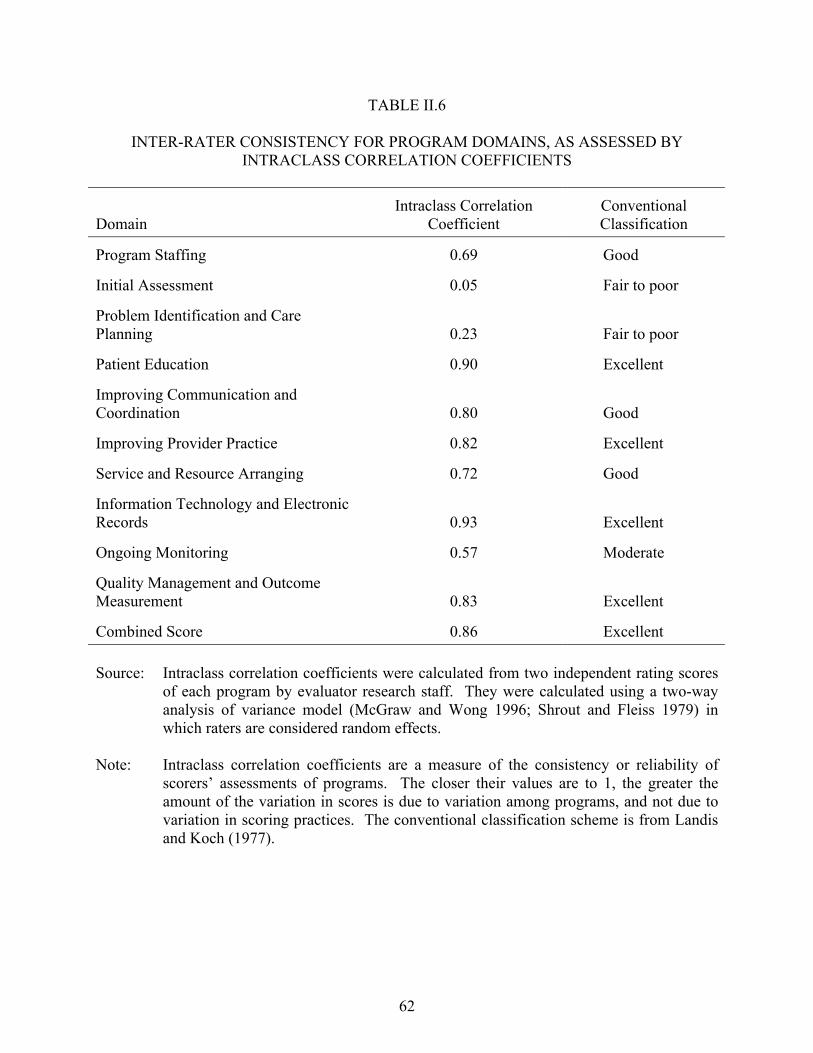
62
TABLE II.6
INTER-RATER CONSISTENCY FOR PROGRAM DOMAINS, AS ASSESSED BY INTRACLASS CORRELATION COEFFICIENTS
Domain
Intraclass Correlation Coefficient
Conventional Classification
Program Staffing 0.69 Good
Initial Assessment 0.05 Fair to poor
Problem Identification and Care Planning 0.23 Fair to poor
Patient Education 0.90 Excellent
Improving Communication and Coordination 0.80 Good
Improving Provider Practice 0.82 Excellent
Service and Resource Arranging 0.72 Good
Information Technology and Electronic Records 0.93 Excellent
Ongoing Monitoring 0.57 Moderate
Quality Management and Outcome Measurement 0.83 Excellent
Combined Score 0.86 Excellent Source: Intraclass correlation coefficients were calculated from two independent rating scores
of each program by evaluator research staff. They were calculated using a two-way analysis of variance model (McGraw and Wong 1996; Shrout and Fleiss 1979) in which raters are considered random effects.
Note: Intraclass correlation coefficients are a measure of the consistency or reliability of
scorers� assessments of programs. The closer their values are to 1, the greater the amount of the variation in scores is due to variation among programs, and not due to variation in scoring practices. The conventional classification scheme is from Landis and Koch (1977).
63
domains (Patient Education, Improving Provider Practice, Information Technology and
Electronic Records, and Quality Management and Outcome Measurement) had excellent
coefficients, as did the overall score. Three domains (Program Staffing, Improving
Communication and Coordination, and Service and Resource Arranging) had coefficients in the
good range, and one domain (Ongoing Monitoring) had a moderate coefficient. Finally, two
domains (Initial Assessment and Problem Identification and Care Planning) had poor to fair
coefficients. Less weight or importance was thus attached to the scores for these last two
domains.
2. Rating Score Results
Not surprisingly, given the diversity of program approaches and the populations that the
programs targeted, there was large variation within domains. Table II.7 shows the program
rating scores for each domain, listed in descending order, as well as the average scores for each
domain. The programs had the highest average scores for Ongoing Monitoring (mean of 68).8
Consistent with the previous observation that few programs had sought to influence clinical
practice, Improving Provider Practice had the lowest average score (32). Average scores for the
remaining domains ranged from 54 to 65.
Table II.7 also shows the variability within each domain, as measured by the range of scores
(the differences between the highest and lowest). The two domains with the narrowest ranges
were the Problem Identification and Care Planning domain, in which scores ranged from 38 to
83, and the Initial Assessment domain, with scores between 50 and 96. As previously noted,
however, the inter-rater reliability of these two scores was low. The two domains with the
8 Initial Assessment also had a high average score of 78, but, as noted, the inter-rater reliability of Initial
Assessment was only fair to poor.
64
TAB
LE II
.7
D
EMO
NST
RA
TIO
N P
RO
GR
AM
S IN
DES
CEN
DIN
G O
RD
ER O
F R
ATI
NG
SC
OR
ES F
OR
EA
CH
DO
MA
IN
Prog
ram
St
affin
g (I
CC
= 0
.69)
Initi
al
Ass
essm
enta
(IC
C =
0.0
5)
Prob
lem
sa Id
entif
icat
ion
and
Car
e Pl
anni
ng
(IC
C =
0.2
3)
Patie
nt
Educ
atio
n (I
CC
= 0
.90)
Impr
ovin
g C
omm
unic
atio
n an
d C
oord
inat
ion
(IC
C =
0.8
0)
Car
le
80
Geo
rget
own
96
Mer
cy
83
Hea
lth Q
ualit
y Pa
rtner
s 88
C
arle
94
Q
ualit
y O
ncol
ogy
75
Cen
VaN
et
95
Geo
rget
own
81
Mer
cy
85
Mer
cy
81
Mer
cy
70
Hea
lth Q
ualit
y Pa
rtner
s 91
A
vera
76
C
orSo
lutio
ns
82
Cha
rlest
own
74
Hea
lth Q
ualit
y Pa
rtner
s 65
A
vera
89
C
orSo
lutio
ns
74
Car
le
80
Geo
rget
own
65
Geo
rget
own
65
Car
le
87
Car
le
74
Hos
pice
of t
he
Val
ley
80
Hea
lth Q
ualit
y Pa
rtner
s 61
Cor
Solu
tions
65
C
orSo
lutio
ns
87
Cha
rlest
own
69
Ave
ra
77
Hos
pice
of t
he
Val
ley
61
Cha
rlest
own
65
Qua
lity
Onc
olog
y 85
M
edic
al C
are
Dev
elop
men
t 69
C
harle
stow
n 77
W
ashi
ngto
n U
nive
rsity
61
Cen
VaN
et
65
Med
ical
Car
e D
evel
opm
ent
82
Hos
pice
of t
he
Val
ley
67
Cen
VaN
et
71
Cen
VaN
et
59
Was
hing
ton
Uni
vers
ity
60
Mer
cy
80
Hea
lth Q
ualit
y Pa
rtner
s 64
G
eorg
etow
n 71
M
edic
al C
are
Dev
elop
men
t 59
M
edic
al C
are
Dev
elop
men
t 55
C
harle
stow
n 74
W
ashi
ngto
n U
nive
rsity
64
Q
ualit
y O
ncol
ogy
71
Cor
Solu
tions
54
H
ospi
ce o
f the
V
alle
y 55
H
ospi
ce o
f the
V
alle
y 74
Q
Med
62
Q
Med
62
Q
Med
54
U
nive
rsity
of
Mar
ylan
d 50
W
ashi
ngto
n U
nive
rsity
65
C
enV
aNet
62
M
edic
al C
are
Dev
elop
men
t 59
A
vera
52
Ave
ra
50
Jew
ish
Hom
e an
d H
ospi
tal
59
Qua
lity
Onc
olog
y 60
W
ashi
ngto
n U
nive
rsity
56
Q
ualit
y O
ncol
ogy
48
QM
ed
30
QM
ed
54
Jew
ish
Hom
e an
d H
ospi
tal
52
Jew
ish
Hom
e an
d H
ospi
tal
12
Uni
vers
ity o
f M
aryl
and
30
Jew
ish
Hom
e an
d H
ospi
tal
20
Uni
vers
ity o
f M
aryl
and
50
Uni
vers
ity o
f M
aryl
and
38
Uni
vers
ity o
f M
aryl
and
6 Je
wis
h H
ome
and
Hos
pita
l 22
Ran
ge
60
Ran
ge
46
Ran
ge
45
Ran
ge
82
Ran
ge
72
Ave
rage
58
A
vera
ge
78
Ave
rage
66
A
vera
ge
65
Ave
rage
58
TAB
LE II
.7 (c
ontin
ued)
65
Impr
ovin
g Pr
ovid
er
Prac
tice
(IC
C =
0.8
2)
Serv
ice
and
Res
ourc
e A
rran
ging
(I
CC
= 0
.72)
Info
rmat
ion
Tech
nolo
gy a
nd
Elec
troni
c R
ecor
ds
(IC
C =
0.9
3)
Ong
oing
M
onito
ring
(IC
C =
0.5
7)
Qua
lity
Man
agem
ent a
nd
Out
com
e M
easu
rem
ent
(IC
C =
0.8
3)
Car
le
77
Was
hing
ton
Uni
vers
ity
76
Car
le
88
Qua
lity
Onc
olog
y 10
0 C
arle
91
QM
ed
73
Jew
ish
Hom
e an
d H
ospi
tal
69
Qua
lity
Onc
olog
y 75
C
enV
aNet
82
W
ashi
ngto
n U
nive
rsity
86
Cor
Solu
tions
65
C
arle
67
U
nive
rsity
of
Mar
ylan
d 71
A
vera
77
Q
ualit
y O
ncol
ogy
82
Ave
ra
50
Cor
Solu
tions
67
C
enV
aNet
71
C
orSo
lutio
ns
77
Geo
rget
own
77
Med
ical
Car
e D
evel
opm
ent
35
Med
ical
Car
e D
evel
opm
ent
64
Cor
Solu
tions
69
H
ealth
Qua
lity
Partn
ers
77
QM
ed
77
Geo
rget
own
31
Mer
cy
64
Cha
rlest
own
63
QM
ed
77
Cen
VaN
et
68
Cen
VaN
et
23
Geo
rget
own
60
Med
ical
Car
e D
evel
opm
ent
63
Car
le
73
Hos
pice
of t
he
Val
ley
64
Was
hing
ton
Uni
vers
ity
23
Hos
pice
of t
he
Val
ley
60
Was
hing
ton
Uni
vers
ity
63
Cha
rlest
own
73
Hea
lth Q
ualit
y Pa
rtner
s 64
Qua
lity
Onc
olog
y 23
A
vera
55
G
eorg
etow
n 52
W
ashi
ngto
n U
nive
rsity
73
C
orSo
lutio
ns
59
Cha
rlest
own
19
Cen
VaN
et
55
Mer
cy
50
Hos
pice
of t
he
Val
ley
68
Mer
cy
55
Uni
vers
ity o
f M
aryl
and
19
Hea
lth Q
ualit
y Pa
rtner
s 55
Q
Med
50
G
eorg
etow
n 64
M
edic
al C
are
Dev
elop
men
t 50
H
ealth
Qua
lity
Partn
ers
15
QM
ed
50
Ave
ra
38
Mer
cy
64
Cha
rlest
own
46
Mer
cy
15
Cha
rlest
own
45
Jew
ish
Hom
e an
d H
ospi
tal
27
Med
ical
Car
e D
evel
opm
ent
41
Ave
ra
14
Hos
pice
of t
he
Val
ley
12
Qua
lity
Onc
olog
y 33
H
ealth
Qua
lity
Partn
ers
19
Uni
vers
ity o
f M
aryl
and
41
Uni
vers
ity o
f M
aryl
and
9 Je
wis
h H
ome
and
Hos
pita
l 0
Uni
vers
ity o
f M
aryl
and
7 H
ospi
ce o
f the
V
alle
y 19
Je
wis
h H
ome
and
Hos
pita
l 32
Je
wis
h H
ome
and
Hos
pita
l 5
Ran
ge
77
Ran
ge
69
Ran
ge
69
Ran
ge
68
Ran
ge
86
Ave
rage
32
A
vera
ge
55
Ave
rage
55
A
vera
ge
68
Ave
rage
56
So
urce
: R
ound
ed m
eans
of t
wo
inde
pend
ent r
atin
g sc
ores
of e
ach
prog
ram
by
eval
uato
r res
earc
h st
aff.
Rat
ers c
onsu
lted
prog
ram
doc
umen
ts, t
elep
hone
and
site
vis
it in
terv
iew
not
es, a
nd e
valu
atio
n ca
se st
udie
s and
eva
luat
ion
1st y
ear r
epor
ts to
com
plet
e st
ruct
ured
ass
essm
ent f
orm
s. T
he fo
rms a
sked
a se
ries o
f que
stio
ns o
n th
e 10
dom
ains
list
ed in
the
colu
mn
head
ings
. N
otes
: Th
e IC
C is
a m
easu
re o
f the
con
sist
ency
or r
elia
bilit
y of
sco
rers
� ass
essm
ents
of p
rogr
ams.
The
clo
ser t
he v
alue
s ar
e to
1, t
he g
reat
er th
e am
ount
of t
he v
aria
tion
in s
core
s th
at is
due
to
varia
tion
amon
g pr
ogra
ms,
and
the
less
it is
due
to v
aria
tion
in s
corin
g pr
actic
es a
mon
g sc
orer
s. B
y co
nven
tion,
val
ues
from
0.8
to 1
.0 a
re c
alle
d �e
xcel
lent
,� fr
om 0
.6 to
0.8
�go
od,�
from
0.
4 to
0.6
�m
oder
ate,
� an
d 0.
4 or
less
�fa
ir to
poo
r� (L
andi
s and
Koc
h 19
77).
Ea
ch d
omai
n co
nsis
ted
of s
ever
al q
uest
ions
. A
few
exa
mpl
es o
f que
stio
n to
pics
with
in e
ach
dom
ain
are:
(1)
Pro
gram
Sta
ffin
g�tra
inin
g an
d ba
ckgr
ound
of c
are
coor
dina
tors
, sup
ervi
sion
of
car
e co
ordi
nato
rs;
(2)
Initi
al A
sses
smen
t�us
e of
sta
ndar
dize
d as
sess
men
t in
stru
men
ts,
the
brea
dth
of a
reas
cov
ered
in
the
initi
al a
sses
smen
t; (3
) Pr
oble
m I
dent
ifica
tion
and
Car
e Pl
anni
ng�
prod
uctio
n of
a c
are
plan
, the
com
preh
ensi
vene
ss o
f ca
re p
lans
; (4)
Pat
ient
Edu
catio
n�us
e of
a c
urric
ulum
, ass
essm
ent o
f pa
tient
s� m
aste
ry o
f th
e m
ater
ial;
(5)
Impr
ovin
g C
omm
unic
atio
n an
d C
oord
inat
ion�
prog
ram
res
pons
e to
ER
vis
its o
r un
plan
ned
hosp
italiz
atio
ns w
ith p
lans
to p
reve
nt r
eocc
urre
nce,
nat
ure
and
exte
nt o
f co
mm
unic
atio
ns b
etw
een
care
co
ordi
nato
rs a
nd p
hysi
cian
s; (
6) I
mpr
ovin
g Pr
ovid
er P
ract
ice�
use
of e
vide
nce-
base
d gu
idel
ines
by
phys
icia
ns a
nd c
are
coor
dina
tors
, use
of
educ
atio
nal w
orks
hops
or
loca
l phy
sici
an
opin
ion
lead
ers;
(7) S
ervi
ce a
nd R
esou
rce
Arr
angi
ng�
prog
ram
acc
ess t
o so
cial
wor
kers
, pro
gram
rela
tions
hips
with
com
mun
ity-b
ased
age
ncie
s; (8
) Inf
orm
atio
n Te
chno
logy
and
Ele
ctro
nic
Rec
ords
�pr
esen
ce o
f an
elec
troni
c ca
re m
anag
emen
t rec
ord
syst
em, u
se o
f hom
e m
onito
ring
tech
nolo
gy; (
9) O
ngoi
ng M
onito
ring�
pres
ence
of p
roto
cols
or s
yste
m fo
r dec
idin
g fr
eque
ncy
of m
onito
ring,
pre
senc
e of
pro
toco
l fo
r co
nten
t of
mon
itorin
g co
ntac
ts;
and
(10)
Qua
lity
Man
agem
ent
and
Out
com
e M
easu
rem
ent�
desi
gnat
ion
of a
sta
ff m
embe
r re
spon
sibl
e fo
r pe
rfor
min
g qu
ality
ass
essm
ent a
nd im
prov
emen
t act
iviti
es, p
rogr
am-w
ide
repo
rting
of p
rogr
am p
erfo
rman
ce.
a Giv
en th
e fa
ir to
poo
r IC
C v
alue
s of t
he sc
ores
for t
hese
two
dom
ains
, les
s im
porta
nce
or w
eigh
t sho
uld
be a
ttach
ed to
thes
e sc
ores
. ER
= e
mer
genc
y ro
om; I
CC
= in
tracl
ass c
orre
latio
n co
effic
ient
.

66
widest ranges were the Quality Management and Outcome Measurement domain, with scores
ranging from 5 to 91, and the Improving Provider Practice domain, with scores between 0 and
77. Differences between the highest and lowest scores in the remaining six domains ranged from
60 to 82, with most domains having a 70-point difference.
There was also wide variability in the scores within each program across domains, with
several programs ranking both in the top and the bottom across two or more domains
(Exhibit II.10). Despite this variability, a few programs had high ranking scores for several
domains, namely, Carle, which had six scores in the top quintile (the top three programs), and
Mercy and Quality Oncology, each with four scores in the top quintile. Likewise, there were a
few programs with several rating scores in the bottom quintiles, namely, the Jewish Home and
Hospital, with nine, and the University of Maryland, with seven. Three programs exhibited a
pattern of having high scores in a single domain and low or lower scores in all the others (the
Jewish Home and Hospital, the University of Maryland, and QMed), but there appeared to be no
other general categories of patterns.

67
EXHIBIT II.10
QUINTILES OF DEMONSTRATION PROGRAMS� RATING SCORES, BY DOMAIN
Q
uint
ile
Pro
gram
Sta
ffin
g (I
CC
= 0
.69)
Initi
al A
sses
smen
t (IC
C =
0.0
5)a
Pro
blem
Iden
t.& C
are
Plan
. (IC
C =
0.2
3)a
Pat
ient
Edu
catio
n (I
CC
= 0
.90)
Impr
. Com
m. a
nd C
oord
. (IC
C =
0.8
0)
Impr
ovin
g Pr
ovid
er P
ract
ice
(IC
C =
0.8
2)
Ser
vice
& R
esou
rce
Arr
ange
. (IC
C =
0.7
2)
Info
. Tec
h. &
Ele
c. R
ecor
ds (I
CC
= 0
.93)
Ong
oing
Mon
itorin
g (I
CC
= 0
.57)
Qua
l. M
gt. &
Out
com
e M
eas.
(IC
C =
0.8
3)
Com
bine
d Sc
ore
(IC
C =
0.8
6)
Avera 1 $ $ 2 $ $ $ 3 $ 4 $ $ $ 5 $ $
Carle 1 $ $ $ $ $ $ $ 2 $ $ $ 3 $ 4 5
CenVaNet 1 $ $ 2 $ $ $ 3 $ $ $ $ 4 $ $ 5
Charlestown 1 $ 2 $ $ $ 3 $ $ $ 4 $ $ $ 5 $
CorSolutions 1 $ $ $ 2 $ $ $ $ $ $ 3 $ 4 $ 5

EXHIBIT II.10 (continued)
68
Q
uint
ile
Pro
gram
Sta
ffin
g (I
CC
= 0
.69)
Initi
al A
sses
smen
t (IC
C =
0.0
5)a
Pro
blem
Iden
t.& C
are
Plan
. (IC
C =
0.2
3)a
Pat
ient
Edu
catio
n (I
CC
= 0
.90)
Impr
. Com
m. a
nd C
oord
. (IC
C =
0.8
0)
Impr
ovin
g Pr
ovid
er P
ract
ice
(IC
C =
0.8
2)
Ser
vice
& R
esou
rce
Arr
ange
. (IC
C =
0.7
2)
Info
. Tec
h. &
Ele
c. R
ecor
ds (I
CC
= 0
.93)
Ong
oing
Mon
itorin
g (I
CC
= 0
.57)
Qua
l. M
gt. &
Out
com
e M
eas.
(IC
C =
0.8
3)
Com
bine
d Sc
ore
(IC
C =
0.8
6)
Georgetown 1 $ $ 2 $ $ $ $ $ 3 $ $ $ 4 $ 5
Health Quality Partners 1 $ $ 2 $ $ $ 3 $ $ $ 4 $ $ 5 $
Hospice of the Valley 1 2 $ $ 3 $ $ $ 4 $ $ $ $ 5 $ $
Jewish Home and Hospital 1 $ 2 3 4 5 $ $ $ $ $ $ $ $ $ $
Medical Care Development 1 2 $ $ 3 $ $ $ $ $ 4 $ $ $ 5 $

EXHIBIT II.10 (continued)
69
Q
uint
ile
Pro
gram
Sta
ffin
g (I
CC
= 0
.69)
Initi
al A
sses
smen
t (IC
C =
0.0
5)a
Pro
blem
Iden
t.& C
are
Plan
. (IC
C =
0.2
3)a
Pat
ient
Edu
catio
n (I
CC
= 0
.90)
Impr
. Com
m. a
nd C
oord
. (IC
C =
0.8
0)
Impr
ovin
g Pr
ovid
er P
ract
ice
(IC
C =
0.8
2)
Ser
vice
& R
esou
rce
Arr
ange
. (IC
C =
0.7
2)
Info
. Tec
h. &
Ele
c. R
ecor
ds (I
CC
= 0
.93)
Ong
oing
Mon
itorin
g (I
CC
= 0
.57)
Qua
l. M
gt. &
Out
com
e M
eas.
(IC
C =
0.8
3)
Com
bine
d Sc
ore
(IC
C =
0.8
6)
Mercy 1 $ $ $ $ $ 2 $ 3 $ 4 $ $ $ 5 $
QMed 1 $ 2 $ $ 3 4 $ $ $ $ $ 5 $ $ $
Quality Oncology 1 $ $ $ $ 2 3 $ $ 4 $ $ 5 $ $ $
University of Maryland 1 $ 2 3 4 $ $ 5 $ $ $ $ $ $ $ $
Washington University 1 $ $ 2 3 $ $ $ $ $ $ 4 $ $ 5 $ Source: Means of two independent rating scores of each program by evaluator research staff. Raters consulted
program documents, telephone and site visit interview notes, and evaluation case studies and evaluation 1st year reports to complete structured assessment forms. The forms asked a series of questions on the 10 domains listed in the column headings.
EXHIBIT II.10 (continued)
70
____________________________________________________________________________________________ Notes: The ICC is a measure of the consistency or reliability of scorers� assessments of programs. The closer the
values are to 1, the greater the amount of the variation in scores that is due to variation between programs, and the less it is due to variation among scorers in scoring practices. By convention, values from 0.8 to 1.0 are called �excellent,� from 0.6 to 0.8 �good,� from 0.4 to 0.6 �moderate,� and 0.4 or less �fair to poor� (Landis and Koch 1977).
Because there were 15 programs, each quintile consists of 3 programs. aGiven the fair to poor ICC values of the scores for these two domains, less importance or weight should be attached to these scores. ICC = intraclass correlation coefficient; Info. Tech. & Elec. Records = Information Technology and Electronic Records; Impr. Comm. & Coord. = Improving Communication and Coordination; Problem Ident. & Care Plan. = Problem Identification and Care Planning; Qual. Mgt. & Outcome Meas. = Quality Management and Outcome Measurement; Service & Resource Arrange. = Service and Resource Arrangement.

71
III. WHO ENROLLED IN THE DEMONSTRATION?
All of the programs participating in the Medicare Coordinated Care Demonstration (MCCD)
recruited and enrolled patients based on the target and exclusion criteria that they developed.
This chapter describes the enrollment strategies used by the organizations that hosted the
15 programs. It then compares actual enrollments and disenrollments after 2 years of operations
with program targets. It also describes the patients who enrolled in each of the 15 programs by
presenting demographic data, preenrollment characteristics and costs, diagnoses, and a
comparison of participants and potentially eligible nonparticipants based on cost waiver
calculations conducted by Mathematica Policy Research, Inc. (MPR).9 Finally, the chapter
compares the preenrollment characteristics of treatment and control group members. The
chapter draws on qualitative interviews with program staff, as well as on Medicare claims data,
data collected by each of the programs, and a patient survey conducted by MPR.
A. PATIENT IDENTIFICATION
Programs generally adopted one of two primary approaches to identifying beneficiaries who
would be asked to participate: (1) obtaining lists of prospective enrollees from hospitals or
health care networks (the approach used by nine programs), or (2) recruiting physicians who then
referred patients to the program (used by six programs; see Table III.1). The six programs that
had hospitals or health care systems as their host organizations generally identified potentially
9 In August 2001, MPR provided an estimate of expected costs and net savings to the Centers for Medicare &
Medicaid Services (CMS) from the demonstration for each of the 15 programs as a part of an Office of Management and Budget (OMB) waiver package. This waiver allowed demonstration programs, within the context of a coordinated care program, to be reimbursed for providing additional items and services not usually allowed under Medicare Parts A and B. However, Section 4016(e)(1)(B) of Public Law 105-33 (42 U.S.C. 1395b-1) requires the Secretary of the Department of Health and Human Services to ensure that the aggregate payments made by Medicare do not exceed the amount that Medicare would have paid if the demonstration projects under this section had not been implemented.
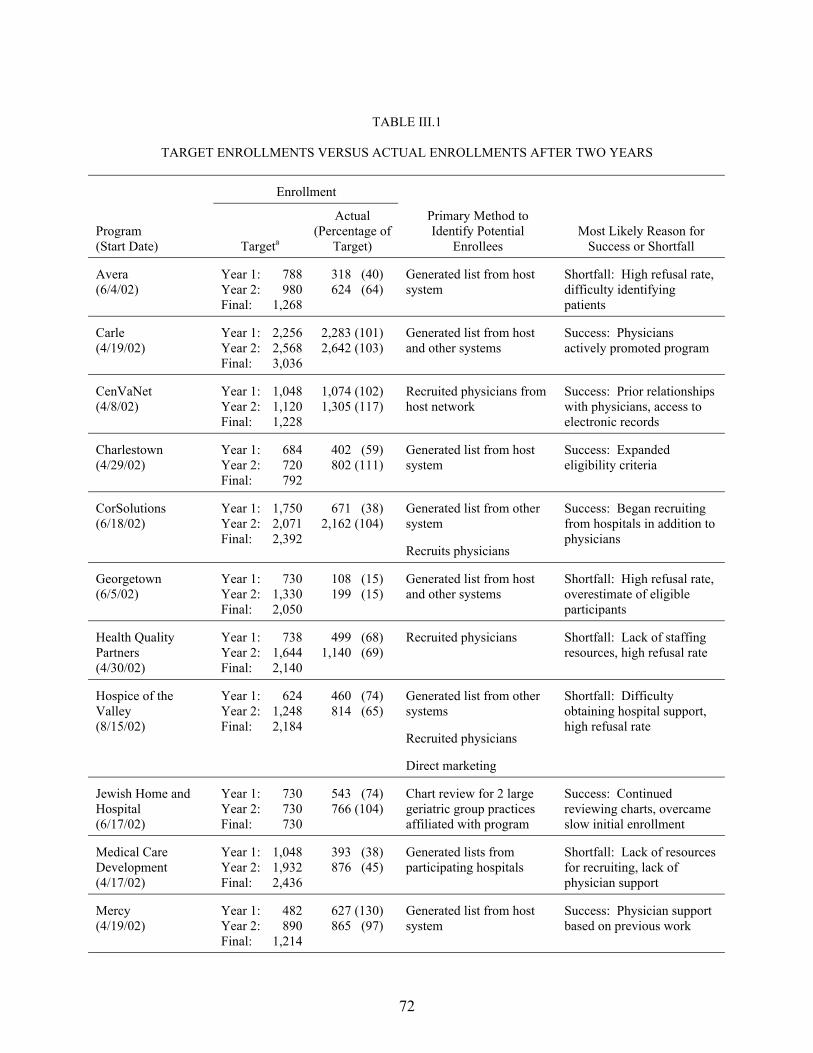
72
TABLE III.1
TARGET ENROLLMENTS VERSUS ACTUAL ENROLLMENTS AFTER TWO YEARS
Enrollment
Program (Start Date) Targeta
Actual (Percentage of
Target)
Primary Method to Identify Potential
Enrollees Most Likely Reason for
Success or Shortfall
Avera (6/4/02)
Year 1: 788 Year 2: 980 Final: 1,268
318 (40) 624 (64)
Generated list from host system
Shortfall: High refusal rate, difficulty identifying patients
Carle (4/19/02)
Year 1: 2,256 Year 2: 2,568 Final: 3,036
2,283 (101) 2,642 (103)
Generated list from host and other systems
Success: Physicians actively promoted program
CenVaNet (4/8/02)
Year 1: 1,048 Year 2: 1,120 Final: 1,228
1,074 (102) 1,305 (117)
Recruited physicians from host network
Success: Prior relationships with physicians, access to electronic records
Charlestown (4/29/02)
Year 1: 684 Year 2: 720 Final: 792
402 (59) 802 (111)
Generated list from host system
Success: Expanded eligibility criteria
CorSolutions (6/18/02)
Year 1: 1,750 Year 2: 2,071 Final: 2,392
671 (38) 2,162 (104)
Generated list from other system
Recruits physicians
Success: Began recruiting from hospitals in addition to physicians
Georgetown (6/5/02)
Year 1: 730 Year 2: 1,330 Final: 2,050
108 (15) 199 (15)
Generated list from host and other systems
Shortfall: High refusal rate, overestimate of eligible participants
Health Quality Partners (4/30/02)
Year 1: 738 Year 2: 1,644 Final: 2,140
499 (68) 1,140 (69)
Recruited physicians Shortfall: Lack of staffing resources, high refusal rate
Hospice of the Valley (8/15/02)
Year 1: 624 Year 2: 1,248 Final: 2,184
460 (74) 814 (65)
Generated list from other systems
Recruited physicians
Direct marketing
Shortfall: Difficulty obtaining hospital support, high refusal rate
Jewish Home and Hospital (6/17/02)
Year 1: 730 Year 2: 730 Final: 730
543 (74) 766 (104)
Chart review for 2 large geriatric group practices affiliated with program
Success: Continued reviewing charts, overcame slow initial enrollment
Medical Care Development (4/17/02)
Year 1: 1,048 Year 2: 1,932 Final: 2,436
393 (38) 876 (45)
Generated lists from participating hospitals
Shortfall: Lack of resources for recruiting, lack of physician support
Mercy (4/19/02)
Year 1: 482 Year 2: 890 Final: 1,214
627 (130) 865 (97)
Generated list from host system
Success: Physician support based on previous work

TABLE III.1 (continued)
73
Enrollment
Program (Start Date) Targeta
Actual (Percentage of
Target)
Primary Method to Identify Potential
Enrollees Most Likely Reason for
Success or Shortfall
QMed (7/12/02)
Year 1: 782 Year 2: 926 Final: 1,372
1,404 (180) 1,454 (157)
Recruited physicians Success: Physician support based on previous experience with host
Quality Oncology (9/18/02)
Year 1: 2,132 Year 2: 2,420 Final: 2,852
63 (6) 141 (6)
Recruited physicians Shortfall: Lack of physician support
University of Maryland (6/28/02)
Year 1: 678 Year 2: 678 Final: 678
29 (4) 137 (20)
Generated lists from host and other systems
Shortfall: High refusal rate, high rate of ineligibility among referrals
Washington University (8/16/02)
Year 1: 2,000 Year 2: 2,000 Final: 2,000
1,425 (71) 2,038 (102)
Generated list from host systems
Success: Intensive marketing to physicians and patients
Source: Program documents, Mathematica Policy Research, Inc. enrollment files, and interviews with program
staff during second year of program operations. aThe final enrollment is the number of beneficiaries that the program expects to have by the end of the demonstration. Programs differed in their planned timelines for reaching full enrollment.
74
eligible beneficiaries primarily from lists of host-system patients, using automated screening
along broad program eligibility criteria, such as diagnosis and Medicare coverage. Rather than
screen patients based on particular diagnoses, one of the six programs partnered with a
commercial disease management vendor and used the vendor�s proprietary algorithm to identify
high-risk patients for the program from the program�s physician network records. Three of the
programs also recruited other health systems to provide lists of their patients. Two programs did
so during their first year of operations; the third started recruiting outside hospitals and physician
practices toward the end of the first year. Of the three other programs that recruited from lists
provided by hospitals or health systems, one was a retirement community that included its own
primary care physicians in the program, and one recruited from a few local hospitals and a large
hospital group practice list. The third, which partnered with 17 hospitals in Maine, identified
potentially eligible beneficiaries while the beneficiaries were inpatients at 1 of the hospitals by
reviewing admission logs daily.
Seven of the nine programs that first identified patients from electronic lists subsequently
contacted the identified patients� physicians to discuss the program. Some of the seven programs
then asked the physicians for permission to contact their patients. Two programs that relied on
electronic contact lists contacted patients directly, without first approaching the patients�
physicians. Eight of the nine programs also welcomed direct physician referrals and hoped that
the numbers of referrals would increase as the programs became better known. (The ninth
program enrolled only recently discharged inpatients.) During their first year, however, the eight
programs identified the majority of their potential enrollees through the automated review of
patient databases.
Six programs used primarily the second recruitment method of enlisting physicians to refer
patients. The five programs with care coordination service providers as hosts first recruited
75
physicians who wished to have their patients participate in the demonstration and then worked
with each physician to generate lists of potentially eligible and appropriate patients. Of these,
one program began reviewing lists of patients generated by local hospitals after the first year to
supplement the physician referrals. Rather than recruit patients directly from its own care
system, the sixth program developed a partnership with two large geriatric physician group
practices prior to implementation.
After they identified potentially eligible patients, 12 of the 15 programs introduced
themselves to patients by sending letters signed by the patients� own physicians. (One program�s
letters were signed by the program�s medical director.) Of the remaining three programs, two
had their care coordinators telephone identified patients instead of sending letters. (In one of
these two programs the care coordinator also introduced the program during in-person visits with
hospitalized patients who had been identified while they were still in the hospital.) The
enrollment staff of the third program that did not use letters first contacted patients while the
patients were at the physician practice clinics that had identified them for the program. The
clinics had provided the program in advance with lists of patients scheduled for clinic visits. The
program�s enrollment coordinator then determined whether the patients were eligible for
Medicare and examined their medical charts to verify that the patients had one of the program�s
target diagnoses. During the clinic visits, their physicians briefly discussed the program and
asked whether the patients would like to meet with the enrollment coordinator at that time.
Program staff of most of the 15 programs reported that physicians were too busy and visits
too short for the physicians to promote the program to patients directly. Program staff handled
most of the �marketing� of the program that followed the mailing of the introductory letter or
during the introductory telephone call or in-person encounter. The staff did report that, if
76
patients specifically asked physicians whether they should participate, most physicians
encouraged them to do so.
B. ENROLLMENT AFTER 2 YEARS
1. Patient Enrollment
The programs had different goals for the number of beneficiaries that they planned to enroll,
ranging from 678 to 3,036 enrollees, split equally between treatment and control groups
(Table III.1).10 Only three programs planned to reach full enrollment by the end of their first
year, and to continue to recruit new patients only as replacements to patients lost through
attrition. The remaining programs planned to continue enrolling new patients through their
second year of operation, and to then gradually decrease the number of new patients recruited to
include only replacements for participants who died or disenrolled.
Although only four programs met (or exceeded) their first-year enrollment targets, four
additional programs were able to meet their second-year targets. Seven programs failed to reach
either their first- or second-year enrollment targets. Four of the seven were able to enroll enough
patients to meet about one-half of their target enrollments; the remaining three fell far short of
their targets.
Three of the four programs that met both their first- and second-year enrollment targets used
centralized patient databases to identify patients. They also enjoyed strong existing
organizational links to and good relationships with the patients� physicians before the
demonstration began, which likely led physicians to enthusiastically encourage patients to enroll.
10 The one exception is CorSolutions. That organization�s treatment group had two arms, one of which
consisted of people who received prescription drugs if they did not already have coverage, and if had an income under 200 percent of the federal poverty level. The overall goal was to randomize 500 patients into the treatment group arm that received the drug benefit, 500 patients into the treatment group that did not receive the benefit, and 750 into the control group. Thus, the treatment-control ratio was 4:3.
77
One program also marketed the program to network physicians before the start of the
demonstration; another had good relationships with area physicians and was considered a well-
regarded disease management provider with long-standing ties to managed care plans in a
service area with a high level of managed care penetration.
Four additional programs overcame low first-year enrollments to meet their second-year
enrollment targets. Two of the four programs relied on patient lists supplied by the program host
to identify patients but faced higher-than-expected patient refusal rates during their first year.
One program also found that its eligibility criteria were overly restrictive; as a result, it expanded
its guidelines to include patients who had chronic obstructive pulmonary disease (COPD).
During its second year, that program also began recruiting patients from a third retirement
community. A second program increased its outreach efforts to physicians and other providers,
asking them to encourage their patients to enroll in the program. During its first year, the third
program had recruited exclusively from its physician referral network, but it fell short of its
enrollment target. To address this shortfall, during the second year, the program began
identifying patients from lists generated by local hospitals; it met its second-year target. The
fourth program met its second-year enrollment target without having to alter its patient
identification and recruitment strategy; as it had done during its first year, it continued to review
charts at two large geriatric group practices. The remaining programs did not meet their first- or
second-year enrollment targets. Five of those programs identified patients using lists generated
by health care providers or networks, whereas two relied on local physicians to provide referrals
to the demonstration.
Program staff provided a variety of reasons to explain these enrollment shortfalls. Five
programs cited higher-than-expected patient refusal rates. In addition, one of the five programs
also indicated that it did not have enough staff resources to devote adequate time to enrollment;

78
another attributed its low enrollment to inadequate physician support for the program. In
particular, a number of physicians with relatively larger practices in this program�s service area
were hostile because they had had negative experiences with the disease management vendor
when it served as a managed care subcontractor; program staff reported that the vendor�s focus
on keeping the costs of chemotherapy agents low had irritated physicians who were used to
greater �price flexibility.�
The experiences of the 15 programs during their first 2 years of operations offer some
lessons about patient recruitment. Physician support seemed to be the key to the programs�
ability to meet their enrollment targets, rather than the particular technique used to recruit
patients. Of the programs that obtained lists of prospective enrollees from hospitals or health
care networks, four programs fell short of their enrollment targets and five programs met (or
exceeded) theirs. Of the programs that recruited physicians to provide patient referrals, two met
their enrollment targets and two fell short. Finally, two programs tried both methods of
identifying and recruiting patients; one program met its second-year enrollment target and the
other fell short.
Regardless of the recruitment strategy that they picked, the programs with strong, existing
relationships with local health care providers were able to meet their enrollment targets. Six of
the eight programs that met their first- or second-year enrollment targets had strong preexisting
ties to participating physicians; only two of the seven programs that failed to reach either their
first- or second year-enrollment targets had had any previous experience working with
participating physicians. One of the programs that fell short of its first-year enrollment target
increased its outreach efforts to physicians during its second year and was able to surpass its
target. Compared with the programs that failed to meet their enrollment targets, the ones that
were able to meet their targets also established relatively broad eligibility criteria and had a

79
larger pool of potential patients from which to recruit (Table III.2); however, all of the programs
had sufficient numbers of potentially eligible participants.
Seven programs accepted patients who had only one target diagnosis. (Five programs
recruited patients who had a primary diagnosis of congestive heart failure [CHF]; one program
recruited patients who had a primary diagnosis of coronary artery disease [CAD]; and one
program recruited only patients who had cancer.) Only two of the seven programs managed to
meet their target enrollments. The eight remaining programs recruited patients with diverse
primary conditions; of those, only two failed to meet their target enrollments. Staff from all
15 programs noted that recruiting patients took more staff time than expected, and that
recruitment made it difficult for care coordinators to balance their workloads.
2. Patient Disenrollment
According to data that each program prepared for the evaluation, substantial numbers of
patients who had enrolled during the first year of operations died or disenrolled during the first
year after the month of randomization (Table III.2). The rates at which patients left each
program because they died, lost their eligibility, or voluntarily chose to disenroll varied from
slightly more than 2 percent to more than 45 percent. Eight programs had a combined death and
disenrollment rate of between 10 and 20 percent. Three programs experienced patients leaving
the program at a rate between 20 and 40 percent. Three programs reported that more than
40 percent of their patients left. The average length of enrollment during the first year after
enrolling for all the programs was 10.8 months. Programs that had lower-than-average patient
tenures experienced correspondingly higher rates of patient death or disenrollment.
Although the disenrollment rates were generally high, the reasons for leaving the various
programs are varied, with few patients (3 percent overall) choosing to leave the
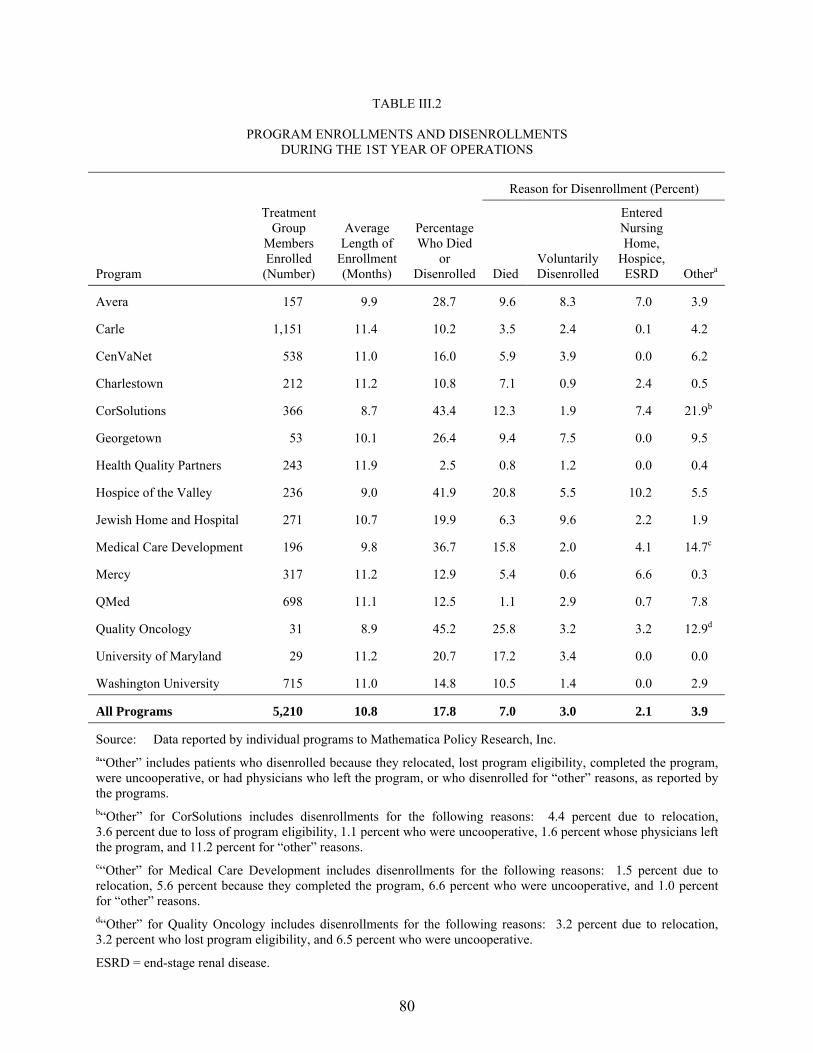
80
TABLE III.2
PROGRAM ENROLLMENTS AND DISENROLLMENTS DURING THE 1ST YEAR OF OPERATIONS
Reason for Disenrollment (Percent)
Program
Treatment Group
Members Enrolled (Number)
Average Length of
Enrollment(Months)
Percentage Who Died
or Disenrolled Died
Voluntarily Disenrolled
Entered Nursing Home,
Hospice, ESRD Othera
Avera 157 9.9 28.7 9.6 8.3 7.0 3.9
Carle 1,151 11.4 10.2 3.5 2.4 0.1 4.2
CenVaNet 538 11.0 16.0 5.9 3.9 0.0 6.2
Charlestown 212 11.2 10.8 7.1 0.9 2.4 0.5
CorSolutions 366 8.7 43.4 12.3 1.9 7.4 21.9b
Georgetown 53 10.1 26.4 9.4 7.5 0.0 9.5
Health Quality Partners 243 11.9 2.5 0.8 1.2 0.0 0.4
Hospice of the Valley 236 9.0 41.9 20.8 5.5 10.2 5.5
Jewish Home and Hospital 271 10.7 19.9 6.3 9.6 2.2 1.9
Medical Care Development 196 9.8 36.7 15.8 2.0 4.1 14.7c
Mercy 317 11.2 12.9 5.4 0.6 6.6 0.3
QMed 698 11.1 12.5 1.1 2.9 0.7 7.8
Quality Oncology 31 8.9 45.2 25.8 3.2 3.2 12.9d
University of Maryland 29 11.2 20.7 17.2 3.4 0.0 0.0
Washington University 715 11.0 14.8 10.5 1.4 0.0 2.9
All Programs 5,210 10.8 17.8 7.0 3.0 2.1 3.9
Source: Data reported by individual programs to Mathematica Policy Research, Inc. a�Other� includes patients who disenrolled because they relocated, lost program eligibility, completed the program, were uncooperative, or had physicians who left the program, or who disenrolled for �other� reasons, as reported by the programs. b�Other� for CorSolutions includes disenrollments for the following reasons: 4.4 percent due to relocation, 3.6 percent due to loss of program eligibility, 1.1 percent who were uncooperative, 1.6 percent whose physicians left the program, and 11.2 percent for �other� reasons. c�Other� for Medical Care Development includes disenrollments for the following reasons: 1.5 percent due to relocation, 5.6 percent because they completed the program, 6.6 percent who were uncooperative, and 1.0 percent for �other� reasons. d�Other� for Quality Oncology includes disenrollments for the following reasons: 3.2 percent due to relocation, 3.2 percent who lost program eligibility, and 6.5 percent who were uncooperative.
ESRD = end-stage renal disease.
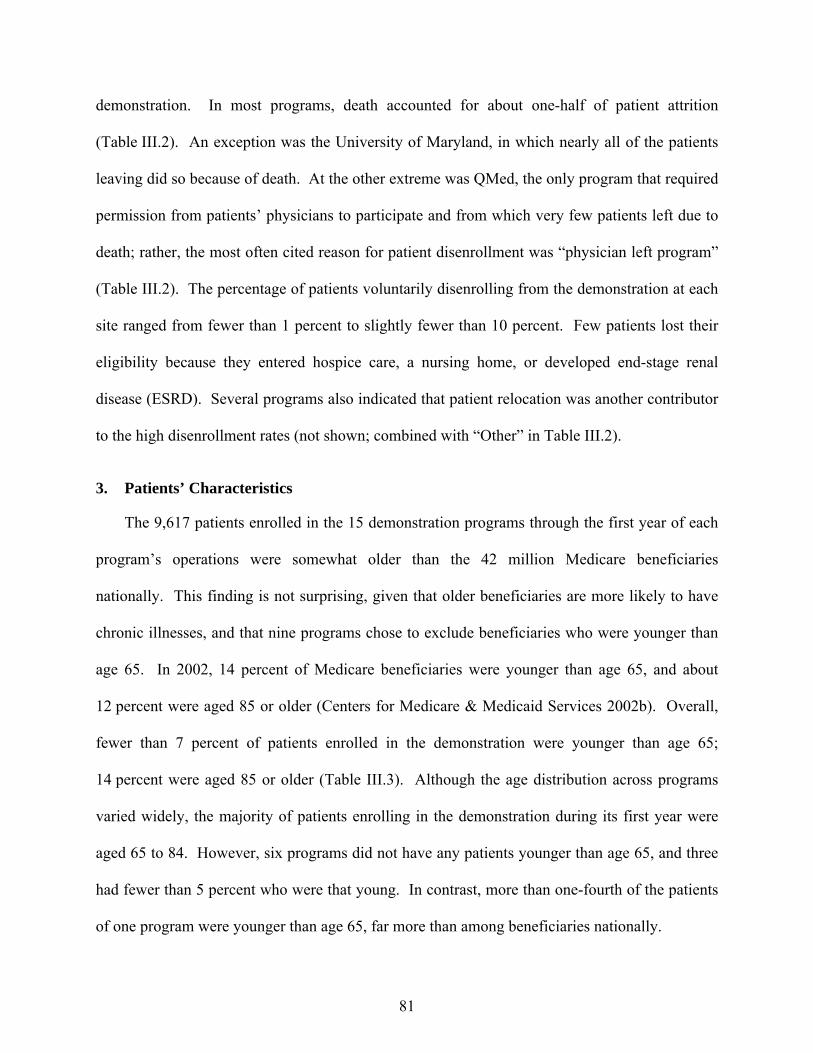
81
demonstration. In most programs, death accounted for about one-half of patient attrition
(Table III.2). An exception was the University of Maryland, in which nearly all of the patients
leaving did so because of death. At the other extreme was QMed, the only program that required
permission from patients� physicians to participate and from which very few patients left due to
death; rather, the most often cited reason for patient disenrollment was �physician left program�
(Table III.2). The percentage of patients voluntarily disenrolling from the demonstration at each
site ranged from fewer than 1 percent to slightly fewer than 10 percent. Few patients lost their
eligibility because they entered hospice care, a nursing home, or developed end-stage renal
disease (ESRD). Several programs also indicated that patient relocation was another contributor
to the high disenrollment rates (not shown; combined with �Other� in Table III.2).
3. Patients’ Characteristics
The 9,617 patients enrolled in the 15 demonstration programs through the first year of each
program�s operations were somewhat older than the 42 million Medicare beneficiaries
nationally. This finding is not surprising, given that older beneficiaries are more likely to have
chronic illnesses, and that nine programs chose to exclude beneficiaries who were younger than
age 65. In 2002, 14 percent of Medicare beneficiaries were younger than age 65, and about
12 percent were aged 85 or older (Centers for Medicare & Medicaid Services 2002b). Overall,
fewer than 7 percent of patients enrolled in the demonstration were younger than age 65;
14 percent were aged 85 or older (Table III.3). Although the age distribution across programs
varied widely, the majority of patients enrolling in the demonstration during its first year were
aged 65 to 84. However, six programs did not have any patients younger than age 65, and three
had fewer than 5 percent who were that young. In contrast, more than one-fourth of the patients
of one program were younger than age 65, far more than among beneficiaries nationally.
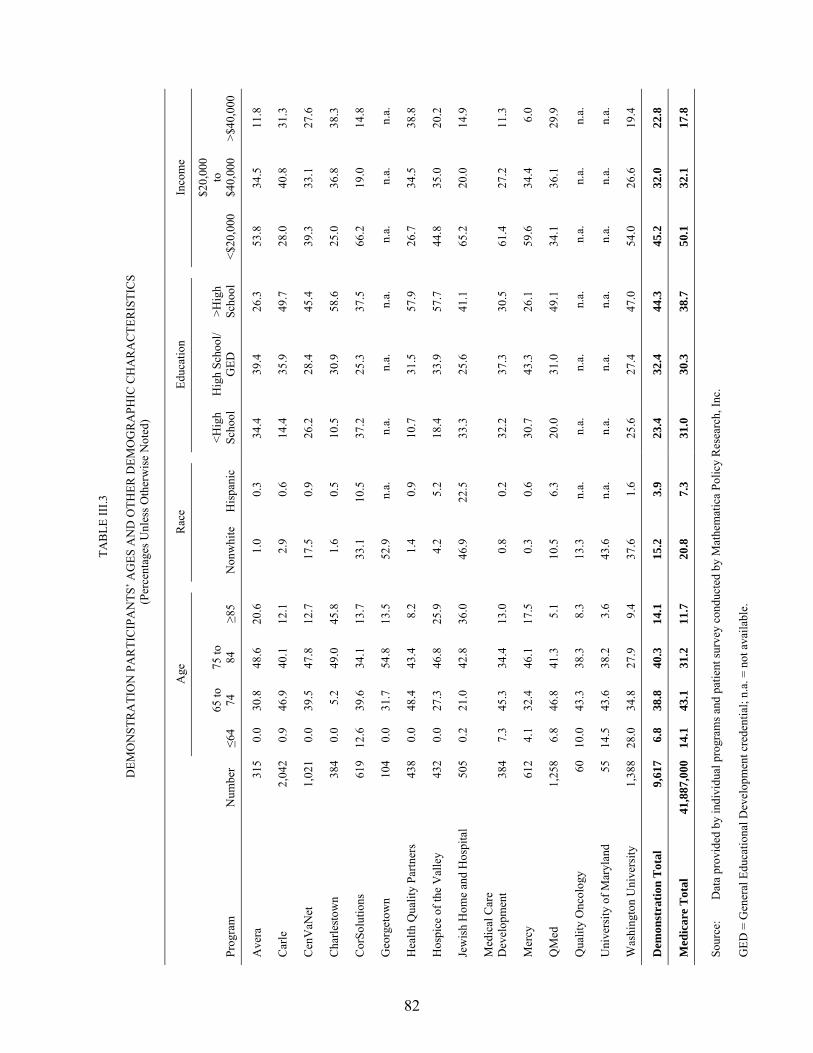
82
TAB
LE II
I.3
D
EMO
NST
RA
TIO
N P
AR
TIC
IPA
NTS
� AG
ES A
ND
OTH
ER D
EMO
GR
APH
IC C
HA
RA
CTE
RIS
TIC
S (P
erce
ntag
es U
nles
s Oth
erw
ise
Not
ed)
Age
Rac
e
Educ
atio
n
Inco
me
Prog
ram
N
umbe
r ≤6
4 65
to
74
75 to
84
≥8
5 N
onw
hite
H
ispa
nic
<Hig
h Sc
hool
H
igh
Scho
ol/
GED
>H
igh
Scho
ol
<$20
,000
$20,
000
to
$40,
000
>$40
,000
Ave
ra
315
0.0
30.8
48
.6
20.6
1.
0 0.
3 34
.4
39.4
26
.3
53.8
34
.5
11.8
Car
le
2,04
2 0.
9 46
.9
40.1
12
.1
2.9
0.6
14.4
35
.9
49.7
28
.0
40.8
31
.3
Cen
VaN
et
1,02
1 0.
0 39
.5
47.8
12
.7
17.5
0.
9 26
.2
28.4
45
.4
39.3
33
.1
27.6
Cha
rlest
own
384
0.0
5.2
49.0
45
.8
1.6
0.5
10.5
30
.9
58.6
25
.0
36.8
38
.3
Cor
Solu
tions
61
9 12
.6
39.6
34
.1
13.7
33
.1
10.5
37
.2
25.3
37
.5
66.2
19
.0
14.8
Geo
rget
own
104
0.0
31.7
54
.8
13.5
52
.9
n.a.
n.
a.
n.a.
n.
a.
n.a.
n.
a.
n.a.
Hea
lth Q
ualit
y Pa
rtner
s 43
8 0.
0 48
.4
43.4
8.
2 1.
4 0.
9 10
.7
31.5
57
.9
26.7
34
.5
38.8
Hos
pice
of t
he V
alle
y 43
2 0.
0 27
.3
46.8
25
.9
4.2
5.2
18.4
33
.9
57.7
44
.8
35.0
20
.2
Jew
ish
Hom
e an
d H
ospi
tal
505
0.2
21.0
42
.8
36.0
46
.9
22.5
33
.3
25.6
41
.1
65.2
20
.0
14.9
Med
ical
Car
e D
evel
opm
ent
384
7.3
45.3
34
.4
13.0
0.
8 0.
2 32
.2
37.3
30
.5
61.4
27
.2
11.3
Mer
cy
612
4.1
32.4
46
.1
17.5
0.
3 0.
6 30
.7
43.3
26
.1
59.6
34
.4
6.0
QM
ed
1,25
8 6.
8 46
.8
41.3
5.
1 10
.5
6.3
20.0
31
.0
49.1
34
.1
36.1
29
.9
Qua
lity
Onc
olog
y 60
10
.0
43.3
38
.3
8.3
13.3
n.
a.
n.a.
n.
a.
n.a.
n.
a.
n.a.
n.
a.
Uni
vers
ity o
f Mar
ylan
d 55
14
.5
43.6
38
.2
3.6
43.6
n.
a.
n.a.
n.
a.
n.a.
n.
a.
n.a.
n.
a.
Was
hing
ton
Uni
vers
ity
1,38
8 28
.0
34.8
27
.9
9.4
37.6
1.
6 25
.6
27.4
47
.0
54.0
26
.6
19.4
Dem
onst
ratio
n T
otal
9,
617
6.8
38.8
40
.3
14.1
15
.2
3.9
23.4
32
.4
44.3
45
.2
32.0
22
.8
Med
icar
e T
otal
41
,887
,000
14
.1
43.1
31
.2
11.7
20
.8
7.3
31.0
30
.3
38.7
50
.1
32.1
17
.8
Sour
ce:
Dat
a pr
ovid
ed b
y in
divi
dual
pro
gram
s and
pat
ient
surv
ey c
ondu
cted
by
Mat
hem
atic
a Po
licy
Res
earc
h, In
c.
GED
= G
ener
al E
duca
tiona
l Dev
elop
men
t cre
dent
ial;
n.a.
= n
ot a
vaila
ble.
83
Twenty percent or more of the enrolled patients of four programs were aged 85 or older; in one
of the four programs, nearly one-half the patients were in that age range.
Patients enrolling in the demonstration were generally more likely to be white, to be better
educated, and to have slightly higher incomes than Medicare beneficiaries nationally. However,
wide variations in patient demographics and patients� characteristics were observed across the
programs. Overall, about 15 percent of the demonstration�s participants were nonwhite,
compared with 20 percent nationally; according to patient survey data, slightly fewer than
5 percent of patients identified themselves as Hispanic, whereas 7 percent of Medicare patients
nationally were Hispanic (Centers for Medicare & Medicaid Services 2002b). Across the
15 programs, the ethnic composition of demonstration participants varied. One-third to one-half
of the patients in five programs that targeted urban areas were non-white. In one of the five
programs, 22 percent of enrollees were Hispanic, making this program the most ethnically
diverse one.
Twenty-three percent of demonstration participants reported having less than a high school
education, compared with slightly more than 30 percent among Medicare beneficiaries nationally
(Table III.3). Forty-four percent of demonstration patients had completed some education
beyond high school, compared with 39 percent of all Medicare beneficiaries. However, as with
race, large variations in patients� educational attainment were observed across the 15 programs.
Roughly 50 percent or more of the patients in five programs had education beyond the high
school level; in three of the five programs, fewer than 15 percent of patients enrolled had less
than a high school education, far less than the national Medicare average.
Demonstration participants also had slightly higher incomes than did Medicare beneficiaries,
nationally. In addition, however, self-reported income varied across the 15 programs. Twenty-
three percent of demonstration participants reported having annual incomes greater than $40,000,
84
compared with only 18 percent of Medicare beneficiaries nationwide (Table III.3). Similarly,
only 45 percent of demonstration patients reported having an income of less than $20,000,
compared with 50 percent of all Medicare beneficiaries. Three programs did enroll substantial
numbers of participants with low incomes; the majority of patients enrolled by those programs
had annual incomes of less than $20,000. In contrast, roughly one-third or more of the
participants enrolled by four programs had annual incomes that were higher than $40,000. Those
programs also enrolled the highest percentages of patients with education beyond the high school
level, and, in general, the patients were healthier than the patients in the 11 other programs.
As expected, based on the numbers and types of medical conditions for which they were
treated during the 2 years preceding randomization, patients enrolling in the 15 programs were
sicker than the average Medicare beneficiary (Table III.4). Heart disease was the most
commonly treated condition; more than 90 percent of the patients enrolled in four programs had
been treated for CHF. In five other programs, about 50 to 75 percent of patients had been treated
for CHF during the 2 years before randomization. More than three-fourths of the patients
enrolling in five programs had been treated for CAD during the 2 years prior to random
assignment. These figures also reflect the eligibility criteria that the programs imposed, as well
as the programs� choices about which diagnoses to target. Of the 15 programs, 13 enrolled
patients with CHF, and 4 focused primarily on patients with that diagnosis. In contrast, only
about 45 percent of the Medicare population as a whole reports a diagnosis for heart disease,
which includes both CHF and CAD (Centers for Medicare & Medicaid Services 2002a).
Because most of the programs that targeted CHF also included a recent hospitalization as a part
of their eligibility criteria, programs enrolling primarily patients with a primary diagnosis of
CHF generally also enrolled patients with higher average numbers of annualized hospitalizations.
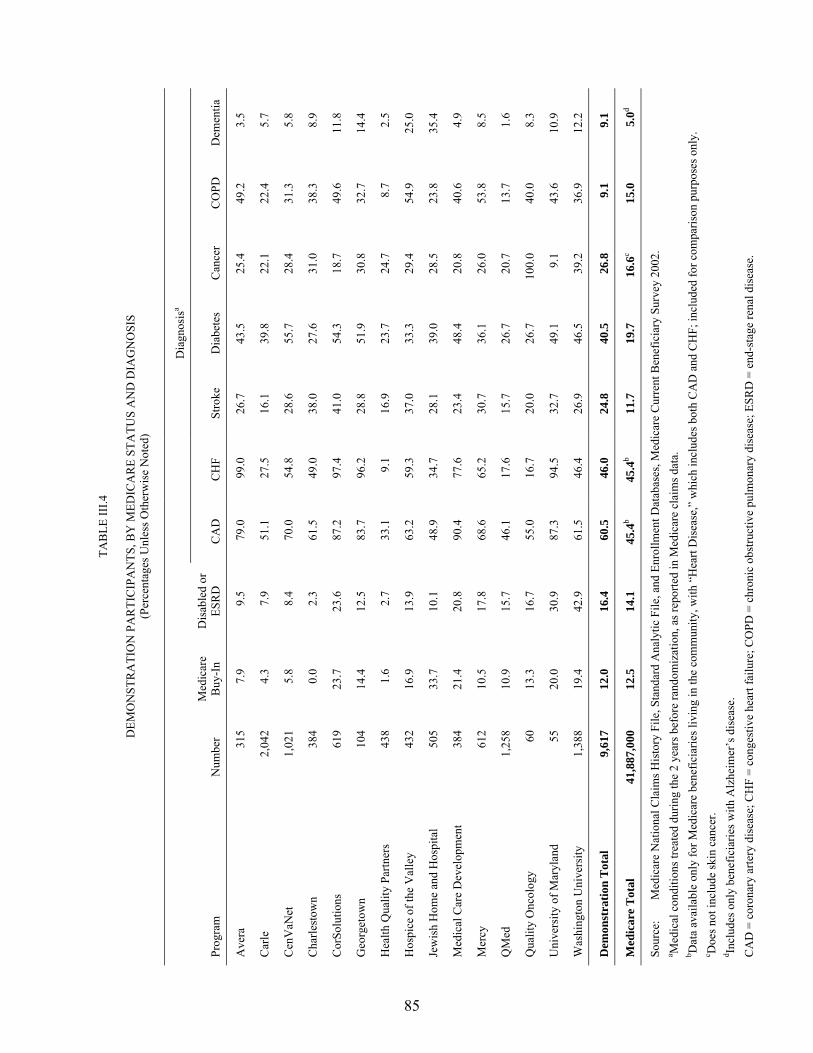
85
TAB
LE II
I.4
D
EMO
NST
RA
TIO
N P
AR
TIC
IPA
NTS
, BY
MED
ICA
RE
STA
TUS
AN
D D
IAG
NO
SIS
(Per
cent
ages
Unl
ess O
ther
wis
e N
oted
)
D
iagn
osis
a
Prog
ram
N
umbe
r M
edic
are
Buy
-In
Dis
able
d or
ES
RD
C
AD
C
HF
Stro
ke
Dia
bete
s C
ance
r C
OPD
D
emen
tia
Ave
ra
315
7.9
9.5
79.0
99
.0
26.7
43
.5
25.4
49
.2
3.5
Car
le
2,04
2 4.
3 7.
9 51
.1
27.5
16
.1
39.8
22
.1
22.4
5.
7
Cen
VaN
et
1,02
1 5.
8 8.
4 70
.0
54.8
28
.6
55.7
28
.4
31.3
5.
8
Cha
rlest
own
384
0.0
2.3
61.5
49
.0
38.0
27
.6
31.0
38
.3
8.9
Cor
Solu
tions
61
9 23
.7
23.6
87
.2
97.4
41
.0
54.3
18
.7
49.6
11
.8
Geo
rget
own
104
14.4
12
.5
83.7
96
.2
28.8
51
.9
30.8
32
.7
14.4
Hea
lth Q
ualit
y Pa
rtner
s 43
8 1.
6 2.
7 33
.1
9.1
16.9
23
.7
24.7
8.
7 2.
5
Hos
pice
of t
he V
alle
y 43
2 16
.9
13.9
63
.2
59.3
37
.0
33.3
29
.4
54.9
25
.0
Jew
ish
Hom
e an
d H
ospi
tal
505
33.7
10
.1
48.9
34
.7
28.1
39
.0
28.5
23
.8
35.4
Med
ical
Car
e D
evel
opm
ent
384
21.4
20
.8
90.4
77
.6
23.4
48
.4
20.8
40
.6
4.9
Mer
cy
612
10.5
17
.8
68.6
65
.2
30.7
36
.1
26.0
53
.8
8.5
QM
ed
1,25
8 10
.9
15.7
46
.1
17.6
15
.7
26.7
20
.7
13.7
1.
6
Qua
lity
Onc
olog
y 60
13
.3
16.7
55
.0
16.7
20
.0
26.7
10
0.0
40.0
8.
3
Uni
vers
ity o
f Mar
ylan
d 55
20
.0
30.9
87
.3
94.5
32
.7
49.1
9.
1 43
.6
10.9
Was
hing
ton
Uni
vers
ity
1,38
8 19
.4
42.9
61
.5
46.4
26
.9
46.5
39
.2
36.9
12
.2
Dem
onst
ratio
n T
otal
9,
617
12.0
16
.4
60.5
46
.0
24.8
40
.5
26.8
9.
1 9.
1
Med
icar
e T
otal
41
,887
,000
12
.5
14.1
45
.4b
45.4
b 11
.7
19.7
16
.6c
15.0
5.
0d
Sour
ce:
Med
icar
e N
atio
nal C
laim
s His
tory
File
, Sta
ndar
d A
naly
tic F
ile, a
nd E
nrol
lmen
t Dat
abas
es, M
edic
are
Cur
rent
Ben
efic
iary
Sur
vey
2002
. a M
edic
al c
ondi
tions
trea
ted
durin
g th
e 2
year
s bef
ore
rand
omiz
atio
n, a
s rep
orte
d in
Med
icar
e cl
aim
s dat
a.
b Dat
a av
aila
ble
only
for M
edic
are
bene
ficia
ries l
ivin
g in
the
com
mun
ity, w
ith �
Hea
rt D
isea
se,�
whi
ch in
clud
es b
oth
CA
D a
nd C
HF;
incl
uded
for c
ompa
rison
pur
pose
s onl
y.
c Doe
s not
incl
ude
skin
can
cer.
d Incl
udes
onl
y be
nefic
iarie
s with
Alz
heim
er�s
dis
ease
. C
AD
= c
oron
ary
arte
ry d
isea
se; C
HF
= co
nges
tive
hear
t fai
lure
; CO
PD =
chr
onic
obs
truct
ive
pulm
onar
y di
seas
e; E
SRD
= e
nd-s
tage
rena
l dis
ease
.

86
Most programs also enrolled substantial percentages of patients who had been treated for
stroke, COPD, or diabetes; smaller percentages of patients had been treated for cancer or
dementia. One-third to one-half of the patients of 11 programs had been treated for diabetes, and
the pattern is similar for COPD (Table III.4). All of the patients of one program (Quality
Oncology) had been treated for cancer during the 2 years before random assignment, which
reflects the program�s target diagnosis. Among the 15 programs, Health Quality Partners
enrolled the healthiest group of enrollees.
The programs that enrolled the highest percentages of patients with self-reported annual
incomes of more than $40,000 also had the fewest percentages of patients who qualified for
Medicare buy-in (Table III.4). During their first year, two programs enrolled few to no patients
who qualified for state assistance for Medicare buy-in. In contrast, more than one-third of the
patients of another program received state assistance for their Medicare premiums, and about
20 percent or more of the patients enrolling in four other programs qualified for Medicare buy-in
programs. Nationally, the percentage of Medicare beneficiaries who are dually eligible is
12.5 percent.11 The percentage of patients in seven programs who were originally entitled to
Medicare due to a disability or to ESRD was higher than the national average of 14 percent. One
program enrolled the lowest percent of patients with a disability or ESRD, with only about
2 percent of its patients being eligible through those means. In contrast, nearly 40 percent of the
11 �State buy-in� is a proxy for whether a beneficiary is also enrolled in Medicaid, as state Medicaid programs
typically pay the Medicare Part B premium for their Medicaid enrollees who are also eligible for Medicare. However, some beneficiaries for whom the state buys in (those in the Qualified Medicare Beneficiary Program or the Specified Low-Income Medicare Beneficiary Program) do not have full Medicaid coverage, and some states do not buy in for some Medicare beneficiaries who have full Medicaid coverage, depending on their type of eligibility (for example, for those who are eligible for Medicaid due to spending down their assets).
87
patients enrolled by another program were eligible for Medicare because of a disability or a
diagnosis of ESRD.12
C. PARTICIPATING PATIENTS AND ELIGIBLE NONPARTICIPATING BENEFICIARIES
Medicare claims and eligibility data were used to estimate both the number of Medicare
beneficiaries in each program�s service area who potentially were eligible for the program and
the percentage of those beneficiaries who actually participated. Beneficiaries were identified as
potentially eligible for a particular program if, for any month during the program�s first 6 months
of operations, they (1) lived in the program�s catchment area, (2) were enrolled in Medicare Parts
A and B, (3) had Medicare as their primary payer, (4) were not in a Medicare managed care plan
(Medicare+Choice or Medicare Advantage plan), (5) met the program�s target diagnosis and
utilization requirements that could be simulated using Medicare claims data, and (6) did not have
any of the program�s exclusion criteria measured in the Medicare claims data (for example,
ESRD or terminal cancer).
This definition of potential eligibility is inexact for many of the programs, however, as they
imposed additional restrictions at intake that the evaluator could not take into account when
trying to identify eligible beneficiaries by using claims data (such as having a telephone, having
at least a fourth grade reading level, or exceeding a specified disease-severity threshold).
Furthermore, the proportion of patients who actually participated was influenced heavily by both
the scope and intensity of the programs� recruiting efforts and referral sources. For example,
because many programs relied heavily on their own data systems or on those of a few affiliated
12 Because some programs excluded beneficiaries with ESRD, and nationally very few beneficiaries are
entitled to Medicare due to ESRD, most of these beneficiaries originally qualified for Medicare because of a disability. According to the elderly, disabled, and ESRD data from CMS in 2002, only 0.6 percent of the national Medicare population qualified for benefits due to ESRD (Centers for Medicare & Medicaid Services 2002a).
88
hospitals or physician groups to identify potentially eligible patients, they were not be able to
identify or enroll many of the beneficiaries in the catchment area that the evaluator had identified
from the claims data as being potentially eligible. Nonetheless, the proportions are useful as a
rough gauge of program penetration among Medicare beneficiaries with specific illnesses. To
lessen possible confusion, this report will refer to these potentially eligible beneficiaries as
�comparable beneficiaries (or nonparticipants) by claims data� from this point on.13
The evaluator also used Medicare claims and enrollment data to assess whether the
programs enrolled a mix of beneficiaries representative of the larger pool of comparable
beneficiaries by claims data. The evaluator conducted that analysis by comparing the
demographic characteristics, diagnoses, and utilization histories of comparable nonparticipants
by claims data with those of participants who enrolled during the first year of each program�s
operations. The analysis compared service use and cost measures for the 12-month period
preceding enrollment for the enrollees and the service use and cost measures for an analogous
period for the comparable nonparticipants by claims data (the 12 months beginning 9 months
before program startup and ending 3 months after startup). In addition, the evaluator compared
the average costs for participants with its projected average costs for the target population that
were presented in the OMB waiver package for the demonstration.
That simulation shows that the programs� pools of comparable nonparticipants by claims
data during the first 6 months of operations ranged in size from about 1,800 to more than
125,000 (Table III.5). Participation rates (the number of beneficiaries enrolled during the first
2 years divided by the number of comparable nonparticipants by claims data; right-hand column
of the table) varied from fewer than 1 percent to more than 15 percent. The overall participation
13 This terminology differs from that used in previous evaluation reports on the demonstration, which used the term �eligible beneficiaries� or �eligible nonparticipants.�

89
TABLE III.5
NUMBER OF PARTICIPANTS AND COMPARABLE NONPARTICIPANTS BY CLAIMS DATA
Program Beneficiaries
Enrolled Comparable
Nonparticipants �Participation� Rate
(Percent)
Avera 624 5,505 11.3
Carle 2,642 23,284 11.3
CenVaNet 1,305 55,262 2.4
Charlestown 802 38,745 2.1
CorSolutions 2,162 13,119 16.5
Georgetown 199 5,122 3.9
Health Quality Partners 1,140 60,740 1.9
Hospice of the Valley 814 85,293 1.0
Jewish Home and Hospital 766 125,821 0.6
Medical Care Development 876 10,655 8.2
Mercy 865 11,322 7.6
QMed 1,454 13,148 11.1
Quality Oncology 141 1,840 7.7
University of Maryland 137 2,398 5.7
Washington University 2,038 117,322 1.7
Total 15,965 569,576 2.8 Source: Enrollment data were provided by the programs. Data on the number of comparable nonparticipants are
from cost waiver calculations produced by Mathematica Policy Research, Inc.
Note: �Comparable Nonparticipants by Claims Data� refers to a group of Medicare beneficiaries identified in each program�s service area as potentially eligible for the program as measured by Medicare claims data. Comparable nonparticipants were beneficiaries who, for any month during the program�s first 6 months of operation (1) lived in the program�s catchment area, (2) were enrolled in Medicare Parts A and B, (3) had Medicare as their primary payer, (4) were not in a Medicare managed care plan (Medicare+Choice or Medicare Advantage plan), (5) met the program�s target diagnosis and utilization requirements that could be simulated using Medicare claims data, and (6) did not have any of the program�s exclusion criteria that could be measured in the Medicare claims data (for example, end-stage renal disease or terminal cancer). This definition of comparable nonparticipants is inexact, as many of the programs imposed additional restrictions at intake that the evaluator could not take into account when trying to identify such beneficiaries through claims data (such as having a telephone, having at least a fourth grade reading level, or exceeding a specified disease severity threshold). Charlestown, for example, recruited only beneficiaries residing in one of its three residential communities, whereas the comparable nonparticipants in the table were drawn from all beneficiaries in the zip codes of the three Charlestown communities. Nevertheless, the proportions in the table are useful as a rough gauge of program penetration among Medicare beneficiaries with specific illnesses. (Note that the �comparable nonparticipants by claims data� terminology differs from terminology in previous evaluation reports on the demonstration, which used the term �eligible nonparticipants.�)
90
rate was 2.8 percent. These rates do not imply that few people were interested in the programs.
Many people probably were unaware of them, others may have failed to meet additional
eligibility criteria beyond those that can be simulated with claims data (such as a minimum
severity of illness threshold), and others may eventually enroll during the remaining years of the
demonstration. As stated, some programs already have reached their enrollment targets, and
others are continuing to enroll additional patients. The estimates simply give an indication of the
number of Medicare beneficiaries who live in program service areas and have the target
diagnoses of each program.
Comparisons of actual program patients with the comparable nonparticipants by claims data
show some differences in characteristics (Table III.6). All but three programs enrolled a smaller
percentage of very elderly beneficiaries (those aged 85 or older) than were in the group of
comparable nonparticipants by claims. Among the 15 programs, those 3 also enrolled the
highest proportions of participants in the group of patients aged 85 or older; 1 of the 3 recruited
exclusively from 3 retirement communities, and another targeted frail beneficiaries from 2 large
geriatric practices, who were older on average than the general Medicare population.
As noted, most programs enrolled relatively few beneficiaries who were dually eligible for
Medicaid and Medicare, with the rate of dually eligible participants in 10 of the 15 programs
falling below the rate of dually eligible nonparticipants in the programs� target areas (see the
column labeled �State Buy-In� in Table III.6). The proportion of demonstration participants who
were dually eligible ranged from 0 to 33 percent, with more than one-half of the programs falling
under 15 percent. This finding is consistent with the fact that most of the programs enrolled
patients who were wealthier than the average Medicare beneficiary nationally.
In general, the patients enrolling in the demonstration were very sick, which is consistent
with the programs� recruitment criteria. Only four programs enrolled a substantial percentage of
91
TAB
LE II
I.6
C
OM
PAR
ISO
N O
F PA
RTI
CIP
AN
TS A
ND
CO
MPA
RA
BLE
NO
NPA
RTI
CIP
AN
TS B
Y C
LAIM
S D
ATA
Age
(P
erce
nt)
Ave
rage
Ann
ualiz
ed H
ospi
taliz
atio
ns
in P
ast 2
Yea
rs
Prog
ram
N
umbe
r <6
5 65
to
84
>85
Tota
l M
onth
ly
Med
icar
e Pa
ymen
ts
Tota
l M
onth
ly
Paym
ent:
Cos
t Es
timat
e R
atio
Stat
e B
uy-I
n (P
erce
nt)
Ave
rage
A
nnua
lized
N
umbe
r of
Hos
pita
lizat
ions
0
≤1
1 to
2
≥2
Ave
ra
Parti
cipa
nts
618
0.0
79.4
20
.6
$1,6
15
1.09
7.
9 1.
8 1.
9 44
.4
29.8
23
.8
Non
parti
cipa
nts
5,50
5 0.
0 63
.1
37.0
$1
,376
0.
93
19.6
1.4
53.2
28
.5
16.9
Car
le
Parti
cipa
nts
2,37
1 0.
9 87
.0
12.1
$5
21
0.70
4.
3 0.
5 56
.9
32.2
7.
9 3.
0 N
onpa
rtici
pant
s 23
,284
7.
9 75
.5
16.6
$6
25
0.84
13
.6
49
.4
36.0
9.
9 4.
7
Cen
VaN
et
Parti
cipa
nts
1,25
6 0.
0 87
.3
12.7
$9
53
0.76
5.
8 0.
8 40
.2
38.5
12
.4
8.9
Non
parti
cipa
nts
55,2
62
0.0
85.5
14
.2
$507
0.
41
10.1
61.4
29
.2
7.0
2.5
Cha
rlest
own
Parti
cipa
nts
742
0.0
54.2
45
.8
$1,1
59
0.78
0.
0 0.
8 32
.3
43.7
17
.7
6.2
Non
parti
cipa
nts
38,7
45
0.0
81.3
18
.7
$1,1
12
0.75
14
.3
25
.6
52.0
15
.5
7.0
Cor
Solu
tions
Pa
rtici
pant
s 2,
102
12.6
73
.7
13.7
$2
,644
1.
27
23.7
2.
0 7.
9 35
.5
25.4
31
.2
Non
parti
cipa
nts
13,1
19
11.9
71
.3
16.8
$1
,942
0.
93
25.5
16.1
38
.6
25.8
19
.5
Geo
rget
own
Parti
cipa
nts
197
0.0
86.5
13
.5
$2,5
30
0.73
14
.4
2.2
5.8
34.6
25
.0
34.6
N
onpa
rtici
pant
s 5,
122
0.0
76.6
23
.4
$2,4
10
0.69
13
.8
2.
1 53
.4
26.0
18
.4
Hea
lth Q
ualit
y Pa
rtner
s
Pa
rtici
pant
s 99
9 0.
0 91
.8
8.2
$414
0.
64
1.6
0.3
72.1
18
.9
6.6
2.3
Non
parti
cipa
nts
60,7
40
0.0
87.5
12
.6
$355
0.
55
5.5
74
.2
19.7
4.
6 1.
6
Hos
pice
of t
he V
alle
y
Pa
rtici
pant
s 74
7 0.
0 74
.1
25.9
$2
,174
2.
12
16.9
1.
5 15
.5
45.6
19
.4
19.4
N
onpa
rtici
pant
s 85
,293
0.
0 82
.5
17.4
$9
65
0.94
8.
9
40.1
44
.4
11.2
4.
4
TAB
LE II
I.6 (c
ontin
ued)
92
Age
(P
erce
nt)
Ave
rage
Ann
ualiz
ed H
ospi
taliz
atio
ns
in P
ast 2
Yea
rs
Prog
ram
N
umbe
r <6
5 65
to
84
>85
Tota
l M
onth
ly
Med
icar
e Pa
ymen
ts
Tota
l M
onth
ly
Paym
ent:
Cos
t Es
timat
e R
atio
Stat
e B
uy-I
n (P
erce
nt)
Ave
rage
A
nnua
lized
N
umbe
r of
Hos
pita
lizat
ions
0
≤1
1 to
2
≥2
Jew
ish
Hom
e an
d H
ospi
tal
Parti
cipa
nts
720
0.2
63.8
36
.0
$1,4
50
0.92
33
.7
0.7
44.0
35
.2
12.3
8.
5 N
onpa
rtici
pant
s 12
5,82
1 0.
0 80
.3
19.7
$9
82
0.62
24
.2
59
.7
28.6
7.
7 4.
0
Med
ical
Car
e D
evel
opm
ent
Parti
cipa
nts
869
7.3
79.7
13
.0
$1,7
18
0.72
21
.4
1.5
3.6
53.4
24
.2
18.7
N
onpa
rtici
pant
s 10
,655
7.
7 66
.1
26.2
$1
,274
0.
53
26.7
16.1
49
.2
21.9
12
.9
Mer
cy
Parti
cipa
nts
848
4.1
78.4
17
.5
$1,3
15
1.03
10
.5
1.1
10.8
58
.8
22.1
8.
3 N
onpa
rtici
pant
s 11
,322
5.
1 71
.3
23.6
$6
10
0.48
16
.7
47
.6
38.5
10
.0
4.0
QM
ed
Parti
cipa
nts
1,29
3 6.
8 88
.2
5.1
$507
0.
45
10.9
0.
3 73
.4
20.0
4.
2 2.
3 N
onpa
rtici
pant
s 13
,148
0.
0 85
.4
14.7
$9
54
0.85
34
.6
57
.9
28.7
9.
7 3.
7
Qua
lity
Onc
olog
y
Pa
rtici
pant
s 12
9 10
.0
81.7
8.
3 $2
,885
0.
79
13.3
0.
8 36
.7
40.0
10
.0
13.3
N
onpa
rtici
pant
s 1,
840
0.0
85.0
15
.0
$2,4
63
0.67
6.
4
36.3
41
.9
14.0
7.
9
Uni
vers
ity o
f Mar
ylan
d
Pa
rtici
pant
s 13
4 14
.5
81.8
3.
6 $3
,299
1.
11
20.0
2.
0 5.
5 32
.7
32.7
29
.1
Non
parti
cipa
nts
2,39
8 15
.2
67.3
17
.5
$3,1
56
1.06
20
.2
2.
0 34
.9
29.7
33
.5
Was
hing
ton
Uni
vers
ity
Parti
cipa
nts
1,96
1 28
.0
62.7
9.
4 $2
,263
2.
49
19.4
1.
6 17
.5
35.1
24
.6
22.9
N
onpa
rtici
pant
s 11
7,32
2 12
.9
72.8
14
.3
$787
0.
87
10.8
56.2
30
.1
8.7
4.9
Sour
ce:
Med
icar
e En
rollm
ent D
atab
ase
and
Nat
iona
l Cla
ims H
isto
ry F
ile.
Not
es:
The
inta
ke d
ate
used
in th
is ta
ble
is th
e da
te o
f en
rollm
ent f
or p
artic
ipan
ts.
For
com
para
ble
nonp
artic
ipan
ts, t
he in
take
dat
e is
the
mid
poin
t of
the
6-m
onth
enr
ollm
ent p
erio
d ex
amin
ed.
�Com
para
ble
Non
parti
cipa
nts
by C
laim
s D
ata�
ref
ers
to a
gro
up o
f M
edic
are
bene
ficia
ries
iden
tifie
d in
eac
h pr
ogra
m�s
ser
vice
are
a as
pot
entia
lly
elig
ible
for
the
pro
gram
as
mea
sure
d by
Med
icar
e cl
aim
s da
ta.
Com
para
ble
nonp
artic
ipan
ts w
ere
bene
ficia
ries
who
, fo
r an
y m
onth
dur
ing
the

TAB
LE II
I.6 (c
ontin
ued)
93
____
____
____
____
____
____
____
____
____
____
____
____
____
____
____
____
____
____
____
____
____
____
____
____
____
____
____
____
____
____
____
____
pr
ogra
m�s
firs
t 6 m
onth
s of
ope
ratio
n (1
) liv
ed in
the
prog
ram
�s c
atch
men
t are
a, (
2) w
ere
enro
lled
in M
edic
are
Parts
A a
nd B
, (3)
had
Med
icar
e as
th
eir
prim
ary
paye
r, (4
) w
ere
not i
n a
Med
icar
e m
anag
ed c
are
plan
(M
edic
are+
Cho
ice
or M
edic
are
Adv
anta
ge p
lan)
, (5)
met
the
prog
ram
�s ta
rget
di
agno
sis a
nd u
tiliz
atio
n re
quire
men
ts th
at c
ould
be
sim
ulat
ed u
sing
Med
icar
e cl
aim
s dat
a, a
nd (6
) did
not
hav
e an
y of
the
prog
ram
�s e
xclu
sion
crit
eria
th
at c
ould
be
mea
sure
d in
the
Med
icar
e cl
aim
s da
ta (
for
exam
ple,
end
-sta
ge r
enal
dis
ease
or
term
inal
can
cer)
. T
his
defin
ition
of
com
para
ble
nonp
artic
ipan
ts is
inex
act,
as m
any
of th
e pr
ogra
ms i
mpo
sed
addi
tiona
l res
trict
ions
at i
ntak
e th
at th
e ev
alua
tor c
ould
not
take
into
acc
ount
whe
n try
ing
to id
entif
y su
ch b
enef
icia
ries
thro
ugh
clai
ms
data
(su
ch a
s ha
ving
a te
leph
one,
hav
ing
at le
ast a
fou
rth g
rade
rea
ding
leve
l, or
exc
eedi
ng a
spe
cifie
d di
seas
e se
verit
y th
resh
old)
. C
harle
stow
n, f
or e
xam
ple,
rec
ruite
d on
ly b
enef
icia
ries
resi
ding
in o
ne o
f its
thre
e re
side
ntia
l com
mun
ities
, whe
reas
the
com
para
ble
nonp
artic
ipan
ts in
the
tabl
e w
ere
draw
n fr
om a
ll be
nefic
iarie
s in
the
zip
code
s of
the
thre
e C
harle
stow
n co
mm
uniti
es.
Nev
erth
eles
s, th
e pr
opor
tions
in
the
tabl
e ar
e us
eful
as
a ro
ugh
gaug
e of
pro
gram
pen
etra
tion
amon
g M
edic
are
bene
ficia
ries
with
spe
cific
illn
esse
s. (
Not
e th
at t
he
�com
para
ble
nonp
artic
ipan
ts b
y cl
aim
s da
ta�
term
inol
ogy
diff
ers
from
term
inol
ogy
in p
revi
ous
eval
uatio
n re
ports
on
the
dem
onst
ratio
n, w
hich
use
d th
e te
rm �
elig
ible
non
parti
cipa
nts.�
)
94
patients who had not had any hospitalizations during the 2 years preceding randomization.
Nearly three-fourths of the patients enrolled in two of the four programs had no hospitalizations
during that 2-year period. Five other programs enrolled a high proportion of patients (about
30 percent or more) who had had two or more hospitalizations during the 2 years preceding
randomization, indicating that they were enrolling very sick patients. The annualized number of
hospitalizations was similar between the program participants and comparable nonparticipants by
claims data in nearly all the programs. Notably, two programs enrolled patients who were
substantially sicker than were the programs� comparable nonparticipants, as indicated by the
patients� higher rate of hospitalizations and higher preenrollment Medicare expenditures.14
Because hospitalizations account for the bulk of Medicare expenses, it is not surprising that
Medicare payments for participants during the year preceding enrollment was high. Most of the
patients enrolled in the demonstration had significantly higher preenrollment monthly Medicare
costs than did the average noninstitutionalized Medicare beneficiary (Table III.6). Programs that
enrolled patients with the highest preenrollment total monthly Medicare costs also had among
the highest rates of disenrollment due to death during the first year of operations, as well as the
highest average number of hospitalizations during the 2 years preceding random assignment.
Three of the four programs that lost more than 15 percent of their patients due to death within the
first year enrolled patients with average monthly Medicare costs of $2,000 or higher, much
higher than the Medicare average of $514 (Centers for Medicare & Medicaid Services 2002a).
The fourth program enrolled patients with average monthly preenrollment costs of about $1,700,
also much higher than the national average. Three programs enrolled patients whose monthly
14 Because Washington University used a proprietary algorithm developed by StatusOne to identify patients,
the evaluator did not have access to the full eligibility criteria used by that program to identify potential enrollees. Thus, the simulation of eligible nonparticipants is likely to be less accurate than those for the other programs.

95
expenditures were close to or lower than the national average. Those programs also enrolled
fewer patients who were older than 85 years, had lower mortality rates for their patients during
the first year of program operations, and enrolled patients with fewer average hospitalizations
during the 2 years preceding enrollment.
The average monthly Medicare payments for program participants ranged from a low of
$414 to a high of $3,299 (Table III.6). Three programs enrolled patients who had monthly
payments of $600 or less (less than $7,000 per year), six programs enrolled patients with
monthly payments between about $1,000 and $1,700 ($12,000 to about $20,000 per year), and
six programs enrolled patients with extremely high payments of $2,000 per month ($24,000 per
year) or more. Two programs enrolled patients whose monthly payments were substantially
higher than the monthly payments that had been estimated by the evaluator for the waiver
calculations. Six programs enrolled patients whose monthly reimbursements were about
75 percent or less than those predicted by the waiver cost estimates. Three programs enrolled
patients whose monthly payments were very close to the estimates.
D. COMPARISON OF TREATMENT AND CONTROL GROUP MEMBERS
As expected under random assignment, with a few minor exceptions, the treatment group
and the control group had similar preenrollment characteristics (Table III.7). Overall, the
number of statistically significant differences observed between the treatment and control groups
was small and what one would expect to occur by chance. In terms of medical conditions treated
during the 2 years before randomization, nine scattered differences between the treatment and
control groups were statistically significant, exactly what one would expect to occur by chance
with 90 separate comparisons (15 sites x 6 conditions), at the 10-percent significance level. The
average number of hospitalizations during the 2 years preceding random assignment was
consistent between treatment and control groups for all of the programs except the University of

96
TAB
LE II
I.7
PR
EEN
RO
LLM
ENT
CH
AR
AC
TER
ISTI
CS
OF
TREA
TMEN
T A
ND
CO
NTR
OL
GR
OU
PS R
AN
DO
MIZ
ED
DU
RIN
G T
HE
1ST
YEA
R O
F PR
OG
RA
M O
PER
ATI
ON
S
Age
(Per
cent
)
Dia
gnos
is (P
erce
nt)
Prog
ram
N
umbe
r <6
5 65
to 84
>85
CA
D
CH
F St
roke
D
iabe
tes
Can
cer
CO
PD
Ave
rage
A
nnua
lized
N
umbe
r of
Hos
pita
lizat
ions
Ave
rage
To
tal M
edic
are
Cos
t
Ave
ra
Tr
eatm
ent
157
0.0
77.1
22
.9
82
.8
100.
0 27
.4
49.0
26
.1
45.9
1.
75
$1,5
37
Con
trol
158
0.0
81.6
18
.4
75
.3
98.1
25
.9
38.0
24
.7
52.5
1.
85
$1,6
93
Diff
eren
ce
0.
0 -4
.5
4.6
7.
5 1.
9*
1.4
11.1
**
1.4
-6.7
-0
.10
-$15
6
Car
le
Tr
eatm
ent
1,02
4 1.
0 87
.3
11.7
51.2
29
.0
16.6
39
.5
24.0
23
.3
0.50
$5
36
Con
trol
1,01
8 0.
9 86
.6
12.5
51.0
26
.0
15.5
40
.1
20.1
21
.4
0.43
$5
05
Diff
eren
ce
0.
1 0.
7 -0
.8
0.
2 3.
0 1.
1 -0
.6
3.9*
* 1.
9 0.
06
$30
Cen
VaN
et
Tr
eatm
ent
512
0.0
87.3
12
.7
70
.5
56.1
27
.5
54.5
29
.1
32.0
0.
79
$1,0
18
Con
trol
509
0.0
87.2
12
.8
69
.5
53.4
29
.7
57.0
27
.7
30.6
0.
74
$888
D
iffer
ence
0.0
0.1
-0.1
1.0
2.6
-2.1
-2
.5
1.4
1.4
0.05
$1
31
Cha
rlest
own
Tr
eatm
ent
195
0.0
50.8
49
.2
60
.5
52.8
36
.9
26.2
31
.8
35.9
0.
74
$1,1
34
Con
trol
189
0.0
57.7
42
.3
62
.4
45.0
39
.2
29.1
30
.2
40.7
0.
86
$1,1
84
Diff
eren
ce
0.
0 6.
9 6.
9
-1.9
7.
8 -2
.2
-2.9
1.
6 -4
.8
-0.1
2 -$
51
Cor
Solu
tions
a
Trea
tmen
t 35
4 13
.8
70.6
15
.5
88
.7
98.6
38
.7
53.1
19
.5
50.8
1.
91
$2,4
68
Con
trol
265
10.9
77
.7
11.3
85.3
95
.8
44.2
55
.8
17.7
47
.9
2.15
$2
,879
D
iffer
ence
2.9
-7.1
4.
2
3.4
2.7*
*-5
.5
-2.7
1.
8 2.
9 -0
.24
-$41
1*
Geo
rget
own
Tr
eatm
ent
51
0.0
94.1
5.
9
84.3
94
.1
23.5
56
.9
27.5
29
.4
1.82
$1
,872
C
ontro
l 53
0.
0 79
.2
20.8
83.0
98
.1
34.0
47
.2
34.0
35
.8
2.52
$3
,164
D
iffer
ence
0.0
14.9
-1
4.9
1.
3 -4
.0
-10.
4 9.
7 -6
.5
-6.4
-0
.70
-$1,
292*
**
Hea
lth Q
ualit
y Pa
rtner
s
Trea
tmen
t 21
9 0.
0 91
.3
8.7
31
.1
9.6
20.1
23
.7
24.7
10
.0
0.29
$3
73
Con
trol
219
0.0
92.2
7.
8
35.2
8.
7 13
.7
23.7
24
.7
7.3
0.30
$4
55
Diff
eren
ce
0.
0 0.
9 0.
9
-4.1
0.
9 6.
4*
0.0
0.0
2.7
-0.0
1 -$
81

TAB
LE II
I.7 (c
ontin
ued)
97
Age
(Per
cent
)
Dia
gnos
is (P
erce
nt)
Prog
ram
N
umbe
r <6
5 65
to 84
>85
CA
D
CH
F St
roke
D
iabe
tes
Can
cer
CO
PD
Ave
rage
A
nnua
lized
N
umbe
r of
Hos
pita
lizat
ions
Ave
rage
To
tal M
edic
are
Cos
t
Hos
pice
of t
he V
alle
y
Trea
tmen
t 22
2 0.
0 71
.6
28.4
62.6
57
.7
40.1
35
.1
27.5
52
.3
1.43
$2
,276
C
ontro
l 21
0 0.
0 76
.7
23.3
63.8
61
.0
33.8
31
.4
31.4
57
.6
1.52
$2
,066
D
iffer
ence
0.0
-5.0
5.
0
-1.2
-3
.3
6.3
3.7
-4.0
-5
.4
-0.0
9 $2
10
Jew
ish
Hom
e an
d H
ospi
tal
Tr
eatm
ent
253
0.4
64.0
35
.6
51
.4
38.3
31
.2
42.7
27
.7
29.6
0.
72
$1,5
23
Con
trol
252
0.0
63.5
36
.5
46
.4
31.0
25
.0
35.3
29
.4
17.9
0.
76
$1,3
77
Diff
eren
ce
0.
4 0.
5 -0
.9
5.
0 7.
4*
6.2
7.4*
-1
.7
11.8
***
-0.0
4 $1
46
Med
ical
Car
e D
evel
opm
ent
Tr
eatm
ent
192
10.4
75
.5
14.1
89.6
78
.1
22.9
46
.9
18.2
45
.3
1.51
$1
,766
C
ontro
l 19
2 4.
2 83
.9
12.0
91.1
77
.1
24.0
50
.0
23.4
35
.9
1.46
$1
,671
D
iffer
ence
6.3*
* -8
.3
2.1
-1
.6
1.0
-1.0
-3
.1
-5.2
9.
4 0.
05
$95
Mer
cy
Tr
eatm
ent
304
3.9
80.6
15
.5
68
.4
64.8
29
.3
34.2
27
.3
56.9
1.
11
$1,3
76
Con
trol
308
4.2
76.3
19
.5
68
.8
65.6
32
.1
38.0
24
.7
50.6
1.
01
$1,2
56
Diff
eren
ce
-0
.3
4.3
-4.0
-0.4
-0
.8
-2.9
-3
.8
2.6
6.3
0.10
$1
20
QM
ed
Tr
eatm
ent
633
6.6
88.8
4.
6
46.6
16
.9
14.8
26
.5
22.1
14
.8
0.29
$5
44
Con
trol
625
6.9
87.5
5.
6
45.6
18
.2
16.6
26
.9
19.4
12
.5
0.26
$4
70
Diff
eren
ce
-0
.2
1.3
-1.0
1.0
-1.3
-1
.8
-0.3
2.
8 2.
4 0.
03
$74
Qua
lity
Onc
olog
y
Trea
tmen
t 29
10
.3
79.3
10
.3
62
.1
17.2
24
.1
27.6
10
0.0
41.4
0.
86
$3,0
72
Con
trol
31
9.7
83.9
6.
5
48.4
16
.1
16.1
25
.8
100.
0 38
.7
0.82
$2
,710
D
iffer
ence
0.7
-4.6
3.
9
13.7
1.
1 8.
0 1.
8 0.
0 2.
7 0.
04
$362
Uni
vers
ity o
f Mar
ylan
d
Trea
tmen
t 29
20
.7
75.9
3.
4
96.6
96
.6
34.5
55
.2
10.3
41
.4
2.51
$3
,711
C
ontro
l 26
7.
7 88
.5
3.8
76
.9
92.3
30
.8
42.3
7.
7 46
.2
1.52
$2
,840
D
iffer
ence
13.0
-1
2.6
-0.4
19.6
**4.
2 3.
7 12
.9
2.7
-4.8
0.
98*
$871
Was
hing
ton
Uni
vers
ity
Tr
eatm
ent
698
27.8
61
.9
10.3
62.2
47
.4
28.1
46
.3
39.3
37
.2
1.57
$2
,267
C
ontro
l 69
0 28
.1
63.5
8.
4
60.7
45
.4
25.7
46
.8
39.1
36
.5
1.54
$2
,259
D
iffer
ence
-0.3
1.
6 1.
9
1.5
2.1
2.4
-0.5
0.
1 0.
7 0.
03
$8

TAB
LE II
I.7 (c
ontin
ued)
98
____
____
____
____
____
____
____
____
____
____
____
____
____
____
____
____
____
____
____
____
____
____
____
____
____
____
____
____
____
____
____
____
____
____
____
____
So
urce
: M
edic
are
clai
ms d
ata.
a C
orSo
lutio
ns h
ad tw
o tre
atm
ent g
roup
arm
s, on
e th
at r
ecei
ved
pres
crip
tion
drug
s if
the
grou
p�s
mem
bers
did
not
alre
ady
have
cov
erag
e, a
nd o
ne th
at r
ecei
ved
the
regu
lar
care
co
ordi
natio
n in
terv
entio
n w
ithou
t the
sup
plem
enta
l pre
scrip
tion
drug
ben
efit.
Its
ove
rall
goal
was
to r
ando
miz
e in
to th
e tre
atm
ent g
roup
500
pat
ient
s w
ho d
id n
ot r
ecei
ve th
e pr
escr
iptio
n dr
ug b
enef
it, a
nd to
rand
omiz
e in
to th
e co
ntro
l gro
up 7
50 p
atie
nts w
ho d
id n
ot re
ceiv
e th
e be
nefit
. Th
us, t
he tr
eatm
ent-c
ontro
l rat
io w
as 1
0:7.
5. T
he tr
eatm
ent-c
ontro
l ra
tio fo
r the
14
othe
r pro
gram
s was
1:1
. C
AD
= c
oron
ary
arte
ry d
isea
se; C
HF
= co
nges
tive
hear
t fai
lure
; CO
PD =
chr
onic
obs
truct
ive
pulm
onar
y di
seas
e.
99
Maryland, one of the two smallest sites. Finally, for 13 out of the 15 programs, average
Medicare expenditures for the treatment group during the 2 years preceding enrollment were
statistically indistinguishable from those for the control group. In the third smallest program,
which had only 51 treatment group members, the treatment group�s average preenrollment
expenditures were 40 percent below those of the control group. The evaluator will control for
preenrollment differences, using regression analyses for key outcomes, to ensure that differences
that have arisen by chance do not distort inferences about whether treatment-control differences
are evidence of true program effects.
E. SUMMARY
Most of the 15 programs found enrollment to be a challenge. In general, although each
program had unique features, all of them took one of two basic approaches to enrolling patients:
(1) obtaining lists of prospective enrollees from hospitals or health care networks, or
(2) recruiting physicians who then referred patients to the program. However, programs with
strong preexisting ties to participating physicians and health care providers had greater success in
recruiting and enrolling patients than did programs without such ties. Notably, many program
staff frequently reported high patient refusal rates as the primary reason for enrollment shortfalls.
The patients who were enrolled were, for the most part, older and sicker than was the average
Medicare beneficiary. On average, however, patients enrolling in the demonstration also had
higher annual incomes and were wealthier and better educated than were Medicare beneficiaries
nationally. Based on Medicare claims data, patients enrolling in the demonstration suffered from
a number of chronic conditions, including CHF, COPD, diabetes, and cancer. A substantial
percentage of patients in many of the programs died during the first year of program operations.
The evaluator also compared the patients who enrolled in the demonstration with groups of
comparable nonparticipants simulated from Medicare claims data, based on each program�s

100
target diagnoses and utilization requirements. In general, the programs enrolled patients with
costs similar to or lower than the costs estimated by the evaluator�s waiver calculation. Only two
programs enrolled patients whose monthly payments were substantially higher than those
estimated for the waiver calculations. Finally, as expected under random assignment, the
treatment and control group members had similar characteristics before random assignment. The
number of statistically significant differences between the two groups was small, and what one
would expect to occur by chance.
101
IV. PATIENTS’ AND PHYSICIANS’ PERCEPTIONS ABOUT CARE COORDINATION AND ITS EFFECTS
Beneficiaries with chronic illnesses often face fragmented health care that is poorly
coordinated across multiple provider types and settings, and that fails to devote sufficient time to
education about the beneficiaries� conditions, appropriate self-care, or assistance with access to
support services. The combination of these factors, along with the frequency, intensity, and mix
of health care services that chronically ill beneficiaries require, may lead to poor clinical
outcomes, increased health care expenditures, and both patients� and providers� dissatisfaction
with the care received.
The improvement in care coordination that the Medicare Coordinated Care Demonstration
(MCCD) seeks to foster requires patient and physician buy-in. Participating programs are
unlikely to interest and obtain cooperation from either patients or physicians unless the programs
are able to convince them that their active participation in the program will benefit them in
some way.
For example, patients must be satisfied with their relationship with their care coordinators,
with the information and assistance they receive, and with their communication with their
providers. Physicians must have confidence in the professional competence of the care
coordinators and must believe that cooperating with the program will benefit their patients,
without adding burden to themselves, their office staff, or their patients. They also are likely to
be concerned about any possible program effects on their relationship with patients and on
practice income. If patients and providers are not satisfied in these ways, the programs probably
will not affect patients� and physicians� behaviors, the quality of care probably will not improve,
and the use and cost of Medicare services probably will not decrease.
102
The analysis of patient satisfaction in this chapter is based on data from telephone interviews
that Mathematica Policy Research, Inc. (MPR) conducted with patients at 12 of the 15 MCCD
programs. To assess the extent to which patients were aware of the intervention they were
supposed to be receiving, the chapter first examines the proportion of the treatment group that
reported receiving help from care coordinators. To assess potential contamination, it also
examines the proportion of the control group that reported receiving such assistance. It then
shows the proportion of treatment group participants who gave their care coordinators favorable
ratings on various aspects of the services provided, such as the care coordinators� knowledge,
ability, and attitudes. Finally, the chapter assesses treatment-control differences in ratings of
treatment choice and overall access to information and health care (for example, providers
remaining in contact with each other and explaining treatment).
This chapter also examines the reactions of physicians to various aspects of the programs
and assesses the physicians� perceptions about the programs� effects on their practices and
patients. The evaluation measured physicians� impressions by surveying a small sample of the
physicians who were providing care to treatment group members in the 15 MCCD programs.
A. PATIENTS’ SATISFACTION
The patient survey for each program was conducted in two waves: one wave approximately
12 months after program startup (May through September 2003), and the second about 6 months
after the first wave (October 2003 through June 2004). By drawing from beneficiaries who
enrolled during the first 6 months of program operations, the sample for the first wave consisted
of those who would have had 7 to 12 months of experience with the program by the time they
were interviewed. Similarly, the second wave surveyed beneficiaries who enrolled during the
7th through 12th months after program startup, again yielding a follow-up period of 7 to 12
months after enrollment; that sample was pooled with the first cohort. The interviews were
103
conducted by telephone, using computer-assisted software. The patient survey instruments
contain a core set of questions that were asked of all interviewees, regardless of diagnosis or
condition, as well as a series of condition- or disease-specific modules. Each patient completed
the one disease-specific module that best matched his or her primary health problem, as assessed
by the program�s intake staff at the time of enrollment. (A �generic� module was administered
to patients who had no dominant chronic illness reported.) The survey collected data on patient
demographics, primary language, well-being, health status, satisfaction with care, health-related
behaviors, adherence to medication regimens, and knowledge of condition. Patients spent an
average of about 35 minutes to complete the survey.
The combined target sample size in each demonstration program for the 2 survey waves was
618 completed interviews (309 each for the treatment and control groups), which would yield 80
percent power to detect a difference of 10 percentage points in a binary variable with a mean of
0.50. However, most of the programs did not have enough enrollees to generate that number of
completed interviews. Thus, MPR attempted to interview all of the patients of the 8 programs
that had at least 400 but fewer than 700 enrollees, (allowing for some survey nonresponse). For
the 4 programs with more than 700 enrollees, MPR drew a random sample of the patients to
interview, under the assumption that interviews would be completed with about 90 percent.
Three programs enrolled about 100 or fewer patients during their first year and were not
surveyed. The total number of patients surveyed was 7,526, with an overall response rate of
nearly 95 percent and response rates of 90 percent or higher for 11 of the 12 programs whose
patients were surveyed (Table IV.1).

104
TABLE IV.1
SAMPLE SIZES AND RESPONSE RATES FOR THE PATIENT SURVEY
Program Sample Size Completes Response Rate
(Percent)
Avera (AVE) 424 395 96.8
Carle (CAR) 704 684 97.6
CenVaNet (CEN) 704 652 94.4
Charlestown (CCI) 607 562 94.6
CorSolutions (COR) 686 620 93.4
Hospice of the Valley (HOS) 483 414 92.0
Health Quality Partners (HQP) 689 675 98.4
Jewish Home and Hospital (JHH) 575 483 84.9
Medical Care Development (MCD) 589 532 95.5
Mercy (MER) 686 649 97.0
QMed (QMD) 691 658 95.8
Washington University (WSH) 688 623 94.1
Total 7,526 6,947 94.7
Source: Mathematica Policy Research, Inc. (MPR) Patient Survey, conducted between May 2003 and June 2004.
Note: The response rate is slightly higher than the ratio of completed interviews to sample
size because sample members who were ineligible for the survey have been excluded from the denominator in calculating the rate. Sample members were ineligible for the survey if they died within 3 months after enrolling in the study. In the case of other sample members who were deceased at the time that the survey was fielded, MPR attempted to locate a family member to complete the survey on the decedent�s behalf.

105
1. Receipt of Care Coordination and Satisfaction with Care Coordinator
Across the 12 demonstration programs included in the survey, 65 percent of treatment group
patients reported receiving help from a nurse, care coordinator, or social worker in arranging care
(Table IV.2). However, the percentages varied widely across the programs, from a low of only
30 percent of patients being aware of the intervention (QMed) to a high of 81 percent (Mercy).
Not surprisingly, relatively few control group members (15 percent overall) reported receiving
help from a care coordinator, although this proportion may be higher than one might have
expected; furthermore, for four programs, the proportion of patients who reported receiving such
help exceeded 20 percent. Because a sizeable proportion of the treatment group was unaware
that the assistance of a care coordinator was available, and because a nontrivial proportion of the
control group received some services that potentially were similar to the services offered by the
programs, the effects of the intervention are likely to be considerably lower than if all treatment
group members and no control group members received care coordinator assistance.
Care coordinators were rated on 4 dimensions�support and monitoring, help arranging
services, ability to provide education to patients, and ability to assist patients in adhering to
treatment recommendations�each of which had 3 or 4 specific indicators (for a total of
14 indicators). Treatment group patients generally were very satisfied with the care coordination
that they received, with about one-third to one-half of the patients surveyed rating
TABLE IV.2
PERCENTAGE REPORTING THAT A CARE COORDINATOR HELPED TO ARRANGE CARE
AVE CAR CEN CCI COR HQP HOS JHH MCD MER QMD WSH Average
Treatment 59 77 66 74 55 76 74 66 57 81 30 62 65
Control 17 8 9 9 19 4 21 28 23 22 3 20 15 Note: See Table IV.1 for the full names of the programs.

106
their coordinators as excellent on the 14 indicators examined (Tables IV.3 and IV.4), and most of
the rest rating them as �very good.� Very few patients (fewer than 10 percent in each program)
rated the programs as only fair or poor on any of the measures (not shown).
Care coordinators received especially high marks on indicators of the emotional support and
monitoring they offered, especially on their �caring attitude,� with more than 60 percent of the
patients, on average, giving ratings of �excellent� (Table IV.3). Patients also rated programs
highly on staying in touch (more than one-half rating their programs� care coordinators as
excellent on this measure, on average). The programs� inclusion of the patients and their
families in decisions and the programs� ability to help patients to cope with their illnesses and to
avoid complications received somewhat lower but still quite positive ratings, on average.
Two programs (Avera and Health Quality Partners) received markedly higher care
coordinator ratings from their patients on each of the four indicators related to support and
monitoring than did the other programs (see the shaded sections of Table IV.3). For example,
more than two-thirds of the patients of those programs reported that their care coordinators did
an excellent job of staying in touch with them. On every measure, two other programs (Jewish
Home and Hospital and QMed) fared markedly worse than the other programs.
Patients were somewhat less satisfied with the help that their programs� care coordinators
gave them in arranging appointments or services. On average across the 12 programs, about
35 to 40 percent of the patients gave their care coordinators an excellent rating on this indicator.
Carle received consistently high ratings. Jewish Home and Hospital and QMed received
markedly lower ratings than did the other programs on the service arrangement indicators.
Substantial minorities of patients (10 to 24 percent) gave their programs� care coordinators a fair
or poor rating (not shown). Those less favorable ratings are likely due to the fact that most
programs focused more on monitoring and education than on service arrangements.
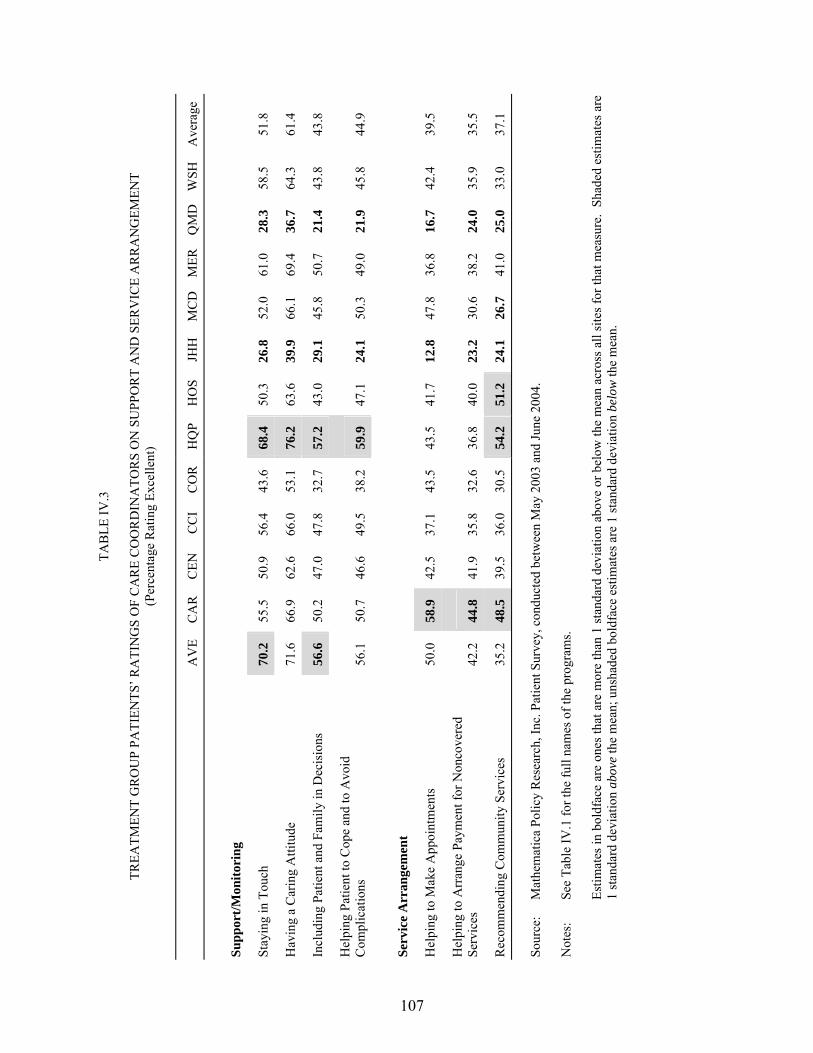
107
TAB
LE IV
.3
TR
EATM
ENT
GR
OU
P PA
TIEN
TS� R
ATI
NG
S O
F C
AR
E C
OO
RD
INA
TOR
S O
N S
UPP
OR
T A
ND
SER
VIC
E A
RR
AN
GEM
ENT
(Per
cent
age
Rat
ing
Exce
llent
)
A
VE
CA
R
CEN
C
CI
CO
R
HQ
P H
OS
JHH
M
CD
MER
Q
MD
WSH
Ave
rage
Supp
ort/M
onito
ring
Stay
ing
in T
ouch
70
.2
55.5
50
.9
56.4
43
.6
68.4
50
.3
26.8
52
.0
61.0
28
.3
58.5
51
.8
Hav
ing
a C
arin
g A
ttitu
de
71.6
66
.9
62.6
66
.0
53.1
76
.2
63.6
39
.9
66.1
69
.4
36.7
64
.3
61.4
Incl
udin
g Pa
tient
and
Fam
ily in
Dec
isio
ns
56.6
50
.2
47.0
47
.8
32.7
57
.2
43.0
29
.1
45.8
50
.7
21.4
43
.8
43.8
Hel
ping
Pat
ient
to C
ope
and
to A
void
C
ompl
icat
ions
56
.1
50.7
46
.6
49.5
38
.2
59.9
47
.1
24.1
50
.3
49.0
21
.9
45.8
44
.9
Serv
ice
Arr
ange
men
t
Hel
ping
to M
ake
App
oint
men
ts
50.0
58
.9
42.5
37
.1
43.5
43
.5
41.7
12
.8
47.8
36
.8
16.7
42
.4
39.5
Hel
ping
to A
rran
ge P
aym
ent f
or N
onco
vere
d Se
rvic
es
42.2
44
.8
41.9
35
.8
32.6
36
.8
40.0
23
.2
30.6
38
.2
24.0
35
.9
35.5
Rec
omm
endi
ng C
omm
unity
Ser
vice
s 35
.2
48.5
39
.5
36.0
30
.5
54.2
51
.2
24.1
26
.7
41.0
25
.0
33.0
37
.1
Sour
ce:
Mat
hem
atic
a Po
licy
Res
earc
h, In
c. P
atie
nt S
urve
y, c
ondu
cted
bet
wee
n M
ay 2
003
and
June
200
4.
Not
es:
See
Tabl
e IV
.1 fo
r the
full
nam
es o
f the
pro
gram
s.
Estim
ates
in b
oldf
ace
are
ones
that
are
mor
e th
an 1
stan
dard
dev
iatio
n ab
ove
or b
elow
the
mea
n ac
ross
all
site
s for
that
mea
sure
. Sh
aded
est
imat
es a
re
1 st
anda
rd d
evia
tion
abov
e th
e m
ean;
uns
hade
d bo
ldfa
ce e
stim
ates
are
1 st
anda
rd d
evia
tion
belo
w th
e m
ean.
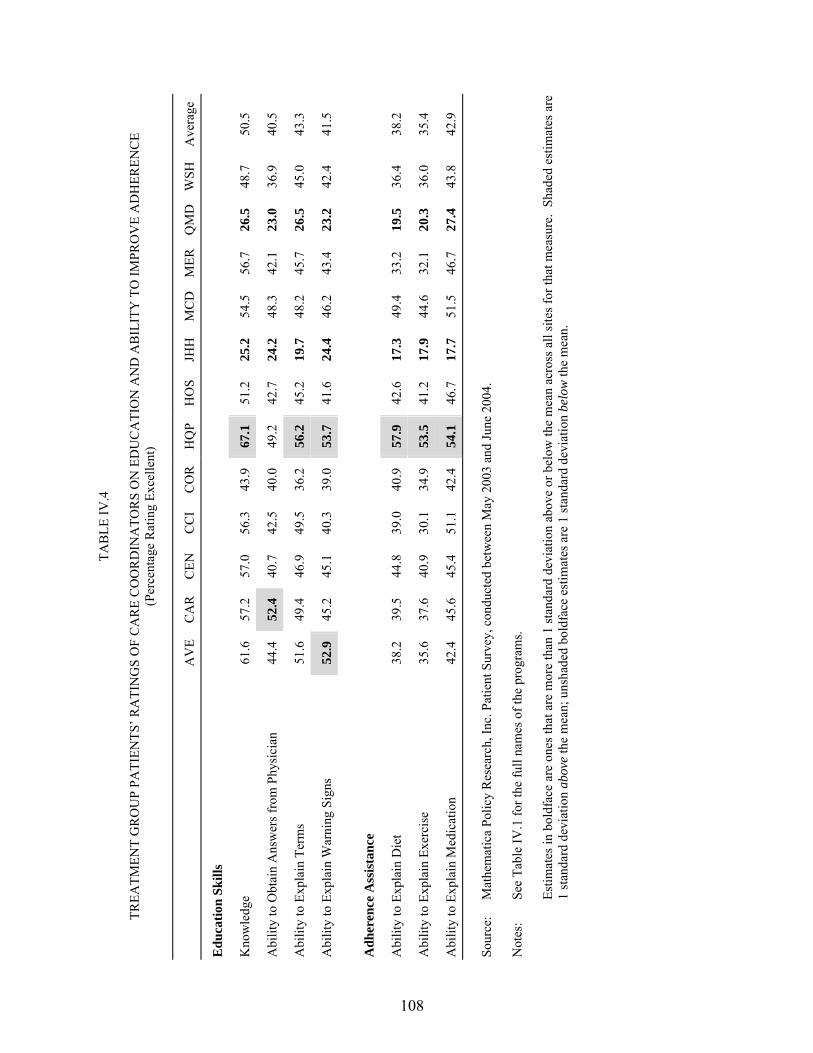
108
TAB
LE IV
.4
TR
EATM
ENT
GR
OU
P PA
TIEN
TS� R
ATI
NG
S O
F C
AR
E C
OO
RD
INA
TOR
S O
N E
DU
CA
TIO
N A
ND
AB
ILIT
Y T
O IM
PRO
VE
AD
HER
ENC
E (P
erce
ntag
e R
atin
g Ex
celle
nt)
A
VE
CA
R
CEN
C
CI
CO
R
HQ
P H
OS
JHH
M
CD
MER
Q
MD
WSH
Ave
rage
Edu
catio
n Sk
ills
Kno
wle
dge
61.6
57
.2
57.0
56
.3
43.9
67
.1
51.2
25
.2
54.5
56
.7
26.5
48
.7
50.5
Abi
lity
to O
btai
n A
nsw
ers f
rom
Phy
sici
an
44.4
52
.4
40.7
42
.5
40.0
49
.2
42.7
24
.2
48.3
42
.1
23.0
36
.9
40.5
Abi
lity
to E
xpla
in T
erm
s 51
.6
49.4
46
.9
49.5
36
.2
56.2
45
.2
19.7
48
.2
45.7
26
.5
45.0
43
.3
Abi
lity
to E
xpla
in W
arni
ng S
igns
52
.9
45.2
45
.1
40.3
39
.0
53.7
41
.6
24.4
46
.2
43.4
23
.2
42.4
41
.5
Adh
eren
ce A
ssis
tanc
e
Abi
lity
to E
xpla
in D
iet
38.2
39
.5
44.8
39
.0
40.9
57
.9
42.6
17
.3
49.4
33
.2
19.5
36
.4
38.2
Abi
lity
to E
xpla
in E
xerc
ise
35.6
37
.6
40.9
30
.1
34.9
53
.5
41.2
17
.9
44.6
32
.1
20.3
36
.0
35.4
Abi
lity
to E
xpla
in M
edic
atio
n 42
.4
45.6
45
.4
51.1
42
.4
54.1
46
.7
17.7
51
.5
46.7
27
.4
43.8
42
.9
Sour
ce:
Mat
hem
atic
a Po
licy
Res
earc
h, In
c. P
atie
nt S
urve
y, c
ondu
cted
bet
wee
n M
ay 2
003
and
June
200
4.
Not
es:
See
Tabl
e IV
.1 fo
r the
full
nam
es o
f the
pro
gram
s.
Estim
ates
in b
oldf
ace
are
ones
that
are
mor
e th
an 1
stan
dard
dev
iatio
n ab
ove
or b
elow
the
mea
n ac
ross
all
site
s for
that
mea
sure
. Sh
aded
est
imat
es a
re
1 st
anda
rd d
evia
tion
abov
e th
e m
ean;
uns
hade
d bo
ldfa
ce e
stim
ates
are
1 st
anda
rd d
evia
tion
belo
w th
e m
ean.
109
Patients had high praise for the care coordinators� ability to educate them. On average, more
than one-half the patients gave a rating of excellent on the care coordinators� knowledge, and for
only two programs did fewer than 43 percent of patients give such a rating (Table IV.4). On
average, about 40 to 43 percent of patients rated their programs� care coordinators as excellent
on their ability to explain symptoms or get physicians to answer questions or help them to
identify warning symptoms of their medical conditions; these rates varied only moderately across
most programs.
A similarly modest proportion of patients gave excellent ratings on the ability of their
programs� care coordinators to explain recommended diet, medication, and exercise regimens
(Table IV.4). Of all the measures, patients were least likely to give coordinators very high marks
on their ability to explain exercise regimens. Again, however, few patients in most programs
rated the programs as fair or poor on these indicators (not shown). The somewhat lower ratings
on these measures may reflect the difficulty of helping patients to adhere to treatment
recommendations, or that education on exercise was a less intense focus for the care
coordinators. Health Quality Partners received markedly higher ratings than did the other
programs on all four measures of the coordinators� ability to explain recommendations. These
high patient ratings were consistent with the scoring results described in Chapter II, in which
Health Quality Partners had the highest ranking of the 15 programs on patient education and was
one of the most highly ranked on monitoring as well.
Overall, a consistent pattern emerges from these numerous measures of patient ratings of
their care coordination intervention, with Health Quality Partners consistently receiving notably
higher marks than other programs. Carle and Avera also were rated highly on some measures,
especially those related to support and service arrangement. Avera�s high ranking on explaining
early warning signs is consistent with the scoring algorithm�s strong rating of Avera on
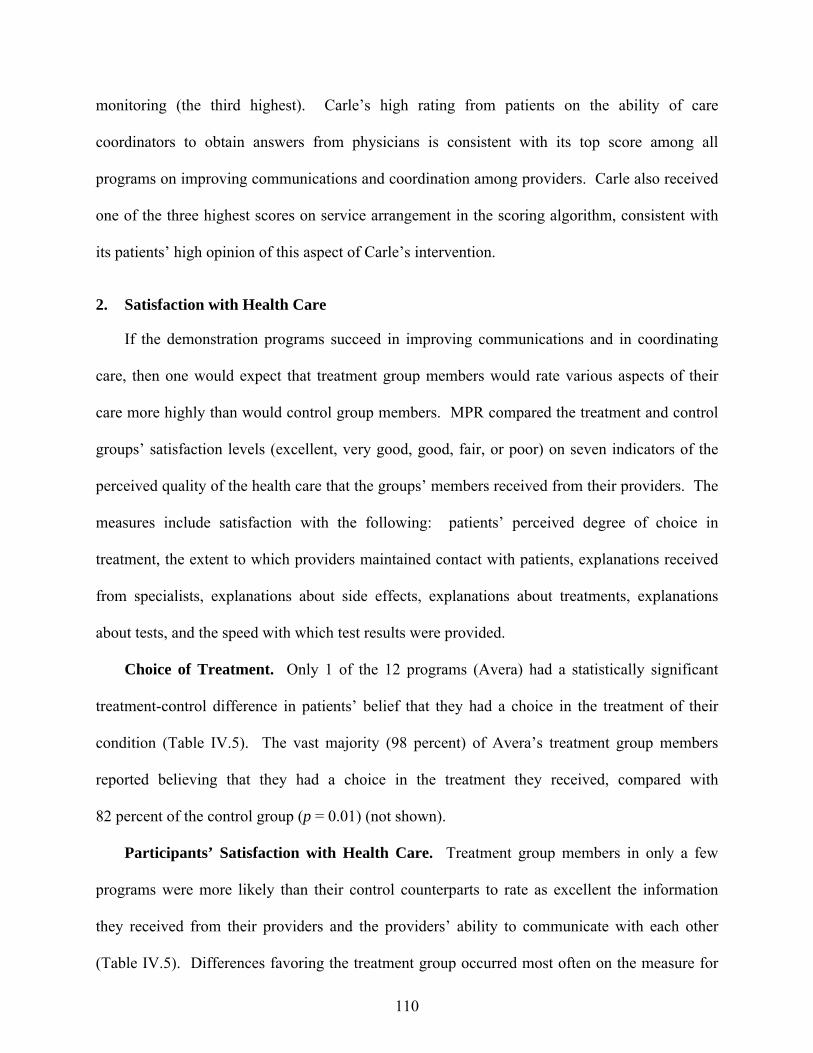
110
monitoring (the third highest). Carle�s high rating from patients on the ability of care
coordinators to obtain answers from physicians is consistent with its top score among all
programs on improving communications and coordination among providers. Carle also received
one of the three highest scores on service arrangement in the scoring algorithm, consistent with
its patients� high opinion of this aspect of Carle�s intervention.
2. Satisfaction with Health Care
If the demonstration programs succeed in improving communications and in coordinating
care, then one would expect that treatment group members would rate various aspects of their
care more highly than would control group members. MPR compared the treatment and control
groups� satisfaction levels (excellent, very good, good, fair, or poor) on seven indicators of the
perceived quality of the health care that the groups� members received from their providers. The
measures include satisfaction with the following: patients� perceived degree of choice in
treatment, the extent to which providers maintained contact with patients, explanations received
from specialists, explanations about side effects, explanations about treatments, explanations
about tests, and the speed with which test results were provided.
Choice of Treatment. Only 1 of the 12 programs (Avera) had a statistically significant
treatment-control difference in patients� belief that they had a choice in the treatment of their
condition (Table IV.5). The vast majority (98 percent) of Avera�s treatment group members
reported believing that they had a choice in the treatment they received, compared with
82 percent of the control group (p = 0.01) (not shown).
Participants’ Satisfaction with Health Care. Treatment group members in only a few
programs were more likely than their control counterparts to rate as excellent the information
they received from their providers and the providers� ability to communicate with each other
(Table IV.5). Differences favoring the treatment group occurred most often on the measure for
111
TAB
LE IV
.5
SUM
MA
RY
OF
ESTI
MA
TED
EFF
ECTS
ON
PA
TIEN
TS� S
ATI
SFA
CTI
ON
-WIT
H-C
AR
E M
EASU
RES
A
VE
CA
R
CEN
C
CI
CO
R
HO
S H
QP
JHH
M
CD
M
ER
QM
D
WSH
A
cces
s to
Car
e C
oord
inat
or a
nd T
reat
men
t Cho
ice
Bel
ieve
d a
choi
ce in
trea
tmen
t of c
ondi
tion
was
ava
ilabl
e ++
Patie
nts�
Rat
ings
(Per
cent
age
Exce
llent
)
Pr
ovid
ers k
eep
in to
uch
with
eac
h ot
her
++
++
+
+
+
Expl
anat
ions
from
spec
ialis
ts
++
++
Expl
anat
ions
of p
ossi
ble
side
eff
ects
+
+
+
Ex
plan
atio
ns o
f tre
atm
ent
+
+
+
+
How
qui
ckly
rece
ived
test
resu
lts
Expl
anat
ions
of t
est r
esul
ts
++
So
urce
: M
athe
mat
ica
Polic
y R
esea
rch,
Inc.
Pat
ient
Sur
vey,
con
duct
ed b
etw
een
May
200
3 an
d Ju
ne 2
004.
N
ote:
Se
e Ta
ble
IV.1
for t
he fu
ll na
mes
of t
he p
rogr
ams.
+Si
gnifi
es s
tatis
tical
ly s
igni
fican
t tre
atm
ent-c
ontro
l diff
eren
ce (p
< 0
.10)
that
favo
rs th
e tre
atm
ent g
roup
and
is m
odes
t (le
ss th
an 1
0 pe
rcen
tage
poi
nts
and
less
than
one
-hal
f the
si
ze o
f the
con
trol g
roup
pro
porti
on [p
c] o
r its
com
plem
ent [
1-pc
]).
++Si
gnifi
es s
tatis
tical
ly s
igni
fican
t tre
atm
ent-c
ontro
l diff
eren
ce (p
< 0
.10)
that
favo
rs th
e tre
atm
ent g
roup
and
is la
rge
(mor
e th
an 1
0 pe
rcen
tage
poi
nts
or a
t lea
st o
ne-h
alf t
he s
ize
of th
e co
ntro
l gro
up p
ropo
rtion
[pc]
or i
ts c
ompl
emen
t [1-
pc])
.
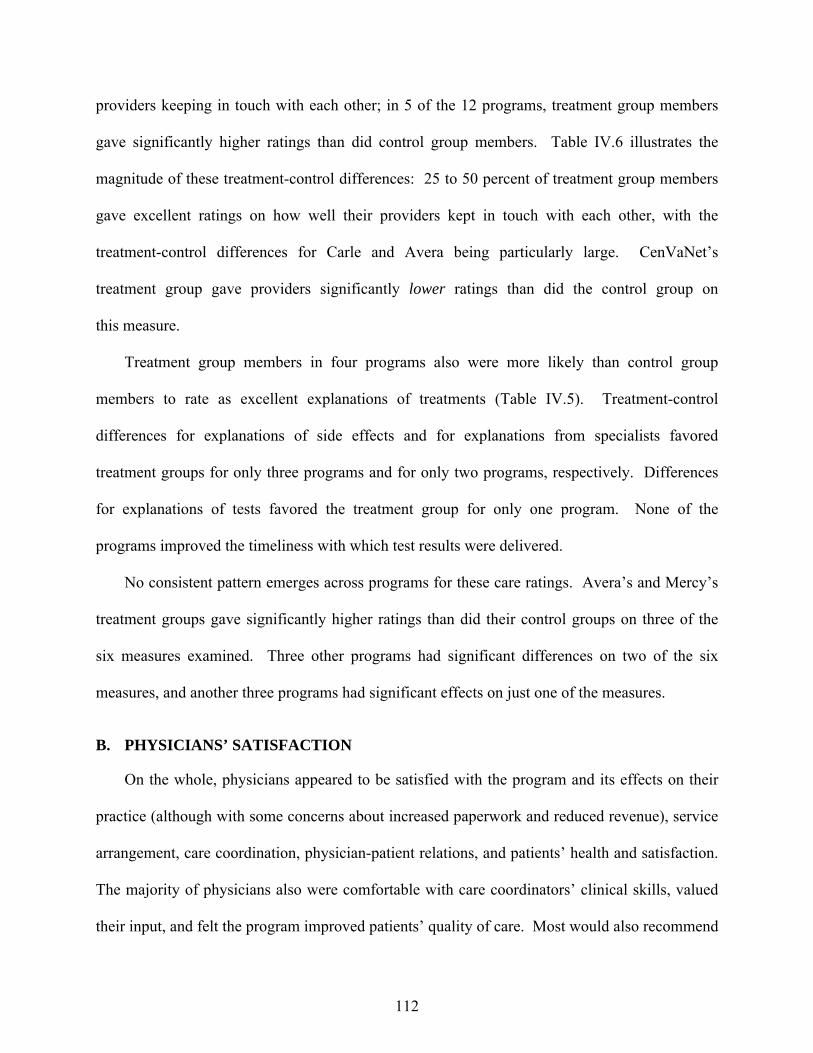
112
providers keeping in touch with each other; in 5 of the 12 programs, treatment group members
gave significantly higher ratings than did control group members. Table IV.6 illustrates the
magnitude of these treatment-control differences: 25 to 50 percent of treatment group members
gave excellent ratings on how well their providers kept in touch with each other, with the
treatment-control differences for Carle and Avera being particularly large. CenVaNet�s
treatment group gave providers significantly lower ratings than did the control group on
this measure.
Treatment group members in four programs also were more likely than control group
members to rate as excellent explanations of treatments (Table IV.5). Treatment-control
differences for explanations of side effects and for explanations from specialists favored
treatment groups for only three programs and for only two programs, respectively. Differences
for explanations of tests favored the treatment group for only one program. None of the
programs improved the timeliness with which test results were delivered.
No consistent pattern emerges across programs for these care ratings. Avera�s and Mercy�s
treatment groups gave significantly higher ratings than did their control groups on three of the
six measures examined. Three other programs had significant differences on two of the six
measures, and another three programs had significant effects on just one of the measures.
B. PHYSICIANS’ SATISFACTION
On the whole, physicians appeared to be satisfied with the program and its effects on their
practice (although with some concerns about increased paperwork and reduced revenue), service
arrangement, care coordination, physician-patient relations, and patients� health and satisfaction.
The majority of physicians also were comfortable with care coordinators� clinical skills, valued
their input, and felt the program improved patients� quality of care. Most would also recommend
113
TAB
LE IV
.6
IL
LUST
RA
TIV
E O
UTC
OM
ES F
OR
PA
TIEN
TS� S
ATI
SFA
CTI
ON
WIT
H H
EALT
H C
AR
E (P
erce
ntag
e R
atin
g Ex
celle
nt)
A
VE
CA
R
CEN
C
CI
CO
R
HQ
P H
OS
JHH
M
CD
M
ER
QM
D
WSH
Pr
ovid
ers K
eep
in T
ouch
with
Eac
h O
ther
Tr
eatm
ent
46.3
44
.8
31.9
33
.1
33.0
43
.9
30.2
25
.6
47.1
35
.1
29.6
34
.0
Con
trol
31.1
27
.6
37.1
30
.7
32.1
36
.4
24.7
19
.9
41.8
27
.4
25.9
36
.0
Diff
eren
ce
15.2
***
17.2
***
-5.3
* 2.
4*
0.9
7.5*
5.
4 5.
7 5.
2 7.
7**
3.7
-2.0
p-
Val
ue
0.00
9 0.
000
0.06
3 0.
068
0.98
6 0.
053
0.14
2 0.
228
0.38
0 0.
015
0.83
7 0.
808
Expl
anat
ions
of P
ossi
ble
Side
Eff
ects
Tr
eatm
ent
29.3
29
.9
23.1
20
.8
25.2
27
.7
23.1
12
.4
30.0
23
.7
29.8
26
.4
Con
trol
19.1
22
.7
25.1
19
.0
25.3
27
.7
17.0
15
.4
25.4
18
.6
25.5
24
.4
Diff
eren
ce
10.2
7.
2*
-2.0
1.
7 -0
.1
0.0
6.1*
-3
.0
4.6
5.1*
4.
4 2.
1 p-
Val
ue
0.11
5 0.
089
0.85
9 0.
303
0.23
3 0.
836
0.08
0 0.
626
0.17
6 0.
074
0.59
4 0.
658
Sour
ce:
Mat
hem
atic
a Po
licy
Res
earc
h, In
c. P
atie
nt S
urve
y, c
ondu
cted
bet
wee
n M
ay 2
003
and
June
200
4.
Not
e:
See
Tabl
e IV
.1 fo
r the
full
nam
es o
f the
pro
gram
s.
*Si
gnifi
cant
ly d
iffer
ent f
rom
0 a
t the
0.1
0 le
vel,
2-ta
iled
test
. *
*Sig
nific
antly
diff
eren
t fro
m 0
at t
he 0
.05
leve
l, 2-
taile
d te
st.
***S
igni
fican
tly d
iffer
ent f
rom
0 a
t the
0.0
1 le
vel,
2-ta
iled
test
.
114
the program to other physicians. Opinions were more mixed about the program�s effect on
patients� self-management behavior.
To assess physicians� satisfaction, the evaluation examined physicians� responses to survey
questions in eight areas. Six areas focused on physicians� opinions about the programs�
perceived effects, including effects on (1) their medical practice, (2) patients� self-management,
(3) service arrangements for patients, (4) care coordination, (5) their own relationships with their
patients, and (6) patient outcomes. For the seventh area, physicians were asked to rate care
coordinators� clinical competence. For the eighth area, they were asked to provide an overall
assessment of the care coordination program.
The physician survey was conducted at all 15 programs and in 2 waves, each intended to
yield completed surveys on a sample of 25 physicians from each program (or on the number that
could be obtained, if the patients in a particular program identified fewer than 25 physicians).
The first wave of the survey began in June 2003; the sample for that wave was drawn from the
physicians identified by treatment group patients who enrolled during the first 9 months after
program startup. (At the time of enrollment, patients were asked to name the physician whom
they saw most often for care for their targeted health problems.) The second-wave sample,
which began in May 2004, was drawn from physicians identified by patients enrolling between
10 and 20 months after program startup. In order to obtain 25 completed interviews, a sample of
37 physicians for each program was selected (assuming a 70-percent completion rate).
Physicians were selected for the survey with probability proportional to the number of treatment
group members in their practices. If treatment group members enrolled in a program identified
fewer than 37 different physicians, all of the physicians of that program were interviewed.
The interviews were conducted by telephone, using computer-assisted software, and took an
average of 12 minutes to complete. The total number of physicians surveyed was 1,018, and the
overall response rate was about 64 percent (Table IV.7). Physicians who were contacted but
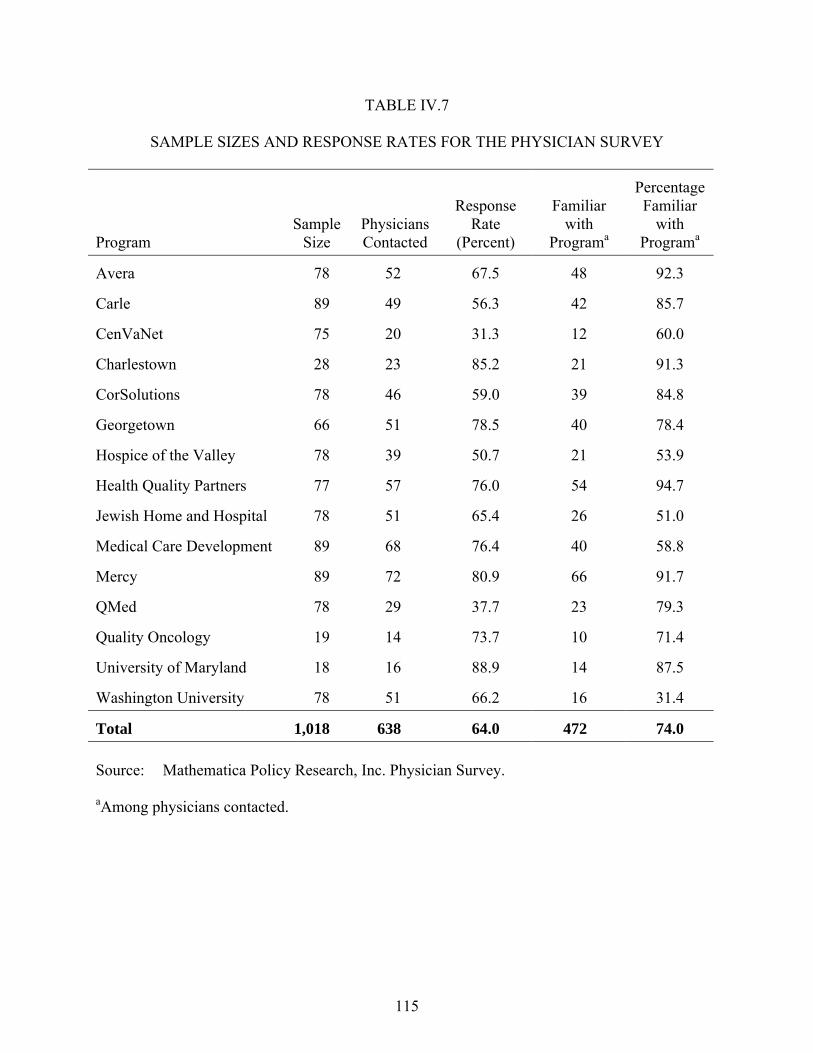
115
TABLE IV.7
SAMPLE SIZES AND RESPONSE RATES FOR THE PHYSICIAN SURVEY
Program Sample
Size Physicians Contacted
Response Rate
(Percent)
Familiar with
Programa
Percentage Familiar
with Programa
Avera 78 52 67.5 48 92.3
Carle 89 49 56.3 42 85.7
CenVaNet 75 20 31.3 12 60.0
Charlestown 28 23 85.2 21 91.3
CorSolutions 78 46 59.0 39 84.8
Georgetown 66 51 78.5 40 78.4
Hospice of the Valley 78 39 50.7 21 53.9
Health Quality Partners 77 57 76.0 54 94.7
Jewish Home and Hospital 78 51 65.4 26 51.0
Medical Care Development 89 68 76.4 40 58.8
Mercy 89 72 80.9 66 91.7
QMed 78 29 37.7 23 79.3
Quality Oncology 19 14 73.7 10 71.4
University of Maryland 18 16 88.9 14 87.5
Washington University 78 51 66.2 16 31.4
Total 1,018 638 64.0 472 74.0 Source: Mathematica Policy Research, Inc. Physician Survey. aAmong physicians contacted.

116
who did not recognize the program name were not interviewed any further, as they would not
have been able to answer the questions about their reactions to the demonstration programs.
About 25 percent of the physicians who were contacted were not familiar with the program.
With respect to the findings, physicians in Charlestown appeared to be the most satisfied
compared with physicians in other programs on the majority of the measures. Physicians in
QMed appeared to be the least satisfied.
1. Effects on Physicians’ Practice
Physicians generally believed that the programs had favorable effects on their practices, with
the average percentage of physicians across programs who gave favorable ratings ranging from
4 to 75 percent for the 10 measures (Table IV.8). Physicians were especially appreciative of the
programs� help in making it easier overall to care for patients; 75 percent of physicians across all
the programs reported that the programs made overall care at least a little easier. However, they
did not typically give high ratings to the usefulness of the reports generated by the programs.
Only 42 percent said the reports were very useful.
Physicians� perceptions varied across measures and across programs. On the one hand, for
example, 9 of 10 physicians at the University of Maryland found the program�s reports to be
very useful, and 95 percent of Carle�s physicians believed that the program helped to make their
care more evidence-based. On the other hand, QMed was given low ratings by physicians on
reducing paperwork and telephone burden; more than one-half its patients� physicians reported
that the program increased their paperwork burden (not shown).
Z-scores were calculated to compare the programs across the various measures of
physicians� practice. The Z-score yields a standardized measure for each program indicating
how far, and in what direction, that program�s score deviates from the mean for all of the
programs on a particular outcome.
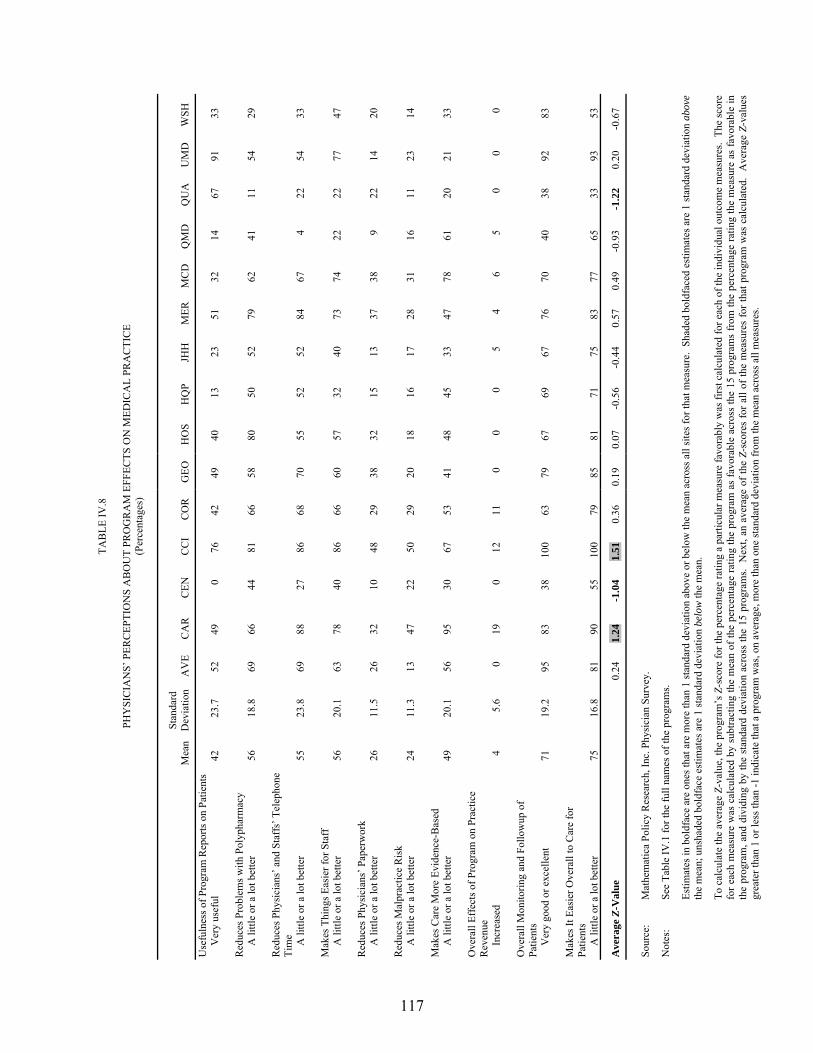
117
TAB
LE IV
.8
PH
YSI
CIA
NS�
PER
CEP
TIO
NS
AB
OU
T PR
OG
RA
M E
FFEC
TS O
N M
EDIC
AL
PRA
CTI
CE
(Per
cent
ages
)
M
ean
Stan
dard
D
evia
tion
AV
E C
AR
C
EN
CC
I C
OR
G
EO
HO
S H
QP
JHH
M
ER
MC
D
QM
D
QU
A
UM
D
WSH
Use
fuln
ess o
f Pro
gram
Rep
orts
on
Patie
nts
V
ery
usef
ul
42
23.7
52
49
0
76
42
49
40
13
23
51
32
14
67
91
33
Red
uces
Pro
blem
s with
Pol
ypha
rmac
y
A li
ttle
or a
lot b
ette
r 56
18
.8
69
66
44
81
66
58
80
50
52
79
62
41
11
54
29
Red
uces
Phy
sici
ans�
and
Sta
ffs�
Tel
epho
ne
Tim
e
A li
ttle
or a
lot b
ette
r 55
23
.8
69
88
27
86
68
70
55
52
52
84
67
4 22
54
33
M
akes
Thi
ngs E
asie
r for
Sta
ff
A li
ttle
or a
lot b
ette
r 56
20
.1
63
78
40
86
66
60
57
32
40
73
74
22
22
77
47
Red
uces
Phy
sici
ans�
Pap
erw
ork
A li
ttle
or a
lot b
ette
r 26
11
.5
26
32
10
48
29
38
32
15
13
37
38
9 22
14
20
R
educ
es M
alpr
actic
e R
isk
A li
ttle
or a
lot b
ette
r 24
11
.3
13
47
22
50
29
20
18
16
17
28
31
16
11
23
14
Mak
es C
are
Mor
e Ev
iden
ce-B
ased
A li
ttle
or a
lot b
ette
r 49
20
.1
56
95
30
67
53
41
48
45
33
47
78
61
20
21
33
Ove
rall
Effe
cts o
f Pro
gram
on
Prac
tice
Rev
enue
Incr
ease
d 4
5.6
0 19
0
12
11
0 0
0 5
4 6
5 0
0 0
Ove
rall
Mon
itorin
g an
d Fo
llow
up o
f Pa
tient
s
Ver
y go
od o
r exc
elle
nt
71
19.2
95
83
38
10
0 63
79
67
69
67
76
70
40
38
92
83
M
akes
It E
asie
r Ove
rall
to C
are
for
Patie
nts
A li
ttle
or a
lot b
ette
r 75
16
.8
81
90
55
100
79
85
81
71
75
83
77
65
33
93
53
Ave
rage
Z-V
alue
0.
24
1.24
-1
.04
1.51
0.
36
0.19
0.
07
-0.5
6 -0
.44
0.57
0.
49
-0.9
3 -1
.22
0.20
-0
.67
Sour
ce:
Mat
hem
atic
a Po
licy
Res
earc
h, In
c. P
hysi
cian
Sur
vey.
Not
es:
See
Tabl
e IV
.1 fo
r the
full
nam
es o
f the
pro
gram
s.
Estim
ates
in b
oldf
ace
are
ones
that
are
mor
e th
an 1
stan
dard
dev
iatio
n ab
ove
or b
elow
the
mea
n ac
ross
all
site
s for
that
mea
sure
. Sh
aded
bol
dfac
ed e
stim
ates
are
1 st
anda
rd d
evia
tion
abov
e th
e m
ean;
uns
hade
d bo
ldfa
ce e
stim
ates
are
1 st
anda
rd d
evia
tion
belo
w th
e m
ean.
To c
alcu
late
the
aver
age
Z-va
lue,
the
prog
ram
�s Z
-sco
re fo
r the
per
cent
age
ratin
g a
parti
cula
r mea
sure
favo
rabl
y w
as fi
rst c
alcu
late
d fo
r eac
h of
the
indi
vidu
al o
utco
me
mea
sure
s. T
he sc
ore
for e
ach
mea
sure
was
cal
cula
ted
by s
ubtra
ctin
g th
e m
ean
of th
e pe
rcen
tage
ratin
g th
e pr
ogra
m a
s fa
vora
ble
acro
ss th
e 15
pro
gram
s fr
om th
e pe
rcen
tage
ratin
g th
e m
easu
re a
s fa
vora
ble
in
the
prog
ram
, and
div
idin
g by
the
stan
dard
dev
iatio
n ac
ross
the
15 p
rogr
ams.
Nex
t, an
ave
rage
of t
he Z
-sco
res
for a
ll of
the
mea
sure
s fo
r tha
t pro
gram
was
cal
cula
ted.
Ave
rage
Z-v
alue
s gr
eate
r tha
n 1
or le
ss th
an -1
indi
cate
that
a p
rogr
am w
as, o
n av
erag
e, m
ore
than
one
stan
dard
dev
iatio
n fr
om th
e m
ean
acro
ss a
ll m
easu
res.

118
The physicians of two programs (Carle and Charlestown) consistently rated their programs
more highly in terms on their effect on medical practice than did the physicians of the other
programs. Quality Oncology�s and CenVaNet�s physicians consistently rated their programs
lower than did the other programs� physicians, by more than one standard deviation, on average,
across the 10 measures.
2. Effects on Patients’ Self-Management
Overall, physicians found that the MCCD programs did not have much effect on improving
patients� self-management behaviors (Table IV.9). More than one-half of all physicians believed
that their programs improved patients� medication adherence (59 percent), ability to monitor
themselves (59 percent), and ability to make and keep appointments (54 percent). These
percentages imply, however, that more than 40 percent of the physicians believed that the
programs did not improve those behaviors. Fewer physicians believed that the MCCD was as
strong in improving their patients� exercise habits or diets; only 22 percent and 36 percent of
physicians felt that the programs improved their patients� exercise habits and diets, respectively.
About one-half of physicians (51 percent) thought that the MCCD did a very good or excellent
job overall in improving patients� self-management behaviors.
There was wide variation across the programs on individual measures. On the one hand, for
example, 9 of 10 physicians associated with the University of Maryland believed that the
program improved patients� ability to monitor themselves. Medical Care Development�s effect
on improving its patients� exercise habits was rated relatively highly, with its physicians rating
the program higher compared with physicians of other programs by almost 2 standard deviations.
Moreover, physicians in two programs (Avera and Charlestown) consistently rated their
programs� effects on all six patient self-management behaviors higher than did physicians in the
other programs, by more than 1 standard deviation, on average. On the other hand, physicians in
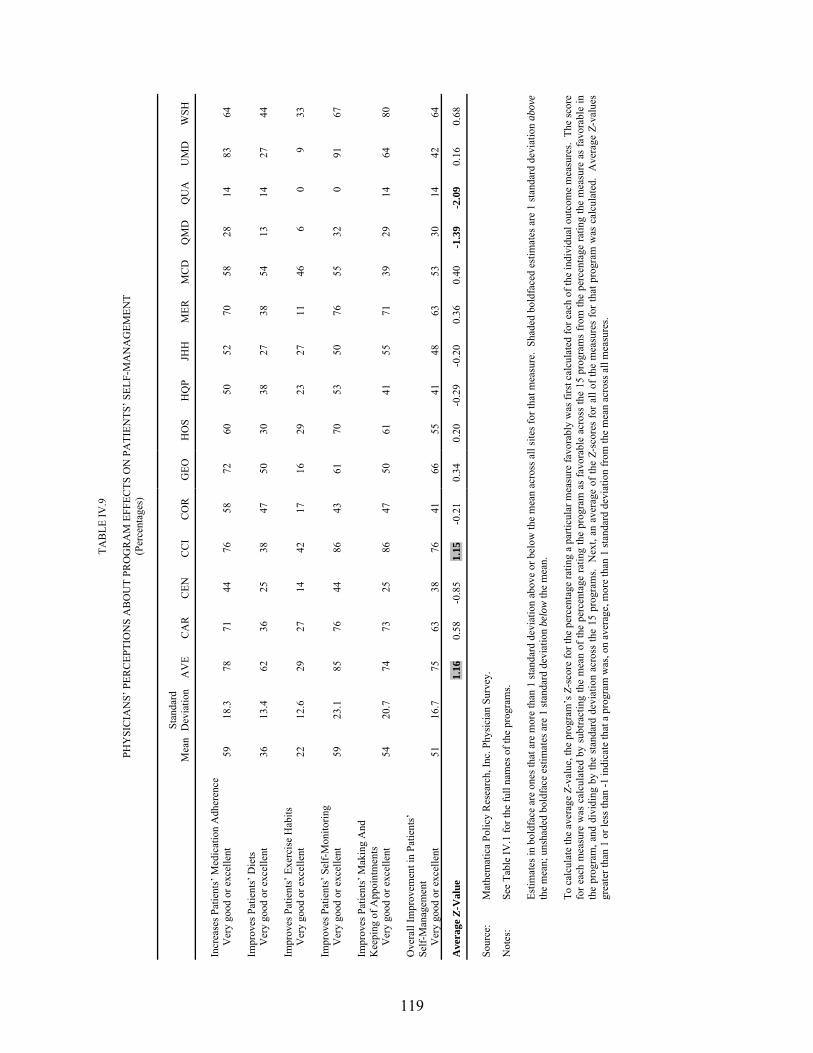
119
TAB
LE IV
.9
PH
YSI
CIA
NS�
PER
CEP
TIO
NS
AB
OU
T PR
OG
RA
M E
FFEC
TS O
N P
ATI
ENTS
� SEL
F-M
AN
AG
EMEN
T (P
erce
ntag
es)
M
ean
Stan
dard
D
evia
tion
AV
E C
AR
C
EN
CC
I C
OR
G
EO
HO
S H
QP
JHH
M
ER
MC
D
QM
D
QU
A
UM
D
WSH
Incr
ease
s Pat
ient
s� M
edic
atio
n A
dher
ence
Ver
y go
od o
r exc
elle
nt
59
18.3
78
71
44
76
58
72
60
50
52
70
58
28
14
83
64
Im
prov
es P
atie
nts�
Die
ts
Ver
y go
od o
r exc
elle
nt
36
13.4
62
36
25
38
47
50
30
38
27
38
54
13
14
27
44
Im
prov
es P
atie
nts�
Exe
rcis
e H
abits
Ver
y go
od o
r exc
elle
nt
22
12.6
29
27
14
42
17
16
29
23
27
11
46
6
0 9
33
Impr
oves
Pat
ient
s� S
elf-
Mon
itorin
g
Ver
y go
od o
r exc
elle
nt
59
23.1
85
76
44
86
43
61
70
53
50
76
55
32
0
91
67
Impr
oves
Pat
ient
s� M
akin
g A
nd
Kee
ping
of A
ppoi
ntm
ents
Ver
y go
od o
r exc
elle
nt
54
20.7
74
73
25
86
47
50
61
41
55
71
39
29
14
64
80
O
vera
ll Im
prov
emen
t in
Patie
nts�
Se
lf-M
anag
emen
t
Ver
y go
od o
r exc
elle
nt
51
16.7
75
63
38
76
41
66
55
41
48
63
53
30
14
42
64
Ave
rage
Z-V
alue
1.
16
0.58
-0
.85
1.15
-0
.21
0.34
0.
20
-0.2
9 -0
.20
0.36
0.
40
-1.3
9 -2
.09
0.16
0.
68
Sour
ce:
Mat
hem
atic
a Po
licy
Res
earc
h, In
c. P
hysi
cian
Sur
vey.
Not
es:
See
Tabl
e IV
.1 fo
r the
full
nam
es o
f the
pro
gram
s.
Estim
ates
in b
oldf
ace
are
ones
that
are
mor
e th
an 1
stan
dard
dev
iatio
n ab
ove
or b
elow
the
mea
n ac
ross
all
site
s for
that
mea
sure
. Sh
aded
bol
dfac
ed e
stim
ates
are
1 st
anda
rd d
evia
tion
abov
e th
e m
ean;
uns
hade
d bo
ldfa
ce e
stim
ates
are
1 st
anda
rd d
evia
tion
belo
w th
e m
ean.
To c
alcu
late
the
aver
age
Z-va
lue,
the
prog
ram
�s Z
-sco
re fo
r the
per
cent
age
ratin
g a
parti
cula
r mea
sure
favo
rabl
y w
as fi
rst c
alcu
late
d fo
r eac
h of
the
indi
vidu
al o
utco
me
mea
sure
s. T
he sc
ore
for e
ach
mea
sure
was
cal
cula
ted
by s
ubtra
ctin
g th
e m
ean
of th
e pe
rcen
tage
ratin
g th
e pr
ogra
m a
s fa
vora
ble
acro
ss th
e 15
pro
gram
s fr
om th
e pe
rcen
tage
ratin
g th
e m
easu
re a
s fa
vora
ble
in
the
prog
ram
, and
div
idin
g by
the
stan
dard
dev
iatio
n ac
ross
the
15 p
rogr
ams.
Nex
t, an
ave
rage
of t
he Z
-sco
res
for a
ll of
the
mea
sure
s fo
r tha
t pro
gram
was
cal
cula
ted.
Ave
rage
Z-v
alue
s gr
eate
r tha
n 1
or le
ss th
an -1
indi
cate
that
a p
rogr
am w
as, o
n av
erag
e, m
ore
than
1 st
anda
rd d
evia
tion
from
the
mea
n ac
ross
all
mea
sure
s.

120
two other programs (QMed and Quality Oncology) consistently rated their programs less
favorably than did physicians in the other programs.
3. Effects on Service Arrangement
Overall, physicians were impressed with the programs� help in arranging other care for
patients (65 percent believed that their programs were helpful in this area) and in arranging
transportation or meals (66 percent) (Table IV.10). Physicians were much less impressed with
the programs� ability to help patients to obtain specialist appointments (41 percent) or expensive
prescriptions (46 percent).
Notable differences across programs and specific measures were reported. For example,
95 percent of its physicians believed that Charlestown�s program helped patients to arrange for
care, but only 11 percent of physicians in QMed believed that their program was helpful in this
area.1 In summarizing findings across the four measures of service arrangement, physicians in
two programs (Charlestown and Mercy) consistently rated their programs higher than did
physicians in the other programs, by more than 1 standard deviation, on average. Conversely,
the physicians of patients enrolled in QMed and Quality Oncology rated those programs
substantially lower.
4. Effects on Care Coordination
Even though care coordination was the focus of the MCCD, physicians� opinions about how
helpful the programs had been with various aspects of care coordination were decidedly mixed.
Across all programs, about one-half to two-thirds of physicians found that their programs were
1 In fact, helping patients to arrange for care was not part of QMed�s intervention. Again, as with the rating
scores in Chapter II, some of these survey results serve more of a descriptive purpose, as some programs intentionally designed interventions that did not focus on certain areas.
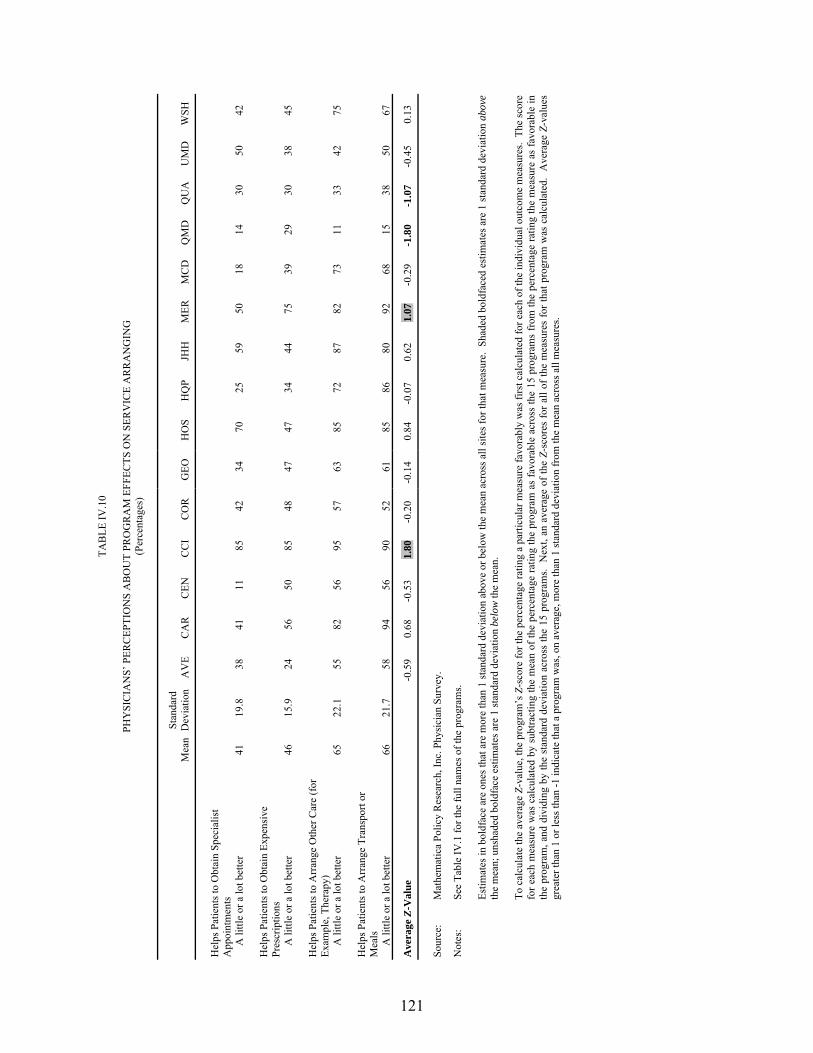
121
TAB
LE IV
.10
PH
YSI
CIA
NS�
PER
CEP
TIO
NS
AB
OU
T PR
OG
RA
M E
FFEC
TS O
N S
ERV
ICE
AR
RA
NG
ING
(P
erce
ntag
es)
M
ean
Stan
dard
D
evia
tion
AV
E C
AR
C
EN
CC
I C
OR
G
EO
HO
S H
QP
JHH
M
ER
MC
D
QM
D
QU
A
UM
D
WSH
Hel
ps P
atie
nts t
o O
btai
n Sp
ecia
list
App
oint
men
ts
A li
ttle
or a
lot b
ette
r 41
19
.8
38
41
11
85
42
34
70
25
59
50
18
14
30
50
42
Hel
ps P
atie
nts t
o O
btai
n Ex
pens
ive
Pres
crip
tions
A li
ttle
or a
lot b
ette
r 46
15
.9
24
56
50
85
48
47
47
34
44
75
39
29
30
38
45
Hel
ps P
atie
nts t
o A
rran
ge O
ther
Car
e (f
or
Exam
ple,
The
rapy
)
A li
ttle
or a
lot b
ette
r 65
22
.1
55
82
56
95
57
63
85
72
87
82
73
11
33
42
75
Hel
ps P
atie
nts t
o A
rran
ge T
rans
port
or
Mea
ls
A li
ttle
or a
lot b
ette
r 66
21
.7
58
94
56
90
52
61
85
86
80
92
68
15
38
50
67
Ave
rage
Z-V
alue
-0
.59
0.68
-0
.53
1.80
-0
.20
-0.1
4 0.
84
-0.0
7 0.
62
1.07
-0
.29
-1.8
0 -1
.07
-0.4
5 0.
13
Sour
ce:
Mat
hem
atic
a Po
licy
Res
earc
h, In
c. P
hysi
cian
Sur
vey.
Not
es:
See
Tabl
e IV
.1 fo
r the
full
nam
es o
f the
pro
gram
s.
Estim
ates
in b
oldf
ace
are
ones
that
are
mor
e th
an 1
stan
dard
dev
iatio
n ab
ove
or b
elow
the
mea
n ac
ross
all
site
s for
that
mea
sure
. Sh
aded
bol
dfac
ed e
stim
ates
are
1 st
anda
rd d
evia
tion
abov
e th
e m
ean;
uns
hade
d bo
ldfa
ce e
stim
ates
are
1 st
anda
rd d
evia
tion
belo
w th
e m
ean.
To c
alcu
late
the
aver
age
Z-va
lue,
the
prog
ram
�s Z
-sco
re fo
r the
per
cent
age
ratin
g a
parti
cula
r mea
sure
favo
rabl
y w
as fi
rst c
alcu
late
d fo
r eac
h of
the
indi
vidu
al o
utco
me
mea
sure
s. T
he sc
ore
for e
ach
mea
sure
was
cal
cula
ted
by s
ubtra
ctin
g th
e m
ean
of th
e pe
rcen
tage
ratin
g th
e pr
ogra
m a
s fa
vora
ble
acro
ss th
e 15
pro
gram
s fr
om th
e pe
rcen
tage
ratin
g th
e m
easu
re a
s fa
vora
ble
in
the
prog
ram
, and
div
idin
g by
the
stan
dard
dev
iatio
n ac
ross
the
15 p
rogr
ams.
Nex
t, an
ave
rage
of t
he Z
-sco
res
for a
ll of
the
mea
sure
s fo
r tha
t pro
gram
was
cal
cula
ted.
Ave
rage
Z-v
alue
s gr
eate
r tha
n 1
or le
ss th
an -1
indi
cate
that
a p
rogr
am w
as, o
n av
erag
e, m
ore
than
1 st
anda
rd d
evia
tion
from
the
mea
n ac
ross
all
mea
sure
s.

122
helpful in coordinating care with family members (69 percent), in resolving family conflicts
(50 percent), and in maintaining or improving continuity of care (66 percent) (Table IV.11).
Fewer than half of the physicians found their programs to be helpful in coordinating with other
physicians (41 percent), reducing the frequency of duplicate testing (41 percent), or in helping
their patients to deal with contradictory information (48 percent).
Some differences across the programs were particularly noteworthy. For example,
95 percent of Charlestown�s physicians believed that the program helped to maintain or improve
continuity of care, and 91 percent of Mercy�s physicians believed that the Mercy program helped
physicians to coordinate care with family members. In summarizing findings across the six
measures of care coordination, physicians in two programs (Charlestown and Mercy)
consistently rated their programs substantially higher than did physicians in the other programs.
Physicians in CenVaNet and QMed consistently rated their programs substantially lower, by an
average of more than 1 standard deviation.
5. Effects on Physician-Patient Relations
Physicians found that the programs had only a limited positive effect on improving
physician-patient relations, but they also believed that the programs produced few negative
effects. Most physicians believed that their patients accepted the programs: 80 percent of
physicians overall felt that their patients did not mind having the program involved
(Table IV.12). Nearly all physicians (95 percent) felt that the programs did not undermine their
patients� confidence in the physician care they received. However, only 40 percent of physicians
felt that the programs improved their relations with patients.
Analysis across the programs revealed some substantial differences in physicians� beliefs
about effects on physician-patient relations. For example, 57 percent of Charlestown�s
physicians believed that the program did improve relations with patients, a rating that was higher
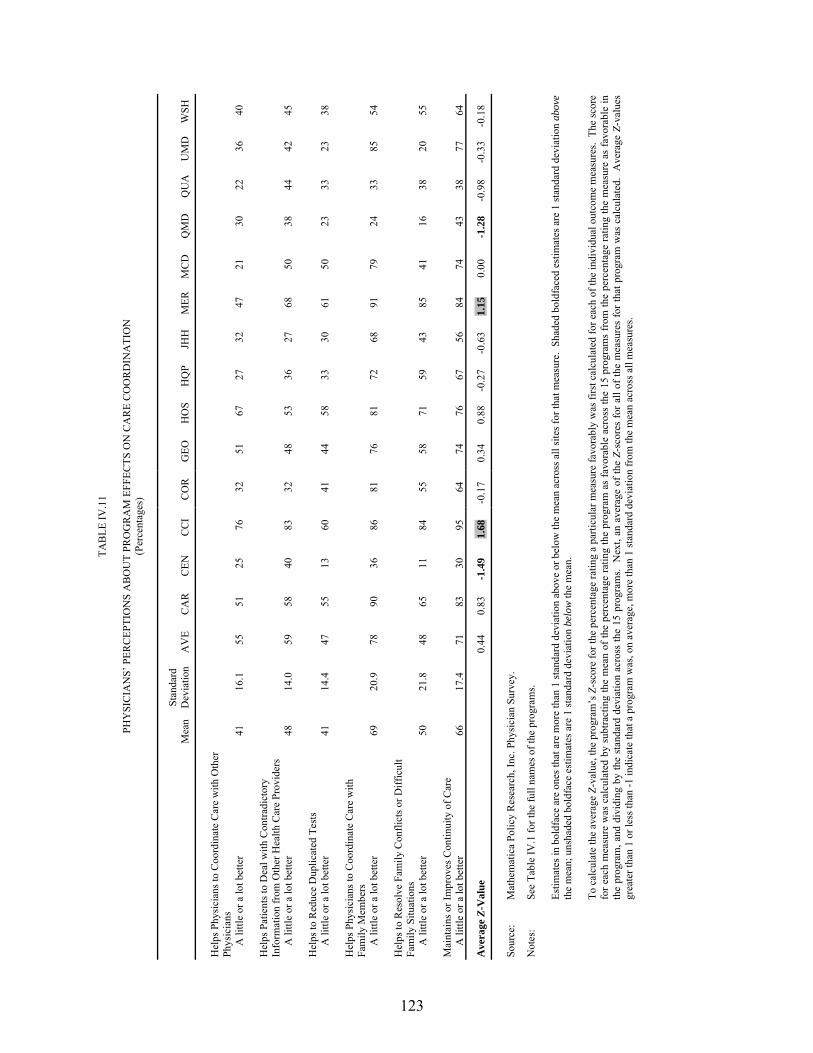
123
TAB
LE IV
.11
PH
YSI
CIA
NS�
PER
CEP
TIO
NS
AB
OU
T PR
OG
RA
M E
FFEC
TS O
N C
AR
E C
OO
RD
INA
TIO
N
(Per
cent
ages
)
M
ean
Stan
dard
D
evia
tion
AV
E C
AR
C
EN
CC
I C
OR
G
EO
HO
S H
QP
JHH
M
ERM
CD
Q
MD
Q
UA
U
MD
W
SH
Hel
ps P
hysi
cian
s to
Coo
rdin
ate
Car
e w
ith O
ther
Ph
ysic
ians
A li
ttle
or a
lot b
ette
r 41
16
.1
55
51
25
76
32
51
67
27
32
47
21
30
22
36
40
Hel
ps P
atie
nts t
o D
eal w
ith C
ontra
dict
ory
Info
rmat
ion
from
Oth
er H
ealth
Car
e Pr
ovid
ers
A li
ttle
or a
lot b
ette
r 48
14
.0
59
58
40
83
32
48
53
36
27
68
50
38
44
42
45
Hel
ps to
Red
uce
Dup
licat
ed T
ests
A li
ttle
or a
lot b
ette
r 41
14
.4
47
55
13
60
41
44
58
33
30
61
50
23
33
23
38
Hel
ps P
hysi
cian
s to
Coo
rdin
ate
Car
e w
ith
Fam
ily M
embe
rs
A li
ttle
or a
lot b
ette
r 69
20
.9
78
90
36
86
81
76
81
72
68
91
79
24
33
85
54
Hel
ps to
Res
olve
Fam
ily C
onfli
cts o
r Diff
icul
t Fa
mily
Situ
atio
ns
A li
ttle
or a
lot b
ette
r 50
21
.8
48
65
11
84
55
58
71
59
43
85
41
16
38
20
55
Mai
ntai
ns o
r Im
prov
es C
ontin
uity
of C
are
A li
ttle
or a
lot b
ette
r 66
17
.4
71
83
30
95
64
74
76
67
56
84
74
43
38
77
64
Ave
rage
Z-V
alue
0.
44
0.83
-1
.49
1.68
-0
.17
0.34
0.
88
-0.2
7 -0
.63
1.15
0.
00
-1.2
8 -0
.98
-0.3
3 -0
.18
So
urce
: M
athe
mat
ica
Polic
y R
esea
rch,
Inc.
Phy
sici
an S
urve
y.
Not
es:
See
Tabl
e IV
.1 fo
r the
full
nam
es o
f the
pro
gram
s.
Estim
ates
in b
oldf
ace
are
ones
that
are
mor
e th
an 1
stan
dard
dev
iatio
n ab
ove
or b
elow
the
mea
n ac
ross
all
site
s for
that
mea
sure
. Sh
aded
bol
dfac
ed e
stim
ates
are
1 st
anda
rd d
evia
tion
abov
e th
e m
ean;
uns
hade
d bo
ldfa
ce e
stim
ates
are
1 st
anda
rd d
evia
tion
belo
w th
e m
ean.
To c
alcu
late
the
aver
age
Z-va
lue,
the
prog
ram
�s Z
-sco
re fo
r the
per
cent
age
ratin
g a
parti
cula
r mea
sure
favo
rabl
y w
as fi
rst c
alcu
late
d fo
r eac
h of
the
indi
vidu
al o
utco
me
mea
sure
s. T
he sc
ore
for e
ach
mea
sure
was
cal
cula
ted
by s
ubtra
ctin
g th
e m
ean
of th
e pe
rcen
tage
ratin
g th
e pr
ogra
m a
s fa
vora
ble
acro
ss th
e 15
pro
gram
s fr
om th
e pe
rcen
tage
ratin
g th
e m
easu
re a
s fa
vora
ble
in
the
prog
ram
, and
div
idin
g by
the
stan
dard
dev
iatio
n ac
ross
the
15 p
rogr
ams.
Nex
t, an
ave
rage
of t
he Z
-sco
res
for a
ll of
the
mea
sure
s fo
r tha
t pro
gram
was
cal
cula
ted.
Ave
rage
Z-v
alue
s gr
eate
r tha
n 1
or le
ss th
an -1
indi
cate
that
a p
rogr
am w
as, o
n av
erag
e, m
ore
than
1 st
anda
rd d
evia
tion
from
the
mea
n ac
ross
all
mea
sure
s.

124
TAB
LE IV
.12
PH
YSI
CIA
NS�
PER
CEP
TIO
NS
AB
OU
T P
RO
GR
AM
EFF
ECTS
ON
PH
YSI
CIA
N-P
ATI
ENT
REL
ATI
ON
S (P
erce
ntag
es)
M
ean
Stan
dard
D
evia
tion
AV
E C
AR
C
EN
CC
I C
OR
G
EO
HO
S H
QP
JHH
M
ERM
CD
Q
MD
Q
UA
U
MD
W
SH
Patie
nts D
o N
ot M
ind
Hav
ing
Prog
ram
In
volv
ed
Som
ewha
t or s
trong
ly a
gree
80
11
.0
89
93
64
95
67
79
81
72
87
82
82
59
67
92
85
Prog
ram
Doe
s Not
Und
erm
ine
Patie
nts�
C
onfid
ence
in P
hysi
cian
s� C
are
Som
ewha
t or s
trong
ly a
gree
95
6.
2 10
0 95
92
10
0 97
95
10
0 96
96
97
10
0 76
87
10
0 92
Ef
fect
on
Phys
icia
ns� R
elat
ions
with
Pat
ient
s
Impr
oved
40
11
.1
54
48
36
57
47
50
48
34
40
41
35
30
11
43
33
Ave
rage
Z-V
alue
0.
97
0.64
-0
.78
1.25
-0
.07
0.27
0.
55
-0.3
6 0.
27
0.20
0.
17
-1.9
5 -1
.69
0.73
-0
.21
Sour
ce:
Mat
hem
atic
a Po
licy
Res
earc
h, In
c. P
hysi
cian
Sur
vey.
Not
es:
See
Tabl
e IV
.1 fo
r the
full
nam
es o
f the
pro
gram
s.
Estim
ates
in b
oldf
ace
are
ones
that
are
mor
e th
an 1
stan
dard
dev
iatio
n ab
ove
or b
elow
the
mea
n ac
ross
all
site
s for
that
mea
sure
. Sh
aded
bol
dfac
ed e
stim
ates
are
1 st
anda
rd d
evia
tion
abov
e th
e m
ean;
uns
hade
d bo
ldfa
ce e
stim
ates
are
1 st
anda
rd d
evia
tion
belo
w th
e m
ean.
To
cal
cula
te th
e av
erag
e Z-
valu
e, th
e pr
ogra
m�s
Z-s
core
for t
he p
erce
ntag
e ra
ting
a pa
rticu
lar m
easu
re fa
vora
bly
was
firs
t cal
cula
ted
for e
ach
of th
e in
divi
dual
out
com
e m
easu
res.
The
scor
e fo
r eac
h m
easu
re w
as c
alcu
late
d by
sub
tract
ing
the
mea
n of
the
perc
enta
ge ra
ting
the
prog
ram
as
favo
rabl
e ac
ross
the
15 p
rogr
ams
from
the
perc
enta
ge ra
ting
the
mea
sure
as
favo
rabl
e in
th
e pr
ogra
m, a
nd d
ivid
ing
by th
e st
anda
rd d
evia
tion
acro
ss th
e 15
pro
gram
s. N
ext,
an a
vera
ge o
f the
Z-s
core
s fo
r all
of th
e m
easu
res
for t
hat p
rogr
am w
as c
alcu
late
d. A
vera
ge Z
-val
ues
grea
ter t
han
1 or
less
than
-1 in
dica
te th
at a
pro
gram
was
, on
aver
age,
mor
e th
an 1
stan
dard
dev
iatio
n fr
om th
e m
ean
acro
ss a
ll m
easu
res.
125
than the mean across all the programs by 1½ standard deviations. However, about one-fourth of
QMed�s physicians felt that QMed undermined patients� confidence in their physicians� care, a
very negative rating relative to that of other programs (more than 3 standard deviations from the
mean).
In summarizing findings across the three measures of physician-patient relations, the rating
given by Charlestown�s physicians was consistently higher than was the average rating across all
programs, by more than 1 standard deviation. Avera was a close second, with physicians rating
that program higher than the ratings given by physicians of other programs, by almost 1 (0.97)
standard deviation on average across the measures. In contrast, physicians of QMed and Quality
Oncology consistently rated their programs substantially lower than the average across
all programs.
6. Effects on Patient Outcomes and Service Use
Overall, physicians found that the programs increased patients� satisfaction and health, with
few effects on office visits in either direction (Table IV.13). The majority of physicians found
that the programs were beneficial to their patients� health (88 percent), and that they increased
patients� satisfaction with health care (65 percent). On average, physicians did not believe the
programs had much effect on increasing office visits (9 percent of physicians reported such an
increase), but, in the few instances in which a change in office visits was reported, the great
majority of physicians (89 percent) believed that the change was medically appropriate. Only a
few physicians (2 percent) felt that the programs increased nursing home admissions.
In some cases, large differences across the programs on some of these patient outcome
measures were reported. For example, 95 percent of physicians in Charlestown felt that the
program increased patients� satisfaction with health care, a rating higher than the average across
all programs by more than 2 standard deviations. By contrast, only 29 percent of physicians in

126
TAB
LE IV
.13
PH
YSI
CIA
NS�
PER
CEP
TIO
NS
AB
OU
T PR
OG
RA
M E
FFEC
TS O
N P
ATI
ENTS
� OU
TCO
MES
AN
D S
ERV
ICE
USE
(P
erce
ntag
es)
M
ean
Stan
dard
D
evia
tion
AV
E C
AR
C
EN
CC
I C
OR
G
EO
HO
S H
QP
JHH
M
ERM
CD
Q
MD
Q
UA
U
MD
W
SH
How
Ben
efic
ial P
rogr
am Is
to P
atie
nts�
Hea
lth
Ver
y or
som
ewha
t ben
efic
ial
88
12.4
96
95
70
10
0 89
95
90
86
96
97
97
68
63
10
0 71
Pa
tient
s� S
atis
fact
ion
with
Hea
lth C
are
Incr
ease
d 65
18
.4
76
74
38
95
66
74
71
62
56
84
76
29
38
85
57
Off
ice
Vis
its
Incr
ease
d 9
8.4
2 10
0
29
0 15
5
2 0
6 3
18
11
7 21
In
crea
se o
r Dec
reas
e in
Vis
its M
edic
ally
A
ppro
pria
te
Yes
89
19
.4
100
93
67
100
100
100
100
88
100
100
100
40
100
100
50
Nur
sing
Hom
e A
dmis
sion
s
Incr
ease
d 2
3.5
0 0
0 0
0 0
6 0
0 3
4 0
13
0 0
Ave
rage
Z-V
alue
0.
11
0.20
-1
.12
1.02
-0
.16
0.38
0.
37
-0.3
4 -0
.16
0.48
0.
35
-1.0
9 0.
12
0.39
-0
.56
Sour
ce:
Mat
hem
atic
a Po
licy
Res
earc
h, In
c. P
hysi
cian
Sur
vey.
Not
es:
See
Tabl
e IV
.1 fo
r the
full
nam
es o
f the
pro
gram
s.
Estim
ates
in b
oldf
ace
are
ones
that
are
mor
e th
an 1
stan
dard
dev
iatio
n ab
ove
or b
elow
the
mea
n ac
ross
all
site
s for
that
mea
sure
. Sh
aded
bol
dfac
ed e
stim
ates
are
1 st
anda
rd d
evia
tion
abov
e th
e m
ean;
uns
hade
d bo
ldfa
ce e
stim
ates
are
1 st
anda
rd d
evia
tion
belo
w th
e m
ean.
To
cal
cula
te th
e av
erag
e Z-
valu
e, th
e pr
ogra
m�s
Z-s
core
for t
he p
erce
ntag
e ra
ting
a pa
rticu
lar m
easu
re fa
vora
bly
was
firs
t cal
cula
ted
for e
ach
of th
e in
divi
dual
out
com
e m
easu
res.
The
scor
e fo
r eac
h m
easu
re w
as c
alcu
late
d by
sub
tract
ing
the
mea
n of
the
perc
enta
ge ra
ting
the
prog
ram
as
favo
rabl
e ac
ross
the
15 p
rogr
ams
from
the
perc
enta
ge ra
ting
the
mea
sure
as
favo
rabl
e in
th
e pr
ogra
m, a
nd d
ivid
ing
by th
e st
anda
rd d
evia
tion
acro
ss th
e 15
pro
gram
s. N
ext,
an a
vera
ge o
f the
Z-s
core
s fo
r all
of th
e m
easu
res
for t
hat p
rogr
am w
as c
alcu
late
d. A
vera
ge Z
-val
ues
grea
ter t
han
1 or
less
than
-1 in
dica
te th
at a
pro
gram
was
, on
aver
age,
mor
e th
an 1
stan
dard
dev
iatio
n fr
om th
e m
ean
acro
ss a
ll m
easu
res.
127
QMed reported the program had increased patients� satisfaction, a rating lower than the average
across programs by almost 2 standard deviations. Across the five measures of patient outcomes
and service use, only Charlestown had higher ratings than the other programs, on average, with
ratings 1 standard deviation higher than those of the other programs. Physicians in QMed rated
their program lower than others across the five measures, by 1 standard deviation, on average.
7. Care Coordinators’ Clinical Judgment and Competence
Overall, physicians across the 15 programs were comfortable with their care coordinators�
clinical skills, and they valued the input of these staff. The majority of physicians found their
care coordinators� information or feedback to be useful (85 percent), and they rated their care
coordinators� overall clinical judgment and competence as very good or excellent (65 percent)
(Table IV.14). About one-half of all physicians (48 percent) also reported that their care
coordinators identified acute problems in patients or influenced their decisions. A great majority
of physicians (94 percent) found that they rarely disagreed with their care coordinators, and they
rated their care coordinators� ability to deal with specific issues as very good or excellent
(87 percent). Physicians also were favorably impressed with their care coordinators� ability to
identify patients� functional problems, and to assess patients� home situations (56 percent and
66 percent of physicians, respectively). Physicians were slightly less impressed with the care
coordinators� ability to identify emotional problems (with only 43 percent reporting that care
coordinators identified such problems at least sometimes).
Analysis across the programs revealed substantial differences. For example, although all of
Charlestown�s, Medical Care Development�s, and the University of Maryland�s physicians found
their care coordinators� information or feedback to be useful, only 33 percent of physicians in
Quality Oncology held the same view (a rating lower than the average across the programs by
almost 3 standard deviations). Likewise, 90 percent of physicians in Charlestown reported that
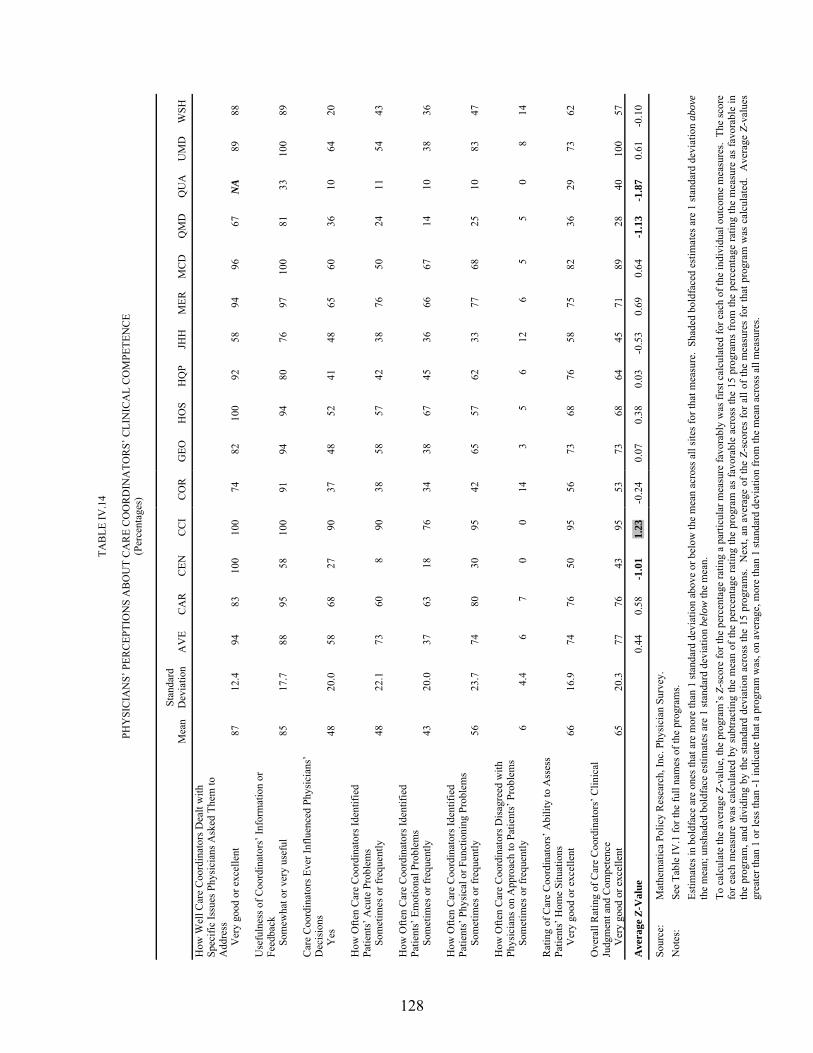
128
TAB
LE IV
.14
PH
YSI
CIA
NS�
PER
CEP
TIO
NS
AB
OU
T C
AR
E C
OO
RD
INA
TOR
S� C
LIN
ICA
L C
OM
PETE
NC
E (P
erce
ntag
es)
M
ean
Stan
dard
D
evia
tion
AV
E C
AR
C
EN
CC
I C
OR
G
EO
HO
S H
QP
JHH
M
ERM
CD
Q
MD
Q
UA
U
MD
W
SH
How
Wel
l Car
e C
oord
inat
ors D
ealt
with
Sp
ecifi
c Is
sues
Phy
sici
ans A
sked
The
m to
A
ddre
ss
Ver
y go
od o
r exc
elle
nt
87
12.4
94
83
10
0 10
0 74
82
10
0 92
58
94
96
67
N
A
89
88
Use
fuln
ess o
f Coo
rdin
ator
s� In
form
atio
n or
Fe
edba
ck
Som
ewha
t or v
ery
usef
ul
85
17.7
88
95
58
10
0 91
94
94
80
76
97
10
0 81
33
10
0 89
C
are
Coo
rdin
ator
s Eve
r Inf
luen
ced
Phys
icia
ns�
Dec
isio
ns
Yes
48
20
.0
58
68
27
90
37
48
52
41
48
65
60
36
10
64
20
How
Ofte
n C
are
Coo
rdin
ator
s Ide
ntifi
ed
Patie
nts�
Acu
te P
robl
ems
Som
etim
es o
r fre
quen
tly
48
22.1
73
60
8
90
38
58
57
42
38
76
50
24
11
54
43
How
Ofte
n C
are
Coo
rdin
ator
s Ide
ntifi
ed
Patie
nts�
Em
otio
nal P
robl
ems
Som
etim
es o
r fre
quen
tly
43
20.0
37
63
18
76
34
38
67
45
36
66
67
14
10
38
36
H
ow O
ften
Car
e C
oord
inat
ors I
dent
ified
Pa
tient
s� P
hysi
cal o
r Fun
ctio
ning
Pro
blem
s
Som
etim
es o
r fre
quen
tly
56
23.7
74
80
30
95
42
65
57
62
33
77
68
25
10
83
47
H
ow O
ften
Car
e C
oord
inat
ors D
isag
reed
with
Ph
ysic
ians
on
App
roac
h to
Pat
ient
s� P
robl
ems
Som
etim
es o
r fre
quen
tly
6 4.
4 6
7 0
0 14
3
5 6
12
6 5
5 0
8 14
R
atin
g of
Car
e C
oord
inat
ors�
Abi
lity
to A
sses
s Pa
tient
s� H
ome
Situ
atio
ns
Ver
y go
od o
r exc
elle
nt
66
16.9
74
76
50
95
56
73
68
76
58
75
82
36
29
73
62
O
vera
ll R
atin
g of
Car
e C
oord
inat
ors�
Clin
ical
Ju
dgm
ent a
nd C
ompe
tenc
e
Ver
y go
od o
r exc
elle
nt
65
20.3
77
76
43
95
53
73
68
64
45
71
89
28
40
10
0 57
Ave
rage
Z-V
alue
0.
44
0.58
-1
.01
1.23
-0
.24
0.07
0.
38
0.03
-0
.53
0.69
0.
64
-1.1
3 -1
.87
0.61
-0
.10
Sour
ce:
Mat
hem
atic
a Po
licy
Res
earc
h, In
c. P
hysi
cian
Sur
vey.
N
otes
: Se
e Ta
ble
IV.1
for t
he fu
ll na
mes
of t
he p
rogr
ams.
Estim
ates
in b
oldf
ace
are
ones
that
are
mor
e th
an 1
stan
dard
dev
iatio
n ab
ove
or b
elow
the
mea
n ac
ross
all
site
s for
that
mea
sure
. Sh
aded
bol
dfac
ed e
stim
ates
are
1 st
anda
rd d
evia
tion
abov
e th
e m
ean;
uns
hade
d bo
ldfa
ce e
stim
ates
are
1 st
anda
rd d
evia
tion
belo
w th
e m
ean.
To
cal
cula
te th
e av
erag
e Z-
valu
e, th
e pr
ogra
m�s
Z-s
core
for t
he p
erce
ntag
e ra
ting
a pa
rticu
lar m
easu
re fa
vora
bly
was
firs
t cal
cula
ted
for e
ach
of th
e in
divi
dual
out
com
e m
easu
res.
The
scor
e fo
r eac
h m
easu
re w
as c
alcu
late
d by
sub
tract
ing
the
mea
n of
the
perc
enta
ge ra
ting
the
prog
ram
as
favo
rabl
e ac
ross
the
15 p
rogr
ams
from
the
perc
enta
ge ra
ting
the
mea
sure
as
favo
rabl
e in
th
e pr
ogra
m, a
nd d
ivid
ing
by th
e st
anda
rd d
evia
tion
acro
ss th
e 15
pro
gram
s. N
ext,
an a
vera
ge o
f the
Z-s
core
s fo
r all
of th
e m
easu
res
for t
hat p
rogr
am w
as c
alcu
late
d. A
vera
ge Z
-val
ues
grea
ter t
han
1 or
less
than
-1 in
dica
te th
at a
pro
gram
was
, on
aver
age,
mor
e th
an 1
stan
dard
dev
iatio
n fr
om th
e m
ean
acro
ss a
ll m
easu
res.
129
their care coordinators had influenced their decisions on occasion (a much higher proportion than
those of other programs), whereas only 10 percent of physicians in Quality Oncology felt that
way (a far lower rating than those of other programs).
Only Charlestown had noticeably higher physician ratings of coordinators� clinical
competence across all nine measures than the cross-program average. QMed and Quality
Oncology had markedly lower ratings than the other programs.
8. Overall Rating
The patients� primary physicians were pleased with the program overall. Across the
15 programs, on average, a majority (67 percent) of physicians found that the program increased
patients� overall quality of care, and 80 percent reported that they would recommend the
program to their patients and colleagues (Table IV.15). (About 60 percent would �definitely�
recommend the program, and the remainder would �probably� do so.)
Some variations across programs in physicians� ratings were observed. For example,
100 percent of the University of Maryland physicians and 95 percent of Charlestown physicians
believed that the program improved their patients� quality of care. By contrast, only 11 percent
of physicians in Quality Oncology believed this (representing a rating lower than those given to
other programs by more than 2 standard deviations, on average). In fact, Charlestown�s
physicians both rated their program more highly on quality and were more likely to recommend
the program relative to physicians of the other programs, whereas three programs (CenVaNet,
QMed, and Quality Oncology) consistently received lower ratings on these two measures.

130
TAB
LE IV
.15
PH
YSI
CIA
NS�
OV
ERA
LL P
ERC
EPTI
ON
S A
BO
UT
PRO
GR
AM
S (P
erce
ntag
es)
M
ean
Stan
dard
D
evia
tion
AV
E C
AR
C
EN
CC
I C
OR
G
EO
HO
S H
QP
JHH
M
ERM
CD
Q
MD
Q
UA
U
MD
W
SH
Ove
rall
Impa
ct o
f Pro
gram
on
Patie
nts�
Qua
lity
of C
are
Incr
ease
d 67
23
.8
82
78
30
95
55
80
84
65
72
78
79
41
11
100
53
Wou
ld R
ecom
men
d Pr
ogra
m to
Pat
ient
s or
Col
leag
ues
Def
inite
ly y
es
59
22.1
70
67
27
95
59
68
86
48
43
70
70
33
11
79
60
Ave
rage
Z-V
alue
0.
57
0.41
-1
.49
1.41
-0
.25
0.47
0.
97
-0.2
9 -0
.26
0.48
0.
51
-1.1
3 -2
.26
1.15
-0
.27
Sour
ce:
Mat
hem
atic
a Po
licy
Res
earc
h, In
c. P
hysi
cian
Sur
vey.
Not
es:
See
Tabl
e IV
.1 fo
r the
full
nam
es o
f the
pro
gram
s.
Estim
ates
in b
oldf
ace
are
ones
that
are
mor
e th
an 1
stan
dard
dev
iatio
n ab
ove
or b
elow
the
mea
n ac
ross
all
site
s for
that
mea
sure
. Sh
aded
bol
dfac
ed e
stim
ates
are
1 st
anda
rd d
evia
tion
abov
e th
e m
ean;
uns
hade
d bo
ldfa
ce e
stim
ates
are
1 st
anda
rd d
evia
tion
belo
w th
e m
ean.
To c
alcu
late
the
aver
age
Z-va
lue,
the
prog
ram
�s Z
-sco
re fo
r the
per
cent
age
ratin
g a
parti
cula
r mea
sure
favo
rabl
y w
as fi
rst c
alcu
late
d fo
r eac
h of
the
indi
vidu
al o
utco
me
mea
sure
s. T
he sc
ore
for e
ach
mea
sure
was
cal
cula
ted
by s
ubtra
ctin
g th
e m
ean
of th
e pe
rcen
tage
ratin
g th
e pr
ogra
m a
s fa
vora
ble
acro
ss th
e 15
pro
gram
s fr
om th
e pe
rcen
tage
ratin
g th
e m
easu
re a
s fa
vora
ble
in
the
prog
ram
, and
div
idin
g by
the
stan
dard
dev
iatio
n ac
ross
the
15 p
rogr
ams.
Nex
t, an
ave
rage
of t
he Z
-sco
res
for a
ll of
the
mea
sure
s fo
r tha
t pro
gram
was
cal
cula
ted.
Ave
rage
Z-v
alue
s gr
eate
r tha
n 1
or le
ss th
an -1
indi
cate
that
a p
rogr
am w
as, o
n av
erag
e, m
ore
than
1 st
anda
rd d
evia
tion
from
the
mea
n ac
ross
all
mea
sure
s.
131
V. PROGRAM EFFECTS ON PATIENTS’ KNOWLEDGE AND BEHAVIOR, UNMET NEEDS, AND QUALITY OF CARE
Among the objectives of the care coordination programs were increasing patients�
knowledge regarding their chronic conditions and improving their self-care behavior, service
arrangements to meet functional deficits, and quality of care. Accomplishing these objectives
should lead eventually to improvements in health and well-being. This chapter describes the
effects of the care coordination programs on measures of patients� education and knowledge,
self-care behavior, unmet needs, quality of care, health status, and well-being. The analysis is
based on comparisons of outcomes for the treatment and control groups, using patient survey and
Medicare claims data.
This chapter does not include the Quality Oncology MCCD program, one of three whose
patients were not surveyed due to low enrollment (described further below). In addition, the
claims-based measures in this chapter gauge general preventive care; preventive care for
diabetes, congestive heart failure (CHF), and coronary artery disease (CAD); and potentially
preventable hospitalizations for those conditions. Thus, because Quality Oncology focuses on
beneficiaries with cancer, none of those measures apply to the program.
Because of the large number of outcomes examined across the 14 other MCCD programs,
the tables in the chapter use plus and minus symbols to summarize treatment-control differences
that are significant at the 10-percent level. Appendix C contains the actual numerical estimates
of the treatment-control differences for the outcomes discussed.
Overall, the analyses indicate that significantly more treatment than control group members
reported receiving education, but that this education did not translate into the hoped-for changes
in their diet, exercise, or self-care, or into favorable effects on functional ability. There was also
increased recognition of having had help in service arrangement, and there were suggestions of

132
favorable (that is, favoring the treatment group) effects on measures of quality of care and health
status and well-being in a few programs.
A. DATA SOURCES
1. Patient Survey
Measures of patients� receipt of education, knowledge, behavior, adherence, receipt of care,
and functioning were obtained from a telephone survey of samples of patients enrolled during the
first year of each program�s operations. A full description of the patient survey is contained in
Chapter IV. As described in Chapter IV, the survey was conducted on only 12 of the 15 MCCD
programs, because 3 enrolled too few patients to permit an analysis of impacts based on survey
data. Therefore, only 12 programs are included in the analyses of survey data.
2. Medicare Claims Data
Additional measures of quality of care were constructed from Medicare claims data. Some
of these measures, such as colon cancer screening or mammography, are general screening tests
that are not specific to the targeted population in the program.2 Receipt of colon cancer
screening by participants was actually assessed in two ways, through self-report in the patient
survey and through claims data.
Other measures of the quality of care from claims data were specific to certain diseases. For
example, it is recommended that patients with diabetes or CAD have periodic blood tests for
lipid levels, and that patients with CHF have a measure of left ventricular ejection at least once.3
2 Such general preventive screening may not be appropriate for enrollees with severe comorbidities or
shortened life expectancy, but, on average, across all enrollees, one might expect to see increased attention to prevention among the intervention group of a care coordination program, compared with usual care.
3 Again, measurement of left ventricular ejection may not have been indicated for individual enrollees with CHF during the study period (for example, if they had had a recent test before the study period). On average,

133
Finally, adverse event outcomes were constructed from the claims data. These measure
events that are presumably preventable with high-quality outpatient care. Some were measured
in all participants regardless of their diagnoses (for example, hospitalizations for pneumonia or
urinary tract infections); others were measured only among beneficiaries with one of the main
targeted conditions (for example, hospitalizations for uncontrolled diabetes among beneficiaries
with diabetes, or fluid and electrolyte problems among those with CHF).4,5
In the analyses of Medicare claims data, first-year enrollees were studied over the first year
after the month of their random assignment, excluding any months during which they did not
meet demonstration-wide eligibility requirements. Enrollees in all 14 MCCD programs
discussed in this chapter were included. An enrollee who had a claim in the Medicare data
involving diabetes, CHF, or CAD in the 2 years prior to enrollment was defined as having the
condition. The diagnosis categories are not mutually exclusive (that is, the same enrollee could
be included in more than one category).
B. RECEIPT OF EDUCATION
It is thought that much morbidity and health care use among people with chronic illness
could be reduced if these people were better able to make difficult changes in lifestyle, adhere to
complex medication regimens, recognize early signs and symptoms of worsening of their (continued) however, across all enrollees with CHF, one might expect to see increased assessment of left ventricular function among the intervention group of a care coordination program, compared with usual care.
4 The potentially preventable hospitalizations examined among all participants, regardless of diagnosis, were those for CHF, chronic obstructive pulmonary disease, dehydration, and urinary tract infection. The reason for including hospitalizations for CHF is that new-onset CHF occurs frequently among the elderly, even among those without a history of the condition. Good ambulatory care should be able to detect and treat such occurrences before they deteriorate to the point of requiring hospitalization.
5 The potentially preventable hospitalizations examined among participants with diabetes include a broad range of cardiac problems, as CAD and CHF cause substantial morbidity among people with diabetes. High-quality ambulatory care should be able to decrease that morbidity.
134
condition, and seek medical care effectively when they need it (Institute of Medicine 2001;
Wagner et al. 2001). The programs sought, to varying degrees, to impart to their patients the
knowledge and skills necessary for making these behavioral changes.
In 11 of the 12 programs with patient survey data, the treatment group was significantly
more likely than the control group to report having been taught about diet, exercise, taking
medication, or recognizing warning signs for their conditions, or to report having received
materials explaining their conditions or treatment (Table V.1). These findings were consistent
with the emphasis of these programs� interventions on patient education. In particular,
CenVaNet, Health Quality Partners, and Mercy had treatment-control differences favoring the
treatment group in all five measures of receipt of education. In the Carle program, more
treatment group members than control group members reported receiving education on four of
the five education measures. Jewish Home and Hospital, which focused on reducing social
isolation, was the only program in which participants did not report any significant treatment-
control differences in health education.
The health topic with the most widespread impacts was diet. In 9 of the 12 programs, a
higher proportion of treatment group members than control group members reported receiving
education on how to follow a healthy diet (Table V.1). Treatment-control group differences
favoring the treatment group ranged from a minimum of 10 percentage points (CorSolutions) to a
high of 52 percentage points (Health Quality Partners). Hospice of the Valley, Jewish Home and
Hospital, and Washington University were the only programs in which the treatment groups did
not report receiving more education than the control groups about diet.
The health topic with the next highest number of impacts was exercise. In 7 of the
12 programs, more treatment group members reported receiving education on exercise.
Treatment group means exceeded the control group means by a minimum of 8 percentage points
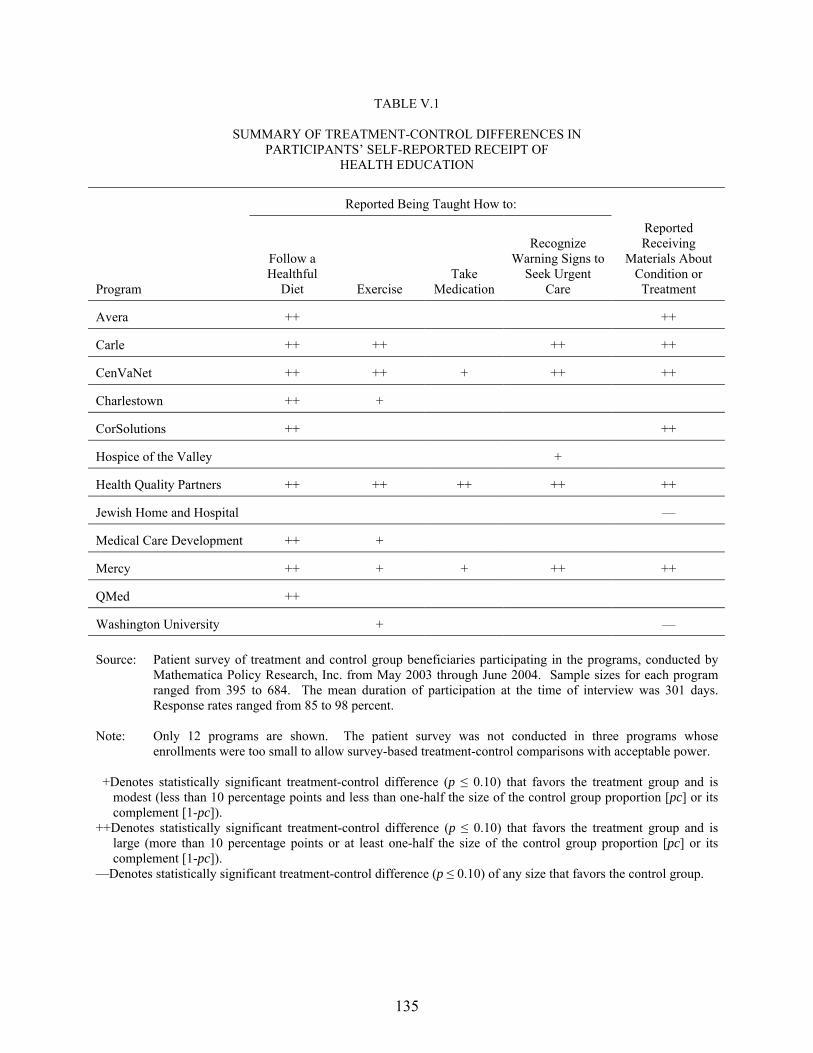
135
TABLE V.1
SUMMARY OF TREATMENT-CONTROL DIFFERENCES IN PARTICIPANTS� SELF-REPORTED RECEIPT OF
HEALTH EDUCATION
Reported Being Taught How to:
Program
Follow a Healthful
Diet Exercise Take
Medication
Recognize Warning Signs to
Seek Urgent Care
Reported Receiving
Materials About Condition or Treatment
Avera ++ ++
Carle ++ ++ ++ ++
CenVaNet ++ ++ + ++ ++
Charlestown ++ +
CorSolutions ++ ++
Hospice of the Valley +
Health Quality Partners ++ ++ ++ ++ ++
Jewish Home and Hospital �
Medical Care Development ++ +
Mercy ++ + + ++ ++
QMed ++
Washington University + � Source: Patient survey of treatment and control group beneficiaries participating in the programs, conducted by
Mathematica Policy Research, Inc. from May 2003 through June 2004. Sample sizes for each program ranged from 395 to 684. The mean duration of participation at the time of interview was 301 days. Response rates ranged from 85 to 98 percent.
Note: Only 12 programs are shown. The patient survey was not conducted in three programs whose
enrollments were too small to allow survey-based treatment-control comparisons with acceptable power. +Denotes statistically significant treatment-control difference (p ≤ 0.10) that favors the treatment group and is
modest (less than 10 percentage points and less than one-half the size of the control group proportion [pc] or its complement [1-pc]).
++Denotes statistically significant treatment-control difference (p ≤ 0.10) that favors the treatment group and is large (more than 10 percentage points or at least one-half the size of the control group proportion [pc] or its complement [1-pc]).
�Denotes statistically significant treatment-control difference (p ≤ 0.10) of any size that favors the control group.
136
(in the Charlestown program) and by a maximum of 34 percentage points (for the Health Quality
Partners program) (Table V.1).
Treatment group members in several programs were also more likely to report having been
taught how to recognize when to seek urgent care and how to take medications (Table V.1). Of
the 12 programs, 5 had large treatment-control differences in the proportion who reported being
taught how to recognize warning signs to seek urgent care, with 4 of these differences
substantial�between 11 and 21 percentage points. The treatment groups in three programs were
more likely to report being taught how and when to take medications (with treatment-control
differences of 6, 8, and 14 percentage points).
Treatment group members in six programs were much more likely to have received
materials explaining their conditions or treatment. In two programs, however, treatment-control
differences actually favored the control group in this measure (Table V.1).
C. HEALTH KNOWLEDGE AND HEALTH BEHAVIORS
If chronically ill people are to make significant changes in their health-related behavior,
mere receipt of education is generally not enough. They must also understand the information
they receive and must apply it to their daily lives. The evaluation survey also had respondents
self-assess their knowledge of healthy eating, exercising, medication adherence, and when to
seek care for specific symptoms, as well as their adherence to regimens of diet, exercise,
and medication.
Despite a higher proportion of the treatment groups reporting receiving health-related
education, there were few detectable treatment-control differences in self-reported knowledge or
health-related behavior. For the four outcomes of (1) understanding how to follow a healthy
diet, (2) following a healthy diet, (3) understanding how to exercise, and (4) exercising regularly,
there was only one favorable treatment-control difference for each outcome, with the differences
137
scattered across four different programs (Table V.2). The absence of significant differences may
reflect an already high baseline level of knowledge among participants. In all programs, 76 to
97 percent of control group members said they knew how to follow a healthy diet, and 66 to
85 percent said they knew the proper way to exercise. It may thus have been difficult for
programs to effect large improvements for these outcomes among the treatment groups.
There were also a few treatment-control differences in trying to quit smoking and trying to
cut down on drinking (Table V.2). However, sample sizes for these questions were very small,
as the questions were asked only of the very few beneficiaries who had reported smoking or
drinking. The treatment-control differences for these measures were mixed, with two favoring
the treatment group and two favoring the control group.
D. UNMET NEEDS
Chronically ill beneficiaries commonly face physical and financial barriers that can lead to
adverse health outcomes and increased use of health care. Some beneficiaries have functional
limitations that complicate such essential activities as eating, dressing, bathing, using the
telephone, shopping, and traveling to medical appointments. In some cases, financial constraints
make it hard for beneficiaries to afford critical medications. Personal care or financial assistance
services can help to lower these barriers.
As described in Chapter II, 9 of the 12 programs sought to improve the provision of
Medicare- or non-Medicare-covered services. Some programs paid for non-Medicare-covered
services, such as home health or prescription drugs, whereas others helped patients to gain access
to community resources, such as meal delivery services or transportation to their
physicians� offices.
Treatment group members� recognition that they had care coordinators was very high across
all programs, as evidenced by large treatment-control differences across programs in participants
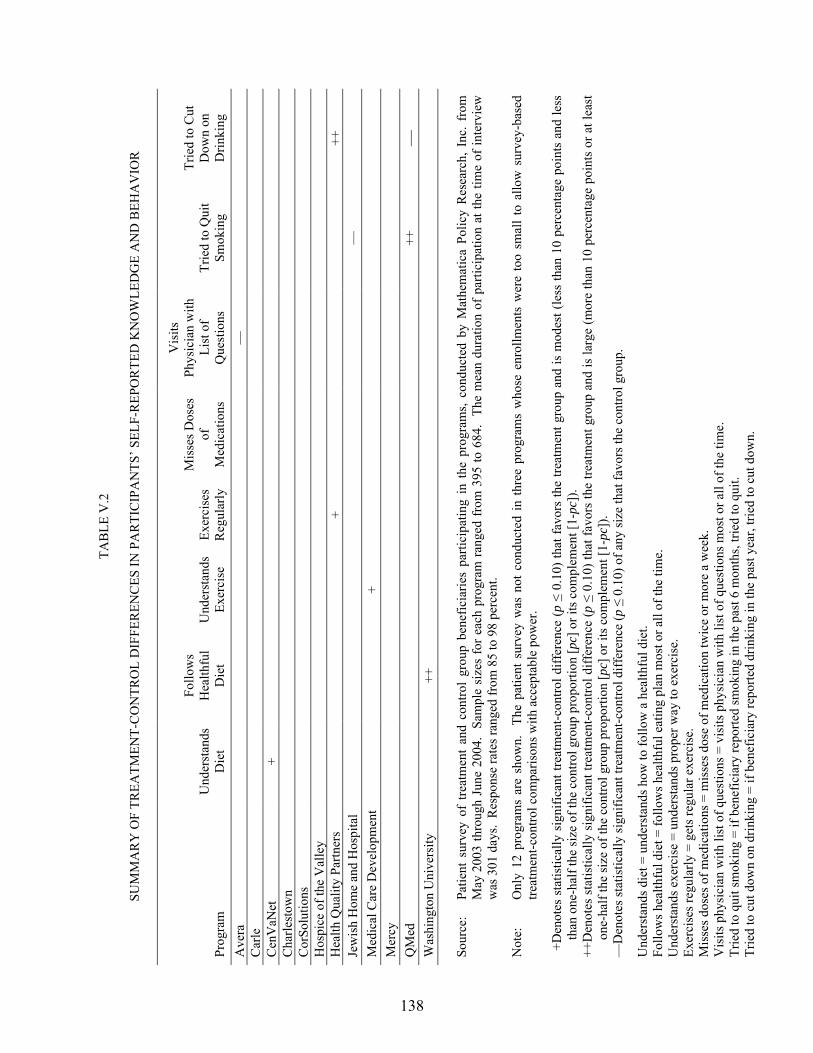
138
TAB
LE V
.2
SU
MM
AR
Y O
F TR
EATM
ENT-
CO
NTR
OL
DIF
FER
ENC
ES IN
PA
RTI
CIP
AN
TS� S
ELF-
REP
OR
TED
KN
OW
LED
GE
AN
D B
EHA
VIO
R
Prog
ram
U
nder
stan
ds
Die
t
Follo
ws
Hea
lthfu
l D
iet
Und
erst
ands
Ex
erci
se
Exer
cise
s R
egul
arly
Mis
ses D
oses
of
M
edic
atio
ns
Vis
its
Phys
icia
n w
ith
List
of
Que
stio
ns
Trie
d to
Qui
t Sm
okin
g
Trie
d to
Cut
D
own
on
Drin
king
A
vera
�
Car
le
Cen
VaN
et
+
Cha
rlest
own
Cor
Solu
tions
H
ospi
ce o
f the
Val
ley
Hea
lth Q
ualit
y Pa
rtner
s
+
++
Jew
ish
Hom
e an
d H
ospi
tal
�
M
edic
al C
are
Dev
elop
men
t
+
M
ercy
Q
Med
++
�
W
ashi
ngto
n U
nive
rsity
++
Sour
ce:
Patie
nt s
urve
y of
tre
atm
ent
and
cont
rol
grou
p be
nefic
iarie
s pa
rtici
patin
g in
the
pro
gram
s, co
nduc
ted
by M
athe
mat
ica
Polic
y R
esea
rch,
Inc
. fr
om
May
200
3 th
roug
h Ju
ne 2
004.
Sam
ple
size
s fo
r eac
h pr
ogra
m ra
nged
from
395
to 6
84.
The
mea
n du
ratio
n of
par
ticip
atio
n at
the
time
of in
terv
iew
w
as 3
01 d
ays.
Res
pons
e ra
tes r
ange
d fr
om 8
5 to
98
perc
ent.
Not
e:
Onl
y 12
pro
gram
s ar
e sh
own.
Th
e pa
tient
sur
vey
was
not
con
duct
ed in
thre
e pr
ogra
ms
who
se e
nrol
lmen
ts w
ere
too
smal
l to
allo
w s
urve
y-ba
sed
treat
men
t-con
trol c
ompa
rison
s with
acc
epta
ble
pow
er.
+D
enot
es s
tatis
tical
ly s
igni
fican
t tre
atm
ent-c
ontro
l diff
eren
ce (p
≤ 0
.10)
that
favo
rs th
e tre
atm
ent g
roup
and
is m
odes
t (le
ss th
an 1
0 pe
rcen
tage
poi
nts
and
less
th
an o
ne-h
alf t
he si
ze o
f the
con
trol g
roup
pro
porti
on [p
c] o
r its
com
plem
ent [
1-pc
]).
++D
enot
es s
tatis
tical
ly s
igni
fican
t tre
atm
ent-c
ontro
l diff
eren
ce (p
≤ 0
.10)
that
favo
rs th
e tre
atm
ent g
roup
and
is la
rge
(mor
e th
an 1
0 pe
rcen
tage
poi
nts
or a
t lea
st
one-
half
the
size
of t
he c
ontro
l gro
up p
ropo
rtion
[pc]
or i
ts c
ompl
emen
t [1-
pc])
. �
Den
otes
stat
istic
ally
sign
ifica
nt tr
eatm
ent-c
ontro
l diff
eren
ce (p
≤ 0
.10)
of a
ny si
ze th
at fa
vors
the
cont
rol g
roup
.
Und
erst
ands
die
t = u
nder
stan
ds h
ow to
follo
w a
hea
lthfu
l die
t. Fo
llow
s hea
lthfu
l die
t = fo
llow
s hea
lthfu
l eat
ing
plan
mos
t or a
ll of
the
time.
U
nder
stan
ds e
xerc
ise
= un
ders
tand
s pro
per w
ay to
exe
rcis
e.
Exer
cise
s reg
ular
ly =
get
s reg
ular
exe
rcis
e.
Mis
ses d
oses
of m
edic
atio
ns =
mis
ses d
ose
of m
edic
atio
n tw
ice
or m
ore
a w
eek.
V
isits
phy
sici
an w
ith li
st o
f que
stio
ns =
vis
its p
hysi
cian
with
list
of q
uest
ions
mos
t or a
ll of
the
time.
Tr
ied
to q
uit s
mok
ing
= if
bene
ficia
ry re
porte
d sm
okin
g in
the
past
6 m
onth
s, tri
ed to
qui
t. Tr
ied
to c
ut d
own
on d
rinki
ng =
if b
enef
icia
ry re
porte
d dr
inki
ng in
the
past
yea
r, tri
ed to
cut
dow
n.

139
reporting having received help in arranging care (Table V.3). Effects on participants� unmet
needs were less dramatic, with a few differences favoring the treatment group across the
programs (Table V.3).
The number of people who needed assistance with any of these activities was very small,
however, and even then, the great majority in the control group reported being able to get the
help they needed. It would have been difficult for the programs to have improved matters much.
E. QUALITY OF CARE
Many of the programs sought to improve the quality of their patients� care, most by teaching
patients to assume more responsibility for keeping track of their own care, and to advocate for
themselves. For example, a program might instruct a patient on the target values for cholesterol
levels or blood pressure and might encourage the patient to monitor results, to remind the
physician when to retest, and to ask the physician to address unsatisfactory numbers. Program
care coordinators might also call physicians on a case-by-case basis to suggest medication
adjustments or monitoring tests in keeping with national evidence-based guidelines. Few
programs attempted to improve physician behavior directly by giving physicians feedback on
their practice patterns compared with those of peers or with those recommended by
care guidelines.
The summary of general and disease-specific preventive care measures in Table V.4
suggests that the Carle and Health Quality Partners programs had some favorable effects, as each
program had four favorable treatment-control differences. The Carle program had moderate to
large treatment-control differences in disease-specific preventive measures (testing for
cholesterol, hemoglobin A1c, and urine protein in beneficiaries with diabetes, and testing for
cholesterol in beneficiaries with CAD). The Health Quality Partners program had two favorable
140
TAB
LE V
.3
SU
MM
AR
Y O
F TR
EATM
ENT-
CO
NTR
OL
DIF
FER
ENC
ES IN
PA
RTI
CIP
AN
TS� S
ELF-
REP
OR
TED
SE
RV
ICE
AR
RA
NG
EMEN
T A
ND
UN
MET
NEE
DS
Am
ong
Ben
efic
iarie
s Una
ble
to D
o by
The
mse
lves
, Rep
orte
d B
eing
Abl
e to
Get
Hel
p w
ith:
Prog
ram
R
ecei
ved
Hel
p in
A
rran
ging
Car
ea Te
leph
one
Tran
spor
tatio
n Sh
oppi
ng
Prep
arin
g M
eals
H
ouse
wor
k Ta
king
M
edic
atio
n H
andl
ing
Mon
ey
Ave
ra
++
Car
le
++
Cen
VaN
et
++
Cha
rlest
own
++
++
Cor
Solu
tions
++
++
++
Hos
pice
of t
he V
alle
y ++
++
Hea
lth Q
ualit
y Pa
rtner
s ++
Jew
ish
Hom
e an
d H
ospi
tal
++
Med
ical
Car
e D
evel
opm
ent
++
Mer
cy
++
�
QM
ed
++
�
Was
hing
ton
Uni
vers
ity
++
So
urce
: Pa
tient
sur
vey
of t
reat
men
t an
d co
ntro
l gr
oup
bene
ficia
ries
parti
cipa
ting
in t
he p
rogr
ams,
cond
ucte
d by
Mat
hem
atic
a Po
licy
Res
earc
h, I
nc.
from
M
ay 2
003
thro
ugh
June
200
4. S
ampl
e si
zes
for e
ach
prog
ram
rang
ed fr
om 3
95 to
684
. Th
e m
ean
dura
tion
of p
artic
ipat
ion
at th
e tim
e of
inte
rvie
w
was
301
day
s. R
espo
nse
rate
s ran
ged
from
85
to 9
8 pe
rcen
t.
Not
e:
Onl
y 12
pro
gram
s ar
e sh
own.
Th
e pa
tient
sur
vey
was
not
con
duct
ed in
thre
e pr
ogra
ms
who
se e
nrol
lmen
ts w
ere
too
smal
l to
allo
w s
urve
y-ba
sed
treat
men
t-con
trol c
ompa
rison
s with
acc
epta
ble
pow
er.
a Whe
ther
a n
urse
, car
e co
ordi
nato
r, or
soci
al w
orke
r hel
ped
arra
nge
care
.
+D
enot
es s
tatis
tical
ly s
igni
fican
t tre
atm
ent-c
ontro
l diff
eren
ce (p
≤ 0
.10)
that
favo
rs th
e tre
atm
ent g
roup
and
is m
odes
t (le
ss th
an 1
0 pe
rcen
tage
poi
nts
and
less
th
an o
ne-h
alf t
he si
ze o
f the
con
trol g
roup
pro
porti
on [p
c] o
r its
com
plem
ent [
1-pc
]).
++D
enot
es s
tatis
tical
ly s
igni
fican
t tre
atm
ent-c
ontro
l diff
eren
ce (p
≤ 0
.10)
that
favo
rs th
e tre
atm
ent g
roup
and
is la
rge
(mor
e th
an 1
0 pe
rcen
tage
poi
nts
or a
t lea
st
one-
half
the
size
of t
he c
ontro
l gro
up p
ropo
rtion
[pc]
or i
ts c
ompl
emen
t [1-
pc])
. �
Den
otes
stat
istic
ally
sign
ifica
nt tr
eatm
ent-c
ontro
l diff
eren
ce (p
≤ 0
.10)
of a
ny si
ze th
at fa
vors
the
cont
rol g
roup
.

141
TAB
LE V
.4
SU
MM
AR
Y O
F TR
EATM
ENT-
CO
NTR
OL
DIF
FER
ENC
ES IN
GEN
ERA
L A
ND
D
ISEA
SE-S
PEC
IFIC
PR
EVEN
TIV
E C
AR
E FO
R P
AR
TIC
IPA
NTS
N
on-D
isea
se-S
peci
fic o
r Gen
eral
Pre
vent
ive
Mea
sure
s
Dis
ease
-Spe
cific
Pre
vent
ive
Mea
sure
s for
Ben
efic
iarie
s with
:
D
iabe
tes
C
HF
C
AD
Su
rvey
-Bas
ed M
easu
res
C
laim
s-B
ased
Mea
sure
s
Cla
ims-
Bas
ed M
easu
resa
Prog
ram
Fl
u V
acci
ne
Pneu
-m
onia
V
acci
ne
Col
on
Can
cer
Scre
enin
gb
C
olon
C
ance
r Sc
reen
ingc
Scre
enin
g M
amm
o-gr
aphy
d
Dia
bete
s Ed
ucat
ione
Eye
Exam
i-na
tion
Cho
les-
tero
l or
Lipi
d Te
st
Hem
o-gl
obin
A
1c
Test
Urin
e Te
st fo
r Pr
otei
n
LV
Fu
nctio
n Te
st
C
hole
s-te
rol o
r Li
pid
Test
A
vera
�
�
C
arle
+ +
++
++
C
enV
aNet
+
�
Cha
rlest
own
Cor
Solu
tions
G
eorg
etow
n
H
ospi
ce o
f the
Val
ley
�
�
Hea
lth Q
ualit
y Pa
rtner
s
+
++
++
+ Je
wis
h H
ome
and
Hos
pita
l
M
edic
al C
are
Dev
elop
men
t
M
ercy
Q
Med
U
nive
rsity
of M
aryl
andf
Was
hing
ton
Uni
vers
ity
�
So
urce
: Fo
r su
rvey
-bas
ed m
easu
res,
patie
nt s
urve
y of
trea
tmen
t and
con
trol g
roup
ben
efic
iarie
s pa
rtici
patin
g in
the
prog
ram
s, co
nduc
ted
by M
athe
mat
ica
Polic
y R
esea
rch,
Inc
. fro
m M
ay 2
003
thro
ugh
June
200
4. S
ampl
e si
zes
for e
ach
prog
ram
rang
ed fr
om 3
95 to
684
. Th
e m
ean
dura
tion
of p
artic
ipat
ion
at th
e tim
e of
inte
rvie
w w
as 3
01 d
ays.
Res
pons
e ra
tes
rang
ed fr
om 8
5 to
98
per
cent
. Fo
r cla
ims-
base
d m
easu
res,
Med
icar
e N
atio
nal C
laim
s H
isto
ry F
ile.
Firs
t-yea
r enr
olle
es o
ver t
he 1
st y
ear a
fter r
ando
m a
ssig
nmen
t in
14 p
rogr
ams
wer
e in
clud
ed, e
xclu
ding
an
y m
onth
s dur
ing
whi
ch a
n en
rolle
e di
d no
t mee
t dem
onst
ratio
n-w
ide
elig
ibili
ty re
quire
men
ts.
Not
e:
Qua
lity
Onc
olog
y is
not
incl
uded
. Th
e pa
tient
sur
vey
was
not
con
duct
ed fo
r Qua
lity
Onc
olog
y be
caus
e its
enr
ollm
ent w
as to
o sm
all t
o al
low
sur
vey-
base
d tre
atm
ent-c
ontro
l com
paris
ons
with
acc
epta
ble
pow
er.
The
clai
ms-
base
d m
easu
res
in th
is ta
ble
wer
e no
t ana
lyze
d fo
r Qua
lity
Onc
olog
y be
caus
e it
focu
ses
on b
enef
icia
ries
with
can
cer,
and
the
clai
ms-
base
d m
easu
res
of
gene
ral p
reve
ntiv
e ca
re a
nd p
reve
ntiv
e ca
re fo
r dia
bete
s, C
HF,
and
CA
D in
this
tabl
e w
ere
not a
ppro
pria
te fo
r the
pro
gram
. a En
rolle
es w
ere
defin
ed a
s ha
ving
dia
bete
s, C
HF,
or C
AD
thro
ugh
Med
icar
e cl
aim
s da
ta.
An
enro
llee
who
had
a c
laim
with
one
of t
hese
dia
gnos
es in
the
2 ye
ars
prio
r to
enro
llmen
t was
def
ined
as
havi
ng th
e co
nditi
on.
The
diag
nosi
s cat
egor
ies a
re n
ot m
utua
lly e
xclu
sive
(tha
t is,
the
sam
e en
rolle
e co
uld
be in
clud
ed in
mor
e th
an o
ne c
ateg
ory)
. b R
epor
ted
havi
ng h
ad a
stoo
l blo
od te
st, s
igm
oido
scop
y, o
r col
onos
copy
in th
e pa
st y
ear.
c Feca
l occ
ult b
lood
test
ing,
scre
enin
g co
lono
scop
y, si
gmoi
dosc
opy,
or b
ariu
m e
nem
a.
d Fem
ales
onl
y.
e Any
cla
ims f
or in
divi
dual
or g
roup
dia
bete
s out
patie
nt se
lf-m
anag
emen
t tra
inin
g se
rvic
es, o
r for
edu
catio
n/tra
inin
g se
rvic
es, i
nclu
ding
dia
bete
s die
t tra
inin
g.
f The
patie
nt s
urve
y w
as n
ot c
ondu
cted
for G
eorg
etow
n an
d th
e U
nive
rsity
of M
aryl
and
beca
use
thei
r enr
ollm
ents
wer
e to
o sm
all t
o al
low
sur
vey-
base
d tre
atm
ent-c
ontro
l com
paris
ons
with
acc
epta
ble
pow
er.

TAB
LE V
.4 (c
ontin
ued)
__
____
____
____
____
____
____
____
____
____
____
____
____
____
____
____
____
____
____
____
____
____
____
____
____
____
____
____
____
____
____
____
____
____
____
____
____
____
____
____
___
142
+D
enot
es st
atis
tical
ly si
gnifi
cant
trea
tmen
t-con
trol d
iffer
ence
(p ≤
0.1
0) th
at fa
vors
the
treat
men
t gro
up a
nd is
mod
est (
less
than
10
perc
enta
ge p
oint
s and
less
than
one
-hal
f the
size
of t
he c
ontro
l gro
up
prop
ortio
n [p
c] o
r its
com
plem
ent [
1-pc
]).
++D
enot
es s
tatis
tical
ly s
igni
fican
t tre
atm
ent-c
ontro
l diff
eren
ce (p
≤ 0
.10)
that
favo
rs th
e tre
atm
ent g
roup
and
is la
rge
(mor
e th
an 1
0 pe
rcen
tage
poi
nts
or a
t lea
st o
ne-h
alf t
he s
ize
of th
e co
ntro
l gro
up
prop
ortio
n [p
c] o
r its
com
plem
ent [
1-pc
]).
�D
enot
es st
atis
tical
ly si
gnifi
cant
trea
tmen
t-con
trol d
iffer
ence
(p ≤
0.1
0) o
f any
size
that
favo
rs th
e co
ntro
l gro
up.
CA
D =
cor
onar
y ar
tery
dis
ease
; CH
F =
cong
estiv
e he
art f
ailu
re; L
V F
unct
ion
Test
= c
ontra
st le
ft ve
ntric
ulog
raph
ic, n
ucle
ar m
edic
ine,
or
echo
card
iogr
aphi
c te
sts
for
asse
ssm
ent o
f le
ft ve
ntric
ular
fu
nctio
n.
143
differences in general preventive care (pneumonia vaccination and screening mammography)
and two in disease-specific care (cholesterol testing in diabetes and in CAD).6
Some of the programs may have had some effects on the rates of general and disease-
specific potentially preventable hospitalizations (Table V.5).7 On the one hand, the CenVaNet
program had a modest favorable difference of 4 percentage points on the rate of all potentially
preventable hospitalizations (compared with a control group mean of 16 percent) and a large
difference of 4 percentage points on the rate of potentially preventable CHF hospitalizations
among patients with diabetes (relative to a control group mean of 10 percent). The Georgetown
program had a large treatment-control difference of 0.48 hospitalizations per beneficiary for all
potentially preventable hospitalizations (with a control group mean of 0.93 hospitalizations per
beneficiary) and also a large difference of 26 percentage points for the rate of potentially
preventable CHF hospitalizations among patients with diabetes (with a control group mean of
48 percent). For all potentially preventable hospitalizations, the Hospice of the Valley program
had a small to moderate treatment-control difference of 0.1 hospitalizations per beneficiary
against a control group mean of 0.4 hospitalizations per beneficiary. Finally, in the Health
Quality Partners program, the treatment group had a potentially preventable CAD hospitalization
rate among patients with diabetes of 0 percent, whereas the control group had a rate of 8 percent.
6 Again, as noted previously in the discussion in Chapter II of the scoring ratings, and in the presentation of the
physician survey results in Chapter IV, some of the programs� interventions intentionally did not include certain features. Many of the programs did not focus on general, non-disease-specific preventive care.
7 Table V.5 summarizes results for treatment-control differences for both rates of potentially preventable hospitalizations (that is, rates of whether any such hospitalization occurred in each group) and rates of average number of potentially preventable hospitalizations (that is, the total number of such hospitalizations divided by the number of beneficiaries in the treatment or control group). A difference in rates of hospitalization is considered modest if it is less than 10 percentage points and less than one-half the size of the control group proportion [pc] or its complement [1-pc]), and large if it is more than 10 percentage points or at least one-half the size of the control group proportion [pc] or its complement [1-pc]). A difference in average number of hospitalizations is considered modest if it is less than one-half of the average number for the control group, and large if at least one-half that of the control group.

144
TAB
LE V
.5
SU
MM
AR
Y O
F TR
EATM
ENT-
CO
NTR
OL
DIF
FER
ENC
ES IN
GEN
ERA
L A
ND
DIS
EASE
-SPE
CIF
IC
POTE
NTI
ALL
Y P
REV
ENTA
BLE
HO
SPIT
ALI
ZATI
ON
S A
MO
NG
PA
RTI
CIP
AN
TS
Am
ong
Parti
cipa
nts w
ith:
A
ll Pa
rtici
pant
s
Dia
bete
s
CH
F
CA
D
Prog
ram
H
osp.
for P
oten
tially
Pr
even
tabl
e C
ondi
tions
a
H
osp.
for
CA
Db
Hos
p. fo
r D
iabe
tesc
Hos
p. fo
r C
HF
Mic
ro-
vasc
ular
C
omp.
d
H
osp.
for
Flui
d/El
ectro
-ly
te P
robl
eme
Hos
p. fo
r C
HF
H
osp.
for
CA
Db
Ave
ra
�
Car
le
C
enV
aNet
+
++
�
Cha
rlest
own
C
orSo
lutio
ns
G
eorg
etow
n ++
++
Hos
pice
of t
he V
alle
y +
�
H
ealth
Qua
lity
Partn
ers
++
Jew
ish
Hom
e an
d H
ospi
tal
M
edic
al C
are
Dev
elop
men
t
�
M
ercy
QM
ed
U
nive
rsity
of M
aryl
and
W
ashi
ngto
n U
nive
rsity
�
�
Sour
ce:
Med
icar
e N
atio
nal C
laim
s His
tory
File
, Sta
ndar
d A
naly
tic F
ile, a
nd E
nrol
lmen
t Dat
abas
e. F
irst-y
ear e
nrol
lees
ove
r the
1st
yea
r afte
r ran
dom
ass
ignm
ent i
n th
e 14
pro
gram
s wer
e in
clud
ed,
excl
udin
g an
y m
onth
s dur
ing
whi
ch a
n en
rolle
e di
d no
t mee
t dem
onst
ratio
n-w
ide
elig
ibili
ty re
quire
men
ts.
Not
es:
Qua
lity
Onc
olog
y is
not
incl
uded
. Q
ualit
y O
ncol
ogy
focu
ses
on b
enef
icia
ries
with
can
cer,
and
the
clai
ms-
base
d m
easu
res
this
tabl
e fo
r gen
eral
pot
entia
lly p
reve
ntab
le h
ospi
taliz
atio
ns a
nd
pote
ntia
lly p
reve
ntab
le h
ospi
taliz
atio
ns fo
r dia
bete
s, C
HF,
and
CA
D w
ere
not a
ppro
pria
te fo
r the
pro
gram
. En
rolle
es w
ere
defin
ed a
s ha
ving
dia
bete
s, C
HF
, or C
AD
thro
ugh
Med
icar
e cl
aim
s da
ta.
An
enro
llee
who
had
a c
laim
with
one
of t
hese
dia
gnos
es in
the
2 ye
ars
prio
r to
enro
llmen
t was
de
fined
as h
avin
g th
e co
nditi
on.
The
diag
nosi
s cat
egor
ies a
re n
ot m
utua
lly e
xclu
sive
(that
is, t
he sa
me
enro
llee
coul
d be
incl
uded
in m
ore
than
one
cat
egor
y).
This
tabl
e su
mm
ariz
es re
sults
fo
r tre
atm
ent-c
ontro
l diff
eren
ces
for b
oth
rate
s of
pot
entia
lly p
reve
ntab
le h
ospi
taliz
atio
ns (t
hat i
s, ra
tes
of w
heth
er a
ny s
uch
hosp
italiz
atio
n oc
curr
ed in
eac
h gr
oup)
and
ave
rage
num
ber o
f po
tent
ially
pre
vent
able
hos
pita
lizat
ions
(tha
t is,
the
tota
l num
ber o
f suc
h ho
spita
lizat
ions
div
ided
by
the
num
ber o
f ben
efic
iarie
s in
the
treat
men
t or c
ontro
l gro
up).
The
ave
rage
num
ber o
f ho
spita
lizat
ions
per
ben
efic
iary
may
be
cons
ider
ed th
e m
ore
impo
rtant
out
com
e as
it is
a s
trong
er d
eter
min
ant o
f hos
pita
l cos
ts a
nd is
a m
ore
info
rmat
ive
indi
cato
r of a
dver
se o
utco
mes
. R
estri
ctin
g at
tent
ion
to th
e av
erag
e nu
mbe
r of h
ospi
taliz
atio
ns p
er b
enef
icia
ry, o
nly
the
Geo
rget
own
and
Hos
pice
of t
he V
alle
y pr
ogra
ms h
ad fa
vora
ble
treat
men
t-con
trol d
iffer
ence
s. a A
ny h
ospi
taliz
atio
ns fo
r CH
F, c
hron
ic o
bstru
ctiv
e pu
lmon
ary
dise
ase,
deh
ydra
tion,
or u
rinar
y tra
ct in
fect
ion.
b A
ny h
ospi
taliz
atio
ns fo
r acu
te m
yoca
rdia
l inf
arct
ion,
cor
onar
y ar
tery
byp
ass g
raft
surg
ery,
per
cuta
neou
s tra
nslu
min
al a
ngio
plas
ty, o
r cor
onar
y ar
tery
sten
ting.
c A
ny h
ospi
taliz
atio
ns fo
r dia
bete
s w
ith h
yper
osm
olar
ity, d
iabe
tes
with
ket
oaci
dosis
, dia
bete
s w
ith o
ther
(non
-hyp
eros
mol
ar a
nd n
on-k
etot
ic) c
ompl
icat
ions
, dia
bete
s w
ith o
ther
(non
-hyp
eros
mol
ar a
nd
non-
keto
tic) c
oma,
or d
iabe
tes w
ithou
t men
tion
of c
ompl
icat
ions
. d A
ny h
ospi
taliz
atio
ns, c
laim
s, or
cha
nge
in e
nrol
lmen
t sta
tus f
or d
iabe
tic e
ye d
isea
se, l
aser
trea
tmen
t for
dia
betic
eye
dis
ease
, nep
hrop
athy
, or n
ew e
nd-s
tage
rena
l dis
ease
. e A
ny h
ospi
taliz
atio
ns fo
r hyp
erka
lem
ia, h
yper
natre
mia
, hyp
okal
emia
, hyp
onat
rem
ia, o
r oth
er fl
uid/
elec
troly
te p
robl
ems.
+D
enot
es s
tatis
tical
ly s
igni
fican
t tre
atm
ent-c
ontro
l diff
eren
ce (p
≤ 0
.10)
that
favo
rs th
e tre
atm
ent g
roup
and
is m
odes
t (fo
r rat
es o
f hos
pita
lizat
ion,
less
than
10
perc
enta
ge p
oint
s an
d le
ss th
an o
ne-h
alf
the
size
of t
he c
ontro
l gro
up p
ropo
rtion
[pc]
or i
ts c
ompl
emen
t [1-
pc],
or fo
r ave
rage
num
ber o
f hos
pita
lizat
ions
is le
ss th
an o
ne-h
alf t
he a
vera
ge n
umbe
r for
the
cont
rol g
roup
). ++
Den
otes
sta
tistic
ally
sig
nific
ant t
reat
men
t-con
trol d
iffer
ence
(p ≤
0.1
0) th
at fa
vors
the
treat
men
t gro
up a
nd is
larg
e (f
or ra
tes
of h
ospi
taliz
atio
n, m
ore
than
10
perc
enta
ge p
oint
s or
at l
east
one
-hal
f the
si
ze o
f the
con
trol g
roup
pro
porti
on [p
c] o
r its
com
plem
ent [
1-pc
], or
for a
vera
ge n
umbe
r of h
ospi
taliz
atio
ns is
less
than
one
-hal
f the
ave
rage
num
ber f
or th
e co
ntro
l gro
up).
�D
enot
es st
atis
tical
ly si
gnifi
cant
trea
tmen
t-con
trol d
iffer
ence
(p ≤
0.1
0) o
f any
size
that
favo
rs th
e co
ntro
l gro
up.
CA
D =
cor
onar
y ar
tery
dis
ease
; CH
F =
cong
estiv
e he
art d
isea
se; H
osp.
For
= h
ospi
taliz
atio
n fo
r; M
icro
vasc
ular
Com
p. =
mic
rova
scul
ar c
ompl
icat
ions
.

145
On the other hand, there were also four treatment-control differences favoring the control group
in four programs (one of which was also one of the programs with a difference favoring the
treatment group).
The average number of hospitalizations per beneficiary may be considered the more
important outcome, since it is a stronger determinant of hospital costs and is a more informative
indicator of adverse outcomes. Restricting attention to the average number of hospitalizations
per beneficiary, only the Georgetown and Hospice of the Valley programs had favorable
treatment-control differences.
F. FUNCTIONING, HEALTH STATUS, AND WELL-BEING
Finally, one of the ultimate goals of the demonstration programs is the improvement of
patients� functioning, health status, and well-being. As noted, it was hoped that the programs
would improve patients� self-management of chronic illnesses, reduce unmet needs, and improve
the quality of care, and that these changes would lead to increased functioning and health.
Many of the treatment-control differences in functioning actually favored the control group
(Table V.6), but they were scattered across several different outcomes and programs and of small
magnitude (with all treatment-control differences less than 9 percentage points, all but one less
than 7 percentage points, and control group means in the 70- to 90-percent range). This evidence
suggests no true underlying program effects. Furthermore, there are no plausible mechanisms
for why program interventions would have led to isolated lower rates among the treatment group
in ability to eat or prepare meals independently, for example, without affecting any other
functioning outcomes.
A few of the programs may have led to some positive effects on self-reported measures of
health status and well-being (Table V.7). Two in particular, the CorSolutions program and the

146
TAB
LE V
.6
SU
MM
AR
Y O
F TR
EATM
ENT-
CO
NTR
OL
DIF
FER
ENC
ES IN
MEA
SUR
ES O
F PA
RTI
CIP
AN
TS� F
UN
CTI
ON
ING
: SE
LF-R
EPO
RTE
D A
BIL
ITY
TO
PER
FOR
M S
ELEC
TED
AC
TIV
ITIE
S O
F D
AIL
Y L
IVIN
G IN
DEP
END
ENTL
Y
Prog
ram
Ea
t D
ress
B
athe
U
se
Tele
phon
e Pr
epar
e M
eals
D
o H
ouse
wor
k Sh
op
Take
M
edic
atio
ns
Han
dle
Mon
ey
Ave
ra
�
Car
le
�
�
�
Cen
VaN
et
Cha
rlest
own
�
Cor
Solu
tions
�
Hos
pice
of t
he V
alle
y
Hea
lth Q
ualit
y Pa
rtner
s
Jew
ish
Hom
e an
d H
ospi
tal
�
Med
ical
Car
e D
evel
opm
ent
+
Mer
cy
+
QM
ed
+
Was
hing
ton
Uni
vers
ity
�
Sour
ce:
Patie
nt su
rvey
of t
reat
men
t and
con
trol g
roup
ben
efic
iarie
s pa
rtici
patin
g in
the
prog
ram
s, co
nduc
ted
from
May
200
3 th
roug
h Ju
ne 2
004.
Sam
ple
size
s fo
r ea
ch p
rogr
am r
ange
d fr
om 3
95 to
684
. Th
e m
ean
dura
tion
of p
artic
ipat
ion
at th
e tim
e of
inte
rvie
w w
as 3
01 d
ays.
Res
pons
e ra
tes
rang
ed f
rom
85
to 9
8 pe
rcen
t. N
ote:
O
nly
12 p
rogr
ams
are
show
n.
The
patie
nt s
urve
y w
as n
ot c
ondu
cted
in th
ree
prog
ram
s w
hose
enr
ollm
ents
wer
e to
o sm
all t
o al
low
sur
vey-
base
d tre
atm
ent-c
ontro
l com
paris
ons w
ith a
ccep
tabl
e po
wer
. +
Den
otes
sta
tistic
ally
sig
nific
ant t
reat
men
t-con
trol d
iffer
ence
(p ≤
0.1
0) th
at fa
vors
the
treat
men
t gro
up a
nd is
mod
est (
less
than
10
perc
enta
ge p
oint
s an
d le
ss
than
one
-hal
f the
size
of t
he c
ontro
l gro
up p
ropo
rtion
[pc]
or i
ts c
ompl
emen
t [1-
pc].
++D
enot
es s
tatis
tical
ly s
igni
fican
t tre
atm
ent-c
ontro
l diff
eren
ce (p
≤ 0
.10)
that
favo
rs th
e tre
atm
ent g
roup
and
is la
rge
(mor
e th
an 1
0 pe
rcen
tage
poi
nts
or a
t lea
st
one-
half
the
size
of t
he c
ontro
l gro
up p
ropo
rtion
[pc]
or i
ts c
ompl
emen
t [1-
pc].
�D
enot
es st
atis
tical
ly si
gnifi
cant
trea
tmen
t-con
trol d
iffer
ence
of a
ny si
ze (p
≤ 0
.10)
that
favo
rs th
e co
ntro
l gro
up.
147
TAB
LE V
.7
SU
MM
AR
Y O
F TR
EATM
ENT-
CO
NTR
OL
DIF
FER
ENC
ES IN
PA
RTI
CIP
AN
TS�
SELF
-REP
OR
TED
HEA
LTH
STA
TUS
AN
D W
ELL-
BEI
NG
Em
otio
nal
Dis
tress
a D
epre
ssio
nb Po
or S
leep
c Pa
ind
Effe
ct o
f Prim
ary
Con
ditio
n on
Life
e Ef
fect
of P
rimar
y C
ondi
tion
on F
amily
f Ph
ysic
al H
ealth
Su
mm
ary
Scor
eg M
enta
l Hea
lth
Sum
mar
y Sc
oreg
Ave
ra
+
Car
le
Cen
VaN
et
+
Cha
rlest
own
�
Cor
Solu
tions
+
+ +
Hos
pice
of t
he V
alle
y
+
++
Hea
lth Q
ualit
y Pa
rtner
s +
Jew
ish
Hom
e an
d H
ospi
tal
+
Med
ical
Car
e D
evel
opm
ent
�
Mer
cy
+
QM
ed
+
Was
hing
ton
Uni
vers
ity
Sour
ce:
Patie
nt s
urve
y of
tre
atm
ent
and
cont
rol
grou
p be
nefic
iarie
s pa
rtici
patin
g in
the
pro
gram
s, co
nduc
ted
from
May
200
3 th
roug
h Ju
ne 2
004.
Sa
mpl
e si
zes
for
each
pr
ogra
m ra
nged
from
395
to 6
84.
The
mea
n du
ratio
n of
par
ticip
atio
n at
the
time
of in
terv
iew
was
301
day
s. R
espo
nse
rate
s ran
ged
from
85
to 9
8 pe
rcen
t.
Not
e:
Onl
y 12
pro
gram
s ar
e sh
own.
Th
e pa
tient
sur
vey
was
not
con
duct
ed in
thre
e pr
ogra
ms
who
se e
nrol
lmen
ts w
ere
too
smal
l to
allo
w s
urve
y-ba
sed
treat
men
t-con
trol
com
paris
ons w
ith a
ccep
tabl
e po
wer
.
+D
enot
es s
tatis
tical
ly s
igni
fican
t tre
atm
ent-c
ontro
l diff
eren
ce (p
≤ 0
.10)
that
favo
rs th
e tre
atm
ent g
roup
and
is m
odes
t (le
ss th
an 1
0 pe
rcen
tage
poi
nts
and
less
than
one
-hal
f the
si
ze o
f the
con
trol g
roup
pro
porti
on [p
c] o
r its
com
plem
ent [
1-pc
]).
++ D
enot
es s
tatis
tical
ly s
igni
fican
t tre
atm
ent-c
ontro
l diff
eren
ce (p
≤ 0
.10)
that
favo
rs th
e tre
atm
ent g
roup
and
is la
rge
(mor
e th
an 1
0 pe
rcen
tage
poi
nts
or a
t lea
st o
ne-h
alf t
he s
ize
of th
e co
ntro
l gro
up p
ropo
rtion
[pc]
or i
ts c
ompl
emen
t [1-
pc])
. �
Den
otes
stat
istic
ally
sign
ifica
nt tr
eatm
ent-c
ontro
l diff
eren
ce o
f any
size
(p ≤
0.1
0) th
at fa
vors
the
cont
rol g
roup
.
a Feel
ing
calm
and
pea
cefu
l mos
t or a
ll of
the
time
in th
e pa
st 4
wee
ks.
b Feel
ing
dow
nhea
rted
and
blue
mos
t or a
ll of
the
time
in th
e pa
st 4
wee
ks.
c Bot
here
d by
poo
r sle
ep m
ost o
r all
of th
e tim
e in
the
past
4 w
eeks
. d Pa
in in
terf
ered
with
usu
al a
ctiv
ities
in th
e pa
st 4
wee
ks.
e Prim
ary
cond
ition
inte
rfer
ed a
lot o
r som
ewha
t with
enj
oym
ent o
f life
in th
e pa
st 4
wee
ks.
f Feel
ing
that
prim
ary
cond
ition
pla
ced
a bu
rden
on
fam
ily in
the
past
4 w
eeks
. g Ph
ysic
al a
nd m
enta
l hea
lth su
mm
ary
scor
es fr
om th
e 12
-item
Sho
rt Fo
rm H
ealth
Sta
tus q
uest
ionn
aire
(SF-
12).
148
Hospice of the Valley program, had more than one favorable effect. Treatment group members
in the CorSolutions program had better results on measures of emotional distress, burden of
primary condition on family members, and a summary score of physical health. Treatment group
members in the Hospice of the Valley program had better results on measures of pain and family
burden. Six other programs also had isolated favorable effects on a single outcome.
G. SUMMARY
The strongest program effect was on patients� recognition of having received health
education. Most programs showed a clear pattern of treatment group members reporting having
received instruction on health behaviors, particularly diet and exercise, as well as educational
materials. These results were generally consistent with the quantitative scores of the programs�
patient education efforts described in Chapter II. Two of the programs that had favorable
treatment-control differences across all five measures of patient education in Table V.1 (the
Health Quality Partners and Mercy programs) also received the highest and second-highest
scores for patient education (Table II.6). The sole program with no treatment-control differences
in any of the patient education measures in Table V.1 (Jewish Home and Hospital) was the
lowest-scoring program in Table II.6. The correspondence between program scores and survey
results on patient education was inexact, however, as some of the high-scoring programs
(CorSolutions, Hospice of the Valley, and Avera, for example) were among those with few
differences on the survey-based patient education measures.
Another obvious treatment effect across programs was in patients� recognition of care
coordinator help in arranging services. Treatment groups for 11 of the 12 programs with patient
survey data were much more likely to report having received help in arranging care. These
results are largely consistent with the rating scores for Service and Resource Arranging assigned
to the programs, as the 11 programs are ranked 2nd through 12th on these scores (Table II.6).

149
The Washington University program is an exception, as it was the top-scoring program for
Service and Resource Arranging but had no significant treatment-control differences in any of
the service arrangement and unmet needs outcomes summarized in Table V.3.
Unfortunately, there were no clear-cut effects across the programs for the key outcomes of
health knowledge and behavior, potentially preventable hospitalizations, or physical functioning.
The CenVaNet, Georgetown, and Health Quality Partners programs may have had some
favorable effects in the potentially preventable hospitalization outcomes. However, the pattern
of scattered treatment-control differences distributed across many outcomes and many programs
does not provide strong evidence that either the programs as a group or any single or few
programs had widespread effects in any of these areas.
There are suggestions that the Carle and Health Quality Partners programs had some effects
on general and disease-specific preventive care, such as vaccination, screening mammography,
and recommended blood and urine tests for beneficiaries with diabetes or CAD (Table V.4). The
correlation between the results for these outcomes and the Improving Provider Practice scores
was poor, however. The Carle program had the highest score for Improving Provider Practice,
but the Health Quality Partners program had one of the lowest.
Finally, there are also suggestions that some of the programs had favorable effects on
measures of health status and well-being, particularly the CorSolutions and Hospice of the
Valley programs. These two programs had high scores for Problem Identification and Care
Planning and for Patient Education; strong performance in these two areas might lead to
increased detection and help for patients with psychosocial distress, which is what many of the
health status and well-being questions measure.
The outcomes discussed in this chapter are subject to measurement �noise,� or biases, that
could make detecting true program effects difficult. For example, for the survey-based

150
measures, it is possible that the treatment group members increased their health knowledge
through the programs and, as a result, became more stringent in their self-assessments�they
might have reported their health knowledge and adherence as low even though it was superior to
the control group�s. Furthermore, the measures of quality of care in claims-based processes of
care are not appropriate for all beneficiaries, and many factors besides the intervention can affect
potentially preventable hospitalizations.
With longer followup of the demonstration, the enhanced patient recognition of having
received teaching may translate into detectable behavioral changes and measurable effects on
health care use and costs. Improvements in provider quality of care may persist and become
broader-based across programs, and thus contribute to positive effects on health care use.
Finally, the programs may adjust their interventions and refocus their efforts to increase
program effectiveness.
151
VI. SHORT-TERM EFFECTS ON MEDICARE EXPENDITURES AND SERVICE USE
A key goal of the demonstration is to determine whether the programs reduce Medicare
expenditures and service use and, if so, whether such reductions are enough to offset the
increased costs of providing care coordination. The evaluation estimates the effects of the
interventions on these outcomes in two ways: (1) for beneficiaries who enrolled over the first
12 months of program operations during the 12 months following their month of random
assignment; and (2) each month, over the first 25 calendar months of program operations for
beneficiaries randomized during that time. The evaluation compares the treatment and control
groups in each program separately and for the programs together on mean outcomes, but only
statistically significant differences are taken as evidence that the intervention caused the
difference. Treatment-control differences in the use of hospital, physician, emergency room
(ER), and imaging and procedure services, as well as in Medicare expenditures and mortality, are
described. Differences in the use of skilled nursing facilities, hospice, home health services, and
durable medical equipment were also examined, but they did not indicate any evidence of major
effects. The report therefore presents only those key outcomes most likely to be influenced by
the intervention.
Because of the high variability of these measures in the Medicare population, detecting
differences in service use and expenditures is difficult for the samples enrolled in each program.
Many programs had unexpected difficulties with enrollment and fell short of their targets, which
also leads to less precise estimates than desired. For 10 of the programs, there is at least
70 percent power (or probability) to detect a 20-percent reduction (or increase) in Medicare
expenditures in the 25-month sample. Thus, smaller, but real, program effects on expenditures
may not be detected. For the three smallest programs, the evaluation has only about a 30-percent
chance of detecting a 20-percent reduction in expenditures.
152
The evidence presented here indicates that, for the average number of hospitalizations and
Medicare expenditures over the year after the randomization month and over the first 25 months
of program operations, only one of the programs had a statistically significant effect that favored
the treatment group. None of the programs had significant treatment-control differences in either
the number of hospitalizations or the average monthly Medicare expenditures in the first year
after randomization. The treatment group in the program with a favorable effect�Mercy�had
27 percent fewer hospitalizations per beneficiary per year than the control group over the first
25 months (0.73 versus 1.01, p = 0.003). Average Medicare expenditures per month were
13 percent lower, or $154 less, than those of the control group (p = 0.105). The treatment groups
in four other programs�Quality Oncology, Hospice of the Valley, Georgetown University, and
Health Quality Partners�had 12 to 18 percent fewer hospitalizations over the 25 months, but
these differences were not statistically significant. Only Georgetown had a concomitant
treatment-control difference in Medicare expenditures (of 12 percent), but this, too, was not
statistically significant. Across all 15 programs, hospitalizations were 4 percent lower for the
treatment than for the control group (p = 0.145) and Medicare expenditures were 2 percent less
(p = 0.368). Turning to whether the programs are cost neutral, the 15 programs combined are
not. There is some evidence that five of the programs might be cost neutral over the first
25 months of operations. However, because of large variations in Medicare expenditures, more
follow-up time is needed to determine this conclusively.
A. TREATMENT-CONTROL DIFFERENCES IN MEDICARE EXPENDITURES AND SERVICE USE
Treatment-control differences were estimated in two ways: (1) through comparison of
outcomes during the 12 months following the month of random assignment for all beneficiaries
who were randomized during the program�s first year of operations, and (2) through examination

153
of how cost-effectiveness might vary over a longer follow-up period by estimating cumulative
monthly impacts over the first 25 calendar months of program operations.8 For the 25-month
analysis, the patients who were enrolled in the program through the first 25 months were
identified and the average monthly Medicare-covered expenditures and hospitalizations for all
patient-months through that month were analyzed. For example, a beneficiary who was
randomized in August 2002 and died on October 31, 2002, would contribute 3 patient-months to
the cumulative total (for August, September, and October of 2002), provided he or she had been
eligible in each month.9
Because these measures, especially Medicare expenditures, are highly variable, it is
important to note that there can be sizable differences due to chance between the treatment and
8 The evaluation began measuring Medicare expenditures and service use for this analysis in the first full
month after random assignment. For example, for a beneficiary randomized on September 15, 2002, 1-year outcomes are calculated from October 1, 2002, through September 30, 2003. The evaluation examines expenditures and service use over 12 calendar months because basic eligibility is assessed on a calendar-month basis. The month of randomization is omitted because programs are not expected to alter service use during the first month. As a sensitivity test, two key outcomes, expenditures and hospital use, were calculated over the year starting from the date of random assignment. The findings were nearly identical.
9 The estimates for both analyses exclude Medicare expenditures and service use during months when the beneficiary did not meet basic insurance and coverage requirements for the demonstration specified by the Centers for Medicare & Medicaid Services (CMS) (has both Part A and B coverage, has Medicare as the primary payer, is not in a health maintenance organization, and is alive for some part of the month), because we could not fully observe the outcomes during those months.
For all outcome measures except mortality, observations are weighted to reflect the length of time the patient was eligible for the study. For binary outcomes covering a 1-year follow-up period (such as had any hospitalizations, used physician services), a separate weight was constructed for each outcome. A person who is observed (that is, eligible) for the full follow-up time receives a weight of 1. Similarly, a person who is ineligible for some months but experienced the outcome during the observed period (for example, was hospitalized) receives a weight of 1. A person who is ineligible for some months and did not experience the outcome during the observed follow-up period receives a weight equal to the number of follow-up months observed, divided by 12. For example, someone observed for 3 months of a 12-month follow-up period receives a weight of 0.25. For continuous outcomes, such as costs and the number of visits, the weight is calculated as the proportion of the follow-up period that is observed. The last step in weighting is to normalize the weights so they sum to the number of observations.
The payment for the intervention was calculated as the amount CMS paid to the program for treatment group patients, using claims from the physician claims file with �G� codes.
Because of rounding, the column in all tables reporting treatment-control differences may differ slightly from the result when the control column is subtracted from the treatment column.
154
control groups, both before and after enrollment. Whether the difference is likely to be due to
the program is determined by a test of its statistical significance, which takes into account the
size of the estimate, the sample size, and how varied the values are. A difference that is not
statistically significant indicates that the treatment and control groups are comparable�that is,
that the observed difference is well within the range that might be expected simply as a result of
chance and should not be attributed to the program.
Any chance differences observed between the treatment and control groups on
preenrollment characteristics were accounted for through use of regression models to adjust the
estimates of three key outcomes�the proportion with a hospitalization, the average number of
hospitalizations, and total Part A and Part B expenditures. The regressions controlled for age;
gender; whether the beneficiary had been treated for congestive heart failure (CHF) during the
2 years before randomization (in programs that did not exclusively target CHF); the number of
the following conditions the patient had been treated for during the two years before
randomization: coronary artery disease, CHF, stroke, diabetes, cancer, chronic obstructive
pulmonary disease, dementia, peripheral vascular disease, end-stage renal disease, depression,
and asthma; the annualized number of hospital admissions in the previous year; and total
Medicare Part A and Part B expenditures per month in the prior year.
The findings show that the programs treated patients with very different levels of risk for
hospital utilization and expenditures. This is consistent with the differences in populations
served, described in Chapter III. About 43 percent of the control group was hospitalized over the
year after enrollment, ranging from a low of about 20 percent in Health Quality Partners and
QMed to a high of nearly two-thirds in CorSolutions and the University of Maryland
(Table VI.1). During the first 25 months, control group members in Health Quality Partners and
QMed had experienced an annualized average of 0.4 hospitalizations per year, whereas those in
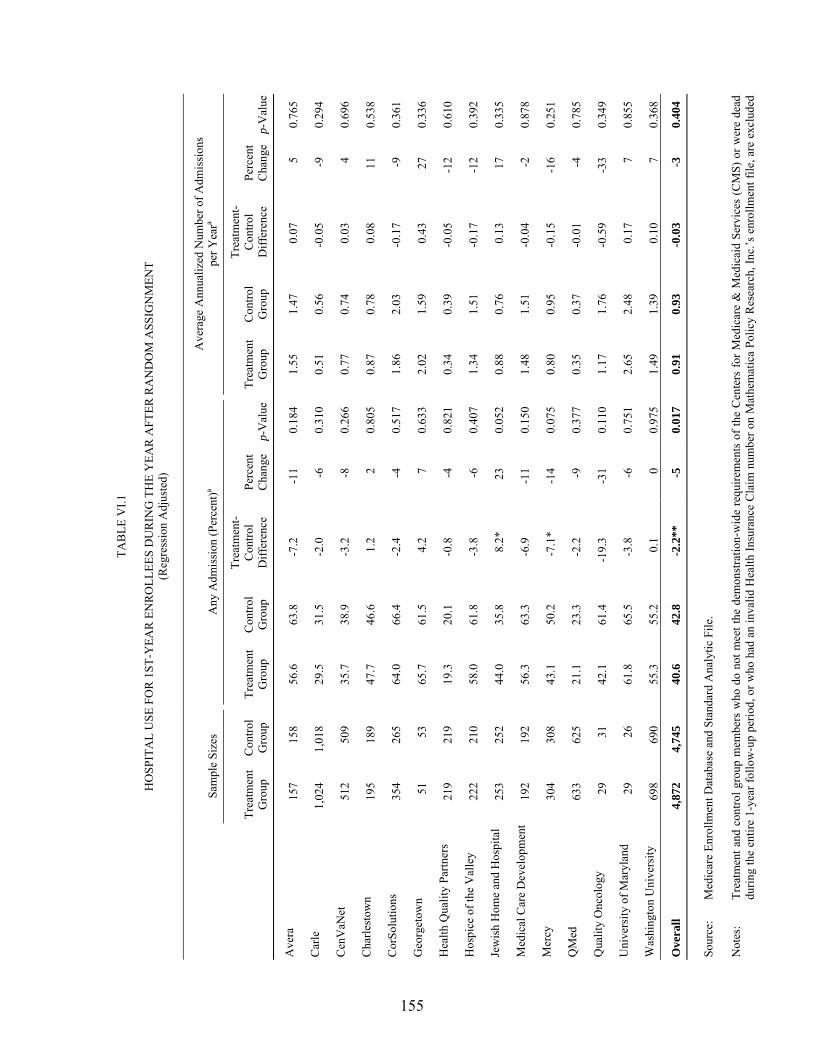
155
TAB
LE V
I.1
H
OSP
ITA
L U
SE F
OR
1ST
-YEA
R E
NR
OLL
EES
DU
RIN
G T
HE
YEA
R A
FTER
RA
ND
OM
ASS
IGN
MEN
T (R
egre
ssio
n A
djus
ted)
Sa
mpl
e Si
zes
Any
Adm
issi
on (P
erce
nt)a
Ave
rage
Ann
ualiz
ed N
umbe
r of A
dmis
sion
s pe
r Yea
ra
Tr
eatm
ent
Gro
up
Con
trol
Gro
up
Trea
tmen
t G
roup
C
ontro
l G
roup
Trea
tmen
t-C
ontro
l D
iffer
ence
Pe
rcen
t C
hang
e p-
Val
ue
Trea
tmen
t G
roup
C
ontro
l G
roup
Trea
tmen
t-C
ontro
l D
iffer
ence
Pe
rcen
t C
hang
e p-
Val
ue
Ave
ra
157
158
56.6
63
.8
-7.2
-1
1 0.
184
1.55
1.
47
0.07
5
0.76
5
Car
le
1,02
4 1,
018
29.5
31
.5
-2.0
-6
0.
310
0.51
0.
56
-0.0
5 -9
0.
294
Cen
VaN
et
512
509
35.7
38
.9
-3.2
-8
0.
266
0.77
0.
74
0.03
4
0.69
6
Cha
rlest
own
195
189
47.7
46
.6
1.2
2 0.
805
0.87
0.
78
0.08
11
0.
538
Cor
Solu
tions
35
4 26
5 64
.0
66.4
-2
.4
-4
0.51
7 1.
86
2.03
-0
.17
-9
0.36
1
Geo
rget
own
51
53
65.7
61
.5
4.2
7 0.
633
2.02
1.
59
0.43
27
0.
336
Hea
lth Q
ualit
y Pa
rtner
s 21
9 21
9 19
.3
20.1
-0
.8
-4
0.82
1 0.
34
0.39
-0
.05
-12
0.61
0
Hos
pice
of t
he V
alle
y 22
2 21
0 58
.0
61.8
-3
.8
-6
0.40
7 1.
34
1.51
-0
.17
-12
0.39
2
Jew
ish
Hom
e an
d H
ospi
tal
253
252
44.0
35
.8
8.2*
23
0.
052
0.88
0.
76
0.13
17
0.
335
Med
ical
Car
e D
evel
opm
ent
192
192
56.3
63
.3
-6.9
-1
1 0.
150
1.48
1.
51
-0.0
4 -2
0.
878
Mer
cy
304
308
43.1
50
.2
-7.1
* -1
4 0.
075
0.80
0.
95
-0.1
5 -1
6 0.
251
QM
ed
633
625
21.1
23
.3
-2.2
-9
0.
377
0.35
0.
37
-0.0
1 -4
0.
785
Qua
lity
Onc
olog
y 29
31
42
.1
61.4
-1
9.3
-31
0.11
0 1.
17
1.76
-0
.59
-33
0.34
9
Uni
vers
ity o
f Mar
ylan
d 29
26
61
.8
65.5
-3
.8
-6
0.75
1 2.
65
2.48
0.
17
7 0.
855
Was
hing
ton
Uni
vers
ity
698
690
55.3
55
.2
0.1
0 0.
975
1.49
1.
39
0.10
7
0.36
8
Ove
rall
4,87
2 4,
745
40.6
42
.8
-2.2
**
-5
0.01
7 0.
91
0.93
-0
.03
-3
0.40
4 So
urce
: M
edic
are
Enro
llmen
t Dat
abas
e an
d St
anda
rd A
naly
tic F
ile.
Not
es:
Trea
tmen
t and
con
trol g
roup
mem
bers
who
do
not m
eet t
he d
emon
stra
tion-
wid
e re
quire
men
ts o
f the
Cen
ters
for M
edic
are
& M
edic
aid
Serv
ices
(CM
S) o
r wer
e de
ad
durin
g th
e en
tire
1-ye
ar fo
llow
-up
perio
d, o
r who
had
an
inva
lid H
ealth
Insu
ranc
e C
laim
num
ber o
n M
athe
mat
ica
Polic
y R
esea
rch,
Inc.
�s e
nrol
lmen
t file
, are
exc
lude
d

TAB
LE V
I.1 (c
ontin
ued)
__
____
____
____
____
____
____
____
____
____
____
____
____
____
____
____
____
____
____
____
____
____
____
____
____
____
____
____
____
____
____
____
____
____
____
____
__
156
from
this
tabl
e be
caus
e M
edic
are
data
sho
win
g th
eir
paym
ents
in th
e fe
e-fo
r-se
rvic
e pr
ogra
m w
ere
not a
vaila
ble.
M
embe
rs o
f th
e sa
me
hous
ehol
ds a
s th
e re
sear
ch
sam
ple
mem
bers
are
als
o ex
clud
ed.
Th
e ou
tcom
es a
re w
eigh
ted
acco
rdin
g to
the
prop
ortio
n of
the
12-m
onth
follo
w-u
p pe
riod
each
sam
ple
mem
ber m
eets
CM
S�s
dem
onst
ratio
n-w
ide
requ
irem
ents
and
is
aliv
e. C
MS�
s re
quire
men
ts a
re a
s fo
llow
s: b
eing
in fe
e-fo
r-se
rvic
e, h
avin
g bo
th P
art A
and
Par
t B c
over
age,
and
hav
ing
Med
icar
e as
the
prim
ary
paye
r. W
eigh
ts a
re
calc
ulat
ed se
para
tely
for t
he tr
eatm
ent a
nd c
ontro
l gro
ups.
See
foot
note
9 in
this
cha
pter
for a
det
aile
d ex
plan
atio
n of
the
wei
ghtin
g al
gorit
hm.
a A st
atis
tical
ly si
gnifi
cant
and
neg
ativ
e tre
atm
ent-c
ontro
l diff
eren
ce a
nd p
erce
nt c
hang
e va
lue
indi
cate
that
the
treat
men
t gro
up is
usi
ng fe
wer
serv
ices
than
the
cont
rol g
roup
. Th
is
sign
ifies
that
the
prog
ram
is w
orki
ng a
s int
ende
d.
*
Diff
eren
ce b
etw
een
the
treat
men
t and
con
trol g
roup
s is s
igni
fican
tly d
iffer
ent f
rom
0 a
t the
0.1
0 le
vel,
2-ta
iled
test
. *
*Diff
eren
ce b
etw
een
the
treat
men
t and
con
trol g
roup
s is s
igni
fican
tly d
iffer
ent f
rom
0 a
t the
0.0
5 le
vel,
2-ta
iled
test
. **
*Diff
eren
ce b
etw
een
the
treat
men
t and
con
trol g
roup
s is s
igni
fican
tly d
iffer
ent f
rom
0 a
t the
0.0
1 le
vel,
2-ta
iled
test
.
157
the University of Maryland experienced more than 2 per year (Table VI.2). Similarly, average
monthly Medicare expenditures for the control group over the first 25 months of operations
varied substantially. The lowest-cost members were in Health Quality Partners, where the
monthly average was $608, only slightly above the 2002 national average of $509 for all
beneficiaries in fee-for-service (Cubanski et al. 2005). The highest-cost patients were served by
Quality Oncology, where Medicare expenditures per patient averaged $4,280 a month.
The treatment group was slightly less likely than the control group overall to experience a
hospitalization in the first year after randomization. The difference (2.2 percentage points, about
5 percent of the control group mean) is statistically significant (p = 0.017). The treatment group
had a lower proportion hospitalized than the control group in 11 of the 15 programs, but Mercy
was the only program to have a statistically significant difference favoring the treatment group.
In Mercy, 43 three percent of the treatment group and 50 percent of the control group had a
hospitalization, a 14-percent difference (p = 0.075). The proportion with a hospitalization was
23 percent higher for the treatment than the control group in Jewish Home and Hospital, and the
difference was statistically significant (p = 0.052).
Overall, combining the 15 programs, the number of hospitalizations per patient was
3 percent lower during the year after intake and 4 percent lower during the first 25 months of
operations. Neither modest difference was statistically significant (p = 0.404 and 0.145,
respectively), but given the statistically significant effect on the proportion with an admission in
their first year after enrollment, it probably reflects a true (though small) effect of the program.
The magnitude of treatment-control differences in the year after the randomization month ranged
across the 15 programs from the treatment group having 27 percent more hospitalizations to it
having 33 percent fewer hospitalizations. Over the first 25 months of operations, the differences
ranged from 14 percent more to 27 percent fewer hospitalizations (Table VI.2).
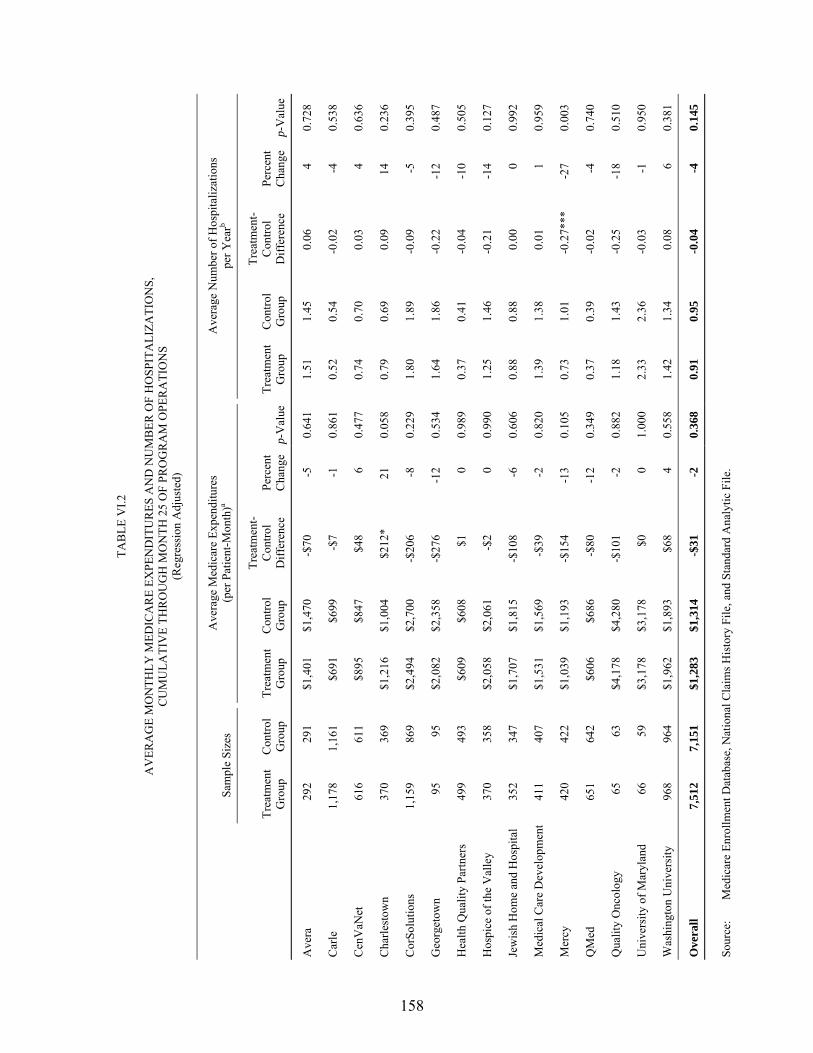
158
TAB
LE V
I.2
A
VER
AG
E M
ON
THLY
MED
ICA
RE
EXPE
ND
ITU
RES
AN
D N
UM
BER
OF
HO
SPIT
ALI
ZATI
ON
S,
CU
MU
LATI
VE
THR
OU
GH
MO
NTH
25
OF
PRO
GR
AM
OPE
RA
TIO
NS
(Reg
ress
ion
Adj
uste
d)
Sa
mpl
e Si
zes
Ave
rage
Med
icar
e Ex
pend
iture
s (p
er P
atie
nt-M
onth
)a
Ave
rage
Num
ber o
f Hos
pita
lizat
ions
pe
r Yea
rb
Tr
eatm
ent
Gro
up
Con
trol
Gro
up
Trea
tmen
t G
roup
C
ontro
l G
roup
Trea
tmen
t-C
ontro
l D
iffer
ence
Pe
rcen
t C
hang
e p-
Val
ue
Trea
tmen
t G
roup
C
ontro
l G
roup
Trea
tmen
t-C
ontro
l D
iffer
ence
Pe
rcen
t C
hang
e p-
Val
ue
Ave
ra
292
291
$1,4
01
$1,4
70
-$70
-5
0.
641
1.
51
1.45
0.
06
4 0.
728
Car
le
1,17
8 1,
161
$691
$6
99
-$7
-1
0.86
1
0.52
0.
54
-0.0
2 -4
0.
538
Cen
VaN
et
616
611
$895
$8
47
$48
6 0.
477
0.
74
0.70
0.
03
4 0.
636
Cha
rlest
own
370
369
$1,2
16
$1,0
04
$212
* 21
0.
058
0.
79
0.69
0.
09
14
0.23
6
Cor
Solu
tions
1,
159
869
$2,4
94
$2,7
00
-$20
6 -8
0.
229
1.
80
1.89
-0
.09
-5
0.39
5
Geo
rget
own
95
95
$2,0
82
$2,3
58
-$27
6 -1
2 0.
534
1.
64
1.86
-0
.22
-12
0.48
7
Hea
lth Q
ualit
y Pa
rtner
s 49
9 49
3 $6
09
$608
$1
0
0.98
9
0.37
0.
41
-0.0
4 -1
0 0.
505
Hos
pice
of t
he V
alle
y 37
0 35
8 $2
,058
$2
,061
-$
2 0
0.99
0
1.25
1.
46
-0.2
1 -1
4 0.
127
Jew
ish
Hom
e an
d H
ospi
tal
352
347
$1,7
07
$1,8
15
-$10
8 -6
0.
606
0.
88
0.88
0.
00
0 0.
992
Med
ical
Car
e D
evel
opm
ent
411
407
$1,5
31
$1,5
69
-$39
-2
0.
820
1.
39
1.38
0.
01
1 0.
959
Mer
cy
420
422
$1,0
39
$1,1
93
-$15
4 -1
3 0.
105
0.
73
1.01
-0
.27*
**
-27
0.00
3
QM
ed
651
642
$606
$6
86
-$80
-1
2 0.
349
0.
37
0.39
-0
.02
-4
0.74
0
Qua
lity
Onc
olog
y 65
63
$4
,178
$4
,280
-$
101
-2
0.88
2
1.18
1.
43
-0.2
5 -1
8 0.
510
Uni
vers
ity o
f Mar
ylan
d 66
59
$3
,178
$3
,178
$0
0
1.00
0
2.33
2.
36
-0.0
3 -1
0.
950
Was
hing
ton
Uni
vers
ity
968
964
$1,9
62
$1,8
93
$68
4 0.
558
1.
42
1.34
0.
08
6 0.
381
Ove
rall
7,51
2 7,
151
$1,2
83
$1,3
14
-$31
-2
0.
368
0.
91
0.95
-0
.04
-4
0.14
5 So
urce
: M
edic
are
Enro
llmen
t Dat
abas
e, N
atio
nal C
laim
s His
tory
File
, and
Sta
ndar
d A
naly
tic F
ile.

TAB
LE V
I.2 (c
ontin
ued)
__
____
____
____
____
____
____
____
____
____
____
____
____
____
____
____
____
____
____
____
____
____
____
____
____
____
____
____
____
____
____
____
____
____
____
____
__
159
Not
es:
Trea
tmen
t and
con
trol g
roup
mem
bers
who
do
not m
eet t
he d
emon
stra
tion-
wid
e re
quire
men
ts o
f the
Cen
ters
for M
edic
are
& M
edic
aid
Serv
ices
(CM
S) o
r wer
e de
ad
durin
g th
e en
tire
25-m
onth
fol
low
-up
perio
d, o
r w
ho h
ad a
n in
valid
Hea
lth I
nsur
ance
Cla
im n
umbe
r on
Mat
hem
atic
a Po
licy
Res
earc
h, I
nc.�s
enr
ollm
ent
file,
are
ex
clud
ed f
rom
this
tabl
e be
caus
e M
edic
are
data
sho
win
g th
eir
paym
ents
in th
e fe
e-fo
r-se
rvic
e pr
ogra
m w
ere
not a
vaila
ble.
Mem
bers
of
the
sam
e ho
useh
olds
as
the
rese
arch
sam
ple
mem
bers
are
als
o ex
clud
ed.
Th
e ou
tcom
es a
re w
eigh
ted
acco
rdin
g to
the
pro
porti
on o
f th
e 25
-mon
th f
ollo
w-u
p pe
riod
each
sam
ple
mem
ber
is e
nrol
led,
mee
ts C
MS�
s de
mon
stra
tion-
wid
e re
quire
men
ts, a
nd is
aliv
e. C
MS�
s re
quire
men
ts a
re a
s fo
llow
s: b
eing
in fe
e-fo
r-se
rvic
e, h
avin
g bo
th P
art A
and
Par
t B c
over
age,
and
hav
ing
Med
icar
e as
the
prim
ary
paye
r. W
eigh
ts a
re c
alcu
late
d se
para
tely
for t
he tr
eatm
ent a
nd c
ontro
l gro
ups.
All
othe
r mon
ths
are
incl
uded
, inc
ludi
ng th
ose
whe
n th
e pr
ogra
m h
ad d
isen
rolle
d th
e pa
tient
as a
resu
lt of
oth
er re
ason
s not
des
crib
ed h
ere.
See
foot
note
9 in
this
cha
pter
for a
det
aile
d ex
plan
atio
n of
the
wei
ghtin
g al
gorit
hm.
a A s
tatis
tical
ly s
igni
fican
t and
neg
ativ
e tre
atm
ent-c
ontro
l diff
eren
ce a
nd p
erce
nt c
hang
e va
lue
indi
cate
that
exp
endi
ture
s w
ere
low
er f
or th
e tre
atm
ent t
han
cont
rol g
roup
. Th
is
sign
ifies
that
the
prog
ram
is w
orki
ng a
s int
ende
d.
b A s
tatis
tical
ly s
igni
fican
t and
neg
ativ
e tre
atm
ent-c
ontro
l diff
eren
ce a
nd p
erce
nt c
hang
e va
lue
indi
cate
that
the
treat
men
t gro
up h
as fe
wer
hos
pita
lizat
ions
than
the
cont
rol g
roup
. Th
is si
gnifi
es th
at th
e pr
ogra
m is
wor
king
as i
nten
ded.
*D
iffer
ence
bet
wee
n th
e tre
atm
ent a
nd c
ontro
l gro
ups i
s sig
nific
antly
diff
eren
t fro
m 0
at t
he 0
.10
leve
l, 2-
taile
d te
st.
**D
iffer
ence
bet
wee
n th
e tre
atm
ent a
nd c
ontro
l gro
ups i
s sig
nific
antly
diff
eren
t fro
m 0
at t
he 0
.05
leve
l, 2-
taile
d te
st.
***D
iffer
ence
bet
wee
n th
e tre
atm
ent a
nd c
ontro
l gro
ups i
s sig
nific
antly
diff
eren
t fro
m 0
at t
he 0
.01
leve
l, 2-
taile
d te
st.
160
In five of the programs, the treatment group had at least 10 percent fewer hospitalizations
than the control group during the first 25 months of operations. Mercy, the program with the
largest difference (27 percent), is the only program for which the difference was statistically
significant. This difference is somewhat larger than the 16-percent difference (p = 0.251)
observed in the year after intake and is consistent with the statistically significant difference in
the proportion with a hospitalization observed in year 1 (noted above). Quality Oncology,
Hospice of the Valley, Georgetown University, and Health Quality Partners are the four other
programs with sizable treatment-control differences in hospitalizations over the first 25 months,
but these differences were not statistically significant. The four programs� treatment groups
experienced 18, 14, 12, and 10 percent fewer hospitalizations, respectively, than their control
groups. Two of these programs (Georgetown University and Quality Oncology) had very small
sample sizes, making it difficult to attribute the differences to the programs, rather than
to chance.
The treatment groups in three programs had higher hospitalizations rates than the control
groups. Although none of these differences were statistically significant, it is possible that care
coordination increases utilization (Congressional Budget Office 2004; Schore et al. 1999). This
might occur if care coordinators uncover unmet needs. Over the 25-month period,
Charlestown�s treatment group had 14 percent more hospitalizations per year than the control
group (0.79 versus 0.69, p = 0.236). Given the already rich medical services in that environment,
the difference seems likely to be due to chance, rather than to the effects of the program, as do
the smaller differences in Washington University and Avera.
Although some programs said that they expected the number of physician visits and tests to
increase in the first year, as patients were encouraged to obtain more preventive care, the
treatment groups had about the same rate of use as the control groups. There were very few

161
statistically significant treatment-control differences in the patients� number of physician visits
or the proportion who had tests or imaging (Table VI.3) or in hospital outpatient department
services or the numbers of those services they received (Table VI.4). Furthermore, even some of
the statistically significant differences were very small in magnitude. For example, the treatment
group in Carle received an average of one more test or imaging procedure (Table VI.3). The
observed difference in the number of hospital outpatient services (4) was somewhat larger in
Georgetown (p = 0.010). The one instance of significantly lower use in the treatment group was
for use of hospital outpatient department services in the small University of Maryland program
(68 percent versus 88 percent, p = 0.095) (Table VI.4).
The treatment groups in two programs had lower use of ER services than the control groups.
The proportion of the treatment groups in CorSolutions and Hospice of the Valley using ER
services were 8.4 and 10 percentage points lower than their respective control groups (p = 0.038
and 0.045, respectively) (Table VI.5). These differences did not, however, translate to a
difference in the average number of ER visits.
The treatment and control groups in 14 of the 15 programs had a statistically comparable
mortality rate over the year after the month of random assignment. The only exception was in
Health Quality Partners, where the mortality rate of the treatment group was 2 percentage points
lower than that of the control group (p = 0.093) (Table VI.6). The mortality rate of the
programs� enrollees varied substantially. Enrollees in Carle, Health Quality Partners, and QMed
had 1-year mortality rates well below the national average for all Medicare beneficiaries of
5 percent, which suggests that the patients enrolled are healthier than average despite having
some chronic illnesses. In contrast, five programs had high mortality rates, ranging from 15 to
38 percent, which indicates that they enrolled very sick beneficiaries.

162
TABLE VI.3
PHYSICIAN SERVICES AND PROCEDURES FOR 1ST-YEAR ENROLLEES DURING THE YEAR AFTER RANDOM ASSIGNMENT
Average Annualized Number of Claimsa,b
Sample Sizes
Physician Services and Procedures (Not in Hospital or ER) Tests and Imaging
Treatment
Group Control Group
Treatment Group
Treatment-Control
Difference p-ValueTreatment
Group
Treatment-Control
Difference p-Value
Avera 157 158 14.3 0.5 0.697 20.1 0.7 0.689
Carle 1,024 1,018 10.9 0.6 0.125 12.9 1.0** 0.048
CenVaNet 512 509 11.0 0.0 0.945 13.6 0.5 0.484
Charlestown 195 189 20.2 1.4 0.229 16.6 2.0 0.144
CorSolutions 354 265 17.1 -0.3 0.795 22.3 -0.9 0.607
Georgetown 51 53 16.2 0.3 0.873 19.3 -1.3 0.713
Health Quality Partners 219 219 13.1 0.2 0.785 8.6 0.6 0.508
Hospice of the Valley 222 210 15.9 -1.4 0.308 17.6 -1.5 0.405
Jewish Home and Hospital 253 252 19.1 1.3 0.364 11.8 1.8 0.151
Medical Care Development 192 192 13.9 -0.8 0.458 16.6 -3.0 0.153
Mercy 304 308 14.7 0.2 0.779 8.8 -0.9 0.220
QMed 633 625 13.9 0.7 0.266 8.8 0.5 0.331
Quality Oncology 29 31 36.0 2.2 0.690 37.5 1.5 0.819
University of Maryland 29 26 11.1 -0.8 0.761 22.8 3.6 0.550
Washington University 698 690 14.6 -0.3 0.637 19.8 0.4 0.741
Overall 4,872 4,745 14.0 0.3 0.200 14.5 0.5 0.119
Source: Medicare Enrollment Database and National Claims History File. Notes: Treatment and control group members who do not meet the demonstration-wide requirements of the Centers for
Medicare & Medicaid Services (CMS) or were dead during the entire 1-year follow-up period, had an invalid Health Insurance Claim number on Mathematica Policy Research, Inc.�s enrollment file, or were identified as a member of the same household as a research sample member are excluded from this table. The outcomes are weighted according to the proportion of the 12-month follow-up period each sample member meets CMS�s demonstration-wide requirements and is alive. CMS�s requirements are as follows: being in fee-for-service, having both Part A and Part B coverage, and having Medicare as the primary payer. Weights are calculated separately for the treatment and control groups. See footnote 9 in this chapter for a detailed explanation of the weighting algorithm.
aThis count is limited to 1 per day for each provider for each patient. bThe direction of the treatment-control difference does not by itself signify whether the program is �effective.� A positive difference does not necessarily mean the program is ineffective or having adverse effects, because the program may encourage patients to see their physicians more regularly for preventative care or to obtain more recommended laboratory tests for their target conditions than they would have had in the absence of the demonstration. *Difference between the treatment and control groups significantly different from 0 at the 0.10 level, 2-tailed test. **Difference between the treatment and control groups significantly different from 0 at the 0.05 level, 2-tailed test. ***Difference between the treatment and control groups significantly different from 0 at the 0.01 level, 2-tailed test. ER = emergency room.
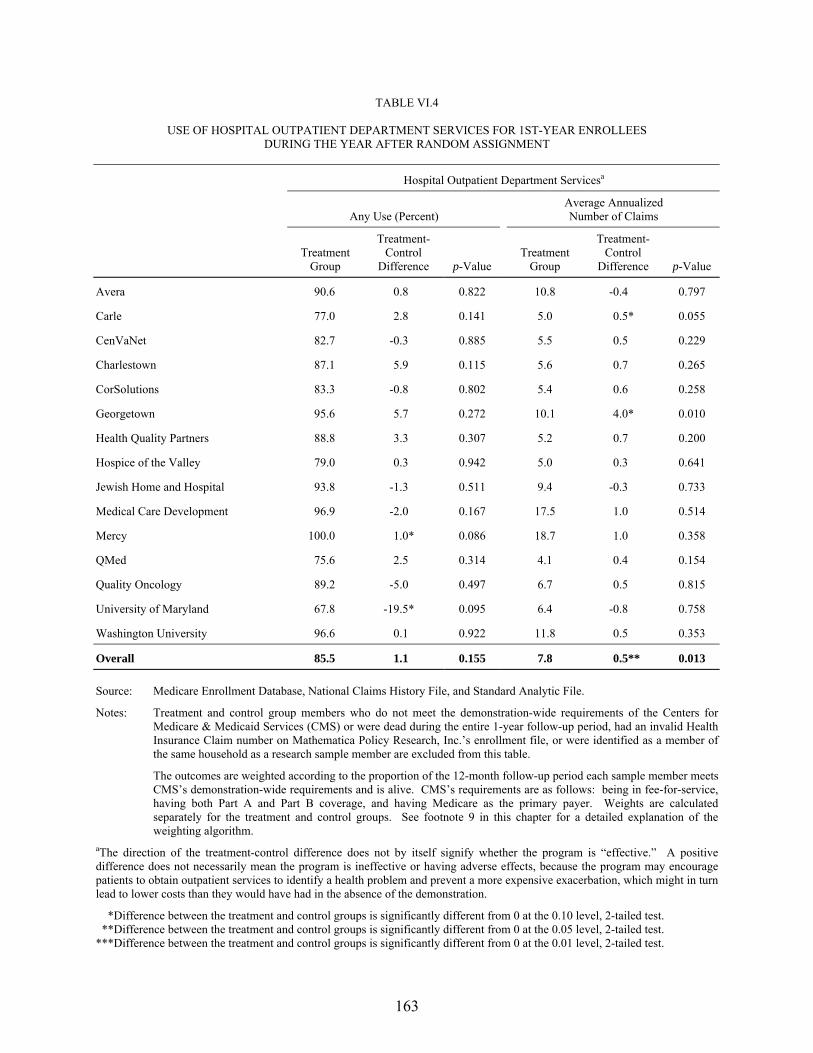
163
TABLE VI.4
USE OF HOSPITAL OUTPATIENT DEPARTMENT SERVICES FOR 1ST-YEAR ENROLLEES DURING THE YEAR AFTER RANDOM ASSIGNMENT
Hospital Outpatient Department Servicesa
Any Use (Percent)
Average Annualized Number of Claims
Treatment
Group
Treatment-Control
Difference p-Value Treatment
Group
Treatment-Control
Difference p-Value
Avera 90.6 0.8 0.822 10.8 -0.4 0.797
Carle 77.0 2.8 0.141 5.0 0.5* 0.055
CenVaNet 82.7 -0.3 0.885 5.5 0.5 0.229
Charlestown 87.1 5.9 0.115 5.6 0.7 0.265
CorSolutions 83.3 -0.8 0.802 5.4 0.6 0.258
Georgetown 95.6 5.7 0.272 10.1 4.0* 0.010
Health Quality Partners 88.8 3.3 0.307 5.2 0.7 0.200
Hospice of the Valley 79.0 0.3 0.942 5.0 0.3 0.641
Jewish Home and Hospital 93.8 -1.3 0.511 9.4 -0.3 0.733
Medical Care Development 96.9 -2.0 0.167 17.5 1.0 0.514
Mercy 100.0 1.0* 0.086 18.7 1.0 0.358
QMed 75.6 2.5 0.314 4.1 0.4 0.154
Quality Oncology 89.2 -5.0 0.497 6.7 0.5 0.815
University of Maryland 67.8 -19.5* 0.095 6.4 -0.8 0.758
Washington University 96.6 0.1 0.922 11.8 0.5 0.353
Overall 85.5 1.1 0.155 7.8 0.5** 0.013 Source: Medicare Enrollment Database, National Claims History File, and Standard Analytic File.
Notes: Treatment and control group members who do not meet the demonstration-wide requirements of the Centers for Medicare & Medicaid Services (CMS) or were dead during the entire 1-year follow-up period, had an invalid Health Insurance Claim number on Mathematica Policy Research, Inc.�s enrollment file, or were identified as a member of the same household as a research sample member are excluded from this table.
The outcomes are weighted according to the proportion of the 12-month follow-up period each sample member meets CMS�s demonstration-wide requirements and is alive. CMS�s requirements are as follows: being in fee-for-service, having both Part A and Part B coverage, and having Medicare as the primary payer. Weights are calculated separately for the treatment and control groups. See footnote 9 in this chapter for a detailed explanation of the weighting algorithm.
aThe direction of the treatment-control difference does not by itself signify whether the program is �effective.� A positive difference does not necessarily mean the program is ineffective or having adverse effects, because the program may encourage patients to obtain outpatient services to identify a health problem and prevent a more expensive exacerbation, which might in turn lead to lower costs than they would have had in the absence of the demonstration.
*Difference between the treatment and control groups is significantly different from 0 at the 0.10 level, 2-tailed test. **Difference between the treatment and control groups is significantly different from 0 at the 0.05 level, 2-tailed test. ***Difference between the treatment and control groups is significantly different from 0 at the 0.01 level, 2-tailed test.
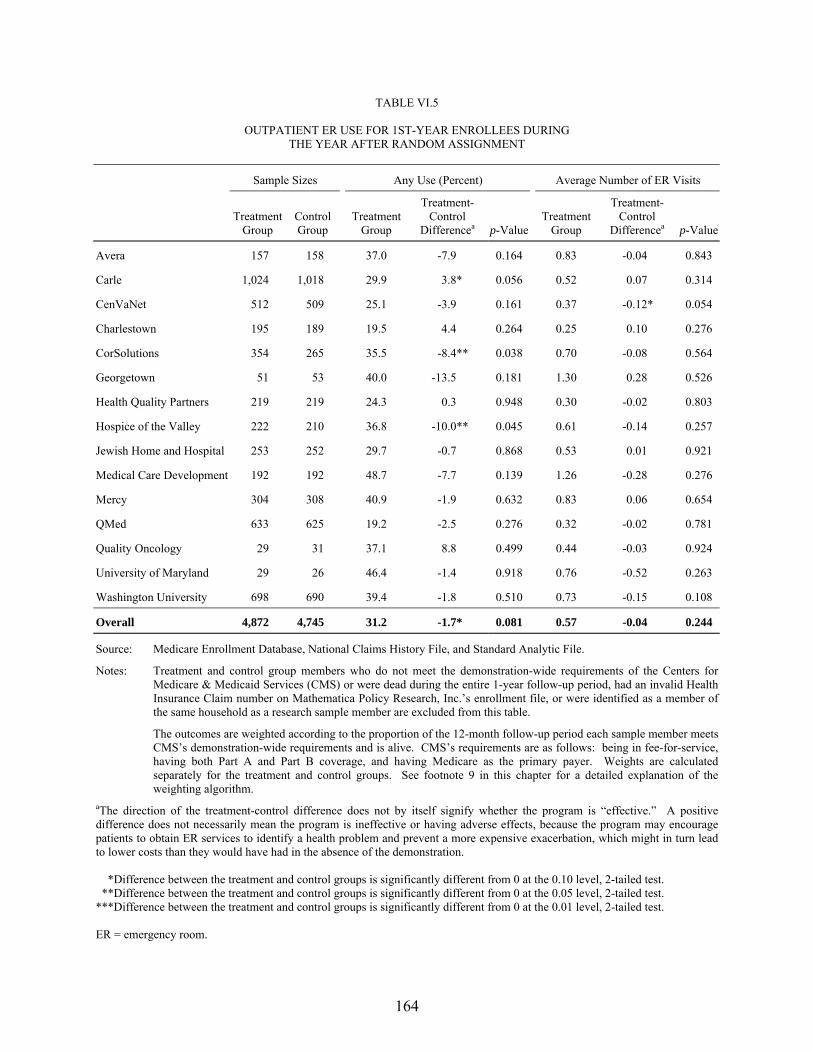
164
TABLE VI.5
OUTPATIENT ER USE FOR 1ST-YEAR ENROLLEES DURING THE YEAR AFTER RANDOM ASSIGNMENT
Sample Sizes Any Use (Percent) Average Number of ER Visits
Treatment
Group Control Group
Treatment Group
Treatment-Control
Differencea p-ValueTreatment
Group
Treatment-Control
Differencea p-Value
Avera 157 158 37.0 -7.9 0.164 0.83 -0.04 0.843
Carle 1,024 1,018 29.9 3.8* 0.056 0.52 0.07 0.314
CenVaNet 512 509 25.1 -3.9 0.161 0.37 -0.12* 0.054
Charlestown 195 189 19.5 4.4 0.264 0.25 0.10 0.276
CorSolutions 354 265 35.5 -8.4** 0.038 0.70 -0.08 0.564
Georgetown 51 53 40.0 -13.5 0.181 1.30 0.28 0.526
Health Quality Partners 219 219 24.3 0.3 0.948 0.30 -0.02 0.803
Hospice of the Valley 222 210 36.8 -10.0** 0.045 0.61 -0.14 0.257
Jewish Home and Hospital 253 252 29.7 -0.7 0.868 0.53 0.01 0.921
Medical Care Development 192 192 48.7 -7.7 0.139 1.26 -0.28 0.276
Mercy 304 308 40.9 -1.9 0.632 0.83 0.06 0.654
QMed 633 625 19.2 -2.5 0.276 0.32 -0.02 0.781
Quality Oncology 29 31 37.1 8.8 0.499 0.44 -0.03 0.924
University of Maryland 29 26 46.4 -1.4 0.918 0.76 -0.52 0.263
Washington University 698 690 39.4 -1.8 0.510 0.73 -0.15 0.108
Overall 4,872 4,745 31.2 -1.7* 0.081 0.57 -0.04 0.244
Source: Medicare Enrollment Database, National Claims History File, and Standard Analytic File.
Notes: Treatment and control group members who do not meet the demonstration-wide requirements of the Centers for Medicare & Medicaid Services (CMS) or were dead during the entire 1-year follow-up period, had an invalid Health Insurance Claim number on Mathematica Policy Research, Inc.�s enrollment file, or were identified as a member of the same household as a research sample member are excluded from this table.
The outcomes are weighted according to the proportion of the 12-month follow-up period each sample member meets CMS�s demonstration-wide requirements and is alive. CMS�s requirements are as follows: being in fee-for-service, having both Part A and Part B coverage, and having Medicare as the primary payer. Weights are calculated separately for the treatment and control groups. See footnote 9 in this chapter for a detailed explanation of the weighting algorithm.
aThe direction of the treatment-control difference does not by itself signify whether the program is �effective.� A positive difference does not necessarily mean the program is ineffective or having adverse effects, because the program may encourage patients to obtain ER services to identify a health problem and prevent a more expensive exacerbation, which might in turn lead to lower costs than they would have had in the absence of the demonstration. *Difference between the treatment and control groups is significantly different from 0 at the 0.10 level, 2-tailed test. **Difference between the treatment and control groups is significantly different from 0 at the 0.05 level, 2-tailed test. ***Difference between the treatment and control groups is significantly different from 0 at the 0.01 level, 2-tailed test. ER = emergency room.
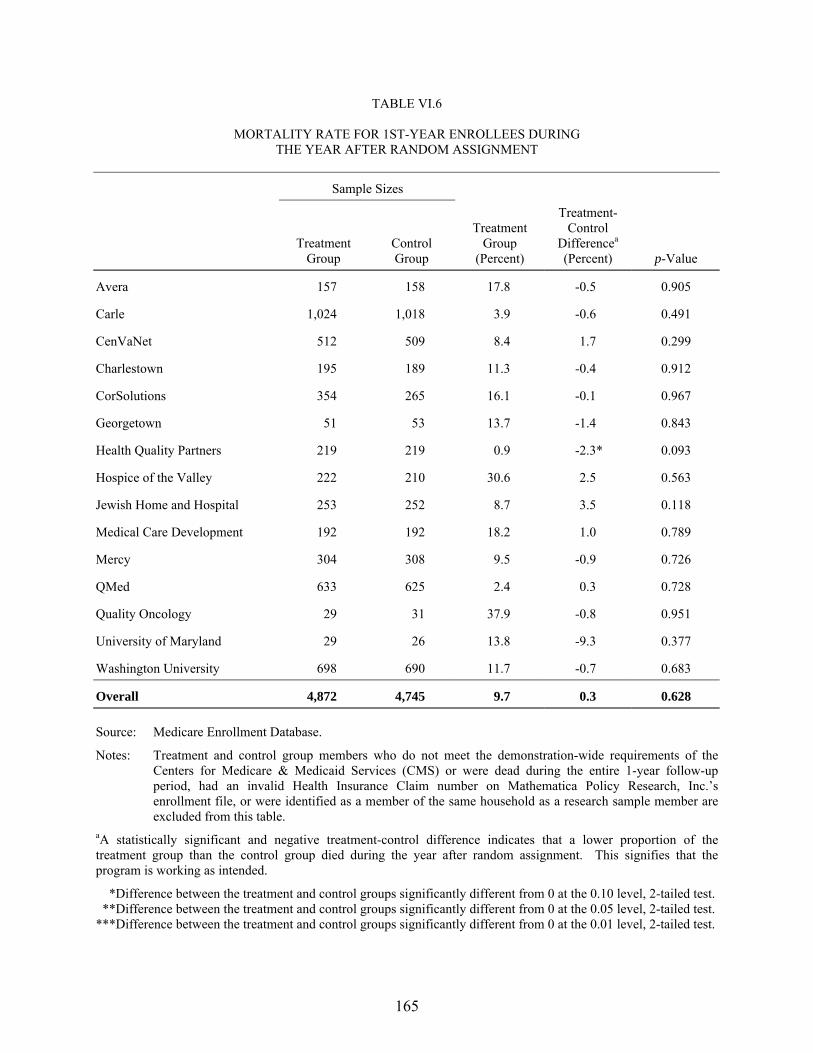
165
TABLE VI.6
MORTALITY RATE FOR 1ST-YEAR ENROLLEES DURING THE YEAR AFTER RANDOM ASSIGNMENT
Sample Sizes
Treatment Group
Control Group
Treatment Group
(Percent)
Treatment-Control
Differencea (Percent) p-Value
Avera 157 158 17.8 -0.5 0.905
Carle 1,024 1,018 3.9 -0.6 0.491
CenVaNet 512 509 8.4 1.7 0.299
Charlestown 195 189 11.3 -0.4 0.912
CorSolutions 354 265 16.1 -0.1 0.967
Georgetown 51 53 13.7 -1.4 0.843
Health Quality Partners 219 219 0.9 -2.3* 0.093
Hospice of the Valley 222 210 30.6 2.5 0.563
Jewish Home and Hospital 253 252 8.7 3.5 0.118
Medical Care Development 192 192 18.2 1.0 0.789
Mercy 304 308 9.5 -0.9 0.726
QMed 633 625 2.4 0.3 0.728
Quality Oncology 29 31 37.9 -0.8 0.951
University of Maryland 29 26 13.8 -9.3 0.377
Washington University 698 690 11.7 -0.7 0.683
Overall 4,872 4,745 9.7 0.3 0.628
Source: Medicare Enrollment Database.
Notes: Treatment and control group members who do not meet the demonstration-wide requirements of the Centers for Medicare & Medicaid Services (CMS) or were dead during the entire 1-year follow-up period, had an invalid Health Insurance Claim number on Mathematica Policy Research, Inc.�s enrollment file, or were identified as a member of the same household as a research sample member are excluded from this table.
aA statistically significant and negative treatment-control difference indicates that a lower proportion of the treatment group than the control group died during the year after random assignment. This signifies that the program is working as intended.
*Difference between the treatment and control groups significantly different from 0 at the 0.10 level, 2-tailed test. **Difference between the treatment and control groups significantly different from 0 at the 0.05 level, 2-tailed test. ***Difference between the treatment and control groups significantly different from 0 at the 0.01 level, 2-tailed test.
166
With two exceptions, the treatment groups� Medicare expenditures, excluding care
coordination fees, were statistically comparable to those of the control groups over both the first
25 months of program operations (Table VI.2) and the first year after the randomization month
(Table VI.7). The only program that had a statistically significant treatment-control difference in
expenditures (excluding care coordination fees) was Charlestown, where Medicare expenditures
for the treatment group were actually higher. After regression adjustment, the average monthly
Medicare expenditures for Charlestown�s treatment group were $393, or 40 percent, more than
the expenditures for the control group over the year after the randomization month (p = 0.044)
and $212, or 21 percent, higher per month over the first 25 months of program operations
(p = 0.058). The other exception to the pattern of no differences was Mercy, whose treatment
group used fewer inpatient hospital services. Mercy�s treatment group had 13 percent ($154)
lower monthly Medicare expenditures over the first 25 calendar months, and the p-value (0.105)
was very close to the 10-percent significance level. This result is promising, but the difference is
not enough to offset Mercy�s care coordination fees of $245 per month over this time period.
While not statistically significant, the treatment groups served by Georgetown University and
QMed each had expenditures 12 percent lower than those of their control groups. The treatment
groups in three other programs had expenditures 8, 6, and 5 percent lower over the first
25 months. (These were not statistically significant.)
Across the 15 programs, monthly Medicare expenditures were 2 percent lower (p = 0.368)
during the year after randomization, and 1 percent lower (p = 0.724) over the 25-month period�
not enough to offset care coordination fees during either period. This does not rule out the
possibility that larger savings will accrue with a longer followup.

167
TABLE VI.7
MEDICARE EXPENDITURES FOR 1ST-YEAR ENROLLEES DURING THE YEAR AFTER RANDOM ASSIGNMENT
(Regression Adjusted)
Sample Sizes
Average Medicare Expenditures per Month in Fee-for-Service (Part A and Part B Combined)a
Treatment
Group Control Group
Treatment Group
Control Group
Treatment- Control
Difference Percent Change p-Value
Avera 157 158 $1,299 $1,522 -$223 -15 0.264
Carle 1,024 1,018 $646 $692 -$45 -7 0.384
CenVaNet 512 509 $905 $800 $105 13 0.218
Charlestown 195 189 $1,387 $993 $393** 40 0.044
CorSolutions 354 265 $2,465 $2,912 -$447 -15 0.219
Georgetown 51 53 $2,184 $2,141 $44 2 0.939
Health Quality Partners 219 219 $554 $504 $50 10 0.611
Hospice of the Valley 222 210 $2,181 $2,026 $154 8 0.555
Jewish Home and Hospital 253 252 $1,756 $1,686 $70 4 0.811
Medical Care Development 192 192 $1,620 $1,789 -$169 -9 0.597
Mercy 304 308 $1,090 $1,099 -$8 -1 0.946
QMed 633 625 $588 $640 -$52 -8 0.621
Quality Oncology 29 31 $4,333 $4,709 -$376 -8 0.714
University of Maryland 29 26 $3,029 $2,767 $262 9 0.829
Washington University 698 690 $2,019 $1,940 $78 4 0.607
Overall 4,872 4,745 $1,246 $1,262 -$16 -1 0.724
Source: Medicare Enrollment Database, National Claims History File, and Standard Analytic File. Notes: Treatment and control group members who do not meet the demonstration-wide requirements of the Centers for
Medicare & Medicaid Services (CMS) or were dead during the entire 1-year follow-up period, had an invalid Health Insurance Claim number on Mathematica Policy Research, Inc.�s enrollment file, or were identified as a member of the same household as a research sample member are excluded from this table.
The outcomes are weighted according to the proportion of the 12-month follow-up period each sample member meets CMS�s demonstration-wide requirements and is alive. CMS�s requirements are as follows: being in fee-for-service, having both Part A and Part B coverage, and having Medicare as the primary payer. Weights are calculated separately for the treatment and control groups. See footnote 9 in this chapter for a detailed explanation of the weighting algorithm.
aA statistically significant and negative treatment-control difference and percent change value indicate that expenditures were lower for the treatment than control group. This signifies that the program is working as intended. *Difference between the treatment and control groups significantly different from 0 at the 0.10 level, 2-tailed test. **Difference between the treatment and control groups significantly different from 0 at the 0.05 level, 2-tailed test. ***Difference between the treatment and control groups significantly different from 0 at the 0.01 level, 2-tailed test.
168
B. COST NEUTRALITY
Interpreting the results on program effects on Medicare expenditures is complicated,
because it may not be possible to reject either of two hypotheses that have diametrically opposed
implications for the program. The first hypothesis is that the program had no effect on Part A
and Part B expenditures (without considering the program fees). Because the sample sizes are
relatively small and the variance of expenditures is large, the estimate of program effects on
Part A and B expenditures has a relatively large confidence interval around it. In other words,
the true effect may range around the particular estimate generated by this sample. As a result,
the hypothesis that the treatment-control difference in total Medicare expenditures on traditional
Part A and Part B services is different from zero�that the program reduced or increased Part A
and B expenditures�is likely to be rejected unless the observed difference is reasonably large
(discussed above). This provides an appropriately conservative test of program impacts.
To be cost neutral, programs must not only reduce Medicare expenditures, but reduce them
by enough to offset program fees. Statistically, this second hypothesis is assessed by testing
whether the estimated treatment-control difference is significantly different from the average
care coordination fee paid per month to the program (or equivalently, whether the combined total
of Part A and B expenditures and program fees are different for the treatment and control
groups). Because the variances are large, it may not be possible to reject this hypothesis either�
that is, the confidence interval around the estimated treatment-control difference in Part A and B
expenditures encompasses both zero and the average fee paid per month. It is therefore possible
to fail to reject the first hypothesis, acknowledging that the program did not reduce Medicare
expenditures for traditional services, and also fail to reject the second, that is, to conclude that
the program may have been cost neutral, despite not clearly reducing Part A and B expenditures.
169
The problem is particularly acute for programs with few enrollees, because the variances of the
estimates for these programs are markedly larger.
This ambiguity, while confusing, properly represents the uncertainty about the results. The
most conservative approach would be simply to conclude that, unless the treatment-control
difference in traditional Medicare expenditures was significantly different from zero, there would
be no need even to test whether it was significantly larger than or equal to the fee. However, that
approach could lead to an erroneous conclusion, especially in those programs for which the fee
received is small in comparison to the control group mean for Medicare expenditures.
One partial solution, implemented below, is to test whether the total Medicare cost
difference between the treatment and control groups, including the care coordination fees, is
significantly different from zero at a 20-percent significance level instead of the more traditional
5- or 10-percent level. This approach increases the statistical power of the analysis (that is, it
increases the likelihood of concluding the program increased or decreased costs when it really
had no effect).10 However, this approach helps only marginally, because the differences to be
detected are small. For example, Quality Oncology�s monthly program fee was only 2 percent of
the large control group mean of $4,178 per month for traditional Medicare services. If the
program had actually reduced Part A and B expenditures by 2 percent, detecting with 80-percent
power a difference this small in total payments including the program fee would require a huge
sample size (nearly 70,000 patients in each group), far greater than the very small sample that
this or any other program has.
10 By accepting a higher-than-usual probability (20 percent) of falsely concluding there is a positive or negative effect when there really is no effect (the program is cost neutral), it is more likely than it would have been to properly reject the hypothesis of cost neutrality when it is false. Thus, this is a more conservative approach for assessing whether the program is cost neutral. Whereas the conservative approach to examining savings on Part A and B costs is to have a low probability of concluding there are savings when in fact there are not, for assessing cost neutrality, the conservative approach is to have a low probability of rejecting the null hypothesis of cost neutrality when in fact there are net cost increases.
170
Only four programs have received fees that exceed 20 percent of the control group mean,
and these are the only ones for which there is at least 70-percent power to detect a difference in
Medicare expenditures large enough to cover the cost of the fees (Table VI.8). For seven of the
other programs, the power is less than 50 percent. That is, failure to reject the hypothesis of cost
neutrality when it is false is more likely than not. Clearly, it would be inappropriate to conclude
on such weak evidence that a program is cost neutral. Conversely, holding the programs to the
rigorous standard of having to demonstrate statistically significant savings means running a
sizable risk of failing to detect true impacts large enough to cover the cost of the intervention.
Given this uncertainty, to determine whether program effects appear to be large enough to
cover the cost of the fees, the evaluation relies instead on a combination of findings about Part A
and B expenditures, total expenditures including program fees, and effects on hospitalizations.
While effects on hospitalizations are not necessary for generating the small impacts needed to
cover the cost of the fees for most of the programs, reductions in hospital use would be the most
likely place where programs could generate Medicare savings. The results for all three outcomes
are regression adjusted to account for any chance differences in preenrollment characteristics of
the two research groups.
Two examples illustrate how the evaluation determines whether a program is likely to be
cost neutral. During the year after random assignment, among all 15 programs, the treatment
group�s expenditures (excluding care coordination fees) are $16 per month lower than the control
group�s, but the 90-percent confidence interval indicates that, if this were the true effect of the
program, the treatment-control difference in any given sample of this size could be expected to
fall somewhere between a reduction of $93 and an increase of $60 per month. Because the
confidence interval includes $0, the hypothesis of no effect on expenditures cannot be rejected.
In other words, the programs may not have reduced Medicare expenditures relative to what they

171
TABLE VI.8
PRECISION OF ESTIMATES OF PROGRAM EFFECTS ON MEDICARE EXPENDITURES (2-Year Sample)
Sample Sizes
Treatment Group
Control Group
Power to Detect
20 Percent Effect on
Cost
Average Fee Received per
Month in Evaluation
Sample
Average Control
Group Cost
Percent Savings
Needed to Cover Fee
Power to Detect Impact
Needed to Cover Fee
Avera 292 291 0.63 $271 $1,470 18 0.58
Carle 1,178 1,161 0.97 $152 $699 22 0.99
CenVaNet 616 611 0.85 $72 $1,004 7 0.33
Charlestown 370 369 0.70 $233 $847 28 0.89
CorSolutions 1,159 869 0.95 $315 $2,700 12 0.67
Georgetown 95 95 0.36 $296 $2,358 13 0.24
Health Quality Partners 499 493 0.79 $105 $2,061 5 0.23
Hospice of the Valley 370 358 0.70 $190 $608 31 0.94
Jewish Home and Hospital 352 347 0.68 $260 $1,815 14 0.49
Medical Care Development 411 407 0.73 $180 $1,569 11 0.43
Mercy 420 422 0.74 $250 $1,193 21 0.77
QMed 651 642 0.87 $88 $686 13 0.60
Quality Oncology 65 63 0.30 $81 $4,280 2 0.11
University of Maryland 66 59 0.30 $321 $3,178 10 0.18
Washington University 968 964 0.95 $166 $1,893 9 0.50
Overall 7,512 7,151 1.00 $196 $1,314 15 1.00
Source: Medicare Enrollment Database, National Claims History File, and Standard Analytic File. *Difference between the treatment and control groups significantly different from 0 at the 0.10 level, 2-tailed test. **Difference between the treatment and control groups significantly different from 0 at the 0.05 level, 2-tailed test. ***Difference between the treatment and control groups significantly different from 0 at the 0.01 level, 2-tailed test.
172
would have been, absent the demonstration. In this case, even the most optimistic estimate of a
reduction of Part A and B expenditures of $93 (the lower end of the confidence interval) is not
enough to offset the average monthly care coordination fee of $196. As a result, the evaluation
definitively demonstrates that the overall demonstration was not cost neutral during this period.
QMed, in contrast, is an example of an ambiguous case where the program might be cost
neutral. The estimate of the monthly treatment-control difference in Part A and B expenditures
is -$52, and the 90-percent confidence interval ranges from -$227 to $122. Because this interval
encompasses $0, the evaluation cannot reject the hypothesis of no effect on Part A and B
expenditures. Despite being unable to conclude that the program reduces Part A and B
expenditures, the evaluation also cannot reject the possibility that the program is cost neutral,
because the change in Part A and B expenditures (-$96) needed to cover the program�s average
monthly fee also falls within this interval.
1. Tests of Cost Neutrality for the Year Following Enrollment in the Study
Over the first year after the randomization month, the demonstration as a whole was not cost
neutral. Total expenditures, including program fees, were $157 (about 12 percent higher) for the
treatment than the control groups (p = 0.001). This result reflects the finding that, overall, the
treatment group�s Part A and B expenditures were virtually identical to the control group�s.
Up to five of the programs may be cost neutral over the first year after randomization, but
because of the large variation in the measures of cost and, in some cases, small samples, this
evidence is weak. The treatment-control differences in total Medicare expenditures, including
program fees, for 7 of the 15 programs are significantly greater than 0 at a 20-percent
significance level (see Table VI.9, top panel)�that is, these seven programs are clearly not cost
neutral during this period. Each program significantly increases average expenditures by
$109 to $631 per month. These estimates are fairly imprecise, given the sample size and sizable
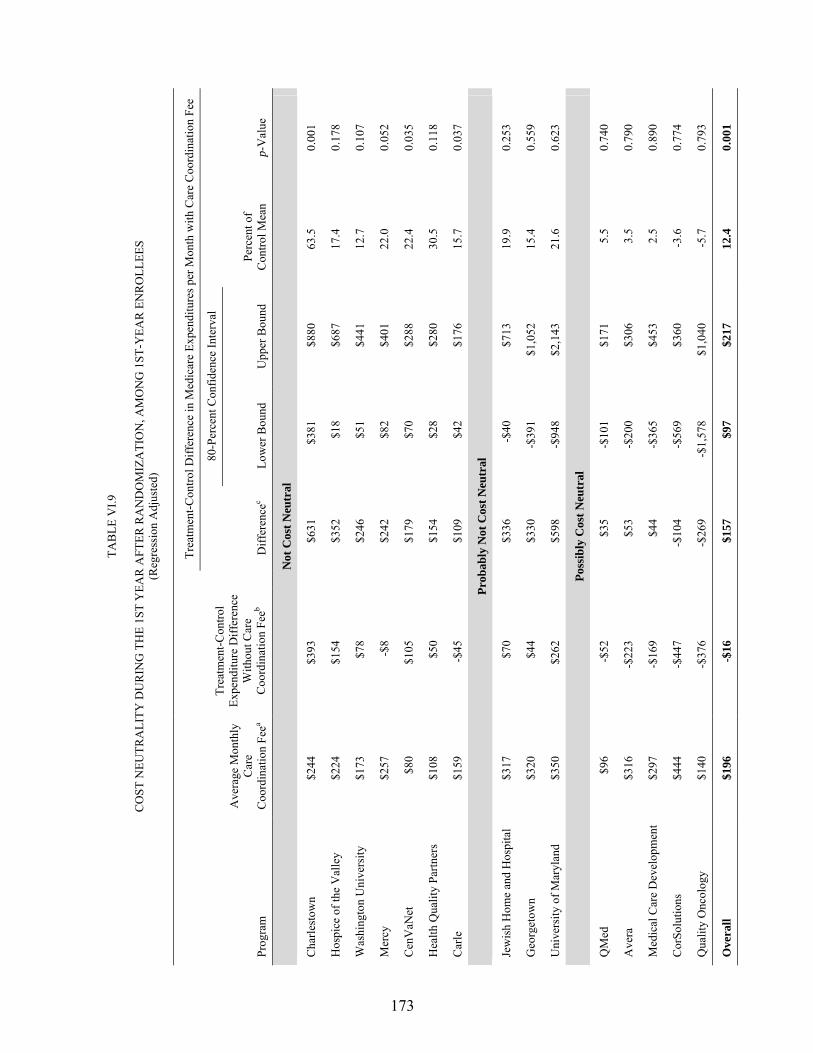
173
TAB
LE V
I.9
C
OST
NEU
TRA
LITY
DU
RIN
G T
HE
1ST
YEA
R A
FTER
RA
ND
OM
IZA
TIO
N, A
MO
NG
1ST
-YEA
R E
NR
OLL
EES
(Reg
ress
ion
Adj
uste
d)
Tr
eatm
ent-C
ontro
l Diff
eren
ce in
Med
icar
e Ex
pend
iture
s per
Mon
th w
ith C
are
Coo
rdin
atio
n Fe
e
80-P
erce
nt C
onfid
ence
Inte
rval
Prog
ram
Ave
rage
Mon
thly
C
are
Coo
rdin
atio
n Fe
ea
Trea
tmen
t-Con
trol
Expe
nditu
re D
iffer
ence
W
ithou
t Car
e C
oord
inat
ion
Feeb
Diff
eren
cec
Low
er B
ound
U
pper
Bou
nd
Perc
ent o
f C
ontro
l Mea
n p-
Val
ue
Not
Cos
t Neu
tral
Cha
rlest
own
$244
$3
93
$6
31
$381
$8
80
63.5
0.
001
Hos
pice
of t
he V
alle
y $2
24
$154
$352
$1
8 $6
87
17.4
0.
178
Was
hing
ton
Uni
vers
ity
$173
$7
8
$246
$5
1 $4
41
12.7
0.
107
Mer
cy
$257
-$
8
$242
$8
2 $4
01
22.0
0.
052
Cen
VaN
et
$80
$105
$179
$7
0 $2
88
22.4
0.
035
Hea
lth Q
ualit
y Pa
rtner
s $1
08
$50
$1
54
$28
$280
30
.5
0.11
8
Car
le
$159
-$
45
$1
09
$42
$176
15
.7
0.03
7
Prob
ably
Not
Cos
t Neu
tral
Jew
ish
Hom
e an
d H
ospi
tal
$317
$7
0
$336
-$
40
$713
19
.9
0.25
3
Geo
rget
own
$320
$4
4
$330
-$
391
$1,0
52
15.4
0.
559
Uni
vers
ity o
f Mar
ylan
d $3
50
$262
$598
-$
948
$2,1
43
21.6
0.
623
Poss
ibly
Cos
t Neu
tral
QM
ed
$96
-$
52
$3
5 -$
101
$171
5.
5 0.
740
Ave
ra
$316
-$
223
$5
3 -$
200
$306
3.
5 0.
790
Med
ical
Car
e D
evel
opm
ent
$297
-$
169
$4
4 -$
365
$453
2.
5 0.
890
Cor
Solu
tions
$4
44
-$44
7
-$10
4 -$
569
$360
-3
.6
0.77
4
Qua
lity
Onc
olog
y $1
40
-$37
6
-$26
9 -$
1,57
8 $1
,040
-5
.7
0.79
3
Ove
rall
$196
-$
16
$1
57
$97
$217
12
.4
0.00
1

TAB
LE V
I.9 (c
ontin
ued)
__
____
____
____
____
____
____
____
____
____
____
____
____
____
____
____
____
____
____
____
____
____
____
____
____
____
____
____
____
____
____
____
____
____
____
____
__
174
Sour
ce:
Med
icar
e En
rollm
ent D
atab
ase,
Nat
iona
l Cla
ims H
isto
ry F
ile, a
nd S
tand
ard
Ana
lytic
File
. a N
ote
that
the
amou
nt p
rese
nted
her
e fo
r 12
pro
gram
s is
the
appr
oved
1st
-yea
r ra
te f
or m
onth
s ex
clud
ing
the
1st m
onth
. R
ates
wer
e ch
ange
d sl
ight
ly f
or A
vera
, Geo
rget
own
Uni
vers
ity, M
ercy
, and
Med
ical
Car
e D
evel
opm
ent o
n A
pril
1, 2
003.
In
3 pr
ogra
ms (
Cor
Solu
tions
, Hea
lth Q
ualit
y Pa
rtner
s, an
d Je
wis
h H
ome
and
Hos
pita
l), th
e am
ount
pre
sent
ed
is a
ble
nded
rat
e th
at a
vera
ges
the
actu
al n
onze
ro p
aym
ents
, bec
ause
the
prog
ram
s ch
arge
d di
ffer
ent f
ees
for
patie
nts
depe
ndin
g on
the
seve
rity
of th
eir
cond
ition
or
thei
r tim
e en
rolle
d.
Cor
Solu
tions
was
app
rove
d to
cha
rge
$437
for
the
firs
t 9
mon
ths,
$287
for
sub
sequ
ent
mon
ths
until
pat
ient
s ar
e de
sign
ated
as
bein
g in
mai
nten
ance
, and
$18
7 in
m
aint
enan
ce.
They
als
o ch
arge
$36
6 pe
r mon
th fo
r pat
ient
s w
ho re
ceiv
e pr
escr
iptio
n dr
ug c
over
age.
Hea
lth Q
ualit
y Pa
rtner
s ch
arge
s $1
30, $
110,
or $
50, a
nd J
ewis
h H
ome
and
Hos
pita
l $3
79, $
259,
or
$74,
bas
ed o
n ea
ch p
atie
nt�s
acu
ity l
evel
. Th
e am
ount
pai
d to
eac
h of
the
15
prog
ram
s as
rec
orde
d in
the
Med
icar
e cl
aim
s da
ta a
nd t
he p
rogr
ams�
ap
prov
ed p
er m
embe
r per
mon
th d
iffer
as
a re
sult
of p
aym
ent a
djus
tmen
ts fo
r pat
ient
s w
ho d
isen
rolle
d fr
om th
e pr
ogra
ms
but r
emai
n in
the
rese
arch
sam
ple,
as
wel
l as
any
billi
ng
erro
rs.
b A s
tatis
tical
ly s
igni
fican
t and
neg
ativ
e tre
atm
ent-c
ontro
l diff
eren
ce w
ould
indi
cate
that
exp
endi
ture
s w
ere
low
er fo
r the
trea
tmen
t tha
n co
ntro
l gro
up.
This
wou
ld s
igni
fy th
at th
e pr
ogra
m is
wor
king
as i
nten
ded.
c A
stat
istic
ally
sign
ifica
nt a
nd p
ositi
ve tr
eatm
ent-c
ontro
l diff
eren
ce in
dica
tes t
hat e
xpen
ditu
res i
nclu
ding
the
care
coo
rdin
atio
n fe
e w
ere
high
er fo
r the
trea
tmen
t tha
n co
ntro
l gro
up.
This
sig
nifie
s th
at th
e pr
ogra
m is
incr
easi
ng to
tal c
osts
and
is th
eref
ore
not c
ost n
eutra
l. W
hen
the
diff
eren
ce is
not
sta
tistic
ally
sig
nific
ant,
it is
pos
sibl
e th
at th
e pr
ogra
m is
cos
t ne
utra
l. In
thos
e ca
ses,
info
rmat
ion
abou
t the
pro
gram
�s e
ffec
ts o
n ho
spita
lizat
ions
was
als
o co
nsid
ered
whe
n cl
assi
fyin
g th
e pr
ogra
m a
s �Pr
obab
ly N
ot C
ost N
eutra
l� o
r �Po
ssib
ly
Cos
t Neu
tral.�
175
variations in costs. The 80-percent confidence intervals illustrate the range within which the true
effect is expected to fall. For example, while the net monthly costs in Mercy are $242 higher for
the treatment group than for the control group, it can be stated with 80-percent confidence that
the true effect of the program on total Medicare expenditures lies somewhere between $82
and $401.
Three other programs are highly unlikely to be cost neutral, even though the treatment-
control differences in total expenditures were not significantly different from zero (p-values were
greater than 0.200), for two reasons. First, a program would probably not be cost neutral unless
the treatment group had fewer hospitalizations than the control group. The treatment groups in
Jewish Home and Hospital, Georgetown University, and the University of Maryland all
experienced more hospitalizations than the control groups during this period (Table VI.1), which
makes it unlikely that the programs were reducing Medicare expenditures enough to offset their
program fees. Second, small sample sizes and large variations in Medicare expenditures limit
the power to detect the size of the differences the programs are generating. This makes it
especially difficult to reject the hypothesis that the effect is statistically different from 0 in
Georgetown and the University of Maryland, whose sample sizes of 104 and 55, respectively,
were very small.
Among the remaining five programs that may have been cost neutral, the findings from
different analyses suggest that only three are really likely to have been cost neutral during the
year after the randomization month. The treatment group in Medical Care Development
experienced only slightly fewer hospitalizations on average (2 percent), and this difference was
not statistically significant; even if it were, a program effect would be unlikely to generate
enough savings to offset the program fee. Avera�s treatment group had 5-percent more
hospitalizations than the control group. Thus, it is unlikely that these two programs generated
176
enough savings in Part A and B expenditures to offset their fees. However, the evidence
suggests that the three other programs (QMed, CorSolutions, and Quality Oncology) may be cost
neutral, as they are the only ones for which the treatment group had lower Medicare expenditures
than the control group (8, 15, and 8 percent, respectively). (The treatment groups also had 4-, 9-,
and 33-percent fewer hospitalizations, respectively, than the control groups.) However, the
hypothesis that the savings in Part A and B expenditures are zero also cannot be rejected, so
these results must be interpreted cautiously.
2. Tests of Cost Neutrality Over the 25 Months Since Program Startup
The results for the first 25 months after startup for all programs combined are similar to
those for enrollees� first 12 months after enrollment, but their pattern across programs is
somewhat different from that of the 12-month followup (Table VI.10). Overall, total Medicare
expenditures, including program fees, are $144, or 11 percent, higher per month for the treatment
than for the control groups (p < 0.001), about the same as the difference estimated above for the
year after enrollment.
During the 25 months since startup, six programs are definitely not cost neutral, four might
be but are probably not, and five might be cost neutral. Five of the seven programs that were
not cost neutral in the 1-year results are also definitely not cost neutral during the 25 months
since startup (see top panel of Table VI.10 and Figure VI.1). In addition, Avera definitively
moves into this category.
Four programs are probably not cost neutral (middle panel of Table VI.10). CorSolutions
had the largest treatment-control difference in Medicare Part A and B expenditures (without
program fees) of -$206 (not significant). While this is larger than the treatment-control
difference in all but 1 of the 14 other programs, it is too small to offset its large monthly fee
(which averaged $444). In addition, CorSolutions�s treatment group had only about 5 percent

177
TAB
LE V
I.10
C
OST
NEU
TRA
LITY
DU
RIN
G T
HE
1ST
25 C
ALE
ND
AR
MO
NTH
S O
F PR
OG
RA
M O
PER
ATI
ON
S (R
egre
ssio
n A
djus
ted)
Trea
tmen
t-Con
trol D
iffer
ence
in M
edic
are
Expe
nditu
res p
er M
onth
with
Car
e C
oord
inat
ion
Fee
80
-Per
cent
Con
fiden
ce In
terv
al
Prog
ram
Ave
rage
Mon
thly
C
are
C
oord
inat
ion
Feea
Trea
tmen
t-Con
trol
Expe
nditu
re D
iffer
ence
W
ithou
t Car
e
Coo
rdin
atio
n Fe
eb D
iffer
ence
c Lo
wer
Bou
nd
Upp
er B
ound
Pe
rcen
t of
Con
trol M
ean
p-V
alue
Not
Cos
t Neu
tral
Cha
rlest
own
$244
$2
12
$445
$3
03
$588
44
.4
0.00
0
Was
hing
ton
Uni
vers
ity
$173
$6
8 $2
34
$84
$383
12
.3
0.04
5
Ave
ra
$316
-$
70
$201
$1
1 $3
91
13.7
0.
175
Car
le
$159
-$
7 $1
45
$90
$199
20
.7
0.00
1
Cen
VaN
et
$80
$48
$120
$3
4 $2
07
14.2
0.
076
Hea
lth Q
ualit
y Pa
rtner
s $1
08
$1
$106
$5
$2
06
17.4
0.
179
Prob
ably
Not
Cos
t Neu
tral
Uni
vers
ity o
f Mar
ylan
d $3
50
$0
$321
-$
692
$1,3
34
10.1
0.
685
Jew
ish
Hom
e an
d H
ospi
tal
$317
-$
108
$152
-$
116
$420
8.
4 0.
468
Med
ical
Car
e D
evel
opm
ent
$297
-$
39
$141
-$
76
$359
9.
0 0.
406
Cor
Solu
tions
$4
44
-$20
6 $1
09
-$11
0 $3
28
4.0
0.52
5
Poss
ibly
Cos
t Neu
tral
QM
ed
$96
-$80
$8
-$
102
$118
1.
2 0.
924
Mer
cy
$257
-$
154
$96
-$26
$2
17
8.0
0.31
2
Hos
pice
of t
he V
alle
y $2
24
-$2
$188
-$
35
$412
9.
1 0.
280
Geo
rget
own
$320
-$
276
$20
-$54
6 $5
87
0.9
0.96
3
Qua
lity
Onc
olog
y $1
40
-$10
1 -$
20
-$89
4 $8
54
-0.5
0.
976
Ove
rall
$196
-$
31
$144
$9
9 $1
88
11.3
0.
000

TAB
LE V
I.10
(con
tinue
d)
____
____
____
____
____
____
____
____
____
____
____
____
____
____
____
____
____
____
____
____
____
____
____
____
____
____
____
____
____
____
____
____
____
____
____
____
178
Sour
ce:
Med
icar
e En
rollm
ent D
atab
ase,
Nat
iona
l Cla
ims H
isto
ry F
ile, a
nd S
tand
ard
Ana
lytic
File
. a N
ote
that
the
amou
nt p
rese
nted
her
e fo
r 12
pro
gram
s is
the
appr
oved
1st
-yea
r ra
te f
or m
onth
s ex
clud
ing
the
1st m
onth
. R
ates
wer
e ch
ange
d sl
ight
ly f
or A
vera
, Geo
rget
own
Uni
vers
ity, M
ercy
, and
Med
ical
Car
e D
evel
opm
ent o
n A
pril
1, 2
003.
In
3 pr
ogra
ms (
Cor
Solu
tions
, Hea
lth Q
ualit
y Pa
rtner
s, an
d Je
wis
h H
ome
and
Hos
pita
l), th
e am
ount
pre
sent
ed
is a
ble
nded
rat
e th
at a
vera
ges
the
actu
al n
onze
ro p
aym
ents
, bec
ause
the
prog
ram
s ch
arge
d di
ffer
ent f
ees
for
patie
nts
depe
ndin
g on
the
seve
rity
of th
eir
cond
ition
or
thei
r tim
e en
rolle
d.
Cor
Solu
tions
was
app
rove
d to
cha
rge
$437
for
the
firs
t 9
mon
ths,
$287
for
sub
sequ
ent
mon
ths
until
pat
ient
s ar
e de
sign
ated
as
bein
g in
mai
nten
ance
, and
$18
7 in
m
aint
enan
ce.
They
als
o ch
arge
$36
6 pe
r mon
th fo
r pat
ient
s w
ho re
ceiv
e pr
escr
iptio
n dr
ug c
over
age.
Hea
lth Q
ualit
y Pa
rtner
s ch
arge
s $1
30, $
110,
or $
50, a
nd J
ewis
h H
ome
and
Hos
pita
l $3
79, $
259,
or
$74,
bas
ed o
n ea
ch p
atie
nt�s
acu
ity l
evel
. Th
e am
ount
pai
d to
eac
h of
the
15
prog
ram
s as
rec
orde
d in
the
Med
icar
e cl
aim
s da
ta a
nd t
he p
rogr
ams�
ap
prov
ed p
er m
embe
r per
mon
th d
iffer
as
a re
sult
of p
aym
ent a
djus
tmen
ts fo
r pat
ient
s w
ho d
isen
rolle
d fr
om th
e pr
ogra
ms
but r
emai
n in
the
rese
arch
sam
ple,
as
wel
l as
any
billi
ng
erro
rs.
b A s
tatis
tical
ly s
igni
fican
t and
neg
ativ
e tre
atm
ent-c
ontro
l diff
eren
ce w
ould
indi
cate
that
exp
endi
ture
s w
ere
low
er fo
r the
trea
tmen
t tha
n co
ntro
l gro
up.
This
wou
ld s
igni
fy th
at th
e pr
ogra
m is
wor
king
as i
nten
ded.
c A
stat
istic
ally
sign
ifica
nt a
nd p
ositi
ve tr
eatm
ent-c
ontro
l diff
eren
ce in
dica
tes t
hat e
xpen
ditu
res i
nclu
ding
the
care
coo
rdin
atio
n fe
e w
ere
high
er fo
r the
trea
tmen
t tha
n co
ntro
l gro
up.
This
sig
nifie
s th
at th
e pr
ogra
m is
incr
easi
ng to
tal c
osts
and
is th
eref
ore
not c
ost n
eutra
l. W
hen
the
diff
eren
ce is
not
sta
tistic
ally
sig
nific
ant,
and
is e
ither
pos
itive
or n
egat
ive,
it is
po
ssib
le t
hat
the
prog
ram
is
cost
neu
tral.
In
thos
e ca
ses,
info
rmat
ion
abou
t th
e pr
ogra
m�s
eff
ects
on
hosp
italiz
atio
ns w
as a
lso
cons
ider
ed w
hen
clas
sify
ing
the
prog
ram
as
�Pro
babl
y N
ot C
ost N
eutra
l� o
r �Po
ssib
ly C
ost N
eutra
l.�
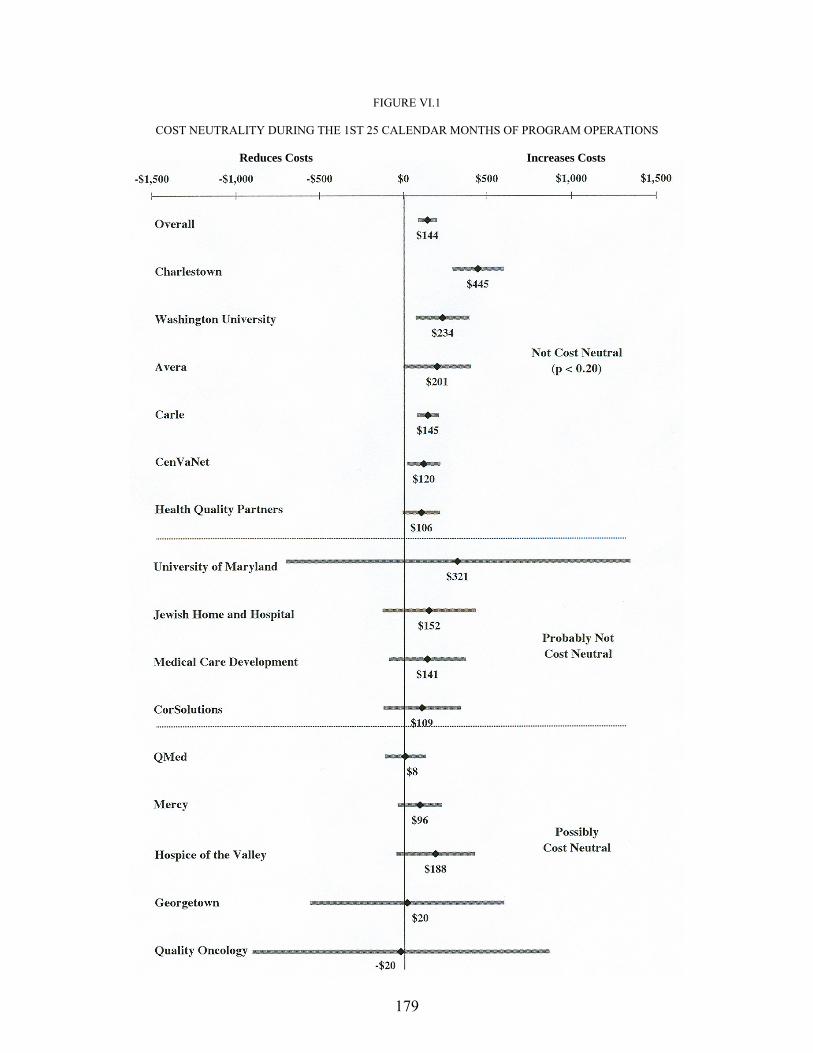
179
FIGURE VI.1
COST NEUTRALITY DURING THE 1ST 25 CALENDAR MONTHS OF PROGRAM OPERATIONS Reduces Costs Increases Costs
180
fewer hospital admissions than the control group during the 25 months since startup. Such a
small difference in hospitalizations (even if a real program effect) seems unlikely to generate the
16-percent reduction in Part A and B expenditures needed to cover the program�s fees. Although
the treatment group costs in each of the three other programs in the middle panel of Table VI.10
are lower than or equal to those of the control group, the differences are not significant and are
too small in each case to outweigh the monthly care coordination fees. Furthermore, the
programs exhibit little treatment-control differences in hospitalization rates. Thus the observed
differences in Medicare Part A and B expenditures appear to be mostly the result of chance
fluctuations rather than true program effects, and even if true savings exist, they are likely to be
too small to offset the monthly fee.
Five programs—Mercy, Hospice of the Valley, Georgetown, Quality Oncology, and
QMed—are more likely to be cost neutral (bottom panel of Table VI.10). Mercy is the clearest
case, with a large and highly significant difference in hospital admissions (27 percent,
p = 0.003). While the estimated treatment-control difference of $154 per member per month
(p = 0.105) is not enough to offset fully the average monthly fee that Mercy receives ($257 per
month for enrolled patients), the statistical variation around this estimate is large enough that
neither the hypothesis that the savings in Part A and B expenditures are zero nor the hypothesis
that the savings are greater than the average care coordination fees received per month the
patients are followed up can be rejected. QMed offers an ambiguous case, because the
difference in Part A and B expenditures (-$80, or 12 percent of the control group mean) virtually
offsets the low monthly fee of $96. While the treatment group had only 4-percent fewer hospital
admissions than the control group (p = 0.740), a small change in hospital use could be enough to
offset QMed�s relatively low program fee. The two other programs (Hospice of the Valley and
Georgetown) are somewhat similar to Mercy in that both have treatment groups with

181
hospitalization rates 10 percent or more below those of their respective control groups (though
neither difference is statistically significant), and neither hypothesis can be rejected. However,
the evidence to support cost neutrality is considerably weaker for both of them than for Mercy.
Georgetown has a small sample (about 100 patients each in the treatment and control groups),
and Hospice of the Valley has virtually no likelihood that it has generated savings in Part A and
B expenditures (p = 0.990). Nonetheless, given the test results, these are included along with
Quality Oncology, QMed, and Mercy in the category of potentially cost neutral programs at the
midpoint of the 4-year demonstration.
The differences between the expenditure results for the 1-year postenrollment period and the
first 25 months of operation warrant some further discussion, because these data are useful for
assessing the robustness of the results (Table VI.11). Altogether, seven of the programs are
classified as possibly or definitely not cost neutral in either analysis, two (Quality Oncology and
QMed) are classified as probably cost neutral in both analyses, and six are classified differently
in the two analyses. The three programs that appear possibly to be cost neutral in the 25-month
analysis but were probably or definitely not cost neutral in the 1-year follow-up estimates
(Hospice of the Valley, Georgetown, and Mercy) appear to have had larger effects as their
experience has grown and as patients were exposed to them for a longer period. This pattern,
which was expected, will be subjected to closer scrutiny as more data become available and
allow for separate assessment of how program effects vary with beneficiaries� length of time
enrolled and with program experience.
The only odd difference in results between the two analyses is for CorSolutions. The
smaller treatment-control difference in costs and hospitalizations over the full time period since
startup may be due to a number of factors, but it appears to be due primarily to the program�s
unusual patient intake pattern. During its first year, CorSolutions was only modestly successful
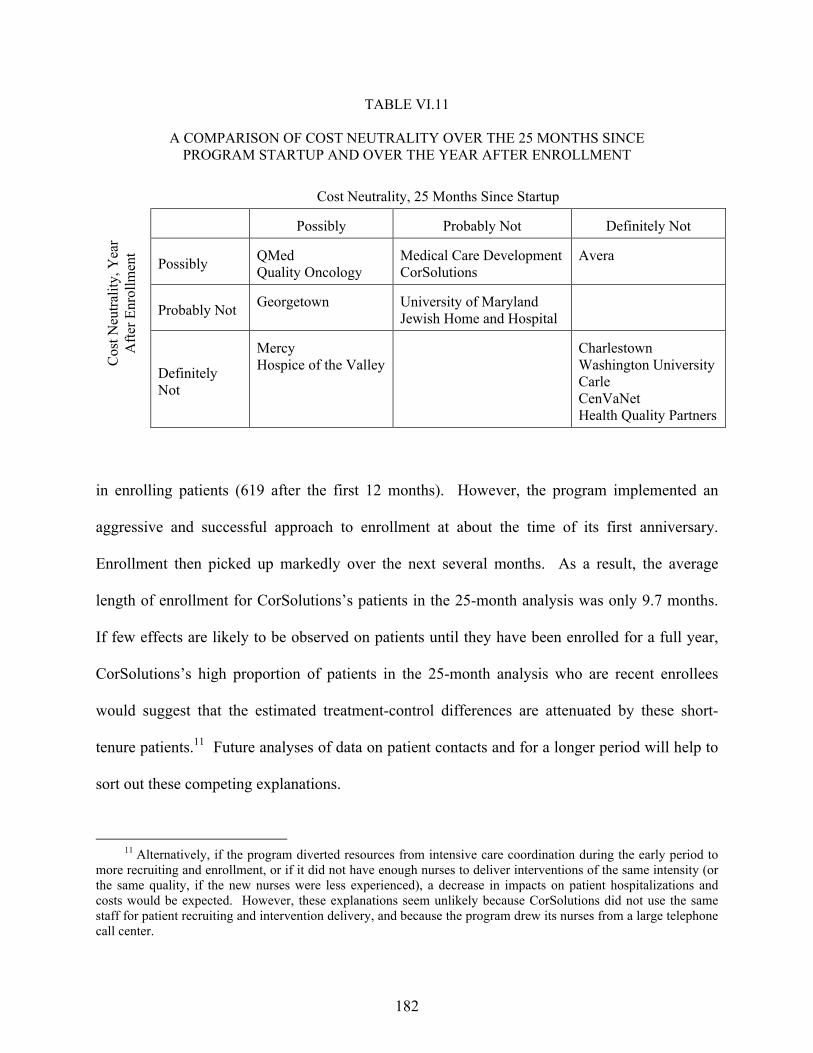
182
TABLE VI.11
A COMPARISON OF COST NEUTRALITY OVER THE 25 MONTHS SINCE PROGRAM STARTUP AND OVER THE YEAR AFTER ENROLLMENT
Cost Neutrality, 25 Months Since Startup
Possibly Probably Not Definitely Not
Possibly QMed Quality Oncology
Medical Care DevelopmentCorSolutions
Avera
Probably Not Georgetown University of Maryland Jewish Home and Hospital
Cos
t Neu
tralit
y, Y
ear
Afte
r Enr
ollm
ent
Definitely Not
Mercy Hospice of the Valley
Charlestown Washington UniversityCarle CenVaNet Health Quality Partners
in enrolling patients (619 after the first 12 months). However, the program implemented an
aggressive and successful approach to enrollment at about the time of its first anniversary.
Enrollment then picked up markedly over the next several months. As a result, the average
length of enrollment for CorSolutions�s patients in the 25-month analysis was only 9.7 months.
If few effects are likely to be observed on patients until they have been enrolled for a full year,
CorSolutions�s high proportion of patients in the 25-month analysis who are recent enrollees
would suggest that the estimated treatment-control differences are attenuated by these short-
tenure patients.11 Future analyses of data on patient contacts and for a longer period will help to
sort out these competing explanations.
11 Alternatively, if the program diverted resources from intensive care coordination during the early period to
more recruiting and enrollment, or if it did not have enough nurses to deliver interventions of the same intensity (or the same quality, if the new nurses were less experienced), a decrease in impacts on patient hospitalizations and costs would be expected. However, these explanations seem unlikely because CorSolutions did not use the same staff for patient recruiting and intervention delivery, and because the program drew its nurses from a large telephone call center.

183
VII. SUMMARY AND CONCLUSION
Patients and physicians were generally very satisfied with the program, but few programs
had statistically detectable effects on patients� behavior or use of Medicare services. Treating
only statistically significant treatment-control differences as evidence of program effects, the
results show:
• Few effects on beneficiaries� overall satisfaction with care
• A sizable increase in the percentage of beneficiaries reporting they received health education on various topics, including diet, exercise, warning signs, and their condition or treatment
• No clear effects on patients� adherence or self-care
• Favorable effects for only two programs each on the quality of preventive care, the number of preventable hospitalizations, and patients� well-being
• Reduced hospitalizations for only 1 of the 15 programs over the first 25 months of program operations (the average number of hospitalizations was 10 percent or more lower for the treatment than control groups in another 4 programs, but these differences were not statistically significant)
• No reduction in expenditures for Medicare Part A and B services for any program
Despite the absence of statistically significant treatment-control differences on Medicare
expenditures for traditional services, it is possible that some of the programs are cost neutral to
date. This could be true because the large variation in Medicare expenditures and the small
number of beneficiaries enrolled in some programs make it difficult to draw definitive
conclusions�for nine programs, treatment-control differences in Part A and B expenditures are
not statistically different from zero, but they also are not significantly different from the average
fee paid to the program. Based on the patterns of differences in hospitalizations, Part A and B
expenditures, and Medicare expenditures including the care coordination fees, six of the
184
programs are not cost neutral, four probably are not, and five may be over the first 25 months
since program startup.
A. NO SINGLE FACTOR STANDS OUT AS KEY TO A SUCCESSFUL INTERVENTION
Given the limited number of programs that show any promise of reducing beneficiaries�
need for hospitalizations and saving money, or of improving the quality of care they receive,
there is relatively little assessment to be done of �what works.� The one program for which there
were statistically significant estimates of reductions in hospital use, Mercy Medical Center in
Iowa, differed from the other programs in that it had by far the highest proportion of contacts
conducted in person (two-thirds), and it excelled at problem identification and care planning,
patient education, and improving communications and coordination between patients and
physicians. Its staffing was also rated in the top quintile. The program also had large impacts on
patient education, as judged from the patient survey, and was rated highly by the
patients� physicians.
In the evaluator�s discussions with the programs on the reasons for their effects or lack of
effects to date, Mercy�s staff attributed the reductions in hospitalizations they achieved primarily
to getting patients to see their physician quickly when symptoms worsened or problems arose.
By identifying looming problems before they became severe, and convincing patients of the
urgency of seeing a physician (or contacting physicians directly on behalf of patients when
necessary), Mercy staff felt they were able to prevent the patients� health from deteriorating to
the point where a hospital admission would be necessary. They felt this preventive effect
typically arose through quickly getting patients on needed medications or different dosages of
their current medications.
185
The four other programs for which the treatment group had 10- to 20-percent fewer
hospitalizations than the control group (though these differences were not statistically
significant) also scored highly on one or more domains. For example, Georgetown and Health
Quality Partners both scored in the top quintile on initial assessment. Quality Oncology scored
in the top quintile on four domains�Staffing, Information Technology, Ongoing Monitoring,
and Quality Management.
Programs that seemed to improve preventive care (Carle and Health Quality Partners) also
scored very well on patient survey indicators and tended to receive high ratings on the scoring
algorithm for the quality of their intervention. Carle scored higher than all other programs on
5 of the 10 indicators. Health Quality Partners scored at the top on patient education. However,
neither of these programs generated reductions in Medicare expenditures in the observed follow-
up period. This lack of impact on expenditures may be due to the fact that these two programs�
enrollees had far lower preenrollment expenditures than any other program�s enrollees (except
for QMed, which was comparable).
Programs that exhibited no effects on hospitalizations, costs, or quality-of-care indicators
gave a range of reasons why they were unable to reduce the need for hospitalizations. Reasons
included the still-short time frame over which the analysis was conducted; the belief that some of
their patients were either too debilitated or not sick enough to benefit from their interventions;
and the belief that physicians in their service areas had an intractable tendency to send patients to
the emergency room, rather than to find time for office visits when patients exhibited
worsening symptoms.
Looking across the characteristics of the five programs most likely to be cost neutral over
the first 2 years of operation and of the two that appear to have improved the quality of care
seems to confirm the finding in Chen et al. (2000) that no single program feature or characteristic
186
seems to be associated with a greater likelihood of program �success.� Nor does the absence of a
particular feature seem to doom a program to relative failure. However, how well programs
perform their functions (based on information obtained from program staff and assessed by the
evaluator) does seem to be associated with program success.
While no firm conclusions can be drawn as yet about which Medicare Coordinated Care
Demonstration programs really are effective, because samples are still relatively small and the
follow-up period relatively short, those programs that are most promising to date share few
common structural features. Two of the programs with the most success in improving quality
(Health Quality Partners and Carle) operate in rural areas, as does Mercy, the sole program with
statistically significant effects on the number of hospitalizations. Yet Avera and Medical Care
Development also operate in rural areas and show no such promising results to date. Two of the
programs with the most favorable expenditure results (Quality Oncology and Georgetown) have
fewer than 100 treatment group members�Medical Care Development is the only other program
serving fewer than 300 patients. However, the results for these two programs may be due more
to the imprecision of the estimates than to the excellence of the interventions. The five other
relatively successful programs have substantially more patients. All four programs whose care
coordinators have average caseloads of 50 or fewer patients are among the most effective
programs, but the other three relatively effective programs have average caseloads in the highest
range (over 75 patients). Three of the five programs operated by commercial disease
management programs were among the top seven performers, but the four other strong
performers had hospitals, clinics, or academic medical centers as hosts. Other program
characteristics examined seem equally unrelated to whether a program was one of the more
effective seven.

187
The relationship between how well programs reportedly performed certain functions appears
to have a somewhat stronger association with performance than the structural characteristics.
Strong performance in any particular domain does not appear to be necessary or sufficient for a
program to be relatively successful. However, there are some clear patterns of association
between how programs scored on the 10 domains examined and their ability to improve quality
or generate reasonably favorable expenditure comparisons. The domains most strongly
associated with the promising programs are Staffing (the five programs with the highest ratings
on staffing were all among the seven most effective programs), Improving Communications and
Coordination (five of the six top programs on this domain were promising programs), Patient
Education (four of the top five programs were promising), and Quality Management and
Outcome Measurement (four of the top five programs were promising). Characteristics
decidedly not associated with stronger quality or cost performance included Improving Provider
Practice, Service and Resource Arranging, Information Technology, and (perhaps surprisingly)
Ongoing Monitoring. For each of these characteristics, only one or two of the five top-rated
programs were among the seven programs classified as most promising to date.
Finally, the characteristics of the patients enrolled appear to be unrelated to the relative
success of the programs to date. Three of the seven promising programs targeted patients with a
single disease; the other four targeted multiple diseases. All three of the programs that enrolled
patients with average preenrollment Medicare expenditures of under $600 per month were
among the top seven performers, but three others of the top performers were among the six
programs whose patients had average expenditures in excess of $2,000 per month. None of the
other patient characteristics examined (age, education, income, or race) appeared to be related to
programs� likelihood of success.
188
The current findings suggest that hiring excellent staff and performing certain key functions
well are the most important determinants of the likelihood that a program might successfully
improve patient outcomes or save enough in Medicare expenditures to cover the cost of its
intervention. The results to date are thus consistent with findings from Chen et al. (2000) that a
few factors were common to most successful programs, including hiring well-trained,
experienced nurses with at least a baccalaureate degree, but that many other factors, such as
having sophisticated electronic health records, were not required.
B. THE FINDINGS FOR THE FIRST 2 YEARS ARE NOT HIGHLY FAVORABLE, BUT THEY COULD IMPROVE
Although none of the impact estimates available at this time suggest that the demonstration
programs are having large effects on patients� behavior or outcomes, effects on Medicare service
use and expenditures might be observed when the full 4 years of data on all patients become
available. Physicians have been responding favorably to the programs�an important factor,
given the widespread recognition that few care coordination programs are likely to succeed
without significant cooperation and reinforcement from patients� physicians (Chen et al. 2000;
Schore et al. 1999). Even more important, patients appear to have formed a bond with their care
coordinators and trust their judgment.
The absence of large effects on the patient adherence measures may be somewhat
discouraging for programs, but it does not necessarily imply that the programs are not having any
effect on patients� behavior. Relative to the control group, patients of several programs reported
better access to information and appointments and better communication among their providers.
Furthermore, the finding that program patients were not significantly more likely to report eating
a healthy diet or exercising regularly may have a positive explanation�it is possible that, as a
result of program education, the treatment group had higher standards of what constitutes
189
�healthy� or �regular.� If that is true, their actual adherence may be better than the control
group�s, but the survey measures reported here may not reflect it. In addition, in many cases,
behavioral change takes time; some changes do not occur until patients have experienced an
adverse event that makes them recognize the value of adhering to advice from their physicians or
care coordinators. Programs report that they expect it to take a few years to observe changes in
their patients� behavior and the effects of those behaviors on their health and service use. The
observed improvements in preventive care in some programs also may not result in lower
hospitalizations or costs for a few years. Thus, there is reason to believe that some programs
may have effects over the longer run.
C. THE FINAL REPORT WILL COVER 4 PROGRAM YEARS
The results presented here are not the final word on the programs� impacts�changing
ingrained behaviors of physicians and patients and improving communications among non-
integrated fee-for-service providers are all difficult tasks to achieve. Furthermore, even if
achieved, such improvements in the processes of care may not yield statistically discernable
improvements in patient well-being or reductions in Medicare costs over the first 2 years of
program operations. Thus, the estimates presented here may differ from those that will be
observed over the full 4 years of operations. Nonetheless, this report provides (to our
knowledge) the largest single random-assignment study to date of disease management/case
management programs, and only the second evaluation ever conducted of such programs in a
Medicare fee-for-service setting. (The first was by Schore et al. 1999.)
The next evaluation report will assess the effectiveness of the demonstration programs by
estimating program impacts on Medicare service use, expenditures, and quality of care over the
first 4 years of program operations. The report will also describe the features of the programs or
target populations associated with effectiveness (if any). CMS has extended the end dates by 2

190
years to 2008 for all 11 of the 15 demonstration programs that requested extensions. The
remaining programs (the three smallest programs and Charlestown, which is starting a new
demonstration program) ended in 2006 as originally planned. CMS granted the extensions
because the Balanced Budget Act of 1997 authorizes CMS to continue any programs that are
found to be cost-effective after the demonstration ends. The Act defines cost-effectiveness as
either (1) reducing Medicare expenditures, or (2) not increasing Medicare expenditures while
increasing the quality of services furnished and beneficiary and provider satisfaction. The new
end dates allow 11 of the demonstration programs to continue operating until the final evaluation
findings are available. The extension allows any of these programs that the final report finds to
be cost effective to remain operating rather than shutting down in 2006 and having to restart
later.
191
REFERENCES
Anderson, Gerard, and Jane Horvath. �Chronic Conditions: Making the Case for Ongoing Care.� Baltimore, MD: The Johns Hopkins University, December 2002.
Aubry, Barbara. �Bolstering Disease Management Programs.� Healthplan, July�August 2000, pp. 11�12.
Bodenheimer, Thomas. �Disease Management�Promises and Pitfalls.� New England Journal of Medicine, vol. 340, no. 15, April 15, 1999, pp. 1202�1205.
Bodenheimer, Thomas, Edward Wagner, and Kevin Grumbach. �Improving Primary Care for Patients with Chronic Illness.� Journal of the American Medical Association, vol. 288, no. 15, October 16, 2002, pp. 1909�1914.
Brown, Randall, Deborah Peikes, Arnold Chen, Judy Ng, Jennifer Schore, and Clara Soh. �Second Report to Congress on the Evaluation of the Medicare Coordinated Care Demonstration.� Princeton, NJ: Mathematica Policy Research, Inc., December 2006.
Brown, Randall, Jennifer Schore, Nancy Archibald, Arnold Chen, Deborah Peikes, Karen Sautter, Bridget Lavin, Sherry Aliotta, and Todd Ensor. �Coordinating Care for Medicare Beneficaries: Early Experiences of 15 Demonstration Programs, Their Patients, and Providers.� Report to Congress. Princeton, NJ: Mathematica Policy Research, Inc., May 2004.
Brown, Randall, Deborah Peikes, Eric Schone, Nazmul Khan, Arnie Aldridge, and Lucy Lu. �Waiver Cost Estimates for the Medicare Coordinated Care Demonstration.� Princeton, NJ: Mathematica Policy Research, Inc., August 31, 2001.
Casalino, Lawrence. �Disease Management and the Organization of Physician Practice.� Journal of the American Medical Association, vol. 293, no. 4, January 26, 2005, pp. 485�488.
Centers for Medicare & Medicaid Services. �Medicare Current Beneficiary Survey.� Baltimore, MD: CMS, 2002a. Available at [www.cms.hhs.gov/mcbs/PublDT.asp].
Centers for Medicare & Medicaid Services. �Program Information on Medicare, Medicaid, SCHIP, and Other Programs of the Centers for Medicare & Medicaid Services.� Baltimore, MD: CMS, June 2002b.
Chen, Arnold, Randall Brown, Nancy Archibald, Sherry Aliotta, and Peter Fox. �Best Practices in Coordinated Care.� Princeton, NJ: Mathematica Policy Research, Inc., February 29, 2000.
Congressional Budget Office. �High-Cost Medicare Beneficiaries.� Washington, DC: CBO, May 2005.
192
Congressional Budget Office. �An Analysis of the Literature on Disease Management Programs.� Washington, DC: CBO, October 13, 2004. Available at [http://www.cbo.gov/ ftpdocs/59xx/doc5909/10-13-DiseaseMngmnt.pdf].
Cubanski, Juliette, Molly Voris, Michelle Kitchman, Tricia Neuman, and Lisa Potetz. Medicare Chartbook. Third edition. Menlo Park, CA: The Henry J. Kaiser Family Foundation, summer 2005.
Department of Obstetrics and Gynaecology, Chinese University of Hong Kong. �IntraClass Correlation�. Available at [http://department.obg.cuhk.edu.hk/researchsupport/ IntraClass_correlation.asp]. Accessed September 28, 2005.
Fox, Peter. �Screening: The Key to Early Intervention for High-Risk Seniors.� Healthplan, November�December 2000, pp. 56�61.
Guterman, Stuart. �Medicare Disease Management Activities.� Paper presented at Invitational Working Meeting for Developing a Research and Data Strategy for Improving Care of Chronically Ill Medicare Beneficiaries, Washington, DC, July 1, 2004.
Hagland, Mark. �Integrating Disease Management.� Healthplan, January�February 2000, pp. 43�46.
Institute of Medicine. Crossing the Quality Chasm: A New Health System for the 21st Century. Washington, DC: National Academy Press, 2001.
Kerr, Eve, Elizabeth McGlynn, John Adams, Joan Keesey, and Steven Asch. �Profiling the Quality of Care in 12 Communities: Results from the CQI Study.� Health Affairs, vol. 23, no. 3, May/June 2004, pp. 247�256.
Kozak, Lola Jean, Margaret J. Hall, and Maria F. Owings. �Trends in Avoidable Hospitalizations, 1980�1998.� Health Affairs, vol. 20, no. 2, March�April 2001, pp. 225�232.
Landis, J. Richard and Gary G. Koch. �The Measurement of Observer Agreement for Categorical Data.� Biometrics, vol. 33, no. 1, March 1977, pp. 159�174.
Lorig, Kate. �Self-Management Education: More Than a Nice Extra.� Medical Care, vol. 41, no. 6, June 2003, pp. 699�701.
Lorig, Kate, David Sobel, Anita Stewart, Byron Brown, Jr., Albert Bandura, Philip Ritter, Virginia Gonzalez, Diana Laurent, and Halsted Holman. �Evidence Suggesting that a Chronic Disease Self-Management Program Can Improve Health Status While Reducing Hospitalization.� Medical Care, vol. 37, no. 1, 1999, pp. 5�14.
Lowenstein, Roger. �The Quality Cure?� New York Times Magazine, March 13, 2005.
McCall, Nancy T., Erica Brody, Lee Mobley, and Sujha Subramanian. �Investigation of Increasing Rates of Hospitalizations for Ambulatory Care Sensitive Conditions Among

193
Medicare Fee-for-Service Beneficiaries.� Washington, DC: RTI International, June 2004. Available at [www.cms.hhs.gov/researchers/reports/2004/McCall.pdf].
McGraw, Kenneth O. and S. P. Wong. �Forming Inferences About Some Intraclass Correlation Coefficients.� Psychological Methods, vol. 1, no. 1, 1996, pp. 30�46.
Medicare Payment Advisory Commission. �Report to Congress: New Approaches to Medicare.� Washington, DC: MedPAC, June 2004. Available at [www.medpac.gov/ publications/congressional_reports/June04_Entire_Report.pdf].
Moreno, Lorenzo. �Electronic Health Records: Synthesizing Recent Evidence and Current Policy.� Issue Brief, no. 1. Princeton, NJ: Mathematica Policy Research, Inc., August 2005. Available at [www.mathematica-mpr.com/publications/pdfs/electronichealth.pdf].
Rector, Thomas, and Patricia Venus. �Judging the Value of Population-Based Disease Management.� Inquiry, vol. 36, summer 1999, pp. 122�126.
Rich, Michael W. �Heart Failure in the Elderly: Strategies to Optimize Outpatient Control and Reduce Hospitalizations.� American Journal of Geriatric Cardiology, vol. 12, no. 1, January 2003, pp. 19�24.
Rich, Michael W., Valerie Beckman, Carol Wittenberg, Charles L. Leven, Kenneth E. Freedland, and Robert M. Carney. �A Multidisciplinary Intervention to Prevent the Readmissions of Elderly Patients with Congestive Heart Failure.� New England Journal of Medicine, vol. 333, no. 18, November 2, 1995, pp. 1190�1195.
Riegel, Barbara, Beverly Carlson, Zoe Kopp, Barbara LePetri, Dale Glaser, and Alan Unger. �Effect of a Standardized Nurse Case-Management Telephone Intervention on Resource Use in Patients with Chronic Heart Failure.� Archives of Internal Medicine, vol. 162, no. 6, March 25, 2002, pp. 705�712.
Roter, Debra, Judith Hall, Rolande Merisca, Beth Nordstrom, Deborah Cretin, and Bonnie Svarstad. �Effectiveness of Interventions to Improve Patient Compliance.� Medical Care, vol. 36, no. 8, 1998, pp. 1138�1161.
Schore, Jennifer, Randy Brown, and Valerie Cheh. �Case Management for High-Cost Medicare Beneficiaries.� Health Care Financing Review, vol. 20, no. 4, summer 1999, pp. 87�101.
Shrout, Patrick E. and Joseph L. Fleiss. �Intraclass Correlations: Uses in Assessing Reliability.� Psychological Bulletin, vol. 86, 1979, pp. 420�428.
Sidorov, Joan, Robert Shull, Janet Tomcavage, Sabrina Girolami, Nadine Lawton, and Ronald Harris. �Does Diabetes Disease Management Save Money and Improve Outcomes? A Report of Simultaneous Short-Term Savings and Quality Improvement Associated with a Health Maintenance Organization-Sponsored Disease Management Program Among Patients Fulfilling Health Employer Data and Information Set Criteria.� Diabetes Care, vol. 25, no. 4, April 2002, pp. 684�689.
194
U.S. Department of Health and Human Services. �Medicare and Medicaid Statistical Supplement, 2001.� Health Care Financing Review, April 2003, Table 12.
Vernarec, Emil. �Health Care Power Shifts to the People.� Business and Health—Special Issue: The State of Health Care in America 1999, vol. 17, no. 6A, June 1999, pp. 8�13.
Villagra, Victor, and Tamim Ahmed. �Effectiveness of a Disease Management Program for Patients with Diabetes.� Health Affairs, vol. 23, no.4, July�August 2004, pp. 255�266.
Wagner, E.H., B.T. Austin, C. Davis, M. Hindmarsh, J. Schaefer, and A. Bonomi. �Improving Chronic Illness Care: Translating Evidence into Action.� Health Affairs, vol. 20, no. 6, 2001, pp. 64�78.
Wasson, J., C. Gaudette, F. Whaley, A. Sauvigne, P. Baribeau, and G. Welch. �Telephone Care as a Substitute for Routine Clinic Followup.� Journal of the American Medical Association, vol. 267, no. 13, April 1, 1992, pp. 1788�1793.
Wenger, Neil S., David H. Solomon, Carol P. Roth, Catherine H. MacLean, Debra Saliba, Caren J. Kamberg, Laurence Z. Rubenstein, Roy T. Young, Elizabeth M. Sloss, Rachel Louie, John Adams, John T. Chang, Patricia J. Venus, John F. Schnelle, and Paul G. Shekelle. �The Quality of Medical Care Provided to Vulnerable Community-Dwelling Older Patients.� Annals of Internal Medicine, vol. 139, no. 9, November 2003, pp. 740�759.
West, J., N. Miller, K. Parker, D. Senneca, G. Gahandour, M. Clark, G. Greenwald, R. Heller, M. Fowler, and R. Debusk. �A Comprehensive Management System for Heart Failure Improves Clinical Outcomes and Reduces Medical Resource Utilization.� American Journal of Cardiology, vol. 79, January 1, 1997, pp. 58�63.
Williams, Mark. �Chronic Care Clinics: Why Don�t They Work?� Journal of the American Geriatric Society, vol. 47, no. 7, July 1999, pp. 908�909.