Embed Size (px)
Citation preview

The Evolution of the Private Equity Market and the Decline in
IPOs
Michael Ewens and Joan Farre-Mensa∗
August 11, 2017
Abstract
Despite the large drop in the number of initial public offerings (IPOs) in the United States,
privately-held firms backed by venture capital continue to raise capital, achieve high rev-
enues and hire at rates historically available only to their public peers. We show that
this ability to finance and grow at older ages stems from a positive shock to the supply of
private capital to high-growth entrepreneurial firms. This shock manifests itself in three
ways. Since 1996, non-traditional investors have played an increasing role in the late-stage
venture capital market. Next, consistent with technological changes lower search costs, we
find that investors are farther away from their portfolio companies in the last 15 years.
Third, the increased participation of these investors coincides with the passage of a major
securities law in 1996 that removed frictions in raising private capital by both firms and
their financiers. The collection of evidence demonstrates that the lower volume of IPOs
for VC-backed firms most likely stems from their founders/managers choosing to remain
private, rather than a market failure leading to frictions in the going public process.
Key words: Initial Public Offerings (IPOs), Venture Capital, Private Equity, Founder Eq-
uity, NSMIA.
JEL classification: G32; G24; G28.
∗Ewens: California Institute of Technology ([email protected]); Farre-Mensa: Cornerstone Research
([email protected]). We thank Will Gornall, Ramana Nanda, and audiences at UC Berkeley’s Finance
and Innovation Conference and at Caltech. We also thank Correlation Ventures and VentureSource for access
to the data. Ewens is an advisor to and investor in Correlation Ventures.
1

Recent years have seen a sharp decline in the number of initial public offerings (IPOs) in the
U.S. (Doidge, Karolyi, and Stulz (2013, 2017); Gao, Ritter, and Zhu (2013)). While this decline
has garnered considerable attention both in academic and policy circles and in the press,1 its
causes remain unclear. In particular, Gao, Ritter, and Zhu (2013) argue that the drop in IPOs
follows from technological changes where “the advantages of selling out to a larger organization
[...] have increased relative to the benefits of operating as an independent firm” (p. 1663).
By contrast, Doidge, Karolyi, and Stulz (2017) note that the U.S.-centric nature of the IPO
decline rules out “explanations that focus on technological change that affects firms regardless
of their country of domicile” (p. 465). At the same time, Gao, Ritter, and Zhu (2013) and
Doidge et al. (2013; 2017) agree that the Sarbanes-Oxley Act and other early 2000s changes
in the regulatory environment surrounding public firms cannot explain the decline.
The debate on the causes behind the dearth of IPOs has been accompanied by a no less
intense debate on its consequences for the U.S. entrepreneurial finance market. To illustrate,
prior to 1997, over 80% of venture capital (VC)-backed startups that raised over $150 million
did so by tapping the public-equity markets, fueling concerns that the lack of IPOs may hinder
successful startups ability to fund their growth. Indeed, Doidge, Karolyi, and Stulz (2013)
conclude that while the low IPO rate is “consistent with the view that U.S. financial markets
became less hospitable for young, small firms, direct tests of this view, while needed, are
beyond the scope” of their study (p. 571). Our paper helps fill this gap by shedding light on
the extent to which the decline in IPOs has impacted U.S. startups’ ability to finance their
growth. Unlike most prior work, which has examined the changes in the public-equity markets
that have accompanied the IPO decline, we do so by analyzing how the private markets have
responded – and contributed – to this decline.
Throughout the paper, we focus on VC-backed startups, which have traditionally been a
major player both in the IPO market (58% of technology IPOs; Ritter (2017)) and the produc-
tion of innovation (e.g., Gornall and Strebulaev (2015)), and for which (pre-IPO) financing data
are widely available. We begin by examining whether the decline in IPOs has been made up by
an increase in acquisitions. If this were the case and the acquirers were public firms, startups’
1For recent examples see “IPO Drought Scorches Wall Street” (https://www.wsj.com/articles/ipo-drought-scorches-wall-street-1474634214) and “Uncuffing capitalism” (http://www.economist.com/node/21551481).
2

ultimate ability to rely on public capital to fund their growth would remain unchanged – even
if they would no longer do so as independent firms. In fact, the fraction of VC-backed startups
that are acquired 7 or 10 years after their initial funding round has remained roughly constant
since the early 1990s. Instead, the decline in IPOs has been accompanied by an increase in the
fraction of startups that stay independent and privately-held long after they first raise capital.
Crucially, in recent years, these late-stage startups that remain privately-held continue to
finance their growth in ways unseen prior to the 2000s. The age of the average startup raising
private capital has almost doubled since 2000, from just under two years old in 2000 to close to
four years old in 2005. This trend is even more pronounced if we weigh firm age by the dollar
amount raised, thus highlighting the large size of these late rounds. Relatedly, as startups stay
private longer, they raise an increasing number of private rounds: Only 4% of startups that
raised their first round in 1992, at the beginning of our sample, went on to raise seven or more
rounds over the following 10 years; by contrast, of those startups raising their initial round in
2005, 10% had raised a seventh round 10 years later.
Of course, even in 1996, when public listings were at their peak (Doidge, Karolyi, and
Stulz (2017)), an IPO was an option only for the most successful startups. Thus, in order
to understand the extent to which private investors have filled up the gap left by the decline
of IPOs, we need to investigate whether they are able to finance the growth of the largest
startups. Our evidence suggests they are. Of those startups whose first round was before 1997
and went on to raise over $150 million in the following seven years, 83% did so by going public;
by contrast, only 36% of startups reaching that scale since 2000 were public - even though the
annual number of startups raising over $150 million has not changed. If we instead focus on
startups that reach a large size as measured by real variables like employment or sales, a similar
picture emerges: In the pre-1997 cohorts, 87% of startups with more than 200 employees and
67% of those with over $40 million in sales had gone public; since 2000, these fractions have
been more halved, standing at 29% and 30%, respectively. Simply put, VC-backed startups
now appear able to raise large amounts of capital and grow in employment and sales without
going public.
The above results suggest private investors have filled much, if not all, of the void left by the
drought in IPOs. We next study the sources of this capital going to late-stage startups. The
3

amount of private capital raised by startups four or more years past their first VC round–an
age at which successful firms would traditionally consider an IPO–has grown by a factor of 20
since 1992, surpassing $30 billion in 2015. Approximately 40% of this growth has been driven
by traditional venture capital funds, which appear increasingly willing to both invest in mature
startups and to make these investments later in the fund’s life. The remaining 60% has been
fueled by less traditional startup investors such as private equity (PE) funds, family offices,
hedge funds, and, particularly since 2010, mutual funds.2
What explains the growth in the supply of private capital to late-stage startups? As is often
the case with such macroeconomic changes, a variety of factors are likely at play. Kahle and
Stulz (2016) note that the Internet has reduced search costs for firms searching for investors (and
vice versa), thus reducing one of the fundamental advantages of centralized stock exchanges.
A number of regulatory changes affecting private firms and their investors have also facilitated
the process of raising capital privately (e.g., de Fontenay (2017)). One notable change was the
National Securities Markets Improvement Act (NSMIA) of 1996. The NSMIA made it easier
for private firms to sell securities to “qualified purchasers” (e.g., institutions or accredited
investors) in different states by exempting those sales from state-level regulations known as
blue-sky laws (public firms have long been exempt from these state laws). In addition, the
NSMIA made it easier for unregistered funds such as VC and PE funds to raise capital by
also exempting them from blue-sky laws and by introducing news exclusions from registration
that effectively increased the maximum number of investors in a fund.3 This exclusion was
particularly important for funds investing in late-stage startups, which tend to be larger and
have more investors to meet mature startups’ higher capital needs.
Consistent with the NSMIA being a positive shock to the supply of late-stage private capital,
our difference-in-difference analysis that compares U.S. and non-U.S.-based funds reveals that
the size of funds increased relatively more in the U.S. around the passage of the NSMIA.
More importantly, when we compare late-stage to early-stage funds in the U.S. around the law
2In contemporaneous work, Chernenko, Lerner, and Zeng (2017) and Kwon, Lowry, and Qian (2017) also findthat mutual funds have taken an increased role in funding VC-backed startups. We show this growth of mutualfund is part of a larger trend that has seen non-VC investments in late-stage startups grow from $1.5 billion in1992 to $32 billion in 2015; the fraction of these non-VC investments made by mutual funds peaked in 2011 at14.8%.
3Prior to the NSMIA, only funds with 100 or fewer investors were excluded from registering as investmentcompanies under the Investment Company Act. Such registration can be burdensome, as it requires the regulardisclosure of investment positions and limits the use of leverage, among other requirements.
4

change, we find that the former increased 40% more on average. Importantly, this finding is
robust to excluding information technology (IT) funds, which suggests it is not driven by the
Internet boom in the late 1990s.
Taken together, our results suggest that the growth in the supply of private capital has
allowed late-stage startups to continue financing their growth while remaining privately held.
A natural question then follows: Is staying private a second-best response to the lack of IPOs,
or is it actually driving the lack of IPOs? In other words, are startups remaining private
because they cannot go public and so find themselves resigned to raising money privately?
Or, alternatively, is an IPO still an option for these firms, but they choose to remain private
instead?
To shed light on this question, it is helpful to consider why startups may choose to remain
private. In their survey of CFOs, Brau and Fawcett (2006) find that the main reason leading the
managers of successful firms to remain private is their desire to preserve decision-making control
and ownership. Boehmer and Ljungqvist (2004), Boot, Gopalan, and Thakor (2006), and
Helwege and Packer (2009), among others, also emphasize founders’ desire to maintain control
as a key benefit of remaining private. However, founders desire to stay private often conflicts
with VCs’ desire to go public, as IPOs ensure a timely liquidation of their investment and carry
considerable reputational benefits (e.g., Gompers (1996); Gompers and Lerner (1996)).4
Consistent with founders’ desire for control being a key driver of startups’ decision to stay
private, we find that the founders’ bargaining power early in a firm’s life has a negative effect on
its eventual exit probability. Our instrumental variable identification strategy exploits state-
year variation in the supply of venture capital stemming from variation in the assets of state
pension funds (Gonzalez-Uribe (2014); Bernstein, Lerner, Sorensen, and Stromberg (2016)).
The first stage shows that founders who raise their first VC round in state-years when the assets
of the state’s pension funds are high have a persistently higher equity stake (after controlling
for the capital raised). In the second stage, founders use this higher equity stake – which is
positively correlated with measures of control such as board seats – to decrease the likelihood
4For a recent example of this conflict, see “Palantir and Investors Spar Over How to Cash In” (Wall StreetJournal, Dec. 30, 2015), which describes the “deepening rift in Silicon Valley between private companies thatwant to stay that way and investors who want to unlock at least some of the profits from their most successfulinvestments.”
5

their firms go public or are acquired seven (or ten) years later.5
The reasons driving the documented increase in founders’ bargaining power are likely to be
multi-faceted, and a full analysis of them falls beyond our paper’s scope. That said, we note
that technological changes decreasing startups’ capital requirements early in their lifecycle–
when uncertainty is highest and thus capital is most expensive (Ewens, Nanda, and Rhodes-
Kropf (Forthcoming))—as well as the growth of non-traditional startup investors in late-stage
financings have likely played a role. Whatever the reasons, our finding that founders with the
most control (and so whose startups have the highest valuations) are in fact the most likely
to stay private suggests they do so by choice and not as a second-best response to not being
able to go public. This conclusion is reinforced by the growing role of mutual funds and other
traditional IPO investors in funding late-stage private startups. These investors’ willingness
to hold private, illiquid securities suggests they would also be willing to invest in these same
startups if they went public.
Our paper makes two contributions. First, we show that the much-debated dearth of
IPOs in the U.S. does not appear to have impeded late-stage startups’ ability to finance their
growth. Of course, ruling out the possibility that the IPO decline has negatively affected
startups’ access to capital would require a comparison of private startups’ ability to fund their
(unobservable) investment opportunities today to that of similar public startups in the 1990s.
Such a comparison is unlikely to be feasible. However, our finding that private investors provide
an increasing amount of capital to late-stage startups, allowing them to reach size thresholds
that until recently few private firms reached, suggests private markets are filling much–if not
all–of the IPO gap.
Private investors funding late-stage startups include traditional actors such as venture cap-
ital funds and more recent entrants such as mutual and hedge funds. Mutual funds’ role in
funding private startups has garnered considerable recent attention, both in the academic liter-
ature (Chernenko, Lerner, and Zeng (2017); Kwon, Lowry, and Qian (2017)) and in the press.6
Our paper confirms the growth of mutual funds’ investments in startups and, more importantly,
quantifies their (still) relatively modest importance in the entrepreneurial finance market.
5As expected, the OLS partial correlation between founder equity and IPO probability is positive, which isconsistent with founder equity (and thus startup valuation) being positively correlated with unobserved quality.
6For example, see “Mutual Funds Moonlight as Venture Capitalists”. (https://www.wsj.com/articles/mutual-funds-moonlight-as-venture-capitalists-1398033557).
6

Second, our paper contributes to our understanding of the causes driving the decline in
IPOs. Prior work (Doidge, Karolyi, and Stulz (2013); Gao, Ritter, and Zhu (2013)) has exam-
ined whether this decline can be explained by changes in the public-equity markets, such as
the Sarbanes-Oxley Act of 2002 or the 2003 Global Settlement, and has concluded it cannot.
Instead, we show that changes in the private markets, some of them regulatory, such as the
National Securities Markets Improvement Act of 1996, and some technological, such as lower
search costs induced by the Internet, have reduced the relative cost of being private. At the
same time, these and other changes (e.g., a lower cost of startup experimentation; Ewens,
Nanda, and Rhodes-Kropf (Forthcoming)) have increased founders’ bargaining power vis-a-vis
investors. This increased bargaining power, coupled with the reduction in the cost of being
private, has made it possible for founders to realize their preference for control by delaying–or
avoiding altogether–an IPO.
1 Data and Sample
Our data builds off the venture capital (VC) and private investment data provided by Ven-
tureSource (a division of Dow Jones) and is supplemented with information from Correlation
Ventures, a quantitative VC fund. This supplemental information (described in detail in Ewens,
Nanda, and Rhodes-Kropf (Forthcoming)) is particularly useful for the analyses of exit valu-
ations, firm failure tracking and founder equity, which would not be possible if relied only on
commercial databases. We begin by considering all startups in VentureSource that raised their
first private round of funding after 1992.7 We observe investments through 2016, and the end
of our sample period changes depending on the data demands of each analysis. To be in our
sample, a startup needs to be headquartered in the U.S. and have raised at least one equity
financing round from a traditional VC investor (defined as standard fixed-life fund that raised
capital from limited partners). For startups passing these filters, we observe the capital (eq-
uity and debt) they raise both from traditional VCs and from other non-VC investors, such as
corporations, private equity (PE) funds, or mutual funds (see Section 3 for details).
Our focus on VC-backed startups, while undoubtedly restrictive, offers three key advan-
tages. First, it allows us to observe private firm-level and financing-level outcomes that are
7We choose 1992 as the starting point because the coverage of VC financings and investors is poor until then.
7

not systematically available for non-VC-backed private firms, providing a unique window to
study the changes in the private markets that have accompanied the decline in IPOs. Second,
although VC-backed firms make up less than 1% of all privately-held firms (Puri and Zarutskie
(2012)), they have historically been a key player in the IPO market,8 and so they are particu-
larly relevant to analyze the consequences of the decline in IPOs. Third, VC-backed firms also
play an outsized role in the production of innovation (Kortum and Lerner (2000)). Therefore,
understanding the consequences of their response to the weak IPO environment is important,
as these consequences are likely to be felt economy-wide.
We obtain sales and employment information for the firms in our sample from three data
sources. For private firm-years, we rely on VentureSource and the NETS database. For public-
firm years, we rely on Compustat, which we merge to the VC-backed firms in our sample that
go public (we also use Compustat to obtain post-IPO capital-raising data). The combination
of these three data sources gives us a rich time series of employment and sales data for 68% of
the VC-backed firms in our sample.
2 The IPO Decline and the Financing of Late-Stage Startups
In this section, we begin our examination of the changes in the entrepreneurial finance market
that have accompanied the decline in IPOs by analyzing how the financing patterns of VC-
backed startups have evolved since the early 1990s.
2.1 Are startups relying on mergers to continue having access to public
investors?
This study is motivated by the finding in the literature that IPOs have experienced a dramatic
decrease since peaking in 1996 (Doidge, Karolyi, and Stulz (2013); Gao, Ritter, and Zhu (2013)).
However, such a decrease does not necessarily imply that startups no longer have access to the
public-equity markets: If those startups that used to go public were now being acquired by
public firms, the startups would still be able to raise capital from public investors–albeit not
as independent firms.
8Ritter (2017) shows that, over 1980–2016, VC-backed firms accounted for 58% of tech IPOs and 37% of allIPOs.
8

Figure 1 shows the evolution of the exit rates of VC-backed startups over our sample period.
Specifically, for startups that raised their first financing round in 1992-2009, the figure shows
the (stacked) fraction of firms that (1) went public, (2) were acquired, (3) failed, or (4) remained
private in the seven years following that first round.9 Consistent with Doidge, Karolyi, and
Stulz (2013) and Gao, Ritter, and Zhu (2013), we find that IPO exits have been extremely
rare for firms first financed after 2000. Importantly, though, the decline in IPOs has not been
replaced by an increase in acquisitions, which have remained mostly flat throughout our sample
period.10 Instead, Figure 1 shows that the IPO decline has been made up by an increase in the
fraction of startups that remain private - and active - for at least seven years after their first
funding round.
2.2 More private capital is going to late-stage startups
Figure 1 makes it clear that acquisitions have not filled the gap left by the decline in IPOs;
rather, VC-backed startups appear to have found ways to remain private longer than they had
historically done. We now turn to investigating whether the private markets have adapted to
finance these firms’ growth.
For each year from 1992 to 2016, Figure 2 plots the (equal-weighted) average age of startups
raising private capital that year, where age is measured in years from the first-financing date.
After falling during the 1990s from two to just over one year old, the average age of startups
raising private capital more than doubled from 2000 to 2005, staying close to three years old
since then. The increase during the 2000s is even more pronounced if we weigh firm age by the
dollar amount raised (dashed line),11 which suggests more mature firms tend to raise larger
financing rounds.
The evidence in Figure 2 thus suggests that private investors have reacted to the dearth
of IPOs since 2000 by shifting their investments toward late-stage startups. This shift has
allowed these startups to continue financing their growth without relying on the public markets.
9Figure A1 in the Internet Appendix performs a similar analysis measuring exits in the 10 years followingthe first financing round. The conclusions remain unchanged.
10Splitting acquisitions into those made by public and private firms has no material impact on the results (i.e.both types exhibit similar dynamics). Also, if we condition the analysis on firms that exit, then, consistent withFigure 2 in Gao, Ritter, and Zhu (2013), we find that the IPO decline has led to a sharp decline in the fractionof exits that are via IPO and a symmetric increase in the fraction of exits via acquisition. The difference withour Figure 1 is that we do not condition on exits.
11All dollar figures in the paper are in real dollars of year 2009 purchasing power.
9

Moreover, the evidence reinforces the notion that the increasing fraction of private startups
shown in Figure 1 are indeed active firms that continue raising capital.
Figure 3 provides complementary evidence consistent with the hypothesis that private mar-
kets are increasingly supporting the growth of late-stage private startups. For startups that
raised their first round of funding in 1992-2005, the figure shows the average predicted prob-
ability of raising at least seven rounds of private capital in the 11 years following that first
round (90% of startups that raise seven rounds of funding do so in 11 years or less). We esti-
mate predicted probabilities using a linear probability model that includes first-financing-year,
industry, and state fixed effects. Figure 3 shows that for startups first funded in the 1990s,
the average predicted probability of raising seven or more rounds of private capital is 8.1%.
By contrast, for startups first funded after 2000, the average predicted probability of raising
at least seven rounds of funding is 12.4%–53% higher (p = 0.002). Figure A2 in the Internet
Appendix shows that a similar increase has not occurred if we focus on startups’ ability to
raise a second funding round, thus highlighting the fact that the changes in the private capital
markets have been centered on late-stage startups.
2.3 Are private markets able to fund the growth of large startups?
Section 2.2 shows that the decline in IPOs has been accompanied by a shift in the supply of pri-
vate capital toward startups that are on average older and raise late funding rounds. However,
the average startup has never been an IPO candidate–historically, only large and successful
startups have gone public (e.g., Chemmanur, He, and Nandy (2009)). Thus, understanding
the extent to which private investors have been able to fill the gap left by the decline of IPOs
requires an analysis of whether private markets are able to finance the growth of large startups.
We do this next.
2.3.1 Raising large amounts of capital as a private firm
We begin by studying startups’ ability to raise large amounts of capital while remaining private.
For each startup in our sample, we compute the total net capital (both equity and debt) raised
from both public and private sources during the seven years following the firms first financing
round. Specifically, for firms that do not go public during these seven years, our measure of
10

capital includes only capital raised from private investors; for firms that go public, we include
both pre-IPO capital raised from private investors as well as net capital raised at the IPO and
any subsequent follow-on offerings from public investors.
Figure 4 shows that, among startups whose first funding round was prior to 1997, approxi-
mately 80% of those that raised over $150 million in the seven years following that first round
went public.12 There is little doubt that the ability to raise large amounts of public capital was
a key driver in these firms’ IPO decision: in untabulated results, we find that 83% of the total
capital they raised was from public investors at or after the IPO. This finding is consistent with
the notion that before the IPO decline, most successful startups that raised large amounts of
capital did so by going public.
By contrast, the figure shows that of those startups whose first funding round was after 1998
and that went on to raise over $150 million in the following seven years, fewer than 40% relied
on the public markets to do so. Importantly, the total number of firms raising over $150 million
in the mid-2000s cohorts was similar to that of one decade earlier—although that number has
remained below the heights of the late 1990s. The evidence in Figure 4 thus suggests that
private markets have been able to fill at least a substantial part of the gap left by the decline
of IPOs in providing large amounts of capital to the most successful startups.
This conclusion is reinforced by Figure 5, which provides a multivariate and continuous
version of Figure 4. Specifically, Figure 5 examines whether the relationship between the net
amount of capital raised by a firm during the seven years following its first funding round and
the likelihood that the firm is public has changed over time. To do so, we plot the annual
coefficients βt (for t ∈ [1992, 2009]) from the following regression:
Y7it = βt × lnK7it + γt + ηs + θj + εit
where i indexes firms and t indexes the year the firm raised its first funding round. Y7 is an
indicator equal to one if the firm went public during the seven years following its first funding
round; K7 is the net amount of capital raised by the firm during these seven years; and γt, ηs,
12Fewer than 6.5% of our sample firms go on to raise $150 million in the seven years following their first roundof funding, thus making $150 million a natural (if necessarily arbitrary) threshold to identify “large” amountsof capital. Our conclusions are robust to using other thresholds, or to not using a binary threshold at all (seeFigure 5).
11

and θj capture first-funding year, state, and industry fixed effects, respectively.
The figure shows that for firms in the pre-1997 cohorts, there was a strong partial correlation
between the (log) amount of capital the firms raised and their likelihood of being public. Simply
put, as shown in Figure 4, most firms that raised large amounts of capital did so by going public.
Since 1999, this partial correlation has seen a 75% decrease, thus indicating that the fact that
a firm raises a large amount of capital is a much weaker predictor of the likelihood that the
firm is public than it was prior to the IPO peak in 1996. Thus, the growing ability of private
investors to fund large and successful startups with considerable sums of money has made it
much less reliable to use a firms fundraising activity to predict its listing status.
2.3.2 Achieving scale as a private firm: employment and sales
In addition to being able to raise large amounts of capital, are those startups that remain
private able to reach a large scale as measured by real variables such as employment or sales?
To shed light on this question, Figures 6 and 7 present analogous versions of Figures 4 and 5
focusing on employment instead of capital raised; Figures A3 and A4 in the Internet Appendix
do the same for sales.
Figure 6 shows that the decline in IPOs has been accompanied by a marked decline in
the fraction of startups with over 200 employees that are public–but not in the total number
of startups that reach this size, which rebounded strongly after the 2001 recession. Indeed,
less than a third of startups with over 200 employees from the cohorts that raised their first
funding round after 2001 did so by going public, while in the early and mid-1990s this fraction
surpassed 80%. Similarly, Figure 7 shows that the partial correlation between the (log) number
of employees a firm has and the likelihood that the firm is public was cut in four for the 2000s
cohorts relative to the pre-1997 cohorts. Figures A3 and A4 show similar results when we focus
on sales instead of employment.
One common concern about the drop in IPOs since 1997 was that the lack of capital would
not allow private firms to achieve scale and grow. For instance, President Obama noted at the
JOBS Act signing (2012): “For business owners who want to take their companies to the next
level, this bill will make it easier for you to go public. And that’s a big deal because going public
is a major step towards expanding and hiring more workers.” While we cannot rule out the
12

possibility that the decline in IPOs has made it harder for some startups to fund their growth,
the evidence in this section suggests that private investors have filled much–if not all–of the gap
left by the decline in IPOs. By shifting their investments toward late-stage startups, private
investors have been able to provide considerable amounts of capital to successful startups,
enabling them to hire large numbers of employees and achieve high sales volumes. We now
turn to studying the sources of this private capital.
3 Who Are the Private Investors Funding Late-Stage Startups?
Section 2 shows the last two decades have seen a marked increase in the supply of private
capital going to late-stage startups, which has helped fill the gap left by the decline in IPOs.
In this section, we investigate the sources of this private capital.
3.1 VC investors’ role in funding late-stage startups
Traditionally, venture capitalists (VCs) have been a key player in the entrepreneurial finance
market, particularly in funding the kind of high-growth startups that tend to become IPO
candidates (e.g., Kortum and Lerner (2000); Puri and Zarutskie (2012); Gornall and Strebulaev
(2015)). To what extent have VCs driven the growth in the supply of capital going to late-stage
startups over the last two decades? For each year from 1992 through 2016, Figure 8 breaks
down the funds raised by late-stage startups into funds raised from traditional VC investors
and from other non-VC investors. Given our focus on the funders of late-stage startups, the
figure and all other analyses in this section include only startups that are at least four years
old (as elsewhere in the paper, we measure age since the first financing round).13
Consistent with our findings in Section 2, Figure 8 shows a large increase in the amount
of private capital going to late-stage startups, raising from an average $1 billion per year in
1992-1996 to around $10 billion in 2005-2009, and then raising again to an average $23 billion in
2014-2016. Through 2009, both traditional VC investors and less traditional startup investors
such as private equity (PE) funds contributed to this increase to a similar extent. However,
in recent years, non-VC investments in late-stage startups have more than doubled those of
13We choose four years as the age threshold because the average IPO firm prior to the 1996 listing peak wasfour years removed from its first VC financing. Our conclusions are robust to using other thresholds.
13

traditional VCs, with non-VC investments peaking at $30 billion in 2015.
Before investigating who these non-VC investors are, we seek to better understand VCs’
growing tendency to invest in mature startups, reflected both in Figure 8 and in Figures 2
and 3 above. Have VC investors changed their fundraising or investment strategies in order to
increase their investments in late-stage startups? We consider two possibilities. First, overall
VC fundraising could have increased, and VCs could be funneling this additional funds to late-
stage startups. This does not appear to be the case: Figure A5 in the Internet Appendix shows
that the total annual capital raised by VC funds has been largely flat since the years of the
dot-com boom (see also NVCA (2016)).
If total VC fundraising has not changed significantly, then VCs must have changed how
they deploy their capital. The typical VC fund’s agreement with its investors (known as
limited partners, or LPs) has a 10-year life, although it often allows extensions of up to three
years beyond these 10 years. The increase in late-stage investments could then be the result of
VCs supporting their portfolio companies longer, effectively extending their investment horizon
by shifting their investments toward the second half of their fund’s life.
The evidence in Figure 9 is consistent with this explanation. For VC funds raised between
1992 and 2006, the figure shows how old the funds are, on average, when they invest in their
portfolio companies (we measure fund age in years since the fund’s closing date). Given that our
goal is to investigate whether funds from recent vintages make investments later in their lives
to continue supporting their still-private portfolio companies, we limit the sample to follow-on
investments in existing portfolio companies.
The figure shows that the average age at which VC funds make follow-on investments
increased by almost a full year, from 3 to 3.9 years, when comparing funds raised prior to 2000
to those raised after 2000, a 31% increase (p < 0.001). We obtain a very similar pattern if
we compare the predicted (log) ages at which funds make follow-on investments using a linear
regression model that includes fund-vintage-year, industry, and state fixed effects (p < 0.001).
VCs have traditionally been reluctant to invest late in the life of their funds, for fear of
not being able to liquidate their investments before the end of their fund’s life. The results in
Figure 9 show that the decline in IPOs has been accompanied by an apparent decrease in this
reluctance, which has enabled VCs to support their portfolio firms longer than they traditionally
14

had. That said, the shift toward more late-stage investments has not been without its tensions:
As we discuss in Section 5 below, VCs’ liquidity needs have become a growing source of friction
between them and their portfolio companies.
3.2 Non-VC investors’ role in funding late-stage startups
Figure 8 shows that non-VC investors play an increasingly important role in financing late-stage
startups, accounting for over 70% of the capital these startups raised in 2014-2016, the last three
years of our sample. But who are these non-VC investors? Figure 10 breaks them down in four
categories: diversified private equity (PE) funds, corporations making minority investments
in startups, mutual funds, and a fourth category that combines hedge funds and investment
banks. See Table A1 in the Internet Appendix for the names of the investors most active in each
of these categories. (The figure does not show non-VC investors that VentureSource identifies
as “Other,” a catch-all category that includes individuals, family offices, and sovereign wealth
funds, among others.)
Private equity funds have consistently been the largest non-VC investor in late-stage star-
tups, with the aggregate size of their investments increasing by a factor of 4.4 from 1999-2001
to 2014-2016. PE investors thus appear to have gradually diversified their traditional focus on
leveraged buyouts, expanding the amount of capital they allocate to so-called “growth equity”
investments in late-stage startups.
PE funds are followed in order of importance by corporations, with mutual funds and the
combined hedge fund/investment bank category coming in next. The growth in investments
by both mutual funds and hedge funds/investment banks has been particularly stark since the
second half of the 2000s, peaking at a combined $3.3 billion in 2015. This rising importance
of mutual funds as investors in private startups is the focus of recent studies by Chernenko,
Lerner, and Zeng (2017) and Kwon, Lowry, and Qian (2017).
Interestingly, mutual and hedge funds have historically been active IPO investors. The fact
that they are increasingly willing to invest in VC-backed startups while the startups are still
private suggests that mutual and hedge funds would also be willing to invest in these same firms
if the firms were to go public–if anything, to the extent that the firms’ securities would be more
liquid, they should be more willing to do so. The evidence in Figure 10 is thus hard to reconcile
15

with the notion that the decline of IPOs has been driven by public investors’ unwillingness to
bear the risks associated with investing in VC-backed IPO firms.
Have the private investments of non-traditional startup investors been concentrated pre-
cisely on the mature startups captured in Figures 8 and 10, or are these investors now also
investing in younger firms? To shed light on this question, Table 1 investigates the relationship
between a startup’s age and the likelihood that the startup raises capital from non-VC investors
in a given financing round.
The results in column 1 point to a strong relation between the age of a startup when it
raises capital and the fraction of the capital that is supplied by non-VC investors, with each
additional year of age being associated with a 10% increase in the fraction of non-VC capital
(p < 0.001). Column 2 shows this finding is robust to including industry × financing year fixed
effects (instead of simply including industry and financing year fixed effects, as in column 1),
while column 3 shows it is robust to using the financing round number instead of the startup’s
age to proxy for its maturity. In addition, columns 4-6 show that our conclusions are also
robust to estimating a linear probability model where the dependent variable is an indicator
for whether the round includes at least one non-VC investor.
The evidence in Table 1 thus indicates that the increasing role that non-traditional startup
investors play in funding late-stage startups is not part of a broader phenomenon whereupon
these investors have now become major investors in startups of all ages. Rather, they appear
to be concentrating their investments in the kind of late-stage startups that would have been
prime candidates to go public before the IPO decline.
4 What Explains the Growth in the Supply of Private Capital
to Late-Stage Startups?
Sections 2 and 3 demonstrate that private investors–both traditional investors in startups such
as VCs and less traditional investors such as PE funds and mutual funds–have increased their
investments in late-stage startups by a factor of 25 since the mid-1990s. In this section, we
seek to understand some of the drivers of this increase.
Before delving into the analysis, it is important to properly set expectations. Our goal here
16

is not to cleanly identify one factor that can explain all the trends we have documented in
Sections 2 and 3. We doubt such one factor exists–although of course future researchers may
prove as wrong. Instead, we view both the decline in IPOs and the increase in the supply
of private capital to late-stage startups as products of a new entrepreneurial finance market
equilibrium whereby fewer startups rely on the public investors to finance their growth. The
emergence of this new equilibrium has likely been facilitated by a combination of interrelated
supply and demand shifts. In this section, we provide evidence of two such private-market
supply-side changes – one technological and one regulatory – that have contributed to the
growth in the supply of private capital for late-stage startups.
4.1 Technological advances and reduction of search costs
Technological advances such as the Internet have reduced search costs (Kahle and Stulz (2016))
and made it easier for startups and investors to find each other without relying on personal
connections or centralized exchanges.14 This change has decreased the relative advantage of
stock markets as centralized marketplaces where firms and investors without a personal rela-
tionship can meet. At the same time, technology – primarily the Internet and growth of mobile
– has facilitated the communication between firms and investors, helping investors monitor
distant firms even when they cannot rely on the governance and disclosure regulations that
public firms must follow.
In this section, we ask whether there have been any changes to the geographic distance
between investors and their portfolio companies. Lower search costs should make it easier to
invest in more distant startups. Measuring the distance between a lead investor (i.e. largest
capital supplier in a financing) and startup is straightforward. We compute the distance in
miles between the startup’s headquarters and that of the lead investor(s), using the closest of
the latter to the startup if there are more than one. This calculation is a noisy approximation
of true distance as it ignores the role that say direct flights (e.g. see Bernstein, Giroud, and
Townsend (2016)) may play in making an otherwise distant destination in fact close in time.
Has this distance changed over the roughly 25-year sample period?
14According to the Pew Research Center, Internet use among American adults went from 14% in 1995 to52% in 2000, 68% in 2005, 76% in 2010, and 88% in 2015. Source: http://www.pewinternet.org/2014/02/
27/part-1-how-the-internet-has-woven-itself-into-american-life/andhttp://www.pewinternet.org/
fact-sheet/internet-broadband/.
17

To address this question, we regress distance between lead investor and startup on a trend
variable and a series of startup financing controls (i.e. industry, state, and round number fixed
effects). Columns (1) and (2) of Table 2 show that on average, there has been no statistically
significant change over time in this distance. However, when we consider the subset of late-
stage financings – again proxied by age greater than four years old – a clear increasing trend
emerges.15 The coefficient implies a 3% increase in the distance between investor and startup
per year or roughly 500 mile increase over 10 years for the average pair. Consistent with the
notion that the rise in the supply of private capital has been accompanied by a reduction
in investors’ search and arm’s length monitoring costs, the mean distance between late-stage
startups and their lead investors has been on an increasing trend since 1992. There is some
evidence that non-VC investors – which Figure 8 shows have played a key role in driving
the increase in the supply of capital to late-stage startups – have exhibited a larger increase
in distance, though we lack the power to show a statistical difference. Thus, these private
investors appear to be increasingly able and willing to invest in late-stage startups with whom
they do not have a close geographical (or personal) connection.
4.2 Regulatory changes affecting private firms
Technological changes that impact the cost of search are not the only change to the private
capital markets that could drive patterns observed thus far. The early 2000s saw a number of
major regulatory changes in the public-equity marketsmost notably, Regulation Fair Disclosure
in 2000, the Sarbanes-Oxley Act of 2002, and the 2003 Global Settlement. Several public
commentators have argued that these changes increased the cost of being public, particularly
for small- and medium-sized public firms, and were a key driver of the decline in IPOs (see, e.g.,
Zweig (2010); Weild (2011)). However, both Gao, Ritter, and Zhu (2013) and Doidge, Karolyi,
and Stulz (2013) conclude that such regulatory changes cannot explain the IPO decline. In
particular, Doidge et al. write that their “results make it possible to reject the hypothesis
that the regulatory changes of the early 2000s caused the decrease in small-firm IPO activity
because it became abnormally low before these changes took place” (p. 549). One source of
change has yet to be explored in the finance literature (to our knowledge) and should have
15The results hold with a full sample estimation and interaction of “older than 4 years” and the trend control.
18

direct implications on the size and cost of private capital.
4.2.1 Deregulating and unifying the private capital markets
A few years before these changes affecting public firms discussed above were adopted, several
regulatory changes affecting private firms made it easier for firms and their investors to raise
capital. The changes followed the October 1996 passage of the National Securities Market
Improvement Act (NSMIA) signed by-then President Clinton. The NSMIA emerged in an era
of often competing and sometimes conflicting state and federal securities rules. The securities
regulations – often called ‘blue sky laws’ – can cover mutual funds, IPOs, investment advisors
and startups. Former SEC Chairman J. Armstrong Sinclair presents one particularly negative
view of the securities laws prior to the NSMIA passage (Armstrong (1958)):
The ’blue sky’ laws had come to have a special meaning–a meaning full of complex-
ities, surprises, unsuspected liabilities for transactions normal and usual–in short, a
crazy-quilt of state regulations no longer significant or meaningful in purpose, and
usually stultifying in effect, or just plain useless.
In 1996, then-SEC chairman Arthur Levitt argued to Congress for change to this patchwork
of regulations:16
The current system of dual Federal-State regulation is not the system that Congress-
or the [SEC]–would create today if we were designing a new system. While securities
markets today are global, issuers and securities firms still must register many se-
curities offerings in 52 separate jurisdictions; satisfy a multitude of separate books
and records requirements; and bear the substantial costs of compliance with the
overlapping requirements.
The NSMIA was an attempt to create security regulation uniformity at the federal level
and improve capital access overall. In this section, we summarize the components of this law
change that impacted the cost and availability of private capital.
16Securities Investment Promotion Act of 1996: Hearings on S. 1815 Before the Senate Comm. on Banking,Housing and Urban Affairs, 104th Cong. 32 (1996), statement of Arthur Levitt, Chairman U.S. Securities andExchange Commission
19

Federal preemption for (small) issuers
Consider a hypothetical startup seeking outside capital for a new investment. Given the
riskiness and uncertainty of the opportunity, it has to raise outside equity financing. Several
existing regulations apply in this setting. Passed in 1982, Regulation D amended the Securities
Act of 1933 to lower barriers for this company’s private capital offerings and remove burdensome
registration requirements faced by public firms. Registration requires both extensive financial
disclosures and rules on firm governance. States’ blue-sky laws often added an additional layer
of regulation because many did not allow the same exemptions as the SEC, thus negating
their value. If a startup sought capital across many state lines, then additional regulatory
complexity emerged because each state could have different disclosure and registration rules.
States attempted to create some uniformity in their securities regulation through the Uniform
Securities Act (1958, 1985) and the Uniform Limited Offering Exemption (ULOE, 1983). The
ULOE in particular sought to coordinate state laws with Regulation D and was eventually
adopted in some form by 27 states. However, several legal scholars (e.g. Maynard (1987),
Denos (1997) and Campbell Jr. (1998)) argue that this law did little to create uniformity.
These features of the regulatory regimes at the state and federal-level introduced a relatively
larger burden on small, private issuers.17
The passage of the NSMIA allowed some federal provisions for private security and fund
registration exemptions to preempt any related regulation in each state where they raised
capital.18 Specifically, the Act “preempts state securities law in certain areas long burdened
by duplicative regulation by both federal and state governments” (Denos (1997), pp 101). In
particular, the Act made it easier for firms to raise capital from investors in different states.
If investors or startups raised capital with “covered securities” from “qualified purchasers”
(e.g. institutions or accredited investors), then the NSMIA exempted those sales from state
regulations, registration or review of the offerings merits. Covered securities are those sold
under rule 506 of Reg. D; a rule that allows unlimited capital raises so long as all the purchasers
are accredited investors. Rule 506 is the most popular exemption used by issuers (Ivanov and
Bauguess (2013)) and used by most private equity funds raising capital. Insofar as this Act
17Even large, registered securities struggled to deal with multiple state blue sky rules. For example, Applecould not sell securities from its 1980 IPO to buyers in 20 US states (Denos (1997)).
18See NSMIA section 102(a), 15 U.S.C - section 77r(a) (West Supp. 1997) (amending Securities Act of 1933section 18).
20
simplified or eliminated a patchwork of regulations faced by issuers, then it should lower issuers’
cost of capital. Investors – particularly those who seek to invest in securities in multiple states
– should in turn, experience more investment opportunities due to the lower regulatory and
transaction costs.
Investment Company Act of 1940 (3(c)(1) and 3(c)(7))
NSMIA also changed some regulations faced by private equity funds through changes to
the Investment Company Act of 1940. The Act regulates companies that “engage primarily
in business of investing and reinvesting in securities of other companies” (Loss, Seligman, and
Paredes (2017), pp 47-8). Open-end (mutual funds) and closed-end funds are common examples
of entities regulated by this Act. As with the securities regulations discussed above, this Act
sets out registration exemption rules, here applied to investment companies. Registration
involves disclosure about investment positions and policies concerning borrowing, lending, new
issuances, etc. It also triggers possible changes in board of director structure, rules on affiliated
transactions and limitations of the use of leverage. Upon registration, these companies are
further required to file financial statements at least semi-annually. Registration rules and
exemptions to it were a major component of the Act.
In 1996, section 3(c)(7) and 3(c)(1) of Investment Company Act were added and amended,
respectively. The former amendment removed the registration requirement for funds that
privately sold stakes to only qualified purchasers.19 The amendments to 3(c)(1) clarified and
reduced the scope of “beneficial owners” that could trigger registration for funds who do not sell
publicly.20 Private equity and venture capital firms use these new exemptions when managing
funds. For example, they must file a Form ADV to request either exemption type above and
provide details supporting their claim.21 In fact, 38% of the 3900 VC funds with Form ADVs
request a 3(c)(7) exemption, while the use of this exemption is also strongly and positively
19It is still the case that (pre-2012) these companies would have to register their shares if they had more than499 investors of any type.
20Prior to the NSMIA, funds with 100 or fewer investors were excluded from registering as investment com-panies under the Investment Company Act. However, the rules for what counted as an investor was “overlybroad and extremely confusing” according to a report from SEC’s Division of Investment Management (Secu-rities, Commission, et al. (1992) report, pp 108). This amendment narrowed the set of entities that counted asinvestors and thus could lead to fewer funds exceeding the limit.
21Using the Form ADV filings of VC funds from the SEC website, we find that all funds use either the 3(c)(1)or 3(c)(7) exemption. The bulk of the 3900 funds (72%) use the latter. Some 5% of funds report having morethan 100 investors. These funds have an average size of $450m compared to $62m for VC funds with fewer than100 investors.
21

correlated with fund size. These facts are central to our identification strategy below. Combined
with the private placement preemption from NSMIA, these amendments to the Investment
Company Act should have had real impacts on the number and size of private equity funds.22
4.2.2 Connection to the private equity and IPO markets
The federal preemption of blue sky laws following the passage of NSMIA removed a large
set of regulatory requirements on small issuers, which include both operation companies (i.e.
our startup example) and funds. Both types could now rely on federal exemptions if they
sold securities or stakes in their funds to qualified purchasers. Thus, NSMIA should increase
the availability of capital for all private issuers, particularly those that sought capital across
state lines. Notwithstanding the blue-sky provisions, the regulatory changes in the Investment
Company Act impacted investment firm fund-raising capabilities both on the intensive and
extensive margin. The smaller set of investors that count against beneficial owner cap that
trigger registration should have lowered the barrier to raising a new fund. For existing funds
that sought increase their size, the qualified purchaser exemption – effectively allowing an
unlimited number of such investors – would make it much easier for funds to raise larger and
larger funds.
While the NSMIA appears to have received little attention among finance scholars, several
legal scholars and practitioner-oriented publications have argued that it played a first-order
role in facilitating private firms’ access to capital (e.g., Denos (1997); Campbell Jr. (1998);
Cox (2013); Badway, Horn, McCoy, Reid, and Romaszewski (2016)). For instance, writing
of NSMIA and other regulatory changes affecting the private-equity markets, de Fontenay
(2017) notes that “the liberalization of the rules for selling and trading private securities is
arguably the most significant development in securities regulation of the last thirty years, but
the empirical literature on the decline of public equity has largely overlooked it. This is a
critical and surprising omission, because the changes to the private side of securities regulation
bear directly on a company’s decision to go public” (p. 466).
Importantly, unlike the early 2000s regulatory changes affecting public firms which took
22Legal scholars (e.g. Greupner (2003)) argue that the main beneficiary of these changes to the InvestmentCompany Act were hedge funds. These funds relied on the 3(c)(1) exemption prior to 1996 and often faced the100 shareholder constraint. They could now rely on 3(c)(7).
22

place after the IPO decline began, the NSMIA was signed into law in late 1996, coinciding
with the U.S. listing peak as measured by Doidge, Karolyi, and Stulz (2017). While this fact
in no way proves that the NSMIA was the one cause of the IPO decline – and we do not claim
(or believe) it was – it does indicate that the timing of the NSMIA adoption makes it at least
possible that it was one of the factors contributing to this decline.
4.3 The Impact of NSMIA on VC and PE funds
Did this regulatory change and increased uniformity of securities laws impact VC and PE
fundraising and thus provide an explanation for the growth in late-stage capital? To address
this question, we study the real fund size of newly raised funds closed around October 1996.
The less stringent investor cap for forced registration and the lowering of barriers to raising
capital across state lines implied that new funds should – all else equal – be larger after the law
change. However, this increase in size should not hold uniformly across fund types. Investing
firms that manage smaller funds that say invest in early-stage IT firms, likely never hit the one
hundred investor mark and could presumably find sufficient capital in one or two U.S. states.
On the other hand, investing firms that seek out larger, late-stage investments are the most
likely to benefit from this change for the opposite reason. Such funds were more likely to be
near (or above) the pre-1996 cap or had a demand to seek a wider set of investors to achieve the
desired scale of the fund. This intuition leads us to estimate a difference-in-difference estimator.
We consider VC and PE funds raised in the years surrounding the NSMIA passage: 1994–
1998. The first difference is motivated by the discussion above and compares large vs. small
funds identified by the fund type in VentureSource, Preqin and Pitchbook or by characterizing
their investments. Using either the fund classification in each database (e.g. “Early stage VC”,
“Mezzanine”, “Growth Equity” or “Later stage VC”) or the fraction of observed investments in
later-stage financings, we separate funds into early and late stage. The latter will be considered
the set of treated funds. Of course, comparing fund size changes around the law change is
limited by the fact that all U.S. funds regardless of size were impacted by the passage of
NSMIA. Therefore, we introduce a sample of non-U.S.-headquartered VC and PE funds from
Pitchbook, each classified at early or late-stage funds as discussed above. Changes in these
funds’ size provide an alternative counter-factual for the U.S. market. This additional data
23

results in 142 non-US funds.
A treated fund is either one headquartered in the U.S. or in our main specification, a U.S.
fund that primarily makes late-stage investments. For VC funds, late stage funds typically
make first-time investments in a startup on or after its Series C, while most PE funds such
as buyout or mezzanine are all late-stage investors.23 Late-stage funds are indeed larger than
their early-stage peers. In the sample of U.S. funds over the 1994–1998 sample period, the
average size of the late stage fund is $173m versus $81m for non-late-stage funds. The post
period are all funds raised in the two years after October 1996. Table 3 presents the results.
The analysis begins with a difference-in-difference comparing the log of real fund size of
U.S.-based and non-U.S. based funds. Here we ignore fund type and focus on the immediate
effect of the deregulation. Controls include quarter fixed effects (many funds closed in Q4),
industry fixed effects24 and fund sequence (i.e. number) fixed effects. Column 1 shows that
US-based funds – of all sizes – grew at a relatively faster rate after the passage of NSMIA
compared to those outside the US. Column 2 of Table 3 presents the within-U.S. difference-in-
difference results where we compare late-stage funds to other fund types. The interaction term
- “Post X Late stage” – has the expected positive sign and implies a 45% relative increase in
fund size for U.S.-based late-stage funds in the post period. The dummy “Late stage” has the
expected sign as well.
The era under study here includes years close in time to the IT boom era of 1998–2000 (we
end in 1998), so a reasonable concern is that the results are somehow driven by this growth. So
long as the IT boom was a global phenomenon, then the inclusion of non-US late-stage funds
is an adequate counter-factual (column (1)). Moreover, there is a priori no reason why the
Internet boom would have differentially affected late-stage funds, particularly once we control
for fund industry fixed effects. Nonetheless, column 3 excludes all funds with an IT focus with
little change in results. Similarly, we repeat the analysis of column (2) using the non-U.S.
fund sample in column (4) and find no economic or statistically significant change in fund size.
The final column of Table 3 presents results using the underlying fraction of investments that
23When using investment histories to identify stage-preferences, it is crucial that we consider only first-timeinvestments. Follow-on investments in late-stage financings are made by early-stage investors.
24Industry is identified either by the fund’s classification in the original data source or by characterizingthe most popular industry in which it invested. Industries are “Business/Consumer/Retail”, “Healthcare”,“Information Technology” and “Other.”
24
are late-stage (i.e. post Series B). The results are unchanged, suggesting that the proxy for
late-stage is robust. Overall, the passage of the NSMIA appears to have allowed VC and PE
funds investing in late-stage startups – startups at stages typically considering an IPO – to
raise larger amounts of capital.
5 Is Staying Private a Second-Best Response to or Driving the
Lack of IPOs?
The evidence in the prior sections points to the emergence of a new equilibrium in the en-
trepreneurial finance market in which the gap left by the decline of IPOs has been filled – at
least in part – by an increase in the supply of private capital to late-stage startups. In this
section, our goal is to investigate whether the emergence of this equilibrium follows from lack of
demand from the public markets for late-stage startup offerings, or whether these firms could
still go public but are instead choosing to stay private.
To shed light on this question, we present two complementary types of analysis. We begin
by analyzing the cross-sectional characteristics of those firms that are more likely to stay
private, with a focus on understanding the role that founders’ bargaining power plays on the
exit decision. Having found that, in the cross-section, an increase in founder equity increases
a startup’s likelihood of staying private, we go on to show that the IPO decline over the last
twenty years has been accompanied by a time-series increase in founder bargaining power.
5.1 Lower demand for IPOs?
Can a lack of public equity investor demand for IPOs be to blame for the fall in IPOs? In the
case of the VC-backed startup, the evidence presented here suggests not. Some of the most
important players in IPO offering – mutual funds, hedge funds and large institutional investors
– have increased their participation in late-stage VC investments. Such investments are at least
as risky and certainly less liquid than comparable investments in public equities. Thus, it does
not appear that a lack of public equity investor demand is a first-order explanation for the lack
of IPOs.
25

5.2 The effect of founder equity on the exit decision
For startups’ decision to stay private to drive the dearth of IPOs rather than being a response
to public markets becoming less welcoming to them, it needs to be the case that startups
decision-makers prefer to stay private. The literature has long recognized that staying private
allows founders to retain control of their firms (e.g., Boehmer and Ljungqvist (2004); Boot,
Gopalan, and Thakor (2006); Helwege and Packer (2009)), which leads many founders to have
a preference for delaying, or avoiding altogether, an IPO. Consistent with this view, Brau
and Fawcett (2006) survey of CFOs shows that the main reason why firms stay private is
their managers desire to preserve control.25 If the private markets can better fund their firms’
growth, then founders will face less pressure to go public.
By contrast, investors’ preferences, particularly in the case of early investors such as VCs,
are often quite different. VC funds have a fixed lifecycle (typically, 10 years) at the end of
which the funds must be liquidated and the proceeds paid back to investors–ideally in cash or
liquid securities. In addition, VCs derive considerable reputational benefits from taking their
portfolio firms public (e.g., Gompers (1996); Gompers and Lerner (1996), which can help them
attract new investors–and fees–to their next fund. For these reasons, VC investors often have a
preference for taking their successful portfolio companies public. Indeed, many of the features
in convertible preferred stock purchased by VCs are structured explicitly to align the exit type
and investment horizon of the founder and investor (e.g. see Hellmann (2006) and Kaplan and
Stromberg (2004)). Such contract features include redemption rights (i.e. puts) and forced
conversion to common equity in the case of an IPO. Overall, the decision whether and when
to go public is a central conflict between VCs and founders.
These differing exit preferences often give rise to conflicts between the founders and investors
of successful startups, which will ultimately be resolved in favor of the party that has decision-
making control when an IPO becomes a possibility. In order to test this prediction, Table 4
examines how a founder’s equity stake early in her startup’s life affects the startup’s eventual
exit probability. By measuring founder equity early in the startup’s life, we avoid capturing a
mechanical correlation between the startup’s financing and exit decisions and the equity owned
25Snap’s recent March 2017 IPO saw an extreme version of this demand for control, with the firm offeringonly non-voting shares in its IPO. Of course, it remains to be seen whether this will be a one-off occurrence orthe beginning of a new trend.
26

by the founders later in the firm’s life. Of course, founder equity still remains endogenous even
when measured years before an IPO becomes a possibility; we will address this endogeneity
using an instrumental variable (IV) approach.
Before discussing our findings in Table 4, it is important to ensure that a founder’s equity
stake is positively correlated with the degree of control of the startup’s major decisions–such
as exit decisions–the founder has, as this assumption is implicit in our Table 4 analysis. To do
so, we use data from VentureSource and VC Experts. We find that a founder’s equity stake
is negatively correlated with standard measures of investor control, such as the likelihood that
the investor has any board voting rights early in the startups life (p = −.11) and the number of
non-executive board members 2 to 3 years later (p = −.22 and −.23, respectively). Moreover,
higher equity stakes of founders in the early years is negatively correlated with redemption
rights (i.e. puts for the investor) and participation rights for VCs. Both contract terms are
important levers of control for investors.
Table 4 (Panel A) presents the OLS estimation of a regression where the dependent variable
is equal to one if the startup had an IPO within 7 years of its first financing. “Founder’s
equity stake” is one minus the total as-if-common equity sold to investors in the first financing
event. Controls include the log of total capital raised in seven years along with fixed effects
for state, year founded and industry. Column 1 in Table 4 begins by showing that the OLS
partial correlation between founder equity and a startup’s probability of exit is positive. The
coefficient suggests a one standard deviation increase in first-year founder equity (19%) results
in an 8% increase in the probability of an IPO. This finding is not surprising, as founder
equity is likely to be positively correlated with unobserved startup quality, while higher quality
startups are more likely to be able to have a successful exit, all else equal. Column 2 introduces
the instrument variable.
Our instrumental variable identification strategy exploits state-year variation in the supply
of venture capital stemming from variation in the assets of state pension funds (Gonzalez-
Uribe (2014); Bernstein, Lerner, Sorensen, and Stromberg (2016)). The instrument relies
on the fact that state pensions are an important source of capital for VC investors, these
investors prefer to invest in local VCs and finally, that their allocation choices are not driven
by individual startup investment opportunities. Satisfying the exclusion restriction requires
27

that the level of state-year pension assets impact a startup’s IPO probability only through
founder equity. First, research shows that major LPs such as these pension funds tend to
overweight their portfolios to local investments, which suggests they are not responding to
investment opportunities (Hochberg and Rauh (2012)). Second, there is a large distance in
time between the pension funds allocation decision and the VC’s investment in the startup.
On the one hand, this attenuates the first stage, but more importantly, it suggests any pension
fund manager’s allocation choice is quite removed from predictions about future exit markets.
Column 2 of Table 4 shows the reduced form relationship between the instrument and our
dependent variable. The negative sign goes in the direction of our hypothesis: more capital
available to startups increases founder bargaining power and leads to fewer, slower exits. Next,
column 3 presents the first stage results. It shows startup founders that raise their first VC
round in state-years when the assets of the state’s pension funds are high, have a higher equity
stake (after controlling for the capital raised). As predicted, more capital invested by major
LPs has a “money chasing deals” impact on entrepreneurial bargaining power (e.g. Gompers
and Lerner (2000)). The F-statistic is reassuringly high at 17.
The final column of Table 4 shows the second stage estimates with the instrumented founder
equity stake. In contrast to the estimates in column 1, the instrumented equity predicts a
negative casual effect on IPO probabilities. The magnitudes imply that a 1% increase in
founding equity leads to an economically meaningful 1.8 percentage points fall in the probability
of an IPO in seven years. Overall, this cross-sectional evidence demonstrates a real conflict
between investor exit preferences and those of founders. Panel B of the same table repeats
the analysis for a more general dependent variable that is one if the startup had an IPO or
successful acquisition in seven years. A successful acquisition is one that has a reported price
that is at least two times total capital invested into the startup. The results are unchanged.
5.3 Has the decline in IPOs coincided with an increase in founder control?
The evidence in Section 5.2 opens the door to the possibility that the decline in IPOs over the
last 20 years may have been driven – at least in part – by a concurrent increase in founder
control. Indeed, if more founders are in a position to influence their firms’ exit decisions, we
should see fewer firms going public as they use their control to stay private. The patterns
28

of first-time financing founder equity stakes shown in Figure 11 suggests that this proxy for
founder bargaining power has indeed changed over the sample period.
The figure reports the average fraction of equity held by founders as of the first round of
financing (or end of first year if there is more than one financing event) across all startups
with data available. The average was between 50-55% until 1999 and dropped significantly
in the post-dot com era. By 2007 the average equity position had returned to the 2000 peak
and since has reached over 65%.26 Figures A6 and A7 in the Internet Appendix show similar
patterns for founder equity 3 and 5 years after first financing, demonstrating real persistence
in this proxy. Figure 12 further reinforces the notion that founders’ control over exit decisions
has increased over time. Specifically, the figure shows that the presence of redemption features
in VC contracts, which can be used by investors to force an exit – or, at least, force startups
to buy them out – has experienced a sharp decline since the early 2000s. Figure 12 also shows
that participation – often coupled with forced conversion to equity for large IPO events – has
also become less popular over the last 15 years. In sum, the collection of time trends in founder
bargaining power combined with the IV results in Table 4 help reinforce a demand-driven
explanation for fewer IPOs.
The reasons driving the documented increase in founders’ bargaining power are again likely
to be multi-faceted, and a full analysis of these reasons falls beyond the scope of our paper.
We have provided some evidence that alternative investors in the late-stage capital market are
playing an increasingly active role in venture capital. Their increased activity and additional
changes to the investment choices of VCs by supporting older startups was preceded by the
deregulation of private markets through the passage of NSMIA. As most VC financing is staged
over multiple rounds, lower cost of late-stage capital should increase early-stage founder bar-
gaining power through either a positive capital supply shock or through lower financing risk
(e.g. Nanda and Rhodes-Kropf (2016)). Other changes are also likely at play. The decreasing
search costs – driven by technological change and the freeing of information – makes these
non-traditional investors more likely to invest in startups. The technological change has also
decreased startups’ capital requirements early in their life-cycle – when uncertainty is highest
26For the more recent years of our sample period, these equity first round equity stakes are almost certainlya lower bound. The rapid growth in the use of convertible notes and other convertible debt instruments, whichresult in zero founder dilution at first financing, would increase these equity positions.
29

and thus capital is most expensive (Ewens, Nanda, and Rhodes-Kropf (Forthcoming)) – which
has been found to increase founder equity stakes in the early stages. Although we cannot iso-
late one dominant mechanism, the evidence presented does show that startups are most likely
staying private by choice of both founders and their investors, rather than because of a lack of
access to public markets.
6 Conclusion
We provide the first rigorous evidence that the lack of IPOs has not hindered U.S. startups’
ability to finance their growth, as some scholars and policymakers had feared. President Obama
at JOBS Act signing (2012):
For business owners who want to take their companies to the next level, this bill
will make it easier for you to go public. And that’s a big deal because going
public is a major step towards expanding and hiring more workers. It’s a big deal
for investors as well, because public companies operate with greater oversight and
greater transparency.27
We show that the first “big deal” (going public is a major startup towards expanding and
hiring) is perhaps not such a big deal any more as firms appear to be able to raise plenty
of capital while private. Since 1999, private firms are able to raise large sums of capital and
reach scale in terms of sales or employment at rates that were historically only available to
their public counterparts. These changes coincide with increased activity of non-traditional
investors in venture capital such mutual funds, hedge funds and private equity investors.
The collection of evidence about private capital markets provided here is not the smoking
gun that the literature has sought to explain the decline of the US IPO markets. However,
we do show strong evidence that several mostly contemporaneous changes – regulatory and
technological – have led to a new equilibrium where fewer firms are going public. The role
of changes to the private capital markets (rather than direct costs of being a public firm)
highlighted here can help explain some of the conflicting results about the impact of the JOBs
Act on IPOs (e.g. Dambra, Field, and Gustafson (2015) and Chaplinsky, Hanley, and Moon
27Remarks by the President at JOBS Act Bill Signing, April 5th, 2012.
30

(2017)). Importantly, our results strongly point to the fact that this new equilibrium is not
an inferior equilibrium that has come about by some unfortunate freeze of the IPO market.
Rather, many firms appear to be choosing to stay private longer and thriving in this new
equilibrium.
Staying private longer or avoiding the IPO has some possible negative consequences for
investors. For example, the lack of IPOs has implied a substantial change in the degree of
oversight and transparency under which some of the most ‘successful’ firms in our economy now
operate. Recent managerial issues in companies such as Uber28 and Theranos29 demonstrate
that managerial entrenchment or weak governance is one potential downside to the increased
founder bargaining power.
28See https://www.nytimes.com/2017/08/10/technology/travis-kalanick-uber-lawsuit-benchmark-capital.html.
29See https://www.wsj.com/articles/theranos-has-struggled-with-blood-tests-1444881901.
31

References
Armstrong, J Sinclair, 1958, The blue sky laws, Virginia Law Review 44, 713.
Badway, Ernest E., Joshua Horn, Benjamin H. McCoy, Sean F. Reid, and Sandra A. Ro-
maszewski, 2016, Private equity and hedge funds: Regulatory analysis and structural
overview, White paper.
Bernstein, Shai, Xavier Giroud, and Richard R Townsend, 2016, The impact of venture capital
monitoring, The Journal of Finance 71, 1591–1622.
Bernstein, Shai, Josh Lerner, Morten Sorensen, and Per Stromberg, 2016, Private equity and
industry performance, Management Science 63, 1198–1213.
Boehmer, Ekkehart, and Alexander Ljungqvist, 2004, On the decision to go public: Evidence
from privately-held firms, Working paper.
Boot, Arnoud WA, Radhakrishnan Gopalan, and Anjan V Thakor, 2006, The entrepreneur’s
choice between private and public ownership, The Journal of Finance 61, 803–836.
Brau, James C, and Stanley E Fawcett, 2006, Initial public offerings: An analysis of theory
and practice, The Journal of Finance 61, 399–436.
Campbell Jr., Rutheford B, 1998, The impact of NSMIA on small issuers, The Business Lawyer
pp. 575–589.
Chaplinsky, Susan, Kathleen Weiss Hanley, and S Katie Moon, 2017, The JOBS Act and the
costs of going public, Journal of Accounting Research.
Chemmanur, Thomas J, Shan He, and Debarshi K Nandy, 2009, The going-public decision and
the product market, The Review of Financial Studies 23, 1855–1908.
Chernenko, Sergey, Josh Lerner, and Yao Zeng, 2017, Mutual funds as venture capitalists?
Evidence from unicorns, Working paper.
Cox, James D, 2013, Who can’t raise capital-The Scylla and Charybdis of capital formation,
Kentucky Law Journal 102, 849.
32

Dambra, Michael, Laura Casares Field, and Matthew T Gustafson, 2015, The JOBS act and
IPO volume: Evidence that disclosure costs affect the IPO decision, Journal of Financial
Economics 116, 121–143.
de Fontenay, Elisabeth, 2017, The deregulation of private capital and the decline of the public
company, Hastings Law Journal 68, 445.
Denos, Kenneth I, 1997, Blue and gray skies: The National Securities Markets Improvement
Act of 1996 makes the case for uniformity in state securities law, Utah L. Rev. p. 101.
Doidge, Craig, G Andrew Karolyi, and Rene M Stulz, 2013, The us left behind? Financial
globalization and the rise of IPOs outside the U.S., Journal of Financial Economics 110,
546–573.
, 2017, The U.S. listing gap, Journal of Financial Economics 123, 464–487.
Ewens, Michael, Ramana Nanda, and Matthew Rhodes-Kropf, Forthcoming, Cost of experi-
mentation and the evolution of venture capital, Journal of Financial Economics.
Gao, Xiaohui, Jay R Ritter, and Zhongyan Zhu, 2013, Where have all the IPOs gone?, Journal
of Financial and Quantitative Analysis 48, 1663–1692.
Gompers, Paul, and Josh Lerner, 1996, The use of covenants: An empirical analysis of venture
partnership agreements, The Journal of Law and Economics 39, 463–498.
, 2000, Money chasing deals? The impact of fund inflows on private equity valuation,
Journal of financial economics 55, 281–325.
Gompers, Paul A, 1996, Grandstanding in the venture capital industry, Journal of Financial
economics 42, 133–156.
Gonzalez-Uribe, Juanita, 2014, Venture capital and the diffusion of knowledge, Working Paper.
Gornall, Will, and Ilya A Strebulaev, 2015, The economic impact of venture capital: Evidence
from public companies, Working paper.
Greupner, Erik J, 2003, Hedge funds are headed down-market: A call for increased regulation?,
San Diego L. Rev. 40, 1555–1649.
33

Hellmann, Thomas, 2006, IPOs, acquisitions, and the use of convertible securities in venture
capital, Journal of Financial Economics 81, 649–679.
Helwege, Jean, and Frank Packer, 2009, Private matters, Journal of Financial Intermediation
18, 362–383.
Hochberg, Yael V, and Joshua D Rauh, 2012, Local overweighting and underperformance:
Evidence from limited partner private equity investments, The Review of Financial Studies
26, 403–451.
Ivanov, Vladimir, and Scott Bauguess, 2013, Capital raising in the U.S.: An analysis of unreg-
istered offerings using the Regulation D exemption, 2009-2012, US Securities and Exchange
Commission White Paper.
Kahle, Kathleen, and Rene M Stulz, 2016, Is the U.S. public corporation in trouble?, NBER
Working Paper.
Kaplan, Steven N, and Per Stromberg, 2004, Characteristics, contracts, and actions: Evidence
from venture capitalist analyses, The Journal of Finance 59, 2177–2210.
Kortum, Samuel, and Josh Lerner, 2000, Assessing the contribution of venture capital to inno-
vation, RAND Journal of Economics 31, 674–692.
Kwon, Sungjoung, Michelle Lowry, and Yiming Qian, 2017, Mutual fund investments in private
firms, Working paper.
Loss, Louis, Joel Seligman, and Troy Paredes, 2017, Fundamentals of securities regulation
(Wolters Kluwer).
Maynard, Therese H, 1987, Uniform limited offering exemption: How uniform is uniform–An
evaluation and critique of the ULOE, Emory Law Journal 36, 357.
Nanda, Ramana, and Matthew Rhodes-Kropf, 2016, Financing risk and innovation, Manage-
ment Science 63, 901–918.
NVCA, 2016, National venture capital association 2016 yearbook, Discussion paper, .
34

Puri, Manju, and Rebecca Zarutskie, 2012, On the life cycle dynamics of venture-capital-and
non-venture-capital-financed firms, The Journal of Finance 67, 2247–2293.
Ritter, Jay, 2017, Initial public offerings: Updated statistics, Working paper.
Securities, Exchange Commission, et al., 1992, Protecting Investors: A Half-Century of Invest-
ment Company Regulation (Commerce Clearing House).
Weild, David, 2011, How to revive small-cap IPOs, Wall Street Journal.
Zweig, Jason, 2010, The demise of the IPO–and ideas on how to revive it, Wall Street Journal.
35

7 Figures and Tables
Figure 1: Exit status by year of first VC financing
For startups that raised their first financing round in 1992-2009, the figure shows the (stacked) fraction ofstartups that (1) went public, (2) were acquired, (3) failed, or (4) remained private during the seven yearsafter their first financing. (E.g., for firms that raised their first financing round in 2000, we measure exits asof 2007. We observe exits through 2016, so ending the sample of first financing rounds in 2009 allows us toobserve seven full years of exits for all firms.) We ensure those startups we identify as “Still Private” havenot failed by using VentureSource’s failure information, complemented with manual searches; in addition,we conservatively code as failed any startup that has not raised capital in five years. The sample includesall VC-backed startups described in Section 1.
36

Figure 2: Age of startups raising private capital
For each year from 1992 to 2016, this figure reports the average age of startups raising private capitalthat year, where age is measured in years from the first-financing date. We show both an “equal-weighted”average, which averages the age of all startups that raise funding each year, and a “dollar-weighted” average,where we weigh firm age by the dollar amount raised (in real 2009 USD). Our definition of private capitalincludes both traditional VC investors and non-VC investors such as corporations, PE funds, or mutualfunds investing in private firms; see Section 3 for further details.
37

Figure 3: Probability of raising at least seven financing rounds
For startups that raised their first round of financing in 1992-2005, the figure shows the average predictedprobability of raising at least seven rounds of private capital in the 11 years following the startup’s firstfinancing round, alongside the 95% confidence interval of these averages (90% of startups that raise sevenrounds of funding do so in 11 years or less). We estimate predicted probabilities using a linear probabilitymodel that includes first-financing-year, industry, and headquarter state fixed effects.
38

Figure 4: Raising large amounts of capital as a private firm
The figure reports the number of startups that raised at least $150m (in real 2009 USD) seven years aftertheir first round of financing, split into two groups. “Private” is the count of firms that satisfy this criteriathat were still private (i.e. no IPO, failure or acquisition) seven years after their first financing. “Public” arethe set of firms that went public within seven years of their first financing event. The capital is a cumulationof both that raised as a private firm (here, from private equity investors) and post-IPO offerings for thosefirms that went public. Data from VentureSource and Compustat are used to aggregate the capital raised.
39

Figure 5: Year fixed effect estimates for relationship between capital raised in seven years andIPO probability
The figure plots the coefficient estimates (and their 95% confidence intervals) from the follow regression:
Y7it = βt × lnK7it + γt + ηs + θj + εit
where i indexes firms and t indexes the year the firm raised its first funding round. Y7 is an indicator equalto one if the firm went public during the seven years following its first funding round; K7 is the net amountof capital raised by the firm during these seven years; and γt, ηs, and θj capture first-funding year, state,and industry fixed effects, respectively. The dependent variable is one if the startup had an IPO within 7years of its first financing event. Robust standard errors are used to construct the 95% confidence intervals.
40

Figure 6: Number of firms raising with at least 200 employees seven years after first financing:public vs. private
The figure reports the number of startups that had at least 200 employees seven years after their first roundof financing (measured using VentureSource, NETs and Compustat), split into two groups. “Private” isthe count of firms that satisfy this criteria that were still private (i.e. no IPO, failure or acquisition) sevenyears after their first financing. “Public” are the set of firms that went public within seven years of theirfirst financing event. The employee count is measured either as a private firm or public firm, seven yearsafter first financing.
41

Figure 7: Year fixed effect estimates for number of firms with at least 200 employees sevenyears after first financing: public vs. private
The figure plots the coefficient estimates (and their 95% confidence intervals) from the follow regression:
Y7it = βt × lnK7it + γt + ηs + θj + εit
Here, the dependent variable is one if the startup had an IPO within 7 years of its first financing event.The coefficients of interest are the γs on the interaction of year first financing and the lnE7i log of totalemployees as of seven years since first capital raised. si and Ii are state and industry fixed effects respectivelyand the ρt are fixed effects for the year of first financing. Robust standard errors.
42

Figure 8: Capital provided by venture capital and non-venture capital investors to startupsfour years and older
The figure presents the sum of total capital raised in each financing year (in 2009 dollars) for startups atleast four years old, measured since their first financing. The dashed line aggregates the capital investedby traditional VC investors. The green bars present the difference between the VC contributions and totalcapital invested, which is capital contributed by non-traditional investors. Capital in a financing is split asdescribe in Section 1.
43

Figure 9: Venture capital fund age at financings
The figure presents the average age of funds when they make follow-on investments. Funds are pooled intotheir vintage years. That is, for each follow-on investment made by a VC funds, we take the mean of theage of the fund at the time of each investment. We then average this number across all funds in the vintageyear. The sample stops in 2006 to allow funds time to make 10 years of investments.
44

Figure 10: Breaking down non-VC investors in late-stage startups
Notes: The figure breaks down the capital numbers provided in Figure 8 by each category of non-VCinvestor. “Corp.” are either corporations making direct investors or their venture capital arms. “Div.PE” include a wide assortment of growth equity funds, mezzanine and traditional private equity investors.“Hedge/Inv. bank” include hedge funds and investment banks. The excluded group here is “Other,” whichis a catchall from VentureSource that include LPs, family offices, soverign wealth funds and individuals.All dollars in 2010 dollars.
45
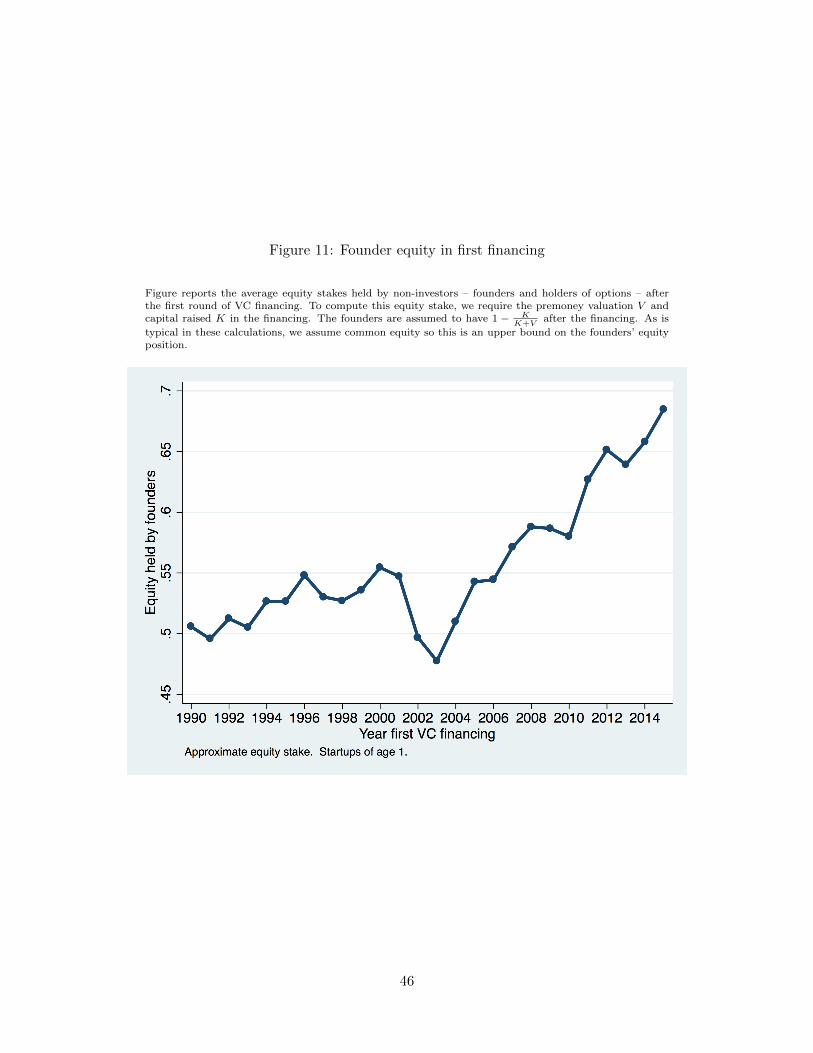
Figure 11: Founder equity in first financing
Figure reports the average equity stakes held by non-investors – founders and holders of options – afterthe first round of VC financing. To compute this equity stake, we require the premoney valuation V andcapital raised K in the financing. The founders are assumed to have 1 − K
K+Vafter the financing. As is
typical in these calculations, we assume common equity so this is an upper bound on the founders’ equityposition.
46

Figure 12: First round contract features over time: redemption and participation rights
Figure reports the fraction of first round financings that have one of two contract features. The first isredemption, which provides the purchasing preferred shareholders a time-dependent put option (effectively)on the startup. The second is “Participation” which provides the preferred shareholder a combination ofdownside protection and upside potential along with a provision for forced conversion to common equity ifa large enough liquidation value is reached.
47

Table 1: Capital raised from non-VCs over startup’s lifecycle
The table presents financing-level OLS regressions where the dependent variable is the fraction of capitalprovided in a financing round (columns 1-3) or a dummy variable that is one if a financing has at least onenon-VC investor. The variable “Log firm age (yrs.)” is the log of the number of years since the startup’sfirst VC financing event at the time of the current financing. “Log round #” is the log of the financingnumber. “Log raised ($m)” is the log of total capital raised in the financing (in 2009 dollars) and “Logsyndicate size” is the log of the number of investors in the financing. “Year FE” are fixed effects for thefinancing year, “Industry FE” are fixed effects for the startup’s industry and “State FE” are fixed effects forthe startup’s headquarter state (US only). Robust standard errors clustered at the startup in parentheses.Significance: ∗ p < 0.10, ∗∗ p < 0.05, ∗∗∗ p < 0.01.
(1) (2) (3) (4) (5) (6)% non-VC % non-VC % non-VC Had non-VC? Had non-VC? Had non-VC?
Log firm age (yrs) 0.103∗∗∗ 0.105∗∗∗ 0.091∗∗∗ 0.093∗∗∗
(0.002) (0.002) (0.003) (0.003)Log round # 0.117∗∗∗ 0.101∗∗∗
(0.003) (0.003)Log raised ($) 0.034∗∗∗ 0.033∗∗∗ 0.032∗∗∗ 0.030∗∗∗ 0.029∗∗∗ 0.029∗∗∗
(0.001) (0.001) (0.001) (0.002) (0.002) (0.002)Log syndicate size -0.112∗∗∗ -0.109∗∗∗ -0.111∗∗∗ 0.136∗∗∗ 0.138∗∗∗ 0.137∗∗∗
(0.003) (0.003) (0.003) (0.003) (0.003) (0.003)Constant 0.646∗∗∗ 0.470∗∗∗ 0.474∗∗∗ 0.765∗∗∗ 0.606∗∗∗ 0.611∗∗∗
(0.044) (0.043) (0.043) (0.045) (0.044) (0.044)
Financings 75410 75410 75410 75410 75410 75410R2 0.092 0.099 0.097 0.113 0.118 0.116
Year FE Y Y Y Y Y YIndustry FE Y Y Y Y Y YIndustry X Year FE N Y Y Y Y YState FE Y Y Y Y Y Y
48

Table 2: Distance between investors and startups over time
The table reports OLS regressions where the dependent variable is the log of the number of miles betweena startup and its lead investors in a financing round. The distance is measured from the startup’s USheadquarters to the investor’s headquarter (or nearest headquarter if more than one listed). The unit ofobservation is a startup-investor pair. Columns (1) includes all financings where we can measure distance.Column (2) includes only financings where startups are less than years years since their first financing.Column (3) consider those that are more than 4 years since their first financing. The last two columnsconsider the sample of column (3), split by rounds with and without VC-investors. The variable “Yeartrend” is trend from 1992 - 2014. The fixed effects are as defined in Table 1. Significance: ∗ p < 0.10, ∗∗
p < 0.05, ∗∗∗ p < 0.01.
(1) (2) (3) (4) (5)All Age < 4 Age ≥ 4 Age ≥ 4
Non-VCs VCs
Year trend 0.001 -0.005 0.029∗∗∗ 0.029∗∗∗ 0.012(0.005) (0.006) (0.008) (0.011) (0.012)
Constant 4.889∗∗∗ 5.114∗∗∗ 6.547∗∗∗ 4.759∗∗∗ 3.878∗∗∗
(0.385) (0.418) (0.886) (1.030) (0.481)
Observations 34092 28032 6060 2975 3085Startups 16795 16017 3488 2133 2096R2 0.054 0.045 0.048 0.069 0.054
Industry FE Y Y Y Y YState FE Y Y Y Y YRound # FE Y Y Y Y Y
49

Table 3: Changes in VC fund size after NSMIA passage
The table reports OLS regressions of fund size on a series of controls. The dependent variable is the log ofVC fund size in 2009 dollars. The date of fund close is identified using the first official close date of thefund. Includes all funds with vintage years 1994 - 1998 (two years on each side of the law change). “Latestage fund” is a dummy variable equal to one if the fund has an above sample median fraction of firsttime investments after the Series B round or is explicitly listed as a late stage or buyout fund. That is, wetake the fraction of a funds first investments in each startup and create a variable that is one if that firstfinancing is a Series C or above. If a large fraction of the fund’s investments – compared to the averagefund – are in these later round financing, then we assume it is a late-stage investor. “U.S. fund” is oneof the fund is headquartered in the US. Column (1) compares all U.S. funds to non-U.S. funds. Column(2) considers the sample of U.S. early and late-stage funds, while Column (3) considers the same sampleexcluding funds investing in information technology. Column (4) repeats the estimation of Column (2) forthe non-U.S. sample (i.e. a placebo). The last column replaces the dummy variable for late stage with itsunderlying continuous counterpart. “Vintage Year FE” are fixed effects for the fund’s vintage year (thuswe exclude the “Post” variable). “Fund seq. FE” are fixed effects for the fund sequence (e.g. 1st or 4thfund). Robust standard errors reported in parentheses. Significance: ∗ p < 0.10, ∗∗ p < 0.05, ∗∗∗ p < 0.01.
(1) (2) (3) (4) (5)Late vs. early Non-IT
All U.S. U.S. Non-US U.S.
Post X U.S. fund 0.426∗
(0.239)Post X late stage fund 0.373∗∗ 0.466∗ -0.025
(0.178) (0.257) (0.423)Late stage fund 0.493∗∗∗ 0.635∗∗∗ 0.815∗∗
(0.137) (0.185) (0.360)Post X % Post Series B 0.700∗∗∗
(0.162)% late stage 0.539∗∗∗
(0.202)US fund -0.072
(0.204)Constant 3.863∗∗∗ 3.569∗∗∗ 3.709∗∗∗ 3.135∗∗∗ 3.770∗∗∗
(0.161) (0.190) (0.184) (0.368) (0.151)
Observations 918 714 390 152 714R2 0.08 0.17 0.16 0.11 0.15Avg. late-stage fund size 173.14 195.10 145.69Avg. non-late fund size 81.69 85.91 60.84
Vintage Year FE Y Y Y YFund industry FE Y Y Y YFund seq. FE Y Y Y Y
50

Table 4: Effect of founder equity on exit outcomes: instrumental variables
The table reports OLS and 2SLS regression estimates of the relationship between startup exits and early-stage founder equity. Panel A considers the dependent variable that is equal to one if the startup had anIPO within seven years of its first VC financing event. “Founder’s equity stake” is the first round equitystake (defined in Figure 11). “Total pension assets (t)” are the startup’s state pension assets in the yearof the firm’s first financing event (in trillions USD, 2009 dollars). “Total capital raised (log, m)” is thetotal capital raised by the startup within seven years of first financing. Column (1) and (2) present OLSregression estimates, while column (3) presents the first stage estimates of a regression of founder equityon the pension assets instrument. The final column presents the IV estimates or second stage. Panel Bconsiders the alternative dependent variable that is one if the startup had either an IPO or a successfulacquisition (sold for at least 2X capital invested) within seven years of its first VC financing. “Firm foundingyear FE” are fixed effects for the startup’s founding year and all other fixed effects as defined in Table 1.Standard errors clustered at the state. Significance: ∗ p < 0.10, ∗∗ p < 0.05, ∗∗∗ p < 0.01.
Panel A:IPO in 7 years(1) (2) (3) (4)
IPO in 7 IPO in 7 Founder % IPO in 7OLS OLS First stage 2SLS
Founder’s equity stake 0.038∗ -1.823∗∗∗
(0.021) (0.678)Total pension assets (t) -0.218∗∗∗ 0.120∗∗∗
(0.051) (0.028)Total capital raised (log, m) 0.056∗∗∗ 0.053∗∗∗ -0.096∗∗∗ -0.123∗
(0.006) (0.004) (0.004) (0.069)Constant -0.132∗∗∗ -0.012 0.887∗∗∗ 2.046∗∗
(0.018) (0.020) (0.025) (0.805)
Observations 10440 10440 10440 10440R2 0.203 0.205 0.329 .1st stage F-stat 17.73
(1) (2) (3) (4)Panel B:IPO or quality Acq. in 7 years
IPO/Acq. in 7 IPO/Acq. in 7 Founder % IPO/Acq. in 7OLS OLS First stage 2SLS
Founder’s equity stake 0.049∗∗ -1.478∗∗
(0.020) (0.717)Total pension assets (t) -0.177∗∗∗ 0.120∗∗∗
(0.062) (0.028)Total capital raised (log, m) 0.055∗∗∗ 0.050∗∗∗ -0.096∗∗∗ -0.092
(0.006) (0.005) (0.004) (0.072)Constant -0.144∗∗∗ -0.029 0.887∗∗∗ 1.613∗
(0.020) (0.021) (0.025) (0.848)
Observations 10440 10440 10440 10440R2 0.173 0.174 0.329 .1st stage F-stat 17.73State FE? Y Y Y YFirm founding year FE? Y Y Y YFinancing year FE? Y Y Y YIndustry FE? Y Y Y Y
51

8 Internet Appendix
Figure A1: Exit status by first VC financing year, 10 years after first financing: IPO, acquisi-tions, failures and still private
The figure reports the fraction of firms that have exited or remain private for each first financing yearcohort. Startups that fail to raise a new round of capital five years after their last observed financing (as of2016Q4) are set to failures. The exit state is measured here ten years after the firm’s first financing eventfor each cohort (e.g. for 1998 firms, we ask what fraction exited in what way in 2008). Sample includes allstartups described in Section 1.
52

Figure A2: Probability a startup raised at least 2 financings by year of first financing
The figure plots the first financing year fixed effects from the following cross-sectional regression where aunit of observation is a startup:
Yi = β0 + si + Ii +
2005∑t=1992
ρt
The dependent variable is a dummy that is equal to one if the startup had a second round of financingas of the end 2016. The figure plots the coefficients ρt – the year first financing variable – and the 95%confidence interval (robust standard errors). Controls include industry and state fixed effects.
53

Figure A3: Number of firms raising with at least $100m in sales seven years after first financing:public vs. private
The figure reports the number of startups that had at least $100m in sales seven years after their first roundof financing (measured using VentureSource, NETs and Compustat), split into two groups. “Private” is thecount of firms that satisfy this criteria that were still private (i.e. no IPO, failure or acquisition) seven yearsafter their first financing. “Public” are the set of firms that went public within seven years of their firstfinancing event. Sales are measured either as a private firm or public firm, seven years after first financing.
54

Figure A4: Year fixed effect estimates for relationship between seven year total sales and IPOprobability
The figure plots the coefficient estimates (and their 95% confidence intervals) from the follow regression:
Y7it = βt × lnS7it + γt + ηs + θj + εit
where i indexes firms and t indexes the year the firm raised its first funding round. Y7 is an indicator equalto one if the firm went public during the seven years following its first funding round; S7 is log of totalsales for the firm during these seven years; and γt, ηs, and θj capture first-funding year, state, and industryfixed effects, respectively. The dependent variable is one if the startup had an IPO within 7 years of itsfirst financing event. Robust standard errors are used to construct the 95% confidence intervals.
55

Figure A5: Total capital raised in VC funds: 1990 - 2016
The figure reports the total amount of capital raised in U.S.-based VC funds (in 2009 dollars).
56

Figure A6: Founder equity three years after first financing
The figure reports the average equity stakes held by non-investors – founders and holders of options –three years safter the first round of VC financing. To compute this equity stake, we require the premoneyvaluation V and capital raised K in the financing. The founders are assumed to have 1 − K
K+Vafter the
financing, where each new financing event dilutes their equity stake. As is typical in these calculations, weassume common equity so this is an upper bound on the founders’ equity position.
57

Figure A7: Founder equity five years after first financing
The figure reports the average equity stakes held by non-investors – founders and holders of options –five years safter the first round of VC financing. To compute this equity stake, we require the premoneyvaluation V and capital raised K in the financing. The founders are assumed to have 1 − K
K+Vafter the
financing, where each new financing event dilutes their equity stake. As is typical in these calculations, weassume common equity so this is an upper bound on the founders’ equity position.
58

Table A1: Most active non-VC investors
The table reports the top seven investors in each non-VC investor category as proxied by total investmentsfrom 1987 - 2015. “Year first inv.” is the year the investor first is first observed in VentureSource duringthis sample period.
Investor Total deals Year first inv.
Diversified Private EquityOak Investment Partners 964 1987Norwest Venture Partners 787 1987JPMorgan Partners 727 1987Battery Ventures 672 1987Highland Capital Partners 629 1988Morgenthaler Ventures 582 1987Sprout Group 558 1987
Hedge fund / Investment bankGoldman Sachs Group Inc. 357 1988Allen & Co. LLC 180 1987RBC Capital Markets Corp. 118 1992Soros Fund Management LLC 106 1992Morgan Stanley 102 1998China Development Industrial Bank 101 1996Deutsche Banc Alex. Brown 98 1987
CorporationsIntel Capital 1291 1988Google Ventures 382 2008Johnson & Johnson Innovation 331 1988Shea Ventures 253 1987SR One Ltd. 249 1987Cisco Systems 248 1992Motorola Solutions Venture Capital 219 1988
Public sec./Univ./SBICStanford University 351 1987Comdisco Ventures 349 1988Oxford Finance LLC 316 1992Affinity Capital Management 170 1995Novus Ventures 165 1994AVI Management Partners 147 1987Two Rivers Associates 111 1987
OtherManagement 315 1997Silicon Valley Bank 293 1997Wilson Sonsini Goodrich & Rosati Corp. 177 1987Northgate LLC 89 2005T. Rowe Price Group Inc. 73 1996Citigroup Inc. 72 1996MMV Capital Partners 62 2005
59