Embed Size (px)
Citation preview

he Evolution of World Income Inequality: Assessing the Impact of Globalization
Andrés Solimano
T
S
E
R
I
E
macroeconomía del desarrollo
Santiago, Chile. December 2001
11
Economic Development Division

This paper was prepared by Andrés Solimano, Regional Adviser, Economic Commission for Latin America and the Caribbean (ECLAC). Comments by Carol Graham, André A. Hofman and José Antonio Ocampo are appreciated.
The views expressed in this document, which has been reproduced without formal editing, are those of the author and do not necessarily reflect the views of the Organization.
United Nations Publication LC/L.1686-P ISBN: 92-1-121342-8 ISSN: 1680-8843 Copyright © United Nations, December 2001. All rights reserved Sales No.: E.01.II.G.124 Printed in United Nations, Santiago, Chile Applications for the right to reproduce this work are welcomed and should be sent to the Secretary of the Publications Board, United Nations Headquarters, New York, N.Y. 10017, U.S.A. Member States and their governmental institutions may reproduce this work without prior authorization, but are requested to mention the source and inform the United Nations of such reproduction.

CEPAL - SERIE Macroeconomía del desarrollo N° 11
3
Contents
Abstract............................................................................................. 5 I. Introduction............................................................................... 7 II. Concepts of Inequality: International, National xxxxxxx
and World Inequality............................................................... 9 III. Evolution of World Income Inequality: Historical xxxxx
and Recent Evidence ............................................................ 11 A. Regional Disparities, 1870-2000 period............................. 11 B. The second half of the 20th Century .................................. 13 C. Rising Inequality with Unweighted Gini’s ......................... 14 D. International Inequality with Weighted Gini’s: xxxxxxx
The Case of China and India .............................................. 16 E. World Inequality................................................................. 18 F. Main Results ....................................................................... 18
IV. The Links Between Globalisation and World xxxxxxx Inequality ................................................................................. 21 A. Static convergence in factor prices..................................... 21 B. Dynamic convergence in per capita income growth .......... 22 C. Within-Country Income Distribution ................................. 23
V. Historic and Econometric Evidence on the Impact xxxx of Globalisation in World Inequality................................. 25 A. Historical and Recent Evidence.......................................... 25 B. Inequality during the first wave of globalisation: 1870-1913 ... 25 C. The De-Globalisation, 1914-1950 period........................... 27 D. The Second half of the 20th Century: Golden Age xxxxxxx
and the Second Wave of Globalisation .............................. 27 E. Econometric Evidence ........................................................ 29 F. Globalisation and Wage Inequality at National Level........ 30

The Evolution of World Income Inequality: Assessing the Impact of Globalization
4
VI. Main Findings and Conclusions.............................................................................. 33 References................................................................................................................................ 37 Serie Macroeconomía del desarrollo, issues published.............................................. 41
Tables
Table 1 Levels of GDP per capita and Interregional Spreads, 1000-1998..............................12 Table 2 Shares of World GDP, 1000-1998..............................................................................13 Table 3 GDP per capita Performance in the Three Most Successful Phases
of the Capitalist Epoch ...............................................................................................28
Figures
Figure 1 Unweighted International Inequality, 1950-1998..................................................... 15 Figure 2 Gini Point Contributions to Concept 1 Inequality, 1960-1998 ................................ 15 Figure 3 Unweighted International Inequality II, 1950-1998 ................................................. 16 Figure 4 Weighted International Inequality, 1950-1998......................................................... 17 Figure 5 Weighted International Inequality without China and India .................................... 17 Figure 6 Global Inequality of Individual Incomes, 1820-1992............................................... 19 Figure 7 Changes in Trade and Changes in Inequality ........................................................... 32

CEPAL - SERIE Macroeconomía del desarrollo N° 11
5
Abstract
In the last two centuries (1800-2000) the world has seen an unprecedented increase in the capacity to create material wealth and undergo technical change. At the same time, this is also a period of large disparities in income per head, living standards across (and within) countries and regions of the world. Large inequalities can eventually undermine global integration and social stability thus hampering long run growth prospects and the legitimacy of globalization.
Global inequalities reflect both inequalities across nations, driven mainly by divergences in economic performance (e.g. growth rates) across countries that cumulate over time and by national inequality that depend on factor prices, patterns of resource ownership and other factors. Policies to reduce global inequalities have to focus in raising growth rates of poorer countries, improve income distribution at national level and facilitate some global redistribution to low-income nations.


CEPAL - SERIE Macroeconomía del desarrollo N° 11
7
I. Introduction
The last millennium of world economic history can be divided in two major periods according to the joint evolution of global growth and global inequality:
a) From 1000 to 1800 there was a period of slow growth in per capita income and material progress with no spectacular increases in living standards but also without large apparent inequalities across countries.
b) In contrast, in the last two centuries (1800-2000) the world has seen an unprecedented increase in the capacity to create material wealth and undergo technical change (particularly the 20th Century). At the same time, this is also a period of large disparities in income per head, living standards across (and within) countries and regions of the world.1
The age of globalisation promises global prosperity. However this is also an age of large inequalities that can eventually undermine global integration and stability thus hampering long run growth prospects (an extension of the “inequality is bad for growth “ argument to a global level). Interestingly, as we will see below, part of the widening in wage inequality coinciding with globalisation takes place within industrialized countries, where the most vocal anti-globalisation voices are heard.
1 See Maddison (2001) for a long run analysis documenting these long run trends in GDP growth and inequalities.

The Evolution of World Income Inequality: Assessing the Impact of Globalization
8
Global inequalities reflect both inequalities across nations, driven mainly by divergences in economic performance (e.g. growth rates) across countries that cumulate over time and by national inequality that depend on factor prices, patterns of resource ownership and other factors.
The last 130 years or so of world economic history provides an extremely rich period to address the relationship between economic integration, economic growth, convergence and divergence and global inequality. In this period two waves of globalisation can be distinguished: the first wave of globalisation or liberal era of 1830-1910. This is an era of increased international trade, high capital mobility under the gold standard, massive international migration between Europe and the “New World”. The “second wave of globalisation” since the mid 1970s with a move towards more open trade regimes, particularly in developing countries, a sharp increase in international financial intermediation under flexible exchange rates and a general stance toward more market-oriented economic policies in both industrialized, post-socialist and developing countries. In between the two waves of globalisation, we find a period of “de-globalisation” between 1913 and around 1950 characterized by two world wars, high inflation and instability in the 1920s in Europe and the great depression of the 1930s. All these events fragmented economic and political relations across countries leading to de-globalisation. In turn, from about 1950 to the early 1970s a period of rapid growth and less inequalities has been identified as a “golden age of capitalism”2, in a policy-framework of international stabilization and regulation, macroeconomic activism and the welfare state. These two periods provide a contrast to the two globalisation waves of late 19th Century and late 20th Century.
Using this historical background of the two waves of globalisation and interim periods along with recent empirical and econometric studies on economic openness, growth, and convergence the paper address several questions around the relationship between increased economic integration (e.g. globalisation) and world inequality.
The paper is organized in 5 sections besides this introduction. Section 2 analyses different concepts of “global” inequality distinguishing between international, national and world inequality and the various determinants of each concept of inequality. Section 3 provides different pieces of empirical evidence that document the rise in global inequalities both since 1870 and throughout the 20th Century, focusing in the evolution of regional disparities and world income inequality in these periods. Section 4 establishes key analytical links between economic integration, factor price equalization and growth and section 5 reviews various econometric studies about the relationship between economic openness, growth and convergence and between international trade and wage inequality at national level. Section 6 summarizes the main findings of the paper and offers concluding remarks.
2 See Marglin and Schor (1991) and Maddison (2001).

CEPAL - SERIE Macroeconomía del desarrollo N° 11
9
II. Concepts of Inequality: International, National and World Inequality
In studying “ global” inequality we need a clear concept of what type of inequality we are discussing.3 An important distinction is between international inequality and world inequality.
The concept of international inequality refers to inequality across countries due to differences in per capita income among them. This concept of inequality takes as the unit of analysis, countries (nations) and, implicitly, omits intra-country income differences among its citizens. There are several methodological considerations involved in cross-country comparisons of per capita income: the exchange rates used in the comparisons (observed or purchasing power parity), the source of income data (survey-based or national accounts), etc. An important methodological issue, relevant for assessing the empirical recent evidence on the evolution of international inequality is how to weigh countries to compute an index of international inequality. One procedure —unweighted international inequality— is to assume that all countries count equally (in an analogy, a sort of UN General Assembly concept in which one country is one vote). Another concept is to weigh countries by population —weighted international inequality. Here a more populous country
3 An excellent analysis of various concepts of global inequality appear in Milanovic( 2001). A discussion on the economic and
philosophic underpinnings of the concept of inequality appears in Solimano (1999) and Solimano, Aninat and Birdsall (2000).

The Evolution of World Income Inequality: Assessing the Impact of Globalization
10
(e.g. China) counts more than a small country (e.g. Luxembourg) when making inferences about the welfare level of the “representative individual” in the world economy.
Another concept is world inequality. Here the unit of analysis is the citizen of the world rather than countries. The concept of world inequality treats, in principle, all individuals in the world the same and ranks them from the poorest to the richest, regardless their country of origin (Milanovic, 2001). An index of world inequality can be decomposed as the sum of international (between countries) inequality plus national (within country) inequality plus an overlapping component or residual (Yitzhaki, 1994).
In other words, the distribution of income (welfare) of an individual of the world is the outcome of distributional patterns within the country he/she lives and the distribution of income of his/her country with respect to other countries (plus the overlapping term or residual).
National inequality, say the dispersity of the distribution of income within a country, provide the bridge between international and world inequality. The determinants of international inequality are the forces generating different rates of growth across countries that, over time, generate (important) differences in per capita income, living standards and levels of development across nations. In turn, national inequality depend on factor prices, ownership of productive resources within countries, demographic patterns, technical change and macroeconomic cycles. Of course, several of these factors can affect also international inequality.

CEPAL - SERIE Macroeconomía del desarrollo N° 11
11
III. Evolution of World Income Inequality: Historical and Recent Evidence
In recent years there has been an increasing interest in measuring and understanding global inequalities. One effort led by Maddison and associates is oriented to construct internationally comparable figures of GDP at international dollars, national accounts and other socioeconomic indicators for the world economy. Maddisson’s research span to the last millennium or before. Another line of research is to construct indices of world income distribution for the 19th and 20th Century based on per capita GDP figures combined with dispersion measures for individual and group of countries. Those results are presented in a recent study by Bourgignon and Morrison (2002). Then an effort at constructing measures of international and world income distribution based on household income (or expenditure) surveys has been undertaken by Milanovic (1999, 2001), at the World Bank.
A. Regional Disparities, 1870-2000 period
Maddison (2001), using comparable data of GDP across countries and over time in Purchasing Power Dollars, reports a steady increase in inter-regional inequalities since 1870 and throughout the 20th Century. His measure of regional dispersion is the ratio of income per head of the richest to the poorest region of the world

The Evolution of World Income Inequality: Assessing the Impact of Globalization
12
(see table 1). This ratio shows a steady rise from around 5:1 in 1870 to 9:1 in 1913, to 15:1 in 1950 and to 19:1 in 1998. The only decline in regional inequality is between 1950 and 1973 from 15:1 to 13:1; that is, during the period of the “golden age of capitalism”. The rapid growth and technical progress of the last century and a half has been accompanied by rising inequality in the world economy, at least between top and bottom in the distribution of world GDP.
Table 1 LEVELS OF GDP PER CAPITA AND INTERREGIONAL SPREADS, 1000-1998
(1990 international dollar)
1000 1500 1820 1870 1913 1950 1973 1998
Western Europe 400 774 1 232 1 974 3 473 4 594 11 534 17 921 Western offshoots 400 400 1 201 2 431 5 257 9 288 16 172 26 146 Japan 425 500 669 737 1 387 1 926 11 439 20 413 Asia (excluding Japan) 450 572 575 543 640 635 1 231 2 936 Latin America 400 416 665 698 1 511 2 554 4 531 5 795 Eastern Europe & former USSR 400 483 667 917 1 501 2 601 5 729 4 354 Africa 416 400 418 444 585 852 1 365 1 368 World 435 565 667 867 1 510 2 114 4 104 5 709
Inter-regional spreads 1.1:1 2:1 3:1 5:1 9:1 15:1 13:1 19:1
Source: Maddison, The World Economy. A Millennial Perspective. Development Centre Studies, Organization for Economic Cooperation and Development (OECD), (2001).
The evidence portrayed in tables 1 and 2 (drawn from Maddison, 2001) for the period
1870-1998 shows a complex pattern of convergence and divergence across regions of the world during this period. Some of the stylised facts are the following:
1. The distribution of world GDP shifted dramatically towards the “western offshoots “ (U.S, Canada, Australia, New Zealand) between 1870 and 1950; in fact while the share of global GDP of these countries was 10.2% in 1870 it increased to 30.6 in 1950 —a 300% rise over an 80-years-period. In 1998 that share declined to 25.1%. However, in terms of GDP per capita these nations have been historically, since the 18th and 19th Century the group of richest economies in the world.
2. Western Europe had the largest share of world income until 1913 but the two world wars and the turbulence of the interwar period and slower relative growth thereafter led to a decline in its share in the world economy which reached to around 20% in 1998 down from 33.6% in 1870; in any case, western European income per head levels are still among the highest of the world.
3. Latin America increased it share in the world GDP from 2.5% in 1870 to 8.7% in 1998. However, the increase in the relative position of Latin America in the world economy stopped in the 1970s. Thereafter, the growth performance of the Latin American region has been below its historical record and its income share remained virtually constant during the last quarter of the 20th Century (see table 2).
4. Africa maintained its relative share in world GDP more or less constant at around 3.0 to 3.5% during the period 1870-1998. This is the region with the lowest average level of per capita income and living standards in the world economy due to persistently weak economic performance.
5. Asia experienced a steady decline in its share of world GDP from 1870 to 1950; then it increased slightly until 1973 and exploded after 1973 due to super performance in
CEPAL - SERIE Macroeconomía del desarrollo N° 11
13
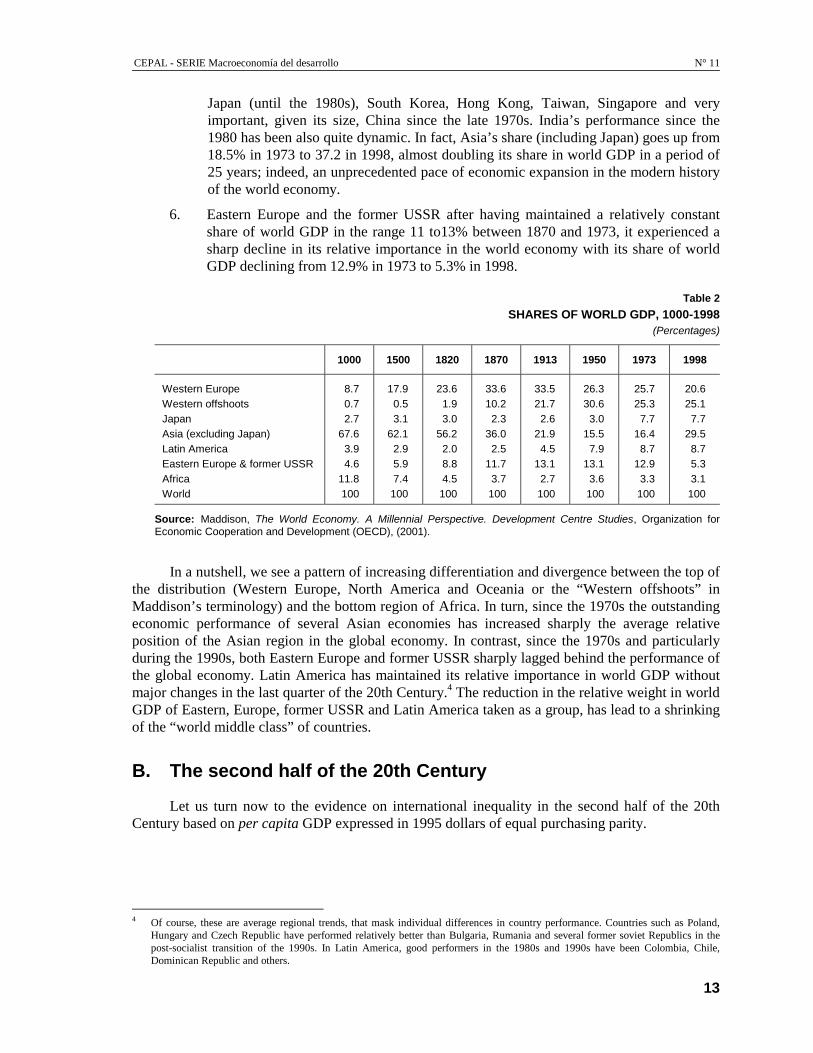
Japan (until the 1980s), South Korea, Hong Kong, Taiwan, Singapore and very important, given its size, China since the late 1970s. India’s performance since the 1980 has been also quite dynamic. In fact, Asia’s share (including Japan) goes up from 18.5% in 1973 to 37.2 in 1998, almost doubling its share in world GDP in a period of 25 years; indeed, an unprecedented pace of economic expansion in the modern history of the world economy.
6. Eastern Europe and the former USSR after having maintained a relatively constant share of world GDP in the range 11 to13% between 1870 and 1973, it experienced a sharp decline in its relative importance in the world economy with its share of world GDP declining from 12.9% in 1973 to 5.3% in 1998.
Table 2
SHARES OF WORLD GDP, 1000-1998 (Percentages)
1000 1500 1820 1870 1913 1950 1973 1998
Western Europe 8.7 17.9 23.6 33.6 33.5 26.3 25.7 20.6 Western offshoots 0.7 0.5 1.9 10.2 21.7 30.6 25.3 25.1 Japan 2.7 3.1 3.0 2.3 2.6 3.0 7.7 7.7 Asia (excluding Japan) 67.6 62.1 56.2 36.0 21.9 15.5 16.4 29.5 Latin America 3.9 2.9 2.0 2.5 4.5 7.9 8.7 8.7 Eastern Europe & former USSR 4.6 5.9 8.8 11.7 13.1 13.1 12.9 5.3 Africa 11.8 7.4 4.5 3.7 2.7 3.6 3.3 3.1 World 100 100 100 100 100 100 100 100
Source: Maddison, The World Economy. A Millennial Perspective. Development Centre Studies, Organization for Economic Cooperation and Development (OECD), (2001).
In a nutshell, we see a pattern of increasing differentiation and divergence between the top of the distribution (Western Europe, North America and Oceania or the “Western offshoots” in Maddison’s terminology) and the bottom region of Africa. In turn, since the 1970s the outstanding economic performance of several Asian economies has increased sharply the average relative position of the Asian region in the global economy. In contrast, since the 1970s and particularly during the 1990s, both Eastern Europe and former USSR sharply lagged behind the performance of the global economy. Latin America has maintained its relative importance in world GDP without major changes in the last quarter of the 20th Century.4 The reduction in the relative weight in world GDP of Eastern, Europe, former USSR and Latin America taken as a group, has lead to a shrinking of the “world middle class” of countries.
B. The second half of the 20th Century
Let us turn now to the evidence on international inequality in the second half of the 20th Century based on per capita GDP expressed in 1995 dollars of equal purchasing parity.
4 Of course, these are average regional trends, that mask individual differences in country performance. Countries such as Poland,
Hungary and Czech Republic have performed relatively better than Bulgaria, Rumania and several former soviet Republics in the post-socialist transition of the 1990s. In Latin America, good performers in the 1980s and 1990s have been Colombia, Chile, Dominican Republic and others.

The Evolution of World Income Inequality: Assessing the Impact of Globalization
14
C. Rising Inequality with Unweighted Gini’s
Milanovic (2001) has computed unweighted and weighted (by population) Gini coefficients of national per capita GDP for the period 1950-1998 for a sample of around 120 countries.5
The unweighted Gini coefficient6 shows a slight decline in international inequality between 1965 and 1978 (in 1978 the Gini is 45.2 some 2.5 points below its level of 1965). Since 1978 there is a steady upward trend in the value of the Gini coefficient (an increase an international inequality), which is accounted for by the following regional patterns (see figure 1):
1. An increase in inequality in Latin America, (the Latin America’s Gini goes up) (see figure 2), during the 1980s and 1990s, a region in the middle of the international income distribution scale (e.g. a “middle class” region).
2. A drastic jump in inequality, since the early 1990s, in post-socialist, transition economies, say Eastern Europe and former USSR.
3. A dismal economic performance in Africa. In fact, as of 1998, 22 out of 35 African countries had a GDP per capita lower than 20 years ago; this lagging economic performance of Africa has contributed to widen global inequality.
4. There has been a trend towards convergence in GDP per capita across the economies of Western Europe, North America and Oceania (WENAO). The WENAO group corresponds to the “western offshoots” in Maddison’s (2001). The regional Gini for the WENAO group was in the range 25-27 for the coefficient in the 1950s declining to at around 15 in the 1990s (figure 3).
Therefore the picture is one of steady convergence in the GDP per capita and development levels among countries at the top of the international income distribution scale, the WENAO group.7 The counterpart of convergence at high per capita GDP levels in the WENAO group is convergence at low GDP per capita levels in most African economies, in “faltering” Asian economies such as Afghanistan, North Korea, Laos, Cambodia, Mongolia and in low income Latin America and Caribbean countries such as Haiti, Nicaragua, Bolivia, Paraguay. Of course, convergence at the top and the bottom, implies a widening in international income distribution. Another feature of world income distribution is a tendency toward a vanishing of the world traditional “middle class”, say Latin America and the transition economies (former USSR and Eastern Europe) in particular given the dramatic fall in the relative importance of particularly the post-socialist, transition economies during the 1990s, already mentioned.
5 A consideration that affects the calculation of distributive indices for inter-national inequality, such as Gini coefficients, is the
number of countries. In fact, there was an increase in the number of countries in the world in the 1950 and 1960s with the de-colonization of Africa. Another increase in the number of countries took place in the 1990s with the break-down of the former Soviet Union into a number of independent States, the separation of the Slovak Republic from the former Czechoslovakia and the break-down of the former Yugoslavia. However, income per capita data for these later countries can be reconstructed from Republican data of their previous countries to whom they belonged.
6 The Gini coefficient goes from 0 to 1. The value 0 is "perfect equality" in which every individual has an equal share of national (or world) income and 1 is "complete" inequality in which all income goes to one individual.
7 Studies that analyze income convergence in WENAO and OECD countries are Dowdrick and Nguyen, 1988 and Li and Papell, 1999. The WENAO region is the equivalent to the OECD without Japan and the new members such as Mexico, South Korea, Hungary, Poland, Slovakia and Czech Republic.

CEPAL - SERIE Macroeconomía del desarrollo N° 11
15
Figure 1 UNWEIGHTED INTERNATIONAL INEQUALITY, 1950-1998
(Gini coefficient)
0.360
0.380
0.400
0.420
0.440
0.460
0.480
0.500
0.520
0.540
0.560
1950
1952
1954
1956
1960
1962
1964
1966
1968
1970
1972
1974
1978
1981
1983
1986
1990
1992
1994
1996
1998
Year
Gin
i coe
ffici
ent
World
Source: Milanovic, B. “World Income Inequality in the Second Half of the Twenty Century” mimeo, World Bank, (2001), June.
Figure 2
UNWEIGHTED INTERNATIONAL INEQUALITY II, 1950-1998 (Gini coefficient)
0.100
0.200
0.300
0.400
0.500
0.600
1950
1954
1958
1962
1966
1970
1974
1978
1982
1986
1990
1994
1998
Year
Gin
i coe
ffici
ent
WENAO
W ENA O and Asia
W orld W ENA O , A sia,LA C and transition
W EN A O, A sia and LA C
Source: Milanovic, B. “World Income Inequality in the Second Half of the Twenty Century” mimeo, World Bank, (2001), June.

The Evolution of World Income Inequality: Assessing the Impact of Globalization
16
Figure 3 GINI POINT CONTRIBUTIONS TO CONCEPT 1 INEQUALITY, 1960-1998
(Gini point contribution to concept 1 inequality)
Source: Milanovic, B. “World Income Inequality in the Second Half of the Twenty Century” mimeo, World Bank, (2001), June.
D. International Inequality with Weighted Gini’s: The Case of China and India
A different picture of the evolution of international inequality in the last decades can be obtained if the regional and international Gini coefficients are computed by weighting the GDP per capita of individual countries by their population share in total regional population.
Figure 4 taken from Milanovic (2001, pp. 30) shows a decline in the weighted international Gini coefficient (a drop in international inequality) since the mid 1960s. In fact, the weighted Gini goes down from 55.6 in 1965 to 50.1 in 1998, a 10% decline. What explains this decrease in the weighted Gini since the mid-1960s? Milanovic (2001) shows the main reason for the decline in the weighted Gini is very rapid growth in populous China since the late 1970s after the adoption of economic reforms and faster growth (though not as rapid as in China) in India, since the 1980s. Those two large, low income countries that account for near 45% of world population have grown much faster than the world economy and the WENAO group of rich countries during the last two decades.
Figure 5 shows, however, that the decline in the Gini disappears if China and India are excluded from the computation of the index. Furthermore, excluding both India and China shows that the weighted international Gini coefficient rises since the 1980s (an increase an inequality), a similar trend observed in the case of the unweighted Gini over the same time-period. The increase in mean income in China and India in recent decades is a very important development since benefits the population of two countries that represent near half of world population. However, the empirical evidence (see Milanovic, 2001, Ravallion, and Chen, 1999 and Ravallion and Datt, 2000) shows also that rapid growth in mean income in both countries has been positively correlated with an increase in inequality (particularly rural-urban income disparities) in both economies.
-0.040
-0.020
0.000
0.020
0.040
0.060
0.080
0.100
1960
1962
1964
1966
1968
1970
1972
1974
1976
1978
1980
1982
1984
1986
1988
1990
1992
1994
1996
1998
Africa
Latin America and the Caribbean
Transition

CEPAL - SERIE Macroeconomía del desarrollo N° 11
17
Figure 4 WEIGHTED INTERNATIONAL INEQUALITY, 1950-1998
Source: Milanovic, B. “World Income Inequality in the Second Half of the Twenty Century” mimeo, World Bank, (2001), June.
Figure 5
WEIGHTED INTERNATIONAL INEQUALITY WITHOUT CHINA AND INDIA
Source: Milanovic, B. “World Income Inequality in the Second Half of the Twenty Century” mimeo, World Bank, (2001b), June.
0.480
0.520
0.560
0.600
1950 1952 1954 1956 1958 1960 1962 1964 1966 1968 1970 1972 1974 1976 1978 1980 1982 1984 1986 1988 1990 1992 1994 1996 1998
World
0.400
0.440
0.480
0.520
0.560
0.600
1950 1952 1954 1956 1958 1960 1962 1964 1966 1968 1970 1972 1974 1976 1978 1980 1982 1984 1986 1988 1990 1992 1994 1996 1998
World without India and China
World without China

The Evolution of World Income Inequality: Assessing the Impact of Globalization
18
E. World Inequality
Let’s turn now to the evidence on world inequality. Remember that this is a broader concept than international inequality as it reflects also within country changes in inequality. The ultimate purpose of the calculation is to assess the rank of welfare of the individual of the world.
There are two main possibilities to construct world indices of income distribution based on country level information about per capita incomes from national accounts and some measures of income dispersion at country level.8 One is to use data of mean incomes or GDP per capita complemented by some measure of income dispersion (Gini coefficient, standard deviation of income) and then make an assumption of log-normality in the income distribution of income individual countries or groups of countries, to construct income distribution for individual countries.9 The assumption of a log-normal distribution although convenient is clearly at odds with actual income distributions. Another possibility, adopted in Bourgignon and Morrison (2002) in their long run study of world income distribution, was to use known actual income distributions of “representative” countries and apply it to other economies with assumed geographical and economic similarities. The obvious cost of this procedure is the approximation of distributive patterns of certain economies to other countries, whose actual income distribution scales can be very different from the assumed “representative” country. Still, the authors are able to construct an index (they use the Theil index) of world income distribution, for a very long period running from 1820 to 1992, a piece of information previously unavailable to gauge changes in distributive pattern in the world economy. Still, the caveats on the study’s methodology are worth to keep in mind.
An alternative procedure, pioneered in Milanovic (2002) is to use a vast array of national household income (expenditure) surveys that provide direct income information by quintiles, deciles, etc. for individual countries to construct world income distributions for specific years. The use of household income/expenditure surveys has been helped by the fact that their geographical coverage has expanded considerably in the last two decades with their collection in China since the 1980s, in the (former) USSR since the second half of the 1980s and in African economies in the 1990s. On these grounds, world income distributions based on household surveys can not be constructed prior to the mid-1980s.10
F. Main Results
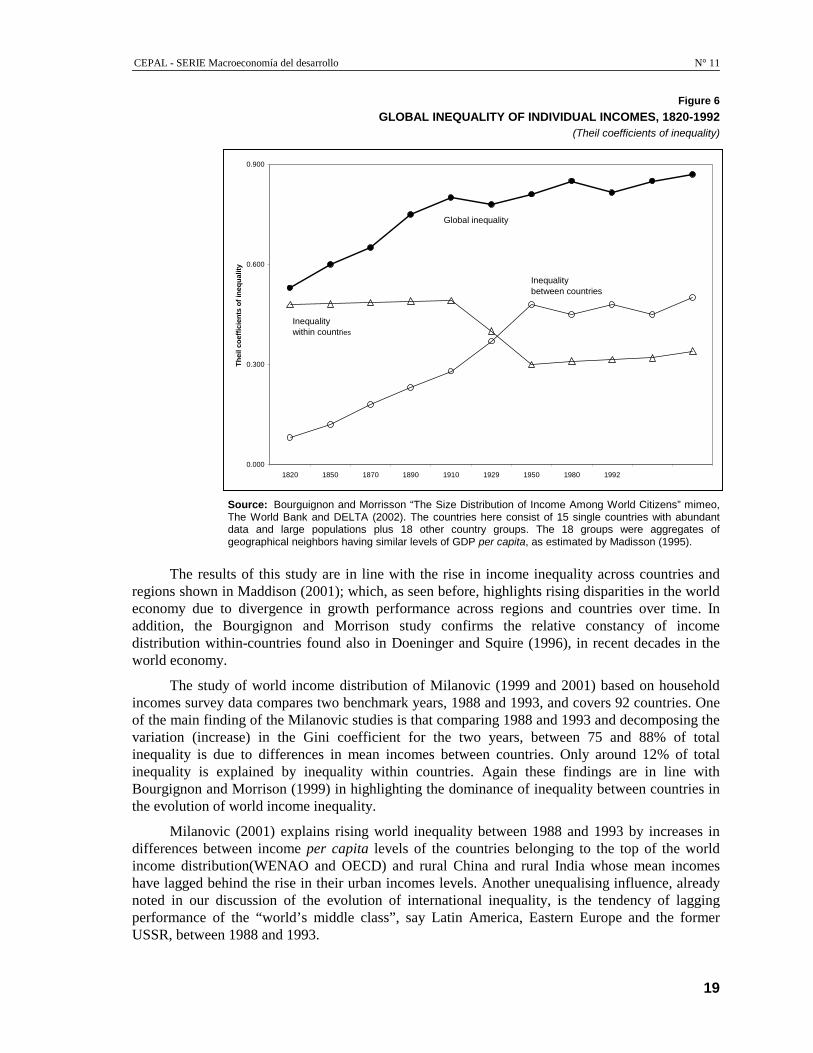
Let’s start with the Bourgignon and Morrison (2002) paper. This study covers the evolution of world income distribution using the Theil index from 1820 to 1992, based in data on population, GDP per capita and income shares for 33 groups of countries. The authors find a steady increase in world inequality since 1820 (see figure 6). The story is roughly the following: between 1820 and 1910, say the Theil index rose by 50%; then global inequality remained relatively stable between 1910 and 1960, to rise again, between 1960 and 1992, now by 12%. Interestingly, the increase in total inequality in the period 1820-1992 is driven almost entirely by a rise in inequality between countries (e.g. a rise in international inequality). In fact, within-country inequality declined between the mid 1910s and around 1950, to rise moderately thereafter.
8 See Milanovic (1999, 2001) for a careful methodological discussion of these issues. 9 Empirical studies following this methodology are Schultz (1998), Quah (1999) and Chotikapachin, Valenzuela and Rao (1997). 10 Other methodological difficulties refer to the use of expenditure versus income in some surveys, the price indices used for
international comparisons , level of aggregation of data, etc.
CEPAL - SERIE Macroeconomía del desarrollo N° 11
19
Figure 6 GLOBAL INEQUALITY OF INDIVIDUAL INCOMES, 1820-1992
(Theil coefficients of inequality)
Source: Bourguignon and Morrisson “The Size Distribution of Income Among World Citizens” mimeo, The World Bank and DELTA (2002). The countries here consist of 15 single countries with abundant data and large populations plus 18 other country groups. The 18 groups were aggregates of geographical neighbors having similar levels of GDP per capita, as estimated by Madisson (1995).
The results of this study are in line with the rise in income inequality across countries and
regions shown in Maddison (2001); which, as seen before, highlights rising disparities in the world economy due to divergence in growth performance across regions and countries over time. In addition, the Bourgignon and Morrison study confirms the relative constancy of income distribution within-countries found also in Doeninger and Squire (1996), in recent decades in the world economy.
The study of world income distribution of Milanovic (1999 and 2001) based on household incomes survey data compares two benchmark years, 1988 and 1993, and covers 92 countries. One of the main finding of the Milanovic studies is that comparing 1988 and 1993 and decomposing the variation (increase) in the Gini coefficient for the two years, between 75 and 88% of total inequality is due to differences in mean incomes between countries. Only around 12% of total inequality is explained by inequality within countries. Again these findings are in line with Bourgignon and Morrison (1999) in highlighting the dominance of inequality between countries in the evolution of world income inequality.
Milanovic (2001) explains rising world inequality between 1988 and 1993 by increases in differences between income per capita levels of the countries belonging to the top of the world income distribution(WENAO and OECD) and rural China and rural India whose mean incomes have lagged behind the rise in their urban incomes levels. Another unequalising influence, already noted in our discussion of the evolution of international inequality, is the tendency of lagging performance of the “world’s middle class”, say Latin America, Eastern Europe and the former USSR, between 1988 and 1993.
0.000
0.300
0.600
0.900
1820 1850 1870 1890 1910 1929 1950 1980 1992
Thei
l coe
ffici
ents
of i
nequ
ality
Global inequality
Inequality between countries
Inequalitywithin countries


CEPAL - SERIE Macroeconomía del desarrollo N° 11
21
IV. The Links Between Globalisation and World Inequality
How all of these trends in world inequality are related to globalisation? The question is certainly very complex for various reasons: controlling for the influence of non-globalisation factors that affect world inequality is difficult, because of the empirical problems to measure world inequality already noted and, not the least, by the obvious generality of the term “globalisation”. On the later, globalisation will be understood here, simply, as increased economic integration in commodity markets, capital markets and international labour markets among countries. At an analytical level, we can distinguish several channels through which globalisation affects world inequality:
A. Static convergence in factor prices
The Heckscher-Ohlin theory of international trade posits that trade of goods lead to commodity (goods) price equalization (or at least a tendency to) across countries. Using duality theorems (see Dixit and Norman, 1980) in which goods prices can be decomposed in terms of factor prices (wages, profits, land rents) embedded in unitary costs, the equalization of commodity prices leads to the Stolper-Samuelson theorem that factor price equalization develops under free trade, therefore narrowing in international differences in factor prices and per capita income levels. Of course, this may take time (e.g. decades), and assumes competitive markets and absence of major barriers to international trade.
The Evolution of World Income Inequality: Assessing the Impact of Globalization
22
Another mechanism for economic integration leading to factor price convergence is international migration and capital mobility. Labour moves across countries in response, among other things, to wage differentials. Migration tends to reduce wage differentials by increasing the labour supply in the labour-scarce, migrant-receiving country and reducing the labour supply in the labour-abundant, sending economy. The result is a narrowing of wage gaps across countries and eventual convergence in per capita income over time.11 The mobility of capital tends in turn to reduce differentials in the marginal product and rates of return of capital among countries.
B. Dynamic convergence in per capita income growth
Neoclassical growth models predict income convergence across countries by postulating an inverse relationship between initial income levels and the growth rate of GDP. This result is due to the fact that with decreasing returns to capital, countries that are further behind their steady-state capital labour ratio (and per capita income level) will grow faster than countries closer to their steady-state. The main inference here, is that poor countries should growth faster than rich countries because they have lower capital labour ratios and thus a higher marginal productivity of capital a feature that leads to a faster rate of adjustment of the capital stock and GDP growth to their steady-state level.12 Over time as the process of economic growth takes place and the stock of capital per person increases the returns of capital decline leading to a gradual slow down in growth rates; this mechanism should generate convergence in growth rates and per capita income levels across countries.
The neoclassical growth model (Solow, 1956) shows that in steady-state the rate of growth of GDP is equal to the rate of technical progress; therefore in a world in which the (expansion) of the technology frontier is globally available,13 all countries should grow at the same rate in steady state therefore keeping unchanged the long run distribution of world income. In this framework, a divergence in growth rates across countries would be a problem of transitional growth dynamics while each country converges to its steady-state. Note that this process may take several decades and that steady-states per capita income level may also increase after domestic economies open to international trade.
This model is subject to several limitations. Convergence may fail due to increasing returns to capital which is the assumption behind the endogenous growth models (see Easterly, 2001). In addition, capital may fail to go to poor countries, in spite of potentially high real returns to capital there, due the absence of complementary factors (e.g. skilled labour, human capital and supportive institutions) needed to realize the potentially high rates of return on capital in low income economies. This mechanism can also prevent convergence to operate.
International migration can be growth enhancing (retarding) for receiving (sending) countries for two reasons: international migration of unskilled labour can help to keep wages down in the receiving country therefore lowering labour costs, rising profits and stimulating investment and growth. In turn, migration of highly qualified people implies a transfer of human capital that is growth enhancing in the receiving economy (see Solimano, 2001b). However, the reverse result can occur for the sending country that suffers from the emigration of human capital, domestic entrepreneurs and talented people. The net result can be a decline in growth rate in poor economies 11 See Solimano (2000b) for a discussion of relationships of substitution and complementarity between international trade and
international migration, with the empirical evidence showing the dominance of complementarity between these two dimensions of globalization (complementarity between trade and international migration).
12 See Jones (1998). 13 Economic integration –globalization– can help this process to take place if there is effective diffusion of technologies across
countries.

CEPAL - SERIE Macroeconomía del desarrollo N° 11
23
that experience the flight of human capital. Still, the level of world output can rise with international migration as labour migrate from countries with a lower marginal product of labour to countries with a higher marginal productivity of labour
C. Within-Country Income Distribution
International trade affects also domestic income distribution. According to the Heckscher-Ohlin model a country tends to export (import) goods intensive in the use of the abundant (scarce) factor of production. So when a country engages in international trade the real price (or the remuneration rate) of its abundant factor, say unskilled labour, should rise and the remuneration of the scarce factor (capital or skilled labour) decline. So international trade create “winners” and “losers” internally with the remuneration of the abundant factor increasing with trade opening while the relative return of the scarce factor declining. However, it is important to realize that factor abundance is, obviously, a relative concept and in world of more than two countries (regions), any prediction on effects of trade on relative wages and factor prices needs to be made comparing all the countries participating in the global marketplace. The empirical evidence on this matter is evaluated below.


CEPAL - SERIE Macroeconomía del desarrollo N° 11
25
V. Historic and Econometric Evidence on the Impact of Globalisation in World Inequality
A. Historical and Recent Evidence
Let us turn now to the historical evidence on the impact of economic openness and globalisation on world inequality. For that purpose, we shall adopt the following classification that combines both historical periods of Maddison (2001) and O’Rourke and Williamson (2000):
i) the first wave of globalisation 1870-1913; ii) the de-globalisation period 1913-1950; iii) the golden age of 1950-1973, and iv) the second wave of globalisation of 1973 onwards.
B. Inequality during the first wave of globalisation: 1870-1913
The first wave of globalisation of around 1870 to 1913 was a period of increasing international trade associated with lower transport costs (due to technical improvements in transports and communication), of relatively low tariffs and of unrestricted capital mobility under the gold standard. In addition, this was a period of

The Evolution of World Income Inequality: Assessing the Impact of Globalization
26
massive international migration from Western Europe to the New World. It is estimated that around 60 million Europeans migrated to labour-scarce, resource abundant New World countries between 1870 and 1913 (see Solimano, 2001b).
The literature on convergence in this period looks at several indicators: GDP per capita, productivity levels, real wages, land rents and profit rates. Using GDP per capita in 1995 international dollars, Maddison (2001) shows that interregional disparities of GDP per capita increased from 1870 to 1913 from a ratio of 5:1 to a ratio of 9:1 between the most advanced (Western Europe, Western offshoots) and the poorest region of the world (Africa). However, at the same time there is a narrowing of GDP per capita gaps among Western Europe and the New World. In fact, the ratio of the average GDP per capita of Western Europe to the GDP per capita of the Western Offshoots (US, Canada, Australia, New Zealand) goes down from 0.80 to 0.66.
Looking at real wages differentials in the “Atlantic Economy”, say Western Europe and the New World,14 O’Rourke and Williamson (2000) find ample evidence of convergence in real wages during the first wave of globalisation within the Atlantic Economy. The process starts around 1850 and intensifies during the period 1870-1913 of the first wave of globalisation. At the end of that period the wage gaps almost disappear. In turn, these authors show also convergence of GDP per capita within the Atlantic economy, although the pace and magnitude of such convergence is lower than for real wages. Within Western Europe, real wages of peripheral Europe (Scandinavian countries, Spain, Italy and Portugal) converged to the real wages of the European industrial core (England, Germany, France) during the same period. In the New World, the real wages of Argentina and Canada converged to the higher salary levels of the U.S. and Australia. In terms of the predictions of trade theory is worth noting that real wages of labour-abundant, natural resource-scarce European countries converged to the real wages levels of labour scarce, resource abundant New World Countries along the lines predicted by the Stolper-Samuelson theorem. It is important to note however, that around two thirds of the real wage convergence in the Atlantic Economy during the first wave of globalisation, is associated with international migration from Europe to the countries of the New World, rather than with international trade.
Convergence during the first wave of globalisation did not include an array of more peripheral countries of Central, Southern and Eastern Europe (Austria-Hungary, Greece, Bulgaria, Russia), China, India, Egypt and other Asian countries and Latin America according to O’Rourke and Williamson (2000), a finding also confirmed by Maddison, (2001). What about domestic income distribution in the Atlantic economy? The evidence points to a worsening of income distribution against labour in the U.S, Canada and other labour abundant countries of the new World due to the combined effect of international trade and (perhaps more importantly) of massive international migration from Europe that increased substantially the supply of labour moderating the pace of increase of domestic real wages coming from accelerated economic growth. The opposite distributive effect took place in Europe, however, as massive emigration to the New World (estimated in about 20% of the labour force) that made labour more scarce, thereby rising real wage.
In sum, the empirical evidence of the first wave of globalisation shows that, indeed, convergence of both per capita income and real wages took place within the Atlantic Economy, the group of more advanced countries in the world economy, thereby reducing initial real wage and per capita income gaps among these countries. Convergence was due to both an increase in international trade and, to a large extent, to massive international migration. There was a narrowing in international inequality across nations that participated in the integration process (the Atlantic Economy). However, at the same time, the evidence shows that many countries outside the Atlantic Economy (e.g. the periphery) were left behind this process of economic convergence. 14 A. Lewis (1978) includes also Uruguay and South Africa in the New World. Recent papers on globalization from an historical
perspective are Lindert, P. and J.G. Williamson (2001), and O'Rourke (2001).

CEPAL - SERIE Macroeconomía del desarrollo N° 11
27
C. The De-Globalisation, 1914-1950 period
The 1914 to 1950 period was very disruptive for the world economy. This period, as already mentioned, included world war I, high inflation and instability in Europe in the 1920s, increasingly restrictive practices towards international migration, the passing of higher tariff legislation in the U.S. countries, the great depression in the 1930s and then world war II. These turbulent developments prevented the continuation of the process of convergence in real wages among the countries of the Atlantic Economy that developed in the period 1870-1913. In fact, convergence of real wages ceased completely between 1914 and 1937, in addition, a trend of divergence in real wages is noted between Europe and the U.S. between 1935 and 1945.15 That tendency of divergence in those years is also confirmed by Maddison (2001) and Pritchet (1997) using data of GDP per capita. Moreover, the U.S leadership in living standards, productivity levels and GDP per head was clearly consolidated during that period. Summing up, global disparities widened in the de-globalisation period, both between the richest and poorest regions in the world economy (see table 2) and among the countries of the Atlantic Economy, reverting the trend towards convergence observed during the first wave of globalisation of the 1870-1913 period.
D. The Second half of the 20th Century: Golden Age and the Second Wave of Globalisation
The 1950-2000 period has been one of the most dynamic in world economic history with a turning-point around 1973.
Some figures will help to put the dynamism of the second half of the 20th Century in historical perspective: the annual rate of growth of world GDP was 3.9% in 1950-1998 compared with 1.6% from 1820 to 1950, and 0.3% from 1500 to 1820. The expansion in international trade was remarkable with the ratio of exports to world GDP rising from 5.5% in 1950 to 17.2 in 1998. In turn, the stock of foreign capital in developing countries increased from 4% to 22% of their GDP between 1950 and 1998 (Maddison, 2001, ch. 3).
It is useful to distinguish two sub-periods when analysing the second half of the 20th Century. The period 1950-1973 which has been termed the “golden age of capitalism” (see Marglin and Schor, 1991) and the period 1973 onwards which has been labelled the “neoliberal order”, or the “second wave of globalisation” (see table 3). The “golden age of capitalism” period were near 25 years of rapid growth, relative stability and declining inequality based on a globally and nationally regulated mix economy. The prevailing policy regime of the golden age combined a balance of payments adjustment mechanism under fixed exchange rates at global level with Keynesianism and the welfare state in advanced capitalist countries, and the developmental state in developing economies at national level (see Solimano, 1996, 2000b).
In the golden age period (1950-1973), the best performers in terms of rates of growth of GDP per capita were Japan (8.1%), Taiwan (6.7%), South Korea (5.8%), Hong Kong (5.2%), Singapore (4.4%), Germany (5%), Italy (5%), France (4.1%). Convergence of per capita income operated for these countries. In this period there was considerable convergence among western European economies and the OECD with Japan jumping to the group of advanced capitalist economies. In the golden age years the GDP gap in per capita income between the poorest and the richest region fell from 15:1 in 1950 to 13:1 in 1973.
15 See O'Rourke and Williamson (2000).

The Evolution of World Income Inequality: Assessing the Impact of Globalization
28
Table 3 GDP PER CAPITA PERFORMANCE IN THE THREE
MOST SUCCESSFUL PHASES OF THE CAPITALIST EPOCH (Percentages)
Annual Average Compound Growth Rate 1998 World Share 1950-1973
(golden age) 1973-1998
(neo-liberal order)
1870-1913 (liberal order)
GDP
Population
Panel A Western Europe 4.08 1.78 1.32 20.6 6.6 Western offshoots 2.44 1.94 1.81 25.1 5.5 Japan 8.05 2.34 1.48 7.7 2.1 Total advanced capitalist 3.72 1.98 1.56 53.4 14.2 Resurgent Asia 2.61 4.18 0.38 25.2 50.9 Advanced Capitalist & Resurgent Asia (49)
2.93 1.91 1.36 78.6 65.1
Panel B 40 Other Asia 4.09 0.59 0.48 4.3 6.5 44 Latin America 2.52 0.99 1.79 8.7 8.6 27 Eastern Europe & former USSR 3.49 -1.10 1.15 5.4 6.9 57 Africa 2.07 0.01 0.64 3.1 12.9 Faltering economies (168) 2.94 -0.21 1.16 21.4 34.9 World 2.93 1.33 1.30 100 100
Source: Maddison, The World Economy. A Millennial Perspective. Development Centre Studies, Organization for Economic Cooperation and Development (OECD), (2001).
For Latin America, the golden age period was the most dynamic in terms of rates of growth GDP compared to previous periods and also compared with the second wave of globalisation (post 1973). In fact, the average annual rate of growth of per capita GDP en Latin America was 2.52% in 1950-1973.
A fatal blow to the “golden age” came with the collapse of the Bretton Woods system of fixed exchange rates in the early 1970s and the two oil shocks of the 1970s. Those events led to a deceleration in growth and an acceleration in inflation in the OECD countries that continued beyond the 1970s. The post 1973 period saw along with a growth slowdown in the OECD, an expansion in international financial flows that can only be compared to the “liberal order” or “first wave of globalisation” of 1870-1913.16 This period also encompassed a drastic shift in economic ideas and policy regimes toward free markets initiated with Tatcher’s policies in the UK in the late 1970s and Reagan’s supply-side economics in the 1980s in the U.S. This ideological shift was followed later on by market-oriented reforms in Eastern Europe, the former USSR and Latin America in the 1990s.17
The rate of growth of world GDP in 1973-1998 was of 1.33 per year —less than half the rate of growth of 1950-1973. In addition the second wave of globalisation has led to a rise in global inequalities, in contrast to the golden age of 1950-1973 (see table 2 in pp 13).
There were also important changes in the shares of world income across regions between 1973 and 1998: Asia, excluding Japan, increased dramatically its share in world GDP from 16.4% in 1973 to 29.5% in 1998. In contrast, Western Europe reduced its share in world GDP from 25.7% to 20.6% and Eastern Europe and the former USSR experienced the most dramatic decline in their share of world GDP from 12.9% in 1973 to 5.3% in 1998. The “western offshoots” went down very
16 In contrast to global financial markets expansion, international labor markets have been much more restricted (e.g. more barriers to
international migration) in the second wave of globalization than in the first wave of globalization, see Solimano (2001a). Stallings (2001) document the extent of capital flows in the second wave of globalization.
17 For an analysis of changes in ideas and policies about economic development in the 1980s and 1990s see Solimano (1996, 1998).

CEPAL - SERIE Macroeconomía del desarrollo N° 11
29
slightly from 25.3 to 25.1% as well as Africa that went down from 3.3% to 3.1 between 1973 and 1998. Latin America kept its share in 8.7% constant between 1973 and 1998.18 In sum, the main regional winner of this period is Asia (particularly Southeast Asia, China and India). The main losers are the former socialist block of Eastern Europe and the former Soviet Union. Therefore, average regional convergence operated for Asia and divergence has been taking place for Eastern Europe and the former Soviet Union during the second wave of globalisation.
E. Econometric Evidence
1. Convergence Let’s leave the analysis of “economic epochs” and turn to recent econometric work on
convergence, growth and openness. A considerable amount of econometric work has been devoted to test the hypothesis of income per capita convergence across countries. An important distinction here is between “absolute” convergence and “conditional” convergence (see Jones, 1998, Dowrick and DeLong, 2001). If absolute convergence holds we should observe in the data a negative correlation between GDP levels and growth rates with poorer economies growing faster than richer economies. Thus, their income per capita gaps should narrow over time. Conditional convergence, in turn, controls for other determinants of growth besides initial income. The study of Mankiw, Romer and Weil (1992) find conditional convergence of around 2 to 3% per year on post-war data covering both industrialized and unindustrialized economies. Higher numbers for conditional convergence are found in more recent studies of convergence reported such as Dowrick and DeLong (2001).
A strong advocate of the convergence hypothesis is Robert Barro. In Barro (1996) the author finds that, on average, a country with the same value of other right hand side variables in the growth regression closes between 2.5 and 4.5% of the log-gap in per capita income between it and the leaders each year. How do we square the empirical evidence of actual global divergence reviewed in this paper and the econometric evidence in favour of conditional convergence? The puzzle is solved when we realize that conditional convergence requires that all countries share similar values for the determinants of growth and therefore the same steady-state value of long run income per head. Here it is evident that important determinants of growth like investment ratios, the quality of institutions (rule of law, corruption, etc.), education levels, fertility rates, etc. vary considerably across countries. This makes the usefulness of conditional convergence tests rather limited since they impose by assumption the equality of growth determinants whose disparity across countries have to be explained and are at the core of differential growth performance across countries and international inequality.
2. Opening, Growth and Convergence The relationship between openness and growth and openness and convergence has been
studied in several cross-country studies such as Sachs and Warner (1995), Rodriguez and Rodrik (1999), Edwards (1998, 1992), Dollar and Kraay (2001). Sachs and Warner find for the period 1970-1989 strong evidence of convergence in per capita GDP among the group of countries classified as open in their study according to several measures of trade policy including tariff levels, nontariff trade barriers, trade monopolies and foreign exchange black market premium. The authors find the average growth premium for economic opening to be 2.5%age points of additional, annual GDP growth. This is certainly a large number. Sachs and Warner (1995) argue that
18 See ECLAC (2000, 2001), Ocampo (2000, 2001) discusses finance and stabilization issues for developing countries in a globalized
world economy, from a Latin American perspective.

The Evolution of World Income Inequality: Assessing the Impact of Globalization
30
globalisation brings about accelerated growth for poor countries thereby fostering convergence. This study (and others) have been criticized by Rodrik and Rodriguez (1999) in the sense that their indicators of openness are poor measures of trade policy and are highly correlated with other sources of bad economic performance.
Dowrick and DeLong (2001) investigate the relationship between openness, globalisation and convergence extending both the country sample and the time period of the Sachs and Warner study to include the 1990s. Besides they amend some aspects of the definition of openness adopted in Sachs and Werner (1995). For a sample of 96 countries in the period 1960-1998 Dowrick and DeLong find that open economies grew faster by 2%age points than closed economies in the period 1960-1980; this is a lower growth premium from economic openness than the one found in Sachs and Warner for the period 1970-1989. The study of Dowrick and DeLong finds that the growth premium of openness tends to be higher for poorer economies. However, when the exercise is carried-out for the period 1980-1998 the growth premium of openness is smaller than in the previous 20 years (the growth premium falls to 1.3 percentage points of additional growth per year) and that poorer countries benefit less from openness than do rich countries, reversing the finding for the period 1960-1980.
Dollar and Kraay (2001) develop a classification of “post 1980 globalisers” that include countries such as China, India, Mexico, Thailand, Malaysia, the Philippines, and found that these countries (after cutting tariffs and integrating effectively to the world economy) have experienced a significant increase in their growth rates in the 1980s and 1990s.19 In contrast, developing countries that do not belong to the “globalising” group had a lower growth performance in the last two decades. The authors use decade-over-decade changes in trade volumes (as proxy for changes in trade policy) and decade changes in GDP growth rates to investigate the effects of openness on growth. In a data set spanning 100 countries, the authors find that changes in growth rates are positively and highly correlated with changes in trade volumes after controlling for other determinants of economic growth. In addition, the authors find a one-to-one relationship between the rate of growth of income of the poor (bottom 20% of the population) and the growth rate of per capita income, although with considerable variability in the estimated coefficient. In other words, the changes of share of income of the poorest fifth quintile are not correlated with the rate of growth of mean income. Another important result, is their finding of no systematic relationship between changes in trade and changes in inequality (see figure 7) measured both through the Gini coefficient and the income share of the poor. In summary, these cross-country empirical studies find a positive correlation between economic openness and growth and find a sizeable growth premium for countries integrating to international trade. However, the growth premium of openness is not stable over different time periods and becomes weaker for poor countries. No systematic direct relationship between trade and national inequality is found in the analysis.
F. Globalisation and Wage Inequality at National Level
Let’s turn now to the impact of globalisation and economic openness on domestic wage inequality. There is considerable empirical documenting a widening of wage differentials in favour of skilled labour and higher income individuals in the 1980s and 1990s in the U.S. and the U.K. This is also a period of increased international economic integration in both economies suggesting a positive correlation between openness and wage inequality. Atkinson (1999) refers as the “Atlantic Consensus” the view that increased import competition from low wage developing countries, coupled with technical change biased to skill labour, has led to a decline in the demand
19 This is more so for China and India than for Mexico, that experienced slower growth in the 1980s and 1990s than in the 1950s,
1960s and 1970s.

CEPAL - SERIE Macroeconomía del desarrollo N° 11
31
for low skill labour in industrialized countries mainly the U.S. and U.K.20 and a widening in wage inequality in these economies. The issue has been in subject of much analysis and controversy.
Authors like Borjas (1994, 1999) stress the fact that immigration of unskilled labour (from Mexico, Asia and other countries) explains around two thirds of the widening of wage differentials for unskilled workers in the U.S. in the 1980s and 1990s. The other third is explained by a combination of import competition and unskilled labour-saving technical change (e.g. the information and computer revolution of the 1990s). Another hypothesis for widening wage inequality is a change in social norms and wage setting patterns away from redistributive payment. Part of the observed wage inequality is socially generated (see Atkinson, 1999).
For developing countries, Wood (1997) contrasts the experience of East Asia in the 1960s and 1970s with that of Latin America in the 1980s and early 1990s to assess the empirical validity of the view that an increase in economic openness in developing countries tend to raise the demand for unskilled labour and thus reduce wage inequality (contrary to the case of industrialized economies we just discussed). The Wood study shows that while East Asia confirms the conventional wisdom and wage inequality declined with increased economic openness, the experience of Latin America points to the contrary. Wage inequality widened in Latin America in the 1980s and early 1990s. The author attributes the differences between the two regions to various factors: differences in the two time-periods selected, and structural differences between the two regions regarding natural resource endowments and other characteristics of their respective economic structure. The author highlights two important developments starting in the 1980s that shift the content of trade towards more skilled labour intensity in Latin America. First, the entrance of China and other low income, large Asian economies into the world market for labour-intensive manufactures shifting the comparative advantages of middle income countries (e.g. several Latin American countries) into goods of medium skill intensity. As a result, the effect of increased economic openness in Latin America is to reduce the relative demand of low skill labour as sectors of low skill intensity contract. Second, as mentioned before, technical change is biased against unskilled workers.
20 Note that countries such as Canada, France and other OECD economies have not experienced the significant change toward greater
wages and earning inequality, of the U.S. and U.K. during the 1980s and 1990s (Atkinson, 1999).

The Evolution of World Income Inequality: Assessing the Impact of Globalization
32
Figure 7 CHANGES IN TRADE AND CHANGES IN INEQUALITY
(Averages)
y=2.5227x+0.0139 R2=0.0013
y=-0.0489x+0.0012 R2=0.0002
Average Annual Change in Trade/GDP
Average Annual Change in Trade/GDP
Ave
rage
Ann
ual C
hang
e in
Gin
i Coe
ffici
ent
Ave
rage
Ann
ual P
erce
nt in
Inco
me
Shar
e of
Bot
tom
Qui
ntile
Trade and the Gini Coefficient
Trade and the Income Share of the Poor
Source: Dollar, D. and A. Kraay, "Trade, Growth and Poverty", The World Bank, Policy Research Working Papers Series No. 2615, (2002).
Note: Figure shows average of annual growth rates of indicated variables over non-overlapping periods of at least five years.

CEPAL - SERIE Macroeconomía del desarrollo N° 11
33
6. Main Findings and Conclusions
A steady trend of increasing inequality in the world economy between rich and poor economies has taken place since 1820 and throughout the 20th Century, the exception being the “golden age” period of 1950-1973. Interestingly, the increase in world inequality is overwhelmingly driven by increases in international inequality rather than by changes in domestic inequality. Significant cross-country differences in economic growth performance generate, over time, large differences in per capita income levels across nations. The dramatic increase in real income, material welfare and the rate of technical progress, particularly in the advanced capitalist economies (the countries of the OECD today) of the last century and a half has spread out in very uneven fashion across the world, giving rise to complex patterns of regional convergence and divergence in GDP per capita levels and growth rates.
The paper shows that the “first wave of globalisation” of 1870-1913: a “liberal economic order” of free trade, high capital mobility under the gold standard and massive international migration came along with convergence in real wages and GDP per capita in the Atlantic Economy [(Western Europe and the New World (the US, Canada, Argentina, Australia and New Zealand)]. A chief force in producing that convergence was international migration rather than increased trade in commodities. Convergence in the first wave of globalisation was only partial, however, in its regional coverage, as it did not extend to the periphery of Central, Eastern Europe and Asian economies.

The Evolution of World Income Inequality: Assessing the Impact of Globalization
34
Domestic inequality increased in labour-scarce, natural resource abundant New World countries and declined in labour-abundant, natural resource-scarce Europe during the first wave of globalisation of 1870-1913.
The convergence process started during the first wave of globalisation in the Atlantic economy was interrupted in the de-globalisation period of 1914-1950 that cut economic links across nations due to a set of events comprising two world wars, large inflation and instability in Europe in the 1920s and the great depression of the early 1930s.
The “golden age” phase from 1950 to 1973 of rapid growth, relative stability, increased international economic integration and social protection under the welfare state, run out of steam after the collapse of the Bretton Woods exchange rate system of fixed parities, the two oil shocks of the 1970s and the alleged adverse effects of the welfare state on profitability and capital formation. It is worth noting that during the “golden age”, global inequalities declined both across —countries and within— nations.
The second wave of globalisation post 1973 of increased global financial intermediation and pro-market economic policies has been accompanied by complex regional disparities and a rise in world inequality. However, in this period regional convergence has operated for Asia as a region, due to high growth performance in South Korea, Taiwan, Hong Kong and, very importantly given their size in China and India. In fact, a population weighted Gini coefficient for world income distribution declines (lower inequality) if China and India are included in the index but increases (higher global inequality) if both economies are excluded from the index. Inequality has risen since the 1980s in Latin America, and particularly in post-socialist Eastern Europe and the former Soviet Union. The sharp economic decline in their relative importance in the world economy of post-socialist countries and the constancy of the share of world GDP of Latin America has led a certain “ vanishing” of the world income middle class.
The econometric evidence of cross-country studies reviewed in this paper points to a positive association between economic openness and GDP growth and to convergence for open economies versus “closed” economies. However, the growth premium of openness is unstable across time periods (declining in the 1980s and 1990s) and convergence is weak for poor countries. Moreover, the cross-country econometric evidence shows no significant effect of international trade on the income share of low income groups for a sample of over 80 developing countries. Methodological problems in measuring openness and controlling for other determinants of economic growth make difficult to establish strong causality from integration to growth in some of the studies reviewed. Individual country studies on the subject are clearly needed to settle some of these questions.
The data shows a widening of wage inequality in the U.S. and the U.K. in the globalisation period of the 1980s and the 1990s (part of the anti-globalisation constituency in industrialized economies is associated to this fact). Empirical studies for the U.S. find a strong effect of both immigration of unskilled labour and technical progress that saves low skill labour in explaining the most part of increased wage inequality besides import competition from low wage countries. Other explanations for the widening in wage inequality in the U.S. and U.K. point out to a shift in social norms away from redistributive pay in these countries. Studies on wage inequality and trade for Latin America that seek to explain the decline in unskilled wage to skill labour ratios highlight the stiff competition of trade in manufacturing coming from low wage Asian countries.
This paper suggests a simple but important message. That a narrowing of global inequality requires a sustained acceleration in the rates of economic growth of low and middle income regions such as Africa, Eastern Europe and former USSR and Latin America. In turn, rapid economy wide growth in GDP per capita must be accompanied by a decline in domestic inequality to improve the relative income and welfare position of the world’s poor.

CEPAL - SERIE Macroeconomía del desarrollo N° 11
35
Is global income redistribution desirable? Is it feasible? How to redistribute globally? These are important questions. Global redistribution has fallen out of favour in the 1990s after the end of communism and is reflected in the drastic cut in the budget of foreign aid per capita directed to the developing world (by nearly a third in the last decade). A main issue is how to use productively foreign aid in receiving countries to raise their rate of economic growth and provide income support or low income groups rather than finance consumption (or eventually corruption). The whole issue of trade versus aid has to be reassessed stressing the potential complementarity between both concepts.
Global inequalities and slow growth in low income countries are international systemic failures. This requires collective action, at national and international levels, hopefully around a global development contract. A “ global contract” requires a clear agenda for growth and equity at global level, an identification of policy instruments to achieve those goals and the concrete mechanisms of global collective action.
Although national inequalities are particularly resilient and change very slowly over time, there is still room for domestic policies that promote greater equality without hampering economy wide economic growth. Narrowing domestic inequalities also contribute to reduce world inequality.


CEPAL - SERIE Macroeconomía del desarrollo N° 11
37
References
Atkinson, A.B. (1999), "Is Rising Inequality Inevitable? A Critique of the Trans-Atlantic Consensus" WIDER, Annual Lectures, 3, UNU-WIDER.
Barro, R. (1996), The Determinants of Economic Growth. The MIT Press. Borjas, G.J. “Economic Research on the Determinants of Immigration: Lessons
for the European Union” World Bank Technical Paper 438, September. ___ “The Economics of Immigration” The Journal of Economic Literature.
Vol. 32, No. 4, December. Bourgignon , F. and C. Morrison (2002), “The Size Distribution of Income
Among World Citizens”, American Economic Review (forthcoming). Chotikapanich, D, R. Valenzuela and D.S.P. Rao (1997), “Global and
Regional Inequality in the Distribution of Income: Estimation with Limited and Incomplete Data ” Empirical Economics, vol. 22, pp. 533-546.
Dixit, A. K. and V. Norman (1980), Theory of International Trade. Cambridge Economic Handbooks, Cambridge University Press.
Doeninger. K. and L. Squire (1996), “A New Data Set Measuring Income Inequality” The World Bank Economic Review, vol. 10, No. 3, September.
Dollar, D. and A. Kraay (2002), "Trade, Growth and Poverty", Policy Research Working Papers Series No. 2615, The World Bank.
Dowrick, S. and J. B. DeLong (2001), “Globalisation and Convergence” Paper presented to the NBER Conference on Globalisation in Historical Perspective.
Dowrick, S. and D. T. Nguyen (1989), Organization for Economic Cooperation and Development (OECD), Comparative Growth 1950- 85: Catch-Up and Convergence” American Economic Review. Vol. 79 (December): pp. 1010-38.
ECLAC. (2001), Current Conditions and Outlook. Economic Survey of Latin America and the Caribbean, 200-2001. United Nations.
___ (2000b), Preliminary Overview of the Economies of Latin America and the Caribbean. United Nations.
___ (2000a), Equity, Citizenship and Development. United Nations.
The Evolution of World Income Inequality: Assessing the Impact of Globalization
38
Eaterly, W. (2001), The Elusive Quest for Growth. The MIT Press. Edwards, S. (1998), "Openness, Productivity and Growth: What do we Really Know?", Economic Journal,
108, March, 383-398. ___ (1992), "Trade Distortions, and Growth in Developing Countries", Journal of Economic Literature,
XXXI (3), September, 1358-1393. Jones. Ch. I. (1998), Introduction to Economic Growth. W. W. Norton and Co., New York, London. Lewis, W.A. (1977), The Evolution of the International Economic Order. Princeton University Press. Li, Q. and D. Papell (1999), “Convergence and International Output: Time Series Evidence for 16
Organization for Economic Cooperation and Development (OECD) countries” International Review of Economics and Finance, Vol. 8, No. 3:pp. 267-80
Lindert, P. and J.G. Williamson (2001), ‘Does Globalization Makes the World More Unequal? Paper prepared for the NBER conference Globalization in Historical Perspective, Santa Barbara , California, May 3-6, 2001.
Maddison, A. (2001), The World Economy. A Millennial Perspective. Development Centre Studies, Organization for Economic Cooperation and Development (OECD).
Mankiw, N.G., D. Roemer and D.N. Weil (1992), “A Contribution to the Empirics of Economic Growth” Quarterly Journal of Economics 107, May, pp. 407-437.
Marglin, S.A. and J. S. Schor (1991), The Golden Age of Capitalism. Oxford University Press. Milanovic, B (2001), “World Income Inequality in the Second Half of the Twenty Century” mimeo, World
Bank, June. ___ (1999), “True world income distribution , 1988 and 1993: First calculations based on households surveys
alone” World Bank Policy Research Working Papers Series No. 2244, November. O’Rourke (2001), “Globalization and Inequality: Historical Trends” mimeo, NBER and CEPR. O’Rourke, K.H. and J.G. Williamson (2000), Globalization and History. The Evolution of a Nineteenth-
Century Atlantic Economy. The MIT Press. Ocampo, J.A. (2001), “International Asymmetries and the Design of the International Financial System” Serie
Temas de Coyuntura, ECLAC, United Nations. ___ (2000), “Developing Countries’Anti-Cyclical Policies in a Globalized World” Serie Temas de Coyuntura,
ECLAC, United Nations. Pritchett, L. (1997), “Divergence, Big Time” The Journal of Economic Perspectives, vol. 11, No. 3, summer. Quah, D. (1999), “6 x10(9) : Some Dynamics of Global Inequality and Growth” mimeo, London School of
Economics, United Kingdom. Ravallion, M. and S. Chen (1999), "When Economic Reform is Faster than Statistical Reform: Measuring and
Explaining Income Inequality in Rural China", World Bank Policy Research Working Paper Series No. 1902. The World Bank.
Ravallion, M. and G. Datt (2000), "When Growth is Pro-Poor? Evidence from the Diverse Experience of Indian States", World Bank Policy Research Working Papers Series No. 2263. The World Bank.
Rodriguez, F. and D. Rodrik (1999), “Trade Policy and Economic Growth: A Skeptic’s Guide to the Cross- National Evidence”, Cambridge, MA, NBER Working Paper 7081.
Sachs, J. and A. Warner (1995), “Economic Reform and the Process of Global Integration” Brookings Papers on Economic Activity, 1:95.
Schultz, T. P. (1998), “Inequality in the Distribution of Personal income in the World: How it is Changing and Why”Journal of Population Economics, vol. 11, No. 3, pp. 307-344.
Solimano, A. ed. (2001b), “Globalization and National Development and the End of the 20th Century: Tensions, Challenges, Dilemmas” chapter 2 in Globalization, Trade and Technology and Trade in the 21st Century, in H. Singer, N. Hatti and R. Tandon, editors, Vedams Press, New Dehli , India.
___ (2001a), “ International Migration and the Global Economic Order: An Overview” World Bank Policy Research Working Paper Series No. 2720
___ (2000b), “ Can Reforming Global Institutions Help Developing Countries Share More in the Benefits of Globalization? World Bank Policy Research Working Paper Series No. 2518.
___ (1998), Social Inequality. Values, Growth and the State. The University of Michigan Press. ___ (1996), Roadmaps to Prosperity. Essays on Growth and Development . The University of Michigan
Press.

CEPAL - SERIE Macroeconomía del desarrollo N° 11
39
Solimano, A., E. Aninat and N. Birdsall eds. (2000), Distributive Justice and Economic Development. The Case of Chile and Developing Countries. The University of Michigan Press. Series Development and Inequality in the Market Economy.
Solow, R. M. (1956), “A Contribution to the Theory of Economic Growth” Quarterly Journal of Economics 70, February, pp. 65-94.
Stallings, B. (2001) “Globalization and Liberalization: The Impact on Developing Countries ” Serie Macroeconomia del Desarrollo, 4. Economic Development Division, ECLAC-UN.
Wood, A. (1997), “Openness and Wage Inequality in Developing Countries: The Latin American Challenge to East Asian Conventional Wisdom” The World Bank Economic Review, vol. 11, No. 1.
Yitzhaki, S. (1994), “Economic Distance and Overlapping of Distributions” Journal of Econometrics, 61:147-159.


CEPAL - SERIE Macroeconomía del desarrollo N° 11
41
Issues published 1. The Impact of Structural Reforms on Growth in Latin America and the Caribbean: An Empirical Estimation,
Hubert Escaith and Samuel Morley (LC/L.1446-P), Sales N° E.00.II.G.123 (US$ 10.00), 2000. www
2. Modernización económica y empleo en América Latina. Propuestas para un desarrollo incluyente, Tilman Atenburg, Regine Qualmann y Jürgen Weller (LC/L.1512-P), N° de venta S.01.II.G.55 (US$ 10.00), 2001. www
3. Exportaciones de manufacturas de América Latina: ¿Desarme unilateral o integración regional?, José Miguel Benavente, (LC/L.11523-P), N° de venta S.01.II.G.66 (US$ 10.00), 2001. www
4. Globalization and Liberalization: The Impact on Developing Countries, Barbara Stallings, (LC/L.1571-P), Sales N° E.01.II.G.114 (US$ 10.00), 2001. www
5. Job Creation in Latin America in the 1990s: The Foundation for Social Policy, Barbara Stallings and Jürgen Weller (LC/L.1572-P), Sales N° E.01.II.G.115 (US$ 10.00), 2001. www
6. Procesos de exclusión e inclusión laboral: la expansión del empleo en el sector terciario, Jürgen Weller, (LC/L.1649-P), N° de venta S.01.II.G.187 (US$ 10.00), 2001. www
7. Tributación ambiental, macroeconomía y medio ambiente en América Latina: aspectos conceptuales y el caso de Brasil, Ronaldo Seroa da Motta, (LC/L.1650-P), N° de venta S.01.II.G.188 (US$ 10.00), 2001. www
8. Long Run Economic Development in Latin America in a Comparative Perspective: Proximate and Ultimate Causes, André A. Hofman, (LC/L.1665-P), Sales N° E.01.II.G.199 (US$ 10.00), 2001. www
9. Financial Regulation and Supervision in Emerging Markets: The Experience of Latin America since the Tequila Crisis, Barbara Stallings and Rogerio Studart, (LC/L.1670-P), Sales N° E.01.II.G.205 (US$ 10.00), 2001. www
10. La problemática de la coordinación de políticas económicas, Christian Ghymers, (LC/L.1674-P), N° de venta S.01.II.G.209 (US$ 10.00), 2001. www
11. The Evolution of World Income Inequality: Assessing the Impact of Globalization, Andrés Solimano, (LC/L.1686-P), Sales N° E.01.II.G.124 (US$ 10.00), 2001. www
�
• Readers wishing to obtain the above publications can do so by writing to the following address: ECLAC, Economic Development Division, Casilla 179-D, Santiago, Chile. Some issues may not be available.
• Publications available for sale should be ordered from the Distribution Unit, ECLAC, Casilla 179-D, Santiago, Chile, Fax (562) 210 2069, [email protected].
• www: These publications are also available on the Internet: http://www.eclac.cl.
Serie
macroeconomía del desarrollo
Name:.............................................................................................................................................................................. Activity:........................................................................................................................................................................... Address: .......................................................................................................................................................................... Postal code, city, country:................................................................................................................................................ Tel.:........................................................................................................Fax:.................................................................. E-Mail: ............................................................................................................................................................................