Embed Size (px)
Citation preview
Stellingen behorende bij het proefschrift
The evolutionary ecology of mutualism
door
Aniek Barbara Françoise Ivens
1. Three common species of root aphids farmed by the ant Lasius flavus are characterised by clonal
reproduction, rare dispersal and (genetic) monocultures at the lowest spatial scale. Such a combination of symbiont characteristics is commonly found in farming mutualisms and likely constitutes a general set of necessary conditions for the evolutionary stability of these systems. This thesis, Chapters 1, 2, 3, 4 and 8; e.g. Poulsen & Boomsma 2005 Science; Aanen et al. 2009 Science
2. ‘Cattle farming’ by the ant L. flavus can be considered ‘niche construction’, since the ‘in-house’ availability of cattle-provided sugars and proteins allows for an exceptionally high density of this species in salt-marsh habitats; this domestication process can thus be considered analogous to the dramatic increase in human population densities after our ancestor’s cultural transition to a farming lifestyle. This thesis, Chapter 4; Larsen 1995 Ann. Rev. Antropology; Laland & Boogert 2010 Ecol. Economics
3. Despite the importance of partner choice for the stability of many mutualisms, the low aphid diversity observed in L. flavus mounds can more parsimoniously be attributed to passive mechanisms of dispersal and local asexual reproduction in the root aphids rather than to active choice by the ants. This thesis, Chapters 2, 4, 7 and Box A
4. Choosing to stick with cooperative partners does not automatically lead to the evolution of more cooperation. This thesis, Chapters 6 and 7
5. Models involving conditional strategies can yield counter-intuitive results and novel ‘out-of-the-box’
insights, which can give rise to future research avenues of explicit hypothesis testing. This thesis, Chapters 6 and 7
6. Low cost-benefit ratios and asymmetry in cooperative investments are key ingredients for successful mutualism. This thesis, Chapters 7, 8
7. Up to 9.5 million tons of food is wasted in The Netherlands annually; this is largely because little value is given to food throughout the complete food chain. Therefore, an important lesson remains to be learned from yellow meadow ants: “De [L. flavus] mieren kennen er [het vee] de waarde van, het is hun schat” (In: “De wijsheid der mieren” by Prof. F.J.J. Buytendijk, 1922). De Nationale DenkTank 2012
8. Parallel study of multiple study systems is needed to identify general patterns in biology. However, conducting a classical, descriptive study can be a handicap to (young) scientists developing novel study systems in evolutionary ecology, since the highest ranking journals prefer studies involving fancy new research technology. Yet, basic descriptive studies of a system’s biology are indispensable for making the application of these techniques to novel study systems worthwhile for between-system comparison.
9. PhD curricula could be better adapted to the future careers of the students following them, because they appear mostly designed to prepare students for a career in science, while >30% of the students pursue a career outside academia directly after completion of their PhD. Sonneveld et al. 2010, IVLOS, Larsen & Lubbe 2008, VSNU
10. People who say ‘yes’ are rewarded by the adventures they have; people who say ‘no’ are rewarded by the
safety they attain. “Impro” by K. Johnstone, 1979

The evolutionary ecology of mutualism
A.Ivens-diss 16-10-2012 11:14 Pagina 1
This PhD project was carried out at the Theoretical Biology Group, which isfpart of the Centre for Ecological and Evolutionary Studies of the University of
Groningen (The Netherlands), according to the requirements of the GraduatefSchool of Science (Faculty of Mathematics and Natural Sciences, University of
Groningen). Part of this project was also carried out at the Centre for SocialEvolution, Department of Biology, University of Copenhagen, Denmark.
Aniek Ivens received a PhD-grant from the Faculty of Mathematics andNatural Sciences following top-master programme Evolutionary Biology. Theresearch was supported by the Pieter Langerhuizen Stipedium and by StichtingNicolaas Mulerius Fonds. The printing of this thesis was partly funded by theUniversity of Groningen and the Faculty of Mathematics and Natural Sciences,University of Groningen.
Lay-out and figures: Dick VisserCover art work: Marlies HulzebosCover design: Aniek IvensPictures: All by Aniek Ivens, except for Figure 1.3C by Thijs Janzen
and the picture on page 192 by Jeroen KuijpersPrinted by: Ipskamp Drukkers, Enschede
ISBN: 978-90-367-5828-4ISBN: 978-90-367-5827-7 (electronic version)
A.Ivens-diss 16-10-2012 11:14 Pagina 2
RIJKSUNIVERSITEIT GRONINGEN
The evolutionary ecology of mutualism
Proefschrift
ter verkrijging van het doctoraat in deWiskunde en Natuurwetenschappenaan de Rijksuniversiteit Groningen
op gezag van de Rector Magnificus, dr. E. Sterken,RRin het openbaar te verdedigen op
vrijdag 23 november 2012om 16.15 uur
door
Aniek Barbara Françoise Ivens
geboren op 22 augustus 1983te Heerlen
A.Ivens-diss 16-10-2012 11:14 Pagina 3

fPromotores: Prof. dr. F.J. Weissing
Prof. dr. J.J. Boomsma
Prof. dr. I.R. Pen
Beoordelingscommissie: Prof. dr. N.E. Pierce
Prof. dr. K.R. Foster
Prof. dr. B.J. Zwaan
A.Ivens-diss 16-10-2012 11:14 Pagina 4

De mierIk heb sinds kort een mier,ik noem het beessie Bartje,'t is zo'n mieren-mini-dier,
hij heeft een héél klein hartje,maar dikwijls denk ik, sapperloot,
wat leeft er in die kleine?'t Geheim in hem is nét zo groot
of groter dan het mijne.
- Toon Hermans (1983)-
Voor Barbara en FrançoisVV
A.Ivens-diss 16-10-2012 11:14 Pagina 5

A.Ivens-diss 16-10-2012 11:14 Pagina 6
Contents
CHAPTER 1 General introduction and thesis outline 9
CHAPTER 2 Reproduction and dispersal in an ant-associated root aphid community 29RR
CHAPTER 3 Estimating the frequency of sexual reproduction in root aphids based on 53microsatellite markers
CHAPTER 4 Ants farm subterranean aphids mostly in clonal groups - an example of 67prudent husbandry for carbohydrates and proteins?
BOX A Partner choice in a farming mutualism: do ants display preference for 87certain homopteran symbionts?
CHAPTER 5 Characterisation and cross-amplification of polymorphic microsatellite loci 99in ant-associated root-aphids
BOX B MLGsim 2.0: updated software for detecting clones from microsatellite data 107using a simulation approach
CHAPTER 6 Conditional dispersal can promote and hamper cooperation in 113unexpected ways
CHAPTER 7 Does joint evolution of cooperativeness and conditional dispersal promote 135the evolution of mutualism?
CHAPTER 8 Epilogue: what have we learned about farming mutualism? 151
References 165RR
Samenvatting 179
Acknowledgements 187
Curriculum vitae 192
Author affiliations and contact information 193AA
A.Ivens-diss 16-10-2012 11:14 Pagina 7

A.Ivens-diss 16-10-2012 11:14 Pagina 8
General introduction and thesis outline
A k B F IAniek B.F. Ivens
CH
AP
TER1
A.Ivens-diss 16-10-2012 11:14 Pagina 9
MUTUALISM
Mutualism, an interaction between different species that is beneficial for all actors, is wide-spread throughout nature. To a large extent, mutualism has shaped, and is still shaping, lifeon this planet. In fact, life as we know it would not have existed without mutualistic rela-tionships. For example, all eukaryotic life is based on ancient endosymbiotic mutualismsbetween its cells and formerly independent microorganisms (e.g. mitochondria, plasmids)(Margulis 1971). Other mutualisms are known to have major impact on ecosystem stability,such as specialized interactions between flowering plants and their pollinators, or seed dis-persal by birds, mammals and other animals. The mutualistic relationship between humansand their agricultural crops and domesticated animals was key to the dominant role ourspecies is now playing on our planet (Larsen 1995; Stachowicz 2001; Leigh 2010).
Already from these few examples it becomes clear that mutualism comes in many dif-ferent types and forms. Known mutualisms range from one-to-one interactions [e.g. cleanerfish that clean their client fish (Bshary & Grutter 2002; Bshary et al. 2002; Bshary &Grutter 2006)] to mutualistic networks with many partners interacting with many, such asseveral species of pollinators interacting simultaneously with several species of floweringplants (Bascompte et al. 2006). Some mutualisms are associations for life or even multiplegenerations [e.g. endosymbionts such as our gut-bacteria (Bäckhed et al. 2005; Booijink tetal. 2007) or fungus-growing ants that farm their mutualistic fungus in their nest (Mueller2002; Poulsen & Boomsma 2005)], whereas other interactions are only short-termed [e.g.fig-wasps that only complete part of their life cycle inside fig fruits (West & Herre 1994;Jander & Herre 2010)]. In addition, mutualisms can also differ in how dependent partnersare on the interaction for survival and maximization of their reproductive success. In obli-gate mutualisms partners fully depend on each other and the interaction, whereas in facul-tative mutualisms the partners’ fitness is enhanced by the interaction, but partners canalso survive and reproduce on their own. Lastly, the nature of goods or services exchangeddiffers significantly between mutualisms: some rely on transportation, others on nutritionor protection (Bronstein 2001).
Despite its importance for all aspects of life and its huge diversity, mutualism has his-torically received much less attention than other ecologically and evolutionarily importantprocesses, such as competition, host-parasite interactions, trophic relationships, or within-species cooperation. Only in the last two decades, ecologists and evolutionary biologistsare starting to realize that the eco-evolutionary causes, consequences and stability of mutu-alism are still poorly understood (as pointed out by Herre et al. 1999). With this disserta-
ftion, I aim to contribute to a better general understanding of the evolutionary ecology ofmutualism. To this end, I have combined two complementary approaches: a specializedempirical approach via a detailed case study of a farming mutualism, that of the under-ground ant Lasius flavus tending various species of root aphids inside its nest (Chapters 2-5), and a more general theoretical approach, via the development of models about theevolutionary emergence and stability of between- and within-species cooperation(Chapters 6, 7).
This chapter serves as an introduction to both approaches. First, I will introduce theevolutionary problem of cooperation, with emphasis on mutualism, by briefly reviewing
10
CH
AP
TER
1
A.Ivens-diss 16-10-2012 11:14 Pagina 10
the existing body of literature and highlighting the most important advances so far. I willalso introduce the most relevant terms (Table 1.1). This is followed by an introduction tothe particular group of farming mutualisms that my empirical studies address. Lastly, I willgive a brief overview of the aims and contents of the thesis.
THE PUZZLE OF WITHIN-SPECIES COOPERATION
Natural selection acts through competition for reproduction and survival. How then canindividuals evolve to help others with costly behaviour, whereas it would be more benefi-cial to reap the benefits without paying the costs? Cooperation poses a particular problemif social dilemmas arise, i.e. when the group as a whole would profit most if all memberswould contribute to a common good, but where individual members would profit most bywould contribute to a common good, but where individual members would profit most bynot contributing, that is by ‘cheating’. But even in situations where all participants have anindividual incentive to cooperate, the evolution of cooperation is not self-evident, forexample when the cost and benefits of the interaction are asymmetrically distributed. Thewwidespread occurrence of cooperation and its evolution pose a problem that has been oneof the most hotly debated issues in evolutionary biology for several decades now (amongothers Hamilton 1964a; 1964b; Trivers 1971; West-Eberhard 1975; Axelrod & Hamilton
y1981; Brown 1983; Queller 1985; Bull & Rice 1991; Fletcher & Doebeli 2009, recentlyreviewed in Sachs et al. 2004; West et al. y2007; Bourke 2011). The controversy evoked bya recent paper on the evolution of eusociality (Nowak et al. 2010; Abbot et al. 2011;Boomsma et al. 2011; Ferrière & Michod 2011; Nowak et al. 2011) indicates that eventoday this problem remains a hot topic. Over the years, major conceptual advancementshave been made to resolve this evolutionary puzzle. Quite a number of reviews appearedthat tackled classification of the mechanisms that have been recognized to promote theevolution of cooperation (beneficial interactions between both actors) and, more specifi-cally, altruism (within-species cooperative behaviour that is costly to the partner and bene-ficial to the recipient) (Sachs et al. 2004; Nowak 2006; West et al. 2007). In my view thesemechanisms can be crudely divided in two groups: the first consisting of mechanisms thatpromote non-random associations fof interacting partners and the second consisting ofmechanisms for the expression of conditional strategies. I will now discuss these two groupsin more detail separately.
Mechanisms promoting non-random associationsAAs opposed to when interactions take place between random partners, interactions in non-random associations take place between partners with a similar type of strategy, e.g. coop-erative individuals interact with other cooperative individuals and non-cooperative oneswwith other non-cooperative individuals. Mechanisms that promote such positive assort-ment of cooperators include kin selection, which is relevant for the evolution of altruism(Hamilton 1964a; 1964b) and passive assortment mechanisms (Queller 1992; 1994;Fletcher & Doebeli 2009) such as population viscosity, that cause cooperative individualsto encounter other co-operators more often than cheaters and vice versa (as seen forexample in bacterial biofilms (Hallatschek et al. 2007; Nadell et al. 2010). Positive assort-
11
INTR
OD
UC
TIO
N
A.Ivens-diss 16-10-2012 11:14 Pagina 11
ment of cooperators reduces the benefits to be gained by cheaters: because cheaters andcooperators mix to a lesser extent, cheating individuals cannot exploit the cooperative com-munity.
Conditional strategiesThe second group of mechanisms consists of conditional strategies, in which the behaviourof an individual depends on its social context: what others do and who others are. A clas-sical example of cooperation through conditional strategies is reciprocityrr , where individualshave the opportunity to leave interactions when cheated upon (Trivers 1971). Well-knownexamples of the study of cooperation through reciprocity are the numerous studies dealingwwith the Iterated Prisoner’s Dilemma (IPD) in game theory. The non-iterated version of thisgame is the prototype example of a social dilemma involving two players (the ‘prisoners’),for whom, although cooperation (‘not confessing a common crime’) would the best optionfor both players, defecting (‘confessing’) remains the dominant strategy, because it yieldsindividually the highest benefit if one does not know what the other participant will do. Asa consequence, the game-theoretical solution (‘both players confess’) corresponds to anoutcome where both players are worse off than if they both had cooperated in denial. Ithas been shown that the dilemma can – at least partly – be resolved if the players do notplay the game once but repeatedly (potentially infinitely). Some of the solutions corre-spond to a cooperative outcome. Much discussed strategies leading to cooperation are ‘Tit-For-T- at’ and related strategies (TT e.g. Axelrod & Hamilton 1981; Selten & Hammerstein 1984;Nowak & Sigmund 1993), where each player decides whether to cooperate or defect basedon previous experiences with the partner. The chance to decide to continue an interactionor abandon a defecting partner has been termed partner fidelity in mutualism literature(see below). Another well-known example of conditional strategies promoting cooperationis the green beard theory (among others Hamilton 1964b; Dawkins 1976; Jansen & van
yBaalen 2006), in which individuals only cooperate with others that carry a trustworthy‘green beard’ marker that is correlated with cooperativeness. Besides theoretical studies,genes that operate together with a kin effect as ‘green beard’ – genes have now also beenempirically identified, for example in social amoeba Dictyostelium and red fire ants (Keller& Ross 1998; Queller et al. 2003). A last major category of conditional strategy–mecha-nisms is part of the Biological Market Theory (BMT) (Noë & Hammerstein 1994). BMTapplies market mechanisms known from economy to biological contexts and is based onthe idea that individuals do not engage in interactions with everybody, but only do so withcooperators (partner choice( ). Partner choice, partner fidelity and their possible interactionhave, however, seldom been studied simultaneously. In my thesis, I will address the rela-tive importance of partner fidelity and partner choice in joint evolution with intraspecificcooperation (Chapter 6).
Both groups of mechanisms listed can lead to the same end results: positive assortmentof co-operators. Therefore, these mechanisms are not mutually exclusive. Over the last fewyyears, attention of the literature shifted from studying altruism towards cooperation
ybetween non-kin and focussing on conditional strategies. Nevertheless, kin selection theorystill provides one of the most important explanations for the evolution of cooperation innature (with the potential exclusion of humans) (Hamilton 1964a; 1964b; Bourke 2011).
12
CH
AP
TER
1
A.Ivens-diss 16-10-2012 11:14 Pagina 12
THE EVEN GREATER PUZZLE OF BETWEEN-SPECIES COOPERATION
Kin selection theory is based on interacting partners carrying with a high probability iden-tical genes (through identity by descent (IBD)). However, in interspecific cooperation IBDcannot apply because interacting individuals of different species each have separate genepools. The existence of a wide diversity of mutualisms in which different species seem tohelp each other thus poses several unsolved evolutionary problems. In fact, Darwin (1859)already pointed out in his chapter on difficulties on his theory, that no species will everevolve traits or behaviour for the exclusive good of another species:
‘Natural selection will produce nothing in one species for the exclusive good or injury ofanother; though it may as well produce parts, organs, and excrements highly useful oreven indispensable (...) to another species, but in all cases at the same time useful to theowner.’
Both the evolutionary emergence of mutualism and the maintenance of mutualism remainpoorly understood. How does cooperation between individuals of different species comeoff the ground to start with? Then, once a mutualistic interaction has been established,natural selection will continue to act on the separate partners and seldom on the mutual-ism as a whole. The partners may thus both be selected to reap the benefits from the inter-
faction without paying the costs of investment, causing cheating behaviour and conflicts ofinterests between the partners (Herre et al. 1999; Bronstein 2001; Bergstorm et al. 2002;Sachs & Simms 2006). For this reason, mutualism has previously also been defined as‘mutual exploitation with net benefits for both’ (Herre et al. 1999). How then can mutualismemerge? And what prevents subsequent mutualism breakdown when faced with cheatersand conflict between partners? Several mechanisms have been put forward that can
ypromote mutualism emergence and maintenance. These mechanisms are not mutuallyexclusive and can be simultaneously at work in shaping interspecific interactions. Here, Iwwill give a brief overview, albeit not exhaustive, of the main theoretical concepts concern-ing mutualism evolution and stability.
By-products and the importance of cost-benefit ratiosMany mutualisms may have started off as a by-product mutualism: a selfish act (i.e. per-formed solely for one’s own good), which results in a good or a service (the ‘by-product’)that is incidentally beneficial for a partner species (West-Eberhard 1975; Brown 1983;Connor 1995; Leimar & Connor 2003). Typically, these interactions start as asymmetricinteractions: one partner produces a by-product from which the other partner profits (suchan interaction is also called commensalism). Through co-adaptation of both partners thisexchange of by-products can then further evolve into mutualism (Connor 1995). In fact,some have argued that maybe all mutualisms that are known today started with by-prod-ucts in at least one of the partners (Connor 1995). Well-known examples of by-productmutualism are ant-homopteran interactions in which homopterans (aphids, coccids)provide their faeces (honeydew) to ants, which provide protective services in return(Connor 1995; Leimar & Connor 2003; Leigh 2010). For the by-product producing species,
13
INTR
OD
UC
TIO
N
A.Ivens-diss 16-10-2012 11:14 Pagina 13
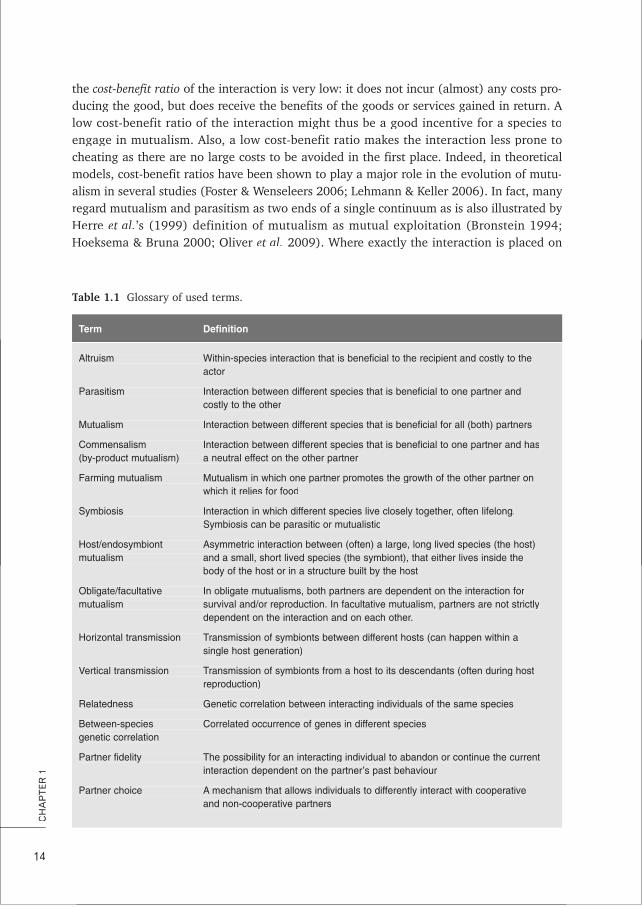
the cost-benefit ratio of the interaction is very low: it does not incur (almost) any costs pro-Aducing the good, but does receive the benefits of the goods or services gained in return. A
low cost-benefit ratio of the interaction might thus be a good incentive for a species toengage in mutualism. Also, a low cost-benefit ratio makes the interaction less prone tocheating as there are no large costs to be avoided in the first place. Indeed, in theoreticalmodels, cost-benefit ratios have been shown to play a major role in the evolution of mutu-
yalism in several studies (Foster & Wenseleers 2006; Lehmann & Keller 2006). In fact, manyr yegard mutualism and parasitism as two ends of a single continuum as is also illustrated byHerre et al.’s (1999) definition of mutualism as mutual exploitation (Bronstein 1994;Hoeksema & Bruna 2000; Oliver et al. 2009). Where exactly the interaction is placed on
14
CH
AP
TER
1
Table 1.1TT Glossary of used terms.
Term DefinitionTT
Altruism Within-species interaction that is beneficial to the recipient and costly to theactor
Parasitism Interaction between different species that is beneficial to one partner andcostly to the other
Mutualism Interaction between different species that is beneficial for all (both) partners
Commensalism Interaction between different species that is beneficial to one partner and has(by-product mutualism) a neutral effect on the other partner
Farming mutualism Mutualism in which one partner promotes the growth of the other partner onwhich it relies for food
Symbiosis Interaction in which different species live closely together, often lifelong.Symbiosis can be parasitic or mutualistic
Host/endosymbiont Asymmetric interaction between (often) a large, long lived species (the host)mutualism and a small, short lived species (the symbiont), that either lives inside the
body of the host or in a structure built by the host
Obligate/facultative In obligate mutualisms, both partners are dependent on the interaction formutualism survival and/or reproduction. In facultative mutualism, partners are not strictly
dependent on the interaction and on each other.
Horizontal transmission Transmission of symbionts between different hosts (can happen within asingle host generation)
Vertical transmission Transmission of symbionts from a host to its descendants (often during hostreproduction)
Relatedness Genetic correlation between interacting individuals of the same species
Between-species Correlated occurrence of genes in different speciesgenetic correlation
Partner fidelity The possibility for an interacting individual to abandon or continue the currentinteraction dependent on the partner’s past behaviour
Partner choice A mechanism that allows individuals to differently interact with cooperativeand non-cooperative partners
Term Definition
A.Ivens-diss 16-10-2012 11:14 Pagina 14
ythe continuum depends on its cost-benefit ratio. Over evolutionary time partners maymove along this continuum and the nature of the interactions can change as the partnersco-evolve. The continuum can be best thought of as a balance that can tip to both sides.Parasitism can evolve from mutualism if two partners are mutually dependent and thus‘trapped’ in the interaction and one of the partners evolves to exploit the other (Sachs &Simms 2006). Alternatively, parasitism can also be a starting point for mutualism if theparasitized host manages to evolve to profit from the presence of the parasite (Yamamura1993; Aanen & Hoekstra 2007).
Generalized kin selectionGenetic relatednessrr (through IBD) is not possible between individuals of different species.However, genetic correlation across species boundaries (= between-species genetic correla-tion f) can occur when two species enhance each other’s productivity because individuals ofboth species with similar traits tend to co-occur and interact. For example, in case of traitsinvolved in cooperation, this happens when between-species assortment causes coopera-
ftive individuals of one partner species to tend to interact with cooperative individuals ofthe other species (Queller 1985; Frank 1994; Doebeli & Knowlton 1998; Fletcher &Doebeli 2009). The presence of this between-species genetic correlation can thus promoteinterspecific cooperation.
ReciprocityRRRReciprocity, as discussed in the previous section on within-species cooperation, has beenput forward by Trivers (1971) (under the misleading name of ‘reciprocal altruism’) as amechanism that could favour cooperation between unrelated individuals, also of differentspecies. In the vast body of work inspired by this idea, the framework of the IPD has alsobeen applied to the study of mutualism in several theoretical models, even though IPDassumes a symmetric interaction whereas most mutualisms are asymmetric (among others
rBull & Rice 1991; Doebeli & Knowlton 1998; Hoeksema & Bruna 2000). Nevertheless, forthis framework of repeated interactions to apply in nature, at least one or both of thefollowing requirements needs to be fulfilled: (1) the partners have the ability to alter theirbehaviour in response to the outcome of previous interactions, i.e. fbreak up interactions ifdesired and (2) to choose with whom to interact. These two requirements each correspondto one of the factors put forward by Bull & Rice (1991): (1) partner fidelity and (2) rpartnerchoice. These factors have come to play a large role in theoretical as well as empiricalapproaches to mutualism and are still debated to date (Weyl et al. 2010; Kiers et al. 2011;WWeyl WW et al. 2011). I will discuss these factors in detail in the next paragraphs.
Partner fidelityPPartner fidelityPP translates to whether a partner will still be available for interaction in thenext round; in other words, partner fidelity offers interacting partners the possibility tochoose whether to continue or abandon an interaction. If partners repeatedly choose tocontinue the interaction, a partner fidelity feedback can occur. This long-term series createsa positive feedback loop between the fitness of the two partners: cooperation will indi-rectly, via its partner, benefit the actor (Bull & Rice 1991; Foster & Wenseleers 2006; Weyl
15
INTR
OD
UC
TIO
N
A.Ivens-diss 16-10-2012 11:14 Pagina 15
et al. k2010). Several mechanisms can favour the establishment of partner fidelity feedbackin nature, all of them causing the interacting partners to be connected in space and/ortime. For example, partners can co-disperse (in space) or co-reproduce (in time). If cooper-ative individuals of partner species tend to be spatially or temporally clustered, bothspecies will indirectly gain benefits from their own investment into cooperation with theother species, because these benefits are likely to be returned, hence partner fidelity feed-back can take effect.
Partner choice and sanctioningPPartner choicePP allows actors to discriminate between individuals of the partner species andspecifically direct cooperative actions towards cooperative individuals of the partners (Bull& Rice 1991). Partner choice thus can take two forms: selection of partners before engag-ing in interaction [so called ‘screening’, known from bobtail squids which selectively allowfluorescent bacteria to enter their body, (Archetti et al. 2011)] and sanctioning of non-cooperative partners [known from client fish which reject nibbling cleaner fish (Bshary &Grutter 2002) and plants which cut off nutrient supplies to bacteria that do not fix enoughnitrogen for them (Kiers et al. 2003)]. Partner choice and sanctioning have been exten-sively studied, both theoretically [mainly as part of the BMT (Noë & Hammerstein 1994)]and empirically [in among others cleaner fish, plant – rhizosphere systems and the bobtailsquid (Bshary et al. 2002; Kiers & Denison 2008; McFall-Ngai 2008)].
In this thesis, I modelled the joint evolution of partner fidelity, partner choice andmutualism (Chapter 7). The evolution of within – and between-species cooperation havehistorically been studied separately from each other, although similar if not identical mech-anisms may be at play. By deriving very similar models for within-species cooperation(Chapter 6) and between-species cooperation (Chapter 7), I will be able to closely comparethe results and we can gain further insight in the similarities and the differences betweenthese two processes.
FARMING MUTUALISMFF
Maybe it is simply not possible to cover the full diversity of mutualisms in a single theoret-ical framework. It is certainly not possible to cover the huge diversity of mutualisms in a
fsingle thesis. In the empirical part of this thesis, I therefore consider a particular kind ofmutualism, farming mutualism. In this section, I will zoom in on these interactions moreclosely.
In farming mutualisms, the host partner promotes the growth of a symbiont that itdepends on for food. This dependence includes both mutualistic systems in which the hostfeeds on goods produced by the symbiont and systems in which the host consumes thesymbiont [the latter is commonly called ‘cultivation mutualism’ (Hata & Kato 2006)].Many examples can be found in nature and these systems often show interesting parallelsto human practices of cattle breeding and crop growing. For example, several insects areknown to actively grow fungus as a crop in their nest, such as the leaf-cutter ants (Weber1972; Mueller et al. 2005; Poulsen & Boomsma 2005), fungus-growing termites (Aanen
16
CH
AP
TER
1
A.Ivens-diss 16-10-2012 11:14 Pagina 16
et al. 2002; Aanen et al. 2009) and ambrosia beetles (Farrell et al. 2001; Biedermann &T faborsky 2011). Other examples of crop growing include damselfish keeping gardens ofTTmultiple species of algae, which they actively protect from other grazers (Hata & Kato2006; Hata et al. 2010) and even Dictyostelium amoeba that prudently farm the bacteriathey eat (Brock et al. 2011). The best known examples of ‘cattle breeding’ are many differ-ent species of ants tending above ground or below ground homopterans for ‘milk’ (honey-dew) and sometimes ‘meat’ (Way 1963; Stadler & Dixon 2005; Stadler & Dixon 2008;Ben-Dov & Fischer 2010). These systems differ in how dependent participants are on theinteraction; both hosts and symbionts can be found that are obligately dependent on theother, but farming mutualisms can also be of facultative nature.
Farming mutualisms are inherently asymmetric: often the host species is larger, longerFFlived and engages in the interaction as a single individual (or colony). The symbiontspecies interacts often as a group of multiple individuals, has a short generation time andis smaller. Moreover, especially in systems where the host consumes the symbiont, the ben-efits to be gained by the host from the interaction stem directly from the ultimate sacrificeof the symbiont: giving its life. Generally, where species rely so closely on each other forsurvival and reproduction in an asymmetric interaction, the interests of the partners willnever be fully aligned and conflict lures around every corner. Because it is often the hostthat is in control over the symbiont, the three main arenas of host/symbiont conflict infarming mutualisms concern the symbiont life history characteristics (1) symbiont repro-
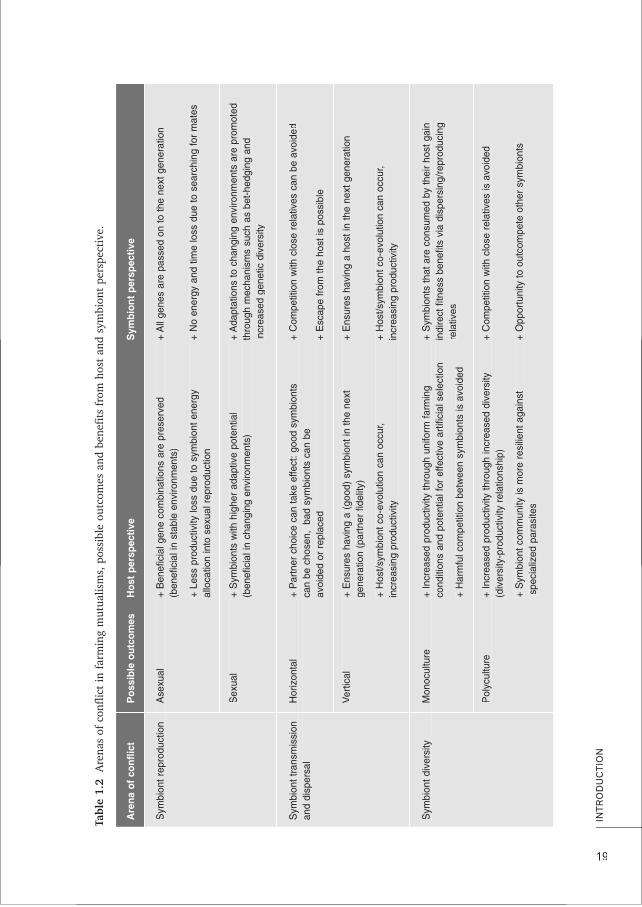
kductive mode, (2) symbiont transmission and dispersal, and (3) symbiont diversity (Frank1996; Herre et al. 1999; Mueller 2002). Indeed, host control over mutualistic symbionts isthought to be essential for evolutionary stability of mutualisms (Frank 1996; Herre et al.1999; Sachs et al. 2004; Archetti et al. 2011). However, are the hosts really in completecontrol and what outcomes of these conflicts are preferred by host and symbiont? Below, Iwwill introduce these three conflicts, their possible outcomes and host/symbiont perspec-
ytives in general (Table 1.2). After that, I will discuss how they potentially apply to mystudy system of ants farming root aphids, after having introduced that system in detail.
Symbiont reproductionIn terms of reproductive mode, it would be in the interest of the host to prevent the sym-biont from sexually reproducing: energy allocation to sexual reproduction is avoided andbeneficial combinations of genes are preserved, because they are not reshuffled by recom-bination. For the symbiont it would be beneficial to sexually reproduce to avoid inbreedingeffects and remain resilient in changing environments (Table 1.2). However, when hostsprovide very stable niches by creating a protective environment to symbionts (Law & Lewis1983; Law 1985; Wulff 1985), sexual reproduction might no longer be the preferred optionfor symbionts the environment no longer changes and the benefits of asexual reproduction(higher reproductive rate, not having to search for a mate) can take precedence. In thiscase, host control may thus emerge as a by-product of genotypic predictability. Indeed,several symbiotic bacteria such as Buchnera are both under host control through asexual,vvertical transmission and enjoy highly predictable growth conditions in specific host tissues(Moran et al. 2008). Fungus-growing termites are known to suppress sexual reproductionof their fungus except for short periods each year, and fungus-growing ants normally sup-
17
INTR
OD
UC
TIO
N
A.Ivens-diss 16-10-2012 11:14 Pagina 17
press sexual reproduction of their fungus permanently, so that clonal vertical transmissionis the rule (Weber 1972; Mueller et al. 1998; Bot et al. 2001; Aanen et al. 2009, but seeMikheyev et al. 2006).
Symbiont transmission and dispersalSymbionts can be either horizontally or vertically transmitted. Under horizontal transmis-sion, symbionts disperse independently from their host. Typically, at the beginning of ahost generation, hosts associate with symbionts that are unrelated to symbionts with whichtheir parents were associated. Under vertical transmission, symbionts are transmitted todescendants of their previous hosts during host reproduction. Vertical transmission is inthe interest of both host and symbiont on the long-term, because it allows co-evolutionbetween the mutualistic partners and hence productivity of the system can increase.Horizontal transmission, however, allows the symbiont on the short term to escape lessbeneficial interactions and to explore new habitats and avoid competition with close rela-tives (Hamilton & May 1977). Also, horizontal transmission allows the host to chooseamong potential symbionts and select the best partners (Table 1.2). Vertical transmissionoccurs in many mutualisms, ranging from endosymbionts such as Buchnera referred toabove to ectosymbionts such as the fungus-growing attine ants in which virgin queenscarry a piece of fungus from their natal nest on their nuptial flight (Weber 1972, but seePoulsen et al. 2009), two species of fungus-growing termites which carry asexual fungusspores on their mating flight (Korb & Aanen 2003) or ant-tended coccids that climb the
yback of virgin queens ready for take-off (Hölldobler & Wilson 1990). There are also plentyof examples of horizontal symbiont transmission, such as the fungus of several fungus-growing termites (Aanen et al. 2002) and above-ground aphids tended by ants (Yao 2010;VVantaux VV et al. 2011a).
Symbiont diversityThe conflict on symbiont diversity deals with the question of polyculture versus monocul-ture, a topic that is also debated with respect to human agriculture. From the symbiont’svviewpoint, some diversity might be preferred, because this would prevent competition withclose relatives and the chance to outcompete non-relatives (Frank 1996). Mutualistic hostsmay, however, favour predominant or exclusive monocultures if coexistence of multiplestrains or species within the same host allows costly contest competition (Frank 1996) orfree-riding by underperforming symbionts, leading to a direct reduction in overall produc-tivity (e.g. Bronstein 2001; Kiers & Denison 2008). Moreover, competition among sym-bionts may also select for virulent competitive traits that will indirectly also harm the host(Wulff 1985; Frank 1996). In addition, the high symbiont relatedness encountered inmonocultures will allow the host to effectively select productive symbionts through artifi-cial selection. Also, uniform conditions allowed by monoculture may increase mutualismproductivity in undisturbed environments. This latter argument, however, remains debated,because a community of multiple symbionts might also offer a broader spectrum of serv-ices or might be less vulnerable to parasites (e.g. van Borm et al. 2002). Host control oversymbiont diversity generally happens through specific mechanisms of symbiont screeningupon admission (Archetti et al. 2011) or symbiont rewarding/sanctioning in proportion to
18
CH
AP
TER
1
A.Ivens-diss 16-10-2012 11:14 Pagina 18
19
INTR
OD
UC
TIO
N
Tabl
e 1.
2TT
Are
nas
of c
onfl
ict
in f
arm
ing
mut
ualis
ms,
pos
sibl
e ou
tcom
es a
nd b
enef
its
from
hos
t an
d sy
mbi
ont
pers
pect
ive.
Are
na o
f co
nflic
tP
ossi
ble
outc
omes
Hos
t pe
rspe
ctiv
eS
ymbi
ont
pers
pect
ive
Sym
bion
t rep
rodu
ctio
nA
sexu
al+
Ben
efic
ial g
ene
com
bina
tions
are
pre
serv
ed+
All
gene
s ar
e pa
ssed
on
to th
e ne
xt g
ener
atio
n(b
enef
icia
l in
stab
le e
nviro
nmen
ts)
+ Le
ss p
rodu
ctiv
ity lo
ss d
ue to
sym
bion
t ene
rgy
+ N
o en
ergy
and
tim
e lo
ss d
ue to
sea
rchi
ng fo
r m
ates
allo
catio
n in
to s
exua
l rep
rodu
ctio
n
Sex
ual
+ S
ymbi
onts
with
hig
her
adap
tive
pote
ntia
l+
Ada
ptat
ions
to c
hang
ing
envi
ronm
ents
are
pro
mot
ed
(ben
efic
ial i
n ch
angi
ng e
nviro
nmen
ts)
thro
ugh
mec
hani
sms
such
as
bet-
hedg
ing
and
incr
ease
d ge
netic
div
ersi
ty
Sym
bion
t tra
nsm
issi
onH
oriz
onta
l+
Par
tner
cho
ice
can
take
effe
ct: g
ood
sym
bion
ts+
Com
petit
ion
with
clo
se r
elat
ives
can
be
avoi
ded
and
disp
ersa
lca
n be
cho
sen,
ba
d sy
mbi
onts
can
be
avoi
ded
or r
epla
ced
+ E
scap
e fr
om th
e ho
st is
pos
sibl
e
Ver
tical
+ E
nsur
es h
avin
g a
(goo
d) s
ymbi
ont i
n th
e ne
xt+
Ens
ures
hav
ing
a ho
st in
the
next
gen
erat
ion
gene
ratio
n (p
artn
er fi
delit
y)
+ H
ost/s
ymbi
ont c
o-ev
olut
ion
can
occu
r,+
Hos
t/sym
bion
t co-
evol
utio
n ca
n oc
cur,
incr
easi
ng p
rodu
ctiv
ityin
crea
sing
pro
duct
ivity
Sym
bion
t div
ersi
tyM
onoc
ultu
re+
Incr
ease
d pr
oduc
tivity
thro
ugh
unifo
rm fa
rmin
g+
Sym
bion
ts th
at a
re c
onsu
med
by
thei
r ho
st g
ain
cond
ition
s an
d po
tent
ial f
or e
ffect
ive
artif
icia
l sel
ectio
nin
dire
ct fi
tnes
s be
nefit
s vi
a di
sper
sing
/rep
rodu
cing
rela
tives
+ H
arm
ful c
ompe
titio
n be
twee
n sy
mbi
onts
is a
void
ed
Pol
ycul
ture
+ In
crea
sed
prod
uctiv
ity th
roug
h in
crea
sed
dive
rsity
+ C
ompe
titio
n w
ith c
lose
rel
ativ
es is
avo
ided
(div
ersi
ty-p
rodu
ctiv
ity r
elat
ions
hip)
+ S
ymbi
ont c
omm
unity
is m
ore
resi
lient
aga
inst
+ O
ppor
tuni
ty to
out
com
pete
oth
er s
ymbi
onts
spec
ializ
ed p
aras
ites
Are
na o
f co
nflic
tP
ossi
ble
outc
omes
Hos
t pe
rspe
ctiv
eS
ymbi
ont
pers
pect
ive
A.Ivens-diss 16-10-2012 11:14 Pagina 19
performance (Kiers & Denison 2008; Weyl et al. 2010). The relative importance of thesemechanisms is somewhat controversial, but available data suggest that monocultures are
fcommonly found in the farming mutualisms that have been studied, from the gardens ofalgae-growing damselfish (Hata & Kato 2002) to those of fungus-growing termites andants (Bot et al. 2001; Poulsen & Boomsma 2005; Aanen et al. 2009; Mueller et al. 2010).In fungus-farming leaf-cutting ants, monocultures appear to be enforced by a combinationof incompatibility between genetically different symbiont strains and active symbiont polic-ing by the hosts (Poulsen & Boomsma 2005; Ivens et al. 2009; Mueller et al. 2010),wwhereas a simple mechanism of positive frequency-dependent propagation within estab-lished colonies appears sufficient to enforce life-time commitment between a termite hostcolony and a single symbiont clone (Aanen et al. 2009). However, more studies are neededto establish the generality of this principle, particularly for farming mutualisms wherehosts are able to segregate symbionts in space (compartmentalization) or time to avoidcompetition (Palmer et al. 2010), so that the benefits of polyculture might surpass thecosts.
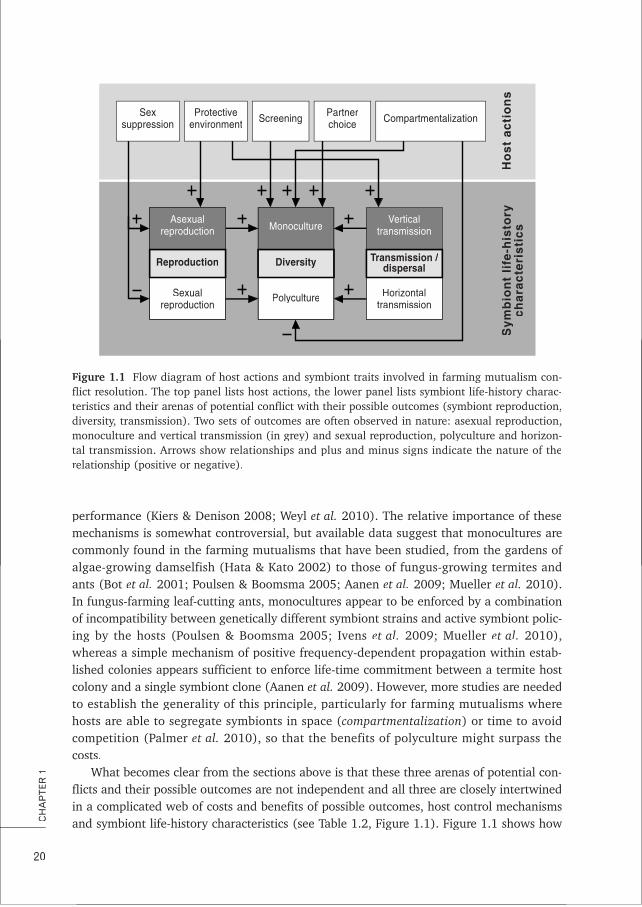
What becomes clear from the sections above is that these three arenas of potential con-flicts and their possible outcomes are not independent and all three are closely intertwinedin a complicated web of costs and benefits of possible outcomes, host control mechanisms
wand symbiont life-history characteristics (see Table 1.2, Figure 1.1). Figure 1.1 shows how
20
CH
AP
TER
1
Sexsuppression
Protectiveenvironment Screening Partner
choice Compartmentalization
Asexualreproduction
Sexualreproduction
Reproduction
Monoculture
Polyculture
Diversity
Verticaltransmission
Horizontaltransmission
Transmission /dispersal
Sy
mb
ion
t li
fe-h
isto
ryc
ha
rac
teri
sti
cs
Ho
st
ac
tio
ns
Figure 1.1 f fFlow diagram of host actions and symbiont traits involved in farming mutualism con-flict resolution. The top panel lists host actions, the lower panel lists symbiont life-history charac-teristics and their arenas of potential conflict with their possible outcomes (symbiont reproduction,diversity, transmission). Two sets of outcomes are often observed in nature: asexual reproduction,monoculture and vertical transmission (in grey) and sexual reproduction, polyculture and horizon-tal transmission. Arrows show relationships and plus and minus signs indicate the nature of therelationship (positive or negative).
A.Ivens-diss 16-10-2012 11:14 Pagina 20
ythe alternative outcomes of the three conflicts are influenced directly and indirectly bymechanisms of host control (top panel) and interactions among each other (lower panel).In practice, two sets of outcomes are often found in nature: (1) asexual reproduction,monocultures and vertical transmission (given in grey) vs. (2) sexual reproduction, poly-cultures and horizontal transmission.
LL. FLAVUS ANTS FARMING ROOT APHIDS – A CASE STUDY
The study systemwThe focal empirical study system of this thesis is the interaction between the Yellow
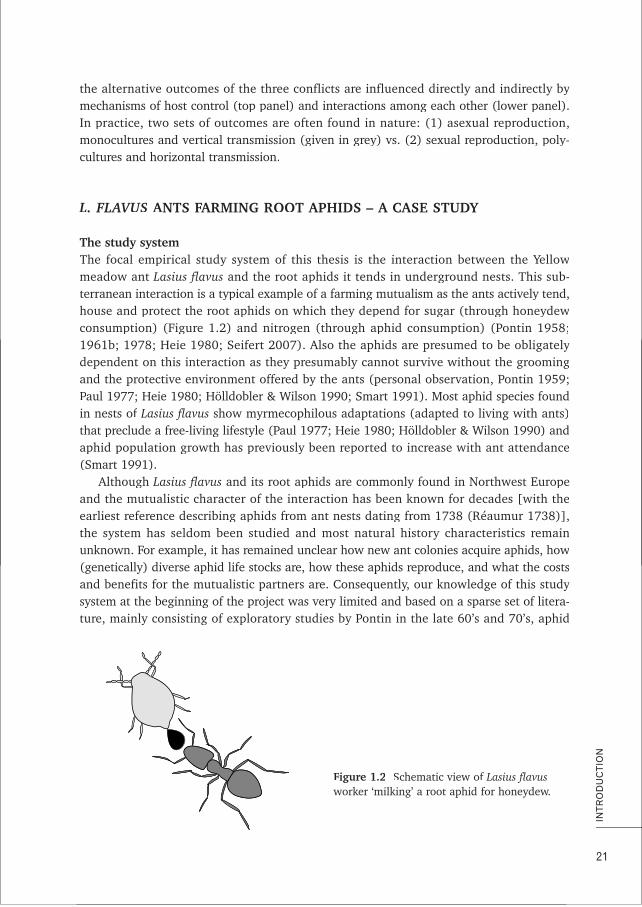
meadow ant Lasius flavus and the root aphids it tends in underground nests. This sub-terranean interaction is a typical example of a farming mutualism as the ants actively tend,house and protect the root aphids on which they depend for sugar (through honeydewconsumption) (Figure 1.2) and nitrogen (through aphid consumption) (Pontin 1958;
y1961b; 1978; Heie 1980; Seifert 2007). Also the aphids are presumed to be obligatelydependent on this interaction as they presumably cannot survive without the groomingand the protective environment offered by the ants (personal observation, Pontin 1959;Paul 1977; Heie 1980; Hölldobler & Wilson 1990; Smart 1991). Most aphid species foundin nests of Lasius flavus show myrmecophilous adaptations (adapted to living with ants)that preclude a free-living lifestyle (Paul 1977; Heie 1980; Hölldobler & Wilson 1990) andaphid population growth has previously been reported to increase with ant attendance(Smart 1991).
Although Lasius flavus and its root aphids are commonly found in Northwest Europeand the mutualistic character of the interaction has been known for decades [with theearliest reference describing aphids from ant nests dating from 1738 (Réaumur 1738)],the system has seldom been studied and most natural history characteristics remain
wunknown. For example, it has remained unclear how new ant colonies acquire aphids, how(genetically) diverse aphid life stocks are, how these aphids reproduce, and what the costs
yand benefits for the mutualistic partners are. Consequently, our knowledge of this studysystem at the beginning of the project was very limited and based on a sparse set of litera-ture, mainly consisting of exploratory studies by Pontin in the late 60’s and 70’s, aphid
21
INTR
OD
UC
TIO
N
Figure 1.2 fSchematic view of Lasius flavuswworker ‘milking’ a root aphid for honeydew.
A.Ivens-diss 16-10-2012 11:14 Pagina 21
records by Heie (1980), two British dissertations (Paul 1977; Smart 1991) and two Danishstudies from the early 90’s (Godske 1991; 1992). Below, I will describe the ‘players’ of themutualism in more detail, as well as the scope for conflict and cooperation in this mutualism.
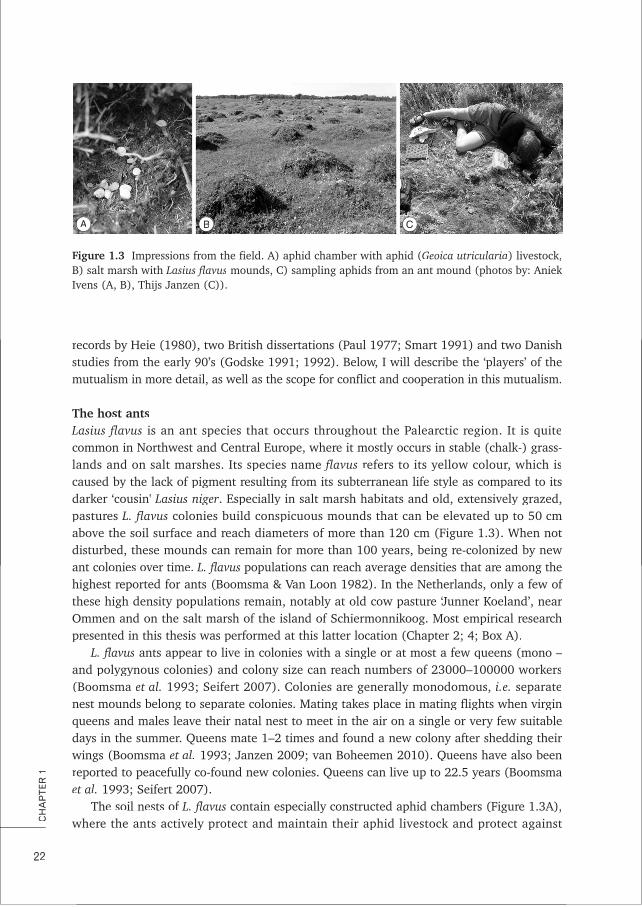
The host antsLLasius flavus is an ant species that occurs throughout the Palearctic region. It is quitecommon in Northwest and Central Europe, where it mostly occurs in stable (chalk-) grass-lands and on salt marshes. Its species name flavus refers to its yellow colour, which iscaused by the lack of pigment resulting from its subterranean life style as compared to itsdarker ‘cousin' Lasius niger. Especially in salt marsh habitats and old, extensively grazed,pastures L. flavus colonies build conspicuous mounds that can be elevated up to 50 cmabove the soil surface and reach diameters of more than 120 cm (Figure 1.3). When notdisturbed, these mounds can remain for more than 100 years, being re-colonized by newant colonies over time. L. flavus populations can reach average densities that are among the
fhighest reported for ants (Boomsma & Van Loon 1982). In the Netherlands, only a few ofthese high density populations remain, notably at old cow pasture ‘Junner Koeland’, nearOmmen and on the salt marsh of the island of Schiermonnikoog. Most empirical researchpresented in this thesis was performed at this latter location (Chapter 2; 4; Box A).
L. flavus –ants appear to live in colonies with a single or at most a few queens (mono –and polygynous colonies) and colony size can reach numbers of 23000–100000 workers(Boomsma et al. 1993; Seifert 2007). Colonies are generally monodomous, i.e. separatenest mounds belong to separate colonies. Mating takes place in mating flights when virginqueens and males leave their natal nest to meet in the air on a single or very few suitabledays in the summer. Queens mate 1–2 times and found a new colony after shedding theirwwings (Boomsma et al. 1993; Janzen 2009; van Boheemen 2010). Queens have also beenreported to peacefully co-found new colonies. Queens can live up to 22.5 years (Boomsmaet al. 1993; Seifert 2007).
The soil nests of L. flavus contain especially constructed aphid chambers (Figure 1.3A),wwhere the ants actively protect and maintain their aphid livestock and protect against
22
CH
AP
TER
1
A B C
Figure 1.3 f fImpressions from the field. A) aphid chamber with aphid (Geoica utricularia) livestock,B) salt marsh with Lasius flavus kmounds, C) sampling aphids from an ant mound (photos by: AniekIvens (A, B), Thijs Janzen (C)).
A.Ivens-diss 16-10-2012 11:14 Pagina 22
parasites and predators (Pontin 1958; 1959; 1961b; Paul 1977; Pontin 1978). The honey-dew secreted by the aphids is likely to be the almost exclusive source of carbohydrates forthe fully subterranean L. flavus ants, as other subterranean carbon sources are very limitedin the typical salt marsh and chalk-grassland habitats of these ants. Stable isotope analyseshave confirmed that in the presence of aphids there is a demonstrable intermediate trophiclevel between the vegetation and the ants, consistent with the aphids being an intermedi-ate food web node (A.B.F. Ivens & M. Schrama, unpublished data). L. flavus ants have alsobeen recorded to eat a major proportion of their root aphids, suggesting that they alsoutilize their ‘dairy cattle’ to increase protein acquisition (Pontin 1958; 1961b; 1978; Smart1991; Ivens et al. 2012a; Chapter 4). This implies that, similar to other subterranean ants,LL. flavus depends on root aphid husbandry for producing colonies large enough to repro-duce (Way 1963; Hölldobler & Wilson 1990).
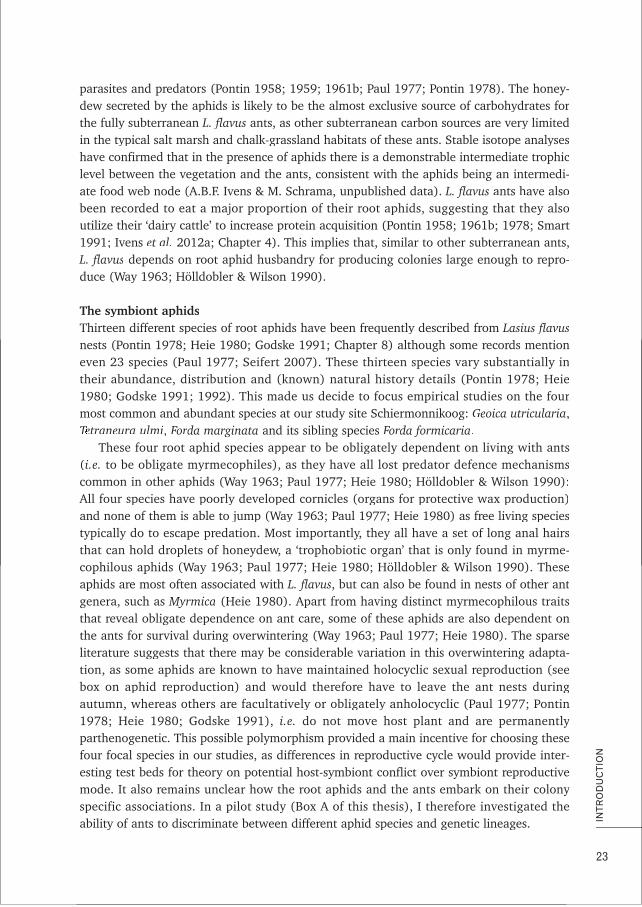
The symbiont aphidsThirteen different species of root aphids have been frequently described from Lasius flavusnests (Pontin 1978; Heie 1980; Godske 1991; Chapter 8) although some records mentioneven 23 species (Paul 1977; Seifert 2007). These thirteen species vary substantially intheir abundance, distribution and (known) natural history details (Pontin 1978; Heie1980; Godske 1991; 1992). This made us decide to focus empirical studies on the fourmost common and abundant species at our study site Schiermonnikoog: Geoica utricularia,Tetraneura ulmiTT , Forda marginatarr and its sibling species Forda formicariarr .
These four root aphid species appear to be obligately dependent on living with ants(i.e. to be obligate myrmecophiles), as they have all lost predator defence mechanismscommon in other aphids (Way 1963; Paul 1977; Heie 1980; Hölldobler & Wilson 1990):AAll four species have poorly developed cornicles (organs for protective wax production)and none of them is able to jump (Way 1963; Paul 1977; Heie 1980) as free living speciestypically do to escape predation. Most importantly, they all have a set of long anal hairsthat can hold droplets of honeydew, a ‘trophobiotic organ’ that is only found in myrme-cophilous aphids (Way 1963; Paul 1977; Heie 1980; Hölldobler & Wilson 1990). Theseaphids are most often associated with L. flavus, but can also be found in nests of other antgenera, such as Myrmica (Heie 1980). Apart from having distinct myrmecophilous traitsthat reveal obligate dependence on ant care, some of these aphids are also dependent onthe ants for survival during overwintering (Way 1963; Paul 1977; Heie 1980). The sparseliterature suggests that there may be considerable variation in this overwintering adapta-tion, as some aphids are known to have maintained holocyclic sexual reproduction (seebox on aphid reproduction) and would therefore have to leave the ant nests duringautumn, whereas others are facultatively or obligately anholocyclic (Paul 1977; Pontin1978; Heie 1980; Godske 1991), i.e. ydo not move host plant and are permanentlyparthenogenetic. This possible polymorphism provided a main incentive for choosing thesefour focal species in our studies, as differences in reproductive cycle would provide inter-esting test beds for theory on potential host-symbiont conflict over symbiont reproductive
ymode. It also remains unclear how the root aphids and the ants embark on their colonyspecific associations. In a pilot study (Box A of this thesis), I therefore investigated theability of ants to discriminate between different aphid species and genetic lineages.
23
INTR
OD
UC
TIO
N
A.Ivens-diss 16-10-2012 11:14 Pagina 23
POTENTIAL FOR CONFLICT AND COOPERATION IN THELLASIUS FLAVUS - ROOT APHID SYSTEM
AAphid reproductionThe fact that the root aphids tended by Lasius flavus may have the ability to reproduce
fboth sexually and asexually (see box on aphid reproduction) implies a potential conflict ofreproductive interest between the ants and the aphids over the best aphid reproductivemode. Holocyclic sexual reproduction that requires the aphids to leave the ant nest yieldsthe advantages associated with sexual reproduction for the aphid symbiont, but is almostcertainly not in the interest of the ants as it would make them lose their livestock partners.On the other hand, a stable environment might render risky sexual reproduction unneces-sary for the aphids, whereas the ants might prefer at least some sexual reproduction amongtheir aphids, for example to increase aphid resilience against parasites. Data on this con-flict and its resolution are very sparse. Ant suppression of aphid sex has not been reported,although several mechanisms of suppressing aphid dispersal by other host ants (delaying
falate (winged individuals) production, active wing clipping) may indicate the potential ofhost ant control over aphid sexual reproduction by prohibiting aphids to disperse to theprimary host plant for sexual reproduction (Way 1963; Hölldobler & Wilson 1990). Inaddition, many above-ground myrmecophilous aphids are known to have maintained theirsexual cycle (Heie 1980; Yao 2010; Vantaux et al. 2011a), but reproduction of myrme-cophilous root aphids had not been studied in detail before I embarked on my thesisproject.
The sparse available literature suggests that all four focal aphid species have beenobserved to live anholocyclically on the roots of secondary host grasses (Festuca rubraFF ,AAgrostis spp. and Elytrigia maritima) in ant mounds (Muir 1959; Pontin 1978; Heie 1980;Godske 1991; Godske 1992). The Forda species and G. utricularia appear to be anholo-cyclic in Northern and Central Europe (including the sampling area of our study), butholocyclic in Southern Europe, where their primary host Pistacia spp. (Anacardiaceae)occurs (Heie 1980). In contrast to the other three species, T. ulmi has been observed to beholocyclic at several sites in Northwest Europe and Scandinavia (Heie 1980). This specieswwas therefore expected to also be holocyclic in The Netherlands, with an obligate annualhost shift to elm trees (Ulmus spp.; Ulmaceae) as primary host for sexual reproduction inautumn (Heie 1980). However, Pontin (1978) and Godske (1991) suggested that T. ulmican also abandon its sexual phase and occur anholocyclically on grass roots in NorthwestEurope. This indicated that there might be substantial intra- and interspecific variation inreproductive mode and life-cycle, suggesting different outcomes within a single system for
ythis potential host-symbiont conflict. This formed the main incentive for a detailed studyof root aphid reproductive mode with the use of genetic markers (Ivens et al. 2011; 2012b;Chapters 2; 3; 5).
AAphid dispersalAA second potential conflict between L. flavus and its root aphids concerns aphid dispersal,as there is both conflict of interest on transmission mode (horizontal vs. vertical transmis-sion) and, in case of horizontal transmission, over the frequency of dispersal. Observation
24
CH
AP
TER
1
A.Ivens-diss 16-10-2012 11:14 Pagina 24
of vertical transmission (vectoring) by ant queens during mating flights has been restrictedto some highly specialized interactions that involve coccids (Way 1963; Hölldobler &WWilson 1990), so that aphids or coccids are assumed to be horizontally transmitted inother ant-homopteran interactions. However, ants have repeatedly been shown to restrictaphid dispersal. Indirect evidence for restricted dispersal was obtained by Yao (2010) afterfinding higher FISF values for (holocyclic) ant-attended TuberculatusTT aphids than for unat-tended (holocyclic) aphids. More direct evidence comes from observations of delayed
25
INTR
OD
UC
TIO
N
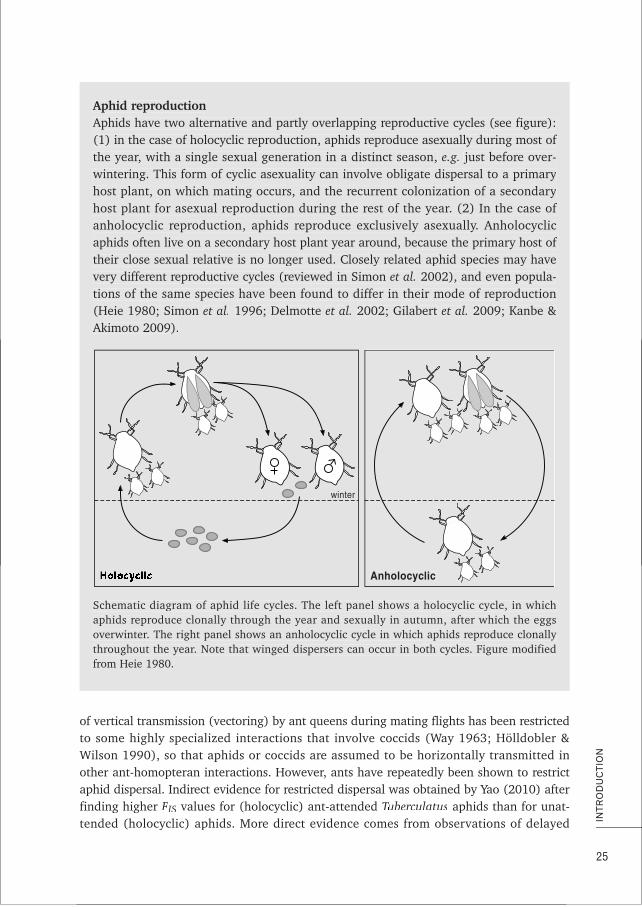
Aphid reproductionAphids have two alternative and partly overlapping reproductive cycles (see figure):(1) in the case of holocyclic reproduction, aphids reproduce asexually during most ofthe year, with a single sexual generation in a distinct season, e.g. just before over-wintering. This form of cyclic asexuality can involve obligate dispersal to a primaryhost plant, on which mating occurs, and the recurrent colonization of a secondaryhost plant for asexual reproduction during the rest of the year. (2) In the case ofanholocyclic reproduction, aphids reproduce exclusively asexually. Anholocyclicaphids often live on a secondary host plant year around, because the primary host oftheir close sexual relative is no longer used. Closely related aphid species may havevery different reproductive cycles (reviewed in Simon et al. 2002), and even popula-tions of the same species have been found to differ in their mode of reproduction(Heie 1980; Simon et al. 1996; Delmotte et al. 2002; Gilabert et al. 2009; Kanbe &Akimoto 2009).
winter
Anholocyclic
Schematic diagram of aphid life cycles. The left panel shows a holocyclic cycle, in whichaphids reproduce clonally through the year and sexually in autumn, after which the eggsoverwinter. The right panel shows an anholocyclic cycle in which aphids reproduce clonallythroughout the year. Note that winged dispersers can occur in both cycles. Figure modifiedfrom Heie 1980.
A.Ivens-diss 16-10-2012 11:14 Pagina 25
aphid dispersal and lower alate production in various ant-aphid interactions (Way 1963;Kindlmann et al. 2007; Oliver et al. 2007; Yao 2010; Tegelaar et al. 2011). The underlyingmechanisms described for Lasius ants vary from dispersal inhibition through semiochemi-cals that slow down aphids (Oliver et al. 2007) to population regulation preventing aphidnumbers reaching the critical threshold for alate production (Way 1963), and wing-clip-ping behaviour. Alate (winged) individuals have been described for the four most common(and focal) aphid species in L. flavus nests in at least some populations (Paul 1977; Heie1980). These could either be asexually produced dispersers or, where these winged indi-vviduals were produced in connection with a host shift, be indicators of sexual reproductionnot having been lost completely. Alate frequency and population viscosity of these fourspecies were further investigated in my study presented in Chapter 2, to gain more insightinto the outcome of the potential conflict on aphid transmission and dispersal.
AAphid (genetic) diversityThe third and last potential conflict between the ants and their root aphids concerns aphidlivestock diversity. For the ants, a homogenous aphid livestock will prevent the potentialcosts of virulent aphid-aphid competition and thus increase productivity of the system. Onthe other hand a diverse aphid livestock might be more resilient against specializedpathogens. Aphids may also gain from living in a polyculture, because competition withclose relatives is reduced when there is at least some niche segregation (e.g. using differentgrass species). Clonal mixing has been well-studied in social gall-forming aphids (amongothers Abbot 2009). In this context, increased relatedness among members of an aphidcolony is predicted to promote cooperation between the gall members. These studies
yshowed that relatedness among gall members tended to be high, but clonal diversityincreased over the course of the season, as dispersing aphids entered existing colonies.Similar results were obtained by Vantaux et al. (2011a) for tree-dwelling, ant-tended,aphids. This study also showed that ant-tending did not affect aphid colony diversity, con-firming earlier findings by Yao & Akimoto (2009). No previous studies have addressed thedetails of within-nest root aphid genetic- and species diversity. The molecular markersdeveloped in my studies (Ivens et al. 2011; Chapter 5) enabled me to address these issuesin detail in the study presented in Ivens et al. (2012a; Chapter 4).
OUTLINE OF THE THESIS
In this thesis, I will first present my empirical work after which I will continue with theymore general theoretical chapters to conclude with an epilogue that focusses specifically
on farming mutualisms. In Chapter 2, I investigated outcomes of the first two potentialhost-symbiont conflicts on symbiont reproductive mode and dispersal in the L. flavussystem. Using microsatellite markers, I show that the four most common root aphid speciesin L. flavus nests reproduce predominantly clonally and that dispersal is rare in all species.In Chapter 3, I reflect on the statistical methods available for determining reproductivemode from microsatellite data, as applied in Chapter 2. This simulation study using thepopulation genetic data of Chapter 2 shows that strict asexual reproduction is hard to
26
CH
AP
TER
1
A.Ivens-diss 16-10-2012 11:14 Pagina 26
confirm with traditional statistical methods based on microsatellite data only. Chapter 4then focusses on the outcomes with respect to symbiont diversity. In this chapter, I investi-gated aphid (genetic) diversity within L. flavus mounds, showing that different aphidspecies and clonal lineages occur mostly spatially separated in Lasius flavus nests. In addi-tion, the results indicate that the study system may be an example case of prudent hus-bandry for both carbohydrates and proteins. Whether ants are able to actively discriminatebetween different aphids, a prerequisite for complete host control over symbionts, remainsunclear. Box A reports on a pilot study in which I conducted partner choice experiments toinvestigate ant discriminatory ability between different aphids. Chapter 5 reports on thedevelopment and cross-amplification of the microsatellite markers used in Chapters 2, 3, 4and Box 1 and similar markers developed for three additional root aphid species com-monly found in nests of Lasius flavus. To conclude the empirical part of the dissertation,Box B reports on the software to detect clonal lineages in a microsatellite dataset, which Iupdated to use in Chapter 2. With Chapter 6 the theoretical part of this thesis starts. Thismodelling study aimed to investigate the joint evolution partner fidelity, partner choiceand within-species cooperation. I show that conditional dispersal (equivalent to partnerfidelity) can indeed promote the evolution of cooperation, but that conditional settlement(partner choice) only plays a marginal role in this model. Also, the evolved conditionalstrategies differ strikingly from what is generally expected in this context. In Chapter 7 Ipresent a follow-up study to Chapter 6 to investigate whether the same results apply tobetween-species cooperation. The study shows that in this case both conditional dispersaland conditional settlement promote the evolution of cooperation. Also, I show that theseprocesses can lead to asymmetric cooperative interactions that are highly dynamic. I willconclude with an epilogue presented in Chapter 8, which will focus on the new insights
yinto farming mutualism gained from this thesis, as well as an evaluation of the studysystem and discussion of aspects of the L. flavus system that have not been treated in thisdissertation. I will also offer some thoughts on promising future research avenues in thestudy of the evolutionary ecology of (farming) mutualisms.
27
INTR
OD
UC
TIO
N
A.Ivens-diss 16-10-2012 11:14 Pagina 27

A.Ivens-diss 16-10-2012 11:14 Pagina 28
Reproduction and dispersal in anRRant-associated root aphid community
A k B F IAniek B.F. IvensDaniel J.C. KronauerIdo PenFranz J. WeissingJacobus J. Boomsma
PP bl h dublished in M l l E lMolecular Ecology: 2012, 21, 4257–4269
CH
AP
TER2
A.Ivens-diss 16-10-2012 11:14 Pagina 29
Clonal organisms with occasional sex are important for our generalunderstanding of the costs and benefits that maintain sexual repro-duction. Cyclically parthenogenetic aphids are highly variable intheir frequency of sexual reproduction. However, studies havemostly focused on free-living aphids above ground, whereas dis-persal constraints and dependence on ant-tending may differen-tially affect the costs and benefits of sex in subterranean aphids.Here, we studied reproductive mode and dispersal in a communityof root aphids that are obligately associated with the ant Lasiusflavus. We assessed the genetic population structure of four species(Geoica utricularia, Tetraneura ulmiTT , Forda marginatarr and F. formi-caria) in a Dutch population and found that all species reproducepredominantly if not exclusively asexually, so that populationsconsist of multiple clonal lineages. We show that population vis-cosity is high and winged aphids rare, consistent with infrequenthorizontal transmission between ant host colonies. The absence ofthe primary host shrub (P(( istacia) may explain the absence of sex inthree of the studied species, but elm trees (Ulmus) that are primaryhosts of the fourth species (T. ulmi), occurred within a few km ofthe study population. We discuss the extent to which obligate ant-tending and absence of primary hosts may have affected selectionfor permanent parthenogenesis and we highlight the need forfurther study of these aphids in Southern Europe where primaryhosts may occur close to Lasius flavus populations, so that all fourroot aphid species would have realistic opportunities for complet-ing their sexual life-cycle.
AABSTRACT
30
CH
AP
TER
2
A.Ivens-diss 16-10-2012 11:14 Pagina 30
INTRODUCTION
AAsexual reproduction can allow rapid population growth and therefore enable quick colo-nization of new habitats. Nevertheless, exclusive asexual reproduction is generally consid-ered an evolutionary ‘dead end’ because prolonged lack of recombination will lead toaccumulation of deleterious mutations and slower evolvability in response to parasites andenvironmental change, ultimately driving asexual species to extinction. Occasional sex inan otherwise asexual species, however, can allow for sufficient recombination to outweighthese costs, without compromising the benefits of asexual reproduction (a.o. Green &Noakes 1995, reviewed in D'Souza & Michiels 2010). Studying species with such mixedreproductive modes can thus enhance our understanding of the evolution and mainte-nance of sex, one of the major current topics in evolutionary biology.
Aphids are particularly informative in this context, because they are often cyclicalparthenogens with a (holocyclic) reproductive cycle consisting of a sequence of asexualgenerations followed by a single sexual generation (Simon et al. 2002). However, someaphids have lost the sexual generation and reproduce exclusively asexually (anholocyclic).These variable reproductive modes, both between species and between populations of thesame species, make aphids excellent model systems for studying the selective forces thataffect cyclical parthenogenesis (Simon et al. 1996; 1999; Delmotte et al. 2002; Gilabert tetal. 2009; Kanbe & Akimoto 2009; Vantaux et al. 2011a).
Aphids are also well-known for their mutualistic relationships with ants (Way 1963;Stadler & Dixon 2008), which can have profound effects on dispersal and reproduction,and thus on the population structure of mutualistic partners (Herre et al. 1999; Leigh2010). However, most of the previous aphid studies have focused on non-myrmecophilesin above-ground populations, whereas subterranean and obligately ant-associated aphidshave been neglected (Yao & Akimoto 2009; Yao 2010). Here, we focus on four sympatricspecies of root aphids (Geoica utricularia, Tetraneura ulmiTT , Forda marginatarr , F. formicaria)that are known to be obligately associated with ants (Heie 1980; Seifert 2007).
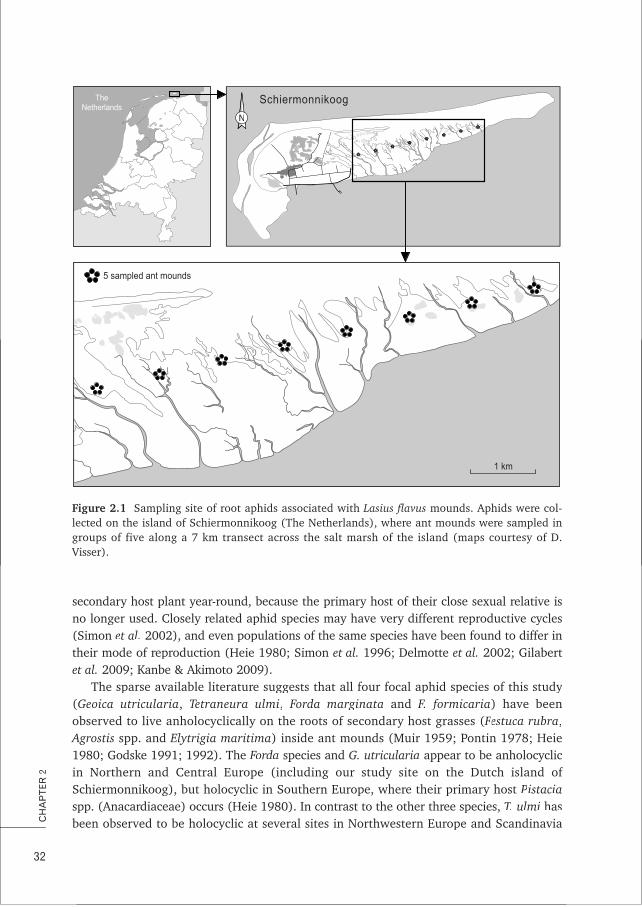
yThe specific objectives of our study were: (1) to infer the extent of population viscosityof multiple root aphid species across a field transect spanning seven km (Figure 2.1), (2)to determine the dominant mode of reproduction in these aphids, and (3) to estimate thepotential for horizontal dispersal via winged forms.
MATERIALS AND METHODS
Root aphid natural historyRRAAphids have two alternative and partly overlapping reproductive cycles: (1) Holocyclicreproduction where aphids are propagated asexually during most of the year, but have a
fsingle sexual generation in a distinct season often just before overwintering. This form ofcyclic asexuality can involve obligate dispersal to a primary host plant, on which matingoccurs, and the recurrent colonization of a secondary host plant for asexual reproductionduring the rest of the year (Heie 1980; Simon et al. 2002). (2) Anholocyclic reproductionwwhere aphids are propagated by obligate parthenogenesis. These aphids often live on a
31
RE
PR
OD
UC
TIO
N A
ND
DIS
PE
RS
AL
IN S
YMB
ION
T A
PH
IDS
A.Ivens-diss 16-10-2012 11:14 Pagina 31
secondary host plant year-round, because the primary host of their close sexual relative isno longer used. Closely related aphid species may have very different reproductive cycles(Simon et al. 2002), and even populations of the same species have been found to differ intheir mode of reproduction (Heie 1980; Simon et al. 1996; Delmotte et al. 2002; Gilabertet al. 2009; Kanbe & Akimoto 2009).
yThe sparse available literature suggests that all four focal aphid species of this study(Geoica utricularia, Tetraneura ulmi, Forda marginatarr and F. formicaria) have beenobserved to live anholocyclically on the roots of secondary host grasses (Festuca rubraFF ,AAgrostis spp. and Elytrigia maritima) inside ant mounds (Muir 1959; Pontin 1978; Heie1980; Godske 1991; 1992). The Forda species and G. utricularia appear to be anholocyclic
fin Northern and Central Europe (including our study site on the Dutch island ofSchiermonnikoog), but holocyclic in Southern Europe, where their primary host Pistaciaspp. (Anacardiaceae) occurs (Heie 1980). In contrast to the other three species, T. ulmi hasbeen observed to be holocyclic at several sites in Northwestern Europe and Scandinavia
32
CH
AP
TER
2
SchiermonnikoogTheNetherlands
N
5 sampled ant mounds
1 km
Figure 2.1 fSampling site of root aphids associated with Lasius flavus mounds. Aphids were col-lected on the island of Schiermonnikoog (The Netherlands), where ant mounds were sampled ingroups of five along a 7 km transect across the salt marsh of the island (maps courtesy of D.VVVisser).
A.Ivens-diss 16-10-2012 11:14 Pagina 32
(Heie 1980). This species was therefore expected to be holocyclic in our sampling area,wwith an obligate annual host shift to elm trees (Ulmus spp.; Ulmaceae) as primary host forsexual reproduction in autumn (Heie 1980). However, Pontin (1978), Godske (1991) andBlackman & Eastop (1994) suggested that T. ulmi can also abandon its sexual phase andoccurr anholocyclically on grass roots in Northwestern Europe. Alate (winged) individualshave been described for all four species in at least some populations (Paul 1977; Heie1980). These could either be indicators of sexual reproduction and host shift not havingbeen lost completely, or asexually produced dispersers, although the existence of the latterremains unconfirmed in Pemphigidae (Moran 1992). We therefore started this study withthe hypothesis that there might be intra- and interspecific variation in reproductive modeand life cycle among the root aphids in our focal Dutch population.
All four aphid species are found in soil nests of the ant Lasius flavus. These nestscontain specifically constructed aphid chambers, where the ants actively protect their live-stock from parasites and predators (Pontin 1959; 1978), and where they both tend and eatthem (Pontin 1958; 1961b; 1978). All four root aphid species appear to be obligate
ymyrmecophiles, having lost predator defense mechanisms common in other aphids (Way1963; Paul 1977; Heie 1980; Hölldobler & Wilson 1990), i.e. all have poorly developedcornicles (organs for protective wax production) and lack saltatorial legs to jump oractively drop from branches in response to threats (Way 1963; Paul 1977; Heie 1980).Most importantly, they all have a set of long anal hairs that can hold droplets of honeydew,a ‘trophobiotic organ’ that is only found in myrmecophilous aphids (Way 1963; Heie 1980;Hölldobler & Wilson 1990) (Figure 2.2). Apart from these distinct traits that reveal obli-gate dependence on ant care, some of these aphids are also dependent on the ants for sur-vvival during overwintering (Way 1963; Heie 1980). However, the sparse literature suggeststhat there may be considerable variation in this overwintering adaptation, as some aphidsare known to have maintained holocyclic sexual reproduction (see above) and wouldtherefore have to leave the ant nests during autumn, whereas others are facultatively orobligately anholocyclic (Pontin 1978; Heie 1980; Godske 1991). How ant colonies acquiretheir mutualistic aphids remains poorly understood, as virgin queens have not beenobserved to vector aphids during colony founding (A.B.F. Ivens, personal observation;
yChapter 8). Most likely, ant mounds that have recently gone extinct are recolonized byfounding queens or neighbouring smaller colonies so that local aphid lineages may acquirenew ‘owners’ (Ivens et al. 2012a; Chapter 4). In addition, aphids may disperse independ-ently by wind, walking or floating on tidal water (Foster & Treherne 1978; Foster 1978).
SamplingAAll aphid samples were collected in July 2008 from L. flavus fant mounds on the island ofSchiermonnikoog, the Netherlands (53°28' N, 6°09' E). Sampling followed a 7 km transectacross the salt-marsh of the island (Figure 2.1), with the westernmost kilometer of thetransect located on grazed pasture and the remainder on un-grazed salt-marsh. The tran-sect was subdivided into eight locations with 1 km intervals. Nest mound density was high
fthroughout the transect (ca. 600–3500 mounds per ha). At each location, soil samples offive ant mounds of similar size (Ø ca. 80 cm) were taken and hand-sorted for the occur-rence of wingless and winged (alate) root aphids. The precise location of each ant nest was
33
RE
PR
OD
UC
TIO
N A
ND
DIS
PE
RS
AL
IN S
YMB
ION
T A
PH
IDS
A.Ivens-diss 16-10-2012 11:14 Pagina 33
recorded with a GPS device (eTrexVista™, Garmin, 0.5–5 m precision). A subsample of allcollected aphids was used for species identification using a protocol for microscopic prepa-
fration modified after (Heie 1980). Reference specimens are located at the University ofGroningen (access available upon request).
We chose to use small soil cores so that sampling was non-destructive and we couldresample mounds in later years. This sampling scheme was nonetheless sufficient to obtainat least one aphid belonging to each of the focal species from 30 of the 40 mounds, andonly one of the 40 mounds yielded no aphids at all in any of our soil core samples. Allmounds were confirmed to be inhabited by L. flavus, with ca. 60% of the 21 soil corestaken per mound containing ants.
Molecular analysisDNA was extracted from entire aphids using 200 μl 20%-Chelex® 100 resin (Fluka) (Walshet al. 1991). We used polymorphic microsatellite markers to genotype specimens of Fordaspp. (loci Fm1, Fm3, Fm4, Fm6, Gu6, Gu11, Gu13), G. utricularia (loci Gu2, Gu3, Gu5,Gu6, Gu8, Gu9, Gu11, Gu13), and T. ulmi (loci Tu1, Tu2, Tu3, Tu4, Tu10, Tu11). Marker-specific details and amplification protocols are given in Ivens et al. (2011; Chapter 5). If amarker failed to amplify in an individual, the amplification process was repeated at leasttwice. PCR-products were analyzed on an ABI-PRISM 3130XL (Applied Biosystems)sequencer and chromatograms were analyzed in Genemapper (Applied Biosystems).
Data analysisAAfter omitting 30 samples in which more than half of the markers repeatedly failed toamplify, the total number of individuals included in the datasets was 469: 201 for G. utric-ularia, 92 for T. ulmi, 158 for F. marginata and 18 for F. formicaria.
MLGsim 2.0 (http://www.rug.nl/fmns-research/theobio/downloads), an updatedvversion of MLGsim (Stenberg et al. 2003b; Box B), was used to group individuals intodiploid multilocus genotypes (MLGs), i.e. unique combinations of alleles across all testedmarker loci. Where missing data occurred (190 of the 469 individuals had some missinggenetic marker data - on average 13% of the alleles was missing), individuals were joinedinto the MLG of which the genotype for the remaining successfully scored loci was identi-cal. In the two cases where an individual matched two different but very similar MLGs atall successfully amplified loci, it was grouped with the more common MLG of the two. Forour further analyses, gaps in an individual’s MLG were filled in with the alleles of the MLGto which the individual had been assigned. While this increased sample size for our analy-ses, it also implied that we may have slightly underestimated overall genetic variability.
MLGs were either represented by several to many individuals (recurrent MLGsrr ) or(rarely) as a single individual in our samples (single MLGs). Asexual reproduction will thusaffect population genetic analyses through overrepresentation of clonally produced indi-vviduals (Sunnucks et al. 1997). To take any possible effects of pseudoreplication intoaccount, all analyses were performed both on the full dataset, including all individuals(ramet data; i.e. all individuals belonging to a single MLG), and on a subset of the dataconsisting of only one individual per MLG (genet data) (sensu Harper 1977). The twoanalyses yielded comparable qualitative conclusions.
34
CH
AP
TER
2
A.Ivens-diss 16-10-2012 11:14 Pagina 34

Estimates of genetic variabilityAAsexual reproduction tends to decrease segregation of alleles within loci and recombina-tion between loci. Over time, this leads to observed heterozygosities (HO) differing fromthose expected under sexual outbreeding (HE), and to deviations from Hardy-Weinbergequilibrium (HWE). Specifically, asexual reproduction can lead to heterozygote excess [i.e.a negative fixation index FISFF (Weir & Cockerham 1984; Balloux et al. 2003; Stoeckel et al.2006)] through mutation accumulation in clonal lineages, also known as the ‘Meselsoneffect’ in ancient asexual lineages (Birky 1996; Welch & Meselson 2000; Halkett et al.2005). Nevertheless, mechanisms such as mitotic recombination or occasional sex can also
ylead to heterozygote deficiency in clones, particularly when asexual lineages are not veryold and stochastic effects determine whether clones happen to be homozygous or het-erozygous at neutral markers (Birky 1996). Finally, the lack of recombination underasexual reproduction should lead to significant linkage disequilibrium (LD). GENEPOP 4.0(Rousset 2008) was used to estimate HO, HEHH , FISFF , linkage disequilibrium (LD), and devia-tions from HWE, assuming a panmictic population with random mating.
As a measure for genetic diversity we used the G/N ratio Pd, where N is the sample sizefor a given aphid species and G is the number of distinct MLGs in a focal population(Ellstrand & Roose 1987; Dorken & Eckert 2001; Arnaud-Haond et al. 2007). We also esti-mated PsexP values for every observed MLG, with PsexP fbeing defined as the probability ofobtaining at least as many as the observed number of individuals belonging to a givenMLG under the null hypothesis of sexual reproduction and population-wide randommating (Tibayrenc et al. 1990; Parks & Werth 1993; Young et al. 2002; Arnaud-Haond tetal. 2007). The calculation of PsexP takes into account the observed frequencies of the allelesconstituting the given MLG. A MLG with a low PsexP value therefore indicates that the mul-tiple individuals observed for that MLG likely originated from clonal reproduction ratherthan sexual reproduction. Although Psex calculation was initially developed to confirmstrict asexuality, it can also be applied to cyclical parthenogens. This is because PsexP estima-tions are done for each unique MLG separately and since this is based on population-wideallele frequencies, any present genetic variation naturally enters the analysis, regardless itsorigin. Using MLGsim 2.0, we estimated PsexP values and derived P-values for these valuesusing Monte Carlo resampling simulations of our study population under HWE with 1000iterations (Box B).
Genetic distanceWWe calculated genetic distances between MLGs using the shared allele distance DAS (Jin &Chakraborty 1993) in POPULATIONS 1.2.30 (© 1999, Olivier Langella, CNRS UPR9034).Pairs of MLGs with relatively small genetic distances might belong to one multilocuslineage (MLL) (Arnaud-Haond et al. 2007), i.e. a grouping of MLGs that go back to thesame sexual reproduction event and whose genetic differences are due to later mutations,asexual recombination, or, possibly, scoring errors. We considered two MLGs as being partof the same MLL when they only differed by one or two alleles over all markers combined.The frequency distribution of the genetic distances between our samples was bimodal,wwith genetic distances of one or two alleles constituting the first peak of this overall fre-quency distribution, so that we felt confident that this distinction captured reality rather
35
RE
PR
OD
UC
TIO
N A
ND
DIS
PE
RS
AL
IN S
YMB
ION
T A
PH
IDS
A.Ivens-diss 16-10-2012 11:14 Pagina 35
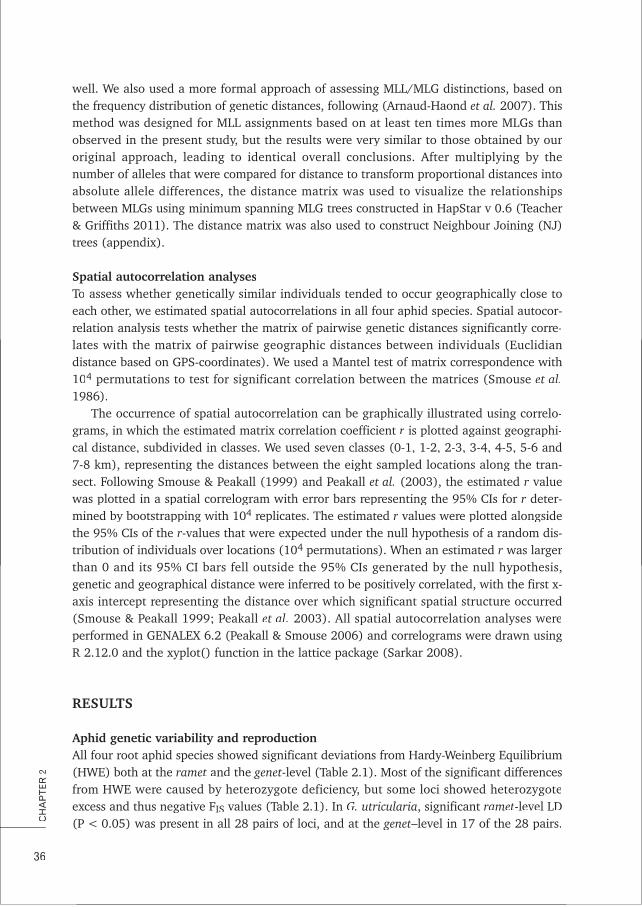
wwell. We also used a more formal approach of assessing MLL/MLG distinctions, based onthe frequency distribution of genetic distances, following (Arnaud-Haond et al. 2007). Thismethod was designed for MLL assignments based on at least ten times more MLGs thanobserved in the present study, but the results were very similar to those obtained by ouroriginal approach, leading to identical overall conclusions. After multiplying by thenumber of alleles that were compared for distance to transform proportional distances intoabsolute allele differences, the distance matrix was used to visualize the relationshipsbetween MLGs using minimum spanning MLG trees constructed in HapStar v 0.6 (Teacher& Griffiths 2011). The distance matrix was also used to construct Neighbour Joining (NJ)trees (appendix).
Spatial autocorrelation analysesTo assess whether genetically similar individuals tended to occur geographically close toeach other, we estimated spatial autocorrelations in all four aphid species. Spatial autocor-relation analysis tests whether the matrix of pairwise genetic distances significantly corre-lates with the matrix of pairwise geographic distances between individuals (Euclidiandistance based on GPS-coordinates). We used a Mantel test of matrix correspondence with104 permutations to test for significant correlation between the matrices (Smouse et al.1986).
The occurrence of spatial autocorrelation can be graphically illustrated using correlo-grams, in which the estimated matrix correlation coefficient r is plotted against geographi-cal distance, subdivided in classes. We used seven classes (0-1, 1-2, 2-3, 3-4, 4-5, 5-6 and7-8 km), representing the distances between the eight sampled locations along the tran-sect. Following Smouse & Peakall (1999) and Peakall et al. (2003), the estimated r valuewwas plotted in a spatial correlogram with error bars representing the 95% CIs for r deter-mined by bootstrapping with 104 replicates. The estimated r values were plotted alongsidethe 95% CIs of the r-values that were expected under the null hypothesis of a random dis-tribution of individuals over locations (104 permutations). When an estimated r was largerthan 0 and its 95% CI bars fell outside the 95% CIs generated by the null hypothesis,genetic and geographical distance were inferred to be positively correlated, with the first x-axis intercept representing the distance over which significant spatial structure occurred(Smouse & Peakall 1999; Peakall et al. 2003). All spatial autocorrelation analyses wereperformed in GENALEX 6.2 (Peakall & Smouse 2006) and correlograms were drawn usingR 2.12.0 and the xyplot() function in the lattice package (Sarkar 2008).
RESULTS
AAphid genetic variability and reproductionAAll four root aphid species showed significant deviations from Hardy-Weinberg Equilibrium(HWE) both at the ramet and the genet-level (Table 2.1). Most of the significant differencesfrom HWE were caused by heterozygote deficiency, but some loci showed heterozygoteexcess and thus negative FIS values (Table 2.1). In G. utricularia, significant ramet-level LD(P < 0.05) was present in all 28 pairs of loci, and at the genet–level in 17 of the 28 pairs.tt
36
CH
AP
TER
2
A.Ivens-diss 16-10-2012 11:14 Pagina 36
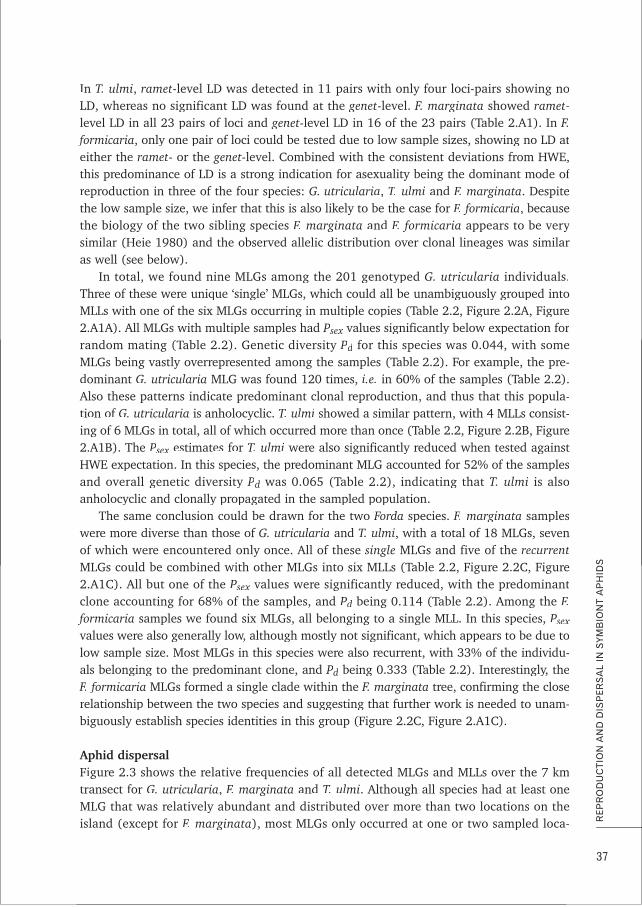
In T. ulmi, ramet-level LD was detected in 11 pairs with only four loci-pairs showing noLD, whereas no significant LD was found at the genet-level. F. marginata showed ramet-level LD in all 23 pairs of loci and genet-level LD in 16 of the 23 pairs (Table 2.A1). In F.fformicaria, only one pair of loci could be tested due to low sample sizes, showing no LD ateither the ramet- or the genet-level. Combined with the consistent deviations from HWE,
fthis predominance of LD is a strong indication for asexuality being the dominant mode ofreproduction in three of the four species: G. utricularia, T. ulmi and F. marginata. Despitethe low sample size, we infer that this is also likely to be the case for F. formicaria, becausethe biology of the two sibling species F. marginata and F. formicaria yappears to be verysimilar (Heie 1980) and the observed allelic distribution over clonal lineages was similaras well (see below).
In total, we found nine MLGs among the 201 genotyped G. utricularia individuals.Three of these were unique ‘single’ MLGs, which could all be unambiguously grouped intoMLLs with one of the six MLGs occurring in multiple copies (Table 2.2, Figure 2.2A, Figure2.A1A). All MLGs with multiple samples had PsexP values significantly below expectation forrandom mating (Table 2.2). Genetic diversity Pd for this species was 0.044, with someMLGs being vastly overrepresented among the samples (Table 2.2). For example, the pre-dominant G. utricularia MLG was found 120 times, i.e. in 60% of the samples (Table 2.2).AAlso these patterns indicate predominant clonal reproduction, and thus that this popula-tion of G. utricularia is anholocyclic. T. ulmi showed a similar pattern, with 4 MLLs consist-ing of 6 MLGs in total, all of which occurred more than once (Table 2.2, Figure 2.2B, Figure2.A1B). The PsexP estimates for T. ulmi were also significantly reduced when tested againstHWE expectation. In this species, the predominant MLG accounted for 52% of the samplesand overall genetic diversity Pd was 0.065 (Table 2.2), indicating that T. ulmi is alsoanholocyclic and clonally propagated in the sampled population.
The same conclusion could be drawn for the two Forda species. F. marginata sampleswwere more diverse than those of G. utricularia and T. ulmi, with a total of 18 MLGs, sevenof which were encountered only once. All of these single MLGs and five of the r tecurrentrrMLGs could be combined with other MLGs into six MLLs (Table 2.2, Figure 2.2C, Figure2.A1C). All but one of the PsexP values were significantly reduced, with the predominantclone accounting for 68% of the samples, and Pd being 0.114 (Table 2.2). Among the F.fformicaria samples we found six MLGs, all belonging to a single MLL. In this species, P xsexPvvalues were also generally low, although mostly not significant, which appears to be due tolow sample size. Most MLGs in this species were also recurrent, with 33% of the individu-als belonging to the predominant clone, and Pd being 0.333 (Table 2.2). Interestingly, theFF. formicaria MLGs formed a single clade within the F. marginata tree, confirming the closerelationship between the two species and suggesting that further work is needed to unam-biguously establish species identities in this group (Figure 2.2C, Figure 2.A1C).
AAphid dispersalFigure 2.3 shows the relative frequencies of all detected MLGs and MLLs over the 7 kmtransect for G. utricularia, F. marginata and T. ulmi. Although all species had at least oneMLG that was relatively abundant and distributed over more than two locations on theisland (except for F. marginata), most MLGs only occurred at one or two sampled loca-
37
RE
PR
OD
UC
TIO
N A
ND
DIS
PE
RS
AL
IN S
YMB
ION
T A
PH
IDS
A.Ivens-diss 16-10-2012 11:14 Pagina 37
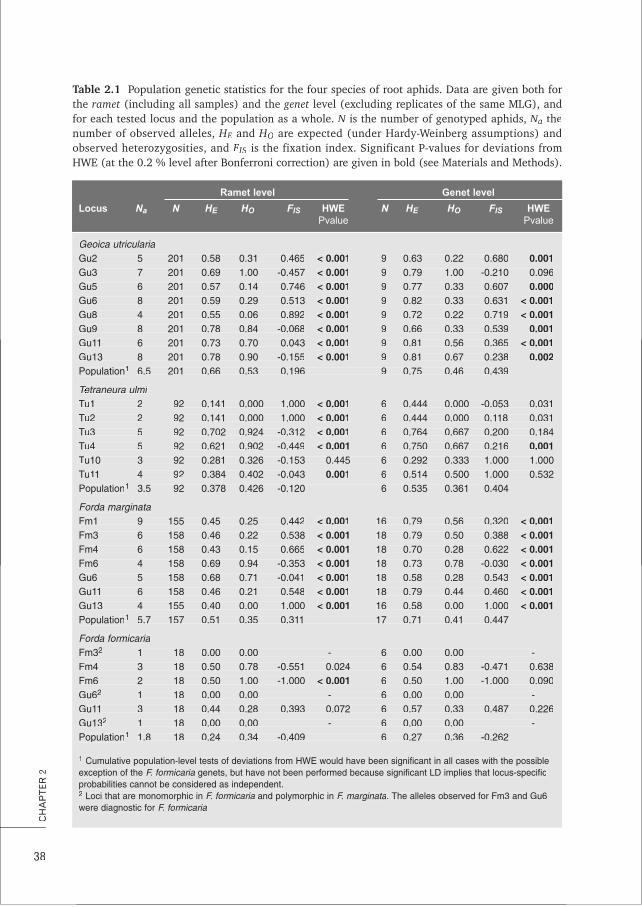
38
CH
AP
TER
2
Table 2.1TT P f f f fopulation genetic statistics for the four species of root aphids. Data are given both forthe ramet (including all samples) and the genet level (excluding replicates of the same MLG), andfor each tested locus and the population as a whole. N is the number of genotyped aphids, NaNN thenumber of observed alleles, HEH and HO are expected (under Hardy-Weinberg assumptions) andobserved heterozygosities, and FISF is the fixation index. Significant P-values for deviations fromHWE (at the 0.2 % level after Bonferroni correction) are given in bold (see Materials and Methods).
Ramet level Genet level
Locus NaNN N HEH HO FISFF HWE N HEH HO FISFF HWEPvalue Pvalue
Geoica utriculariaGu2 5 201 0.58 0.31 0.465 < 0.001 9 0.63 0.22 0.680 0.001Gu3 7 201 0.69 1.00 -0.457 < 0.001 9 0.79 1.00 -0.210 0.096Gu5 6 201 0.57 0.14 0.746 < 0.001 9 0.77 0.33 0.607 0.000Gu6 8 201 0.59 0.29 0.513 < 0.001 9 0.82 0.33 0.631 < 0.001Gu8 4 201 0.55 0.06 0.892 < 0.001 9 0.72 0.22 0.719 < 0.001Gu9 8 201 0.78 0.84 -0.068 < 0.001 9 0.66 0.33 0.539 0.001Gu11 6 201 0.73 0.70 0.043 < 0.001 9 0.81 0.56 0.365 < 0.001Gu13 8 201 0.78 0.90 -0.155 < 0.001 9 0.81 0.67 0.238 0.002Population1 6.5 201 0.66 0.53 0.196 9 0.75 0.46 0.439
Tetraneura ulmiTTTu1 2 92 0.141 0.000 1.000 < 0.001 6 0.444 0.000 -0.053 0.031Tu2 2 92 0.141 0.000 1.000 < 0.001 6 0.444 0.000 0.118 0.031Tu3 5 92 0.702 0.924 -0.312 < 0.001 6 0.764 0.667 0.200 0.184Tu4 5 92 0.621 0.902 -0.449 < 0.001 6 0.750 0.667 0.216 0.001Tu10 3 92 0.281 0.326 -0.153 0.445 6 0.292 0.333 1.000 1.000Tu11 4 92 0.384 0.402 -0.043 0.001 6 0.514 0.500 1.000 0.532Population1 3.5 92 0.378 0.426 -0.120 6 0.535 0.361 0.404
Forda marginataFm1 9 155 0.45 0.25 0.442 < 0.001 16 0.79 0.56 0.320 < 0.001Fm3 6 158 0.46 0.22 0.538 < 0.001 18 0.79 0.50 0.388 < 0.001Fm4 6 158 0.43 0.15 0.665 < 0.001 18 0.70 0.28 0.622 < 0.001Fm6 4 158 0.69 0.94 -0.353 < 0.001 18 0.73 0.78 -0.030 < 0.001Gu6 5 158 0.68 0.71 -0.041 < 0.001 18 0.58 0.28 0.543 < 0.001Gu11 6 158 0.46 0.21 0.548 < 0.001 18 0.79 0.44 0.460 < 0.001Gu13 4 155 0.40 0.00 1.000 < 0.001 16 0.58 0.00 1.000 < 0.001Population1 5.7 157 0.51 0.35 0.311 17 0.71 0.41 0.447
Forda formicariaFm32 1 18 0.00 0.00 - 6 0.00 0.00 -Fm4 3 18 0.50 0.78 -0.551 0.024 6 0.54 0.83 -0.471 0.638Fm6 2 18 0.50 1.00 -1.000 < 0.001 6 0.50 1.00 -1.000 0.090Gu62 1 18 0.00 0.00 - 6 0.00 0.00 -Gu11 3 18 0.44 0.28 0.393 0.072 6 0.57 0.33 0.487 0.226Gu132 1 18 0.00 0.00 - 6 0.00 0.00 -Population1 1.8 18 0.24 0.34 -0.409 6 0.27 0.36 -0.262
1 Cumulative population-level tests of deviations from HWE would have been significant in all cases with the possibleexception of the F. formicaria genets, but have not been performed because significant LD implies that locus-specificprobabilities cannot be considered as independent.2 Loci that are monomorphic in F. formicaria and polymorphic in F. marginata. The alleles observed for Fm3 and Gu6were diagnostic for F. formicaria.
Ramet level Genet level
Locus Na N HE HO FIS HWE N HE HO FIS HWEPvalue Pvalue
A.Ivens-diss 16-10-2012 11:14 Pagina 38
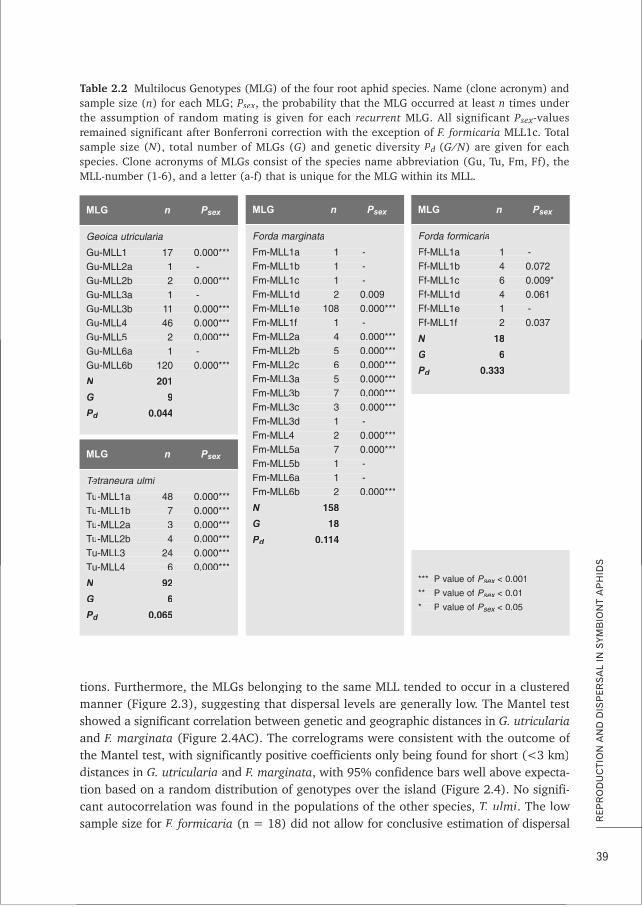
tions. Furthermore, the MLGs belonging to the same MLL tended to occur in a clusteredmanner (Figure 2.3), suggesting that dispersal levels are generally low. The Mantel testshowed a significant correlation between genetic and geographic distances in G. utriculariaand F. marginata f(Figure 2.4AC). The correlograms were consistent with the outcome ofthe Mantel test, with significantly positive coefficients only being found for short (<3 km)distances in G. utricularia and F. marginata, with 95% confidence bars well above expecta-tion based on a random distribution of genotypes over the island (Figure 2.4). No signifi-cant autocorrelation was found in the populations of the other species, T. ulmi. The lowsample size for F. formicaria (n = 18) did not allow for conclusive estimation of dispersal
39
RE
PR
OD
UC
TIO
N A
ND
DIS
PE
RS
AL
IN S
YMB
ION
T A
PH
IDS
Table 2.2TT f fMultilocus Genotypes (MLG) of the four root aphid species. Name (clone acronym) andsample size (n) for each MLG; PsexP , the probability that the MLG occurred at least n times underthe assumption of random mating is given for each recurrent MLG. All significant Psex-valuesremained significant after Bonferroni correction with the exception of F. formicaria MLL1c. Totalsample size (N), total number of MLGs (G) and genetic diversity Pd (G/N) are given for eachspecies. Clone acronyms of MLGs consist of the species name abbreviation (Gu, Tu, Fm, Ff), theMLL-number (1-6), and a letter (a-f) that is unique for the MLG within its MLL.
MLG n PsexP
Geoica utricularia
Gu-MLL1 17 0.000***Gu-MLL2a 1 -Gu-MLL2b 2 0.000***Gu-MLL3a 1 -Gu-MLL3b 11 0.000***Gu-MLL4 46 0.000***Gu-MLL5 2 0.000***Gu-MLL6a 1 -Gu-MLL6b 120 0.000***
N 201
G 9
Pd 0.044
MLG n Psex
MLG n PsexP
Tetraneura ulmiTT
Tu-MLL1a 48 0.000***Tu-MLL1b 7 0.000***Tu-MLL2a 3 0.000***Tu-MLL2b 4 0.000***Tu-MLL3 24 0.000***Tu-MLL4 6 0.000***
N 92
G 6
Pd 0.065
MLG n Psex
MLG n PsexP
Forda formicaria
Ff-MLL1a 1 -Ff-MLL1b 4 0.072Ff-MLL1c 6 0.009*Ff-MLL1d 4 0.061Ff-MLL1e 1 -Ff-MLL1f 2 0.037
N 18
G 6
Pd 0.333
*** P value of PsexP < 0.001
** P value of PsexP < 0.01
* P value of PsexP < 0.05
MLG n PsexMLG n PsexP
Forda marginata
Fm-MLL1a 1 -Fm-MLL1b 1 -Fm-MLL1c 1 -Fm-MLL1d 2 0.009Fm-MLL1e 108 0.000***Fm-MLL1f 1 -Fm-MLL2a 4 0.000***Fm-MLL2b 5 0.000***Fm-MLL2c 6 0.000***Fm-MLL3a 5 0.000***Fm-MLL3b 7 0.000***Fm-MLL3c 3 0.000***Fm-MLL3d 1 -Fm-MLL4 2 0.000***Fm-MLL5a 7 0.000***Fm-MLL5b 1 -Fm-MLL6a 1 -Fm-MLL6b 2 0.000***
N 158
G 18
Pd 0.114
MLG n Psex
A.Ivens-diss 16-10-2012 11:14 Pagina 39
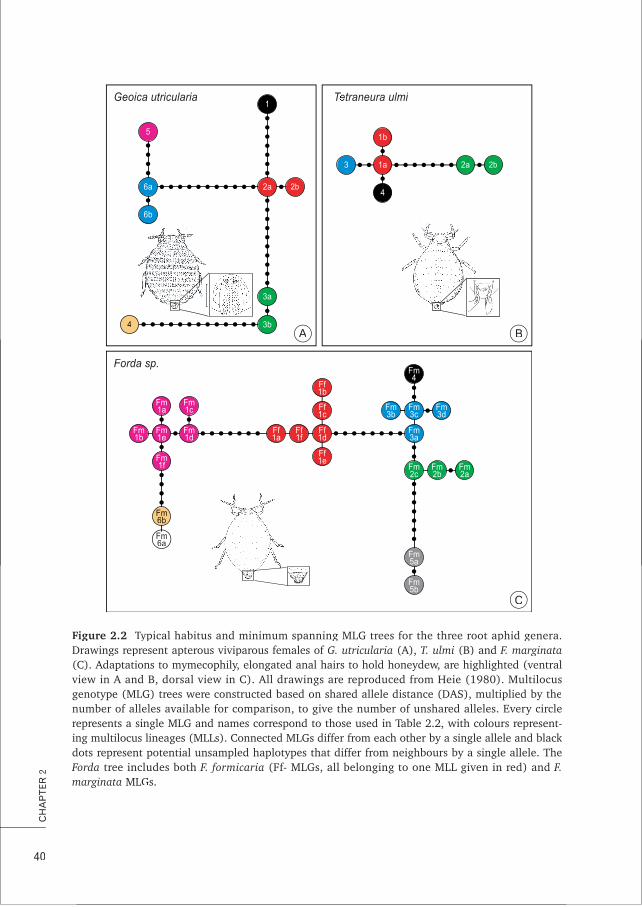
40
CH
AP
TER
2
Geoica utricularia
5
Fm1c
Fm1d
6a
6b
2a
3a
3b
2b
1Tetraneura ulmiTT
1b
1a3
4
2a 2b
Fm1a
Fm1e
Fm1b
Fm1f
Ff1c
Ff1d
Ff1e
Ff1b
Fm3c
Fm3a
Fm3b
Fm3d
Fm4
Fm2b
Fm2c
Fm5a
Fm5b
Fm2a
Ff1f
Ff1a
Fm6b
4A
Forda sp.
C
B
Fm6a
Figure 2.2 T fypical habitus and minimum spanning MLG trees for the three root aphid genera.TTDrawings represent apterous viviparous females of G. utricularia (A), T. ulmi (B) and F. marginata(C). Adaptations to mymecophily, elongated anal hairs to hold honeydew, are highlighted (ventralvvview in A and B, dorsal view in C). All drawings are reproduced from Heie (1980). Multilocusgenotype (MLG) trees were constructed based on shared allele distance (DAS), multiplied by thenumber of alleles available for comparison, to give the number of unshared alleles. Every circlerepresents a single MLG and names correspond to those used in Table 2.2, with colours represent-
king multilocus lineages (MLLs). Connected MLGs differ from each other by a single allele and blackdots represent potential unsampled haplotypes that differ from neighbours by a single allele. TheFFForda tree includes both F. formicaria (Ff- MLGs, all belonging to one MLL given in red) and F.marginata MLGs.
A.Ivens-diss 16-10-2012 11:14 Pagina 40
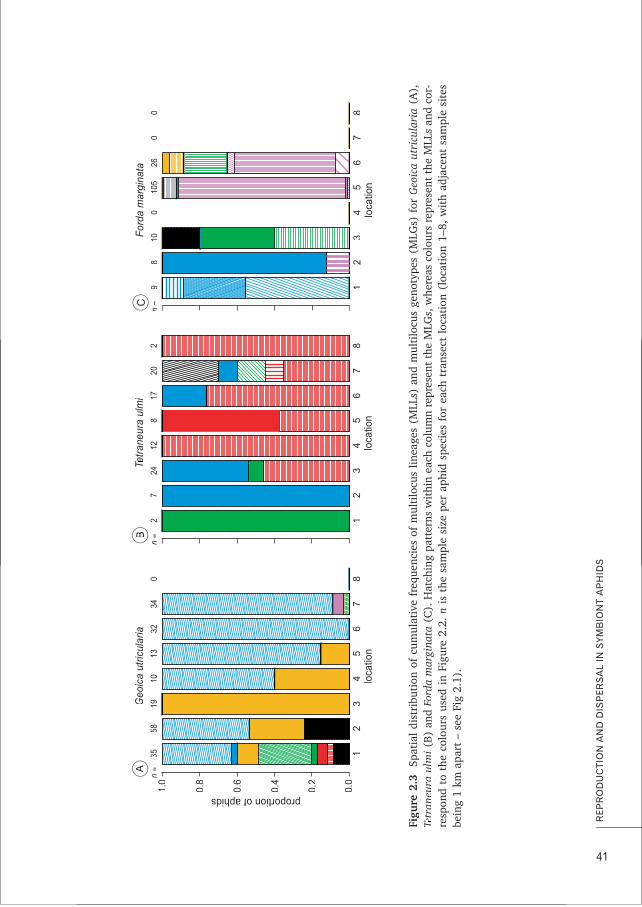
41
RE
PR
OD
UC
TIO
N A
ND
DIS
PE
RS
AL
IN S
YMB
ION
T A
PH
IDS
0.0
0.2
0.4
0.6
0.8
1.0
proportion of aphids
12
34
56
78
35n
=58
1910
1332
340
loca
tion
Geo
ica
utric
ular
iaA
B
12
34
56
78
9n
=8
100
105
260
0
loca
tion
For
da m
argi
nata
C
12
34
56
78
2n
=7
2412
817
202
loca
tion
Tetr
aneu
ra u
lmi
TT
Figu
re 2
.3f
ff
fSp
atia
l di
stri
buti
on o
f cu
mul
ativ
e fr
eque
ncie
s of
mul
tilo
cus
linea
ges
(MLL
s) a
nd m
ulti
locu
s ge
noty
pes
(MLG
s) f
or G
eoic
a ut
ricu
lari
a(A
),Te
tran
eura
ulm
iTT
(B)
and
Ford
a m
argi
nata
rr(C
). H
atch
ing
patt
erns
wit
hin
each
col
umn
repr
esen
t th
e M
LGs,
whe
reas
col
ours
rep
rese
nt t
he M
LLs
and
cor-
resp
ond
to t
he c
olou
rs u
sed
in F
igur
e 2.
2. n
is t
he s
ampl
e si
ze p
er a
phid
spe
cies
for
eac
h tr
anse
ct l
ocat
ion
(loc
atio
n 1–
8, w
ith
adja
cent
sam
ple
site
sbe
ing
1 km
apa
rt –
see
Fig
2.1
).
A.Ivens-diss 16-10-2012 11:14 Pagina 41
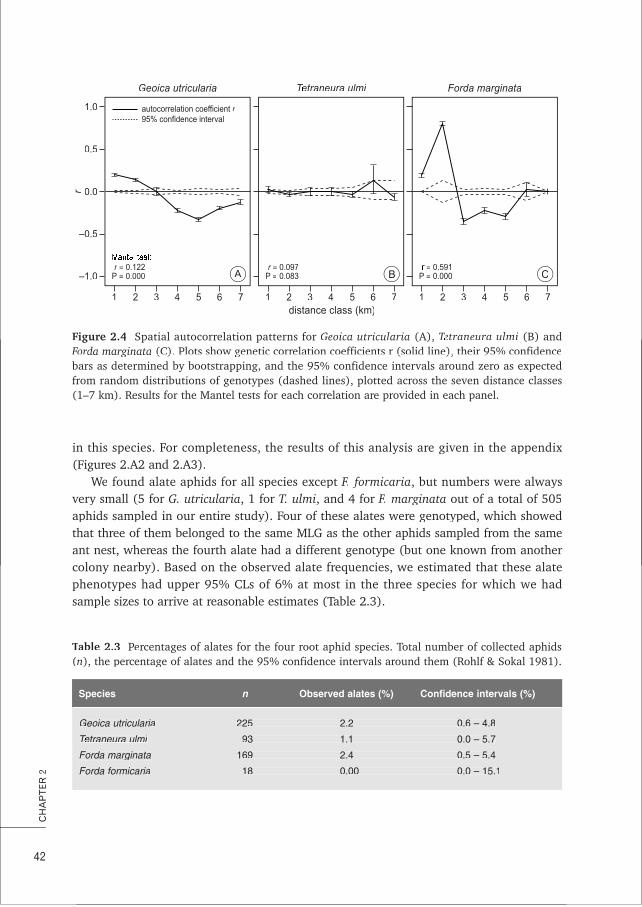
in this species. For completeness, the results of this analysis are given in the appendix(Figures 2.A2 and 2.A3).
We found alate aphids for all species except F. formicaria, but numbers were alwaysvvery small (5 for G. utricularia, 1 for T. ulmi, and 4 for F. marginata out of a total of 505aphids sampled in our entire study). Four of these alates were genotyped, which showedthat three of them belonged to the same MLG as the other aphids sampled from the sameant nest, whereas the fourth alate had a different genotype (but one known from anothercolony nearby). Based on the observed alate frequencies, we estimated that these alatephenotypes had upper 95% CLs of 6% at most in the three species for which we hadsample sizes to arrive at reasonable estimates (Table 2.3).
42
CH
AP
TER
2
–1.0
–0.5
0.0
0.5
1.0
r
1 2 3 4 5 6 7distance class (km)
A B Cr = 0.122
P = 0.000
Geoica utricularia
autocorrelation coefficient r95% confidence interval
1 2 3 4 5 6 7
r = 0.097P = 0.083
Tetraneura ulmiTT
1 2 3 4 5 6 7
= 0.591P = 0.000
Forda marginata
Figure 2.4 fSpatial autocorrelation patterns for Geoica utricularia (A), Tetraneura ulmiTT (B) andFFForFForda marginatada marginatarrr (C). Plots show genetic correlation coefficients r (solid line), their 95% confidence(C). Plots show genetic correlation coefficients r (solid line), their 95% confidencebbars as determined by bootstrapping, and the 95% confidence intervals around zero as expectedfrom random distributions of genotypes (dashed lines), plotted across the seven distance classes(1–7 km). Results for the Mantel tests for each correlation are provided in each panel.
Table 2.3TT Per f f f fcentages of alates for the four root aphid species. Total number of collected aphids(n), the percentage of alates and the 95% confidence intervals around them (Rohlf & Sokal 1981).
Species n Observed alates (%) Confidence intervals (%)
Geoica utricularia 225 2.2 0.6 – 4.8
Tetraneura ulmiTT 93 1.1 0.0 – 5.7
Forda marginata 169 2.4 0.5 – 5.4
Forda formicaria 18 0.00 0.0 – 15.1
Species n Observed alates (%) Confidence intervals (%)
A.Ivens-diss 16-10-2012 11:14 Pagina 42
DISCUSSION
Our population genetic estimates showed a strong signature of clonal reproduction for allfour root aphid species. We therefore infer that G. utricularia, T. ulmi, Forda marginatarr andFF. formicaria have predominantly if not exclusively asexual reproduction in the sampledSchiermonnikoog population, which largely confirms earlier findings and records (Muir1959; Pontin 1978; Heie 1980; Godske 1991; Blackman & Eastop 1994). A single cloneaccounted for the majority of individuals in all species. In G. utricularia and F. marginata,genetic differentiation and geographical distance correlated significantly, further corrobo-rating that the clonal aphid populations are viscous.
The reproductive modes of ant-tended root aphidsAAnholocyclic reproduction and overwintering as asexual females (instead of sexually pro-duced eggs) in ant nests in Northwest Europe has previously been inferred for G. utricu-laria and both Forda species (Muir 1959; Pontin 1978; Heie 1980; Godske 1991; Blackman
f& Eastop 1994), and our molecular data confirm this. However, finding the same extent ofasexual reproduction in T. ulmi ywas interesting, as this result matched observations by(Muir 1959; Pontin 1978; Godske 1991), but contrasted with (Heie 1980) statement thatT. ulmi reproduces sexually on elm trees in NW-Europe. Moderately mature (ca. 30 yearsold) elm trees do occur in the single village on the island of Schiermonnikoog, but leaf-galls of T. ulmi were not found (A.B.F. Ivens & M. Schrama, unpublished data). The recur-rence of identical T. ulmi clones in the same nest-mounds over consecutive years (Ivens tetal. 2012a; Chapter 4) further corroborates that T. ulmi does not reproduce sexually on theisland at any appreciable frequency. Until the 1980’s there were much older elm trees inthe village, which died from Dutch Elm Disease. These might have provided better oppor-tunities for sexual reproduction in T. ulmi.
fIt is important to note that currently available statistical tests for inferring modes ofreproduction from microsatellite data are designed to test the null hypothesis of 100%sexual reproduction and random mating, so that rejecting this null hypothesis does notimply that sexual reproduction is completely absent. Low frequencies of sex (<5%) couldalso account for the high variance in FISF values in combination with the strong LD that wefound in most of the loci-pairs (De Meeus & Balloux 2004). Statistically, we cannot ruleout, therefore, that a small proportion of reproduction, particularly in T. ulmi, was in factsexual (Balloux et al. 2003; Chapter 3), consistent with the primary host plant for thisspecies being available and spatial autocorrelation being low, in contrast to G. utriculariaand F. marginata where the host shrub for sexual reproduction is lacking (Heie 1980;Blackman & Eastop 1994) and autocorrelation patterns are distinct (Figure 4ab).
Population viscosity and dispersalThe aphid populations under study were viscous with low frequencies of alates and signif-icant autocorrelation in two species, G. utricularia and F. marginata. These autocorrela-tions were tenfold stronger that the largely non-significant, previously observedautocorrelations in two species of holocyclic aphids (Abbot & Chhatre 2007; Michel et al.2009). Despite this strong spatial structuring, some clonal lineages had managed to spread
43
RE
PR
OD
UC
TIO
N A
ND
DIS
PE
RS
AL
IN S
YMB
ION
T A
PH
IDS
A.Ivens-diss 16-10-2012 11:14 Pagina 43
along the studied transect (Figure 2.3), most likely by wind-dispersal of winged individu-als (alates). As our genetic data indicate that there is negligible recruitment from sexualreproduction on Schiermonnikoog, this must imply that the few alates that we genotypedwwere either sexual migrants destined to fail (i.e. to never result in spring offspring recolo-nizing ant mounds), or unusual asexual dispersers headed for other ant mounds ratherthan for primary host trees. Both scenarios would be consistent with the alate MLGs beingidentical with those of wingless aphids in the same or a neighbouring mound, so that ourdata do not allow us to discriminate between these possibilities.
Morphological analysis of the embryos borne by the alates could have allowed us toresolve whether alates were sexual or not, since embryos of sexuparae are arostrate,wwhereas embryos of asexual dispersers are rostrate (Blackman & Eastop 1994).Unfortunately, by the time we realized this, we had used the alates for DNA extraction andmicroscopic preparation. However, the timing of their appearance (mid-summer) suggeststhat we were dealing with unusual asexual dispersers, as sexupara are expected to occuronly towards the autumn (Heie 1980). Moreover, as the primary host of three species (theMediterranean shrub Pistacia f) has not occurred even close to the Island ofSchiermonnikoog since the last glaciation, it seems hard to imagine how the island couldhave ever been colonized if alates of these species could only migrate to and from Pistaciashrubs.
What we can infer is that clonal aphid gene flow between ant mounds would indeed bevvery low if dispersal remains restricted to wingless aphids walking on the soil surface (evenwwhen helped somewhat by wind), which has been observed for both Forda and TetraneuraTT(Muir 1959) or passive floating during tidal inundations, which has been observed for thesalt marsh root aphid Pemphigus trehernei, a non-ant-attended relative of Forda and Geoica(Foster & Treherne 1978; Foster 1978). P. trehernei yalso reproduces predominantly clonally
wand produces alates at very low frequencies (Foster 1975), but nevertheless colonizes newhost plants very effectively (Foster & Treherne 1978). Although dispersal by tidal floatingis poorly understood, it is conceivable that the aphid symbionts of L. flavus employ thesame mechanism during occasional summer inundations, to colonize existing ant moundswwhere they might then establish a new MLG that can be vertically propagated after adop-tion by the ants (Ivens et al. 2012a; Chapter 4).
Why aphids may lose sex altogether and does ant-tending matter?AAlthough it has long been known that aphids either have holocyclic (with sex) or anholo-cyclic (completely parthenogenetic) life cycles, we lack an overall understanding of theselection forces that make aphids lose sex and whether such development is always irre-vversible. This is because populations of only a few species have been studied in sufficientgenetic detail and few of these studies have targeted metapopulations consisting of holo-cyclic and anholocyclic patches. Polymorphisms of this kind are known to occur (Simon tetal. 2002) and genetic studies of such populations would thus be highly informative. Thestrong LD, significant deviations from HWE and the observed heterozygote excess matchthe genetic population structures of other anholocyclic aphids (Simon et al. 1996; Simon tetal. 1999; Delmotte et al. 2002; Gilabert et al. 2009; Kanbe & Akimoto 2009). However, allof these studies concern free-living aphids, while an association with ants is likely to affect
44
CH
AP
TER
2
A.Ivens-diss 16-10-2012 11:14 Pagina 44
the genetic population structure as well. Yao (2010) for example showed that FISF valuesfor ant-tended TuberculatusTT aphids were higher than those for unattended aphids.However, Vantaux et al. (2011a) did not find any effect of ant attendance on the geneticpopulation structure of facultatively ant-tended aphids above ground. The root aphidsstudied here may have such metapopulations consisting of sexual and asexual patches inSouthern Europe (see below), but their genetic analysis would only reveal whether closeproximity of primary host plants increases the frequency of sex, and not whether anttending matters, because there are no free living underground populations of these aphids(see Figure 2.2 for illustrations of their adaptations to myrmecophily).
Living in obligate mutualistic symbiosis has been argued to promote the irreversibleloss of sexual reproduction when the symbiotic environment becomes highly predictableand uniform (Law & Lewis 1983). Although originally developed for endosymbionts, thishypothesis might also apply to ectosymbionts such as the aphids of our present study,because they are surrounded by a highly protective host colony (i.e. they are endosym-bionts at the colony-level). The ants thus provide a protective underground environment inwwhich potentially (1) sexually produced frost-resistant eggs are no longer necessary and(2) well-known sex-inducing environmental cues such as lower temperature and shorterdaylight are less likely to be effective as cues (Rispe et al. 1998, reviewed in Moran 1992;Hales et al. 1997; Simon et al. y2002). In addition, ants actively keep aphid densities low byculling (Ivens et al. 2012a; Chapter 4), decreasing the potential for crowding, a factor alsoknown to induce dispersal and sexual reproduction in aphids (reviewed in Hales et al.1997). Dispersal constraints due to lack of primary host plants nearby and year-roundunderground nursing may thus have tipped the balance towards permanent parthenogene-sis, relative to aphids that are facultatively ant-tended on food plants above ground whereholocyclic life-cycles are more often maintained. We would thus be surprised if under-ground ant tending would ever be compatible with substantial aphid sexuality, even whenprimary host plants grow nearby. This logic seems to match the sparsely available compar-ative data as many above-ground aphids such as Aphis fabae combine a holocyclic life cyclewwith facultative ant-association (Heie 1986), whereas some other obligately ant-tended
faphids and coccids have become anholocyclic and even use the dispersing virgin queens ofthe host ants for transmission (Hölldobler & Wilson 1990).
It is interesting to note that some studies have found that ‘host-ant management’ candelay aphid dispersal and reduce alate production (Way 1963; Kindlmann et al. 2007;Oliver et al. 2007; Yao 2010; Tegelaar et al. 2011). In addition to the culling mentionedabove, underlying mechanisms for such practices as described for Lasius ants vary frominhibition through semiochemicals that slow aphids down (Oliver et al. 2007) to antsactively cutting the wings of their ‘dairy farm’ dispersal morphs (Way 1963; Hölldobler &WWilson 1990). We note, however, that our study population does not allow a convincingtest of the possible role of ‘ant management’ in the restriction of root aphid sex, becausethe primary host plant was absent for three species and quite possibly unsuitable for thefourth species (see above). Such a study would be possible in the southern European rangeof Pistacia, at sites where these bushes and mature elm trees co-occur with L. flavus andtheir root aphids. The microsatellite markers developed for the present study wouldprovide efficient tools to address these questions.
45
RE
PR
OD
UC
TIO
N A
ND
DIS
PE
RS
AL
IN S
YMB
ION
T A
PH
IDS
A.Ivens-diss 16-10-2012 11:14 Pagina 45
AAcknowledgmentsWe thank Sylvia Mathiasen for help in the laboratory, Thijs Janzen for field and laboratory assis-
tance, Ole E. Heie and Maurice Jansen for help with aphid taxonomy, David Nash for constructing
the minimal spanning trees of Figure 2.2 and Subject Editor at Molecular Ecology Jacob Russell and
three anonymous reviewers for their constructive comments on the manuscript. This study was sup-
fported by a PhD-Grant of the Centre for Ecological and Evolutionary Studies, University of
Groningen and grants by the Langerhuizen Fund and Nicolaas Mulerius Fund, awarded to A.B.F.I, as
wwell as by a grant from the Danish National Research Foundation to J.J.B that funded D.J.C.K’s con-
tributions before he obtained support from the Harvard Society of Fellows. We are grateful to the
VVereniging Natuurmonumenten for granting us permission to conduct field work in the National
Nature Reserve Schiermonnikoog and to the publishers Apollo Books, Stenstrup, Denmark and Brill,
Leiden, the Netherlands for granting permission to reproduce figures from Heie (1980) in Figure
2.2.
AAuthor informationThis work is part of the PhD thesis of ABFI. All authors have long standing interest in the evolution-
ary biology of cooperation and conflict within and between species in all its facets, including repro-
ductive mode and genetic diversity. FJW and IP are theoretical biologists using a modeling approach
to study social evolution and the causes and consequences of sexual reproduction.
Data AccessibilityySampling locations, sampling details, and microsatellite data are available from DRYAD (entry
doi:10.5061/dryad.d0t63).
46
CH
AP
TER
2
A.Ivens-diss 16-10-2012 11:14 Pagina 46
AAPPENDIX
The dependence of the ant Lasius flavus on root aphidsThe honeydew secreted by the aphids is the main source of carbohydrates for the subter-ranean L. flavus ants, as other subterranean carbon sources are limited in the salt marshand chalk-grassland habitats of these ants. Stable isotope analyses have confirmed that inthe presence of aphids there is a demonstrable intermediate trophic level between the veg-etation and the ants, consistent with the aphids being an intermediate foodweb node(A.B.F. Ivens & M. Schrama, unpublished data). L. flavus ants have also been recorded to
yeat a large proportion of their root aphids, suggesting that they also utilize their ‘dairycattle’ to increase protein acquisition (Pontin 1958; 1961b; 1978; Ivens et al. 2012a;Chapter 4). This implies that, similar to other subterranean ants, L. flavus depends on rootaphid husbandry for producing colonies large enough to reproduce (Way 1963; Hölldobler& Wilson 1990).
47
RE
PR
OD
UC
TIO
N A
ND
DIS
PE
RS
AL
IN S
YMB
ION
T A
PH
IDS
A.Ivens-diss 16-10-2012 11:14 Pagina 47

48
CH
AP
TER
2
Table 2.A1TT R f f f fesults of tests for the presence of Linkage Disequilibrium forRR ramet and genet datasetsof Geoica utricularia, Tetraneura ulmiTT and Forda marginatarr . G-tests for each available pair of lociw ywwere run using the Markov Chain algorithm of Raymond and Rousset (1995). P-values statisticallysignificant at a 5%-level are given in bold, indicating pairs of loci with significant LinkageDisequilibrium. The parameter setting for dememorisation was 10000, the number of batches wasset at 20, and the number of iterations per batch was 5000.
Ramet data Genet data
Locus 1 Locus 2 P-Value S.E. Locus 1 Locus 2 P-Value S.E.
Geoica utriculariaGu2 Gu2 0.000 0.000 Gu2 Gu3 0.000 0.000Gu2 Gu2 0.000 0.000 Gu2 Gu5 0.001 0.001Gu2 Gu2 0.000 0.000 Gu2 Gu6 0.016 0.003Gu2 Gu2 0.000 0.000 Gu2 Gu8 0.008 0.002Gu2 Gu2 0.000 0.000 Gu2 Gu9 0.483 0.011Gu2 Gu2 0.000 0.000 Gu2 Gu11 0.078 0.005Gu2 Gu2 0.000 0.000 Gu2 Gu13 0.054 0.005Gu5 Gu5 0.000 0.000 Gu5 Gu3 0.001 0.000Gu5 Gu5 0.000 0.000 Gu5 Gu6 0.003 0.001Gu5 Gu5 0.000 0.000 Gu5 Gu8 0.003 0.001Gu5 Gu5 0.000 0.000 Gu5 Gu9 0.904 0.006Gu5 Gu5 0.000 0.000 Gu5 Gu11 0.010 0.003Gu5 Gu5 0.000 0.000 Gu5 Gu13 0.011 0.003Gu6 Gu6 0.000 0.000 Gu6 Gu3 0.003 0.002Gu6 Gu6 0.000 0.000 Gu6 Gu8 0.007 0.002Gu6 Gu6 0.000 0.000 Gu6 Gu9 1.000 0.000Gu6 Gu6 0.000 0.000 Gu6 Gu11 0.124 0.010Gu6 Gu6 0.000 0.000 Gu6 Gu13 0.057 0.007Gu8 Gu8 0.000 0.000 Gu8 Gu3 0.002 0.001Gu8 Gu8 0.000 0.000 Gu8 Gu9 0.235 0.010Gu8 Gu8 0.000 0.000 Gu8 Gu13 0.002 0.001Gu9 Gu9 0.000 0.000 Gu9 Gu3 0.903 0.007Gu9 Gu9 0.000 0.000 Gu9 Gu13 0.097 0.009Gu11 Gu11 0.000 0.000 Gu11 Gu3 0.012 0.003Gu11 Gu11 0.000 0.000 Gu11 Gu8 0.049 0.004Gu11 Gu11 0.000 0.000 Gu11 Gu9 0.338 0.013Gu11 Gu11 0.000 0.000 Gu11 Gu13 0.018 0.003Gu13 Gu13 0.000 0.000 Gu13 Gu3 0.009 0.002
Pairs with significant LD : 28 Pairs with significant LD : 17
Ramet data Genet data
Locus 1 Locus 2 P-Value S.E. Locus 1 Locus 2 P-Value S.E.
A.Ivens-diss 16-10-2012 11:14 Pagina 48
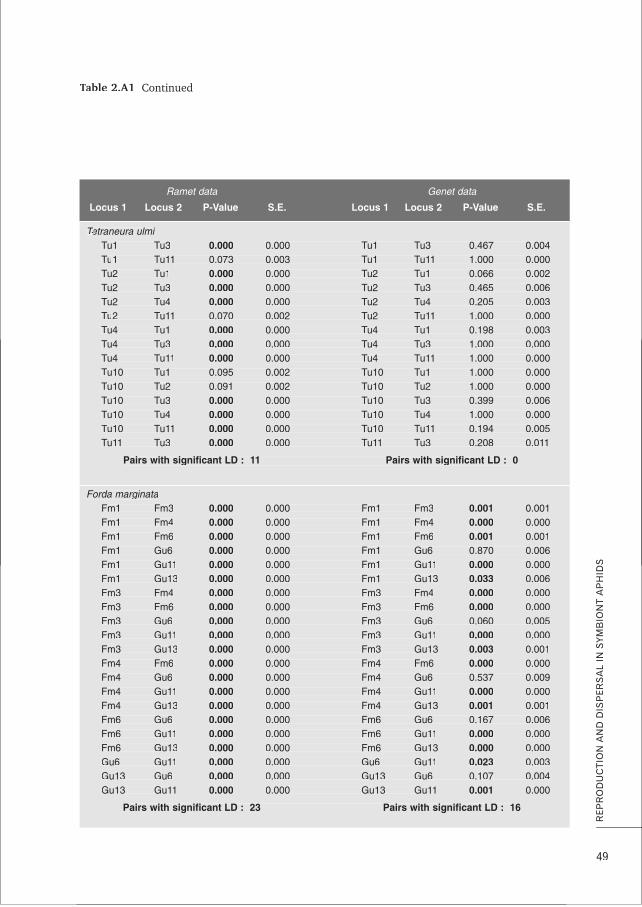
49
RE
PR
OD
UC
TIO
N A
ND
DIS
PE
RS
AL
IN S
YMB
ION
T A
PH
IDS
Table 2.A1TT Continued
Ramet data Genet data
Locus 1 Locus 2 P-Value S.E. Locus 1 Locus 2 P-Value S.E.
Tetraneura ulmiTTTu1 Tu3 0.000 0.000 Tu1 Tu3 0.467 0.004Tu1 Tu11 0.073 0.003 Tu1 Tu11 1.000 0.000Tu2 Tu1 0.000 0.000 Tu2 Tu1 0.066 0.002Tu2 Tu3 0.000 0.000 Tu2 Tu3 0.465 0.006Tu2 Tu4 0.000 0.000 Tu2 Tu4 0.205 0.003Tu2 Tu11 0.070 0.002 Tu2 Tu11 1.000 0.000Tu4 Tu1 0.000 0.000 Tu4 Tu1 0.198 0.003Tu4 Tu3 0.000 0.000 Tu4 Tu3 1.000 0.000Tu4 Tu11 0.000 0.000 Tu4 Tu11 1.000 0.000Tu10 Tu1 0.095 0.002 Tu10 Tu1 1.000 0.000Tu10 Tu2 0.091 0.002 Tu10 Tu2 1.000 0.000Tu10 Tu3 0.000 0.000 Tu10 Tu3 0.399 0.006Tu10 Tu4 0.000 0.000 Tu10 Tu4 1.000 0.000Tu10 Tu11 0.000 0.000 Tu10 Tu11 0.194 0.005Tu11 Tu3 0.000 0.000 Tu11 Tu3 0.208 0.011
Pairs with significant LD : 11 Pairs with significant LD : 0
Forda marginataFm1 Fm3 0.000 0.000 Fm1 Fm3 0.001 0.001Fm1 Fm4 0.000 0.000 Fm1 Fm4 0.000 0.000Fm1 Fm6 0.000 0.000 Fm1 Fm6 0.001 0.001Fm1 Gu6 0.000 0.000 Fm1 Gu6 0.870 0.006Fm1 Gu11 0.000 0.000 Fm1 Gu11 0.000 0.000Fm1 Gu13 0.000 0.000 Fm1 Gu13 0.033 0.006Fm3 Fm4 0.000 0.000 Fm3 Fm4 0.000 0.000Fm3 Fm6 0.000 0.000 Fm3 Fm6 0.000 0.000Fm3 Gu6 0.000 0.000 Fm3 Gu6 0.060 0.005Fm3 Gu11 0.000 0.000 Fm3 Gu11 0.000 0.000Fm3 Gu13 0.000 0.000 Fm3 Gu13 0.003 0.001Fm4 Fm6 0.000 0.000 Fm4 Fm6 0.000 0.000Fm4 Gu6 0.000 0.000 Fm4 Gu6 0.537 0.009Fm4 Gu11 0.000 0.000 Fm4 Gu11 0.000 0.000Fm4 Gu13 0.000 0.000 Fm4 Gu13 0.001 0.001Fm6 Gu6 0.000 0.000 Fm6 Gu6 0.167 0.006Fm6 Gu11 0.000 0.000 Fm6 Gu11 0.000 0.000Fm6 Gu13 0.000 0.000 Fm6 Gu13 0.000 0.000Gu6 Gu11 0.000 0.000 Gu6 Gu11 0.023 0.003Gu13 Gu6 0.000 0.000 Gu13 Gu6 0.107 0.004Gu13 Gu11 0.000 0.000 Gu13 Gu11 0.001 0.000
Pairs with significant LD : 23 Pairs with significant LD : 16
Ramet data Genet data
Locus 1 Locus 2 P-Value S.E. Locus 1 Locus 2 P-Value S.E.
A.Ivens-diss 16-10-2012 11:14 Pagina 49
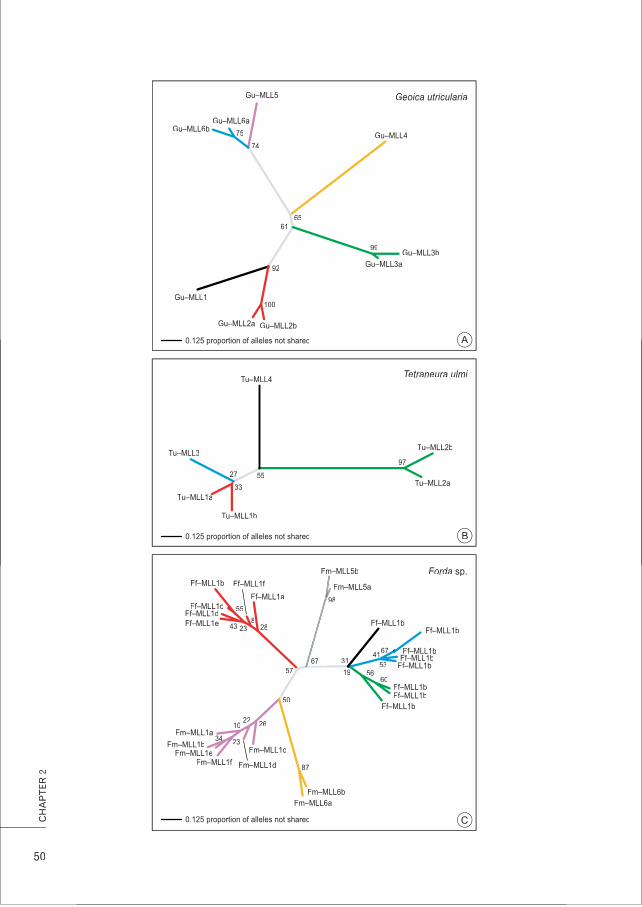
50
CH
AP
TER
2
Geoica utricularia
Ff–MLL1b
Ff–MLL1bFf–MLL1b
Ff–MLL1b
Ff–MLL1bFf–MLL1b
Ff–MLL1b
Ff–MLL1b
Fm–MLL5a
Fm–MLL5b
Ff–MLL1a
Ff–MLL1f
57
50
22 26
344 23
10
87
28
98
31
97
100
92
6165
99
74
75
55
33
27
19 5660
53
67741
8
55
2343
Ff–MLL1b
Ff–MLL1cFf–MLL1dFf–MLL1e
Fm–MLL1a
Fm–MLL1bFm–MLL1e
Fm–MLL1f Fm–MLL1d
Fm–MLL1c
Fm–MLL6bFm–MLL6a
0.125 proportion of alleles not shared
0.125 proportion of alleles not shared
0.125 proportion of alleles not shared
Gu–MLL5
Gu–MLL6aGu–MLL6b
Gu–MLL4
Gu–MLL3bGu–MLL3a
Gu–MLL2bGu–MLL2a
Gu–MLL1
Tu–MLL4
Tu–MLL3
Tu–MLL1b
Tu–MLL1a
Tu–MLL2a
Tu–MLL2b
Tetraneura ulmi
A
Forda sp.
6767
B
C
A.Ivens-diss 16-10-2012 11:14 Pagina 50
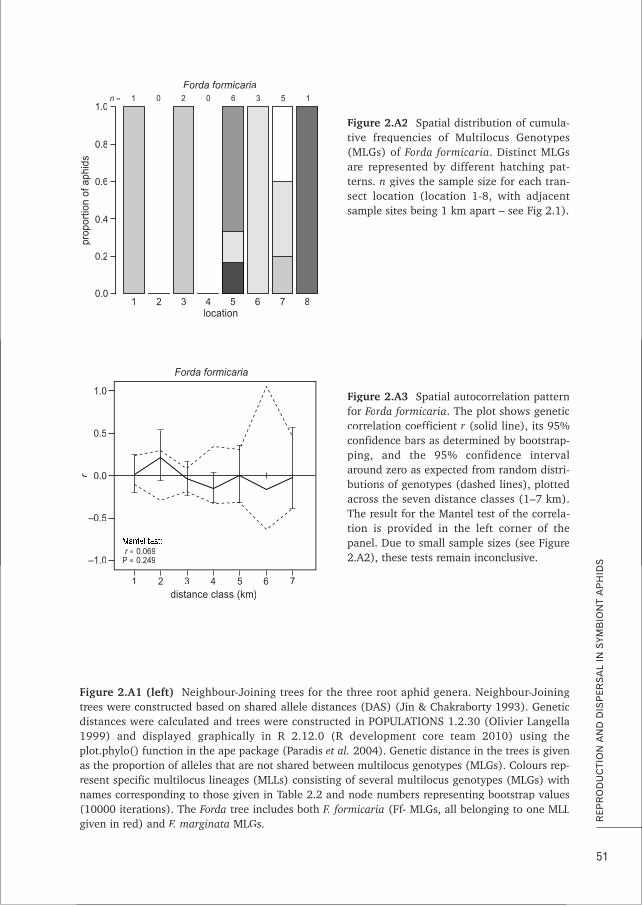
51
RE
PR
OD
UC
TIO
N A
ND
DIS
PE
RS
AL
IN S
YMB
ION
T A
PH
IDS
Figure 2.A1 (left) fNeighbour-Joining trees for the three root aphid genera. Neighbour-Joiningtrees were constructed based on shared allele distances (DAS) (Jin & Chakraborty 1993). Geneticdistances were calculated and trees were constructed in POPULATIONS 1.2.30 (Olivier Langella1999) and displayed graphically in R 2.12.0 (R development core team 2010) using theplot.phylo() function in the ape package (Paradis et al. 2004). Genetic distance in the trees is givenas the proportion of alleles that are not shared between multilocus genotypes (MLGs). Colours rep-resent specific multilocus lineages (MLLs) consisting of several multilocus genotypes (MLGs) withnames corresponding to those given in Table 2.2 and node numbers representing bootstrap values(10000 iterations). The Forda tree includes both F. formicaria (Ff- MLGs, all belonging to one MLLgiven in red) and F. marginata MLGs.
0.0
0.2
0.4
0.6
0.8
1.0
prop
ortio
n of
aph
ids
1 2 3 4 5 6 7 8location
Forda formicaria1 0 2 0 6 3 5 1n =
Figure 2.A2 fSpatial distribution of cumula-tive frequencies of Multilocus Genotypes(MLGs) of Forda formicaria. Distinct MLGsare represented by different hatching pat-terns. n gives the sample size for each tran-sect location (location 1-8, with adjacentsample sites being 1 km apart – see Fig 2.1).
–1.0
–0.5
0.0
0.5
1.0
r
1 2 3 4 5 6 7
r = 0.069P = 0.249
Forda formicaria
distance class (km)
Figure 2.A3 Spatial autocorrelation patternfor Forda formicariarr . The plot shows geneticcorrelation coefficient r (solid line), its 95%confidence bars as determined by bootstrap-ping, and the 95% confidence intervalaround zero as expected from random distri-butions of genotypes (dashed lines), plottedacross the seven distance classes (1–7 km).The result for the Mantel test of the correla-tion is provided in the left corner of thepanel. Due to small sample sizes (see Figure2.A2), these tests remain inconclusive.
A.Ivens-diss 16-10-2012 11:14 Pagina 51

A.Ivens-diss 16-10-2012 11:14 Pagina 52
f fEstimating the frequency of sexualreproduction in root aphids based onmicrosatellite markers
A k B F IAniek B.F. IvensJacobus J. BoomsmaFranz J. WeissingIdo Pen
CH
AP
TER3
A.Ivens-diss 16-10-2012 11:14 Pagina 53

54
CH
AP
TER
3
Many organisms are known to have a mixed reproductive strategyof both sexual and asexual reproduction. Mixed reproduction canhave major implications for the ecology and evolution of a speciesand detecting the occurrence of mixed reproduction and its extentcan therefore be crucial for our understanding of the evolutionaryecology of these organisms. However, to date it remains difficult toindirectly estimate the frequency of sexual and asexual reproduc-tion from microsatellite data. This is because traditional methodsremain limited to all-or-nothing detection of sexual reproduction,rather than allowing for estimation of rates sexual reproductionsmaller than 100%. Here, we present a simulation model of popu-lation genetic diversity under varying rates of sexual reproduction.Population genetic diversity is assessed using two estimates: clonaldiversity Pd and effective clonal diversity Pde. Model assumptionsof microsatellite marker diversity and spatial population structurewere especially tailored to root aphids and based on empirical dataof natural population of these cyclic parthenogens. The resultsshow that in predominantly sexual populations, small amounts ofasexual reproduction will remain hard to detect. On the otherhand, small amounts of sexual reproduction in predominantlyclonal populations leave significant population genetic signatures.The results further show that the clonal diversity observed for theroot aphids on which we based our simulations, match best withpredominant asexual reproduction and absence of dispersal. Forone root aphid species, Tetraneura ulmiTT , however, observed geno-typic variation proved too small to draw definite conclusions fromour simulations and neither did our simulation results matchearlier findings with traditional methods. We therefore argue thatfor inferring mixed reproduction from microsatellite data a plural-istic approach consisting of several different analyses should ideallybe applied.
AAABSTRACT
A.Ivens-diss 16-10-2012 11:14 Pagina 54
INTRODUCTION
A small amount of sexual reproduction or recombination can overcome the costs of strictlyA small amount of sexual reproduction or recombination can overcome the costs of strictlyasexual reproduction, which is generally considered an evolutionary ‘dead end’ (Green &Noakes 1995; Hurst & Peck 1996; D'Souza & Michiels 2010). These costs, such as accumu-lation of deleterious mutations (‘Muller’s ratchet’) and being ‘out-evolved’ by parasitesmay ultimately outweigh the benefits of the higher reproductive rate of clonal species (nothaving to find a mate) and the preservation of beneficial combinations of alleles in absence
fof recombination (reviewed in Green & Noakes 1995). Detecting a small proportion ofsexual reproduction in an otherwise clonal organism can thus be crucial for our under-standing of the ecology and evolution of the species under study. Vice versaVV can small boutsof asexual reproduction in a predominantly sexual species allow for increased colonizationopportunities, through outbursts of high reproductive rates. Many of the species withpotentially mixed reproductive modes include ecologically and economically importantspecies such as various insects that are crop pests (e.g. aphids), crop plants (e.g. potato)and human pathogens (e.g. Candida albicans) (reviewed in De Meeus et al. 2007).Moreover, the frequency of sexual reproduction can have a strong effect on effective popu-lation sizes (N(( EN ) (Yonezawa et al. 2004), which can have important consequences for theconservation genetics of a species. However, despite its assumed importance, it was notuntil recently that attention shifted towards the study of mixed reproduction in single,natural populations (among others Balloux et al. 2003; De Meeus et al. 2006; Villate et al.2010; Allen & Lynch 2012).
A major reason for our lack of knowledge on the occurrence of mixed reproductivefmodes in natural populations is the lack of accurate methods to estimate the frequency of
sexual reproduction from population genetic data. The most widely used techniques aretests for deviations from Hardy-Weinberg Equilibrium (HWE) and estimating so-called P xsexPvvalues for specific genotypes. The PsexP value of a genotype gives the probability that thenumber of repeated observations of a particular genotype in the population resulted fromindependent events of sexual reproduction, rather than asexual reproduction (Tibayrenc tetal. 1990; Parks & Werth 1993; Young et al. 2002; Arnaud-Haond et al. 2007). Bothmethods rely on rejecting the null hypothesis of 100% random mating, with the only avail-able alternative being 100% clonal reproduction and thus leaving lower rates of sexualreproduction undetected (reviewed in Arnaud-Haond et al. 2007). Moreover, both HWEand PsexP approaches test observed population genetic data under the classic, restricted,assumptions of a randomly mating, unstructured population. In sum, the currently oftenobserved ‘negative’ result of failing to detect sexual reproduction with these classicapproaches could also be explained by (1) proportions of sexual reproduction muchsmaller than 100% occurring in a population, which remain undetected by currentmethods and (2) the ‘ideal’ HWE assumptions not being met; violation of any of theseassumptions will cause significant deviations from HWE.
Several theoretical studies have investigated the effects of mixed reproductive strate-gies on the patterning of genetic variation in a population (Green & Noakes 1995; Ballouxet al. 2003; Bengtsson 2003; De Meeus & Balloux 2004; Halkett et al. 2005; D'Souza &Michiels 2010). These studies reveal that proportions of clonality other than those
55
ES
TIM
ATI
ON
OF
RE
PR
OD
UC
TIV
E M
OD
E B
AS
ED
ON
MIC
RO
SA
TELL
ITE
DA
TA
A.Ivens-diss 16-10-2012 11:14 Pagina 55
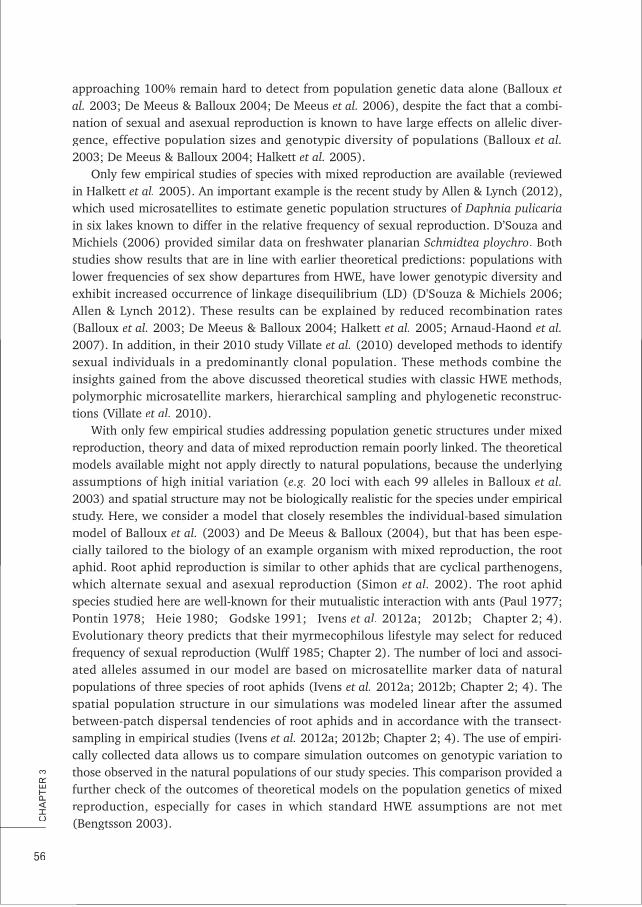
approaching 100% remain hard to detect from population genetic data alone (Balloux tetal. 2003; De Meeus & Balloux 2004; De Meeus et al. 2006), despite the fact that a combi-nation of sexual and asexual reproduction is known to have large effects on allelic diver-gence, effective population sizes and genotypic diversity of populations (Balloux et al.2003; De Meeus & Balloux 2004; Halkett et al. 2005).
Only few empirical studies of species with mixed reproduction are available (reviewedin Halkett et al. 2005). An important example is the recent study by Allen & Lynch (2012),wwhich used microsatellites to estimate genetic population structures of Daphnia pulicariain six lakes known to differ in the relative frequency of sexual reproduction. D’Souza andMichiels (2006) provided similar data on freshwater planarian Schmidtea ploychro. Bothstudies show results that are in line with earlier theoretical predictions: populations withlower frequencies of sex show departures from HWE, have lower genotypic diversity andexhibit increased occurrence of linkage disequilibrium (LD) (D'Souza & Michiels 2006;AAllen & Lynch 2012). These results can be explained by reduced recombination rates(Balloux et al. 2003; De Meeus & Balloux 2004; Halkett et al. 2005; Arnaud-Haond et al.2007). In addition, in their 2010 study Villate et al. y(2010) developed methods to identifysexual individuals in a predominantly clonal population. These methods combine theinsights gained from the above discussed theoretical studies with classic HWE methods,polymorphic microsatellite markers, hierarchical sampling and phylogenetic reconstruc-tions (Villate et al. 2010).
With only few empirical studies addressing population genetic structures under mixedreproduction, theory and data of mixed reproduction remain poorly linked. The theoreticalmodels available might not apply directly to natural populations, because the underlyingassumptions of high initial variation (e.g. 20 loci with each 99 alleles in Balloux et al.2003) and spatial structure may not be biologically realistic for the species under empiricalstudy. Here, we consider a model that closely resembles the individual-based simulationmodel of Balloux et al. (2003) and De Meeus & Balloux (2004), but that has been espe-cially tailored to the biology of an example organism with mixed reproduction, the rootaphid. Root aphid reproduction is similar to other aphids that are cyclical parthenogens,wwhich alternate sexual and asexual reproduction (Simon et al. 2002). The root aphidspecies studied here are well-known for their mutualistic interaction with ants (Paul 1977;Pontin 1978; Heie 1980; Godske 1991; Ivens et al. 2012a; 2012b; Chapter 2; 4).Evolutionary theory predicts that their myrmecophilous lifestyle may select for reducedfrequency of sexual reproduction (Wulff 1985; Chapter 2). The number of loci and associ-ated alleles assumed in our model are based on microsatellite marker data of naturalpopulations of three species of root aphids (Ivens et al. 2012a; 2012b; Chapter 2; 4). Thespatial population structure in our simulations was modeled linear after the assumedbetween-patch dispersal tendencies of root aphids and in accordance with the transect-sampling in empirical studies (Ivens et al. 2012a; 2012b; Chapter 2; 4). The use of empiri-cally collected data allows us to compare simulation outcomes on genotypic variation tothose observed in the natural populations of our study species. This comparison provided afurther check of the outcomes of theoretical models on the population genetics of mixedreproduction, especially for cases in which standard HWE assumptions are not met(Bengtsson 2003).
56
CH
AP
TER
3
A.Ivens-diss 16-10-2012 11:14 Pagina 56
MODEL
fIn our simulations, we considered a monoecious population consisting of a linear array of10 patches that each contain 1000 diploid individuals, in correspondence with the islandmodel used by Balloux et al. (2003). The simulation assumes that these individuals reproducesexually with fixed probability PsP and asexually with the complementary probability 1–P– sP .
During sexual reproduction, recombination occurs between two randomly drawnparents, whereas offspring produced by asexual reproduction are identical copies of theirparent. The population was further assumed to be monoecious without selfing (unlike themodel by Balloux et al. (2003)). The number of loci, allelic variation and initial allelefrequencies were identical to those observed in the field for three species of root aphids
y(see below, Table 3.A1). During the reproduction phase, alleles mutate with probabilityμμ = 10-3 into one of the other available alleles for that locus. By choosing this mutationimplementation we followed Balloux et al. (2003), although microsatellite loci are likely tobe subject to stepwise mutation (Nauta & Weissing 1996). The assumed mutation rate ishigher than the rate of 10-5 applied by Balloux et al. y(2003). This is because the naturallyobserved variation on which we based our simulations is lower than the theoretical varia-tion assumed in Balloux et al. (2003) and De Meeus & Balloux (2004); under a low muta-tion rate of 10-5 drift would therefore erode all variation over simulation time. In addition,wwe assume that all loci are neutral and unlinked. After reproduction, parents die and theoffspring disperse between patches with fixed probability Pdisp and across a distance ran-domly chosen between 0 and a fixed maximal dispersal distance Ddist. After dispersal,1000 juveniles per patch mature into the next parent generation. We assumed no fitnessdifferences between sexually and asexually produced individuals and simulated 15000generations, after which observed diversity estimates (see below) were in equilibrium(Figures 3.1, 3.A1).
Two indicators for population genetic diversity were estimated: clonal diversity TT Pd andeffective clonal diversity Pde. The clonal diversity index Pd is given by G/N with G being thenumber of unique multilocus genotypes (MLGs) and N the total population size (Ellstrand& Roose 1987; Dorken & Eckert 2001; Arnaud-Haond et al. 2007). Pd is a widely used esti-mate of genotypic diversity in clonal species (reviewed in Arnaud-Haond et al. 2007). Pd
ranges between 0 and 1, with a value of 1 indicating high genetic diversity (i.e every indi-vvidual having a unique genotype). Population structures of clonal species are often charac-terized by one or a few MLGs that are overrepresented. To quantify this effect, we used theeffective number of genotypes Ge (Balloux et al. 2003) given by:
Ge = 1
(2.1)∑
gi2
in which gi is the frequency of the ith genotype. To normalize the effective number of geno-types for population size we use the following modified estimate for effective clonal diver-sity Pde
Pde =Ge (2.2)N
57
ES
TIM
ATI
ON
OF
RE
PR
OD
UC
TIV
E M
OD
E B
AS
ED
ON
MIC
RO
SA
TELL
ITE
DA
TA
A.Ivens-diss 16-10-2012 11:14 Pagina 57
in our further analysis. Again, Pde ranges between 0 and 1 and values approaching 1 indi-cate high genetic diversity.
We ran simulations with the frequency of sexual reproduction PsP increasing from 0 and1, in steps of size 0.01. To study the effect of population structure, these simulations wererun for a series of dispersal regimes (Pdisp = 0.0, 0.001, 0.01, 0.05, 0.1 in combinationwwith Ddisp = 1 and Ddisp = 2, 5, 10 with Pdisp = 0.01). All simulations were replicated 5times.
Simulations were run using a C++ routine (available upon request) and compiled ing++ 4.3.4 (Free Software Foundation, Inc. 2008). The program included a random numbergenerator that uses the GNU Scientific Library (James 1994; Lüscher 1994).
DataThe number of loci and allelic variation and frequency implemented in the model werebased on population genetic data on three species of root aphids: Geoica utricularia, Fordamarginata and Tetraneura ulmiTT (Ivens et al. 2012a; 2012b; Chapter 2; 4). Reproductivemode in aphids is known to differ between species and between populations of the species,wwith holocyclic species or populations having a sexual phase and anholocyclic species com-pletely lacking this phase (Simon et al. 2002). However, the occurrence of rare sex mightremain undetected in aphids that are thought to be anholocyclic. All aphids were sampledon the Dutch island of Schiermonnikoog in July 2008. To determine MLGs in these threespecies species-specific 5–8 polymorphic microsatellite markers (Ivens et al. 2011; Chapter5) were used and sample sizes per species ranged from 92 to 201 individuals. A detaileddescription of the sampling, molecular analysis and observed MLGs can be found inChapter 2.
RESULTS AND DISCUSSION
We simulated populations with the number of loci and allelic diversity observed in naturalfpopulations of three species of root aphids. Only the estimated microsatellite variation of
Geoica utricularia and Forda marginatarr turned out to be sufficient for any effect to beobserved over simulation time in our model. We will therefore focus discussion of theresults on these two species. For completeness, Tetraneura ulmiTT results are given in theappendix (Figures 3.A1, 3.A2)
The effects of sexual reproduction and dispersal on clonal diversityPPd and Pde values both fluctuated strongly over simulation time, with the strongest fluctua-tions observed for Pde values and under PsP = 1 (complete sexual reproduction), as is shownin Figure 3.1 for one representative simulation run. After an initial decline in clonal diver-sity over the whole range of PsP values, the diversity estimates kept fluctuating within alimited range of values. Caution should thus be taken at what time step observed and sim-ulated diversity estimates are compared. Figure 3.2 shows results for generation 15000,corresponding to a near-equilibrium for all PsP yvalues except maybe for complete sexuality(P(( sP = 1.0).
58
CH
AP
TER
3
A.Ivens-diss 16-10-2012 11:14 Pagina 58
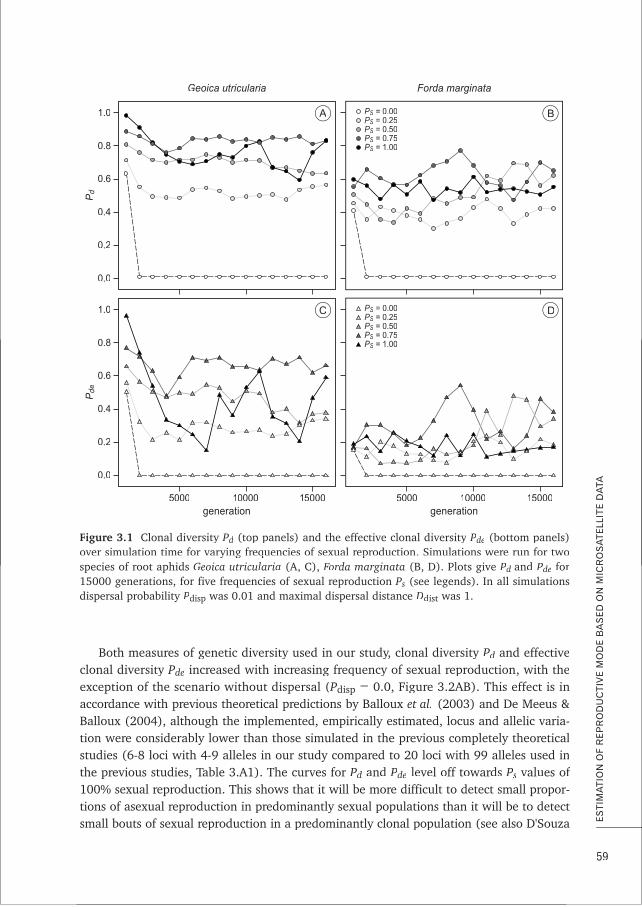
Both measures of genetic diversity used in our study, clonal diversity Pd and effectiveclonal diversity Pde increased with increasing frequency of sexual reproduction, with theexception of the scenario without dispersal (Pdisp = 0.0, Figure 3.2AB). This effect is inaccordance with previous theoretical predictions by Balloux et al. (2003) and De Meeus &Balloux (2004), although the implemented, empirically estimated, locus and allelic varia-tion were considerably lower than those simulated in the previous completely theoreticalstudies (6-8 loci with 4-9 alleles in our study compared to 20 loci with 99 alleles used inthe previous studies, Table 3.A1). The curves for Pd and Pde level off towards PsP fvalues of100% sexual reproduction. This shows that it will be more difficult to detect small propor-tions of asexual reproduction in predominantly sexual populations than it will be to detectsmall bouts of sexual reproduction in a predominantly clonal population (see also D'Souza
59
ES
TIM
ATI
ON
OF
RE
PR
OD
UC
TIV
E M
OD
E B
AS
ED
ON
MIC
RO
SA
TELL
ITE
DA
TA
0.0
0.2
0.4
0.6
0.8
1.0
Pde
15000100005000generation
A B
C DPS = 0.00S
0.0
0.2
0.4
0.6
0.8
1.0
Pd
Geoica utricularia
15000100005000generation
Forda marginata
PS = 0.25SPS = 0.50SPS = 0.75SPS = 1.00S
PS = 0.00SPS = 0.25SPS = 0.50SPS = 0.75SPS = 1.00S
Figure 3.1 Clonal diversity Pd ff(top panels) and the effective clonal diversity Pde (bottom panels)over simulation time for varying frequencies of sexual reproduction. Simulations were run for twoover simulation time for varying frequencies of sexual reproduction. Simulations were run for twospecies of root aphids Geoica utricularia (A, C), Forda marginatarr (B, D). Plots give Pd and Pde for15000 generations, for five frequencies of sexual reproduction PsP (see legends). In all simulationsdispersal probability Pdisp was 0.01 and maximal dispersal distance Ddist was 1.
A.Ivens-diss 16-10-2012 11:14 Pagina 59

& Michiels 2006; De Meeus et al. 2006). Indeed, a small percentage of sexual reproductionis known to have a major effect on patterning of genetic diversity in a population and canmake a predominantly clonal population look like a sexually reproducing population. Thisis in line with conclusions that ‘a little bit of sexual reproduction’ may be superior to bothpurely clonal reproduction and purely sexual reproduction, since it combines the benefitsof sexual reproduction (a high degree of genetic diversity) without having to bear the ‘costsof sex’ (Green & Noakes 1995; Bengtsson 2003; D'Souza & Michiels 2010).
Higher dispersal rates Pdisp have a clear positive effect on clonal diversity (Figure3.2AB), while dispersal distance Ddist has only a marginal additional effect (Figure 3.2CD).The positive effect of dispersal on clonal diversity under varying frequencies of sex is inaccordance with previous results by De Meeus & Balloux (2004).
Insights into root aphid dispersal and reproductionObserved Pd and Pde values in the natural populations of G. utricularia and F. marginatawwere consistently lower than those obtained in the simulations, even when assuming com-plete absence of sex (indicated by the arrows on the y-axes, Figure 3.2), with the exceptionof simulated populations that were both strictly asexual and highly structured (Pdisp =0.0). This shows that the observed clonal diversity for G. utricularia and F. marginata canbe best explained by strong population structure in combination with exclusive asexualreproduction. The simulations thus enable us to confirm our previous findings of HWE-based analyses (Ivens et al. 2012b; Chapter 2). Predominant asexual reproduction and raredispersal are also in accordance with the biological details known for these aphid species(Heie 1980; Ivens et al. 2012b; Chapter 2).
The same HWE-based analyses (Ivens et al. 2012b; Chapter 2), however, also rejectedsexual reproduction in the third population of aphid species Tetraneura ulmiTT (Figure 3.A2),wwhereas our simulation results show that based on its observed genotypic variation, sexualreproduction cannot be completely excluded, because observed and simulated Pd and Pde
vvalues overlapped along the full range of PsP values from 0 to 1. This shows that cautionshould be taken when rejecting sexual reproduction based on classical HWE-tests alone,especially when standard assumptions, such as an unstructured population, are not met.The difference between the results for this species and the other two species may be due tolower statistical power because variation at marker loci was less pronounced in T. ulmi (6loci, 2–5 alleles; rather than 6–7 loci with 8–9 alleles in the other two species, Table 3.A1).AAlternatively, the ambiguous results for T. ulmi may reflect that some sex in this speciesdoes indeed occur, or did so until a few decades ago, as T. ulmi has mature elm trees(Ulmus) as primary hosts, which did in fact occur on the island until the 1980s, whereasthe Pistacia primary host of G. utricularia and F. marginata is restricted to Mediterraneanareas (Heie 1980; Ivens et al. 2012b; Chapter 2).
Conclusion and future directionsOur present simulations were restricted to microsatellite variation of three species of rootaphids, with similar natural history characteristics. Further understanding of the impor-tance of mixed reproductive modes in structured populations, would greatly benefit fromrepeating our simulations with data from other taxa than root aphids. Such future studies
60
CH
AP
TER
3
A.Ivens-diss 16-10-2012 11:14 Pagina 60
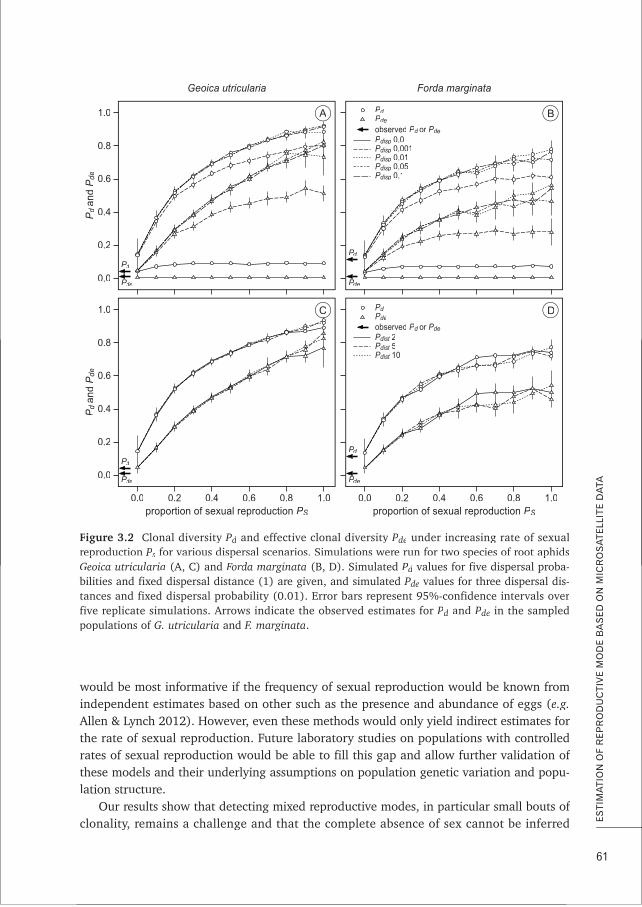
wwould be most informative if the frequency of sexual reproduction would be known fromindependent estimates based on other such as the presence and abundance of eggs (e.g.AAllen & Lynch 2012). However, even these methods would only yield indirect estimates forthe rate of sexual reproduction. Future laboratory studies on populations with controlled
frates of sexual reproduction would be able to fill this gap and allow further validation ofthese models and their underlying assumptions on population genetic variation and popu-lation structure.
fOur results show that detecting mixed reproductive modes, in particular small bouts ofclonality, remains a challenge and that the complete absence of sex cannot be inferred
61
ES
TIM
ATI
ON
OF
RE
PR
OD
UC
TIV
E M
OD
E B
AS
ED
ON
MIC
RO
SA
TELL
ITE
DA
TA
0.0
0.2
0.4
0.6
0.8
1.0
Pd
and
Pde
0.0proportion of sexual reproduction PS
A B
C D
Geoica utricularia Forda marginata
Pdisp 0.0Pdisp 0.001Pdisp 0.01Pdisp 0.05Pdisp 0.1
0.2 0.4 0.6 0.8 1.0
PdPP
PdePP
0.0proportion of sexual reproduction PS
0.2 0.4 0.6 0.8 1.0
PdPP
PdePP
0.0
0.2
0.4
0.6
0.8
1.0
Pd
and
Pde
PdPP
PdePP
PdPP
PdePP
PdPde
Pdist 2tPdist 5tPdist 10t
PdPde
observed Pd or Pde
observed Pd or Pde
Figure 3.2 Clonal diversity Pd ffand effective clonal diversity Pde funder increasing rate of sexualrreproduction eproduction PPssPP for various dispersal scenarios. Simulations were run for two species of root aphidsfor various dispersal scenarios. Simulations were run for two species of root aphidsGeoica utricularia (A, C) and Forda marginatarr (B, D). Simulated Pd values for five dispersal proba-bbilities and fixed dispersal distance (1) are given, and simulated Pde values for three dispersal dis-tances and fixed dispersal probability (0.01). Error bars represent 95%-confidence intervals overfive replicate simulations. Arrows indicate the observed estimates for Pd and Pde in the sampledpopulations of G. utricularia and F. marginata.
A.Ivens-diss 16-10-2012 11:14 Pagina 61
wwith certainty in cases where variation at marker loci is limited (e.g. T. ulmi). Ideally, con-clusions on estimated rates of (a)sexual reproduction in natural populations with mixedreproductive strategies should therefore be based on multiple different analyses such asclassic LD-, FIS- and Psex-analyses combined with Pd simulations as presented here(Bengtsson 2003; De Meeus & Balloux 2004; Halkett et al. 2005; De Meeus et al. 2006;AArnaud-Haond et al. 2007).
AAcknowledgementsWe authors thank the Donald Smits Centre for Information Technology, Groningen, for letting us use
the Millipede High Performance Cluster to run simulations. This study was supported by a PhD
ygrant of the Centre for Ecological and Evolutionary Studies, University of Groningen and grants by
the Langerhuizen Fund and the Nicolaas Mulerius Fund, awarded to A.B.F.I.
62
CH
AP
TER
3
A.Ivens-diss 16-10-2012 11:14 Pagina 62
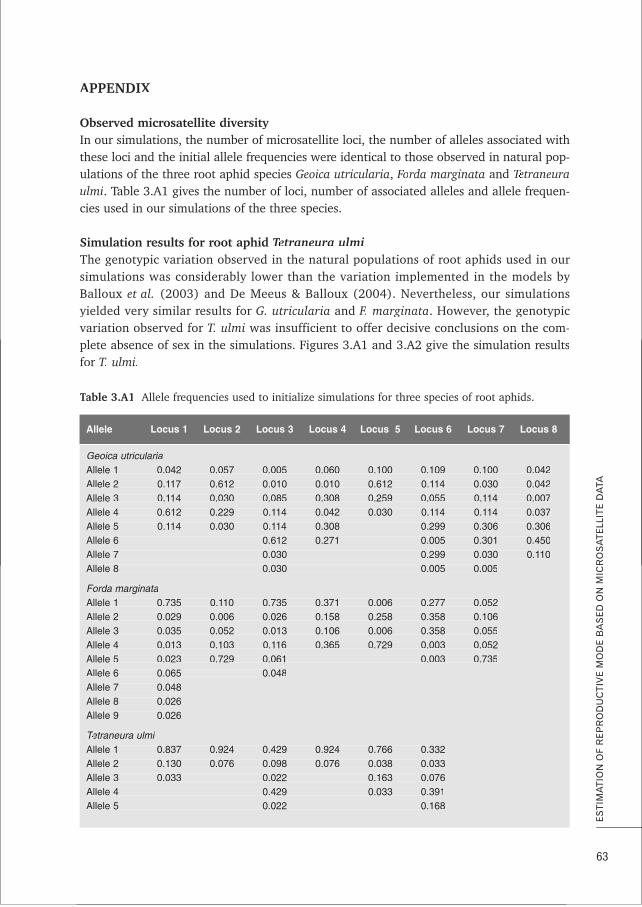
AAPPENDIX
Observed microsatellite diversity In our simulations, the number of microsatellite loci, the number of alleles associated withthese loci and the initial allele frequencies were identical to those observed in natural pop-ulations of the three root aphid species Geoica utricularia, Forda marginatarr and TetraneuraTTulmi. Table 3.A1 gives the number of loci, number of associated alleles and allele frequen-cies used in our simulations of the three species.
Simulation results for root aphid Tetraneura ulmiTTThe genotypic variation observed in the natural populations of root aphids used in our
ysimulations was considerably lower than the variation implemented in the models byBalloux et al. (2003) and De Meeus & Balloux (2004). Nevertheless, our simulationsyyielded very similar results for G. utricularia and F. marginata. However, the genotypicvvariation observed for T. ulmi was insufficient to offer decisive conclusions on the com-plete absence of sex in the simulations. Figures 3.A1 and 3.A2 give the simulation resultsfor T. ulmi.
63
ES
TIM
ATI
ON
OF
RE
PR
OD
UC
TIV
E M
OD
E B
AS
ED
ON
MIC
RO
SA
TELL
ITE
DA
TA
Table 3.A1TT Allele frequencies used to initialize simulations for three species of root aphids.
Allele Locus 1 Locus 2 Locus 3 Locus 4 Locus 5 Locus 6 Locus 7 Locus 8
Geoica utriculariaAllele 1 0.042 0.057 0.005 0.060 0.100 0.109 0.100 0.042Allele 2 0.117 0.612 0.010 0.010 0.612 0.114 0.030 0.042Allele 3 0.114 0.030 0.085 0.308 0.259 0.055 0.114 0.007Allele 4 0.612 0.229 0.114 0.042 0.030 0.114 0.114 0.037Allele 5 0.114 0.030 0.114 0.308 0.299 0.306 0.306Allele 6 0.612 0.271 0.005 0.301 0.450Allele 7 0.030 0.299 0.030 0.110Allele 8 0.030 0.005 0.005
Forda marginataAllele 1 0.735 0.110 0.735 0.371 0.006 0.277 0.052Allele 2 0.029 0.006 0.026 0.158 0.258 0.358 0.106Allele 3 0.035 0.052 0.013 0.106 0.006 0.358 0.055Allele 4 0.013 0.103 0.116 0.365 0.729 0.003 0.052Allele 5 0.023 0.729 0.061 0.003 0.735Allele 6 0.065 0.048Allele 7 0.048Allele 8 0.026Allele 9 0.026
Tetraneura ulmiTTAllele 1 0.837 0.924 0.429 0.924 0.766 0.332Allele 2 0.130 0.076 0.098 0.076 0.038 0.033Allele 3 0.033 0.022 0.163 0.076Allele 4 0.429 0.033 0.391Allele 5 0.022 0.168
Allele Locus 1 Locus 2 Locus 3 Locus 4 Locus 5 Locus 6 Locus 7 Locus 8
A.Ivens-diss 16-10-2012 11:14 Pagina 63
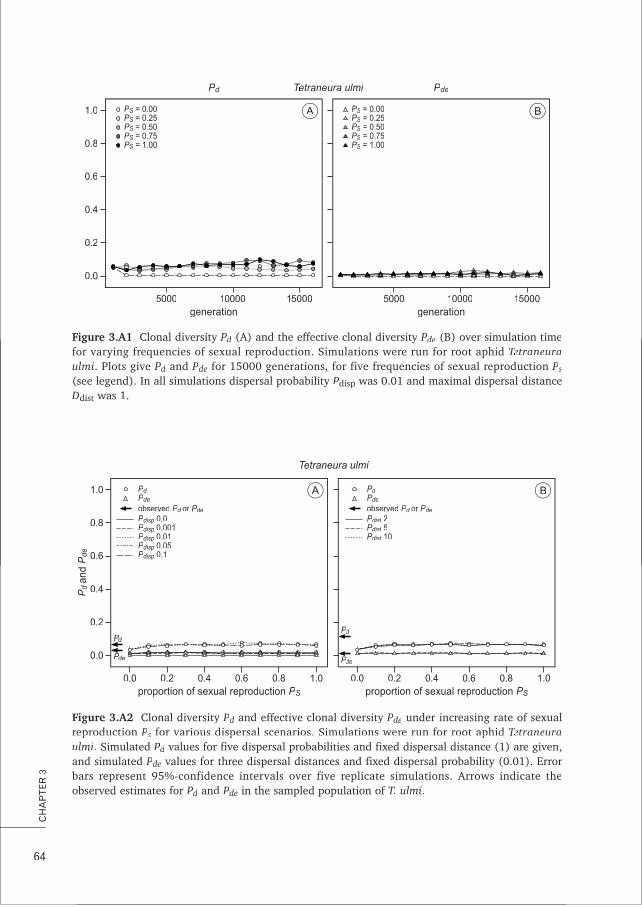
64
CH
AP
TER
3
0.0
0.2
0.4
0.6
0.8
1.0
15000100005000generation
A BPS = 0.00S
Pd
15000100005000generation
Pde
PS = 0.25SPS = 0.50SPS = 0.75SPS = 1.00S
PS = 0.00SPS = 0.25SPS = 0.50SPS = 0.75SPS = 1.00S
Tetraneura ulmiTT
Figure 3.A1 Clonal diversity Pd ff(A) and the effective clonal diversity Pde (B) over simulation timefor varying frequencies of sexual reproduction. Simulations were run for root aphid for varying frequencies of sexual reproduction. Simulations were run for root aphid TTetraneuraetraneuraTTTTulmi. Plots give Pd and Pde for 15000 generations, for five frequencies of sexual reproduction PsP(see legend). In all simulations dispersal probability Pdisp was 0.01 and maximal dispersal distanceDDDdist was 1.
0.0
0.2
0.4
0.6
0.8
1.0
Pd
and
Pde
0.0proportion of sexual reproduction PS
A B
Tetraneura ulmi
0.2 0.4 0.6 0.8 1.0
PdPP
PdePP
0.0proportion of sexual reproduction PS
0.2 0.4 0.6 0.8 1.0
PdPP
PdePP
Pdisp 0.0Pdisp 0.001Pdisp 0.01Pdisp 0.05Pdisp 0.1
PdPde
Pdist 2tPdist 5tPdist 10t
PdPde
observed Pd or Pde observed Pd or Pde
Figure 3.A2 Clonal diversity Pd ffand effective clonal diversity Pde funder increasing rate of sexualrreproduction eproduction PPss for various dispersal scenarios. Simulations were run for root aphidfor various dispersal scenarios. Simulations were run for root aphid TTetraneuraetraneuraTTTTulmi. Simulated Pd values for five dispersal probabilities and fixed dispersal distance (1) are given,and simulated Pde values for three dispersal distances and fixed dispersal probability (0.01). Errorbbars represent 95%-confidence intervals over five replicate simulations. Arrows indicate theobserved estimates for Pd and Pde in the sampled population of T. ulmi.
A.Ivens-diss 16-10-2012 11:14 Pagina 64

65
ES
TIM
ATI
ON
OF
RE
PR
OD
UC
TIV
E M
OD
E B
AS
ED
ON
MIC
RO
SA
TELL
ITE
DA
TA
A.Ivens-diss 16-10-2012 11:14 Pagina 65

A.Ivens-diss 16-10-2012 11:14 Pagina 66
Ants farm subterranean aphids mostlyAnts farm subterranean aphids mostlyin single clone groups – an example ofprudent husbandry for carbohydrates andproteins?
A k B F IAniek B.F. IvensDaniel J.C. KronauerFranz J. WeissingJacobus J. Boomsma
PP bl h dublished in BMC E l i Bi lBMC Evolutionary Biology: 2012, 12: 106
CH
AP
TER44
A.Ivens-diss 16-10-2012 11:14 Pagina 67
68
CH
AP
TER
4
Mutualistic interactions are wide-spread but the mechanismsunderlying their evolutionary stability and ecological dynamicsremain poorly understood. Cultivation mutualisms in which hostsconsume symbionts occur in phylogenetically diverse groups, butoften have symbiont monocultures for each host. This is consistentwith the prediction that symbionts should avoid coexistence withother strains so that host services continue to benefit relatives, butit is less clear whether hosts should always favor monocultures andwhat mechanisms they might have to manipulate symbiont diver-sity. Few mutualisms have been studied in sufficient genetic detailto address these issues, so we decided to characterize symbiontdiversity in the complex mutualism between multiple root aphidspecies and Lasius flavus ants. After showing elsewhere that threeof these aphid species have low dispersal and mostly if not exclu-sively asexual reproduction, we here investigate aphid diversitywithin and between ant nest mounds.
The three focal species (Geoica utricularia, Forda marginatarr andTetraneura ulmiTT ) had considerable clonal diversity at the popula-tion level. Yet more than half of the ant mounds contained just asingle aphid species, a significantly higher percentage thanexpected from a random distribution. Over 60% of these single-species mounds had a single aphid clone, and clones tended topersist across subsequent years. Whenever multiple species/clonesco-occurred in the same mound, they were spatially separated withmore than 95% of the aphid chambers containing individuals of asingle clone.
L. flavus ‘husbandry’ is characterized by low aphid ‘livestock’diversity per colony, especially at the nest-chamber level, but itlacks the exclusive monocultures known from other cultivationmutualisms. The ants appear to eat most of the early instar aphids,so that adult aphids are unlikely to face limited phloem resourcesand scramble competition with other aphids. We suggest that suchculling of carbohydrate-providing symbionts for protein ingestionmay maintain maximal host yield per aphid while also benefittingthe domesticated aphids as long as their clone-mates reproducesuccessfully. The cost-benefit logic of this type of polyculture hus-bandry has striking analogies with human farming practices basedon slaughtering young animals for meat to maximize milk-produc-tion by a carefully regulated adult livestock population.
AAABSTRACT
A.Ivens-diss 16-10-2012 11:14 Pagina 68
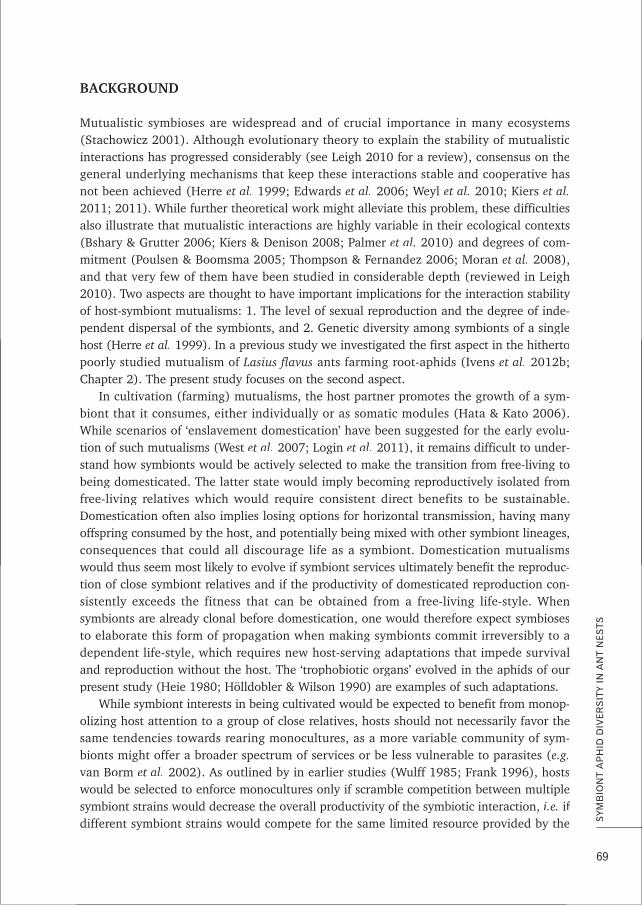
BACKGROUND
Mutualistic symbioses are widespread and of crucial importance in many ecosystems(Stachowicz 2001). Although evolutionary theory to explain the stability of mutualisticinteractions has progressed considerably (see Leigh 2010 for a review), consensus on thegeneral underlying mechanisms that keep these interactions stable and cooperative hasnot been achieved (Herre et al. 1999; Edwards et al. 2006; Weyl et al. 2010; Kiers et al.2011; 2011). While further theoretical work might alleviate this problem, these difficultiesalso illustrate that mutualistic interactions are highly variable in their ecological contexts(Bshary & Grutter 2006; Kiers & Denison 2008; Palmer et al. 2010) and degrees of com-mitment (Poulsen & Boomsma 2005; Thompson & Fernandez 2006; Moran et al. 2008),and that very few of them have been studied in considerable depth (reviewed in Leigh
y2010). Two aspects are thought to have important implications for the interaction stabilityof host-symbiont mutualisms: 1. The level of sexual reproduction and the degree of inde-pendent dispersal of the symbionts, and 2. Genetic diversity among symbionts of a singlehost (Herre et al. 1999). In a previous study we investigated the first aspect in the hithertopoorly studied mutualism of Lasius flavus ants farming root-aphids (Ivens et al. 2012b;Chapter 2). The present study focuses on the second aspect.
In cultivation (farming) mutualisms, the host partner promotes the growth of a sym-biont that it consumes, either individually or as somatic modules (Hata & Kato 2006).While scenarios of ‘enslavement domestication’ have been suggested for the early evolu-tion of such mutualisms (West et al. 2007; Login et al. 2011), it remains difficult to under-stand how symbionts would be actively selected to make the transition from free-living tobeing domesticated. The latter state would imply becoming reproductively isolated fromfree-living relatives which would require consistent direct benefits to be sustainable.
yDomestication often also implies losing options for horizontal transmission, having manyoffspring consumed by the host, and potentially being mixed with other symbiont lineages,consequences that could all discourage life as a symbiont. Domestication mutualismswwould thus seem most likely to evolve if symbiont services ultimately benefit the reproduc-tion of close symbiont relatives and if the productivity of domesticated reproduction con-sistently exceeds the fitness that can be obtained from a free-living life-style. Whensymbionts are already clonal before domestication, one would therefore expect symbiosesto elaborate this form of propagation when making symbionts commit irreversibly to adependent life-style, which requires new host-serving adaptations that impede survivaland reproduction without the host. The ‘trophobiotic organs’ evolved in the aphids of ourpresent study (Heie 1980; Hölldobler & Wilson 1990) are examples of such adaptations.
While symbiont interests in being cultivated would be expected to benefit from monop-olizing host attention to a group of close relatives, hosts should not necessarily favor thesame tendencies towards rearing monocultures, as a more variable community of sym-bionts might offer a broader spectrum of services or be less vulnerable to parasites (e.g.vvan Borm et al. 2002). As outlined by in earlier studies (Wulff 1985; Frank 1996), hostswwould be selected to enforce monocultures only if scramble competition between multiplesymbiont strains would decrease the overall productivity of the symbiotic interaction, i.e. fifdifferent symbiont strains would compete for the same limited resource provided by the
69
SYM
BIO
NT
AP
HID
DIV
ER
SIT
Y IN
AN
T N
ES
TS
A.Ivens-diss 16-10-2012 11:14 Pagina 69
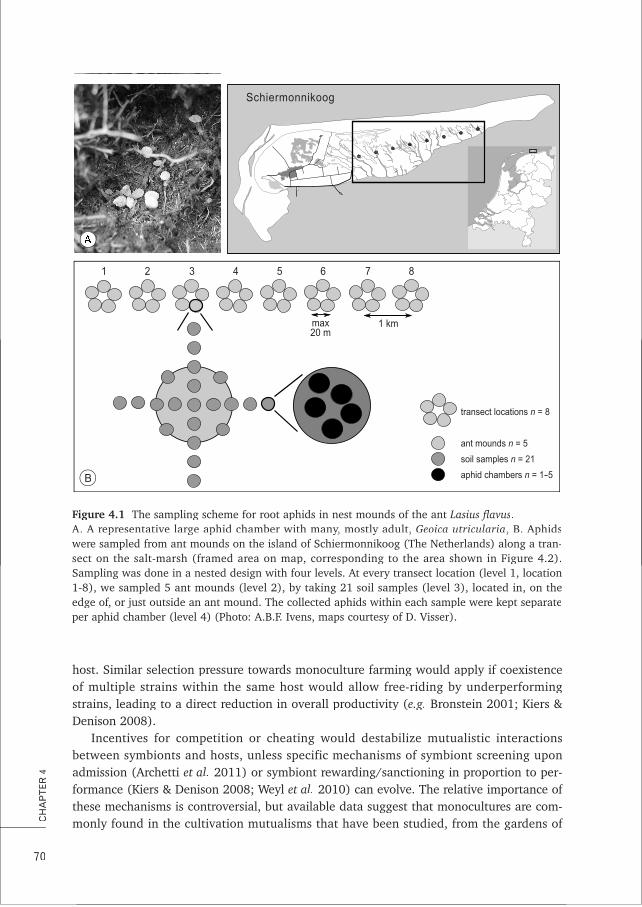
host. Similar selection pressure towards monoculture farming would apply if coexistenceof multiple strains within the same host would allow free-riding by underperformingstrains, leading to a direct reduction in overall productivity (e.g. Bronstein 2001; Kiers &Denison 2008).
Incentives for competition or cheating would destabilize mutualistic interactionsbetween symbionts and hosts, unless specific mechanisms of symbiont screening uponadmission (Archetti et al. 2011) or symbiont rewarding/sanctioning in proportion to per-formance (Kiers & Denison 2008; Weyl et al. f2010) can evolve. The relative importance ofthese mechanisms is controversial, but available data suggest that monocultures are com-
fmonly found in the cultivation mutualisms that have been studied, from the gardens of
70
CH
AP
TER
4
1 km
87654321
max20 m
transect locations n = 8
ant mounds n = 5
soil samples n = 21
aphid chambers n = 1-5
Schiermonnikoog
B
Figure 4.1 f fThe sampling scheme for root aphids in nest mounds of the ant Lasius flavus.AAA.AA. A representative large aphid chamber with many, mostly adult, A representative large aphid chamber with many, mostly adult, Geoica utriculariaGeoica utricularia, B. Aphids, B. Aphidswwwere sampled from ant mounds on the island of Schiermonnikoog (The Netherlands) along a tran-sect on the salt-marsh (framed area on map, corresponding to the area shown in Figure 4.2).Sampling was done in a nested design with four levels. At every transect location (level 1, location1-8), we sampled 5 ant mounds (level 2), by taking 21 soil samples (level 3), located in, on theedge of, or just outside an ant mound. The collected aphids within each sample were kept separatepper aphid chamber (level 4) (Photo: A.B.F. Ivens, maps courtesy of D. Visser).
A.Ivens-diss 16-10-2012 11:14 Pagina 70
algae-growing damselfish (Hata & Kato 2002) to those of fungus-growing termites andants (Bot et al. 2001; Poulsen & Boomsma 2005; Aanen et al. 2009; Mueller et al. 2010).In fungus-farming leaf-cutting ants, monocultures appear to be enforced by a combinationof incompatibility between genetically different symbiont strains and active symbiont polic-ing by the hosts (Poulsen & Boomsma 2005; Ivens et al. 2009; Mueller et al. 2010),wwhereas a simple mechanism of positive frequency-dependent propagation within estab-lished colonies appears sufficient to enforce life-time commitment between a termite hostcolony and a single symbiont clone (Aanen et al. 2009). However, more studies are neededto establish the generality of this principle, particularly for cultivation mutualisms wherehosts are able to segregate symbionts in space or time to avoid competition (Palmer et al.2010), so that the benefits of polyculture might surpass the costs.
In the present study we focus on a farming symbiosis that has been known for decadesbut has rarely been studied: the root aphid husbandry for sugar (honeydew, ‘milk’) andnitrogen (‘meat’) of the Yellow meadow ant Lasius flavus, which is likely to be essential forant colony growth and reproduction, and involves an entire array of root aphid species(Pontin 1958; Muir 1959; Pontin 1961b; 1978; Heie 1980; Godske 1991; Seifert 2007).These root aphid species have a number of distinct traits that improve performance as antsymbionts but are never found in free-living aphids, such as the ‘trophobiotic organ’ tohold honeydew for the ants (Hölldobler & Wilson 1990). The most common species havefurther lost most if not all sexual reproduction in Northwest Europe, but have maintainedlow frequencies of winged morphs that may disperse between colonies (Ivens et al. 2012b;Chapter 2). In the present study we use a newly developed set of DNA microsatellitemarkers (Ivens et al. y2011; Chapter 5) to assess aphid species number and clonal diversityat the level of single ant nest mounds.
AThe objectives of our study were to use hierarchical sampling (Figure 4.1) and DNAfmicrosatellite analysis to: 1. Estimate species- and clone diversity for three focal species of
root aphids (Geoica utricularia, Tetraneura ulmiTT , Forda marginatarr ) within L. flavus nests,soil samples within nests, and single aphid chambers (Figure 4.1A) within these soilsamples, 2. Evaluate whether the observed distributions are consistent with the expecta-
ytion that symbiont diversity within nests is low, 3. Analyze the extent to which diversitypatterns change across sampling levels and years, and 4. Infer which potential mechanismscan lead to the observed diversity patterns.
RESULTS
AAphid diversity and abundanceAAs shown in Figure 4.2, considerable aphid diversity existed along the sampled 7 km
ytransect, but the distribution of this diversity across ant mounds deviated significantlyfrom random. At all sampling levels (ant mound, soil sample and chamber) monoculturescontaining only a single species occurred much more often than expected from a randomdistribution (Figure 4.2, Table 4.1), with 52% of the sampled mounds and 99% of theaphid chambers containing only a single species. Also genetic diversity within species wasalways non-randomly distributed over the mounds, as there were more mounds that
71
SYM
BIO
NT
AP
HID
DIV
ER
SIT
Y IN
AN
T N
ES
TS
A.Ivens-diss 16-10-2012 11:14 Pagina 71
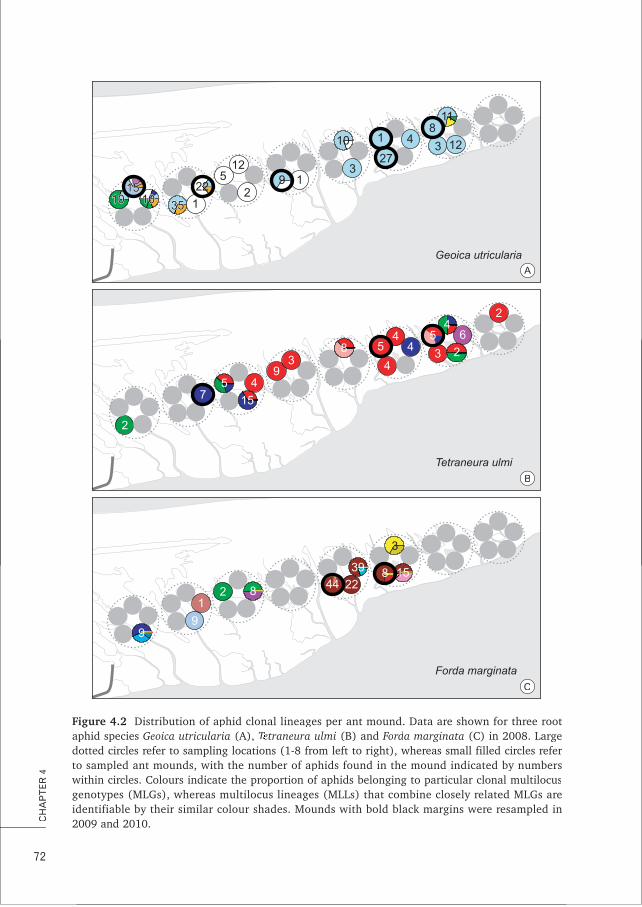
72
CH
AP
TER
4
15151010 3535 1
225
Geoica utricularia
Tetraneura ulmi
Forda marginata
21
3
10
12
1 43
2
7 15
5 4
8 54
4
43
54
6
2
2
93
3
15839
224482
1
99
12
811
27
9
1010
A
B
C
1510 3510
Figure 4.2 f fDistribution of aphid clonal lineages per ant mound. Data are shown for three rootaphid species Geoica utricularia (A), Tetraneura ulmiTT (B) and Forda marginata (C) in 2008. Largedotted circles refer to sampling locations (1-8 from left to right), whereas small filled circles referto sampled ant mounds, with the number of aphids found in the mound indicated by numberswwithin circles. Colours indicate the proportion of aphids belonging to particular clonal multilocusgenotypes (MLGs), whereas multilocus lineages (MLLs) that combine closely related MLGs areidentifiable by their similar colour shades. Mounds with bold black margins were resampled in2009 and 2010.
A.Ivens-diss 16-10-2012 11:14 Pagina 72
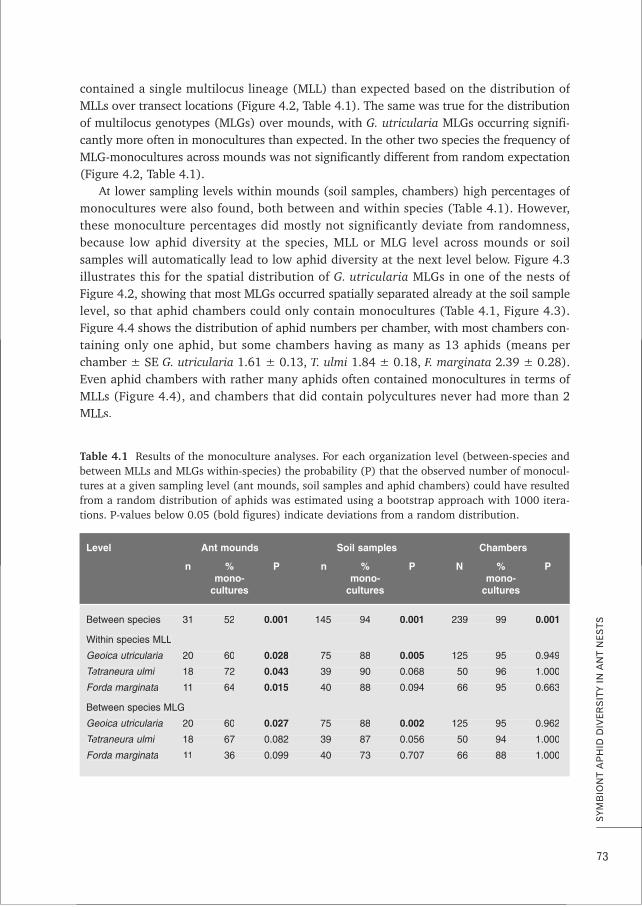
fcontained a single multilocus lineage (MLL) than expected based on the distribution ofMLLs over transect locations (Figure 4.2, Table 4.1). The same was true for the distributionof multilocus genotypes (MLGs) over mounds, with G. utricularia MLGs occurring signifi-
fcantly more often in monocultures than expected. In the other two species the frequency ofMLG-monocultures across mounds was not significantly different from random expectation(Figure 4.2, Table 4.1).
At flower sampling levels within mounds (soil samples, chambers) high percentages ofmonocultures were also found, both between and within species (Table 4.1). However,these monoculture percentages did mostly not significantly deviate from randomness,because low aphid diversity at the species, MLL or MLG level across mounds or soilsamples will automatically lead to low aphid diversity at the next level below. Figure 4.3illustrates this for the spatial distribution of G. utricularia fMLGs in one of the nests ofFigure 4.2, showing that most MLGs occurred spatially separated already at the soil samplelevel, so that aphid chambers could only contain monocultures (Table 4.1, Figure 4.3).Figure 4.4 shows the distribution of aphid numbers per chamber, with most chambers con-taining only one aphid, but some chambers having as many as 13 aphids (means perchamber ± SE G. utricularia 1.61 ± 0.13, T. ulmi 1.84 ± 0.18, F. marginata 2.39 ± 0.28).
fEven aphid chambers with rather many aphids often contained monocultures in terms ofMLLs (Figure 4.4), and chambers that did contain polycultures never had more than 2MLLs.
73
SYM
BIO
NT
AP
HID
DIV
ER
SIT
Y IN
AN
T N
ES
TS
TTable 4.1TT R fesults of the monoculture analyses. For each organization level (between-species andRRbbetween MLLs and MLGs within-species) the probability (P) that the observed number of monocul-tures at a given sampling level (ant mounds, soil samples and aphid chambers) could have resultedfrom a random distribution of aphids was estimated using a bootstrap approach with 1000 itera-tions. P-values below 0.05 (bold figures) indicate deviations from a random distribution.
LevelAnt mounds Soil samples Chambers
n % P n % P N % Pmono- mono- mono-
cultures cultures cultures
Between species 31 52 0.001 145 94 0.001 239 99 0.001
Within species MLL
Geoica utricularia 20 60 0.028 75 88 0.005 125 95 0.949
Tetraneura ulmiTT 18 72 0.043 39 90 0.068 50 96 1.000
Forda marginata 11 64 0.015 40 88 0.094 66 95 0.663
Between species MLG
Geoica utricularia 20 60 0.027 75 88 0.002 125 95 0.962
Tetraneura ulmiTT 18 67 0.082 39 87 0.056 50 94 1.000
Forda marginata 11 36 0.099 40 73 0.707 66 88 1.000
Level Ant mounds Soil samples Chambers
n % P n % P N % Pmono- mono- mono-
cultures cultures cultures
A.Ivens-diss 16-10-2012 11:14 Pagina 73
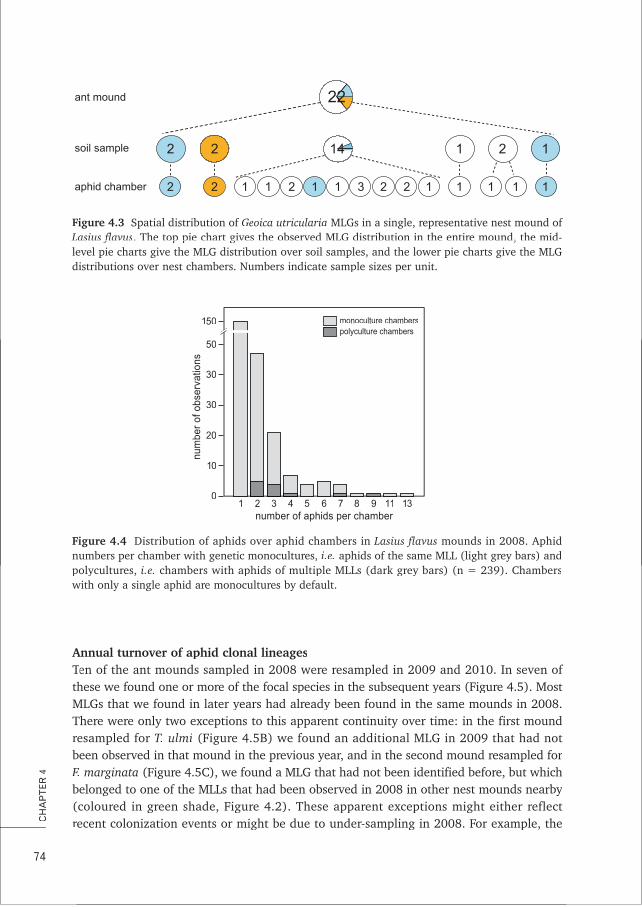
AAnnual turnover of aphid clonal lineagesT fen of the ant mounds sampled in 2008 were resampled in 2009 and 2010. In seven ofTTthese we found one or more of the focal species in the subsequent years (Figure 4.5). MostMLGs that we found in later years had already been found in the same mounds in 2008.There were only two exceptions to this apparent continuity over time: in the first moundresampled for T. ulmi (Figure 4.5B) we found an additional MLG in 2009 that had notbeen observed in that mound in the previous year, and in the second mound resampled forFF. marginata (Figure 4.5C), we found a MLG that had not been identified before, but which
ybelonged to one of the MLLs that had been observed in 2008 in other nest mounds nearby(coloured in green shade, Figure 4.2). These apparent exceptions might either reflectrecent colonization events or might be due to under-sampling in 2008. For example, the
74
CH
AP
TER
4
2 2 1 1 2 1 1 3 2 2 1 1 1 1 1
121422
22
1
ant mound
soil sample
aphid chamber
Figure 4.3 fSpatial distribution of Geoica utricularia fffMLGs in a single, representative nest mound ofLLLasius flavusLLasius flavus. The top pie chart gives the observed MLG distribution in the entire mound, the mid. The top pie chart gives the observed MLG distribution in the entire mound, the mid-level pie charts give the MLG distribution over soil samples, and the lower pie charts give the MLGdistributions over nest chambers. Numbers indicate sample sizes per unit.
0
10
20
30
50
num
ber
of o
bser
vatio
ns
1 2 3 4 5 6 7
monoculture chambers
number of aphids per chamber
30
150
8 9 11 13
polyculture chambers
Figure 4.4 fDistribution of aphids over aphid chambers in Lasius flavus mounds in 2008. Aphidnumbers per chamber with genetic monocultures,numbers per chamber with genetic monocultures, i.e.i.e. aphids of the same MLL (light grey bars) andaphids of the same MLL (light grey bars) andppolycultures, i.e. chambers with aphids of multiple MLLs (dark grey bars) (n = 239). Chamberswwwith only a single aphid are monocultures by default.
A.Ivens-diss 16-10-2012 11:14 Pagina 74
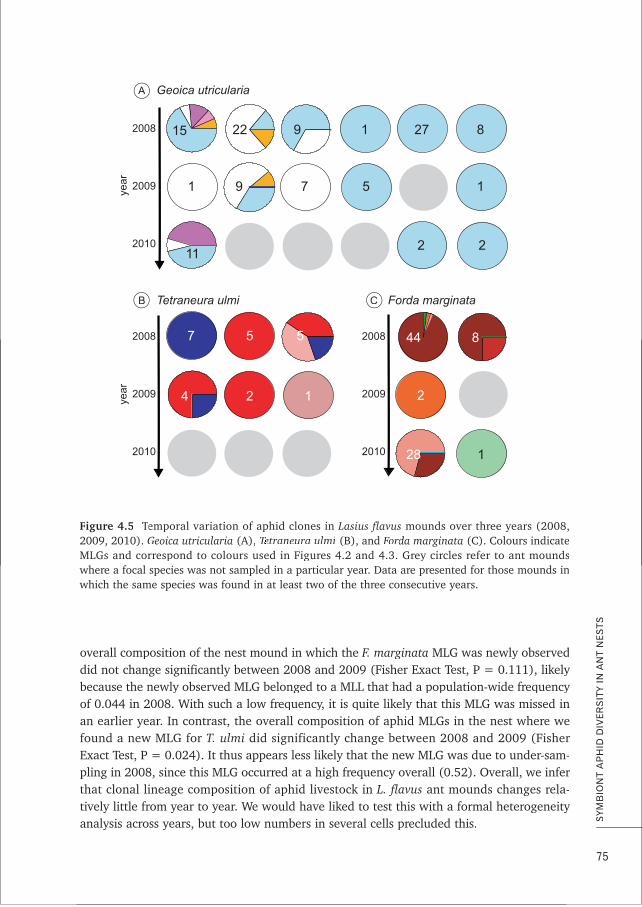
overall composition of the nest mound in which the F. marginata MLG was newly observedydid not change significantly between 2008 and 2009 (Fisher Exact Test, P = 0.111), likelyybecause the newly observed MLG belonged to a MLL that had a population-wide frequency
of 0.044 in 2008. With such a low frequency, it is quite likely that this MLG was missed inan earlier year. In contrast, the overall composition of aphid MLGs in the nest where wefound a new MLG for T. ulmi rdid significantly change between 2008 and 2009 (FisherExact Test, P = 0.024). It thus appears less likely that the new MLG was due to under-sam-
rpling in 2008, since this MLG occurred at a high frequency overall (0.52). Overall, we inferthat clonal lineage composition of aphid livestock in L. flavus ant mounds changes rela-
ytively little from year to year. We would have liked to test this with a formal heterogeneityanalysis across years, but too low numbers in several cells precluded this.
75
SYM
BIO
NT
AP
HID
DIV
ER
SIT
Y IN
AN
T N
ES
TS
Geoica utricularia
Tetraneura ulmi Forda marginata
15 22 9 1 27 8
9 7 51
5 57
2 14
1
44 8
2
28 1
112 2
2008
2009
year
year
2010
2008
2009
2010
2008
2009
2010
2
A
B C
Figure 4.5 T femporal variation of aphid clones in TT Lasius flavus mounds over three years (2008,2009, 2010). Geoica utricularia (A), Tetraneura ulmiTT (B), and Forda marginatarr (C). Colours indicateMLGs and correspond to colours used in Figures 4.2 and 4.3. Grey circles refer to ant moundswwwhere a focal species was not sampled in a particular year. Data are presented for those mounds inwwwhich the same species was found in at least two of the three consecutive years.
A.Ivens-diss 16-10-2012 11:14 Pagina 75
DISCUSSION
AAphid distribution and abundanceIn half of the ant mounds sampled in 2008 only one of the three focal root aphid species,G. utricularia, T. ulmi or F. marginata was found, despite the other aphid species beingpresent within a radius of 50 m. This level of aphid specificity among ant nests matchesearlier findings by Muir (1959) in a British field survey of the same ant species and its
yunderground aphids. If there were multiple aphid species per mound, we found that theytended to be clustered in separate soil samples and hardly ever occurred in the same aphidchamber. This not only applied for the three most abundant species that we focused on,
fbut also for other rarer species of root aphids. We are confident, therefore, that inclusion ofthese other aphids would not have changed our overall conclusions. Unfortunately, aphidsample sizes remained low for most mounds and for two of the three focal species, whichseems unavoidable as earlier non-destructive large-scale surveys obtained similar numbersof adult root aphids for these species (Table 4.A1). Comparing frequencies and absolutedensities across studies is not easy as authors have used different sampling methods in thepast (Pontin 1978; Godske 1992). While these have given very different estimates of rootaphid density, we show in the appendix that this is almost certainly due to these samplingdifferences, and that our estimates of adult aphid densities are in line with previousstudies. In spite of these sample size limitations, we are confident, therefore, that ourresults would be repeatable with larger sample sizes at: (1) the mound level, becauseaphids were generally found scattered throughout the entire mound, so that systematicbias in our non-destructive sampling appears unlikely, and (2) at the chamber level,because Figure 4.4 shows that within-chamber aphid diversity does not increase withincreasing numbers of aphids per chamber (ca. equivalent to chamber size). Moreover, inour statistical analysis we control for any effect of the low sample sizes, by simulating theexact same sample sizes as achieved in the field.
The considerable interaction-specificity, often between single ant colonies and singleyaphid lineages was also encountered at the genetic level within species. Mounds often only
harbored one clonal lineage of a single aphid species and if mounds had multiple aphidclones they were almost always compartmentalized in different chambers. A similar degreeof host specificity has also been shown for above-ground aphids tended by ants as opposedto non-tended aphids (Yao 2010). However, complete spatial separation of aphid clones isless frequently observed above ground (Yao 2010; Vantaux et al. 2011a), probably becausethese aphids can more easily move around. Our limited sampling across years further indi-cated a high degree of constancy of distributions of aphid clones over time. It would havebeen interesting to compare our results with similar studies on other myrmecophilous andnon-myrmecophilous root aphids, but to our knowledge such studies have not yet beendone.
Within- and between ant mound aphid distribution patternsWWThe between- and within-mound distribution patterns were very similar for the three aphidspecies under study (Figure 4.2), suggesting that similar dispersal and recruitment mecha-nisms apply. Most aphid chambers contained only a single aphid (Figure 4.4) and chamber
76
CH
AP
TER
4
A.Ivens-diss 16-10-2012 11:14 Pagina 76
sizes seemed proportional to the number of aphids housed in them (appendix). It thusappears unlikely that these aphids competed for limiting phloem resources, even in the fewcases where different aphid species or MLLs shared a chamber. Rather, the husbandingants seem to optimize the feeding conditions for each aphid adult, because aphid densities
y(on average 1.00 per liter soil, appendix) remained well below densities that would occupyall available root phloem resources. These relatively low numbers of adult aphids can beexplained by the ants eating the vast majority of aphid nymphs and only keeping a smallnumber of adults for honeydew production as inferred previously by Pontin (1978).
The low aphid diversity per mound, the apparent invariance of clonal distributions permound among years, and the high degree of population viscosity (Ivens et al. 2012b;Chapter 2) are consistent with horizontal transmission of aphids between mounds beinginfrequent. After successful dispersal and adoption, aphid propagation within mounds wouldthen mostly be in the form of clonal copies of fundatrices (aphid ‘foundresses’) replacingtheir ancestors. We would thus expect that the genetic diversity of aphid livestock within agiven ant mound would slowly increase over the years. The densest L. flavus populations inNorthwest Europe are normally found in extensively grazed old pastures that have beenstable for centuries and where nest-mounds are large because many generations of L. flavuscolonies have contributed to building them. Compared to such populations, the coastaltransect that we studied is more variable in age and stability, which appeared to be reflectedin the younger parts of the salt-marsh harboring less aphid diversity, at least for G. utricu-laria (appendix). Patterns like this would be reminiscent of older trees having richer com-munities of underground mycorrhiza and leaf-endophytes (Arnold & Herre 2003; Palfner tetal. 2005), but also of above-ground aphid colonies becoming more genetically diverse overthe season due to the immigration of new aphid clones (Vantaux et al. 2011a).
Inferring the evolutionary logic of aphid husbandry in Lasius flavus coloniesGenetic diversity of symbionts has been a central issue in mutualism theory (Wulff 1985;Frank 1996; Herre et al. 1999) as diversity levels that simultaneously maximize the fitnessof both hosts and symbionts are often expected to be low (Wulff 1985; Frank 1996). Thisis indeed what we found throughout our data set (i.e. at the species, MLL and MLG level).Compartmentalization of symbionts is known to promote mutualism stability in othersystems [e.g. mycorrhizal mutualisms (Bever et al. 2009)], because benefits can be prefer-entially allocated toward cooperative symbionts. However, many of these conceptual argu-ments are based on the assumption that symbiont lineages compete and that the collateraldamage of such interactions for host fitness maintains selection to suppress symbiontdiversity (Frank 1996). While the high root aphid densities per L. flavus mound reported inthe literature (appendix) that inspired this study suggested that such competition mightalso apply in this system, our results prompt us to reappraise this assumption, because: (1)AAphid husbandry is special, relative to other resource enhancing mutualisms, in that theant hosts can exploit their aphid symbionts both for sugars (‘milking’ adults in their primeage) and for proteins (eating young instars and old adults) and (2) Our data suggest thatconsumption of most of the aphid offspring by the ants reduces total aphid numbers permound (appendix) to such extent that the grass-root phloem resource constraints thatmight have induced aphid competition are unlikely to apply.
77
SYM
BIO
NT
AP
HID
DIV
ER
SIT
Y IN
AN
T N
ES
TS
A.Ivens-diss 16-10-2012 11:14 Pagina 77
Many details of the interaction between L. flavus ants and their communities of mutu-alistic root aphids remain unknown and deserve further study. However, our present resultsindicate that the biological details and specific resource constraints of an obligate mutual-ism may be decisive for the selection factors that determine evolutionary stability overtime. Our present data indicate that prevailing paradigms of partner choice and sanctions(Noë & Hammerstein 1994; Kiers & Denison 2008; Weyl et al. 2010; Archetti et al. 2011)may not apply in the ant-aphid mutualism that we studied, because fundamental assump-tions of scramble competition between unrelated symbionts (Frank 1996) are not fulfilled(appendix).
After initial domestication, the aphid clones would have continued to benefit from theysymbiosis, because the premature death of most early instar nymphs (which individually
are of low value as sugar providers for the ants) reduces competition over resources andreproduction, and extensive clonality ensures that vertical transmission will maintainclonal tenure within nests. This interpretation might explain why L. flavus yis reputedlyobligately dependent on root aphids (Pontin 1978; Seifert 2007), but without having spe-cialized on any of the large number of aphid species that are available, despite the aphidshaving evolved specialized traits that enhance productivity as ant symbionts but precludeindependent life (see Ivens et al. 2012b; Chapter 2 for details). Testing the validity of ourinterpretation that early instar aphids are worth more as direct sources of protein than aslater sources of carbohydrates will require controlled lab experiments, which might be fea-sible in spite of the challenges of keeping these ants and aphids in artificial nests (Smart1991).
AAnalogies with human subsistence farmingThe results of our study suggest that polyculture aphid husbandry in L. flavus followssimilar efficiency principles as modern cattle husbandry practices in humans, where adultcows are kept in numbers that secure maximal milk-productivity in a competition-free envi-ronment and where surplus reproduction is slaughtered for meat-consumption soon afterbirth. How this analogy could come about is interesting to evaluate.
The English name for L. flavus, Yellow meadow ant, indicates lack of pigmentationbecause the ants are almost never exposed to direct sunlight. This exclusively undergroundlife style, shared by many but far from all Lasius ants (Seifert 2007), must have impliedthat foraging territories became limited to the direct nest environment, so that access toprey was reduced but protection and monopolization of domesticated aphids becameeasier. Intensification of aphid husbandry thus seems a logical consequence of becoming
ysubterranean and a prudent way of harvesting a small local resource-base that ultimatelydepends on primary production (grass roots) rather than secondary production (free-livingprey capture). Extensive culling of immature aphids for meat not only allowed polyculturepractices (by eliminating competition), but may have actively encouraged it when different
yaphid species would exploit somewhat different plant root niches, when their availabilitywwould be unpredictably, or when they would produce honeydew with slightly differentchemical composition (Fischer & Shingleton 2001).
The analogies between aphid husbandry in L. flavus and human cultural practices arequite striking as farming husbandry allowed human populations to sustain themselves at
78
CH
AP
TER
4
A.Ivens-diss 16-10-2012 11:14 Pagina 78
much higher densities than hunter-gatherer populations (Larsen 1995). Likewise, thedensity of L. flavus ants in mature grasslands is among the highest known for ants (Odum& Pontin 1961; Boomsma & Van loon 1982; Seifert 2007) and appears to be sustainablewwith only a modest ecological footprint. As in humans, the secret of success appears to bea unique combination of traits, such as the ability to actively engineer nest mound habitat[a form of niche construction (Laland & Boogert 2010)] rather than living in fixed plantstructures as other obligately aphid-dependent ants do (e.g. van Borm et al. 2002), and theavailability of multiple aphids that could be domesticated without the need to specializeon any one of them. This suggests that ant farming practices for meat (Offenberg 2001;Ben-Dov & Fischer 2010) deserve more explicit study, as they may provide remarkableinsights into sustainable farming practice.
CONCLUSIONS
Farming mutualisms are highly diverse. Some have a long history of coadaptation, speci-FFficity and vertical symbiont transmission, whereas others have evolved interdependencesbased on horizontal symbiont acquisition and low specificity. Many ant species obtain fac-
yultative benefits from tending aphids. Some of these interactions have evolved to be highlyspecific, but the Lasius flavus husbandry system that we studied is unusual in that bothants and root aphids appear to be obligately interdependent and adapted to their respec-tive life styles as farmers and livestock, but without obvious signs of species-by-speciesinteraction specificity.
Our genetic explorations of a large island population with dense populations of L.fflavus suggest that the combination of permanently underground nesting, aphid clonality,and very low gene flow between aphid populations of neighbouring mounds has allowedthese ants to evolve an unusual form of polyculture symbiosis. Species and clonal lineages
yof aphids appear to be kept apart, which likely gives colonies the possibility to activelymanage the diversity and abundance of their livestock. We hypothesize that this allows theants to secure maximal yield from a subset of mature aphids that are kept for carbohy-drates under optimal conditions of phloem feeding and ant care. These selected aphidsmay then also reproduce at the highest possible rate, so that the ants both secure maximalprotein intake by eating the excess of early instar aphids, and replacement of their honey-dew-producing livestock when adult aphids age and become less productive.
Many mechanistic details that govern the dynamics of this mutualism await furtherresearch. However, we feel that analogies with human husbandry practices based onsimilar cost-benefit considerations lend sufficient credibility to our interpretations to gen-erate novel interest into natural selection processes that have produced ant farming prac-tices for both meat and carbohydrates.
79
SYM
BIO
NT
AP
HID
DIV
ER
SIT
Y IN
AN
T N
ES
TS
A.Ivens-diss 16-10-2012 11:14 Pagina 79
METHODS
Natural history of the model systemThe subterranean Yellow meadow ant Lasius flavus constructs conspicuous nest mounds(↕ ca. 30cm, Ø ca. 80 cm) in grassland habitats to house both its own colonies and the rootaphids on which it depends for honeydew as a source of carbohydrates (Pontin 1958;1961b; 1978; Heie 1980) and which they eat for protein (Pontin 1958; 1961b; 1978). Theants actively protect the aphids (Pontin 1959; A.B.F. Ivens, personal observation) and keepthem in specially constructed ‘aphid-chambers’, cavities around grass-roots with one orseveral aphids (Figure 4.1A). Thirteen species of root aphids are known to be tended by L.fflavus, often with multiple species in the same nest mound ((Muir 1959; Pontin 1978;Heie 1980; Godske 1991; A.B.F. Ivens, personal observation). Among these, TetraneuraTTulmi, Geoica utricularia and Forda marginatarr are often the most dominant species (Muir1959; Pontin 1978; Heie 1980; Godske 1991; Ivens et al. 2012b; Chapter 2). This was alsothe case at our study site, so we focused our study on these three species. These aphids canalso be found in nests of other ants, such as Myrmica sp. and other Lasius species (Heie1980), albeit in lower numbers than in the typical L. flavus mounds.
Aphid reproductive cycles can be fully asexual (anholocyclic) or include a single sexualphase at the end of the season (holocyclic). In another study (Ivens et al. 2012b; Chapter
y2) we showed that the three focal aphid species are predominantly if not completelyasexual in our study population (see also below), consistent with all three species havingbeen shown to feed year-round on roots of the grasses Festuca rubraFF , Agrostis spp. andEElytrigia maritima without requiring a host shift during winter (Muir 1959; Pontin 1978;Heie 1980; Ivens et al. 2012b; Chapter 2). The possible winter host shift to Ulmus treesthat has previously been described for Tetraneura ulmiTT (Heie 1980; O.E. Heie, personalcommunication) thus appears to be absent in our NW European study population.However, several other mechanisms can account for more limited horizontal aphid disper-sal in salt march habitats such as our study site: walking, floating on tidal floods and winddispersal of winged individuals (alates) that are produced at very low frequencies in allthree species. Considerable genetic population viscosity confirms that horizontal dispersalbetween mounds is generally limited (Ivens et al. 2012b; Chapter 2). However, thisappears to be the only dispersal mode available as neither vertical nor horizontal transmis-sion by the tending workers has ever been observed for Lasius ants.
Sampling methodsAAnt mounds were sampled for aphids on the island of Schiermonnikoog, the Netherlands(53°28' N, 6°09' E) in July 2008, 2009 and 2010 along a 7 km transect across most of thesalt-marsh on the island (Figure 4.1B). The westernmost first kilometer close to the inhab-ited part of the island was grazed by cattle, whereas the remaining transect crossedungrazed salt-marsh. The transect was subdivided into eight locations (one every km). Atevery location we sampled five same-sized ant mounds (Ø ca. 60 cm), taking 21 cylindri-cal soil samples (10 cm deep and Ø 8 cm, volume 0.64 l), according to a fixed samplingscheme (Figure 4.1B). The average volume of the part of the mounds that was suitable foraphids (i.e. had roots of the appropriate grasses) was 66.7 l (appendix). We obtained this
80
CH
AP
TER
4
A.Ivens-diss 16-10-2012 11:14 Pagina 80
estimate by adding the volume of the aboveground part of an average mound and thevvolume of a ring directly surrounding the mound (10 cm wide, 8 cm deep) which is knownto often contain root aphids as well (Pontin 1978; Godske 1991).
Every soil sample was hand-sorted for ‘aphid chambers’, cavities containing one ormore root aphid individuals in spatial isolation from any other aphids (Figure 4.1A). Thissampling scheme resulted in a four-level nested design: transect location, ant nest mound,
fsoil sample and aphid chamber (Figure 4.1B). In July 2009 and 2010 we resampled 10 ofthe 40 previously sampled nest mounds, for which we had obtained sufficiently detailedaphid distributions in 2008 to be able to detect changes in later years.
Molecular methods and data analysisAA detailed description of the molecular analysis of the aphids and properties of the geneticmarkers is provided by Ivens et al. (2011; Chapter 5). In short, all collected aphids weregenotyped for an array of polymorphic microsatellite markers (Geoica utricularia, eightmarkers: Gu2, Gu3, Gu5, Gu6, Gu8, Gu9, Gu11, Gu13; Forda marginatarr , seven markers:Fm1, Fm3, Fm4, Fm6, Gu6, Gu11, Gu13; Tetraneura ulmiTT , six markers: Tu1, Tu2, Tu3, Tu4,Tu10, Tu11) after DNA extraction from entire aphids using 200 μl 20%-ChelexTT ® 100 resin(Fluka) (Walsh et al. 1991). Following PCR-amplification, products were analyzed on anAABI-PRISM 3130XL (Applied Biosystems) sequencer and chromatograms were analyzed inGenemapper (Applied Biosystems).
When amplification failed, samples were re-run at least two more times. When amplifi-cation remained unsatisfactory, the specific microsatellite locus was scored as ‘missingdata’. When data were missing for more than half of the loci the individual was omittedfrom further analysis. In total, we included 239 individuals of Geoica utricularia (2008:201, 2009: 23, 2010: 15, after omitting a total of 28 individuals), 191 of Forda marginatarr(2008: 158, 2009: 4, 2010: 29, 11 omitted) and 105 of Tetraneura ulmiTT (2008: 92, 2009:7, 2010: 6, 4 omitted).
Diploid clonal multilocus genotypes (MLGs) consist of a unique combination of allelesacross all genotyped loci. The genotypic data allowed us to assign every aphid to a MLGusing the software MLGSIM 2.0 (http://www.rug.nl/fmns-research/theobio/downloads),an updated version of MLGSIM (Stenberg et al. 2003b; Box B). A multilocus lineage (MLL)is a group of closely related MLGs that differ by only one or two alleles (Ivens et al. 2012b;Chapter 2). All MLGs could be grouped into MLLs. The complete analysis is detailed inIvens et al. (2012b; Chapter 2).
When a sample only contained aphids from a single species, MLL or MLG, we classifiedthat sample as a ‘monoculture’ at the species, MLL or MLG level. Samples were taken atthree ‘sampling levels’: ant mound, soil sample or chamber. To test whether the observedmonocultures occurred more frequently than expected under a random distribution, wewwrote a bootstrap routine in R 2.13.0 (R Development Core Team 2011) (routine availableupon request). For a given level of sampling, the routine distributed the species, MLLs, orMLGs randomly over samples in 1000 iterations with simulation sample sizes correspon-ding to the observed sample sizes. The routine thus used the observed frequency distribu-tions of species, MLLs, or MLGs at the sampling level above the focal level (Figure 4.1B) toestimate the probability (P) that the same or a higher number of monocultures than the
81
SYM
BIO
NT
AP
HID
DIV
ER
SIT
Y IN
AN
T N
ES
TS
A.Ivens-diss 16-10-2012 11:14 Pagina 81
observed number would be obtained by chance (one-tailed test). When P was <0.05, thenull hypothesis that the observed number of monocultures resulted from a random distri-bution of aphids over samples was rejected.
Competing interestsThe authors declare that they have no competing interests.
AAuthors’ contributionsAABFI and JJB designed research with input from IP and FJW. ABFI did the fieldwork and the genetic
analyses, the latter with contributions from DJCK, both for the practical work and the final analyses.
AABFI conducted the statistical analyses, with contributions from IP. ABFI and JJB wrote the paper,
wwith several rounds of contributions from DJCK, IP and FJW. All authors read and approved the final
manuscript.
AAuthors’ informationAAll authors have long standing interest in the evolutionary biology of cooperation and conflict within
fand between species. JJB, DJCK and ABFI mainly focus on different aspects of social evolution of
fants and their mutualistic partners. FJW and IP are theoretical biologists, focusing on the theory of
conflict and cooperation in social systems.
AAcknowledgementsWWe r thank Thijs Janzen and Sylvia Mathiasen for help in the field and in the laboratory, Søren Feodor
Nielsen for statistical advice, Ruth Howison for help with the analysis of the elevation data (appen-
dix) and David Nash and two anonymous reviewers for comments on earlier versions of the manu-
script. A PhD-Grant of the Centre for Ecological and Evolutionary Studies, University of Groningen
and grants by the Langerhuizen Fund and the Nicolaas Mulerius Fund, awarded to ABFI supported
this study, as well as a grant by the Danish National Research Foundation to JJB. We are grateful to
‘Vereniging Natuurmonumenten’ for permission to do field work in the national nature reserveVV
Schiermonnikoog.
82
CH
AP
TER
4
A.Ivens-diss 16-10-2012 11:14 Pagina 82
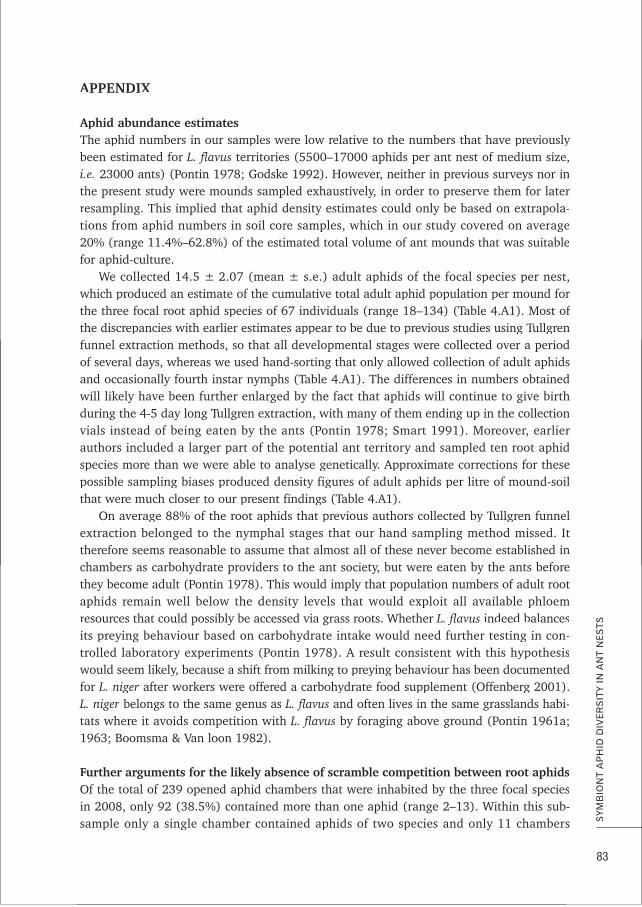
AAPPENDIX
AAphid abundance estimatesyThe aphid numbers in our samples were low relative to the numbers that have previously
been estimated for L. flavus territories (5500–17000 aphids per ant nest of medium size,i.e. 23000 ants) (Pontin 1978; Godske 1992). However, neither in previous surveys nor inthe present study were mounds sampled exhaustively, in order to preserve them for laterresampling. This implied that aphid density estimates could only be based on extrapola-tions from aphid numbers in soil core samples, which in our study covered on average20% (range 11.4%–62.8%) of the estimated total volume of ant mounds that was suitablefor aphid-culture.
We collected 14.5 ± 2.07 (mean ± s.e.) adult aphids of the focal species per nest,wwhich produced an estimate of the cumulative total adult aphid population per mound for
fthe three focal root aphid species of 67 individuals (range 18–134) (Table 4.A1). Most ofthe discrepancies with earlier estimates appear to be due to previous studies using Tullgrenfunnel extraction methods, so that all developmental stages were collected over a periodof several days, whereas we used hand-sorting that only allowed collection of adult aphidsand occasionally fourth instar nymphs (Table 4.A1). The differences in numbers obtainedwwill likely have been further enlarged by the fact that aphids will continue to give birthduring the 4-5 day long Tullgren extraction, with many of them ending up in the collectionvvials instead of being eaten by the ants (Pontin 1978; Smart 1991). Moreover, earlierauthors included a larger part of the potential ant territory and sampled ten root aphidspecies more than we were able to analyse genetically. Approximate corrections for thesepossible sampling biases produced density figures of adult aphids per litre of mound-soilthat were much closer to our present findings (Table 4.A1).
On average 88% of the root aphids that previous authors collected by Tullgren funnelextraction belonged to the nymphal stages that our hand sampling method missed. Ittherefore seems reasonable to assume that almost all of these never become established inchambers as carbohydrate providers to the ant society, but were eaten by the ants beforethey become adult (Pontin 1978). This would imply that population numbers of adult rootaphids remain well below the density levels that would exploit all available phloemresources that could possibly be accessed via grass roots. Whether L. flavus indeed balancesits preying behaviour based on carbohydrate intake would need further testing in con-trolled laboratory experiments (Pontin 1978). A result consistent with this hypothesiswwould seem likely, because a shift from milking to preying behaviour has been documentedfor L. niger after workers were offered a carbohydrate food supplement (Offenberg 2001).LL. niger belongs to the same genus as L. flavus and often lives in the same grasslands habi-tats where it avoids competition with L. flavus by foraging above ground (Pontin 1961a;1963; Boomsma & Van loon 1982).
Further arguments for the likely absence of scramble competition between root aphidsFFOf the total of 239 opened aphid chambers that were inhabited by the three focal speciesin 2008, only 92 (38.5%) contained more than one aphid (range 2–13). Within this sub-sample only a single chamber contained aphids of two species and only 11 chambers
83
SYM
BIO
NT
AP
HID
DIV
ER
SIT
Y IN
AN
T N
ES
TS
A.Ivens-diss 16-10-2012 11:14 Pagina 83
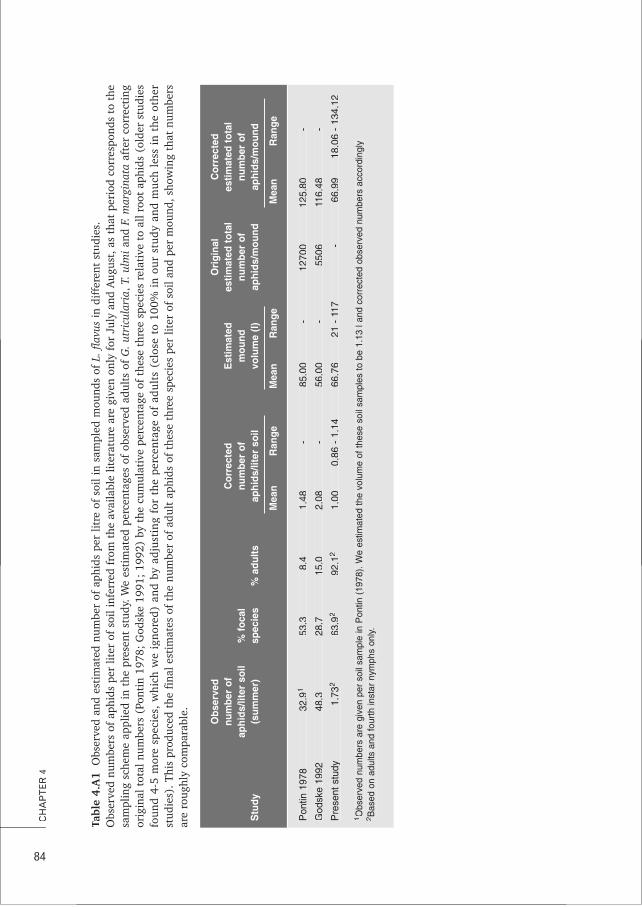
84
CH
AP
TER
4
Tabl
e 4.
A1
TTf
ff
Obs
erve
d an
d es
tim
ated
num
ber
of a
phid
s pe
r lit
re o
f so
il in
sam
pled
mou
nds
of L
. fla
vus
ffin
dif
fere
nt s
tudi
es.
Obs
erve
d nu
mbe
rs o
f ap
hids
per
lite
r of
soi
l inf
erre
d fr
om t
he a
vaila
ble
liter
atur
e ar
e gi
ven
only
for
Jul
y an
d A
ugus
t, a
s th
atpe
riod
cor
resp
onds
to
the
sam
plin
g sc
hem
e ap
plie
d in
the
pre
sent
stu
dy. W
e es
tim
ated
per
cent
ages
of
obse
rved
adu
lts
of G
. utr
icul
aria
,T.u
lmia
nd F
.mar
gina
taaf
ter
corr
ecti
ngor
igin
al t
otal
num
bers
(Po
ntin
197
8; G
odsk
e 19
91;
1992
) by
the
cum
ulat
ive
perc
enta
ge o
f th
ese
thre
e sp
ecie
s re
lati
ve t
o al
l roo
t ap
hids
(ol
der
stud
ies
foun
d 4-
5 m
ore
spec
ies,
whi
ch w
e ig
nore
d) a
nd b
y ad
just
ing
for
the
perc
enta
ge o
f ad
ults
(cl
ose
to 1
00%
in
our
stud
y an
d m
uch
less
in
the
othe
rst
udie
s). T
his
prod
uced
the
fin
al e
stim
ates
of
the
num
ber
of a
dult
aph
ids
of t
hese
thr
ee s
peci
es p
er li
ter
of s
oil a
nd p
er m
ound
, sho
win
g th
at n
umbe
rsar
e ro
ughl
y co
mpa
rabl
e. Obs
erve
d O
rigi
nal
Cor
rect
ed
num
ber
ofC
orre
cted
E
stim
ated
estim
ated
tot
ales
timat
ed t
otal
ap
hids
/lite
r so
il%
foc
alnu
mbe
r of
mou
ndnu
mbe
r of
num
ber
ofS
tudy
(sum
mer
)sp
ecie
s%
adu
ltsap
hids
/lite
r so
ilvo
lum
e (l)
aphi
ds/m
ound
aphi
ds/m
ound
Mea
nR
ange
Mea
nR
ange
Mea
nR
ange
Pon
tin 1
978
32.9
153
.38.
41.
48-
85.0
0-
1270
012
5.80
-
God
ske
1992
48.3
28.7
15.0
2.08
-56
.00
-55
0611
6.48
-
Pre
sent
stu
dy1.
732
63.9
292
.12
1.00
0.86
- 1
.14
66.7
621
- 1
17-
66.9
918
.06
- 13
4.12
1 Obs
erve
d nu
mbe
rs a
re g
iven
per
soi
l sam
ple
in P
ontin
(19
78).
We
estim
ated
the
volu
me
of th
ese
soil
sam
ples
to b
e 1.
13 l
and
corr
ecte
d ob
serv
ed n
umbe
rs a
ccor
ding
ly2 B
ased
on
adul
ts a
nd fo
urth
inst
ar n
ymph
s on
ly.
Obs
erve
d O
rigi
nal
Cor
rect
ed
num
ber
ofC
orre
cted
E
stim
ated
estim
ated
tot
ales
timat
ed t
otal
ap
hids
/lite
r so
il%
foc
alnu
mbe
r of
mou
ndnu
mbe
r of
num
ber
of
Stu
dy(s
umm
er)
spec
ies
% a
dults
aphi
ds/li
ter
soil
volu
me
(l)ap
hids
/mou
ndap
hids
/mou
nd
Mea
nR
ange
Mea
nR
ange
Mea
nR
ange
A.Ivens-diss 16-10-2012 11:14 Pagina 84
(4.6%) contained 2 MLLs (Figure 4.4). Aphid chambers are small cavities that are exca-vvated by the ants alongside roots of grasses like Festuca rubraFF and Elytrigia maritima.AAlthough chamber volumes were not measured, they often seemed approximately propor-tional to the number of aphids housed in them, suggesting that the ants expand chamberswwhen they need to contain more adult aphids and more roots for these aphids to extractphloem sap from. Combined with the abundant availability of grass roots in L. flavusmounds and our average yield of ca. 1 adult aphid per litre soil (Table 4.A1), this minimalcoexistence with non-clone mates and the absence of chamber space constraints wouldmake it very unlikely that individual ant-tended aphids would not have access to adlibitum phloem resources.
External factors that may affect aphid diversity at a larger scaleyOverall, we would expect that the genetic diversity of aphid livestock would tend to slowly
increase when L. flavus mounds become larger over the years of their existence, but we didnot have a range of mound-size data to test this and neither are we aware of directly rele-vvant data on this by others. However, the transect locations that are known to be the oldestfrom historical records about salt marsh development on the island of Schiermonnikoog(locations 1,2 and possibly 7) (Olff et al. 1997), harbored mounds that yielded a higheraphid diversity, at least for G. utricularia for which we had most data. Similarly, moundsoccurring at lower elevations will be more frequently subjected to flooding, a disturbancethat might cause mounds to be growing slower and have longer periods without abundantant habitation (Boomsma & Isaaks 1982). Also this seems at least partially consistent withour data, as aphid clonal diversity in mounds on transect locations with lower elevationlevels [e.g. location 5 and 6 (Ivens et al., unpublished data), tended to have lower clonediversity with the exception of F. marginata]. Aphid numbers of each of the three speciesvvaried considerably across the transect, possibly reflecting subtle differences in local eco-logical conditions related flooding frequency and salinity owing to slight elevation differ-ences (Ivens et al., unpublished data). None of these differences appear to have affectedthe overall results and conclusions of our study, but they may be of interest for future eco-logical studies of L. flavus populations in coastal areas.
85
SYM
BIO
NT
AP
HID
DIV
ER
SIT
Y IN
AN
T N
ES
TS
A.Ivens-diss 16-10-2012 11:14 Pagina 85

A.Ivens-diss 16-10-2012 11:14 Pagina 86

P fartner choice in a farming mutualism:do ants display preference for certainhomopteran symbionts?
A k B F IAniek B.F. IvensIdo PenFranz J. WeissingJacobus J. Boomsma
BO
XAAA.Ivens-diss 16-10-2012 11:14 Pagina 87

88
BO
X A
Mutualism, cooperation between members of different species, isassumed to be prone to conflicts between partners about invest-ments and returns. One of the mechanisms that can aid alignmentof these interests is partner choice: the selective directing ofresources towards preferred partners or the neglect of unwelcomepartners. Partner choice requires the ability to discriminate amongpotential symbionts. Here, we studied the ability of ant workers ofLasius flavus to preferentially select among its obligate homopteransymbionts relative to control homopterans that are not tended. Inthis pilot experimental set-up we observed sub-colonies of ants thatwere offered mealybugs and aphids that originated from their owncolony or from neighbouring ant colonies as well as symbiontsbelonging to different species, all in different states (dead/alive),in different developmental stages (nymph/adult) or belonging todifferent clonal genotypes. We show that the acceptance rate ofsymbionts did not differ among any of the categories evaluated.Total interaction time of the ants with the symbionts was, however,TTsignificantly shorter for nymphs and one of the genotypes, and alsofor the mealybugs. In fact, the mealybugs offered were largelyignored by the ant workers, consistent with them never beingactively tended by Lasius flavus in the field. We use these prelimi-nary results to evaluate whether the low number and clone diver-sity of aphid species in ant mounds may be caused by passive aphiddispersal constraints, rather than by active aphid selection ‘at thegate’.
AAABSTRACT
A.Ivens-diss 16-10-2012 11:14 Pagina 88
INTRODUCTION
Mutualisms are ubiquitous in nature (Leigh 2010), but their evolutionary stability is stillnot completely understood. How can mutualisms remain stable interactions over evolu-tionary time, when cooperating partner species are likely selected to reap maximal benefitsfrom the interaction for the least possible investments (Herre et al. 1999)? Several mecha-nisms to prevent or resolve such conflicts and thus enhance mutualism stability have beenput forward in the literature. One of these, partner choice (Bull & Rice 1991) allows (one
fof) the species to choose with whom to cooperate by preferentially directing benefits. Ifcooperative individuals tend to choose cooperative partners, the potential for conflict overcooperative investment will ultimately be reduced. This mechanism has been studied boththeoretically (e.g. Noë & Hammerstein 1995; Archetti et al. 2011) and empirically (e.g.Bshary et al. 2002; Kiers & Denison 2008; McFall-Ngai 2008). Partner choice requires dis-
ycriminatory power in the choosing species, which prompted us to study the discriminatorypower of Lasius flavus ants when confronted with different underground homoptereans.
Work on partner choice in homopteran-tending ants has so far been restricted to aWWcouple of studies on facultative interactions between ants and above ground aphids. These
ystudies showed that aphid species honeydew composition induces a preference hierarchyfor the aphids species tended, with species producing melezitose-rich honeydew being pre-ferred (Völkl et al. 1999; Woodring et al. 2004). However, Vantaux et al. (2012) showedthat Lasius niger ants do not appear to discriminate in tending or predation of high andlow quality clones of aphids.
Here we present pilot study results on partner choice in the obligate interactionbetween the underground ant L. flavus and the homopterans it tends in its nests. L. flavusis well-known for rearing several aphid species (Paul 1977; Pontin 1978; Godske 1991).AAlso mealybugs are frequently found in the nests of these ants, but their relationship to theants has remained unclear, although mealybugs are often described as being also mutualis-tic partners of ants for honeydew (Hölldobler & Wilson 1990). In an experimental sub-colony set-up we investigated ant preferences for both underground aphids and mealybugsbelonging to different species, and for aphids from the ants’ own colony or a differentcolony, for different developmental stages, different clonal lineages, and different states(dead or alive) and measured possible preferences in terms of symbiont acceptance rateand total interaction time.
METHODS
Study systemThe subterranean Yellow meadow ant Lasius flavus houses root aphids and mealybugs inits conspicuous nest mounds(↕ ca. 30 cm, ø ca. 80 cm) (Paul 1977; Pontin 1978; Godske1991). The ants depend on these symbionts for honeydew as a source of carbohydratesand they are also known to eat the root aphids for protein (Pontin 1958; Pontin 1961b;Pontin 1978; Smart 1991). Aphids are kept in specially constructed ‘aphid-chambers’, cavi-ties around grass-roots with one or several aphids and are actively protected from preda-
89
PA
RTN
ER
CH
OIC
E I
N A
FA
RM
ING
MU
TUA
LIS
M
A.Ivens-diss 16-10-2012 11:14 Pagina 89
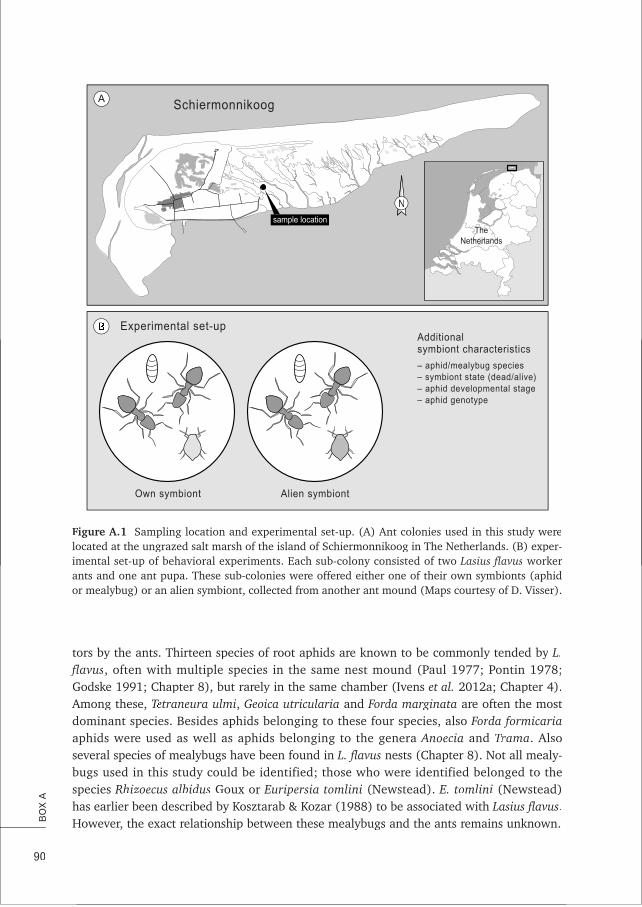
tors by the ants. Thirteen species of root aphids are known to be commonly tended by L.fflavus, often with multiple species in the same nest mound (Paul 1977; Pontin 1978;Godske 1991; Chapter 8), but rarely in the same chamber (Ivens et al. 2012a; Chapter 4).AAmong these, Tetraneura ulmiTT , Geoica utricularia and Forda marginatarr are often the mostdominant species. Besides aphids belonging to these four species, also Forda formicariarraphids were used as well as aphids belonging to the genera Anoecia and TramaTT . Alsoseveral species of mealybugs have been found in L. flavus nests (Chapter 8). Not all mealy-bugs used in this study could be identified; those who were identified belonged to thespecies Rhizoecus albidus Goux or Euripersia tomlini (Newstead). E. tomlini (Newstead)has earlier been described by Kosztarab & Kozar (1988) to be associated with Lasius flavus.However, the exact relationship between these mealybugs and the ants remains unknown.
90
BO
X A
Schiermonnikoog
Nsample location
A
Experimental set-up
Own symbiont Alien symbiont
Additionalsymbiont characteristics
– aphid/mealybug species– symbiont state (dead/alive)– aphid developmental stage– aphid genotype
TheNetherlands
Figure A.1 Sampling location and experimental set-up. (A) Ant colonies used in this study werelocated at the ungrazed salt marsh of the island of Schiermonnikoog in The Netherlands. (B) experlocated at the ungrazed salt marsh of the island of Schiermonnikoog in The Netherlands. (B) exper-imental set-up of behavioral experiments. Each sub-colony consisted of two Lasius flavus workerants and one ant pupa. These sub-colonies were offered either one of their own symbionts (aphidor mealybug) or an alien symbiont, collected from another ant mound (Maps courtesy of D. Visser).
A.Ivens-diss 16-10-2012 11:14 Pagina 90
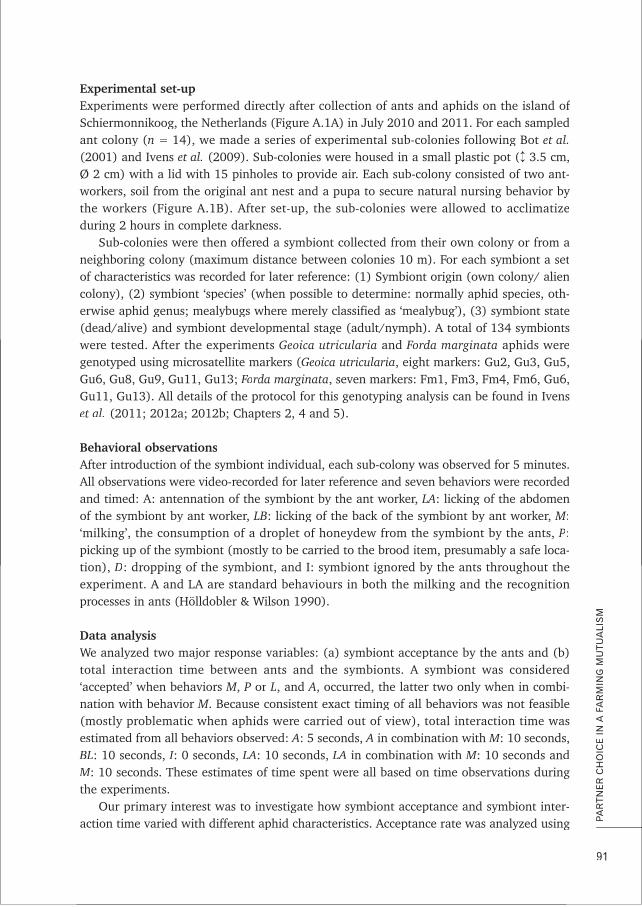
Experimental set-upfExperiments were performed directly after collection of ants and aphids on the island of
Schiermonnikoog, the Netherlands (Figure A.1A) in July 2010 and 2011. For each sampledant colony (n = 14), we made a series of experimental sub-colonies following Bot et al.(2001) and Ivens et al. (2009). Sub-colonies were housed in a small plastic pot (↕ 3.5 cm,Ø 2 cm) with a lid with 15 pinholes to provide air. Each sub-colony consisted of two ant-workers, soil from the original ant nest and a pupa to secure natural nursing behavior byworkers, soil from the original ant nest and a pupa to secure natural nursing behavior bythe workers (Figure A.1B). After set-up, the sub-colonies were allowed to acclimatizeduring 2 hours in complete darkness.
Sub-colonies were then offered a symbiont collected from their own colony or from aneighboring colony (maximum distance between colonies 10 m). For each symbiont a setof characteristics was recorded for later reference: (1) Symbiont origin (own colony/ aliencolony), (2) symbiont ‘species’ (when possible to determine: normally aphid species, oth-erwise aphid genus; mealybugs where merely classified as ‘mealybug’), (3) symbiont state(dead/alive) and symbiont developmental stage (adult/nymph). A total of 134 symbiontswwere tested. After the experiments Geoica utricularia and Forda marginatarr aphids weregenotyped using microsatellite markers (Geoica utricularia, eight markers: Gu2, Gu3, Gu5,Gu6, Gu8, Gu9, Gu11, Gu13; Forda marginatarr , seven markers: Fm1, Fm3, Fm4, Fm6, Gu6,Gu11, Gu13). All details of the protocol for this genotyping analysis can be found in Ivenset al. (2011; 2012a; 2012b; Chapters 2, 4 and 5).
Behavioral observationsAAfter introduction of the symbiont individual, each sub-colony was observed for 5 minutes.AAll observations were video-recorded for later reference and seven behaviors were recordedand timed: A: antennation of the symbiont by the ant worker, LA: licking of the abdomenof the symbiont by ant worker, LB: licking of the back of the symbiont by ant worker, M:‘milking’, the consumption of a droplet of honeydew from the symbiont by the ants, P:picking up of the symbiont (mostly to be carried to the brood item, presumably a safe loca-tion), D: dropping of the symbiont, and I: symbiont ignored by the ants throughout theexperiment. A and LA are standard behaviours in both the milking and the recognitionprocesses in ants (Hölldobler & Wilson 1990).
Data analysisWWe analyzed two major response variables: (a) symbiont acceptance by the ants and (b)total interaction time between ants and the symbionts. A symbiont was considered‘accepted’ when behaviors M, P or L, and A, occurred, the latter two only when in combi-nation with behavior M. Because consistent exact timing of all behaviors was not feasible(mostly problematic when aphids were carried out of view), total interaction time wasestimated from all behaviors observed: A: 5 seconds, A in combination with M: 10 seconds,BBL: 10 seconds, I: 0 seconds, LA: 10 seconds, LA in combination with M: 10 seconds andMM: 10 seconds. These estimates of time spent were all based on time observations duringthe experiments.
Our primary interest was to investigate how symbiont acceptance and symbiont inter-action time varied with different aphid characteristics. Acceptance rate was analyzed using
91
PA
RTN
ER
CH
OIC
E I
N A
FA
RM
ING
MU
TUA
LIS
M
A.Ivens-diss 16-10-2012 11:14 Pagina 91
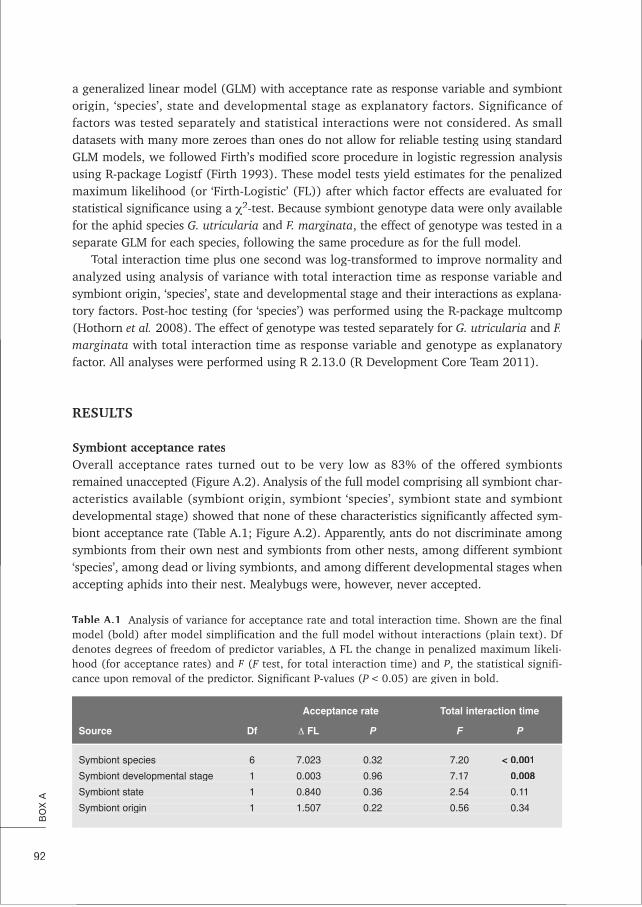
a generalized linear model (GLM) with acceptance rate as response variable and symbiontforigin, ‘species’, state and developmental stage as explanatory factors. Significance of
factors was tested separately and statistical interactions were not considered. As smalldatasets with many more zeroes than ones do not allow for reliable testing using standardGLM models, we followed Firth’s modified score procedure in logistic regression analysisusing R-package Logistf (Firth 1993). These model tests yield estimates for the penalizedmaximum likelihood (or ‘Firth-Logistic’ (FL)) after which factor effects are evaluated forstatistical significance using a χ2-test. Because symbiont genotype data were only availablefor the aphid species G. utricularia and F. marginata, the effect of genotype was tested in aseparate GLM for each species, following the same procedure as for the full model.
Total interaction time plus one second was log-transformed to improve normality andTTanalyzed using analysis of variance with total interaction time as response variable andsymbiont origin, ‘species’, state and developmental stage and their interactions as explana-tory factors. Post-hoc testing (for ‘species’) was performed using the R-package multcomp(Hothorn et al. 2008). The effect of genotype was tested separately for G. utricularia and F.marginata ywith total interaction time as response variable and genotype as explanatoryfactor. All analyses were performed using R 2.13.0 (R Development Core Team 2011).
RESULTS
Symbiont acceptance ratesOverall acceptance rates turned out to be very low as 83% of the offered symbiontsremained unaccepted (Figure A.2). Analysis of the full model comprising all symbiont char-acteristics available (symbiont origin, symbiont ‘species’, symbiont state and symbiontdevelopmental stage) showed that none of these characteristics significantly affected sym-biont acceptance rate (Table A.1; Figure A.2). Apparently, ants do not discriminate amongsymbionts from their own nest and symbionts from other nests, among different symbiont‘species’, among dead or living symbionts, and among different developmental stages whenaccepting aphids into their nest. Mealybugs were, however, never accepted.
92
BO
X A
Table A.1TT f f fAnalysis of variance for acceptance rate and total interaction time. Shown are the finalffmodel (bold) after model simplification and the full model without interactions (plain text). Df
denotes degrees of freedom of predictor variables, Δ FL the change in penalized maximum likeli-hood (for acceptance rates) and F (F test, for total interaction time) and P, the statistical signifi-cance upon removal of the predictor. Significant P-values (P < 0.05) are given in bold.
Acceptance rate Total interaction time
Source Df Δ FL P F P
Symbiont species 6 7.023 0.32 7.20 < 0.001
Symbiont developmental stage 1 0.003 0.96 7.17 0.008
Symbiont state 1 0.840 0.36 2.54 0.11
Symbiont origin 1 1.507 0.22 0.56 0.34
Acceptance rate Total interaction time
Source Df Δ FL P F P
A.Ivens-diss 16-10-2012 11:14 Pagina 92
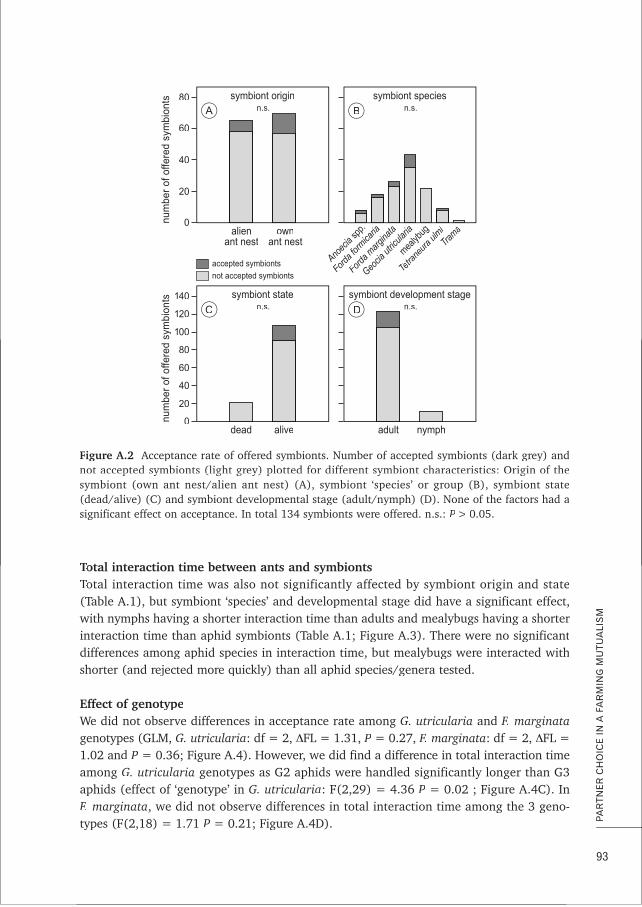
Total interaction time between ants and symbiontsTTTotal interaction time was also not significantly affected by symbiont origin and stateTT(Table A.1), but symbiont ‘species’ and developmental stage did have a significant effect,wwith nymphs having a shorter interaction time than adults and mealybugs having a shorterinteraction time than aphid symbionts (Table A.1; Figure A.3). There were no significantdifferences among aphid species in interaction time, but mealybugs were interacted withshorter (and rejected more quickly) than all aphid species/genera tested.
Effect of genotypeWWe did not observe differences in acceptance rate among G. utricularia and F. marginatagenotypes (GLM, G. utricularia: df = 2, ΔFL = 1.31, P = 0.27, F. marginata: df = 2, ΔFL =1.02 and P = 0.36; Figure A.4). However, we did find a difference in total interaction timeamong G. utricularia genotypes as G2 aphids were handled significantly longer than G3aphids (effect of ‘genotype’ in G. utricularia: F(2,29) = 4.36 P = 0.02 ; Figure A.4C). InFF. marginata, we did not observe differences in total interaction time among the 3 geno-types (F(2,18) = 1.71 P = 0.21; Figure A.4D).
93
PA
RTN
ER
CH
OIC
E I
N A
FA
RM
ING
MU
TUA
LIS
M
0
120
20
40
60
80
100
num
ber
of o
ffere
d sy
mbi
onts
dead
A B
C D
not accepted symbionts
accepted symbionts
alive
140 symbiont state
0
20
40
60
num
ber
of o
ffere
d sy
mbi
onts
alienant nest
80 symbiont origin
adult nymph
symbiont development stage
Anoec
ia sp
p.
symbiont species
n.s.n.s.
ownant nest
Forda f
ormica
ria
Forda m
argina
ta
Geocia
utric
ularia
mealyb
ug
Tetra
neura
ulmi
Trama
n.s.n.s.
Figure A.2 f ff fAcceptance rate of offered symbionts. Number of accepted symbionts (dark grey) andnot accepted symbionts (light grey) plotted for different symbiont characteristics: Origin of thenot accepted symbionts (light grey) plotted for different symbiont characteristics: Origin of thesymbiont (own ant nest/alien ant nest) (A), symbiont ‘species’ or group (B), symbiont state(dead/alive) (C) and symbiont developmental stage (adult/nymph) (D). None of the factors had asignificant effect on acceptance. In total 134 symbionts were offered. n.s.: P > 0.05.
A.Ivens-diss 16-10-2012 11:14 Pagina 93
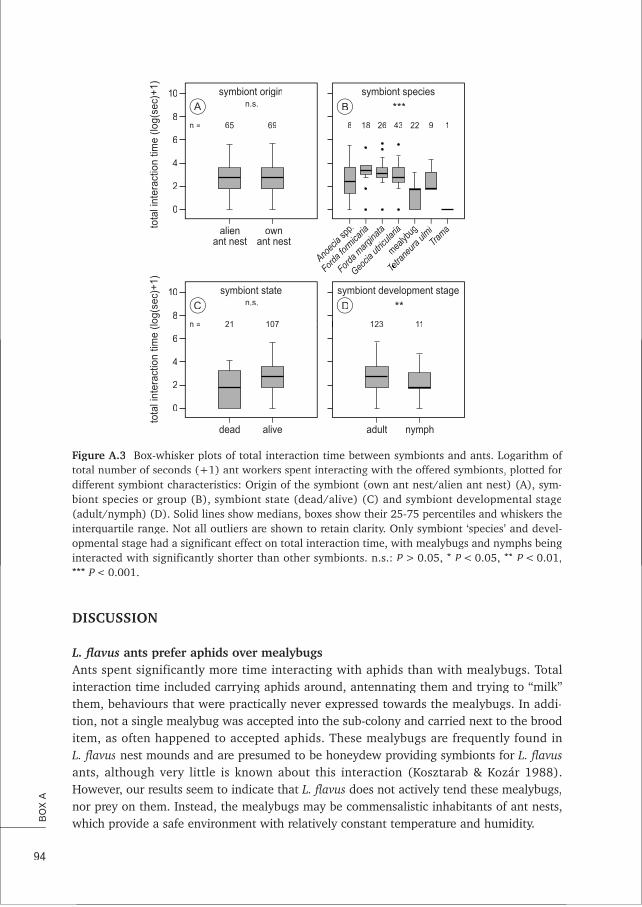
DISCUSSION
LL. flavus ants prefer aphids over mealybugsAAnts spent significantly more time interacting with aphids than with mealybugs. Totalinteraction time included carrying aphids around, antennating them and trying to “milk”them, behaviours that were practically never expressed towards the mealybugs. In addi-tion, not a single mealybug was accepted into the sub-colony and carried next to the brooditem, as often happened to accepted aphids. These mealybugs are frequently found inLL. flavus nest mounds and are presumed to be honeydew providing symbionts for L. flavusants, although very little is known about this interaction (Kosztarab & Kozár 1988).However, our results seem to indicate that L. flavus does not actively tend these mealybugs,nor prey on them. Instead, the mealybugs may be commensalistic inhabitants of ant nests,wwhich provide a safe environment with relatively constant temperature and humidity.
94
BO
X A
***
0
2
4
6
8
10
tota
l int
erac
tion
time
(log(
sec)
+1)
dead
A B
C D
alive
symbiont state
alienant nest
symbiont origin
adult nymph
symbiont development stage
symbiont species
**n.s.
ownant nest
n.s.
8 18 26 43 22 9 1
21 107 123 11n =
65 69n =
0
2
4
6
8
10
tota
l int
erac
tion
time
(log(
sec)
+1)
Anoec
ia sp
p.
Forda f
ormica
ria
Forda m
argina
ta
Geocia
utric
ularia
mealyb
ug
Tetra
neura
ulmi
TT
Trama
Figure A.3 fff fBox-whisker plots of total interaction time between symbionts and ants. Logarithm oftotal number of seconds (+1) ant workers spent interacting with the offered symbionts, plotted fortotal number of seconds (+1) ant workers spent interacting with the offered symbionts, plotted fordifferent symbiont characteristics: Origin of the symbiont (own ant nest/alien ant nest) (A), sym-bbiont species or group (B), symbiont state (dead/alive) (C) and symbiont developmental stage(adult/nymph) (D). Solid lines show medians, boxes show their 25-75 percentiles and whiskers theinterquartile range. Not all outliers are shown to retain clarity. Only symbiont ‘species’ and devel-opmental stage had a significant effect on total interaction time, with mealybugs and nymphs beinginteracted with significantly shorter than other symbionts. n.s.: P > 0.05, * P < 0.05, ** P < 0.01,*** P < 0.001.
A.Ivens-diss 16-10-2012 11:14 Pagina 94
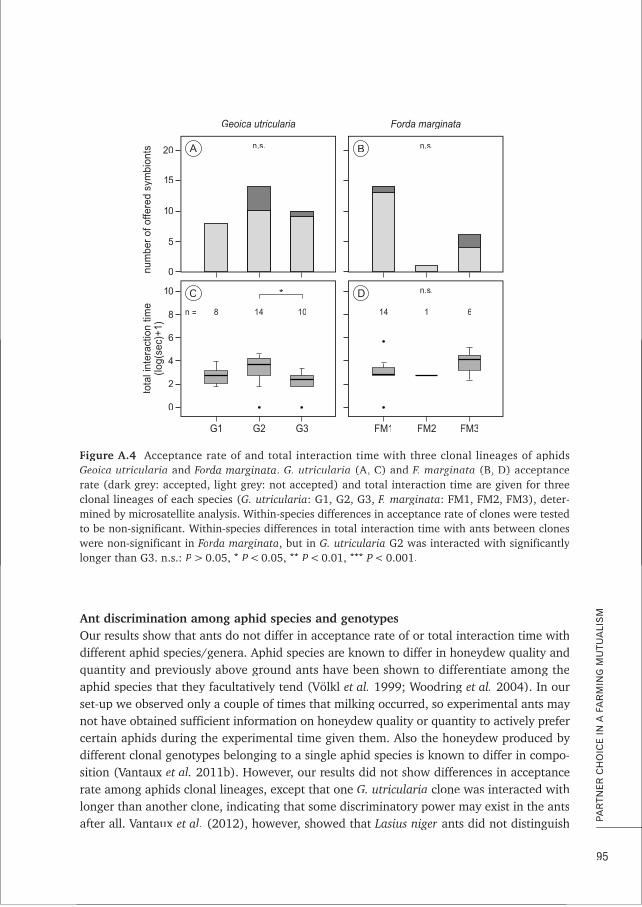
AAnt discrimination among aphid species and genotypesOur results show that ants do not differ in acceptance rate of or total interaction time withdifferent aphid species/genera. Aphid species are known to differ in honeydew quality andquantity and previously above ground ants have been shown to differentiate among theaphid species that they facultatively tend (Völkl et al. 1999; Woodring et al. 2004). In our
yset-up we observed only a couple of times that milking occurred, so experimental ants maynot have obtained sufficient information on honeydew quality or quantity to actively prefer
ycertain aphids during the experimental time given them. Also the honeydew produced bydifferent clonal genotypes belonging to a single aphid species is known to differ in compo-sition (Vantaux et al. 2011b). However, our results did not show differences in acceptancerate among aphids clonal lineages, except that one G. utricularia clone was interacted withlonger than another clone, indicating that some discriminatory power may exist in the antsafter all. Vantaux et al. (2012), however, showed that Lasius niger ants did not distinguish
95
PA
RTN
ER
CH
OIC
E I
N A
FA
RM
ING
MU
TUA
LIS
M
0
2
4
6
8
10
tota
l int
erac
tion
time
(log(
sec)
+1)
G1
A
C
G2
Geoica utricularia
*
n.s.
8 14n =
0
5
10
15
20nu
mbe
r of
offe
red
sym
bion
ts
G3
10
FM1
B
D
FM2
Forda marginata
n.s.
n.s.
14 1
FM3
6
Figure A.4 f fAcceptance rate of and total interaction time with three clonal lineages of aphidsGeoica utriculariaGeoica utricularia andand FoForrda marginatada marginatarrr .. G. utriculariaG. utricularia (A, C) and (A, C) and F.F. marginatamarginata (B, D) acceptance(B, D) acceptancerate (dark grey: accepted, light grey: not accepted) and total interaction time are given for threeclonal lineages of each species (G. utricularia: G1, G2, G3, F. marginata: FM1, FM2, FM3), deter-mined by microsatellite analysis. Within-species differences in acceptance rate of clones were testedto be non-significant. Within-species differences in total interaction time with ants between cloneswwwere non-significant in Forda marginatarr , but in G. utricularia yyG2 was interacted with significantlylonger than G3. n.s.: P > 0.05, * P < 0.05, ** P < 0.01, *** P < 0.001.
A.Ivens-diss 16-10-2012 11:14 Pagina 95
between aphid clones of the same facultative aphid species, even though the honeydewproduced differed in quality. To be able to assess whether similar dynamics apply to anobligate, underground ant-aphid interaction, future experiments on L. flavus fpreference ofaphid species and clones should therefore include longer assessment times for the ants,recently fed experimental aphids, and the performance of chemical analysis of the honey-dew produced by the different aphids.
Symbiont state and developmental stageLL. flavus wants rely on aphids for both carbohydrate and nitrogen intake, as aphid honeydewprovides sugar and aphid predation yields proteins (Pontin 1958; Pontin 1961b; Pontin1978; Smart 1991; Ivens et al. 2012a; Chapter 4). Aphids of different developmentalstages presumably have a different nutritional destination for the ants: the majority of the
rnymphs has been inferred to be eaten by the ants, whereas adult aphids are preserved forhoneydew production (Pontin 1978; Ivens et al. 2012a; Chapter 4). Likewise, one mightexpect that dead aphids can still serve as food. To test whether ants distinguish betweenaphids that can serve as different food sources, we offered both nymphs and adults as wellas dead and live aphids. The results show that ants do not prefer living over dead aphids interms of acceptance rate or interaction time. However, ants do spend significantly moretime interacting with adult aphids than nymphs (including milking and depositing aphidsnext to the brood), suggesting that the ants may have at least some discriminatory power.
No effect of symbiont origin Symbiont recognition by ant hosts has previously been shown in fungus growing antswwhich distinguish their own resident symbiont fungus from alien fungus and even policeagainst the latter, helped by the resident fungus (Bot et al. 2001; Poulsen & Boomsma2005; Ivens et al. 2009), a form of discrimination that could be a mechanism to ensurelong-term host-symbiont association. The tested L. flavus ants, however, did not differ inacceptance rate or interaction time with symbionts originating from their own nest or fromneighbouring nests. This suggests that the ants do not distinguish between these twogroups of symbionts and may thus not be able to recognize their own “dairy cattle”. This issurprising, because the ants may transfer colony-specific cuticular hydrocarbons (CHC)when antennating their symbionts, which one would expect could label them as part ofwhen antennating their symbionts, which one would expect could label them as part ofthe colony (Hölldobler & Wilson 1990). This would be consistent with the observation thatants display very similar behavior towards their aphids as towards their brood (Way 1963;personal observation). L. flavus ants display low aggression levels (A.B.F. Ivens, personalobservation), which could possibly be correlated with less pronounced CHC-profiles andthus lower discriminatory power among the different profiles. Future CHC-analyses of antwworkers and their associated aphids could further elucidate this.Implications of results and future perspectivesThe experiments shown here served as preliminary studies of partner choice in the L. flavus–– root aphid farming mutualism. The pilot character of the experiments caused the samplesizes to be rather unbalanced and some factors causing variation might not have been con-trolled for (e.g. temperature, weather conditions, distance between sampled colonies).Nevertheless, these experiments showed that partner choice experiments in this system are
96
BO
X A
A.Ivens-diss 16-10-2012 11:14 Pagina 96
feasible and they yielded a couple of interesting preliminary results. Overall, the ants showvvery little discriminatory power between aphids. This suggests that the low aphid speciesand genetic diversity observed within single ant mounds may not be caused by active antscreening upon entry into a colony, but rather be due to aphid dispersal constraints whichimplies that local clones are seldomly being “diluted” by immigrants (Ivens et al. 2012a;Chapter 4).
AAcknowledgementsThe authors would like to thank Maurice Jansen for mealybug species identification, Marten van de
Sanden for help with the experimental equipment, and Saleta Perez Vila and Sebastian Baldauf for
statistical advice. This study was supported by a PhD-Grant of the Centre for Ecological and
Evolutionary Studies, University of Groningen and grants by the Langerhuizen Fund and Nicolaas
Mulerius Fund, awarded to A.B.F.I as well as a grant by the Danish National Research Foundation to
J.J.B.
97
PA
RTN
ER
CH
OIC
E I
N A
FA
RM
ING
MU
TUA
LIS
M
A.Ivens-diss 16-10-2012 11:14 Pagina 97

A.Ivens-diss 16-10-2012 11:14 Pagina 98
fCharacterisation and cross-amplificationof polymorphic microsatellite loci inant-associated root-aphids
A k B F IAniek B.F. IvensDaniel J.C. KronauerJacobus J. Boomsma
PP bl h dublished in C i G i RConservation Genetics Resources: 2011, 3: 73-77
CH
AP
TER5
A.Ivens-diss 16-10-2012 11:14 Pagina 99
100
CH
AP
TER
5
Twenty-six polymorphic microsatellite loci were developed for fourTTspecies of ant-associated root-aphids: Geoica utricularia, Forda mar-rrginata, Tetraneura ulmiTT and Anoecia corni. We found up to 9 allelesper locus, with an average of 4.8. We also report polymorphiccross-amplification of eleven of these markers between differentpairs of study species. Furthermore, we tested previously publishedaphid microsatellites and found one locus developed for PemphigusPPbursarius to be polymorphic in G. utricularia. These microsatellitemarkers will be useful to study the population structure of aphidsassociated with the ant Lasius flavus and possibly other ants. Suchstudies are relevant because: 1. L. flavus mounds and their associ-ated flora and fauna are often key components in protected tem-perate grasslands, and 2. L. flavus and its diverse community ofroot-aphids provide an interesting model system for studying thelong-term stability of mutualistic interactions.
AAABSTRACT
A.Ivens-diss 16-10-2012 11:14 Pagina 100
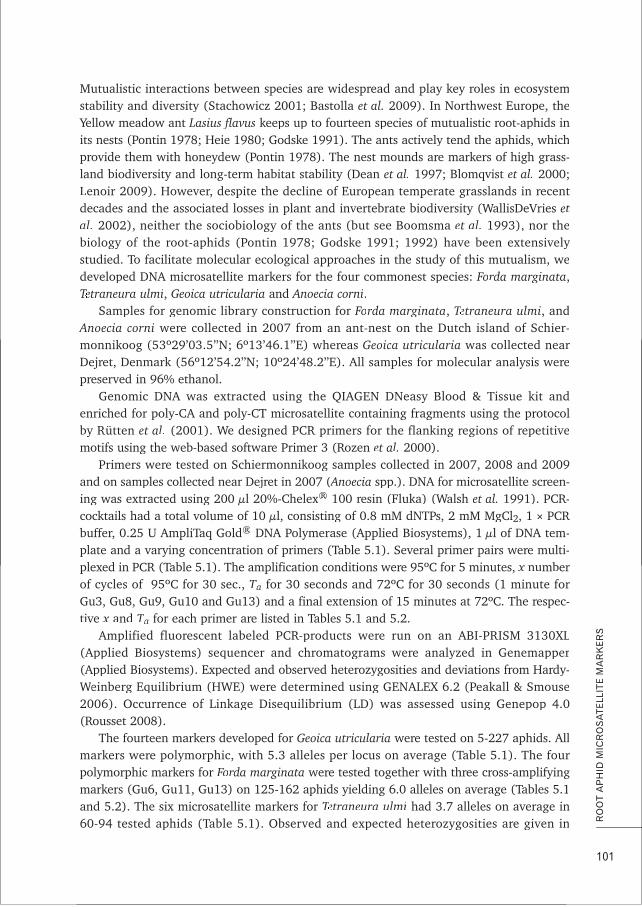
Mutualistic interactions between species are widespread and play key roles in ecosystemstability and diversity (Stachowicz 2001; Bastolla et al. 2009). In Northwest Europe, theYYellow meadow ant Lasius flavus keeps up to fourteen species of mutualistic root-aphids inits nests (Pontin 1978; Heie 1980; Godske 1991). The ants actively tend the aphids, whichprovide them with honeydew (Pontin 1978). The nest mounds are markers of high grass-land biodiversity and long-term habitat stability (Dean et al. 1997; Blomqvist et al. 2000;Lenoir 2009). However, despite the decline of European temperate grasslands in recentdecades and the associated losses in plant and invertebrate biodiversity (WallisDeVries tetal. 2002), neither the sociobiology of the ants (but see Boomsma et al. 1993), nor the
ybiology of the root-aphids (Pontin 1978; Godske 1991; 1992) have been extensivelystudied. To facilitate molecular ecological approaches in the study of this mutualism, wedeveloped DNA microsatellite markers for the four commonest species: Forda marginatarr ,Tetraneura ulmiTT , Geoica utricularia and Anoecia corni.
Samples for genomic library construction for Forda marginatarr , Tetraneura ulmiTT , andAAnoecia corni were collected in 2007 from an ant-nest on the Dutch island of Schier-monnikoog (53º29’03.5’’N; 6º13’46.1’’E) whereas Geoica utricularia was collected nearDejret, Denmark (56º12’54.2’’N; 10º24’48.2’’E). All samples for molecular analysis werepreserved in 96% ethanol.
Genomic DNA was extracted using the QIAGEN DNeasy Blood & Tissue kit andenriched for poly-CA and poly-CT microsatellite containing fragments using the protocolby Rütten et al. (2001). We designed PCR primers for the flanking regions of repetitivemotifs using the web-based software Primer 3 (Rozen et al. 2000).
Primers were tested on Schiermonnikoog samples collected in 2007, 2008 and 2009and on samples collected near Dejret in 2007 (Anoecia(( spp.). DNA for microsatellite screen-ing was extracted using 200 μl 20%-Chelex® 100 resin (Fluka) (Walsh et al. 1991). PCR-cocktails had a total volume of 10 μl, consisting of 0.8 mM dNTPs, 2 mM MgCl2, 1 × RPCRbuffer, 0.25 U AmpliTaq Gold® DNA Polymerase (Applied Biosystems), 1 μl of DNA tem-plate and a varying concentration of primers (Table 5.1). Several primer pairs were multi-plexed in PCR (Table 5.1). The amplification conditions were 95ºC for 5 minutes, x numberof cycles of 95ºC for 30 sec., TaTT for 30 seconds and 72ºC for 30 seconds (1 minute forGu3, Gu8, Gu9, Gu10 and Gu13) and a final extension of 15 minutes at 72ºC. The respec-tive x and TaTT for each primer are listed in Tables 5.1 and 5.2.
Amplified fluorescent labeled PCR-products were run on an ABI-PRISM 3130XL(Applied Biosystems) sequencer and chromatograms were analyzed in Genemapper(Applied Biosystems). Expected and observed heterozygosities and deviations from Hardy-WWeinberg Equilibrium (HWE) were determined using GENALEX 6.2 (Peakall & SmouseWW2006). Occurrence of Linkage Disequilibrium (LD) was assessed using Genepop 4.0(Rousset 2008).
The fourteen markers developed for Geoica utricularia were tested on 5-227 aphids. Allmarkers were polymorphic, with 5.3 alleles per locus on average (Table 5.1). The fourpolymorphic markers for Forda marginatarr were tested together with three cross-amplifyingmarkers (Gu6, Gu11, Gu13) on 125-162 aphids yielding 6.0 alleles on average (Tables 5.1and 5.2). The six microsatellite markers for Tetraneura ulmiTT had 3.7 alleles on average in60-94 tested aphids (Table 5.1). Observed and expected heterozygosities are given in
101
RO
OT
AP
HID
MIC
RO
SA
TELL
ITE
MA
RK
ER
S
A.Ivens-diss 16-10-2012 11:14 Pagina 101
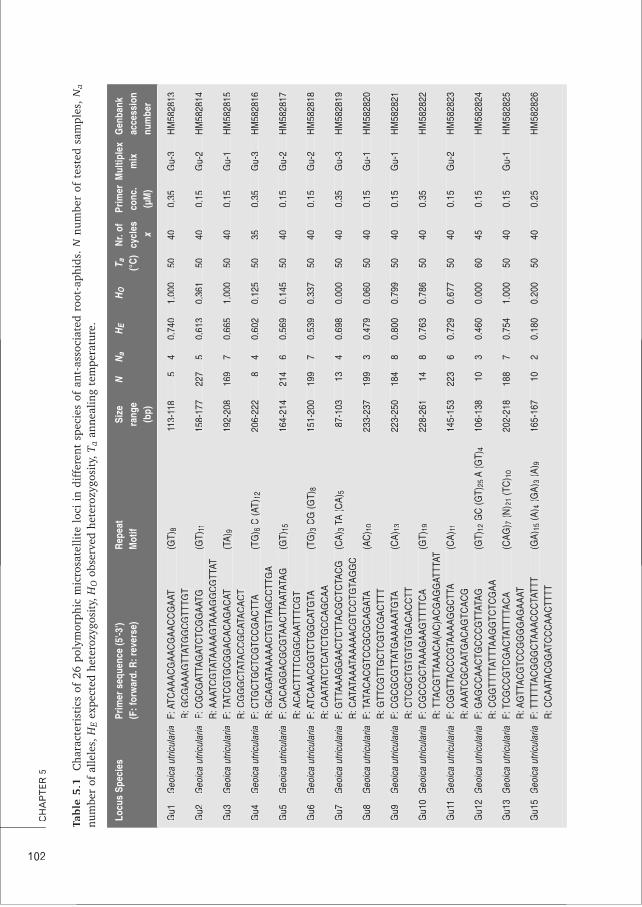
102
CH
AP
TER
5
Tblab
le 5
.1TT
fff
fh
fl
hll
ld
fff
dh
dC
hara
cter
isti
cs o
f 26
pol
ymor
phic
mic
rosa
telli
te l
oci
in d
iffe
rent
spe
cies
of
ant-
asso
ciat
ed r
oot-
aphi
ds.
Nf
bf
dl
num
ber
of t
este
d sa
mpl
es,
Na
NNnu
mbe
r of
alle
les,
HE
Hex
pect
ed h
eter
ozyg
osit
y,H
Oob
serv
ed h
eter
ozyg
osit
y, T
aTTan
neal
ing
tem
pera
ture
.
Locu
s Sp
ecie
sPr
imer
seq
uenc
e (5
'-3')
Rep
eat
Size
N
Na
NNH
EH
HO
T aTTN
r. of
Prim
er M
ultip
lex
Gen
bank
(F
: for
war
d. R
: rev
erse
)M
otif
rang
e(°
C)
cycl
esco
nc.
mix
acce
ssio
n(b
p)x
(μM
)nu
mbe
r
Gu1
Geo
ica
utric
ular
iaF:
ATC
AAAC
GAA
CG
AAC
CG
AAT
(GT)
811
3-11
85
40.
740
1.00
050
400.
35G
u-3
HM
5828
13R
: GC
GAA
AGTT
ATG
GC
GTT
TGT
Gu2
Geo
ica
utric
ular
iaF:
CG
CG
ATTA
GAT
CTC
GG
AATG
(GT)
1115
8-17
722
75
0.61
30.
361
5040
0.15
Gu-
2H
M58
2814
R: A
AATC
GTA
TAAA
AGTA
AAG
GC
GTT
ATG
u3G
eoic
a ut
ricul
aria
F: T
ATC
GTG
CG
GAC
ACAG
ACAT
(TA)
919
2-20
816
97
0.66
51.
000
5040
0.15
Gu-
1H
M58
2815
R: C
GG
GC
TATA
CC
GC
ATAC
ACT
Gu4
Geo
ica
utric
ular
iaF:
CTG
CTG
CTC
GTC
CG
ACTT
A(T
G) 6
C (A
T)12
206-
222
84
0.60
20.
125
5035
0.35
Gu-
3H
M58
2816
R: G
CAG
ATAA
AAAC
TGTT
AGC
CTT
GA
Gu5
Geo
ica
utric
ular
iaF:
CAC
AGG
ACG
CG
TAAC
TTAA
TATA
G(G
T)15
164-
214
214
60.
569
0.14
550
400.
15G
u-2
HM
5828
17R
: AC
ACTT
TTC
GG
CAA
TTTC
GT
Gu6
Geo
ica
utric
ular
iaF:
ATC
AAAC
GG
TCTG
GC
ATG
TA(T
G) 3
CG
(GT)
815
1-20
019
97
0.53
90.
337
5040
0.15
Gu-
2H
M58
2818
R: C
AATA
TCTC
ATC
TGC
CAG
CAA
Gu7
Geo
ica
utric
ular
iaF:
GTT
AAAG
GAA
CTC
TTAC
GC
TCTA
CG
(CA)
3TA
(CA)
587
-103
134
0.69
80.
000
5040
0.35
Gu-
3H
M58
2819
R: C
ATAT
AAAT
AAAA
ACG
TCC
TGTA
GG
CG
u8G
eoic
a ut
ricul
aria
F: T
ATAC
ACG
TCC
GC
GC
AGAT
A(A
C) 1
023
3-23
719
93
0.47
90.
060
5040
0.15
Gu-
1H
M58
2820
R: G
TTC
GTT
GC
TCG
TCG
ACTT
TG
u9G
eoic
a ut
ricul
aria
F: C
GC
GC
GTT
ATG
AAAA
ATG
TA(C
A)13
223-
250
184
80.
800
0.79
950
400.
15G
u-1
HM
5828
21R
: CTC
GC
TGTG
TGTG
ACAC
CTT
Gu1
0G
eoic
a ut
ricul
aria
F: C
GC
CG
CTA
AAG
AAG
TTTT
CA
(GT)
1922
8-26
114
80.
763
0.78
650
400.
35H
M58
2822
R: T
TAC
GTT
AAAC
A(AC
)AC
GAG
GAT
TTAT
Gu1
1G
eoic
a ut
ricul
aria
F: C
GG
TTAC
CC
GTA
AAAG
GC
TTA
(CA)
1114
5-15
322
36
0.72
90.
677
5040
0.15
Gu-
2H
M58
2823
R: A
AATC
GC
AATG
ACAG
TCAC
GG
u12
Geo
ica
utric
ular
iaF:
GAG
CC
AAC
TGC
CC
GTT
ATAG
(GT)
12G
C (G
T)25
A(G
T)4
106-
138
103
0.46
00.
000
6045
0.15
HM
5828
24R
: CG
GTT
TTAT
TTAA
GG
TCTC
GAA
Gu1
3G
eoic
a ut
ricul
aria
F: T
CG
CC
GTC
GAC
TATT
TTAC
A(C
AG) 7
(N) 2
1(T
C) 1
020
2-21
818
87
0.75
41.
000
5040
0.15
Gu-
1H
M58
2825
R: A
GTT
ACG
TCC
GG
GG
AGAA
ATG
u15
Geo
ica
utric
ular
iaF:
TTT
TTAC
GG
GC
TAAA
CC
CTA
TTT
(GA)
15(A
) 4(G
A)3
(A) 9
165-
167
102
0.18
00.
200
5040
0.25
HM
5828
26R
: CC
AATA
CG
GAT
CC
CAA
CTT
TT
Locu
s Sp
ecie
sPr
imer
seq
uenc
e (5
'-3')
Rep
eat
Size
N
Na
HE
HO
T aN
r. of
Prim
er M
ultip
lex
Gen
bank
(F
: for
war
d. R
: rev
erse
)M
otif
rang
e(°
C)
cycl
esco
nc.
mix
acce
ssio
n(b
p)x
(μM
)nu
mbe
r
A.Ivens-diss 16-10-2012 11:14 Pagina 102
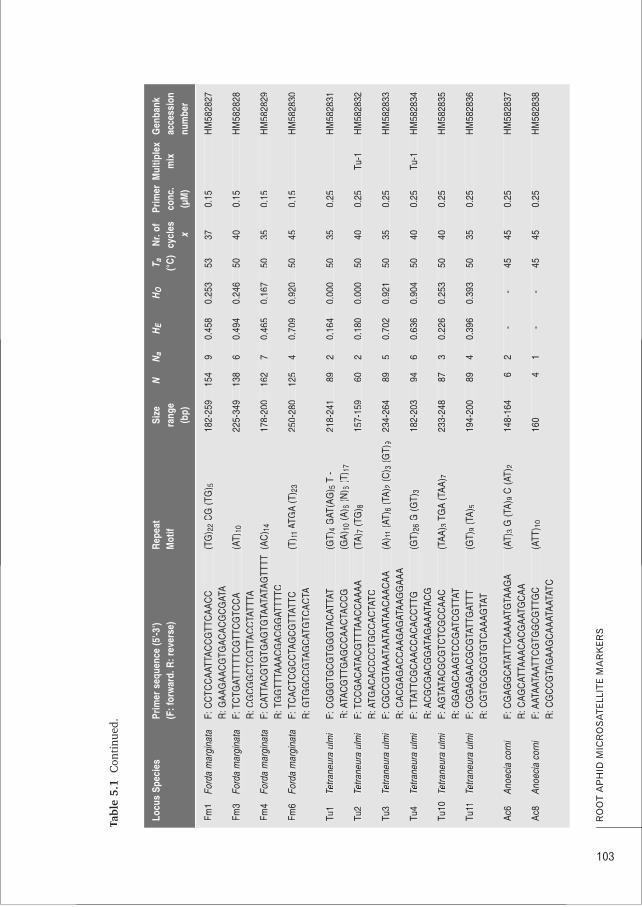
103
RO
OT
AP
HID
MIC
RO
SA
TELL
ITE
MA
RK
ER
S
Tabl
e 5.
1TT
Con
tinu
ed.
Locu
s Sp
ecie
sPr
imer
seq
uenc
e (5
'-3')
Rep
eat
Size
N
Na
NNH
EH
HO
T aTTN
r. of
Prim
er M
ultip
lex
Gen
bank
(F
: for
war
d. R
: rev
erse
)M
otif
rang
e(°
C)
cycl
esco
nc.
mix
acce
ssio
n(b
p)x
(μM
)nu
mbe
r
Fm1
Ford
a m
argi
nata
F: C
CTC
CAA
TTAC
CG
TTC
AAC
C(T
G) 2
2C
G (T
G) 5
182-
259
154
90.
458
0.25
353
370.
15H
M58
2827
R: G
AAG
AAC
GTG
ACAC
GC
GAT
AFm
3Fo
rda
mar
gina
taF:
TC
TGAT
TTTT
CG
TTC
GTC
CA
(AT)
1022
5-34
913
86
0.49
40.
246
5040
0.15
HM
5828
28R
: CG
CG
GC
TCG
TTAC
CTA
TTTA
Fm4
Ford
a m
argi
nata
F: C
ATTA
CG
TGTG
AGTG
TAAT
ATAG
TTTT
(AC
) 14
178-
200
162
70.
465
0.16
750
350.
15H
M58
2829
R: T
GG
TTTA
AAC
GAC
GG
ATTT
TCFm
6Fo
rda
mar
gina
taF:
TC
ACTC
GC
CTA
GC
GTT
ATTC
(T) 1
1AT
GA
(T) 2
325
0-28
012
54
0.70
90.
920
5045
0.15
HM
5828
30R
: GTG
GC
CG
TAG
CAT
GTC
ACTA
Tu1
Tetra
neur
a ul
mi
TTF:
CG
GG
TGC
GTG
GG
TAC
ATTA
T(G
T)4
GAT
(AG
) 5T
-21
8-24
189
20.
164
0.00
050
350.
25H
M58
2831
R: A
TAC
GTT
GAG
CC
AAC
TAC
CG
(GA)
10(A
) 6(N
) 6(T
) 17
Tu2
Tetra
neur
a ul
mi
TTF:
TC
CG
ACAT
ACG
TTTA
ACC
AAAA
(TA)
7(T
G) 8
157-
159
602
0.18
00.
000
5040
0.25
Tu-1
HM
5828
32R
: ATG
ACAC
CC
CTG
CC
ACTA
TCTu
3Te
trane
ura
ulm
iTT
F: C
GC
CG
TAAA
TAAT
AATA
ACAA
CAA
(A) 1
1(A
T)6
(TA)
2(C
) 3(G
T)9
234-
264
895
0.70
20.
921
5035
0.25
HM
5828
33R
: CAC
GAG
ACC
AAG
AGAT
AAG
GAA
ATu
4Te
trane
ura
ulm
iTT
F: T
TATT
CG
CAA
CC
ACAC
CTT
G(G
T)26
G (G
T)3
182-
203
946
0.63
60.
904
5040
0.25
Tu-1
HM
5828
34R
: AC
GC
GAC
GG
ATAG
AAAT
ACG
Tu10
Tetra
neur
a ul
mi
TTF:
AG
TATA
CG
CG
TCTC
GC
CAA
C(T
AA) 3
TGA
(TAA
) 723
3-24
887
30.
226
0.25
350
400.
25H
M58
2835
R: G
GAG
CAA
GTC
CG
ATC
GTT
ATTu
11Te
trane
ura
ulm
iTT
F: C
GG
AGAA
CG
CG
TATT
GAT
TT(G
T)9
(TA)
519
4-20
089
40.
396
0.39
350
350.
25H
M58
2836
R: C
GTG
CG
CG
TGTC
AAAG
TAT
Ac6
Anoe
cia
corn
iF:
CG
AGG
CAT
ATTC
AAAA
TGTA
AGA
(AT)
3G
(TA)
9C
(AT)
214
8-16
46
2-
-45
450.
25H
M58
2837
R: C
AGC
ATTA
AAC
ACG
AATG
CAA
Ac8
Anoe
cia
corn
iF:
AAT
AATA
ATTC
GTG
GC
GTT
GC
(ATT
) 10
160
41
--
4545
0.25
HM
5828
38R
: CG
CC
GTA
GAA
GC
AAAT
AATA
TC
Locu
s Sp
ecie
sPr
imer
seq
uenc
e (5
'-3')
Rep
eat
Size
N
Na
HE
HO
T aN
r. of
Prim
er M
ultip
lex
Gen
bank
(F
: for
war
d. R
: rev
erse
)M
otif
rang
e(°
C)
cycl
esco
nc.
mix
acce
ssio
n(b
p)x
(μM
)nu
mbe
r
A.Ivens-diss 16-10-2012 11:14 Pagina 103
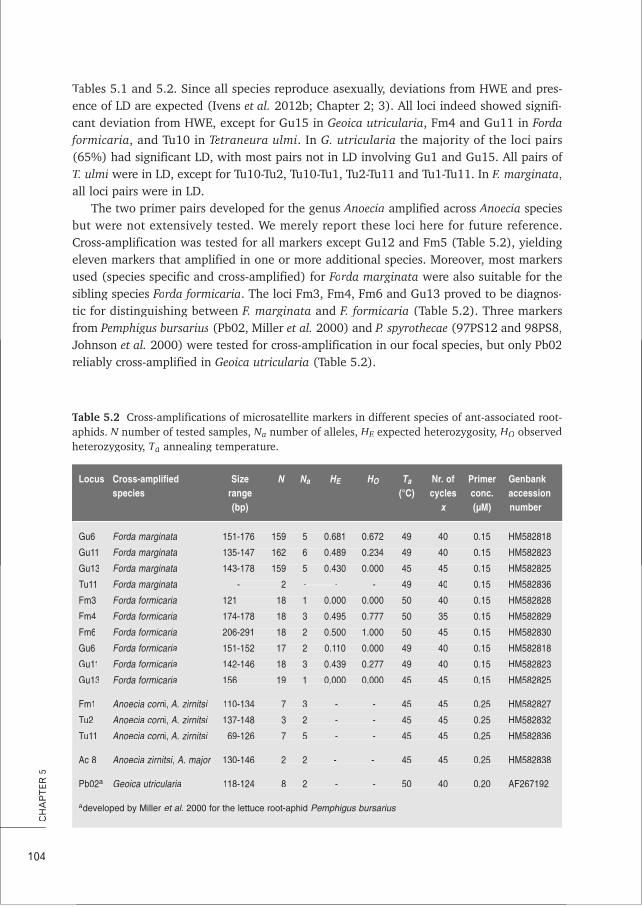
Tables 5.1 and 5.2. Since all species reproduce asexually, deviations from HWE and pres-TTence of LD are expected (Ivens et al. 2012b; Chapter 2; 3). All loci indeed showed signifi-cant deviation from HWE, except for Gu15 in Geoica utricularia, Fm4 and Gu11 in Fordafformicaria, and Tu10 in Tetraneura ulmiTT . In G. utricularia the majority of the loci pairs
f(65%) had significant LD, with most pairs not in LD involving Gu1 and Gu15. All pairs ofT. ulmi were in LD, except for Tu10-Tu2, Tu10-Tu1, Tu2-Tu11 and Tu1-Tu11. In F. marginata,all loci pairs were in LD.
The two primer pairs developed for the genus Anoecia amplified across Anoecia speciesbut were not extensively tested. We merely report these loci here for future reference.Cross-amplification was tested for all markers except Gu12 and Fm5 (Table 5.2), yieldingeleven markers that amplified in one or more additional species. Moreover, most markersused (species specific and cross-amplified) for Forda marginatarr were also suitable for thesibling species Forda formicariarr . The loci Fm3, Fm4, Fm6 and Gu13 proved to be diagnos-tic for distinguishing between F. marginata and F. formicaria (Table 5.2). Three markersfrom Pemphigus bursariusPP (Pb02, Miller et al. 2000) and P. spyrothecae (97PS12 and 98PS8,Johnson et al. 2000) were tested for cross-amplification in our focal species, but only Pb02reliably cross-amplified in Geoica utricularia (Table 5.2).
104
CH
AP
TER
5
Table 5.2TT f f ff fCross-amplifications of microsatellite markers in different species of ant-associated root-aphids. N number of tested samples, NaNN number of alleles, HEH expected heterozygosity, HO observedheterozygosity, TaTT annealing temperature.
Locus Cross-amplified Size N NaNN HEH HO TaTT Nr. of Primer Genbank species range (°C) cycles conc. accession
(bp) x (μM) number
Gu6 Forda marginata 151-176 159 5 0.681 0.672 49 40 0.15 HM582818
Gu11 Forda marginata 135-147 162 6 0.489 0.234 49 40 0.15 HM582823
Gu13 Forda marginata 143-178 159 5 0.430 0.000 45 45 0.15 HM582825
Tu11 Forda marginata - 2 - - - 49 40 0.15 HM582836
Fm3 Forda formicaria 121 18 1 0.000 0.000 50 40 0.15 HM582828
Fm4 Forda formicaria 174-178 18 3 0.495 0.777 50 35 0.15 HM582829
Fm6 Forda formicaria 206-291 18 2 0.500 1.000 50 45 0.15 HM582830
Gu6 Forda formicaria 151-152 17 2 0.110 0.000 49 40 0.15 HM582818
Gu11 Forda formicaria 142-146 18 3 0.439 0.277 49 40 0.15 HM582823
Gu13 Forda formicaria 156 19 1 0.000 0.000 45 45 0.15 HM582825
Fm1 Anoecia corni, A. zirnitsi 110-134 7 3 - - 45 45 0.25 HM582827
Tu2 Anoecia corni, A. zirnitsi 137-148 3 2 - - 45 45 0.25 HM582832
Tu11 Anoecia corni, A. zirnitsi 69-126 7 5 - - 45 45 0.25 HM582836
Ac 8 Anoecia zirnitsi, A. major 130-146 2 2 - - 45 45 0.25 HM582838
Pb02a Geoica utricularia 118-124 8 2 - - 50 40 0.20 AF267192
adeveloped by Miller et al. 2000 for the lettuce root-aphid Pemphigus bursarius
Locus Cross-amplified Size N Na HE HO Ta Nr. of Primer Genbank species range (°C) cycles conc. accession
(bp) x (μM) number
A.Ivens-diss 16-10-2012 11:14 Pagina 104
Although we enriched specifically for (CA)n and (CT)n r Aepeats, the aphid DNAappeared to be especially AT-rich, including repeats that were suitable for microsatellitedesign. This observation is in accordance with earlier findings (Weng et al. 2007).
In conclusion, the 26 newly developed microsatellite markers presented here cover alarge proportion of the known root-aphid fauna associated with L. flavus and other ant
fspecies (Heie 1980), and will be useful for detailed studies of the ecology and evolution ofthis mutualistic association.
AAcknowledgementsThis study was supported by a PhD-Grant from the Centre for Ecological and Evolutionary Studies,
University of Groningen and grants from the Pieter Langerhuizen Fund and the Nicolaas Mulerius
Foundation, awarded to A.B.F.I., as well as a grant from the Danish National Research Foundation toFF
kJ.J.B. that funded D.J.C.K.’s postdoctoral work in Copenhagen. The authors would like to thank
Sylvia Mathiasen, Thijs Janzen and Elzemiek Geuverink for help in the laboratory and in the field,
Ole E. Heie and Maurice Jansen for help with aphid taxonomy and Franz J. Weissing and Ido Pen for
discussion.
105
RO
OT
AP
HID
MIC
RO
SA
TELL
ITE
MA
RK
ER
S
A.Ivens-diss 16-10-2012 11:14 Pagina 105

A.Ivens-diss 16-10-2012 11:14 Pagina 106

f fMLGsim 2.0: updated software fordetecting clones from microsatellite datausing a simulation approach
A k B F IAniek B.F. IvensMarten van de SandenJoke Bakker
BO
XBA.Ivens-diss 16-10-2012 11:14 Pagina 107
INTRODUCTION
The ability to reproduce both sexually and asexually can be found in many organisms(Halkett et al. 2005). Such organisms with mixed reproductive modes include economi-cally important species such as pest species (e.g. aphids) and agricultural crops (e.g.potato). Despite recent theoretical and empirical advances (Balloux et al. 2003; De Meeus& Balloux 2004; Halkett et al. 2005; D'Souza & Michiels 2010; Villate et al. 2010; Chapter3) it remains difficult to accurately estimate rates of asexual reproduction in predomi-
ynantly sexual populations from microsatellite data alone. Moreover, sexually and asexuallyproduced individuals can be hard to distinguish, especially in plants. However, the modeof reproduction is known to have important implications for the evolutionary ecology andpopulation genetics of a species (Balloux et al. 2003; Halkett et al. 2005; Arnaud-Haond tetal. 2007). Detecting clonal individuals in sexual populations thus greatly contributes to amore complete insight into the evolution and ecology of a number of focal study species(Stenberg et al. 2003a; 2003b; Villate et al. 2010).
The most frequently used statistical method for assessing the likelihood that a givenindividual is of clonal origin from microsatellite data, is the estimation of the Psex P fvalue ofthe multilocus genotype (MLG) to which the individual belongs. PsexP ygives the probabilityto observe at least as many identical MLGs in the sampled population, as expected in arandom-mating population in Hardy-Weinberg equilibrium (Tibayrenc et al. 1990; Parks &Werth 1993; YoungWW et al. 2002):
Psex P = ∑N ! (PgenP )i (1 – PgenP )N–i (B.1)
i!(N – i(( )!
wwith N = sample size and n = number of individuals with the same MLG. PgenP is the prob-ability of that MLG to occur in a diploid population assuming Hardy-Weinberg equilibrium:
PgenP = Π (aja bjb ) 2h (B.2)
wwith L = number of loci, aja and bjb = frequencies of alleles a and b at locus j, respectively,and h = number of heterozygous loci in the sample (Parks & Werth 1993). To take intoaccount departures from Hardy-Weinberg equilibrium using fixation index FISF , a measurefor heterozygote excess or deficit in the population (Weir & Cockerham 1984), a more con-servative probability Pgen,FP ISF can be estimated (following Arnaud-Haond et al. 2007):
Pgen,FP ISF = Πaja bj b + cjc Fjj IS,jF 2h (B.3)
wwith L, aja , bjb and h the same as above, FIS,jF the estimated FISF for locus j, and cjc = aja (1– aja )if locus j is homozygous (i.e., aja = bjb ) and cjc = –aja bjb if j kis heterozygous (Hartl & Clark1997).
PsexP values can vary between 0 and 1, with a very low value for an MLG indicating thatthe multiple observations of that particular MLG have a very low probability of beingderived from separate events of sexual reproduction. In other words, the repeated occur-rence of the MLG can be best explained by these individuals belonging to the same clonal
108
BO
X B
i=n
N
j=1
L
j=1
L
A.Ivens-diss 16-10-2012 11:14 Pagina 108
lineage. However, PsexP cannot be treated as an accurate probability that is consistent andcomparable between populations, because the distribution of Psex P values of MLGs in a pop-ulation will also depend on the allelic variation present in the population (equation (B.1)).Here, we present simulation software that allows the estimation of the critical PsexP valuefor statistical significance in a given population and thus allows for the statistical signifi-cance of observed PsexP values to be evaluated.
Overview of MLGsim 2.0The software MLGsim 2.0 is an updated and extended version of MLGsim by Stenberg tetal. (2003b). MLGsim 2.0 reads microsatellite data of diploid organisms and assigns allindividuals to MLGs for which PsexP values are then estimated based on their counts andallele frequencies determined from the observed dataset. Next, the program simulates thesampled population a (user-specified) number of times taking the estimated allele frequen-cies and realized sample sizes into account. These simulations then provide a distributionof simulated Psex values from which a critical Psex threshold value can be determinedagainst which the observed PsexP values can be statistically tested.
Since its release, the original software MLGsim has been widely used in molecular eco-logical and evolutionary studies on a wide variety of organisms including weevils(Stenberg et al. 2003a), aphids (Vorburger 2006), willows (Stamati et al. 2007), corals(Severance & Karl 2006) and fungi (Xhaard et al. 2011). However, recent developments ingenomic techniques have allowed reaching much larger sample sizes than previous studies,wwhich implied that the original MLGsim software can no longer be used as it can maxi-mally handle 200 sampled individuals and needs manually encoded data input. The updated version MLGsim 2.0 includes, beside bug-fixes, the following new features:
(1) no restriction to dataset sample size(2) microsatellite data will be read automatically from a standard data file(4) the software calculates allele frequencies directly from the data file(5) individuals are sorted and assigned to MLG and MLG-counts are now automatised(6) the program allows for estimation of both PgenP (equation (B.2)) and Pgen,FP ISF (equa-
tion (B.3))(7) the software now calculates the observed and expected heterozygosities HOHH and
HEHH and the fixation index FISFF . (8) the user can specify whether allele frequencies and population genetic estimates
should be calculated based on ramet data (all samples included) or genet data (each MLG included only once) (sensu Harper 1977)
(9) several commonly used estimates for clonal diversity are calculated for the dataset: ● Clonal diversity and its modified counterpart R = (G – 1)/(N(( – 1), with G =number of MLGs and N = number of individuals (Ellstrand & Roose 1987;Dorken & Eckert 2001; Arnaud-Haond et al. 2007).● Effective clonal diversity Pde = Ge
N with effective number of genotypes Ge
given by Ge =∑gi
21 in which gi is the frequency of the i th genotype (MLG)
(Balloux et al. 2003; Chapter 3)
109
PR
OG
RA
M N
OTE
MLG
SIM
2.0
A.Ivens-diss 16-10-2012 11:14 Pagina 109

AApplication of MLGsim2.0The limitation of the original software MLGsim to datasets comprising at most 200 individ-uals has previously been listed as a shortcoming in several studies and a review (Halkett tetal. 2005; Vorburger 2006; Stamati et al. 2007). MLGsim 2.0 can in principal handle unlim-
yited sample sizes. Since its release online, MLGsim 2.0 has already been successfullyapplied in several studies with large sample sizes or large numbers of loci, includingstudies on corals (Gorospe & Karl in review; 2352 samples, 6 loci), ants (Kronauer et al. inreview; 83 samples, 30 loci) and aphids (Ivens et al. 2012b; 18 – 201 samples, 6-8 loci).
fIn 2006, the predecessor of MLGsim 2.0 was used to analyse population genetic data offaphids (Vorburger 2006), which necessitated using only a subsample of 200 individuals of
the total sample of 365. We re-analyzed the complete dataset using MLGsim 2.0 and threeof its new features [custom number of iterations, the ‘FIS’ option (PsexP estimation based onPPgen,FP IS F rather than PgenP ) and the ‘MLG’ option (allele frequencies based on genet data)].These new analyses do show a couple of quantitative and qualitative differences betweenprevious and present results (Table B.1). The first analysis (2nd row, Table B.1), is identicalTTto the analysis by Vorburger (2006), but now includes the complete dataset of 365 individ-uals rather than a subset of 200 individuals. By including all sampled individuals, therange of PsexP values increased from 10-11 – 10-15 to 10-8 – 10-15, possibly making it easierto detect critical PsexP values for statistical significance. An increased number of iterationsyyielded the same results (3rd row, Table B.1). Using the newly implemented FIS option (4TT rd
row, Table B.1) also resulted in higher significance levels for a clonal origin of MLGs. UsingTTthe newly implemented genet data option, in which allele frequencies are calculated basedon a subset of the entire dataset comprising of only a single copy of each MLG, fewer sig-nificant PsexP values were observed. By using the genet data (5th and 6th row, Table B.1) forTTthis dataset, fewer MLGs thus are estimated to be of clonal origin than previously reported(Vorburger 2006).
110
BO
X B
Table B.1TT R f fe-analysis of aphid data from Vorburger (2006). The published study used a subsampleRRof 200 individuals instead of the complete dataset to analyse the data with MLGsim using 1000iterations. These original results are shown in the first row. We re-analysed the complete datasetwwwith 1000 iterations using the new features of MLGsim 2.0 FIS (using PgenP ,FISF ) and MLG (using agggenet subsample of the data to estimate allele frequencies).
PsexP range Significance level
Vorburger 2006 (subset used) 10-11 – 10-15 0.05
MLGsim 2.0 (1000 iterations) 10-8 – 10-15 0.05 – 0.01
MLGsim 2.0 (10000 iterations) 10-8 – 10-15 0.05 – 0.01
MLGsim 2.0 (option FIS) 10-8 – 10-15 0.01
MLGsim 2.0 (option MLG) 10-6 – 10-15 ns – 0.01
MLGsim 2.0 (options MLG, FIS) 10-6 – 10-15 ns – 0.01
Psex range Significance level
A.Ivens-diss 16-10-2012 11:14 Pagina 110
In sum, MLGsim2.0 allows for more efficient clone detection in a population geneticdata set of diploid organisms based on co-dominant microsatellite markers. This updatedvversion of MLGsim is now suited for datasets of unrestricted size, it uses automated datainput, sorts individuals into MLGs and calculates their statistical significance, and providesan array of population genetic and clonal diversity estimates.
111
PR
OG
RA
M N
OTE
MLG
SIM
2.0
A.Ivens-diss 16-10-2012 11:14 Pagina 111

A.Ivens-diss 16-10-2012 11:14 Pagina 112
Conditional dispersal can promote andhamper cooperation in unexpected ways
A k B F IAniek B.F. IvensIdo PenJacobus J. BoomsmaFranz J. Weissing
CH
AP
TER6
A.Ivens-diss 16-10-2012 11:14 Pagina 113
114
CH
AP
TER
6
Although cooperation provides benefits to all parties involved, itdoes not evolve easily, because cooperators can be exploited bycheaters. This problem may be overcome if cooperative individualspredominantly interact with other cooperators. Two mechanismsleading to such positive assortment are partner choice (seekingcooperative and rejecting non-cooperative neighbourhoods) andpartner fidelity (staying in cooperative and leaving non-coopera-tive neighbourhoods). We used individual-based simulations toinvestigate whether partner choice and partner fidelity indeedfavour the evolutionary emergence and subsequent stability ofcooperation in a patch-structured population. We organized oursimulations as a public goods game, where investment in coopera-tiveness could jointly evolve with the tendency to leave a patch tojoin another patch. Both dispersal and settlement decisions wereallowed to be conditional on average cooperativeness in sourceand target patches. Conditional settlement had a negligible effecton the evolutionary outcome, but conditional dispersal had astrong effect. If the cost-benefit ratio of public good investmentwas very low (making any investment profitable for the investorsthemselves), conditional dispersal destabilized cooperation thatreadily evolved when dispersal was kept constant. If the cost-benefit ratio of investing in public goods was high (making thepublic goods game a social dilemma where investors lose whiletheir group gains) conditional dispersal strongly promoted the evo-lution of cooperation, but only in simulations where individualsevolved the tendency to leave cooperative patches. In simulationswhere individuals tended to stay in cooperative patches (partnerfidelity), cooperation quickly went extinct. This unexpected findingis explained by the fact that a high level of cooperation is associ-ated with a high intensity of local competition in our model,making it profitable to leave cooperative environments and cashthe benefits of cooperation elsewhere. Our results imply that con-ditional dispersal can both promote and destabilize cooperation,and that the evolutionary consequences of conditional strategiesmay thus be difficult to predict.
AAABSTRACT
A.Ivens-diss 16-10-2012 11:14 Pagina 114
INTRODUCTION
Cooperation is found throughout nature in a wide variety of organisms ranging frommicroorganisms to primates (Sachs et al. 2004; West et al. 2007). Ecologically dominant
yorganisms are often characterized by a high degree of cooperation, as exemplified bybiofilm-producing microorganisms, social insects, or our own species. Yet the origin andmaintenance of cooperation is not fully understood, especially in social dilemma situationswwhere from an individual perspective cheating is more profitable than cooperation (amongothers Janssen & Goldstone 2006; Killingback et al. k2006; Lehmann & Keller 2006; Nowak2006; West et al. 2007; Fletcher & Doebeli 2009; Bijma & Aanen 2010).
It is generally believed that a tendency for positive assortment between cooperativeindividuals is an important prerequisite for the evolution and stability of cooperation(Lehmann & Keller 2006). Already Hamilton (1964a) proposed that limited dispersal couldpromote the evolution of cooperation, because under limited dispersal interacting individ-uals will often be related and, thus, have similar tendencies to cooperate. However, limiteddispersal favours the evolution of cooperation only under very specific conditions (Queller1992; Taylor 1992; Queller 1994; West et al. 2002; Kümmerli et al. 2009). This is becauselimited dispersal will not only increase the scope for cooperation with kin, but also forcompetition with relatives (Taylor 1992; Kümmerli et al. 2009).
Still, dispersal could have an important effect on the evolution of cooperation if it isnot random but conditional on the cooperativeness in the local environment. Partnerchoice and partner fidelity are important aspects of such conditional dispersal. As arguedby Bull and Rice (1991), the evolution of cooperation should be strongly promoted if indi-viduals preferentially settle in cooperative neighbourhoods (partner choice) and if theyviduals preferentially settle in cooperative neighbourhoods (partner choice) and if theyonly stay in those neighbourhoods where the level of cooperation is sufficiently high(partner fidelity). Several modelling studies have confirmed these predictions. In an iter-ated prisoner’s dilemma game, Sherratt and Roberts (1998) showed that including theoption of terminating the interaction with a certain partner after a bad experience (a formof partner fidelity) does indeed promote cooperative behaviour. The same principle appliesin a continuous snowdrift game (McNamara et al. 2008), provided that the variation incooperativeness is sufficiently large and the same partners can interact with each othersufficiently often. For an N-person prisoner’s dilemma game played in a patch-structuredpopulation, Ichinose and Arita (2008) showed that a conditional dispersal strategy doesnot always lead to a more favorable outcome than unconditional dispersal. However, the
ydispersal strategy yielding the highest fitness was a conditional strategy, and this strategyinduced the evolution of cooperation. This matched earlier results by Pepper & Smuts(2002), who showed in a non-evolutionary assortment model that the option to leave non-
fcooperators leads to positive assortment between cooperators. The joint evolution ofpartner choice and cooperation tendency was investigated by Hruschka and Henrich(2006), again in the context of an iterated prisoner’s dilemma. In this model, already alow level of choosiness allowed the evolutionary emergence and spread of cooperative
kstrategies. Partner choice and partner fidelity are also at center stage in social networktheory (Perc & Szolnoki 2010), which does not only consider strategic behaviour but alsostrategic changes in the structure of the interaction network, such as breaking links with
115
JOIN
T E
VO
LUTI
ON
OF
WIT
HIN
-SP
EC
IES
CO
OP
ER
ATI
ON
AN
D C
ON
DIT
ION
AL
DIS
PE
RS
AL
A.Ivens-diss 16-10-2012 11:14 Pagina 115
uncooperative individuals or seeking to establish links with cooperative ones. Variousstudies (e.g. Ohtsuki et al. 2006; Fu et al. 2008; Zhang et al. 2012) arrive at the conclusionthat ‘rewiring’ the existing interaction network can strongly promote and stabilize coopera-tion.
The studies cited above are important first steps, but they also have several limitations.F yirst, most of these studies are based on game situations where the players repeatedlyinteract and know each other’s identity. In many biological systems, interactions are withanonymous or changing partners, and reliable information on the cooperativeness of thesepartners is often not available. Second, the strategic structure of the game models studiedis often very simple. Many models restrict attention to binary choices (between coopera-tion and defect) while in natural systems there are often many ‘degrees’ of cooperation. Inother words, cooperativeness is typically a continuous (rather than a discrete or evenbinary) variable. Third, most cooperation models equate the payoff of a cooperation game(e.g., a prisoner’s dilemma game or a public goods game) with fitness. This can be mis-leading, since the ecological context (e.g., density regulation) and the patterning of the life
ycycle can strongly affect the evolutionary outcome, both qualitatively and quantitatively(Mylius & Diekmann 1995; Pen & Weissing 2000). Fourth, and most importantly, partnerchoice and partner fidelity are either implemented by fixed, non-evolvable rules or asevolvable strategies with limited flexibility. In particular, most models assume a priori thatindividuals should have the unidirectional tendency to seek cooperative neighbourhoods
yand to avoid non-cooperative environments. As we will demonstrate, an opposite tendencycan also make perfect sense.
Here, we consider a model for the joint evolution of conditional dispersal andanonymized cooperation that allows for both partner choice and partner fidelity. We con-sider a species that lives in patches of fixed size where local inhabitants play a public goodsgame. Individuals may condition their dispersal decisions on the mean level of coopera-tiveness in their patch, which may result in partner fidelity. Likewise, we allow for condi-tional settlement where dispersing individuals make their decision on whether to settledependent on the mean level of cooperativeness of a target patch, which is equivalent toactive partner choice.
By means of individual-based evolutionary simulations, we investigate the joint evolu-tion of cooperativeness, conditional dispersal, and conditional settlement, focusing on thequestion whether such conditional strategies will emerge and subsequently allow thestable establishment of sizable levels of cooperation. No a priori assumptions are madewwith respect to the kind of conditional strategies that could evolve. We also evaluate whichkinds of dispersal and settlement strategies are more favourable for the evolution of coop-eration and whether different strategies can stably coexist.
THE MODEL
OverviewWWe consider a patch structured population, in which individuals locally interact in a publicgoods game and an individual’s contribution to the patch-specific public good is a heritable
116
CH
AP
TER
6
A.Ivens-diss 16-10-2012 11:14 Pagina 116
trait. Contributing to the public good (‘cooperation’) is costly for the actor and beneficialfor all individuals inhabiting a patch. The benefits accrued on a patch owing to individualcontributions of (some) inhabitants are equally distributed over all individuals in thepatch. Hence, all individuals profit from a high degree of cooperation, while only the con-tributors pay a cost. The individual cost of public good investment implies that coopera-tion will be selected against in well-mixed populations.
Generations in our model are discrete and non-overlapping, with a complete life cycleconsisting of three phases: a social interaction phase, a dispersal and settlement phase anda reproduction phase. In the social interaction phase, the public goods game is played.
yEvery individual can make a costly contribution to a common good that is shared equallyfamong all patch inhabitants, regardless of their individual contribution. The net effect of
contributing and receiving determines an individual’s ‘condition’, which in turn affects itsfuture fecundity in the patch where it will reproduce. During the dispersal and settlementphase, individuals may redistribute over the patches. Each individual has a certain ten-dency to leave its natal patch and settle in a new patch. A candidate target patch is
yselected at random but may be rejected if it does not meet the individual’s patch qualityycriteria of cooperativeness. Several rounds of such inspection of patches and rejection may
occur before finally settling. Both dispersal and rejection carry a small mortality cost.Dispersal and settlement strategies can be either fixed or conditional on the local produc-tivity of the natal patch and its alternatives after settlement. The reproduction phase startsafter all dispersing individuals have settled in a new patch. In each patch, all individuals(both locals and immigrants) produce offspring in proportion to their condition, as deter-mined by the costs and benefits experienced in the social interaction phase. After repro-duction, the parents die and the offspring compete for a fixed number of N positions intheir natal patch. The N successful individuals then enter the interaction phase, while theremaining individuals die (are removed from the population).
An individual’s cooperativeness (i.e., its contribution to the public goods game) and itstendencies to disperse and settle are heritable strategies that are transmitted from parents
yto offspring, subject to occasional mutations, which allows these strategies to evolve jointlyover the generations. We are particularly interested in the evolution of cooperation underfour dispersal and settlement scenarios: (1) dispersal and settlement rates are both con-stant (i.e., not conditional on local cooperativeness) and the same for all individuals (i.e.,no heritable variation); (2) the dispersal decision is based on an evolvable conditionalstrategy; (3) the settlement rule is based on an evolvable conditional strategy; (4) bothdispersal and settlement are heritable conditional strategies. We used these scenarios toevaluate whether and under what circumstances conditional dispersal and settlementstrategies will favour the evolution of cooperation.
Social interactionsEach patch member i in a given patch contributes to the public good according to itsgenetically determined investment level xi. The costs of this contribution are cxi, where thecost c per unit of investment is fixed parameter. The total investment made in the patch,xxtot = ∑xk x , generates a revenue bxtot that is distributed over all patch members, irrespec-tive of their contribution to the public good. The benefit b, i.e. f, the revenue per unit of
117
JOIN
T E
VO
LUTI
ON
OF
WIT
HIN
-SP
EC
IES
CO
OP
ER
ATI
ON
AN
D C
ON
DIT
ION
AL
DIS
PE
RS
AL
A.Ivens-diss 16-10-2012 11:14 Pagina 117
investment, is again a fixed parameter. Each of the N patch members receives a revenue1––NNbxtot = bx–, where x– = 1–
N∑xkx is the average ‘cooperativeness’ (= contribution to the publicgood) in the patch. The difference between benefits (bx–) and costs (cxi) determine thefecundity of focal individual i, which is given by:
WiWW = W0WW + bx– x – cxi . (6.1)
Here W0WW denotes the baseline fecundity, which is set at a sufficiently high value to preventfecundities becoming negative. In our model, only relative fecundities (relative to otherpatch members) are important, so that we can normalize fecundities by dividing all termsin equation (6.1) by b:
wi = w0 + x– x –(c/c b)xi , (6.2)
wwhere wi = WiWW /b and w0 = W0WW /b. Later on we will systematically vary the cost-benefitratio c/c b. The normalized baseline fecundity w0 determines the strength of selection: if w0
is large, the costs and benefits in equation (6.2) have only a small effect on wi and all indi-vviduals have a fairly similar fecundity. A high value of w0 thus corresponds to weak selec-tion. In the main text, we use w0 = 5. In the appendix (Figure 6.A3), we will also considerthe case w0 = 2, corresponding to stronger selection. It is useful to rewrite equation (2) as:
wi = w0 + 1–N∑xkx + (1–
N – c–b )xi . (6.3)
This equation reveals that for a low cost-benefit ratio ( c–b < 1–N) the focal individual’s invest-
ment xi has also a positive net effect on i’s fecundity (i.e., wi increases with xi). Therefore,the public goods game is a social dilemma only for c–b > 1–
N when, all other things being equal,individuals are better off by not cooperating but reaping the benefits accumulated by thecooperation of others. In all simulations shown here N = 50, implying that the cost-benefitratio c–
b = 1–50 = 0.02 is the borderline case beyond which the public goods game turns into a
social dilemma.
Dispersal and settlementIn the dispersal and settlement phase, each individual has the opportunity to leave itsnatal patch. Depending on the dispersal scenario considered, the dispersal probability d iseither constant (d = d0 for all individuals; following Taylor (1988), we chose d0 = 0.08)or an evolvable conditional strategy. In the latter case, the dispersal probability of a givenindividual depends on the average cooperativeness x– in the individual’s natal patch:
d(x((–) = 1 . (6.4)1 + exp(– βd · (x– – αdα ))
Here, αd and βd are heritable parameters describing how the individual will respond to theaverage public goods investment x– encountered in its patch. As illustrated in Figure 6.1,equation (6.4) represents a logistic function that can either increase (when βd >0; ‘type 1’)or decrease (βd <0 ; ‘type 2’) with x–. This function has a turning point in x– x = αd , at which
118
CH
AP
TER
6
k∑∑
≠i∑∑
A.Ivens-diss 16-10-2012 11:14 Pagina 118
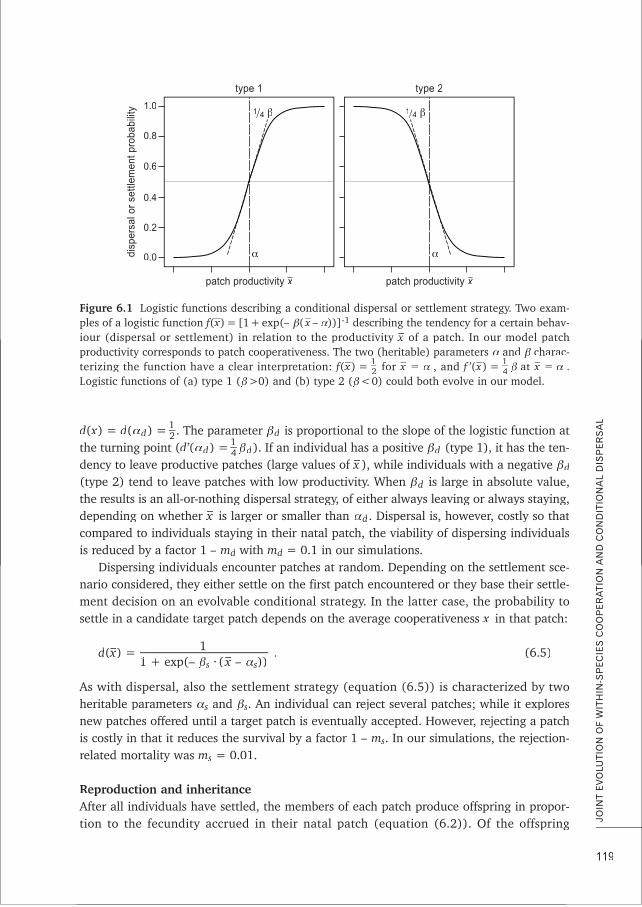
d(x((–) = d(αd) = 1–2. The parameter βd is proportional to the slope of the logistic function at
the turning point (d’(αd) = 1–4 βd). If an individual has a positive βd (type 1), it has the ten-
dency to leave productive patches (large values of x–), while individuals with a negative βd
(type 2) tend to leave patches with low productivity. When βd is large in absolute value,the results is an all-or-nothing dispersal strategy, of either always leaving or always staying,depending on whether x– is larger or smaller than αd . Dispersal is, however, costly so thatcompared to individuals staying in their natal patch, the viability of dispersing individualsis reduced by a factor 1 – md with md = 0.1 in our simulations.
Dispersing individuals encounter patches at random. Depending on the settlement sce-nario considered, they either settle on the first patch encountered or they base their settle-ment decision on an evolvable conditional strategy. In the latter case, the probability tosettle in a candidate target patch depends on the average cooperativeness x– in that patch:
d(x((–) = 1 . (6.5)1 + exp(– βs · (x– – αs))
AAs with dispersal, also the settlement strategy (equation (6.5)) is characterized by twoheritable parameters αs and βs. An individual can reject several patches; while it exploresnew patches offered until a target patch is eventually accepted. However, rejecting a patchis costly in that it reduces the survival by a factor 1 – ms. In our simulations, the rejection-related mortality was ms = 0.01.
Reproduction and inheritanceRRAAfter all individuals have settled, the members of each patch produce offspring in propor-tion to the fecundity accrued in their natal patch (equation (6.2)). Of the offspring
119
JOIN
T E
VO
LUTI
ON
OF
WIT
HIN
-SP
EC
IES
CO
OP
ER
ATI
ON
AN
D C
ON
DIT
ION
AL
DIS
PE
RS
AL
0.0
0.2
0.4
0.6
0.8
1.0
disp
ersa
l or
settl
emen
t pro
babi
lity
patch productivity x
type 1
1/4// β
α
patch productivity x
type 2
1/4// β
α
Figure 6.1 L fogistic functions describing a conditional dispersal or settlement strategy. Two exam-ples of a logistic functionples of a logistic function ff((fff xx((((–) [1+ e) = [1+ exp( xp(– ββ((xx– – αα))]))]α -1 describing the tendency for a certain behavdescribing the tendency for a certain behav-iour (dispersal or settlement) in relation to the productivity x–x of a patch. In our model patchproductivity corresponds to patch cooperativeness. The two (heritable) parameters α and β charac-terizing the function have a clear interpretation: f(x–) = 1–
2 for x– = α , and f ’(x–) = 1–4 β at x– = α .
Logistic functions of (a) type 1 (β >0) and (b) type 2 (β <0) could both evolve in our model.
A.Ivens-diss 16-10-2012 11:14 Pagina 119
produced in each patch, N are chosen at random to form the patch members entering thesocial interaction phase in the next generation, while parents and all other offspring die.
yIndividuals are haploid and reproduce clonally, so that each individual is geneticallycharacterized by its alleles (x(( ,αd ,βd ,αs,βs) at five jointly evolving loci. Allelic values arereal numbers that determine the individual’s cooperativeness (i.e., its contribution to thepublic good) and its condition dependent dispersal and settlement strategy. In the disper-sal scenarios where the dispersal and/or settlement decision is not evolvable and based ona fixed probability the corresponding genetic parameters [(αd ,βd) and/or (α s,βs)] haveno effect and evolve by genetic drift. When reproducing, parents transmit all five alleles totheir offspring, but each locus mutates with probability μ. In such cases, a small numberdrawn from the uniform distribution on the interval (–δ,δ) is added to the allele at the cor-δδresponding locus. To prevent a mutation bias at zero, allelic values at the cooperativenesslocus were allowed to become negative (a negative value of x finduces a contribution ofzero to the public goods game). However, mutations shifting x below –0.1 were notallowed, in order to prevent x drifting to very negative values (from where the subsequentevolution of cooperativeness would be very difficult to achieve). In our simulations, weused a per-locus mutation rate μ = 0.01 and a maximal mutational step size δ = 0.1.
Simulation settingsWe simulated populations consisting of 50,000 individuals that where distributed over1,000 patches, with each patch harbouring N = 50 individuals. In the simulations reportedin the main text all individuals were initialized at the allelic values x = αd = α s = 0.5 andβd = βs = 0. To check for the robustness of our conclusions, we also initialized βd and/orβs at positive (type 1 logistic function) or negative (type 2 logistic function) values, whichproduced results given in the appendix (Figure 6.A2).
For all four dispersal and settlement scenarios we considered six different cost-benefitratios (c/c b = 0.0001, 0.001, 0.01, 0.02, 0.06, 0.1), including two cases where the publicgoods game corresponds to a social dilemma (c/b >0.02). The figures in the main textreport on the cost-benefit values c/c b = 0.06 (social dilemma) and c/c b = 0.01 (no socialdilemma); the results of the other cost-benefit ratios are given in the appendix.
For each dispersal and settlement scenario and each parameter combination consid-ered, we ran 100 replicate simulations. Most simulations were run for 50,000 generations,but we regularly ran longer simulations (>200,000 generations) to check for the robust-ness of our results.
The simulation program was coded in C++ (code available upon request from A.I.),and compiled in g++ (4.3.4; Free Software Foundation, Inc. 2008).
RESULTS
Evolution of cooperation when the costs of cooperation are lowLet us first consider a small cost-benefit ratio (c/b = 0.01), where the benefits of con-tributing to the public good exceed the costs of the contribution and the public goods gameis no social dilemma. Figure 6.2 shows five representative simulation runs for each of the
120
CH
AP
TER
6
A.Ivens-diss 16-10-2012 11:14 Pagina 120
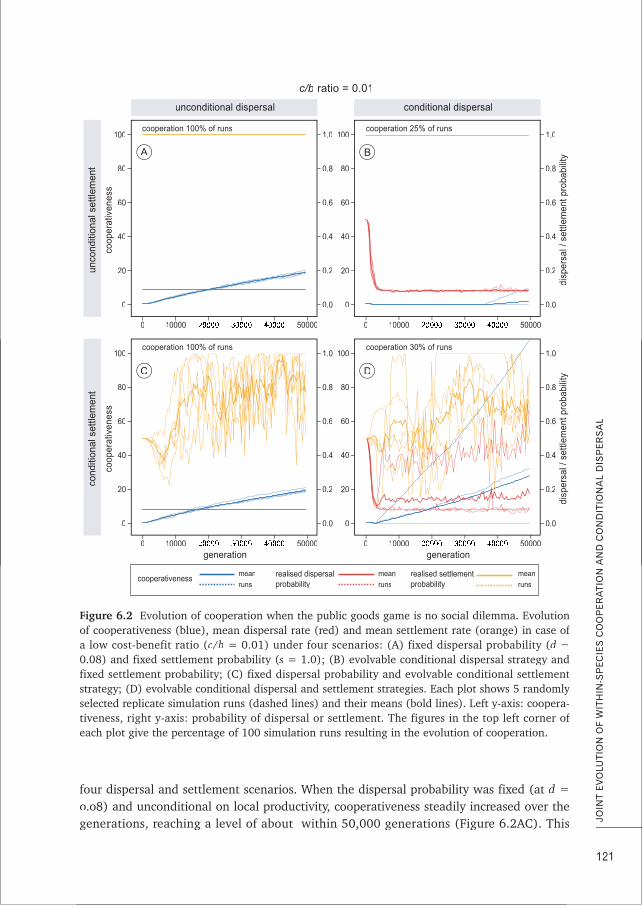
four dispersal and settlement scenarios. When the dispersal probability was fixed (at d =o.o8) and unconditional on local productivity, cooperativeness steadily increased over thegenerations, reaching a level of about within 50,000 generations (Figure 6.2AC). This
121
JOIN
T E
VO
LUTI
ON
OF
WIT
HIN
-SP
EC
IES
CO
OP
ER
ATI
ON
AN
D C
ON
DIT
ION
AL
DIS
PE
RS
AL
0
0.0
0.2
0.4
0.6
0.8
1.0
10000 500003
cooperation 100% of runs
coop
erat
iven
ess
unco
nditi
onal
set
tlem
ent
disp
ersa
l / s
ettle
men
t pro
babi
lity
0
0
20
40
60
80
100
0.0
0.2
0.4
0.6
0.8
1.0
10000 500003
unconditional dispersal
c/b ratio = 0.01
conditional dispersal
A B
0
meancooperativeness
realised dispersalprobability
realised settlementprobabilityruns
mean
runs
mean
runs
0.0
0.2
0.4
0.6
0.8
1.0
10000 500003generation
cooperation 100% of runs
cooperation 25% of runs
cooperation 30% of runs
coop
erat
iven
ess
cond
ition
al s
ettle
men
t
disp
ersa
l / s
ettle
men
t pro
babi
lity
0
0
20
40
60
80
100
0
20
40
60
80
100
0
20
40
60
80
100
0.0
0.2
0.4
0.6
0.8
1.0
10000 500003generation
C D
Figure 6.2 fEvolution of cooperation when the public goods game is no social dilemma. Evolutionffp ( ), p ( ) ( g ) fof cooperativeness (blue), mean dispersal rate (red) and mean settlement rate (orange) in case of
a low cost-benefit ratio (c/b = 0.01) under four scenarios: (A) fixed dispersal probability (d =0.08) and fixed settlement probability (s = 1.0); (B) evolvable conditional dispersal strategy andfixed settlement probability; (C) fixed dispersal probability and evolvable conditional settlement
yystrategy; (D) evolvable conditional dispersal and settlement strategies. Each plot shows 5 randomlyselected replicate simulation runs (dashed lines) and their means (bold lines). Left y-axis: coopera-
fftiveness, right y-axis: probability of dispersal or settlement. The figures in the top left corner ofeach plot give the percentage of 100 simulation runs resulting in the evolution of cooperation.
A.Ivens-diss 16-10-2012 11:14 Pagina 121
happened in all 200 simulation runs for these two scenarios. Surprisingly, however, thejjoint evolution of a more flexible conditional dispersal strategy inhibited cooperativenessand often led to the breakdown of cooperation (Figure 6.2BD). Irrespective of the settle-ment scenario, all 200 simulation runs showed an all-or-nothing pattern: while some runsresulted in consistently increasing high levels of cooperativeness (sometimes reaching alevel of x >100 within 50,000 generations), cooperativeness converged to zero in themajority of runs. In fact, cooperation only got off the ground in 25% of the 100 runs withfixed settlement and 30% of the runs with evolvable conditional settlement. This small dif-ference in simulation outcomes is not significant (P(( y= 0.431, Fisher exact test); apparentlythere is no synergistic effect of conditional dispersal and conditional settlement on the evo-lution of cooperation under low cost-benefit ratios.
As shown in the appendix, the same outcome was observed for even lower cost-benefitratios (Figure 6.A1). In case of fixed, unconditional dispersal, cooperativeness alwaysevolved, and the level reached within 50,000 generations was negatively related to thecost-benefit ratio. In case of the joint evolution of conditional dispersal, the simulationsexhibited an all-or-nothing pattern, where the percentage of simulation runs resulting incooperation was lowest for the lowest cost-benefit ratios.
Evolution of cooperation in a social dilemmaWWhen the cost-benefit ratio is larger than the public goods game becomes a socialdilemma. For c/c b f= 0.06, Figure 6.3 shows five representative simulation runs for each ofthe four dispersal and settlement scenarios. When the dispersal probability was fixed and
funconditional on local productivity, cooperation did not get off the ground, irrespective ofthe settlement scenario (Figure 6.3AC). In fact, cooperativeness rapidly converged to zeroin all 200 simulation runs with fixed and unconditional dispersal. In contrast, high levelsof cooperativeness could evolve when conditional dispersal could jointly evolve (Figure6.3BD). As in the case of a low cost-benefit ratio, all 200 simulations were of an all-or-nothing type: either cooperativeness dropped to zero or it rapidly evolved to ever increas-ing high levels (typically x >100 within 50,000 generations). In case of c/c b f= 0.06, 66% ofthe 100 runs with fixed settlement and 63% of the runs with evolvable conditional settle-ment resulted in the evolution of cooperation. This small difference in simulation out-comes is not significant (P(( = 0.767, Fisher’s exact test), so there is again no evidence for a
fsynergistic effect of conditional dispersal and conditional settlement on the evolution ofcooperation. Both percentages are significantly higher than the corresponding figures (25%and 30%, respectively) that were obtained for c/c b = 0.01 in Figure 6.2 (P(( <0.001, Fisherexact test).
As shown in the appendix, the same simulation outcome was observed for a highercost-benefit ratio (c/c b = 0.1; see Figure 6.A1). Cooperativeness always converged to zero
yin case of fixed dispersal, and to an all-or-nothing pattern when cooperativeness jointlyevolved with conditional dispersal. Although the cost-benefit ratio was higher than in thesimulations of Figure 6.3, cooperation evolved in an even higher percentage of runs (92%wwith fixed settlement and 90% with evolvable conditional settlement).
122
CH
AP
TER
6
A.Ivens-diss 16-10-2012 11:14 Pagina 122
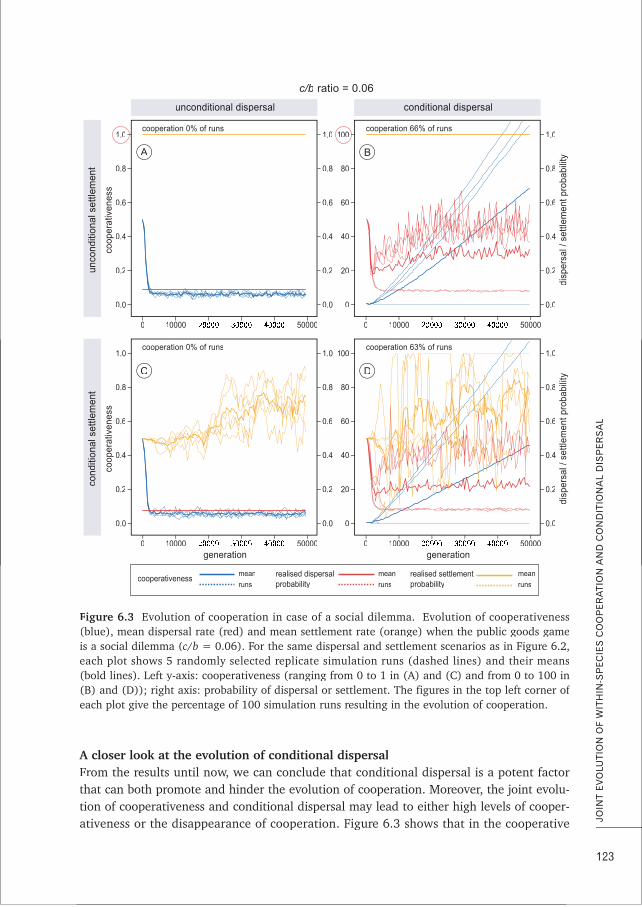
AA closer look at the evolution of conditional dispersalFrom the results until now, we can conclude that conditional dispersal is a potent factorthat can both promote and hinder the evolution of cooperation. Moreover, the joint evolu-tion of cooperativeness and conditional dispersal may lead to either high levels of cooper-ativeness or the disappearance of cooperation. Figure 6.3 shows that in the cooperative
123
JOIN
T E
VO
LUTI
ON
OF
WIT
HIN
-SP
EC
IES
CO
OP
ER
ATI
ON
AN
D C
ON
DIT
ION
AL
DIS
PE
RS
AL
0
0.0
0.2
0.4
0.6
0.8
1.0
0.0
0.2
0.4
0.6
0.8
1.0
10000 500003
cooperation 0% of runs
coop
erat
iven
ess
unco
nditi
onal
set
tlem
ent
disp
ersa
l / s
ettle
men
t pro
babi
lity
0
0
20
40
60
80
100
0.0
0.2
0.4
0.6
0.8
1.0
10000 500003
unconditional dispersal
c/b ratio = 0.06
conditional dispersal
A B
0
meancooperativeness
realised dispersalprobability
realised settlementprobabilityruns
mean
runs
mean
runs
0.0
0.2
0.4
0.6
0.8
1.0
0.0
0.2
0.4
0.6
0.8
1.0
10000 500003generation
cooperation 0% of runs
cooperation 66% of runs
cooperation 63% of runs
coop
erat
iven
ess
cond
ition
al s
ettle
men
t
disp
ersa
l / s
ettle
men
t pro
babi
lity
0
0
20
40
60
80
100
0.0
0.2
0.4
0.6
0.8
1.0
10000 500003generation
C D
Figure 6.3 f f fEvolution of cooperation in case of a social dilemma. Evolution of cooperativeness( ), p ( ) ( g ) p g g(blue), mean dispersal rate (red) and mean settlement rate (orange) when the public goods gameis a social dilemma (c/c b = 0.06). For the same dispersal and settlement scenarios as in Figure 6.2,each plot shows 5 randomly selected replicate simulation runs (dashed lines) and their means(bold lines). Left y-axis: cooperativeness (ranging from 0 to 1 in (A) and (C) and from 0 to 100 in
ff(B) and (D)); right axis: probability of dispersal or settlement. The figures in the top left corner ofeach plot give the percentage of 100 simulation runs resulting in the evolution of cooperation.
A.Ivens-diss 16-10-2012 11:14 Pagina 123
yruns, the average dispersal rate and the average settlement rate converged to relativelyhigh values (d ≈ 0.5; s often attaining the maximal value of 1.0), while the values obtainedin the non-cooperative runs were much lower (d ≈ 0.05, s ≈ 0.5) (Figure 6.3BD). But whatdetermines whether a simulation run will be ‘cooperative’? To answer this question, weinvestigated two specific simulation runs (for the social dilemma case c/c b = 0.06) in more
fdetail (Figure 6.4). One of these runs (upper panels of the figure) resulted in high levels ofcooperation, while cooperativeness converged to zero in the other run (lower panels). Thereplicated simulations in Figure 6.4 are typical in that cooperativeness first declined fromthe initial value x = 0,5 and subsequently sharply increased again as can be clearly seen inFig 6.4E. While x continued to increase in the cooperative runs, it abruptly declined andconverged to zero in the non-cooperative runs. Figure 6.4 also provides a more detailedvview of how the conditional dispersal strategy jointly evolved with the tendency to cooper-ate. In the cooperative run, the parameter αd of the dispersal strategy (equation (6.4))closely matched the average cooperativeness x– in the population, while the parameter βdβevolved to rather large positive values. As a consequence, the dispersal strategy corre-sponds to a type-1 logistic function that resembles a ‘bang-bang’ strategy (Figure 6.4D):individuals using this strategy leave their patch, when the patch productivity is larger thanαd , and they stay on their patch when x– <αd . In non-cooperative runs (Figure 4EFGH),both types of logistic function (βd >0 and βd <0) coexist in the same population forextended periods of time. Initially, type-1 strategies are as predominant as in the coopera-tive runs. Eventually, however, they get outcompeted by a type-2 strategy, where individu-als tend to leave unproductive patches while they tend to stay in cooperative patches.These outcomes are opposite to what one might have expected: the standard pattern asso-ciated with partner fidelity (i.e., leaving unproductive patches and staying in cooperativeenvironments) leads to the decay of cooperation, while the opposite pattern allows for theevolution of cooperation even in case of large cost-benefit ratios.
Robustness of the resultsRRThe simulations reported above were initialized at βd y= 0, that is, dispersal was initially
fnot condition dependent. It is conceivable that starting with a positive or negative value ofβd might lead to a different outcome, since it might give the evolution of cooperation ahead start. We therefore initialized some simulations with the values βd = +0.1 and βd =––0.1, where the associated initial values of αd were chosen such that d(x(( init) = d(0.5) =0.15 for the logistic function in equation (6.4). In line with our earlier results, cooperationnever evolved when the population was initialized with a type-2 dispersal strategy (βd =––0.1). Cooperation did evolve in about 50% of the simulations when the population wasinitialized at βd = +0.1, but it got off the ground less easily than in our standard set-up.Figure 6.A2 in the appendix shows a typical example. Cooperativeness did not evolve foran extended period of time (about 30,000 generations). In this period, αd ydeclined steadilyfrom its initial value αd = 17.85. Once it had reached a sufficiently small value, both βd
yand cooperativeness started to increase. In sum, cooperation indeed evolves frequentlywwhen βd values are initialized positive, whereas it does not evolve when βd values are ini-tialized negative.
124
CH
AP
TER
6
A.Ivens-diss 16-10-2012 11:14 Pagina 124
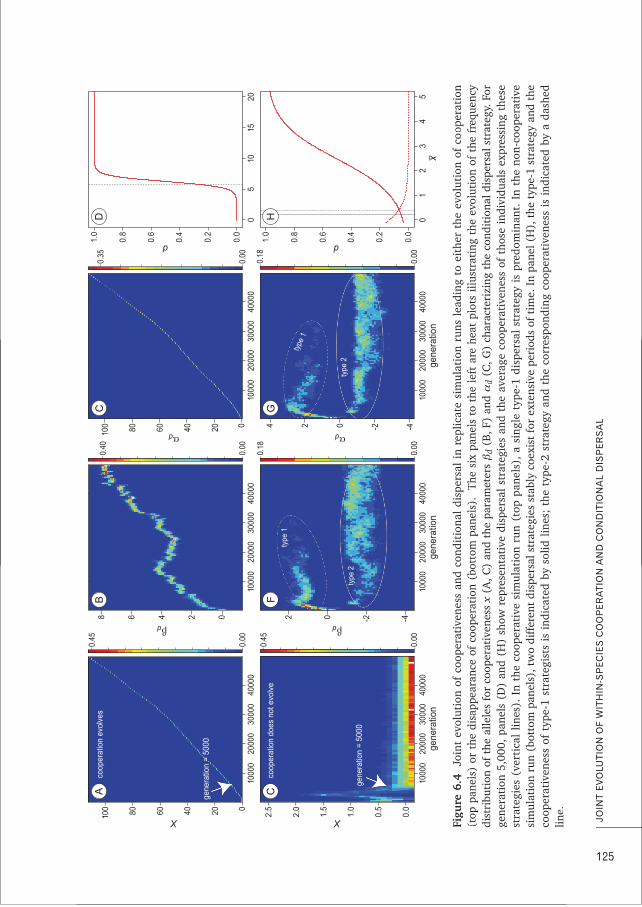
125
JOIN
T E
VO
LUTI
ON
OF
WIT
HIN
-SP
EC
IES
CO
OP
ER
ATI
ON
AN
D C
ON
DIT
ION
AL
DIS
PE
RS
AL
Figu
re 6
.4f
fJo
int
evol
utio
n of
coo
pera
tive
ness
and
con
diti
onal
dis
pers
al i
n re
plic
ate
sim
ulat
ion
runs
lea
ding
to
eith
er t
he e
volu
tion
of
coop
erat
ion
(top
pan
els)
or
the
disa
ppea
ranc
e of
coo
pera
tion
(bo
ttom
pan
els)
. Th
e si
x pa
nels
to
the
left
are
hea
t pl
ots
illus
trat
ing
the
e(t
l)
thdi
fti
(btt
l)
Thi
lt
thl
fth
tl
till
tti
thy
volu
tion
of
the
freq
uenc
yl
tif
thf
dist
ribu
tion
of
the
alle
les
for
coop
erat
iven
ess
x(A
, C)
and
the
para
met
ers
βd
(B, F
) an
d α
d(C
, G)
char
acte
rizi
ng t
he c
ondi
tion
al d
ispe
rsal
str
ateg
y. F
orge
nera
tion
5,0
00,
pane
ls (
D)
and
(H)
show
rep
rese
ntat
ive
disp
ersa
l st
rate
gies
and
the
ave
rage
coo
pera
tive
ness
of
thos
e in
divi
dual
s ex
pres
sing
the
sest
rate
gies
(ve
rtic
al l
ines
). I
n th
e co
oper
ativ
e si
mul
atio
n ru
n (t
op p
anel
s),
a si
ngle
typ
e-1
disp
ersa
l st
rate
gy i
s pr
edom
inan
t.In
the
non
-coo
pera
tive
sim
ulat
ion
run
(bot
tom
pan
els)
, tw
o di
ffer
ent
disp
ersa
l str
ateg
ies
stab
ly c
oexi
st f
or e
xten
sive
per
iods
of
tim
e. I
n pa
nel (
H),
the
typ
e-1
stra
tegy
and
the
coop
erat
iven
ess
of t
ype-
1 st
rate
gist
s is
ind
icat
ed b
y so
lid l
ines
; th
e ty
pe-2
str
ateg
y an
d th
e co
rres
pond
ing
coop
erat
iven
ess
isin
dica
ted
by a
das
hed
line.
A.Ivens-diss 16-10-2012 11:14 Pagina 125
1000
040
000
3000
020
000
0.0
0.00
0.45
0.5
1.0
1.5
2.0
2.5
gene
ratio
n
X
1000
040
000
3000
0
coop
erat
ion
evol
ves
coop
erat
ion
does
not
evo
lve
gene
ratio
n =
5000
gene
ratio
n =
5000
2000
00
0.00
0.45
20406080100
X
A C
1000
040
000
3000
020
000
-40.
00
0.18
0.18
-202
gene
ratio
n
βd
1000
040
000
3000
0
type
2
type
1
type
2
type
1
2000
0
0
0.00
0.40
2468
βd
B F
1000
040
000
3000
020
000
-40.
00
-2024
gene
ratio
n
αd
1000
040
000
3000
020
000
00.
00
0.35
20406080100
αd
C G
01
23
45
0.0
0.2
0.4
0.6
0.8
1.0
d
05
1015
20
0.0
0.2
0.4
0.6
0.8
1.0
d
D
x
H
To further investigate the robustness of our results, we increased the strength of selec-tion by reducing baseline fecundity from its standard value 5 to the lower value 2. Figure6.A3 in the appendix shows the results for the two cost-benefit ratios c/c b = 0.01 (no socialdilemma) and c/c b = 0.06 (social dilemma). Qualitatively, our earlier results were recov-ered, but they were quantitatively different in showing that stronger selection accelerates(as expected) the enhancement of cooperation when dispersal becomes conditional andcost-benefit ratios are high, whereas it inhibits cooperation more effectively when cost-benefit ratios are low.
DISCUSSION
yIt has repeatedly been argued that partner choice and partner fidelity may stronglypromote the evolution of cooperation (Bull & Rice 1991; Sachs et al. 2004; Foster &WW yenseleers 2006). Cooperation models including partner choice and partner fidelityWW(Sherratt & Roberts 1998; Hruschka & Henrich 2006; Ichinose & Arita 2008; McNamara tetal. 2008; Zhang et al. 2012) do indeed conclude that cooperation can evolve if individualstend to leave uncooperative environments and tend to settle in cooperative neighbour-hoods. However, all these models implemented a priori a fixed direction of the partnerchoice and/or a partner fidelity mechanism: individuals were assumed to have the ten-dency to move away from non-cooperative environments and towards cooperative envi-r yonments. To our knowledge, the present model is the first to consider the evolutionaryemergence of such directionality as well as the joint evolution of cooperativeness, partnerchoice and partner fidelity.
Our results confirm that conditional dispersal (a mechanism related to partner fidelity)has an important effect on the evolution of cooperation, but that conditional settlement (a
fmechanism related to partner choice) has only a marginal effect. Interestingly, the effect ofconditional dispersal on cooperativeness is not universally positive. In those cases wherecooperation seems to be the standard option (a low cost-benefit ratio making cooperationindividually advantageous), conditional dispersal often led to the breakdown of coopera-tion. Conditional dispersal did have a positive effect on cooperativeness in case of a socialdilemma situation, but also this effect manifested itself in an unexpected way. Whenever apopulation evolved the expected pattern associated with partner fidelity (i.e., to leave non-cooperative environments), cooperativeness did not evolve. In contrast, cooperativeness
fevolved in those cases where individuals tended to leave patches with a high degree ofcooperation.
How can these patterns be explained? Presumably, two features of our model areresponsible for this: local population regulation and the timing of dispersal in relation toother life-history events. The local population was reduced to N findividuals at the start ofeach generation. In other words, we did not consider the possibility of local resourceenhancement, that is, a positive effect of local cooperativeness (= productivity) on thelocal carrying capacity, also known as ‘population elasticity’ (Queller 1994; Le Galliard tetal. 2003; Janssen & Goldstone 2006). As a consequence, if individuals tend to bephilopatric a high degree of local cooperation automatically leads to a high degree of local
126
CH
AP
TER
6
A.Ivens-diss 16-10-2012 11:14 Pagina 126
competition, since more offspring will have to compete for the N positions if local fecun-dity is high. Our model also assumes that social interactions precede dispersal and settle-ment. As a consequence, individuals can evade local competition by leaving patches withhigh productivity. In view of these considerations, a tendency to leave cooperative patchesmakes perfect sense, because an individual can only really profit from the benefits of coop-
yeration if it goes away, thereby avoiding the severe competition otherwise experienced byits offspring. It has long been known that enhanced local competition may cancel the ben-efits of local cooperation (Queller 1992; Taylor 1992; West et al. 2002). The evolved dis-persal strategies in our simulations annihilate this effect by avoiding competition in aproductive environment.
Why does ‘inverse partner fidelity’ (leaving productive environments) favour the evolu-tion of cooperation in a social dilemma situation? Once a type-1 dispersal strategy hasbecome established, it is understandable how cooperativeness can evolve. Within a patch,cheaters (i.e., individuals with an atypically low degree of cooperation) can exploit the
fcooperativeness of other patch members, but they also lower the average productivity oftheir patch. As a consequence, cheaters (and other patch members) will tend to stay, whilenewcomers to the patch will predominantly come from patches of high productivity. Bothfactors enhance the local competition experienced by the offspring of cheaters, and this
feffect is apparently sufficiently strong to overcompensate for the immediate benefits ofcheating. The lesson is that the payoffs (equation (6.1)) in the public goods game are notnecessarily reliable proxies of individual fitness, as they correspond to one fitness compo-
fnent (fecundity), while total fitness also depends on other factors, such as the intensity oflocal competition. Once ‘inverse partner fidelity’ is established in the population, itbecomes clear why conditional settlement decisions (‘partner choice’) only had a marginaleffect on the evolution of cooperation. In our model, settlement could evolve to be basedon the past productivity of a patch. If individuals have the tendency to leave productivepatches, past cooperativeness becomes an unreliable predictor of future cooperativeness.In addition, the evolved value of αd closely matched the mean cooperativeness x– in thepopulation (Figure 6.4AC). Hence, individuals with a type-1 dispersal strategy tend toleave patches of above-average cooperativeness and, as a consequence, they will onaverage encounter patches of a lower cooperativeness than in their natal patch.AAccordingly, individuals can better avoid the costs of choosiness at settlement and settle onthe first patch they encounter.
Why does conditional dispersal hamper the evolution of cooperation in case of lowcost-benefit ratios that do not constitute a social dilemma? In fact, the same kind of rea-soning applies as in the social dilemma situation. When c/c b <1/N// , an individual extractsNmore benefits from its investment than the costs of this investment. However, the other
ypatch members will profit even more from this investment (since they do not have to paythe costs). When staying in a cooperative patch, cooperative individuals therefore have toface competition with other philopatric individuals whom they in fact helped to becomestrong competitors. Thus, also in case of a very low cost-benefit ratio individuals profitfrom avoiding competition by leaving cooperative patches. If, on the other hand, a type-2strategy gets the upper hand in the early stages of evolution, cooperation does not persistsince its benefits are nullified by the costs of local competition described above.
127
JOIN
T E
VO
LUTI
ON
OF
WIT
HIN
-SP
EC
IES
CO
OP
ER
ATI
ON
AN
D C
ON
DIT
ION
AL
DIS
PE
RS
AL
A.Ivens-diss 16-10-2012 11:14 Pagina 127
CONCLUSIONS
Our analysis shows that the joint evolution of cooperativeness and conditional dispersalhas features that – at least at first sight – are counter-intuitive. In the model considered,conditional dispersal could hamper the evolution of cooperation, and when it favoured theevolution of cooperation, the dispersal strategy had an unexpected shape. We do notpretend that exactly the same results will apply to all cooperation models. In fact, the evo-lutionary outcome would presumably have been different if the causal link between localproductivity and the intensity of local competition would have been broken (or weakened)by local resource enhancement, if dispersal and settlement would have preceded the localinteraction phase; or if individuals could have based their settlement decisions on indica-tors of future (rather than past) cooperativeness. Nevertheless, a few general conclusionscan be drawn from our study. First, the evolution of conditional strategies is often difficultto predict a priori. This insight is a cornerstone of classical game theory (Van Damme1991; Rasmusen 2006), but it is not yet firmly established in evolutionary ecology. Yet,also in biology a variety of models have arrived at the conclusion that the evolution of con-ditional strategies may have surprising outcomes ([e.g., the evolution of winner-losereffects in the absence of any difference in resource-holding potential, Van Doorn et al.2003; the strategic disadvantage of being the informed party in a conflict of interest, Pen &Taylor 2005; the erosion of sexual selection by conditional sex allocation decisions, FawcettTTet al. 2011]. Second, conditional strategies often coexist for extended periods of time (asthe type-1 and type-2 dispersal strategies in our model; see Figure 6.4FG). Again, there isa variety of examples for this, including the coexistence of communication strategies(Botero et al. 2010) and the coexistence of foraging strategies (Giske et al. in press). Third,the outcome of evolution may strongly depend on the order of life history events and eco-logical details (see also Mylius & Diekmann 1995; Pen & Weissing 2000). Since the payoffsof a cooperation game (like the public goods game in our model) are closely related tofitness, they are often viewed as proxies for fitness. As we have seen in our model, thismay be a problematic inference, since fitness also depends on factors like local competi-tion, which in turn reflect population regulation and the timing of life history events suchas dispersal.
AAcknowledgementsWWe thank Yiming Yu, Joke Bakker and Marten van de Sanden for help with the development and
implementation of the model. Support for this work was obtained through a PhD fellowship from
the Centre for Ecological and Evolutionary Studies, University of Groningen and by grants from the
Langerhuizen Fund and Nicolaas Mulerius Fund, awarded to ABFI. The Centre for High-Performance
Computing and Visualisation at the University of Groningen provided access to the Millipede High
Performance Cluster.
128
CH
AP
TER
6
A.Ivens-diss 16-10-2012 11:14 Pagina 128
AAPPENDIX
This appendix contains additional simulation results that illustrate the robustness of theresults discussed in the main text. The main text focused on two cost-benefit ratios (c/c b =0.01 and 0.06). Figure 6.A1 shows that similar results are obtained for a range of cost-benefit ratios (ranging from 0.001 to 0.1). Figure 6.A2 shows some simulations that werenot initialized with βd = 0 but with a positive value. Figure 6.A3 considers a lower base-line fecundity than the standard value (w0 = 5) used in the main text. All results presentedin this appendix are discussed in the main text.
129
JOIN
T E
VO
LUTI
ON
OF
WIT
HIN
-SP
EC
IES
CO
OP
ER
ATI
ON
AN
D C
ON
DIT
ION
AL
DIS
PE
RS
AL
A.Ivens-diss 16-10-2012 11:14 Pagina 129
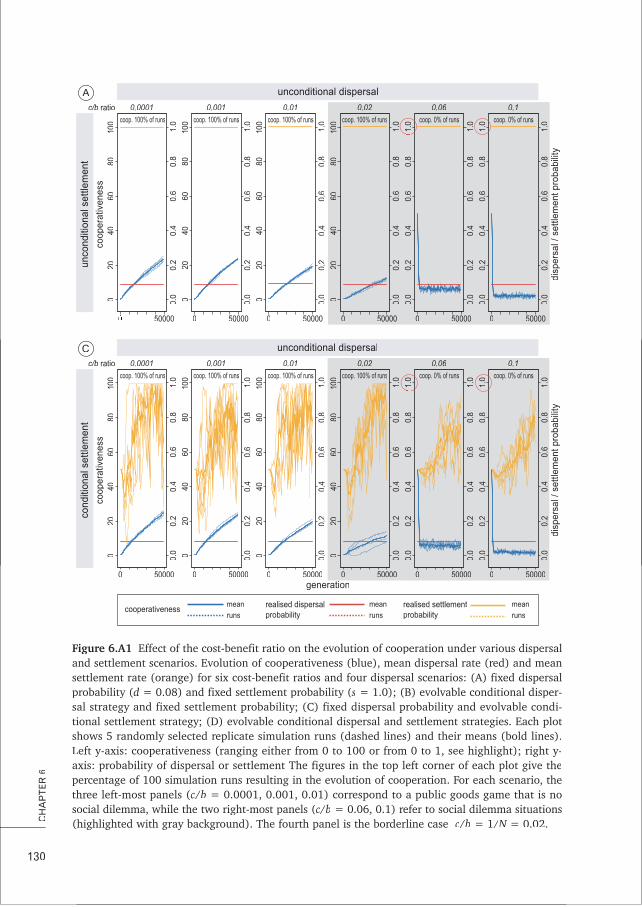
130
CH
AP
TER
6
0 0.0
0.2
0.4
0.6
0.8
1.0
2040
6080
100
50000
c/b ratio 0.0001
coop. 100% of runs
coop
erat
iven
ess
unco
nditi
onal
set
tlem
ent
disp
ersa
l / s
ettle
men
t pro
babi
lity
unconditional dispersalA
generation
0
0 0.0
0.2
0.4
0.6
0.8
1.0
2040
6080
100
50000
0.001
coop. 100% of runs
0
0 0.0
0.2
0.4
0.6
0.8
1.0
2040
6080
100
50000
0.01
coop. 100% of runs
0
0 0.0
0.2
0.4
0.6
0.8
1.0
2040
6080
100
50000
0.02
coop. 100% of runs
0
0.0
0.2
0.4
0.6
0.8
1.0
50000
0.06
coop. 0% of runs
0
0.0
0.2
0.4
0.6
0.8
1.0
0.0
0.2
0.4
0.6
0.8
1.0
0.0
0.2
0.4
0.6
0.8
1.0
50000
0.1
coop. 0% of runs
0
0 0.0
0.2
0.4
0.6
0.8
1.0
2040
6080
100
50000
c/b ratio 0.0001
coop. 100% of runs
coop
erat
iven
ess
cond
ition
al s
ettle
men
t
disp
ersa
l / s
ettle
men
t pro
babi
lity
unconditional dispersalC
0
0 0.0
0.2
0.4
0.6
0.8
1.0
2040
6080
100
50000
0.001
coop. 100% of runs
0
0 0.0
0.2
0.4
0.6
0.8
1.0
2040
6080
100
50000
0.01
coop. 100% of runs
0
0 0.0
0.2
0.4
0.6
0.8
1.0
2040
6080
100
50000
0.02
coop. 100% of runs
0
0.0
0.2
0.4
0.6
0.8
1.0
50000
0.06
coop. 0% of runs
0
0.0
0.2
0.4
0.6
0.8
1.0
0.0
0.2
0.4
0.6
0.8
1.0
0.0
0.2
0.4
0.6
0.8
1.0
50000
0.1
coop. 0% of runs
meancooperativeness
realised dispersalprobability
realised settlementprobabilityruns
mean
runs
mean
runs
Figure 6.A1 ff f f fEffect of the cost-benefit ratio on the evolution of cooperation under various dispersaland settlement scenarios. Evolution of cooperativeness (blue), mean dispersal rate (red) and meansettlement rate (orange) for six cost-benefit ratios and four dispersal scenarios: (A) fixed dispersalprobability (d = 0.08) and fixed settlement probability (s = 1.0); (B) evolvable conditional disper-sal strategy and fixed settlement probability; (C) fixed dispersal probability and evolvable condi-tional settlement strategy; (D) evolvable conditional dispersal and settlement strategies. Each plotshows 5 randomly selected replicate simulation runs (dashed lines) and their means (bold lines).Left y-axis: cooperativeness (ranging either from 0 to 100 or from 0 to 1, see highlight); right y-axis: probability of dispersal or settlement The figures in the top left corner of each plot give thepercentage of 100 simulation runs resulting in the evolution of cooperation. For each scenario, thethree left-most panels (c/b = 0.0001, 0.001, 0.01) correspond to a public goods game that is nosocial dilemma, while the two right-most panels (c/c b = 0.06, 0.1) refer to social dilemma situations(highlighted with gray background). The fourth panel is the borderline case c/c b = 1/N// = 0.02.
A.Ivens-diss 16-10-2012 11:14 Pagina 130
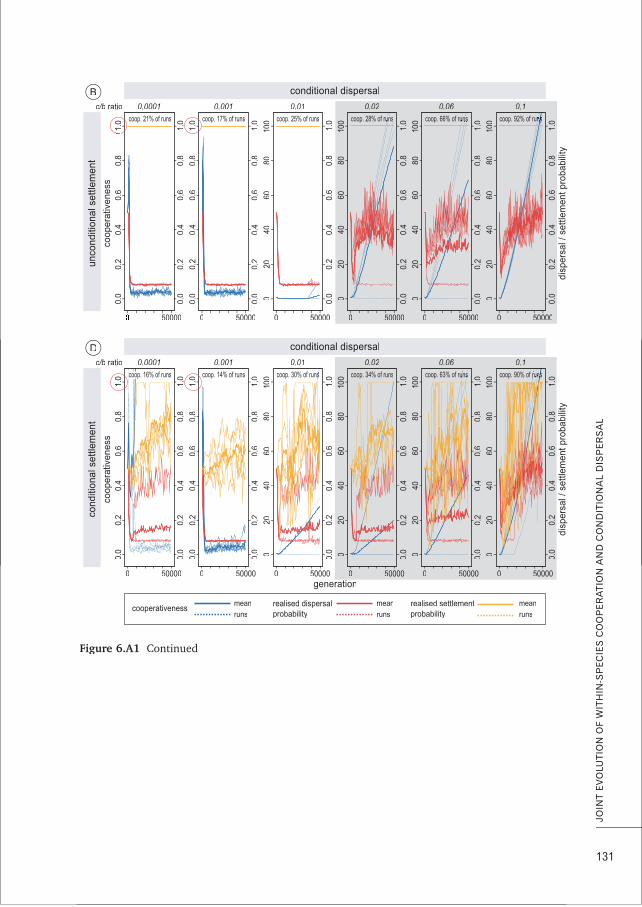
131
JOIN
T E
VO
LUTI
ON
OF
WIT
HIN
-SP
EC
IES
CO
OP
ER
ATI
ON
AN
D C
ON
DIT
ION
AL
DIS
PE
RS
AL
generation
meancooperativeness
realised dispersalprobability
realised settlementprobabilityruns
mean
runs
mean
runs
0.0
0.2
0.4
0.6
0.8
1.0
50000
c/b ratio 0.0001
coop. 21% of runs
coop
erat
iven
ess
unco
nditi
onal
set
tlem
ent
disp
ersa
l / s
ettle
men
t pro
babi
lity
conditional dispersalB
0
0.0
0.2
0.4
0.6
0.8
1.0
0.0
0.2
0.4
0.6
0.8
1.0
0.0
0.2
0.4
0.6
0.8
1.0
50000
0.001
coop. 17% of runs
0
0 0.0
0.2
0.4
0.6
0.8
1.0
2040
6080
100
50000
0.01
coop. 25% of runs
0
0 0.0
0.2
0.4
0.6
0.8
1.0
2040
6080
100
50000
0.02
coop. 28% of runsuns
0
0 0.0
0.2
0.4
0.6
0.8
1.0
2040
6080
100
50000
0.06
coop. 66% of runsuns
0
0 0.0
0.2
0.4
0.6
0.8
1.0
2040
6080
100
50000
0.1
coop. 92% of runsnsns
0
0.0
0.2
0.4
0.6
0.8
1.0
50000
c/b ratio 0.0001
coop. 16% of runscoo
coop
erat
iven
ess
cond
ition
al s
ettle
men
t
disp
ersa
l / s
ettle
men
t pro
babi
lity
conditional dispersalD
0
0.0
0.2
0.4
0.6
0.8
1.0
0.0
0.2
0.4
0.6
0.8
1.0
0.0
0.2
0.4
0.6
0.8
1.0
50000
0.001
coop. 14% of runs
0
0 0.0
0.2
0.4
0.6
0.8
1.0
2040
6080
100
50000
0.01
coop. 30% of runss
0
0 0.0
0.2
0.4
0.6
0.8
1.0
2040
6080
100
50000
0.02
coop. 34% of runs
0
0 0.0
0.2
0.4
0.6
0.8
1.0
2040
6080
100
50000
0.06
coop. 63% of runsuns
0
0 0.0
0.2
0.4
0.6
0.8
1.0
2040
6080
100
50000
0.1
coop. 90% of runsrunns
Figure 6.A1 Continued
A.Ivens-diss 16-10-2012 11:14 Pagina 131
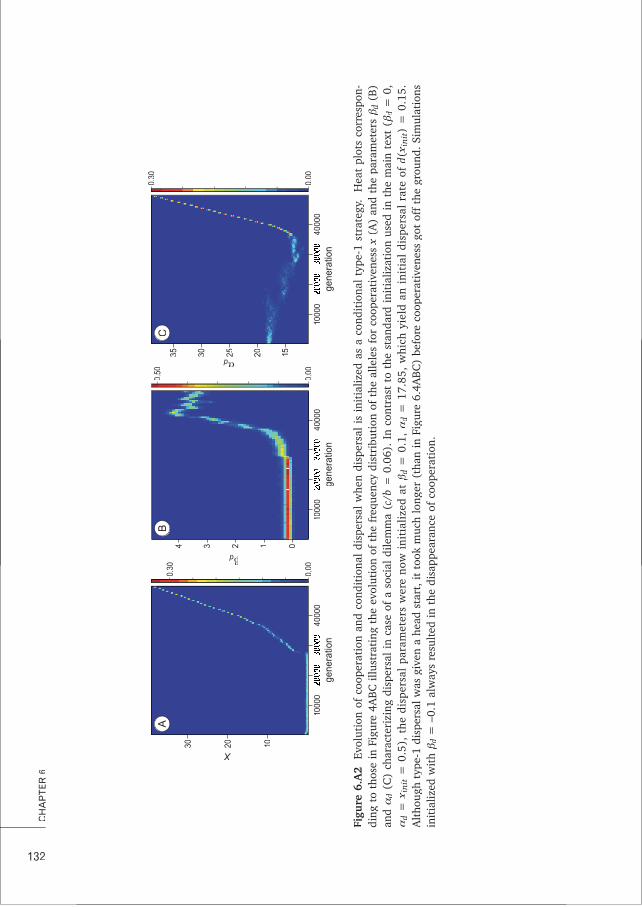
132
CH
AP
TER
6
gene
ratio
n10
000
4000
030
000
0.00
0.30
2030 10
XA
gene
ratio
n10
000
4000
030
000
0
0.00
0.50
1234
βd
B
gene
ratio
n10
000
4000
030
000
0.00
00.30
0
20253035 15αd
C
Figu
re 6
.A2
fEv
olut
ion
of c
oope
rati
on a
nd c
ondi
tion
al d
ispe
rsal
whe
n di
sper
sal
is i
niti
aliz
ed a
s a
cond
itio
nal
type
-1 s
trat
egy.
H
eat
plot
sco
rres
pon-
ding
to
thos
e in
Fig
ure
4AB
C il
lust
rati
ng t
he e
volu
tion
of
the
freq
uenc
y di
stri
buti
on o
f th
e al
lele
s fo
r co
oper
ativ
enes
s x
(A)
and
the
para
met
ers
β dβ(B
)an
dα
dα
(C)
char
acte
rizi
ng d
ispe
rsal
in
case
of
a so
cial
dile
mm
a (c
/cb
= 0
.06)
. In
con
tras
t to
the
sta
ndar
d in
itia
lizat
ion
used
in
the
mai
n te
xt (
β dβ=
0,
αd
α=
x ini
t=
0.5
), t
he d
ispe
rsal
par
amet
ers
wer
e no
w i
niti
aliz
ed a
t β dβ
= 0
.1,
αd
α=
17.
85,
whi
ch y
ield
an
init
ial
disp
ersa
l ra
te o
f d(
x ini
t) =
0.1
5.AA
ltho
ugh
type
-1 d
ispe
rsal
was
giv
en a
hea
d st
art,
it t
ook
muc
h lo
nger
(th
an in
Fig
ure
6.4A
BC
) be
fore
coo
pera
tive
ness
got
off
the
gro
und.
Sim
ulat
ions
init
ializ
ed w
ith
β dβ=
–0.
1 al
way
s re
sult
ed in
the
dis
appe
aran
ce o
f co
oper
atio
n.
A.Ivens-diss 16-10-2012 11:14 Pagina 132
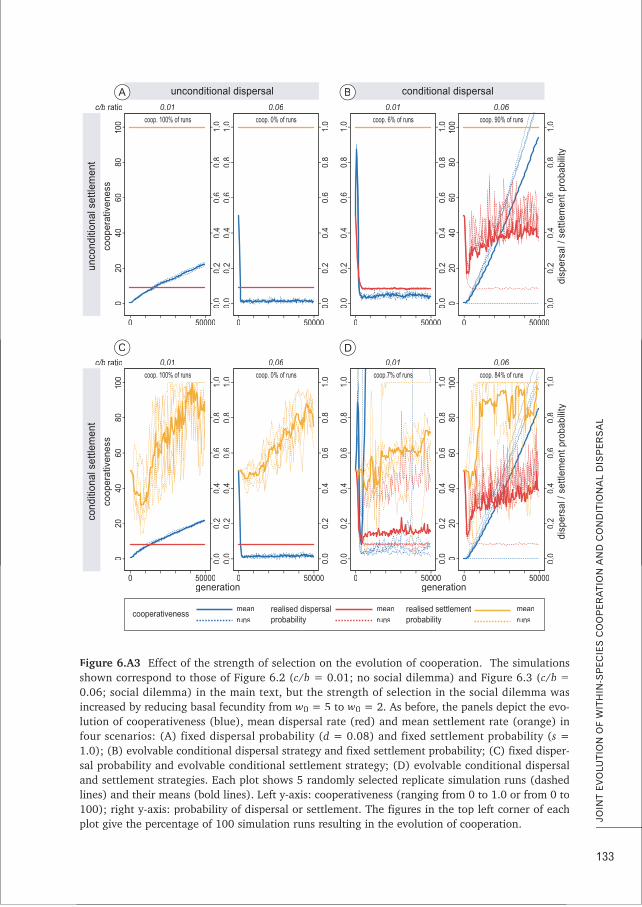
133
JOIN
T E
VO
LUTI
ON
OF
WIT
HIN
-SP
EC
IES
CO
OP
ER
ATI
ON
AN
D C
ON
DIT
ION
AL
DIS
PE
RS
AL
0
0 0.0
0.2
0.4
0.6
0.8
1.0
2040
6080
100
50000
c/b ratio 0.01
coop. 100% of runs
coop
erat
iven
ess
unco
nditi
onal
set
tlem
ent
disp
ersa
l / s
ettle
men
t pro
babi
lity
unconditional dispersalA
00.
00.
20.
40.
60.
81.
050000
0.06
coop. 0% of runs
0
0.0
0.2
0.4
0.6
0.8
1.0
0.0
0.2
0.4
0.6
0.8
1.0
0.0
0.2
0.4
0.6
0.8
1.0
0.0
0.2
0.4
0.6
0.8
1.0
0.0
0.2
0.4
0.6
0.8
1.0
50000
0.01
coop. 6% of runs
conditional dispersal
0
0 0.0
0.2
0.4
0.6
0.8
1.0
2040
6080
100
50000
0.06
coop. 90% of runs
meancooperativeness
realised dispersalprobability
realised settlementprobabilityruns
mean
runs
mean
runs
B
0
0 0.0
0.2
0.4
0.6
0.8
1.0
2040
6080
100
50000
c/b ratio 0.01
coop. 100% of runs
coop
erat
iven
ess
cond
ition
al s
ettle
men
t
disp
ersa
l / s
ettle
men
t pro
babi
lity
C
0
0.0
0.2
0.4
0.6
0.8
1.0
50000
0.06
coop. 0% of runs
0
0.0
0.2
0.4
0.6
0.8
1.0
50000
0.01
coop.7% of runs
0
0 0.0
0.2
0.4
0.6
0.8
1.0
2040
6080
100
50000
0.06
coop. 84% of runs
D
generation generation
Figure 6.A3 ff f f fEffect of the strength of selection on the evolution of cooperation. The simulationsshown correspond to those of Figure 6.2 (c/b = 0.01; no social dilemma) and Figure 6.3 (c/b =0.06; social dilemma) in the main text, but the strength of selection in the social dilemma wasincreased by reducing basal fecundity from w0 = 5 to w0 = 2. As before, the panels depict the evo-lution of cooperativeness (blue), mean dispersal rate (red) and mean settlement rate (orange) infour scenarios: (A) fixed dispersal probability (d = 0.08) and fixed settlement probability (s =1.0); (B) evolvable conditional dispersal strategy and fixed settlement probability; (C) fixed disper-sal probability and evolvable conditional settlement strategy; (D) evolvable conditional dispersaland settlement strategies. Each plot shows 5 randomly selected replicate simulation runs (dashedlines) and their means (bold lines). Left y-axis: cooperativeness (ranging from 0 to 1.0 or from 0 to100); right y-axis: probability of dispersal or settlement. The figures in the top left corner of eachplot give the percentage of 100 simulation runs resulting in the evolution of cooperation.
A.Ivens-diss 16-10-2012 11:14 Pagina 133

A.Ivens-diss 16-10-2012 11:14 Pagina 134

fDoes the joint evolution of cooperativenessand conditional dispersal promotethe evolution of mutualism?
A k B F IAniek B.F. IvensIdo PenJacobus J. BoomsmaFranz J. Weissing
CH
AP
TER77
A.Ivens-diss 16-10-2012 11:14 Pagina 135
136
CH
AP
TER
7
Mutually beneficial interactions between species are common andof considerable ecological importance, but the evolutionary stabil-ity of such relationships is not well understood. This is becausecostly cooperation can be exploited by cheaters reaping the bene-fits without offering much, if anything in return. It has been arguedthat partner choice (actively selecting cooperative interaction part-ners) and partner fidelity (continuing profitable relationships andabandoning unprofitable ones) might promote the evolution ofmutualism. Here we use individual-based simulations to investi-gate whether and under which circumstances the joint evolution ofcooperativeness, partner choice and partner fidelity does indeedresult in a mutualistic outcome. Our model considers a patch-struc-tured environment with fixed patch size where individuals of twospecies interact locally by producing costly commodities that arebeneficial for the patch members of the other species. Productionrate of the commodity (‘cooperativeness’), conditional dispersalstrategy (‘partner fidelity’), and conditional settlement strategy(‘partner choice’) are all heritable traits that jointly evolve in bothspecies. To make the results comparable with an earlier model forthe evolution of intraspecific cooperation, we focused on a sym-metric scenario where species have identical life histories andfitness parameters. We show that interspecific cooperation canevolve, but only under extremely low cost-benefit ratios. Whenthese conditions are met, both conditional dispersal and condi-tional settlement promote cooperation and have a synergisticeffect. The evolved pattern of dispersal is opposite to the commonassumption in models of partner fidelity that individuals will stayin cooperative patches and leave uncooperative patches. Weexplain this finding by the strong local competition in patcheswhere productivity is high. Although the two species considered inour model were identical, evolved patterns of cooperation weretypically unilateral, with one species contributing a lot and theother very little. This matches the observation that many naturalmutualisms exhibit a strong asymmetry between partners.
AAABSTRACT
A.Ivens-diss 16-10-2012 11:14 Pagina 136
INTRODUCTION
Mutualistic cooperation between species is widespread and of major importance tocomplex life (Leigh 2010). Mutually beneficial interactions range from ancient endosym-bionts that evolved into organelles such as mitochondria and plasmids, to pollination net-wworks that help stabilizing ecosystems (Margulis 1971; Stachowicz 2001; Bastolla et al.2009). The emergence and evolutionary stability of mutualisms are, however, not wellunderstood. How can species evolve to invest into costly helping of other species, whereasthe benefits could also be reaped for free by exploiting the other species as a parasite(Herre et al. 1999; Bronstein 2001; Bergstorm et al. 2002; Leigh 2010)? Conditionalbehaviour is assumed to play a major role in the evolution of interspecific cooperation.The two most important mechanisms of conditional dispersal are partner fidelity, theoption to either continue or abandon current interactions and partner choice, the option toonly engage in interactions with selected partners (Bull & Rice 1991; Foster & Wenseleers2006). By inducing positive assortment between cooperators of both interacting species,partner choice and partner fidelity might pave the way for the evolution of cooperation(Nowak & May 1992; Frank 1994; Pepper & Smuts 2002; Foster & Wenseleers 2006).
Several modeling studies (Sherratt & Roberts 1998; Ichinose & Arita 2008; McNamaraet al. 2008) have shown that conditional dispersal can promote cooperation between indi-viduals of the same species. However, most of these models considered a restricted set ofviduals of the same species. However, most of these models considered a restricted set ofcooperation and/or dispersal strategies. In a previous study (Chapter 6), we considered amore flexible strategic structure. We showed that the joint evolution of cooperativenessand conditional dispersal can both promote (for high cost-benefit ratios) and impede (forlow cost-benefit ratios) the evolution of cooperation in a public goods game. Cooperationdid only evolve when the (jointly evolving) conditional dispersal strategy was opposite tothe pattern included a priori in earlier models: individuals tend to leave cooperativepatches and to stay in non-cooperative patches. This counter-intuitive result can beexplained by the fact that the beneficial effects of local cooperation are annihilated by theintense local competition in cooperative and, hence, productive environments. If localcooperation induces intense local competition, it makes perfect sense to leave cooperativepatches. In our model (Chapter 6), the strong link between local cooperation and localcompetition was caused by the fact that patch sizes were constant. The outcome mighthave been different in case of local resource enhancement, that is, if local competitionwwould have a positive effect on local carrying capacities. Yet, our study illustrates that therole of partner choice and partner fidelity is less straightforward than has been suggested.
Only a limited number of studies has so far focused on the interplay between dispersaland the evolution of inter-specific cooperation. In a model of pair-wise interactionsbetween two species inhabiting dual lattices it was shown that mutualism can only evolvewwhen dispersal distances are limited (Yamamura et al. 2004), a result that was confirmedfor joint evolution of cooperativeness and dispersal distance (Mack 2012) and for evolvingcost-benefit ratios (Doebeli & Knowlton 1998). In these models, dispersal was uncondi-tional and the results could be explained by positive assortment of cooperators. However,Doebeli & Knowlton (1998) also showed that the likelihood of mutualistic evolutionincreased when hosts were allowed to take along symbionts that had previously experi-
137
JOIN
T E
VO
LUTI
ON
OF
MU
TUA
LIS
M A
ND
CO
ND
ITIO
NA
L D
ISP
ER
SA
L
A.Ivens-diss 16-10-2012 11:14 Pagina 137
enced a satisfyingly cooperative interaction. Such conditional association with cooperativepartners has also been shown to promote mutualism in an asymmetric model of joint evo-lution of partner choice in a choosy host and cooperativeness of both hosts and symbionts(Foster & Kokko 2006). In addition, the fitness calculations of Foster & Wenseleers (2006)suggest that mutualism evolves most readily when both species can actively select theirpartners through partner fidelity and partner choice.
Hitherto, the interplay between dispersal and mutualism has mostly been studied forunconditional dispersal and when dispersal was conditional, individuals were a prioriassumed move away from non-cooperators and/or towards cooperators. In the model pre-sented here, we explore the joint evolution of conditional dispersal and cooperativeness intwo interacting species without a priori assumptions about the evolving response strate-gies. Our model considers species that both produce a commodity that is beneficial for theother species (following Foster & Wenseleers 2006), a setup that differs from previous pair-wwise cooperation models (Doebeli & Knowlton 1998; Yamamura et al. 2004; Mack 2012)in that local exchange of goods is represented by an interspecific public goods model. Afterthe exchange of goods, individuals may choose to disperse from their local patch condi-tional upon the cooperativeness received. Such a conditional strategy may result in partnerfidelity. Likewise, dispersing individuals can decide whether to settle in a new patchdependent on the cooperativeness of the partner species in that patch, which is equivalentto partner choice. Our aim was to investigate what dispersal patterns results from the jointevolution of conditional dispersal and cooperation and whether these patterns promote
ythe evolution of stable inter-specific cooperation. In our simulations, we focus on a fullysymmetric interaction. This allows us to compare the results with those on intraspecificcooperation (Chapter 6) and to study the question whether asymmetric species interac-tions will evolve from symmetric starting conditions.
THE MODEL
OverviewIn a previous model (Chapter 6), we studied the joint evolution of individual cooperative-ness and conditional dispersal in a single species. To allow for a comparison of the evolu-tion of within- and between-species cooperation, we here consider a straightforwardextension of that earlier model assuming a patch structured environment that is inhabitedby species A and B. Generations are discrete and non-overlapping, and both species have asimilar life cycle. In a first stage, the interaction phase, individuals play a local cooperationgame in which patch members of each species benefit from a commodity produced by theindividuals of the other species. Producing this commodity is costly and would hence beselected against in a well-mixed population. The net effect of these costs and the benefitsreceived from the members of the other species determines an individual’s condition,wwhich in turn affects its future fecundity in the patch where it will reproduce. In a secondstage, the dispersal phase, the individuals of both species may redistribute over thepatches. Individuals can make their decisions on whether to leave a patch after evaluatingthe average ‘cooperativeness’ of the other species (i.e., the amount of commodities pro-
138
CH
AP
TER
7
A.Ivens-diss 16-10-2012 11:14 Pagina 138
vvided by the patch members of other species). Likewise, they can let their decision onwwhether to settle in a potential target patch depend on the cooperativeness of the otherspecies there during the interaction phase. Both dispersal and rejection of target patcheshave mortality costs. In the third and final stage, reproduction, inheritance and populationregulation takes place. All individuals settling in a patch (locals and immigrants) produceoffspring in proportion to their condition, which reflects the costs and benefits experiencedin the interaction phase. After reproduction, the parents die and the offspring of eachspecies compete for a fixed number (NAN and NBN , respectively) of positions in their natalpatch. The successful individuals of both species enter a new interaction phase and theremaining individuals die, i.e. are removed from both populations.
As in the earlier model, an individual’s cooperativeness and its tendencies to disperseand settle elsewhere are heritable strategies that are transmitted from parents to offspring,subject to occasional mutations. Hence, these strategies jointly evolve within each species,and the two species co-evolve over the generations. We considered four scenarios: (1) thedispersal and settlement rates are constant in both species and the same for all individuals(i.e., not heritable); (2) dispersal decisions in both species are based on an evolvable con-ditional strategy; (3) the settlement rule in both species is based on an evolvable condi-tional strategy; (4) dispersal and settlement in both species are heritable conditionalstrategies. The question addressed is whether and under what circumstances conditionaldispersal and settlement will favour the evolution of interspecific cooperation.
Interaction phaseEach individual i of species A has a genetically determined ‘cooperativeness’ xi, which rep-resents the contribution of i fto a commodity X that is beneficial for i’s patch members ofspecies B. The total contribution in a given patch, xtot = ∑xi , is distributed over the indi-vviduals of species B, yielding an individual share x–B = 1–NB
xtot per patch member of speciesB. Likewise, an individual j of species B has a heritable tendency to contribute an amountyyjy Ato a commodity Y beneficial for the other species; each patch member of species Areceives a share y–B =
1–NBytot of the total contribution ytot = ∑yi . cAc and cB represent the
respective fecundity costs for the two species per unit of investment, and bAb and bB denotefthe respective fecundity benefits per unit of commodity received, so that the fecundities of
focal individuals i and j are given by:
ViVV = VAVV + bAb y–Ayy – cAc xi (7.1)WjWW = WBW + bB x–B – cBc yjy
Here VAVV and WBW denote the baseline fecundities of the members of species A and B, respec-tively. Throughout, we will only consider the case where the two species are fully symmet-ric with respect to their fitness parameters: cAc = cBc = c, bAb = bB = b, VAVV = WBW , and NAN =NNBN = N f. In our model, only relative fecundities (in comparison to other patch members ofthe same species) are important. We can therefore normalize fecundities by dividing allterms in equation (7.1) by b:
139
JOIN
T E
VO
LUTI
ON
OF
MU
TUA
LIS
M A
ND
CO
ND
ITIO
NA
L D
ISP
ER
SA
L
A.Ivens-diss 16-10-2012 11:14 Pagina 139
vi = vAv + y–Ayy –(c/c b)xi , (7.2)wjw = wBw + x–B –(c/c b)yjy
wwhere v = V/V b and w = W/W b. In our simulations, we will systematically vary the cost-benefit ratio c/c b while keeping the normalized baseline fecundities fixed at vAv = wBw = 5.
Dispersal and settlementIn the dispersal phase, each individual has the opportunity to leave its patch of origin.Depending on the scenario considered, the dispersal probability d is either constant (d =0.15; the value predicted by Taylor (1988)) or an evolvable conditional strategy where anindividual’s dispersal probability is made dependent on the cooperativeness of the patchmembers of the other species. As in Chapter 6, we consider conditional strategies that aregiven by a logistic function. Individuals of species A make their probability to leave thenatal patch dependent on y–Ayy , i.e. on their share in the commodity Y produced by the patchmembers of species B:
d(y–Ayy ) = 1 . (7.3)1 + exp(– βd · ( y–Ayy – αdα ))
Here αd and βd are heritable parameters that characterize the individual’s ‘norm of reac-tion’ (see Figure 6.1). If an individual harbours a positive βd (‘type 1’ strategy), it has thetendency to leave productive patches (large values of y–Ayy ), while individuals with a nega-tive βd (‘type 2’) tend to leave patches with a low productivity. When βd is large in absolutevvalue, the dispersal strategy approaches an all-or-nothing strategy, where an individual willalways leave or always stay, depending on whether y–Ayy is larger or smaller than αd.Similarly, the dispersal tendency of members of species B is determined by evolvableparameters αdα and βd , but now the dispersal decision depends on x–B and thus on the coop-erativeness of the patch members of species A.
Dispersing individuals encounter patches at random. Depending on the settlement sce-nario considered they either settle on the first patch encountered or they base their settle-ment decision on an evolvable conditional evaluation of candidate patches. In the lattercase, the probability to settle in a candidate target patch depends on the cooperativeness
yof the other species in that patch. For an individual of species A, the settlement probabilityis given by:
s(y–Ayy ) = 1 (7.4)1 + exp(– β s · ( y–Ayy – αs))
wwhere again αs and βs are heritable parameters. Similarly, individuals of species B maketheir settlement decisions depending on x–B .
Dispersal and the rejection of patches are costly: the viability of dispersing individualsis reduced by a factor 1 – md, while each time that a possible target patch is rejected thevviability is further reduced by a factor 1 – ms . Dispersal-related mortality md and rejection-related mortality ms were assumed to be the same for both species and given md = 0.1 andms = 0.001.
140
CH
AP
TER
7
A.Ivens-diss 16-10-2012 11:14 Pagina 140
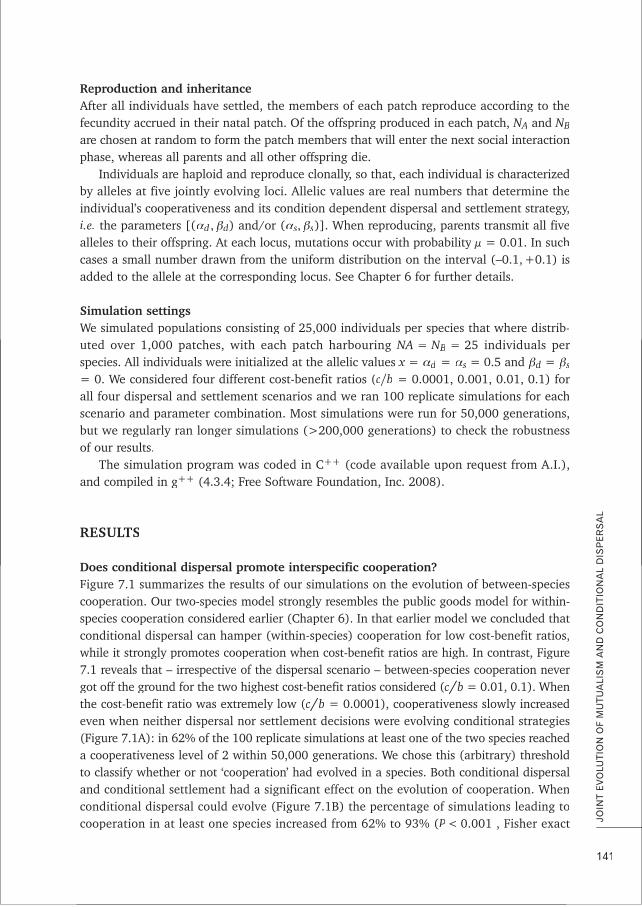
Reproduction and inheritanceRRAAfter all individuals have settled, the members of each patch reproduce according to thefecundity accrued in their natal patch. Of the offspring produced in each patch, NAN and NBNare chosen at random to form the patch members that will enter the next social interactionphase, whereas all parents and all other offspring die.
Individuals are haploid and reproduce clonally, so that, each individual is characterizedby alleles at five jointly evolving loci. Allelic values are real numbers that determine theindividual’s cooperativeness and its condition dependent dispersal and settlement strategy,i.e. the parameters [(αdα , βd) and/or (αs, βs)]. When reproducing, parents transmit all fivealleles to their offspring. At each locus, mutations occur with probability μ = 0.01. In suchcases a small number drawn from the uniform distribution on the interval (–0.1, +0.1) isadded to the allele at the corresponding locus. See Chapter 6 for further details.
Simulation settingsWe simulated populations consisting of 25,000 individuals per species that where distrib-uted over 1,000 patches, with each patch harbouring NA = NBN = 25 individuals perspecies. All individuals were initialized at the allelic values x = αdα = αs = 0.5 and βd = βs
= 0. We considered four different cost-benefit ratios (c/c b = 0.0001, 0.001, 0.01, 0.1) forall four dispersal and settlement scenarios and we ran 100 replicate simulations for eachscenario and parameter combination. Most simulations were run for 50,000 generations,but we regularly ran longer simulations (>200,000 generations) to check the robustnessof our results.
The simulation program was coded in C++ (code available upon request from A.I.),and compiled in g++ (4.3.4; Free Software Foundation, Inc. 2008).
RESULTS
Does conditional dispersal promote interspecific cooperation?Figure 7.1 summarizes the results of our simulations on the evolution of between-speciescooperation. Our two-species model strongly resembles the public goods model for within-species cooperation considered earlier (Chapter 6). In that earlier model we concluded thatconditional dispersal can hamper (within-species) cooperation for low cost-benefit ratios,wwhile it strongly promotes cooperation when cost-benefit ratios are high. In contrast, Figure7.1 reveals that – irrespective of the dispersal scenario – between-species cooperation nevergot off the ground for the two highest cost-benefit ratios considered (c/c b = 0.01, 0.1). Whenthe cost-benefit ratio was extremely low (c/c b = 0.0001), cooperativeness slowly increasedeven when neither dispersal nor settlement decisions were evolving conditional strategies(Figure 7.1A): in 62% of the 100 replicate simulations at least one of the two species reacheda cooperativeness level of 2 within 50,000 generations. We chose this (arbitrary) thresholdto classify whether or not ‘cooperation’ had evolved in a species. Both conditional dispersaland conditional settlement had a significant effect on the evolution of cooperation. Whenconditional dispersal could evolve (Figure 7.1B) the percentage of simulations leading tocooperation in at least one species increased from 62% to 93% (P < 0.001 , Fisher exact
141
JOIN
T E
VO
LUTI
ON
OF
MU
TUA
LIS
M A
ND
CO
ND
ITIO
NA
L D
ISP
ER
SA
L
A.Ivens-diss 16-10-2012 11:14 Pagina 141
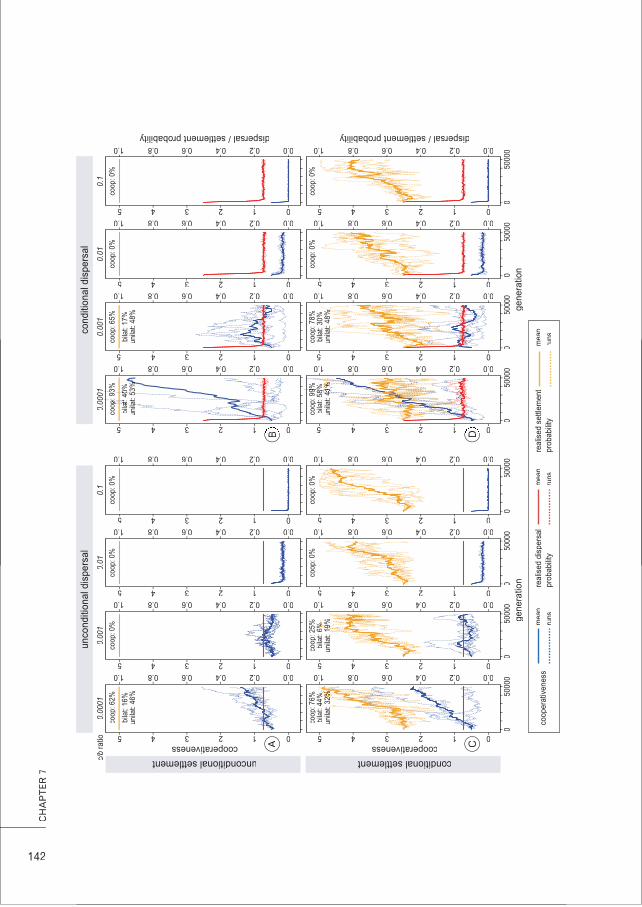
142
CH
AP
TER
7
0
0.00.20.40.60.81.0
12345
c/b
ratio
0.00
01
coop
: 62%
bila
t: 16
%un
ilat:
46%
cooperativeness
unconditional settlement
dispersal / settlement probability
unco
nditi
onal
dis
pers
al
A
gene
ratio
nge
nera
tion
0
0.00.20.40.60.81.0
12345
0.00
1
coop
: 0%
0
0.00.20.40.60.81.0
12345
0.01
coop
: 0%
0
0.00.20.40.60.81.0
12345
0.1
coop
: 0%
0.00.20.40.60.81.0
0.00
0100
01
coop
: 93%3
p
bila
t: 40
%0at
:un
ilat:
53%
5a
%%
cond
ition
al d
ispe
rsal
B
0.00.20.40.60.81.0
012345
012345
B
0.00
1
coop
: 65%
bila
t: 17
%un
ilat:
48%
0
0.00.20.40.60.81.0
12345
0.01
coop
: 0%
0
0.00.20.40.60.81.0
12345
0.1
coop
: 0%
00
0.00.20.40.60.81.0
12345
5000
0
coop
: 76%
bila
t: 44
%44
%un
ilat:
32%
32%
cooperativeness
conditional settlement
dispersal / settlement probability
00
0.00.20.40.60.81.0
12345
5000
0
coop
: 25%
bila
t: 6%%
unila
t: 19
%19
%
00
0.00.20.40.60.81.0
12345
5000
0
coop
: 0%
00
0.00.20.40.60.81.0
12345
5000
0
coop
: 0%
0
0.00.20.40.60.81.0
5000
0
coop
: 99%9
bila
t: 58
%88un
ilat:
41%
41%
41%
D
0
0.00.20.40.60.81.0
012345
012345D
5000
0
coop
: 78%
bila
t: 30
%un
ilat:
48%
at: 4
8%
00
0.00.20.40.60.81.0
12345
5000
0
coop
: 0%
00
0.00.20.40.60.81.0
12345
5000
0
coop
: 0%
mea
nco
oper
ativ
enes
sre
alis
ed d
ispe
rsal
prob
abili
tyre
alis
ed s
ettle
men
tpr
obab
ility
runs
mea
n
runs
mea
n
runs
C
A.Ivens-diss 16-10-2012 11:14 Pagina 142

test), while the percentage increased to 76% when conditional settlement could evolve(Figure 7.1C; P < 0.016, Fisher exact test). Conditional dispersal and conditional settle-ment had a synergistic effect in that the percentage of simulations leading to cooperationwwhen both were conditional increased to 99% (Figure 7.1D; P < 0.015 for the comparisonof 93% and 99%, Fisher exact test). In contrast, the evolution of conditional settlementhad no marked effect on the evolution of within-species cooperativeness (Chapter 6).
For the intermediate cost-benefit ratio FF c/c b = 0.001 (which is still very low) the simula-tion results were somewhat mixed. In the absence of conditional dispersal and conditionalsettlement (Figure 7.1A), the cooperativeness of both species stayed well above zero in allsimulations, but no species reached the threshold criterion of 2. The percentage of cooper-ation increased to 25% in case of conditional settlement (Figure 7.1C; P < 0.001, binomialtest), to 65% in case of conditional dispersal (Figure 7.1B; P < 0.001, binomial test), andto 78% in case of conditional dispersal and conditional settlement (Figure 7.1D; P < 0.021,Fisher exact test). However, in none of the simulations did cooperativeness reach highlevels, and the occasional (small) outbursts in cooperativeness were in all cases followedby a subsequent drop in cooperativeness to small values.
Since consistent and sizeable cooperation levels only evolved when the cost-benefitratio was extremely low (c/b = 0.0001), we will focus on this case for the rest of thispaper. In view of equation (7.2), between-species cooperation is very ‘cheap’ in this case,because even if an individual contributes 10 units to the commodity that is beneficial tothe other species (a value that was almost never reached in our simulations), the loss infecundity (0.001) is minute in comparison to the baseline fecundity (vAv = wB = 5). Onemight therefore suspect that evolution is largely governed by random factors (genetic driftand mutation), but this does not seem to be the case. When simulations were run for alonger period (Figure 7.2 shows two representative examples), the evolution of coopera-tiveness showed a clear trend that was only marginally affected by stochastic fluctuations.As we will show below, stochasticity was mainly important for determining which kind ofAs we will show below, stochasticity was mainly important for determining which kind ofstrategies evolved in the two species in a given simulation run.
Evolution of asymmetric species interactionsTo make our results comparable with the situation of within-species cooperation consid-ered earlier, we consider two species that are identical in all respects, including fitness
143
JOIN
T E
VO
LUTI
ON
OF
MU
TUA
LIS
M A
ND
CO
ND
ITIO
NA
L D
ISP
ER
SA
L
Figure 7.1 (left) ff f f f fEffect of the cost-benefit ratio on the evolution of interspecific cooperation underdifferent dispersal and settlement scenarios. Evolution of cooperativeness (blue), mean dispersalpprobability (red) and mean settlement probability (orange) for four cost-benefit ratios and four dis-ppersal scenarios: (A) fixed dispersal probability (d = 0.15) and fixed settlement probability (s =1.0); (B) evolvable conditional dispersal strategy and fixed settlement probability; (C) fixed disper-sal probability and evolvable conditional settlement strategy; (D) evolvable conditional dispersaland settlement strategies. Each plot shows 5 randomly selected replicate simulation runs (dashedlines) and their means (bold lines). Left y-axis: cooperativeness; right y-axis: probability of disper-
ffsal and settlement in a new patch. The graphs in the top of each panel refer to the percentage of100 simulation runs during 50,000 generations where the cooperativeness of one or both speciesexceeded the (arbitrary) threshold value of 2, meaning that we obtained: ‘cooperation’, when atleast one species exceeded the threshold; ‘bilateral cooperation’, when both species exceed thethreshold; and ‘unilateral cooperation’, when only one species exceeded the threshold.
A.Ivens-diss 16-10-2012 11:14 Pagina 143
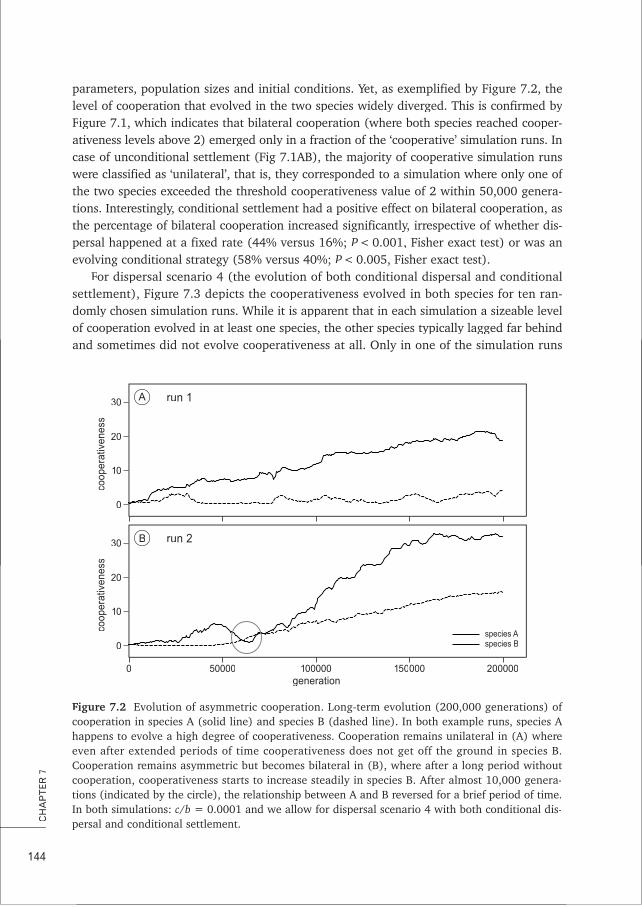
parameters, population sizes and initial conditions. Yet, as exemplified by Figure 7.2, theylevel of cooperation that evolved in the two species widely diverged. This is confirmed by
Figure 7.1, which indicates that bilateral cooperation (where both species reached cooper-ativeness levels above 2) emerged only in a fraction of the ‘cooperative’ simulation runs. Incase of unconditional settlement (Fig 7.1AB), the majority of cooperative simulation runswere classified as ‘unilateral’, that is, they corresponded to a simulation where only one ofwere classified as ‘unilateral’, that is, they corresponded to a simulation where only one ofthe two species exceeded the threshold cooperativeness value of 2 within 50,000 genera-tions. Interestingly, conditional settlement had a positive effect on bilateral cooperation, asthe percentage of bilateral cooperation increased significantly, irrespective of whether dis-persal happened at a fixed rate (44% versus 16%; P < 0.001, Fisher exact test) or was anevolving conditional strategy (58% versus 40%; P < 0.005, Fisher exact test).
For dispersal scenario 4 (the evolution of both conditional dispersal and conditionalsettlement), Figure 7.3 depicts the cooperativeness evolved in both species for ten ran-domly chosen simulation runs. While it is apparent that in each simulation a sizeable levelof cooperation evolved in at least one species, the other species typically lagged far behindand sometimes did not evolve cooperativeness at all. Only in one of the simulation runs
144
CH
AP
TER
7
0
0
10
20
30
100000 150000 20000050000generation
run 2
coop
erat
iven
ess
species A
B
0
10
20
30 run 1
coop
erat
iven
ess
A
species B
Figure 7.2 fff fEvolution of asymmetric cooperation. Long-term evolution (200,000 generations) ofAcooperation in species A (solid line) and species B (dashed line). In both example runs, species Acooperation in species A (solid line) and species B (dashed line). In both example runs, species A
hhappens to evolve a high degree of cooperativeness. Cooperation remains unilateral in (A) whereeven after extended periods of time cooperativeness does not get off the ground in species B.Cooperation remains asymmetric but becomes bilateral in (B), where after a long period withoutcooperation, cooperativeness starts to increase steadily in species B. After almost 10,000 genera-tions (indicated by the circle), the relationship between A and B reversed for a brief period of time.In both simulations: c/c b = 0.0001 and we allow for dispersal scenario 4 with both conditional dis-ppersal and conditional settlement.
A.Ivens-diss 16-10-2012 11:14 Pagina 144
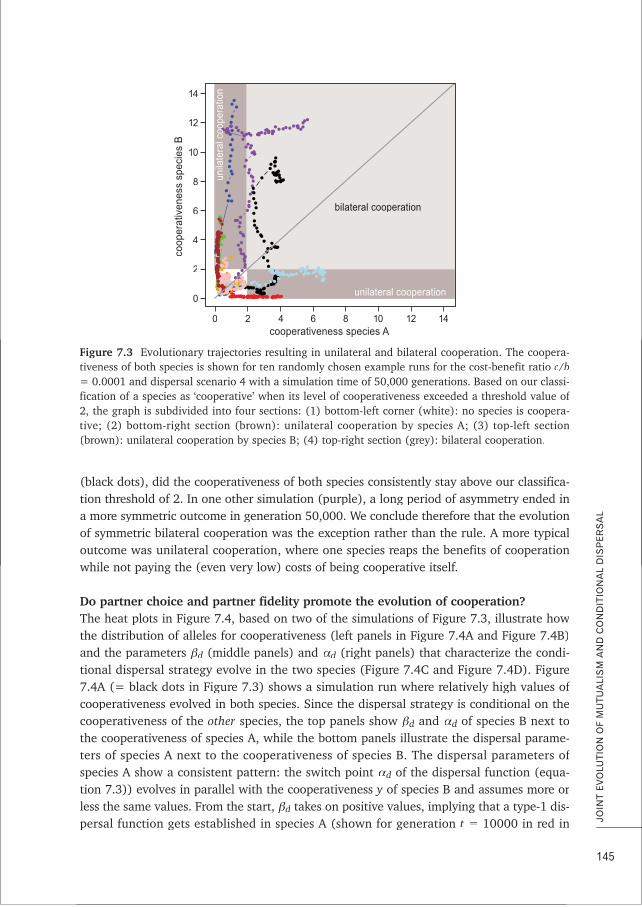
(black dots), did the cooperativeness of both species consistently stay above our classifica-tion threshold of 2. In one other simulation (purple), a long period of asymmetry ended ina more symmetric outcome in generation 50,000. We conclude therefore that the evolutionof symmetric bilateral cooperation was the exception rather than the rule. A more typicaloutcome was unilateral cooperation, where one species reaps the benefits of cooperationwwhile not paying the (even very low) costs of being cooperative itself.
Do partner choice and partner fidelity promote the evolution of cooperation?wThe heat plots in Figure 7.4, based on two of the simulations of Figure 7.3, illustrate how
the distribution of alleles for cooperativeness (left panels in Figure 7.4A and Figure 7.4B)and the parameters βd (middle panels) and αdα (right panels) that characterize the condi-tional dispersal strategy evolve in the two species (Figure 7.4C and Figure 7.4D). Figure
f7.4A (= black dots in Figure 7.3) shows a simulation run where relatively high values ofcooperativeness evolved in both species. Since the dispersal strategy is conditional on thecooperativeness of the other species, the top panels show βd and αd of species B next tothe cooperativeness of species A, while the bottom panels illustrate the dispersal parame-
fters of species A next to the cooperativeness of species B. The dispersal parameters ofspecies A show a consistent pattern: the switch point αd of the dispersal function (equa-tion 7.3)) evolves in parallel with the cooperativeness y of species B and assumes more orless the same values. From the start, βd takes on positive values, implying that a type-1 dis-persal function gets established in species A (shown for generation t = 10000 in red in
145
JOIN
T E
VO
LUTI
ON
OF
MU
TUA
LIS
M A
ND
CO
ND
ITIO
NA
L D
ISP
ER
SA
L
0
0
14
10
2
4
6
8
12
12 14102 4 6 8cooperativeness species A
bilateral cooperation
unilateral cooperation
unila
tera
l coo
pera
tion
coop
erat
iven
ess
spec
ies
B
Figure 7.3 Evolutionary trajectories resulting in unilateral and bilateral cooperation. The coopera-tiveness of both species is shown for ten randomly chosen example runs for the cost benefit ratio tiveness of both species is shown for ten randomly chosen example runs for the cost-benefit ratio cc//cc bb= 0.0001 and dispersal scenario 4 with a simulation time of 50,000 generations. Based on our classi-
ffication of a species as ‘cooperative’ when its level of cooperativeness exceeded a threshold value of2, the graph is subdivided into four sections: (1) bottom-left corner (white): no species is coopera-tive; (2) bottom-right section (brown): unilateral cooperation by species A; (3) top-left section(brown): unilateral cooperation by species B; (4) top-right section (grey): bilateral cooperation.
A.Ivens-diss 16-10-2012 11:14 Pagina 145
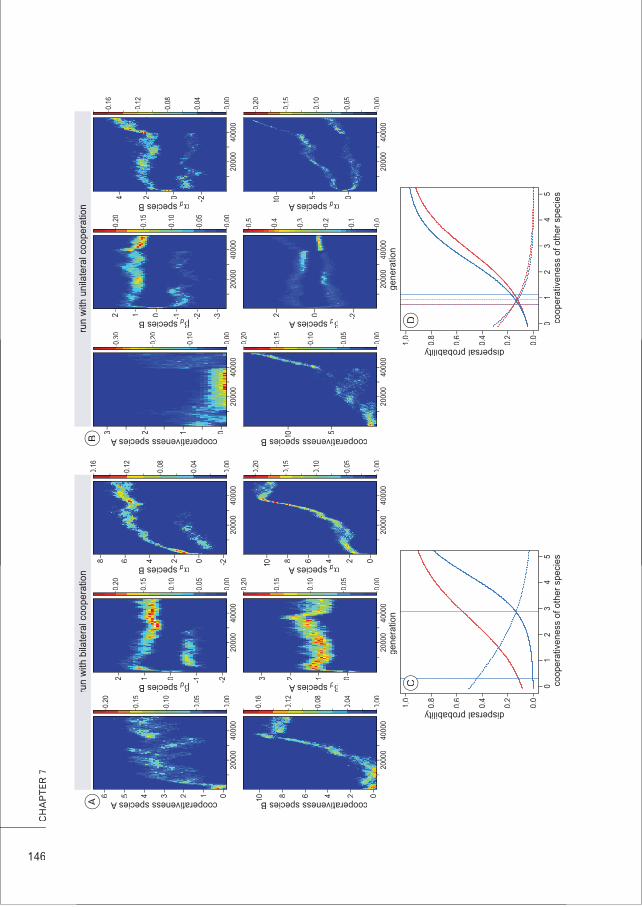
146
CH
AP
TER
7
4000
020
000
00.
00
0.05
0.10
0.15
0.20
1235 46 cooperativeness species A
4000
020
000
-20.
00
0.05
0.10
0.15
0.20
-1012 βd species B d
4000
020
000
-20.
00
0.04
0.08
0.12
0.16
026 48 αd species B d
4000
020
000
00.
00
0.04
0.08
0.12
0.16
246810 cooperativeness species B1
4000
020
000
0
0.00
0.05
0.10
0.15
0.20
123 βd species A d
4000
020
000
00.
00
0.05
0.10
0.15
0.20
246810 αd species A d
A
01
23
45
0.0
0.2
0.4
0.6
0.8
1.0
dispersal probability
coop
erat
iven
ess
of o
ther
spe
cies
gene
ratio
nge
nera
tion
C
run
with
bila
tera
l coo
pera
tion
4000
020
000
00.
00
0.10
0.20
0.30
123 cooperativeness species A
4000
020
000
-3-2
0.00
0.05
0.10
0.15
0.20
-1012 βd species B d
4000
020
000
-2
0.00
0.04
0.08
0.12
0.16
024 αd species B d
4000
020
000
5
0.00
0.05
0.10
0.15
0.20
10 cooperativeness species B 1
4000
020
000
-2
0.0
0.1
0.3
0.2
0.4
0.5
02 βd species A d
4000
020
000
0
0.00
0.05
0.10
0.15
0.20
510 αd species A d
Bru
n w
ith u
nila
tera
l coo
pera
tion
01
23
45
0.0
0.2
0.4
0.6
0.8
1.0
dispersal probabilityco
oper
ativ
enes
s of
oth
er s
peci
es
D
A.Ivens-diss 16-10-2012 11:14 Pagina 146
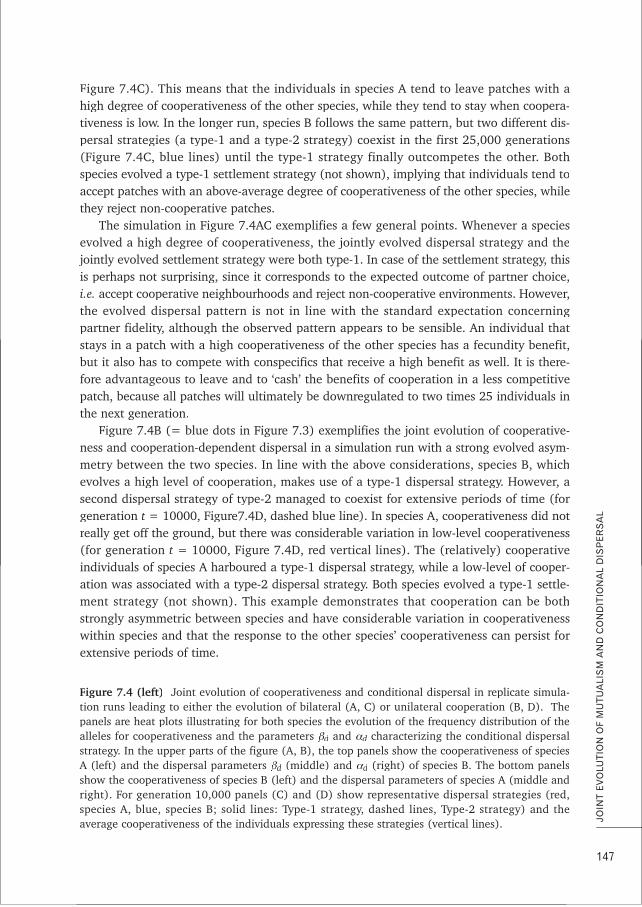
Figure 7.4C). This means that the individuals in species A tend to leave patches with ahigh degree of cooperativeness of the other species, while they tend to stay when coopera-tiveness is low. In the longer run, species B follows the same pattern, but two different dis-persal strategies (a type-1 and a type-2 strategy) coexist in the first 25,000 generations(Figure 7.4C, blue lines) until the type-1 strategy finally outcompetes the other. Bothspecies evolved a type-1 settlement strategy (not shown), implying that individuals tend toaccept patches with an above-average degree of cooperativeness of the other species, whilethey reject non-cooperative patches.
The simulation in Figure 7.4AC exemplifies a few general points. Whenever a speciesevolved a high degree of cooperativeness, the jointly evolved dispersal strategy and thejjointly evolved settlement strategy were both type-1. In case of the settlement strategy, thisis perhaps not surprising, since it corresponds to the expected outcome of partner choice,i.e. accept cooperative neighbourhoods and reject non-cooperative environments. However,the evolved dispersal pattern is not in line with the standard expectation concerningpartner fidelity, although the observed pattern appears to be sensible. An individual thatstays in a patch with a high cooperativeness of the other species has a fecundity benefit,but it also has to compete with conspecifics that receive a high benefit as well. It is there-fore advantageous to leave and to ‘cash’ the benefits of cooperation in a less competitivepatch, because all patches will ultimately be downregulated to two times 25 individuals inthe next generation.
Figure 7.4B (= blue dots in Figure 7.3) exemplifies the joint evolution of cooperative-ness and cooperation-dependent dispersal in a simulation run with a strong evolved asym-metry between the two species. In line with the above considerations, species B, whichevolves a high level of cooperation, makes use of a type-1 dispersal strategy. However, asecond dispersal strategy of type-2 managed to coexist for extensive periods of time (forgeneration t = 10000, Figure7.4D, dashed blue line). In species A, cooperativeness did notreally get off the ground, but there was considerable variation in low-level cooperativeness(for generation t = 10000, Figure 7.4D, red vertical lines). The (relatively) cooperativeindividuals of species A harboured a type-1 dispersal strategy, while a low-level of cooper-ation was associated with a type-2 dispersal strategy. Both species evolved a type-1 settle-ment strategy (not shown). This example demonstrates that cooperation can be bothstrongly asymmetric between species and have considerable variation in cooperativenesswwithin species and that the response to the other species’ cooperativeness can persist forextensive periods of time.
147
JOIN
T E
VO
LUTI
ON
OF
MU
TUA
LIS
M A
ND
CO
ND
ITIO
NA
L D
ISP
ER
SA
L
Figure 7.4 (left) fJoint evolution of cooperativeness and conditional dispersal in replicate simula-tion runs leading to either the evolution of bilateral (A, C) or unilateral cooperation (B, D). Theppanels are heat plots illustrating for both species the evolution of the frequency distribution of thealleles for cooperativeness and the parameters βdβ and αdα characterizing the conditional dispersalstrategy. In the upper parts of the figure (A, B), the top panels show the cooperativeness of speciesAAA (left) and the dispersal parameters βdβ (middle) and αdα (right) of species B. The bottom panelsshow the cooperativeness of species B (left) and the dispersal parameters of species A (middle andright). For generation 10,000 panels (C) and (D) show representative dispersal strategies (red,species A, blue, species B; solid lines: Type-1 strategy, dashed lines, Type-2 strategy) and theaverage cooperativeness of the individuals expressing these strategies (vertical lines).
A.Ivens-diss 16-10-2012 11:14 Pagina 147
DISCUSSION
Cost-benefit effects on the evolution of interspecific cooperationIn our model cooperation between species only evolved when the cost-benefit ratio of theinteraction was extremely low. Under higher cost-benefit ratios, no cooperation emerged,irrespective of the dispersal scenarios considered (Figure 7.1). This outcome contrasts theresults obtained in Chapter 6, where we showed that conditional dispersal promoteswwithin-species cooperation particularly strongly under high cost-benefit ratios. This isbecause, in both models, the only adaptive response as a cooperative individual underhigh cost-benefit ratios is to evolve competitor avoidance. However, under intraspecificcooperation (Chapter 6), the cooperative individual in fact just helped the competitorsbecoming competitive herself. In case of interspecific cooperation the competitors to beavoided are not the same individuals that she also cooperates with. Cooperation between
yspecies will therefore not come off the ground when both species have a strong tendency(as selected for by high c/b ratios) to avoid conspecific competitors and leave beneficialenvironments created by the other species.
With the extremely low cost-benefit ratios required for mutualism in our current model,the mutualistic relationships that evolved may be viewed as examples of by-product mutu-alism, where partners exchange goods that are cheap (or even free) to produce but yield
Ahigh benefits for the other species (Connor 1995; Leimar & Connor 2003; Leigh 2010). Awwell-known example of by-product mutualism is honeydew provided by aphids to ants,which is based on trading waste product for protection and obtaining the extra bonus ofwhich is based on trading waste product for protection and obtaining the extra bonus ofengaging waste collectors that enhance hygiene in the aphid colony (Stadler & Dixon2008). Also others have found that (low) c/c b ratios enhance the probability (Yamamura tetal. 2004; Foster & Wenseleers 2006), but it would be useful for future studies to let cost-benefit ratios jointly evolve with cooperativeness and conditional dispersal, as it is conceiv-able that costs and benefits change over evolutionary time as mutualistic partnersco-evolve. Evolving cost-benefit ratios did indeed promote mutualism in a model of pair-wwise interspecific cooperation (Doebeli & Knowlton 1998).
Partner fidelity, partner choice and the evolution of mutualismProvided cost-benefit ratios were sufficiently low, interspecific cooperation evolved in allfour simulated dispersal scenarios. However, cooperation in at least one of the speciesevolved more frequently when conditional dispersal (equivalent to partner fidelity) wasallowed to evolve as well (Figure 7.1AB). Also the joint evolution of conditional settlement(equivalent to partner choice) promoted cooperation (Figure 7.1AC) and we observed anadditional synergistic effect of conditional dispersal and settlement that increased thefrequency in which bilateral cooperation evolved (Figure 7.1D; see below). Previously,partner fidelity and partner choice have theoretically been shown to promote mutualism(Foster & Kokko 2006; Foster & Wenseleers 2006), but, these models assumed that individ-uals would have an innate tendency to leave non-cooperators and move towards coopera-tors. Such positive conditional settlement could indeed evolve in our model, butconditionally dispersing individuals evolved to leave cooperative patches rather than non-cooperative ones. These counter-intuitive results match findings in our similar model on
148
CH
AP
TER
7
A.Ivens-diss 16-10-2012 11:14 Pagina 148
wwithin-species cooperation (Chapter 6). Although unexpected at first these within-speciesresults could be explained by competition avoidance: by leaving ‘good’ patches, individualsavoided competition over reproduction with individuals they themselves helped to bestrong competitors. Virtually the same explanation applies to the current model for inter-specific cooperation. A tendency to stay in ‘good’ patches is clearly not advantageous in
your model; individuals would profit from the cooperativeness of the other species byhaving a higher fecundity, but their offspring would face fierce competition for the fixednumber of positions available since all conspecific patch members would be highly fecundas well. In other words, the benefits received in a good patch can only be ‘cashed’ else-wwhere. This effect may have been buffered for when we would have allowed for localr yesource enhancement to take effect: if patch sizes would increase with patch productivityrather than being constant.
Emergence of variation in cooperativeness and conditional strategiesTo allow comparison of our results on between-species cooperation with those obtained forwwithin-species cooperation in Chapter 6, we focused on a symmetric situation in whichboth species were virtually identical and started simulations with the same initial condi-tions. Still, a remarkable degree of interaction asymmetry evolved, with the majority of theruns resulting in unilateral rather than bilateral cooperation (Figure 7.3). Doebeli andKnowlton (1998) showed as well that symmetric starting conditions can yield fluctuating
fend results for the evolution of mutualism. Most likely, similar or even higher degrees ofasymmetry would evolve when the model contains asymmetry a priori. However, givensome of the other counterintuitive results, it would seem wise to explicitly test this expec-tation. Such future studies would be particularly relevant because many mutualisms arecharacterized by asymmetry between partners, for example in body size, generation time,and number of interacting individuals (reviewed in Leigh 2010).
Throughout our simulations we maintained considerable variation for cooperativenessboth between and within species and the same was true for conditional strategies. Overextended periods of time, opposite dispersal strategies can apparently coexist (Figure 7.4),often in combination with differing levels of cooperativeness. The importance of variationfor beneficial effects of conditional strategies has previously been recognized in differentcontexts (Ferrière et al. 2002; Foster & Kokko 2006; McNamara et al. 2008; Wolf et al.2011). Indeed, costly conditional behaviour requires variation; it is only worth paying thecosts of being choosy or responsive if these costs are balanced by fitness benefits emanat-ing from making good choices.
AAcknowledgementsWe thank Yiming Yu, Joke Bakker and Marten van de Sanden for help with the development and
implementation of the model. Support for this work was obtained through a PhD felolowship from
the Centre for Ecological and Evolutionary Studies, University of Groningen and by grants from the
Langerhuizen Fund and Nicolaas Mulerius Fund, awarded to ABFI. The Centre for High-Performance
Computing and Visualisation at the University of Groningen provided access to the Millipede High
Performance Cluster.
149
JOIN
T E
VO
LUTI
ON
OF
MU
TUA
LIS
M A
ND
CO
ND
ITIO
NA
L D
ISP
ER
SA
L
A.Ivens-diss 16-10-2012 11:14 Pagina 149

A.Ivens-diss 16-10-2012 11:14 Pagina 150
Epilogue: what have we learned aboutfarming mutualism?
A k B F IAniek B.F. Ivens
CH
AP
TER8
A.Ivens-diss 16-10-2012 11:14 Pagina 151
yIn this thesis, I have studied the problem of the evolution of stable (farming) mutualism bymeans of combined empirical (Chapters 2-5, Box A, B) and theoretical approaches(Chapters 6, 7). For a detailed description of my findings I refer to the individual chapters.Instead, in this last chapter I will reflect on what we have learned about farming mutu-alisms in general and the suitability of the Lasius flavus-root aphid system as model systemfor farming mutualisms in particular. I will also look ahead to future avenues in bothempirical and theoretical studies on farming mutualism by discussing potential future
yempirical angles and by describing the characteristics of a theoretical model specificallytailored to farming mutualism.
AARE CONDITIONAL BEHAVIOUR AND LOW COSTS THE KEYS TOSUCCESS IN COOPERATION?
How cooperation can evolve by means of natural selection is not self-evident. In a world inwwhich individuals are selected to outcompete others, even a small cost of cooperativebehaviour can be too high and prevent its evolution (see also Chapter 1). Previously it wasshown that selectively continueing cooperative interactions (partner fidelity( y) or selectivelyengaging in cooperative interactions (partner choice( ) can be important mechanisms topromote the evolution of cooperation (among others Trivers 1971; Bull & Rice 1991).Evolution of such conditional mechanisms is often hard to predict. Indeed, when model-ling conditional behaviour one easily obtains counter-intuitive results (e.g. Van Doorn VV et al.2003; Pen & Taylor 2005; Fawcett et al. 2011). This was also the case in Chapter 6, inwwhich conditional dispersal (partner fidelity in our model) was shown to promote within-species cooperation, but did so in unexpected ways: (1) cooperation evolved when individ-uals tended to leave cooperative patches for non-cooperative ones, rather than the otherwway around, (2) conditional dispersal could also lead to the disappearance of cooperationand (3) the evolution of cooperation under conditional dispersal evolved more easily whencost-benefit ratios were high. As explained in Chapter 6, although counter-intuitive at first,these results can well be understood by taking local resource enhancement into considera-tion. I therefore conclude that when investigating the importance of conditional behaviourfor the evolution of cooperation one should be careful to not only focus on the cost-bene-fits of the cooperation pay-off, but also to take into account other effects such as thosegenerated by population regulation.
Cooperation between species, however, is expected to be even more difficult to evolvethan the within-species cooperation studied in Chapter 6. This is especially so because nokin-selective advantage can take effect in an interaction between individuals of differentspecies (see Chapter 1). Indeed, in my model in Chapter 7, between-species cooperationonly evolved under much more restricted conditions than within-species cooperation in thecomparable model of Chapter 6. In particular, interspecific cooperation could only evolveunder very low cost-benefit ratios, in which there are hardly any costs involved in engagingin an interaction (comparable to by-product mutualism). Given these low costs, the modelin Chapter 7 showed that conditional dispersal (partner fidelity) can also promote the evo-lution of between-species cooperation, in particular in combination with additional condi-
152
CH
AP
TER
8
A.Ivens-diss 16-10-2012 11:14 Pagina 152
tionality in the form of conditional settlement (partner choice). Interspecific cooperation thus evolves most easily under very low cost-benefit ratios
and under conditions in which partner fidelity and partner choice can interact. The con-ceptual models of Chapters 6 and 7, however, did not consider specific cooperativesystems, rendering the underlying assumptions rather general and biologically less realis-tic. Future extensions of these conceptual models should include a wider range of coopera-tive games, such as one-to-one interactions and interactions with asymmetry incost-benefit ratios and information available to participants, in order to test whether thesegeneral results are robust. Moreover, for a better theoretical understanding of the evolu-tion of farming mutualism, we will need to go beyond conceptual models and developmore mechanistic models specifically tailored to farming mutualism. In the section on‘farming mutualism’, I will also give a detailed prospect of the contours of such a model.First, I will discuss what we have learned about the specific farming mutualism betweenYYellow meadow ants and their root aphids and discuss its prospect as a future modelYYsystem for farming mutualism.
EVALUATION OF L. FLAVUS- SYSTEM AS A STUDY SYSTEM FORFARMING MUTUALISMSFF
AAt the start of my dissertation project, very little was known about the L. flavus – rootaphid system. All information was based on a handful of studies, published between the50’s and early 90’s (Pontin 1958; 1959; 1961b; Paul 1977; Godske 1991; 1992; Smart1991). In addition, some information seemed to be based on anecdotal evidence and noneof the studies or observations had been performed in my main study population on theisland of Schiermonnikoog, the Netherlands. Nevertheless, for several reasons the L. flavus
ysystem seemed a promising study system for farming mutualism: (1) field and laboratorystudies seemed quite feasible; a large study population was available and laboratory set-ups had been described in the literatur (Muir 1960; Dixon 1970; Paul 1977; Smart 1991);(2) the available information suggested considerable life-history variation among the sym-
ybiont root aphid species that would enable comparative studies; and (3) a detailed studyof conflict resolution mechanisms in farming mutualism seemed feasible, because of the
yavailable variation in symbiont life-history with respect to for example myrmecophily(dependence on ants) and reproductive mode. In this section, I will evaluate these threenotions in light of what we know now and discuss the future potential of this ant-aphidinteraction as a model system for farming mutualism.
The feasibility of field and laboratory studiesDuring the first year of this project, I visited a large number of field sites in NorthwestEurope (the Netherlands, Belgium, Germany and Denmark, see Figure 8.1, Table 8.1).These site visits were aimed at obtaining insight into aphid species diversity in L. flavusnests in general and at evaluating the suitability of these sites for my studies. The saltmarsh population on the island of Schiermonnikoog proved to be the most suitable locationwwith large numbers of ant mounds, large numbers of aphids per mound, and a considerable
153
EP
ILO
GU
E
A.Ivens-diss 16-10-2012 11:14 Pagina 153
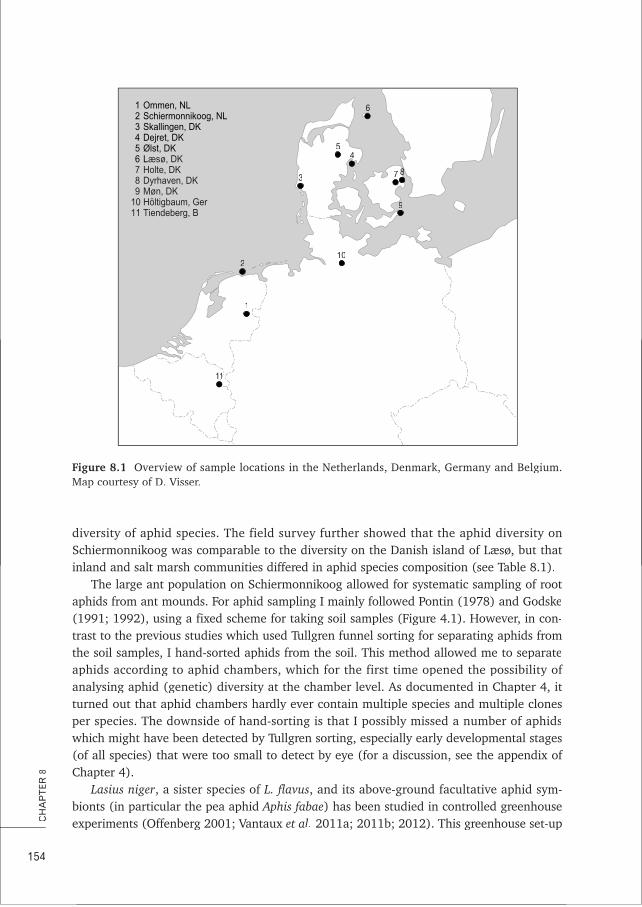
diversity of aphid species. The field survey further showed that the aphid diversity onSchiermonnikoog was comparable to the diversity on the Danish island of Læsø, but thatinland and salt marsh communities differed in aphid species composition (see Table 8.1).
The large ant population on Schiermonnikoog allowed for systematic sampling of rootaphids from ant mounds. For aphid sampling I mainly followed Pontin (1978) and Godske(1991; 1992), using a fixed scheme for taking soil samples (Figure 4.1). However, in con-trast to the previous studies which used Tullgren funnel sorting for separating aphids fromthe soil samples, I hand-sorted aphids from the soil. This method allowed me to separate
faphids according to aphid chambers, which for the first time opened the possibility ofanalysing aphid (genetic) diversity at the chamber level. As documented in Chapter 4, itturned out that aphid chambers hardly ever contain multiple species and multiple clonesper species. The downside of hand-sorting is that I possibly missed a number of aphidswwhich might have been detected by Tullgren sorting, especially early developmental stages
f(of all species) that were too small to detect by eye (for a discussion, see the appendix ofChapter 4).
Lasius niger, a sister species of L. flavus, and its above-ground facultative aphid sym-bionts (in particular the pea aphid Aphis fabae) has been studied in controlled greenhouseexperiments (Offenberg 2001; Vantaux et al. 2011a; 2011b; 2012). This greenhouse set-up
154
CH
AP
TER
8
111
1
2
3
10
9
888887
445
6
Figure 8.1 fOverview of sample locations in the Netherlands, Denmark, Germany and Belgium.Map courtesy of D. Visser.Map courtesy of D. Visser.
A.Ivens-diss 16-10-2012 11:15 Pagina 154
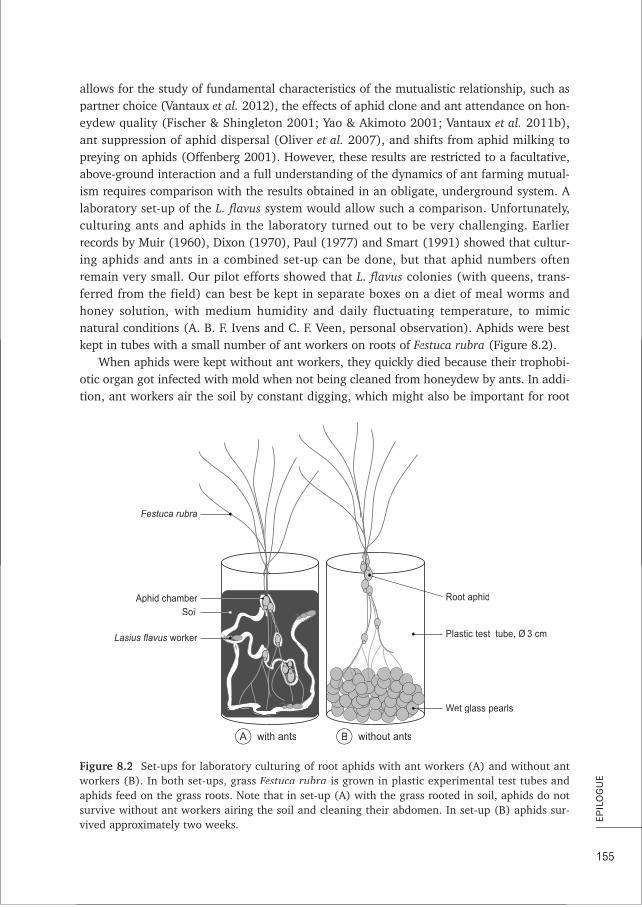
allows for the study of fundamental characteristics of the mutualistic relationship, such aspartner choice (Vantaux et al. 2012), the effects of aphid clone and ant attendance on hon-eydew quality (Fischer & Shingleton 2001; Yao & Akimoto 2001; Vantaux et al. 2011b),ant suppression of aphid dispersal (Oliver et al. 2007), and shifts from aphid milking topreying on aphids (Offenberg 2001). However, these results are restricted to a facultative,above-ground interaction and a full understanding of the dynamics of ant farming mutual-
Aism requires comparison with the results obtained in an obligate, underground system. Alaboratory set-up of the L. flavus system would allow such a comparison. Unfortunately,culturing ants and aphids in the laboratory turned out to be very challenging. Earlierrecords by Muir (1960), Dixon (1970), Paul (1977) and Smart (1991) showed that cultur-ing aphids and ants in a combined set-up can be done, but that aphid numbers oftenremain very small. Our pilot efforts showed that L. flavus colonies (with queens, trans-ferred from the field) can best be kept in separate boxes on a diet of meal worms andhoney solution, with medium humidity and daily fluctuating temperature, to mimicnatural conditions (A. B. F. Ivens and C. F. Veen, personal observation). Aphids were bestkept in tubes with a small number of ant workers on roots of Festuca rubraFF (Figure 8.2).
When aphids were kept without ant workers, they quickly died because their trophobi-otic organ got infected with mold when not being cleaned from honeydew by ants. In addi-tion, ant workers air the soil by constant digging, which might also be important for root
155
EP
ILO
GU
ERoot aphidRR
Plastic test tube, Ø 3 cm
Wet glass pearls
SoilAphid chamber
Festuca rubra
Lasius flavus worker
A with ants B without ants
Figure 8.2 f fSet-ups for laboratory culturing of root aphids with ant workers (A) and without antwwworkers (B). In both set ups, grasswworkers (B). In both set-ups, grass FFestuca rubraestuca rubraFFFF is grown in plastic experimental test tubes andis grown in plastic experimental test tubes andaphids feed on the grass roots. Note that in set-up (A) with the grass rooted in soil, aphids do notsurvive without ant workers airing the soil and cleaning their abdomen. In set-up (B) aphids sur-vvvived approximately two weeks.
A.Ivens-diss 16-10-2012 11:15 Pagina 155
aphid survival. In our pilot studies, neither ants nor aphids reached densities high enoughfor larger-scale experiments. Future efforts to culture ants and aphids should include cul-turing aphid on Holcus lanatus (Paul 1977) and direct connection of root aphids and antcolonies, which has previously been shown to yield higher aphid numbers for experimentaland taxonomic studies. Alternatively, experiments can be performed with ants and aphidsdirectly after being collected from the field. This method was applied in the pilot experi-ments of Box A of this thesis, in which I studied aphid and mealybug acceptance by antsub-colonies. Although possible, this collection method does not allow for carefully con-trolled laboratory circumstances and sample sizes.
Diversity in the L. flavus systemOver the course of my PhD studies, I found 15 different species of root aphids in Lasiusfflavus nests and five species of underground mealybugs (Table 8.1). These aphid specieshave all been described before from L. flavus nests in Britain and Denmark (Paul 1977;Pontin 1978; Heie 1980; Godske 1991), but as far as I am aware, this is the first detailedstudy of root aphids and mealybugs in L. flavus nests in the Netherlands. For species identi-fication I used a protocol for microscopic preparation (modified from Heie 1980). Thisprocess is very time consuming and identification remains uncertain, because of the limitednumber of records on root aphid taxonomy available (Zwölfer 1958; Paul 1977; Heie 1980).It is therefore likely that some cryptic species remained undetected; this issue can only beresolved by further genetic analysis, following up on our initial work presented in Chapter 5.
The sparse records on the species found indicated a large variation in life-history char-acteristics. For example, Anoecia corni and Tetraneura ulmiTT were assumed to complete theirsexual cycle in Northwest Europe on their primary host plants Cornus and Ulmus resp.,wwhereas Forda spp., Geoica spp. and Anoecia zirnitsi yhave been inferred to reproduce onlyanholocyclically in the area (Paul 1977; Heie 1980). Also the extent to which these rootaphids disperse differs between species according to the few available records: somespecies obligately leave ant nests in search for their primary host plants to reproduce, forothers clonal alates (winged individuals) have been described and others are assumed tonever leave the ant nest (Paul 1977; Heie 1980). Lastly, these aphid species are assumedto differ significantly in their dependence on ants: Forda spp., for example, have beendescribed to be obligate myrmecophiles whereas Tetraneura ulmiTT is considered a faculta-tive myrmecophile by some (Paul 1977; Heie 1980). In Chapters 2 & 3, I first tried tovverify early records on root aphid reproduction and dispersal using microsatellite markersin a detailed field study of the four most common species Geoica utricularia, Forda mar-rrgginata, Forda formicariarr and Tetraneura ulmi.TT I showed that, in contrast to earlier records,all four species most likely reproduce clonally on Schiermonnikoog, although cautionshould be taken when excluding sexual reproduction for T. ulmi based on microsatellitedata only (Chapter 3). The microsatellite data confirm that some aphid dispersal occursalong the island’s salt marsh, but at very low frequencies. This indicates that sparse naturalhistory records emanating from field surveys are not necessarily accurate, and that sitespecific life-history details of root aphids should ideally be verified prior to further experi-ments, especially when earlier records concern populations that have not been studiedwwith genetic markers before.
156
CH
AP
TER
8
A.Ivens-diss 16-10-2012 11:15 Pagina 156
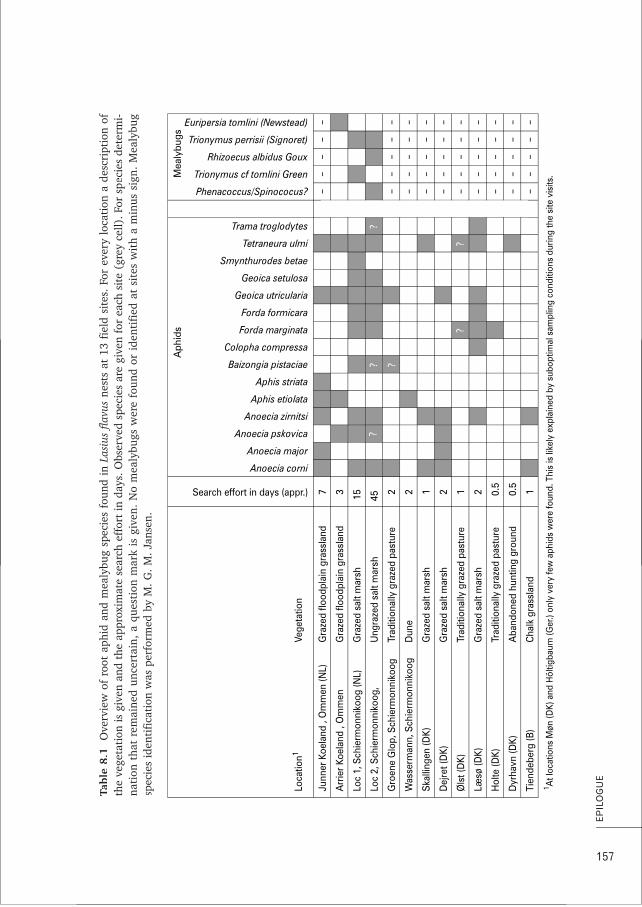
157
EP
ILO
GU
E
Tabl
e 8.
1TT
ff
Ove
rvie
w o
f ro
ot a
phid
and
mea
lybu
g sp
ecie
s fo
und
in L
asiu
s fla
vus
nest
s at
13
fiel
d si
tes.
For
eve
ry l
ocat
ion
a de
scri
ptio
n of
nest
s at
13
fiel
d si
tes.
For
eve
ry l
ocat
ion
a de
scri
ptio
n of
the
vege
tati
on is
giv
en a
nd t
he a
ppro
xim
ate
sear
ch e
ffor
t in
day
s. O
bser
ved
spec
ies
are
give
n fo
r ea
ch s
ite
(gre
y ce
ll). F
or s
peci
es d
eter
mi-
nati
on t
hat
rem
aine
d un
cert
ain,
a q
uest
ion
mar
k is
giv
en.
No
mea
lybu
gs w
ere
foun
d or
ide
ntif
ied
at s
ites
wit
h a
min
us s
ign.
Mea
lybu
gsp
ecie
s id
enti
fica
tion
was
per
form
ed b
y M
. G. M
. Jan
sen.
A.Ivens-diss 16-10-2012 11:15 Pagina 157
In spite of some sampling efforts having remained limited (Table 8.1), the L. flavuspopulations across Northwest Europe may harbour an interesting degree of variation inaphid species diversity, their degree of myrmecophily, and possibly also reproductive modesand dispersal tendencies. This variation provides many additional opportunities to testalternative hypotheses on the implications of association with ants. This work wouldinclude population genetic analyses of aphids over their full ecological and geographicalrange, in particular including areas where aphid primary host plants occur and an ant-aphid conflict of interests over aphid reproductive mode is likely to be more pressing(Southern Europe for the focal species of Chapter 2 and 4). In addition, combined analy-ses of nuclear and mitochondrial DNA on sampled aphids from a wider geographicalrange, would allow construction of a phylogeny of aphid clonal lineages which will givemore insight into the history of this mutualistic interaction and the origin of aphid clonesfound in Northwest Europe nowadays.
In particular the genus Anoecia offers a wide spectrum of these possibilities, withwwithin-genus interspecific differences in reproductive mode, myrmecophily and dispersaltendencies (Paul 1977; Heie 1980). This means that in comparisons between Anoeciaaphids, genus-differences in life-history can be factored out and yielded results may givemore direct information on the evolutionary ecology of ant-tending than the aphid-aphidcomparisons presented in this thesis. We already developed some microsatellite markersfor this genus (Ivens et al. 2011; Chapter 5) and a preliminary taxonomic survey identifiedthe possibility for several cryptic species in this species-complex (A.B.F. Ivens, personalobservation), but time was too short to study this genus in detail.
What have we learned?My empirical studies ended up focussing on the three most common aphid species. Chapter2 and 3 show that G. utricularia and F. marginata reproduce exclusively clonally and T.ulmi most likely also. In addition dispersal is rare in all species. Ivens et al. (2012a; Chapter4) then reveals that the majority of L. flavus nests contain only a single of these threespecies and that clonal lineages and species tend to occur spatially separated within antmounds. Although the chapters presented in this thesis were largely aphid oriented, wealso conducted several unpublished studies concerning the basic biology of the ants.
rMicrosatellite analysis of ant workers collected from the same mounds as sampled foraphids, showed that the L. flavus fpopulation on Schiermonnikoog appears to consist ofboth mono- and polygynous colonies and that queens mate 1-2 times (Janzen 2009; vanBoheemen 2010). Moreover, an ecological study that investigated correlations between antcolony genetic diversity, sex ratios and environmental stress factors such as inundation fre-quency (as approximated by salinity) and colony density showed, among other results,that ant sex ratios (males/females) are negatively correlated with salinity and that totalreproductive output is negatively correlated with ant mound density (van Boheemen 2010;Koch 2012). KK
Our studies also gave further insights into incipient stages of the interaction, althoughadditional work will be needed to fully resolve this. Our population genetic analyses onassociated ants and aphids showed that host and symbiont population structures differstrongly, with aphid populations being highly structured, and the ant population being
158
CH
AP
TER
8
A.Ivens-diss 16-10-2012 11:15 Pagina 158
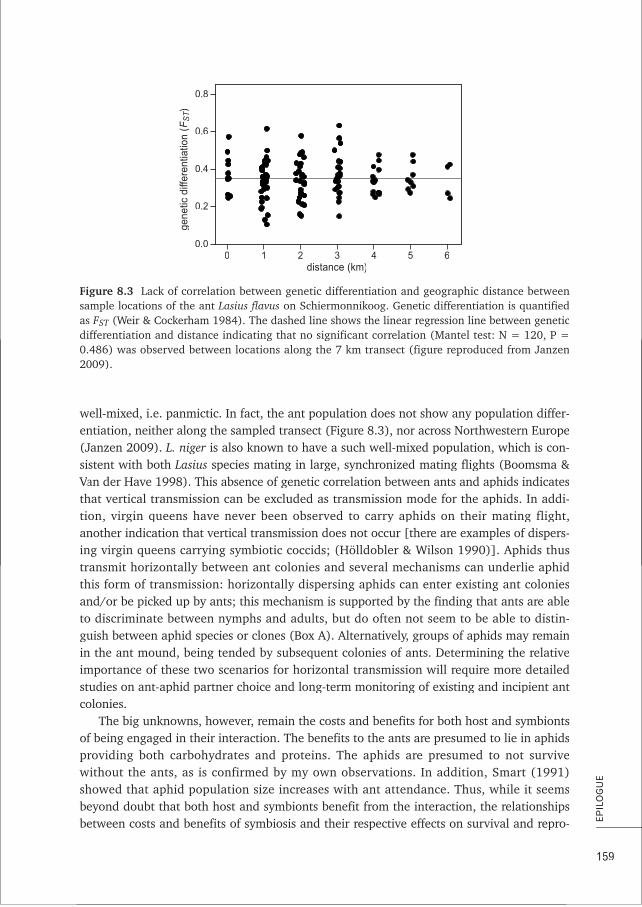
wwell-mixed, i.e. panmictic. In fact, the ant population does not show any population differ-entiation, neither along the sampled transect (Figure 8.3), nor across Northwestern Europe(Janzen 2009). L. niger is also known to have a such well-mixed population, which is con-sistent with both Lasius species mating in large, synchronized mating flights (Boomsma &VVan der Have 1998). This absence of genetic correlation between ants and aphids indicatesVVthat vertical transmission can be excluded as transmission mode for the aphids. In addi-tion, virgin queens have never been observed to carry aphids on their mating flight,another indication that vertical transmission does not occur [there are examples of dispers-ing virgin queens carrying symbiotic coccids; (Hölldobler & Wilson 1990)]. Aphids thustransmit horizontally between ant colonies and several mechanisms can underlie aphidthis form of transmission: horizontally dispersing aphids can enter existing ant coloniesand/or be picked up by ants; this mechanism is supported by the finding that ants are ableto discriminate between nymphs and adults, but do often not seem to be able to distin-guish between aphid species or clones (Box A). Alternatively, groups of aphids may remainin the ant mound, being tended by subsequent colonies of ants. Determining the relativeimportance of these two scenarios for horizontal transmission will require more detailedstudies on ant-aphid partner choice and long-term monitoring of existing and incipient antcolonies.
The big unknowns, however, remain the costs and benefits for both host and symbiontsof being engaged in their interaction. The benefits to the ants are presumed to lie in aphidsproviding both carbohydrates and proteins. The aphids are presumed to not survivewwithout the ants, as is confirmed by my own observations. In addition, Smart (1991)showed that aphid population size increases with ant attendance. Thus, while it seemsbeyond doubt that both host and symbionts benefit from the interaction, the relationshipsbetween costs and benefits of symbiosis and their respective effects on survival and repro-
159
EP
ILO
GU
E
00.0
0.2
0.4
0.6
0.8
gene
tic d
iffer
entia
tion
(FS
T)
TT
1 2 3 4 5 6distance (km)
Figure 8.3 f ffLack of correlation between genetic differentiation and geographic distance betweensample locations of the ant sample locations of the ant Lasius flavusLasius flavus on Schiermonnikoog. Genetic differentiation is quantifiedon Schiermonnikoog. Genetic differentiation is quantifiedas FSTF (Weir & Cockerham 1984). The dashed line shows the linear regression line between geneticdifferentiation and distance indicating that no significant correlation (Mantel test: N = 120, P =0.486) was observed between locations along the 7 km transect (figure reproduced from Janzen2009).
A.Ivens-diss 16-10-2012 11:15 Pagina 159

ductive success would need to be quantified before we can draw firmer conclusion on theforces that affect the dynamics of this mutualism.
Scope for the L. flavus – root aphid system as a future model system forfarming mutualism?Does the Lasius flavus – root aphid system have the potential to become a new modelsystem for farming mutualisms? In order to understand universal factors governing theevolutionary ecology of farming mutualisms, we need systems that are similar enough toallow meaningful comparison, yet different enough to highlight the importance of system-specific characteristics. The best known farming mutualisms are those of social insectsfarming crops: the fungus-growing ants and termites. Just like these systems, the L. flavussystem is presumed to be an obligate mutualism with in-nest farming of symbionts, unlikeother examples of ‘cattle-breeding’ ants such as L. niger that facultatively tend above-ground aphids. For a further understanding of (obligate) farming mutualisms, having astudy system at hand such as L. flavus is therefore indispensable. Moreover, the fact thatboth Lasius species sometimes tend the same aphid species opens doors to studying mutu-alism networks. Likewise, promising future studies of this mutualism can extend to includ-ing aphid host plants (Veen 2011) and aphid endosymbionts.
My studies showed that population genetic field studies are feasible and that the systemyhas a lot of research potential in terms of mapping aphid species diversity and life-history
vvariation across mounds and (sub)populations. Controlled laboratory studies, however,wwill remain a challenge in this subterranean system, with observations remaining restrictedto artificial environments (as used by Muir 1960; Dixon 1970; Paul 1977; Smart 1991)wwith low aphid numbers. In addition, the interpretation of experimental data will be diffi-cult as long as basic biological information, such as how partners associate, is not wellunderstood. Developing this system into a model system would thus first require a largenumber of descriptive studies, before conclusive experimental data can be obtained. Infact, these descriptive studies might constitute the biggest hurdle towards adopting this
ysystem as a model system: in the current scientific culture of publish-or-perish, purelydescriptive, often time-consuming, studies have a hard time to be published in the highestranking journals. Nevertheless, I think that it is worth taking this hurdle, because few otherfarming mutualisms have that much potential for studying the many facets of in-housecattle breeding in a single system.
FARMING MUTUALISMSFF
Farming mutualisms are interactions between different species in which one species (theFFhost) promotes the growth of a species it relies on for food (the symbiont). Farming inter-actions are considered to be mutualisms when they are presumed to yield net benefits forboth partners. In general, the exchanged benefits in farming interactions are nutrients pro-vvided by the symbiont (either in the form of goods produced, or by being eaten or both) inexchange for host protection and tending so their life-time reproductive success isenhanced. In asymmetric interactions in which the host potentially controls the symbiont,
160
CH
AP
TER
8
A.Ivens-diss 16-10-2012 11:15 Pagina 160

host-symbiont conflicts of interests are expected. The three main arenas of potential con-flict are (1) symbiont reproductive mode, (2) symbiont transmission and dispersal and (3)symbiont diversity (see also Chapter 1).
Universal patterns in farming mutualisms?For each of the three potential arenas of conflict, generally two alternative outcomes interms of symbiont traits are considered possible: (1) symbiont reproduction can be sexualor asexual, (2) symbiont transmission can be vertical or horizontal, and (3) symbiontdiversity can be minimal (monoculture – clonal relatedness of 100%) or substantial (poly-culture – relatedness moderate to low) (Herre et al. 1999; Mueller 2002; Table 1.2). Hostand symbiont may prefer different outcomes and hence a conflict of interest can arise. Inthis thesis, I studied which combination of outcomes characterizes the mutualistic interac-tion between ant L. flavus and the root aphids in its nest. I showed that in this system,symbiont reproduction is asexual in three of the studied species and also likely asexual in
ythe fourth, transmission is horizontal (and rare), and symbiont diversity is low, especiallyat the lowest organization-level of aphid chambers. This particular combination of out-comes is not commonly observed in other farming mutualisms (see Figure 1.1). Otherfarmed obligate symbionts are often asexually vertically transmitted and kept in geneticmonocultures [e.g. fungus-growing ants; some fungus-growing termites (Weber 1972; Korb& Aanen 2003; Mueller et al. 2005; Poulsen & Boomsma 2005; Mueller et al. 2010)] orsymbionts reproduce sexually and transmit horizontally, after which diversity remains or is
yactively decreased by hosts [above-ground aphids (facultatively) kept by ants; the majorityof fungus-growing termites; algae-farming damselfish (Hata & Kato 2004; Aanen et al.2009; Yao 2010)].
In the other obligate systems of fungus-farming insects, symbiont reproduction, trans-mission and diversity are controlled by an interplay of several host and symbiont controlmechanisms (a.o. Bot et al. 2001; Poulsen & Boomsma 2005; Aanen et al. 2009; Poulsen tetal. 2009; Schiøtt et al. 2010). In the L. flavus – system, however, the underlying mecha-nisms governing these symbiont traits remain unclear. Does our observed set of outcomesresult from L. flavus host control over symbiont dispersal, reproduction and diversity? Ordo the strong aphid population structure and compartmentalization of aphid clones within
fant mounds simply result from constraints on aphid dispersal and does the absence ofsexual reproduction in aphids result from the absence of suitable host plants? Whetheractive host control mechanisms or symbiont dispersal constraints underlie our findingsremains unclear. We can, however, confirm based on our data in combination with previ-ous findings in other farming mutualisms (Bot et al. 2001; Hata & Kato 2002; Poulsen2005; Aanen et al. 2009; Mueller et al. 2010), that many of the farming systems that havebeen stable over evolutionary time are characterized by low symbiont diversity at thelowest organization level. Often this low diversity goes hand in hand with asexual repro-duction and vertical transmission. My results show that also with horizontal transmissionlow diversity can be achieved, be it actively or passively (see also Aanen et al. 2009). Careshould be taken when comparing obligate to facultative systems and systems with hostcontrol to systems without host control, because very different mechanisms may be at work.Nevertheless, recognizing universal patterns in terms of identical outcomes regard fless of
161
EP
ILO
GU
E
A.Ivens-diss 16-10-2012 11:15 Pagina 161
different underlying mechanisms may give hints as to what makes mutualistic systemsrobust against cheating so they do not fall victim to mutualism breakdown (Sachs & Simms2006). Low diversity through compartmentalization might be one of these universal, stabi-lizing factors (Frank 1996; Herre et al. 1999), but see Verbruggen et al. w(2012) who showthat spatial structure can also hamper the stability of mutualism in mycorrhiza.
Future avenues for modelling (farming) mutualismIn sum, a more complete understanding of the evolutionary ecology of mutualisms requiresboth empirical studies on a wider array of farming mutualisms and theoretical modellingeffort specifically tailored to farming mutualism. In this section I would like to describe
yhow a suitable model for the evolution of farming mutualism would look like, therebytaking into consideration the empirical and theoretical findings on farming mutualism Idiscussed in the two previous sections.
In my opinion, more encompassing models for the evolution of farming mutualism shouldinclude the following features:● Asymmetric host-symbiont interaction (in terms of cost-benefit ratio, goods or services
exchanged, generation time, body size, number of individuals): asymmetry on one ormore levels is a key characteristic of farming mutualism
● Nutritional benefit for the host: by definition, the host is dependent on the symbiont forfood, and the condition of the host should thus directly improve with consuming (partof) the symbiont.
● Protection and uniform environment provided by the hostrr : in many farming mutualisms,host protection increases symbiont survival and decreases environmental fluctuations,by creating a uniform environment.
● Different symbiont reproductive modes possible: sexual vs. asexual: the two alternativeoutcomes of the conflict on reproductive mode
● Different symbiont transmission modes possible: vertical vs. horizontal: the two alterna-tive outcomes for the conflict on transmission mode
● Different levels of symbiont diversity possible: monoculture vs. different degrees of poly-culture.
● Host control over symbiont reproduction, transmission and diversity (symbiont related-ness) should be allowed to evolve: host control is often assumed to be the driving forcebehind conflict resolution in farming mutualism. However, host control should not bean a priori assumption but an evolving trait, as it will undergo evolutionary changewhen the symbiosis becomes more integrated.
● Co-transmission and simultaneous timing of reproduction should be allowed to undergoevolutionary change: these two mechanisms can lead to positive assortment of mutual-
fistic partners. Implementing these mechanisms can help evaluating the importance ofpositive assortment for the evolution of mutualism.
In addition, my thesis results indicate that a good model for mutualism in general shouldideally include the following two components: (1) conditional behaviour of the interactingpartners and (2) evolving cost-benefit ratios. First, conditional behaviour allows for higher
162
CH
AP
TER
8
A.Ivens-diss 16-10-2012 11:15 Pagina 162
ydegrees of freedom for interacting partners, which can lead to unforeseen co-evolutionarydynamics that may remain overlooked when behaviour is presumed to be unconditional ina model (Chapter 6, 7). Second, allowing evolution of variables that have hitherto beenconsidered constant can also give new insights into mutualism dynamics. Joint evolutionof mutualism intensity and cost-benefits ratios is particularly important, because it allowsmodelled mutualisms to move along the mutualism-parasitism continuum.
fA model with these features would allow for an in-depth analysis of the outcomes ofhost-symbiont conflict and the mechanisms governing them in specific biological systems.For example, is low symbiont diversity indeed a basic requirement for stable farming mutu-FFalism to evolve, as comparison of natural farming mutualisms suggests? And what is therelative importance of mechanisms like host control, partner fidelity and partner choice? Iseach of these necessary for stable farming mutualism, or can mutualism remain stable alsoin the absence of one of them? Lastly, such a model would give us insight in the mutual-ism-parasitism dynamics of farming mutualisms.
CONCLUSION
The establishment of a mutually beneficial relationship requires partners to be able torepeatedly choose to continue an interaction (partner fidelity). Although most farmingmutualisms may start under this condition, subsequent co-evolution, inherent asymmetry,
fand potential conflicts of interests will ultimately erode the initial degrees of freedom ofthe partners in terms of dispersal, reproduction and partner choice. However, giving up onindividual freedom may be compensated for by being part of an increasingly productive,specialized system in which the individual partners are more successful than they would
yhave been on their own. This is also what likely happened to the root aphids tended byYYellow meadow ants: the protective environment provided by the ants might have givenYYthe aphids the opportunity to give up almost all sexual reproduction, stay at the same loca-tion for prolonged periods of time and spread northwards from their original habitat. Viceversa, the year-round presence of aphids for ‘milk and meat’ gives the ants the opportunityversa, the year-round presence of aphids for ‘milk and meat’ gives the ants the opportunityto reach higher population densities than they could reach in salt marsh habitats withoutaphids. It is therefore safe to say that, for these ants and aphids, life seems better together.
Why are we here? And where do we go? And how come it’s so hard?It’s not always easy and sometimes life can be deceiving
I’ll tell you one thing, it’s always better when we’re together
- Better Together, Jack Johnson (2004) -
163
EP
ILO
GU
E
A.Ivens-diss 16-10-2012 11:15 Pagina 163

A.Ivens-diss 16-10-2012 11:15 Pagina 164

R feferencesRR
A.Ivens-diss 16-10-2012 11:15 Pagina 165
AAanen DK, De Fine Licht HH, Debets AJM, Kerstes NAG, Hoekstra RF, Boomsma JJ (2009) High sym-biont relatedness stabilizes mutualistic cooperation in fungus-growing termites. Science, 326, 1103-1106.
AAanen DK, Eggleton P, Rouland-Lefevre C, Guldberg-Froslev T, Rosendahl S, Boomsma JJ (2002) Theevolution of fungus-growing termites and their mutualistic fungal symbionts. Proceedings of theNational Academy of Sciences of the United States of America, 99, 14887-14892.
AAanen DK, Hoekstra RF (2007) The evolution of obligate mutualism: if you can't beat 'em, join 'em.Trends in Ecology & Evolutionrr , 22, 506-509.
AAbbot P (2009) On the evolution of dispersal and altruism in aphids. Evolution, 63, 2687-2696.AAbbot P, Abe J, Alcock J, et al (2011) Inclusive fitness theory and eusociality. Nature, 471, E1-E4. AAbbot P, Chhatre V (2007) Kin structure provides no explanation for intruders in social aphids. rMolecular
Ecology, 16, 3659-3670.AAllen DE, Lynch M (2012) The effect of variable frequency of sexual reproduction on the genetic struc-
ture of natural populations of a cyclical parthenogen. Evolution, 66, 919-926. AArchetti M, Úbeda F, Fudenberg D, Green J, Pierce NE, Yu DW (2011) Let the right one in: a microeco-
nomic approach to partner choice in mutualisms. The American Naturalist, 177, 75-85. AArnaud-Haond S, Duarte CM, Alberto F, Serrao EA (2007) Standardizing methods to address clonality in
population studies. Molecular Ecology, 16, 5115-5139.AArnold A, Herre E (2003) Canopy cover and leaf age affect colonization by tropical fungal endophytes:
Ecological pattern and process in Theobroma cacao (Malvaceae). Mycologia, 95, 388-398. AAxelrod R, Hamilton WD (1981) The evolution of cooperation. Science, 211, 1390-1396.BBäckhed F, Ley R, Sonnenburg J, Peterson D, Gordon J (2005) Host-bacterial mutualism in the human
intestine. Science, 307, 1915-1920.Balloux F, Lehmann L, De Meeus T (2003) The population genetics of clonal and partially clonal
diploids. Genetics, 164, 1635-1644. yBascompte J, Jordano P, Olesen JM (2006) Asymmetric coevolutionary networks facilitate biodiversity
maintenance. Science, 312, 431-433. fBastolla U, Fortuna MA, Pascual-Garcia A, Ferrera A, Luque B, Bascompte J (2009) The architecture of
mutualistic networks minimizes competition and increases biodiversity. Nature, 458, 1018-U91. Ben-Dov Y, Fischer BL (2010) The mutualism of Melissotarsus ants and armoured scale insects in Africa
and Madagascar: distribution, host plants and biology. Entomologica Hellenica, 19, 45-53. Bengtsson B (2003) Genetic variation in organisms with sexual and asexual reproduction. fJournal of
Evolutionary Biology, 16, 189-199. Bergstorm CT, Bronstein JL, Bshary R, et al (2002) Interspecific mutualism - Puzzels and predictions. In:
Genetic and cultural evolution of cooperation pp. 241-257 The MIT Press, Cambridge, Massachusetts. Bever JD, Richardson SC, Lawrence BM, Holmes J, Watson M (2009) Preferential allocation to beneficial
symbiont with spatial structure maintains mycorrhizal mutualism. Ecology Letters, 12, 13-21. Biedermann PHW, Taborsky M (2011) Larval helpers and age polyethism in ambrosia beetles.
Proceedings of the National Academy of Sciences of the United States of America, 108, 17064-17069. Bijma P, Aanen DK (2010) Assortment, Hamilton's rule and multilevel selection. Proceedings of the Royal
Society B-Biological Sciences, 277, 673-675. Birky CW (1996) Heterozygosity, heteromorphy, and phylogenetic trees in asexual eukaryotes. Genetics,
144, 427-437. Blackman RL, Eastop VF (1994) Aphids on the world's trees - An identification and Information Guide CAB
International, Oxon, UK. Blomqvist MM, Olff H, Blaauw MB, Bongers T, van der Putten WH (2000) Interactions between above-
and belowground biota: importance for small-scale vegetation mosaics in a grassland ecosystem.Oikos, 90, 582-598.
Booijink CCGM, Zoetendal EG, Kleerebezem M, de Vos WM (2007) Microbial communities in the humansmall intestine: coupling diversity to metagenomics. Future MicrobiologyFF , 2, 285-295.
166
RE
FER
EN
CE
S
A.Ivens-diss 16-10-2012 11:15 Pagina 166

ff f fBoomsma JJ, Isaaks JA (1982) Effects of inundation and salt on the survival of ants in a sandy coastalplain Ecological Entomology, 7, 121-130.
Boomsma JJ, Van loon AJ (1982) Structure and diversity of ant communities in successive coastal dunevalleys. Journal of Animal Ecology, 51, 957-974.
Boomsma JJ, Wright PJ, Brouwer AH (1993) Social structure in the ant Lasius flavus - Multi-queen nestsor multi-nest mounds. Ecological Entomology, 18, 47-53.
Boomsma JJ, Beekman M, Cornwallis CK, et al (2011) Only full-sibling families evolved eusociality.Nature, 471, E4-E5.
Boomsma J, Van der Have T (1998) Queen mating and paternity variation in the ant Lasius niger.Molecular Ecology, 7, 1709-1718.
Bot ANM, Rehner SA, Boomsma JJ (2001) Partial incompatibility between ants and symbiotic fungi intwo sympatric species of Acromyrmex leaf-cutting ants. Evolution, 55, 1980-1991.
Botero CA, Pen I, Komdeur J, Weissing FJ (2010) The evolution of individual variation in communica-tion strategies. Evolution, 64, 3123-3133.
Bourke AFG (2011) Principles of social evolution. Oxford University Press Inc., New York.Brock DA, Douglas TE, Queller DC, Strassmann JE (2011) Primitive agriculture in a social amoeba.
Nature, 469, 393-396. Bronstein JL (2001) The exploitation of mutualisms. Ecology Letters, 4, 277-287. Bronstein JL (1994) Conditional Outcomes in Mutualistic Interactions. Trends in Ecology & Evolutionrr , 9,
214-217. Brown JL (1983) Cooperation - A biologists dilemma. Advances in the Study of Behaviour, 13, 1-37. Bshary R, Grutter AS (2002) Asymmetric cheating opportunities and partner control in a cleaner fish
mutualism. Animal Behaviour, 63, 547-555. Bshary R, Noë R, Hammerstein P (2002) Biological markets: The ubiquitous influence of partner choice
on the dynamics of cleaner fish-client reef fish interactions. In: Genetic and cultural evolution of coop-eration. pp. 167-185 The MIT Press, Cambridge, Massachusetts, London, England.
Bshary R, Grutter AS (2006) Image scoring and cooperation in a cleaner fish mutualism. Nature, 441, 975-978.Bull JJ, Rice WR (1991) Distinguishing mechanisms for the evolution of cooperation. fJournal of
Theoretical Biology, 149, 63-74. CConnor RC (1995) The benefits of mutualism - a conceptual framework. Biological reviews of the
Cambridge Philosophical Society,tt 70, 427-457. DDarwin C (1859) Difficulties on theory. In: On the origin of species, 2004 edn, pp. 191-228 Collector's
Library, London.Dawkins R (1976) The selfish gene. Oxford University Press, Oxford.De Meeus T, Balloux F (2004) Clonal reproduction and linkage disequilibrium in diploids: a simulation
study. Infection, Genetics and Evolution, 4, 345-351.De Meeus T, Lehmann L, Balloux F (2006) Molecular epidemiology of clonal diploids: A quick overview
and a short DIY (do it yourself) notice. Infection, Genetics and Evolution, 6, 163-170. De Meeus T, Prugnolle F, Agnew P (2007) Asexual reproduction: Genetics and evolutionary aspects.
Cellular and Molecular Life Sciences, 64, 1355-1372.Dean WRJ, Milton SJ, Klotz S (1997) The role of ant nest-mounds in maintaining small-scale patchiness
in dry grasslands in Central Germany. Biodiversity and Conservation, 6, 1293-1307. Delmotte F, Leterme N, Gauthier JP, Rispe C, Simon JC (2002) Genetic architecture of sexual and asexual
populations of the aphid Rhopalosiphum padi based on allozyme and microsatellite markers.Molecular Ecology, 11, 711-723.
Dixon AFG (1970) Aphids as root-fluid feeders. In: Methods of study in soil ecology (ed. Philopson J) pp.243-247 UNESCO, Paris.
Doebeli M, Knowlton N (1998) The evolution of interspecific mutualisms. Proceedings of the NationalAcademy of Sciences of the United States of America, 95, 8676-8680.
167
RE
FER
EN
CE
S
A.Ivens-diss 16-10-2012 11:15 Pagina 167
fDorken ME, Eckert CG (2001) Severely reduced sexual reproduction in northern populations of a clonalplant, Decodon verticillatus (Lythraceae). Journal of Ecology, 89, 339-350.
D'Souza TG, Michiels NK (2010) The costs and benefits of occasional sex: theoretical predictions and acase study. Journal of Heredity, 101, S34-S41.
D'Souza TG, Michiels NK (2006) Genetic signatures of occasional sex in parthenogenetic subpopulationsof the freshwater planarian Schmidtea polychroa. Freshwater Biology, 51, 1890-1900.
EEdwards DP, Hassall M, Sutherland WJ, Yu DW (2006) Selection for protection in an ant-plant mutual-
ism: host sanctions, host modularity and the principal-agent game. Pr yoceedings of the Royal SocietyB-Biological Sciences, 273, 595-602.
Ellstrand NC, Roose ML (1987) Patterns of genotypic diversity in clonal plant-species. American Journalof Botany, 74, 123-131.
FFarrell BD, Sequeira AS, O'Meara BC, Normark BB, Chung JH, Jordal BH (2001) The evolution of agri-FF
culture in beetles (Curculionidae : Scolytinae and Platypodinae). Evolution, 55, 2011-2027. Fawcett TW, Kuijper B, Weissing FJ, Pen I (2011) Sex-ratio control erodes sexual selection, revealing
evolutionary feedback from adaptive plasticity. Proceedings of the National Academy of Sciences of theUnited States of America, 108, 15925-15930.
F yerrière R, Bronstein JL, Rinaldi S, Law R, Gauduchon M (2002) Cheating and the evolutionary stabilityof mutualisms. Proceedings of the Royal Society of London Series B-Biological Sciences, 269, 773-780.
Ferrière R, Michod RE (2011) Inclusive fitness in evolution. Nature, 471, E6-E8. Firth D (1993) Bias reduction of maximum likelihood estimates. Biometrica, 80, 27-38. F fischer MK, Shingleton AW (2001) Host plant and ants influence the honeydew sugar composition of
aphids. Functional EcologyFF , 15, 544-550.Fletcher JA, Doebeli M (2009) A simple and general explanation for the evolution of altruism.
Proceedings of the Royal Society B-Biological Sciences, 276, 13-19. Foster KR, Kokko H (2006) Cheating can stabilize cooperation in mutualisms. Proceedings of the Royal
Society B-Biological Sciences, 273, 2233-2239. Foster KR, Wenseleers T (2006) A general model for the evolution of mutualisms. fJournal of
Evolutionary Biology, 19, 1283-1293. Foster WA (1978) Dispersal behaviour of an intertidal aphid. Journal of Animal Ecology, 47, 653-659. Foster WA (1975) Life-history and population biology of an intertidal aphid, Pemphigus trehernei Foster.
Transactions of the Royal Entomological Society of LondonTT , 127, 193-207.Foster WA, Treherne JE (1978) Dispersal mechanisms in an intertidal aphid. Journal of Animal Ecology,
47, 205-217. Frank SA (1996) Host-symbiont conflict over the mixing of symbiotic lineages. Proceedings of the Royal
Society of London Series B-Biological Sciences, 263, 339-344. Frank SA (1994) Genetics of mutualism - the evolution of altruism between species. Journal of Theo-
retical Biologyrr , 170, 393-400.Fu F, Hauert C, Nowak MA, Wang L (2008) Reputation-based partner choice promotes cooperation in
social networks. Physical Review E, 78, 026117.GGilabert A, Simon JC, Mieuzet L, et al (2009) Climate and agricultural context shape reproductive mode
variation in an aphid crop pest. Molecular Ecology, 18, 3050-3061. Giske M, Eliassen S, Fisken Ø, et al (in press) Maintenance of genotypic and phenotypic variation in
architecture, emotions and behaviour. Proceedings of the National Academy of Sciences of the UnitedStates of America, .
Godske L (1992) Aphids in nests of Lasius flavus F. in Denmark II: Population dynamics. EntomologiskeMeddelelser, 60, 21-26.
Godske L (1991) Aphids in nests of Lasius flavus F. in Denmark I: Faunistic description. EntomologiskeMeddelelser, 59, 85-89.
168
RE
FER
EN
CE
S
A.Ivens-diss 16-10-2012 11:15 Pagina 168
Gorospe KD, Karl SA (in review) Genetic relatedness does not retain spatial pattern across multiplespatial scales: dispersal and colonization in the coral, Pocillopora damicornis. PloS One.
Green RF, Noakes DLG (1995) Is a little bit of sex as good as a lot? Journal of Theoretical Biology, 174,87-96.
HHales DF, Tomiuk J, Wohrmann K, Sunnucks P (1997) Evolutionary and genetic aspects of aphid biology:
A review. European Journal of Entomology, 94, 1-55. Halkett F, Simon J, Balloux F (2005) Tackling the population genetics of clonal and partially clonal
organisms. Trends in Ecology & Evolutionrr , 20, 194-201. Hallatschek O, Hersen P, Ramanathan S, Nelson DR (2007) Genetic drift at expanding frontiers pro-
motes gene segregation. Pr foceedings of the National Academy of Sciences of the United States ofAmerica, 104, 19926-19930.
Hamilton WD (1964a) Genetical evolution of social behaviour 1. Journal of Theoretical Biology, 7, 1-16.Hamilton WD (1964b) Genetical evolution of social behaviour 2. Journal of Theoretical Biology, 7, 17-52.Hamilton WD, May RM (1977) Dispersal in stable habitats. Nature, 269, 578-581. Harper J (1977) Population biology of plants. Academic Press, London.Hartl DL, Clark AG (1997) Principles of population genetics. Sunderland, Sinauer Ass. Hata H, Kato M (2006) A novel obligate cultivation mutualism between damselfish and Polysiphonia
algae. Biology Letters, 2, 593-596. Hata H, Kato M (2004) Monoculture and mixed-species algal farms on a coral reef are maintained
through intensive and extensive management by damselfishes. Journal of experimental marinebiology and ecology, 313, 285-296.
Hata H, Kato M (2002) Weeding by the herbivorous damselfish Stegastes nigricans in nearly monocul-tural algae farms. Marine Ecology-Progress Series, 237, 227-231.
Hata H, Watanabe K, Kato M (2010) Geographic variation in the damselfish-red alga cultivation mutual-ism in the Indo-West Pacific. BMC Evolutionary Biology, 10.
Heie OE (1986) The Aphidoidea (Hemiptera) of Fennoscandia and Denmark. III. Fauna EntomologicaFFScandinavica, 17, 1-314.
Heie OE (1980) The Aphidoidea (Hemiptera) of Fennoscandia and Denmark. I. Fauna EntomologicaFFScandinavica, 9, 1-236.
Herre EA, Knowlton N, Mueller UG, Rehner SA (1999) The evolution of mutualisms: exploring the pathsbetween conflict and cooperation. Trends in Ecology & Evolutionrr , 14, 49-53.
fHoeksema JD, Bruna EM (2000) Pursuing the big questions about interspecific mutualism: a review oftheoretical approaches. Oecologia, 125, 321-330.
Hölldobler B, Wilson EO (1990) The Ants. Harvard University Press, Cambridge,MA. Hothorn T, Bretz F, Westfall P (2008) Simultaneous inference in general parametric models. Biometrical
Journal, 50, 346-363. Hruschka D, Henrich J (2006) Friendship, cliquishness, and the emergence of cooperation. fJournal of
Theoretical Biology, 239, 1-15. Hurst L, Peck J (1996) Recent advances in understanding of the evolution and maintenance of sex.
Trends in Ecology & Evolutionrr , 11, A46-A52.IIchinose G, Arita T (2008) The role of migration and founder effect for the evolution of cooperation in a
multilevel selection context. Ecological Modelling, 210, 221-230. Ivens ABF, Kronauer DJC, Pen I, Weissing FJ, Boomsma JJ (2012a) Ants farm subterranean aphids
mostly in single clone groups – an example of prudent husbandry for carbohydrates and proteins?BMC Evolutionary Biology, 12, 106.
Ivens ABF, Kronauer DJC, Pen I, Weissing FJ, Boomsma JJ (2012b) Reproduction and dispersal in anant-associated root aphid community. Molecular Ecology, 21, 4257-4269.
Ivens ABF, Kronauer DJC, Boomsma JJ (2011) Characterisation and cross-amplification of polymorphicmicrosatellite loci in ant-associated root-aphids. Conservation Genetics Resources, 3, 73-77.
169
RE
FER
EN
CE
S
A.Ivens-diss 16-10-2012 11:15 Pagina 169
Ivens ABF, Nash DR, Poulsen M, Boomsma JJ (2009) Caste-specific symbiont policing by workers ofIvens ABF, Nash DR, Poulsen M, Boomsma JJ (2009) Caste-specific symbiont policing by workers ofAcromyrmex fungus-growing ants. Behavioural Ecology, 20, 378-384.
JJames F (1994) RANLUX: A Fortran implementation of the high-quality pseudo-random number genera-
tor of Lüscher. Computer Physics Communications, 79, 111-114. Jander KC, Herre EA (2010) Host sanctions and pollinator cheating in the fig tree-fig wasp mutualism.
Proceedings of the Royal Society B-Biological Sciences, 277, 1481-1488.Jansen VAA, van Baalen M (2006) Altruism through beard chromodynamics. Nature, 440, 663-666. Janssen MA, Goldstone RL (2006) Dynamic-persistence of cooperation in public good games when
group size is dynamic. Journal of Theoretical Biology, 243, 134-142. Janzen T (2009) Within nest genetics of Lasius flavus and one of its mutualistsWW Tetraneura ulmi. M.Sc.TT
Thesis, University of Groningen, Groningen.AJin L, Chakraborty R (1993) A bias-corrected estimate of heterozygosity for single-probe multilocus DNA
fingerprints. Molecular Biology and Evolution, 10, 1112-1114. Johnson PCD, Llewellyn KS, Amos W (2000) Microsatellite loci for studying clonal mixing, population
structure and inbreeding in a social aphid, Pemphigus spyrothecae (Hemiptera : Pemphigidae).Molecular Ecology, 9, 1445-1446.
KKanbe T, Akimoto SI (2009) Allelic and genotypic diversity in long-term asexual populations of the pea
aphid, Acyrthosiphon pisum in comparison with sexual populations. Molecular Ecology, 18, 801-816.Keller L, Ross KG (1998) Selfish genes: a green beard in the red fire ant. Nature, 394, 573-575. Kiers ET, Denison RF (2008) Sanctions, cooperation, and the stability of plant-rhizosphere mutualisms.
Annual Review of Ecology Evolution and Systematics, 39, 215-236. Kiers ET, Denison RF, Kawakita A, Herre EA (2011) The biological reality of host sanctions and partner
fidelity. Proceedings of the National Academy of Sciences of the United States of America, 108, E7-E7. Kiers ET, Rousseau RA, West SA, Denison RF (2003) Host sanctions and the legume-rhizobium mutual-
ism. Nature, 425, 78-81. yKillingback T, Bieri J, Flatt T (2006) Evolution in group-structured populations can resolve the tragedy
of the commons. Proceedings of the Royal Society B-Biological Sciences, 273, 1477-1481. Kindlmann P, Hulle M, Stadler B (2007) Timing of dispersal: effect of ants on aphids. Oecologia, 152,
625-631. Koch W (2012) Effects of intra-colony relatedness and environmental stress on the production of sexuals in
the ant Lasius flavus. M.Sc. Thesis, University of Groningen, Groningen. Korb J, Aanen DK (2003) The evolution of uniparental transmission of fungal symbionts in fungus-
growing termites (Macrotermitinae). Behavioural Ecology and Sociobiology, 53, 65-71. Kosztarab M, Kozár F (1988) Scale insects of Central Europe. Akademiai Kiado, Budapest, Hungary. Kronauer DJC, Pierce NE, Keller L (in review) Invasion of the clones – The global spread of the partheno-
genetic ant Cerapachys biroi. Molecular Ecology. Kümmerli R, Gardner A, West SA, Griffin AS (2009) Limited dispersal, budding dispersal, and coopera-
tion: an experimental study. Evolution, 63, 939-949. LLaland KN, Boogert NJ (2010) Niche construction, co-evolution and biodiversity. Ecological Economics,
69, 731-736. Larsen CS (1995) Biological changes in human populations with agriculture. Annual Review of Anthro-
pology, 24, 185-213. Law R (1985) Evolution in a mutualistic environment. In: The Biology of Mutualism (ed. Boucher DH)
pp. 145-191 Oxford University Press, Oxford. Law R, Lewis DH (1983) Biotic environments and the maintenance of sex - some evidence from mutual-
istic symbioses. Biological Journal of the Linnean Society, 20, 249-276. Le Galliard JF, Ferrière R, Dieckmann U (2003) The adaptive dynamics of altruism in spatially heteroge-
neous populations. Evolution, 57, 1-17.
170
RE
FER
EN
CE
S
A.Ivens-diss 16-10-2012 11:15 Pagina 170
L f fehmann L, Keller L (2006) The evolution of cooperation and altruism - a general framework and aclassification of models. Journal of Evolutionary Biology, 19, 1365-1376.
Leigh EG (2010) The evolution of mutualism. Journal of Evolutionary Biology, 23, 2507-2528.Leimar O, Connor RC (2003) By-product benefits, reciprocity and pseudoreciprocity in mutualism. In:
Genetic and cultural evolution of cooperation (ed. Hammerstein P) pp. 203-222 The MIT press,Cambridge, MA.
Lenoir L (2009) Effects of ants on plant diversity in semi-natural grasslands. Arthropod-Plant Inter-actions, 3, 163-172.
Login FH, Balmand S, Vallier A, et al. (2011) Antimicrobial peptides keep insect endosymbionts undercontrol. Science, 334, 362-365.
Lüscher M (1994) A portable high-quality random number generator for lattice field theory calculations.Computer Physics Communications, 79, 100-110.
MMack KML (2012) Selective feedback between dispersal distance and the stability of mutualism. Oikos,
121, 442-448. Margulis L (1971) Symbiosis and evolution. Scientific American, 225, 49-55. McFall-Ngai M (2008) Hawaiian bobtail squid. Current Biology, 18, R1043-R1044. McNamara JM, Barta Z, Fromhage L, Houston AI (2008) The coevolution of choosiness and coopera-
tion. Nature, 451, 189-192. Michel AP, Zhang W, Jung JK, Kang S, Mian MAR (2009) Population genetic structure of Aphis glycines.
Environmental Entomology, 38, 1301-1311. Mikheyev AS, Mueller UG, Abbot P (2006) Cryptic sex and many-to-one colevolution in the fungus-
growing ant symbiosis. Pr foceedings of the National Academy of Sciences of the United States ofAmerica, 103, 10702-10706.
Miller NJ, Birley AJ, Tatchell GM (2000) Polymorphic microsatellite loci from the lettuce root aphid,Pemphigus bursarius. Molecular Ecology, 9, 1951-1952.
Moran NA (1992) The evolution of aphid life-cycles. Annual Review of Entomology, 37, 321-348. Moran NA, McCutcheon JP, Nakabachi A (2008) Genomics and evolution of heritable bacterial sym-
bionts. Annual Review of Genetics, 42, 165-190.fMueller UG (2002) Ant versus fungus versus mutualism: Ant-cultivar conflict and the deconstruction of
the attine ant-fungus symbiosis. American Naturalist, 160, S67-S98. Mueller UG, Gerardo NM, Aanen DK, Six DL, Schultz TR (2005) The evolution of agriculture in insects.
Annual Review of Ecology Evolution and Systematics, 36, 563-595. Mueller UG, Rehner SA, Schultz TR (1998) The evolution of agriculture in ants.RR Science, 281, 2034-2038.Mueller UG, Scott JJ, Ishak HD, Cooper M, Rodrigues A (2010) Monoculture of leafcutter ant gardens.
Plos One, 5, e12668. Muir DA (1960) A culture method for myrmecophilous root aphids. Bulletin of Entomological Research,
51, 7-8.Muir DA (1959) The ant-aphid-plant relationship in West Dunbartonshire. Journal of Animal Ecology,
28, 133-140. Mylius S, Diekmann O (1995) On evolutionarily stable life histories, optimization and the need to be
specific about density dependence. Oikos, 74, 218-224.NNadell CD, Foster KR, Xavier JB (2010) Emergence of spatial structure in cell groups and the evolution
of cooperation. PLoS computational biology, 6, e1000716.Nauta MJ, Weissing FJ (1996) Constraints on allele size at microsatellite loci: implications for genetic
differentiation. Genetics, 143, 1021-1032. Noë R, Hammerstein P (1994) Biological markets - supply and demand determine the effect of partner
choice in cooperation, mutualism and mating. Behavioural Ecology and Sociobiology, 35, 1-11. Nowak M, Sigmund K (1993) A strategy of win-stay, lose-shift that outperforms Tit-For-Tat in the
Prisoners Dilemma game. Nature, 364, 56-58.
171
RE
FER
EN
CE
S
A.Ivens-diss 16-10-2012 11:15 Pagina 171
f fNowak MA (2006) Five rules for the evolution of cooperation. Science, 314, 1560-1563. Nowak MA, May RM (1992) Evolutionary games and spatial chaos. Nature, 359, 826-829. Nowak MA, Tarnita CE, Wilson EO (2011) In defence of inclusive fitness theory. Nature, 471, E9-E10. Nowak MA, Tarnita CE, Wilson EO (2010) The evolution of eusociality. Nature, 466, 1057-1062.OOdum EP, Pontin AJ (1961) Population density of underground ant, Lasius Flavus y, as determined by
tagging with P-32. Ecology, 42, 186-188.Offenberg J (2001) Balancing between mutualism and exploitation: the symbiotic interaction between
Lasius ants and aphids. Behavioural Ecology and Sociobiology, 49, 304-310. Ohtsuki H, Hauert C, Lieberman E, Nowak M (2006) A simple rule for the evolution of cooperation on
graphs and social networks. Nature, 441, 502-505.Olff H, De Leeuw J, Bakker J, Platerink R, Van Wijnen H, De Munck W (1997) Vegetation succession
and herbivory in a salt marsh: changes induced by sea level rise and silt deposition along an eleva-tional gradient. Journal of Ecology, 85, 799-814.
Oliver TH, Leather SR, Cook JM (2009) Tolerance traits and the stability of mutualism. Oikos, 118,346-352.
Oliver TH, Mashanova A, Leather SR, Cook JM, Jansen VAA (2007) Ant semiochemicals limit apterousaphid dispersal. Proceedings of the Royal Society B-Biological Sciences, 274, 3127-3131.
PP falfner G, Casanova-Katny M, Read D (2005) The mycorrhizal community in a forest chronosequence of
Sitka spruce [Picea sitchensis (Bong.) Carr.] in Northern England. Mycorrhiza, 15, 571-579. Palmer TM, Doak DF, Stanton ML, et al (2010) Synergy of multiple partners, including freeloaders,
increases host fitness in a multispecies mutualism. Pr foceedings of the National Academy of Sciences ofthe United States of America, 107, 17234-17239.
Paradis E, Claude J, Strimmer K (2004) APE: Analyses of Phylogenetics and Evolution in R language.Bioinformatics, 20, 289-290.
Parks JC, Werth CR (1993) A study of spatial features of clones in a population of Bracken Fern,Pteridium aquilinum (Dennstaedtiaceae). American Journal of Botany, 80, 537-544.
Paul RG (1977) Aspects of the biology and taxonomy of British myrmecophilous root aphids. PhD Thesis,Department of Entomology, Britsh Museum, London.
Peakall R, Ruibal M, Lindenmayer DB (2003) Spatial autocorrelation analysis offers new insights intogene flow in the Australian bush rat, Rattus fuscipes. Evolution, 57, 1182-1195.
Peakall R, Smouse PE (2006) GENALEX 6: genetic analysis in Excel. Population genetic software forteaching and research. Molecular Ecology Notes, 6, 288-295.
Pen I, Taylor P (2005) Modelling information exchange in worker-queen conflict over sex allocation.Proceedings of the Royal Society B-Biological Sciences, 272, 2403-2408.
Pen yI, Weissing F (2000) Towards a unified theory of cooperative breeding: the role of ecology and life historyre-examined. Proceedings of the Royal Society of London Series B-Biological Sciences, 267, 2411-2418.
Pepper JW, Smuts BB (2002) A mechanism for the evolution of altruism among nonkin: Positive assort-ment through environmental feedback. American Naturalist, 160, 205-213.
Perc M, Szolnoki A (2010) Coevolutionary games-A mini review. Biosystems, 99, 109-125. Pontin AJ (1978) Numbers and distribution of subterranean aphids and their exploitation by the ant
Lasius flavus (Fabr.). Ecological Entomology, 3, 203-207. Pontin AJ (1963) Further considerations of competition and the ecology of the ants Lasius flavus (F) and
L. niger (L). Journal of Animal Ecology, 32, 565-574. Pontin AJ (1961a) Population stabilization and competition between the ants Lasius flavus (F) and L.
niger (L). Journal of Animal Ecology, 30, 47-54. Pontin AJ (1961b) The prey of Lasius niger (L.) and L. flavus (F.) (Hym., Formicidae). The Entomologist's
Monthly Magazine, 97, 135-137. Pontin AJ (1959) Some records of predators and parasites adapted to attack aphids attended by ants.
The Entomologist's Monthly Magazine, 95, 154-155.
172
RE
FER
EN
CE
S
A.Ivens-diss 16-10-2012 11:15 Pagina 172
P f fontin AJ (1958) A preliminary note on the eating of aphids by ants of the genus Lasius (Hym.,Formicidae). The Entomologist's Monthly Magazine, 94, 9-11.
Poulsen M (2005) Conflict and Cooperation in Fungus-growing Ant Mutualisms. fPhD-thesis, University ofCopenhagen.
Poulsen M, Boomsma JJ (2005) Mutualistic fungi control crop diversity in fungus-growing ants. Science,307, 741-744.
Poulsen M, Fernandez-Marin H, Currie CR, Boomsma JJ (2009) Ephemeral windows of opportunity forhorizontal transmission of fungal symbionts in leaf-cutting ants. Evolution, 63, 2235-2247.
QQueller D (1994) Genetic relatedness in viscous populations. Evolutionary Ecology, 8, 70-73. Queller DC (1985) Kinship, reciprocity and synergism in the evolution of social behaviour. Nature, 318,
366-367.Queller DC, Ponte E, Bozzaro S, Strassmann JE (2003) Single-gene greenbeard effects in the social
amoeba Dictyostelium discoideum. Science, 299, 105-106. Queller D (1992) Does population viscosity promote kin selection. Trends in Ecology & Evolutionrr , 7, 322-324.RR Development Core Team (2011) R: A language and environment for statistical computing.Rasmusen E (2006) Games and information. Blackwell Publishing Ltd, Oxford. Raymond M, Rousset F (1995) An exact test for population differentiation. Evolution, 49, 1280-1283. Réaumur RA (1738) Memoires pour servir a l'histoire de insectes 3:1-312, Amsterdam. Rispe C, Pierre JS, Simon JC, Gouyon PH (1998) Models of sexual and asexual coexistence in aphids
based on constraints. Journal of Evolutionary Biology, 11, 685-701. Rohlf FJ, Sokal RR (1981) RR Statistical tables, second edn. W.H. Freeman and Company, San Francisco.Rousset F (2008) GENEPOP ' 007: a complete re-implementation of the GENEPOP software for WindowsRR
and Linux. Molecular Ecology Resources, 8, 103-106. Rozen S, Skaletsky HJ, Krawetz S, Misener S (2000) Primer3 on the WWW for general users and for
biologist programmers. In: Bioinformatics Methods and Protocols: Methods in Molecular Biology pp.365-386 Humana Press, Totowa, NJ.
Rütten K, Schulz I, Olek K, Uhl G (2001) Polymorphic microsatellite markers in the spider Pholcus pha-langioides isolated from a library enriched for CA repeats. Molecular Ecology Notes, 1, 255-257.
SSachs JL, Mueller UG, Wilcox TP, Bull JJ (2004) The evolution of cooperation. fQuarterly Review of
Biology, 79, 135-160. Sachs JL, Simms EL (2006) Pathways to mutualism breakdown. Trends in Ecology & Evolutionrr , 21, 585-
592. Sarkar D (2008) Lattice: multivariate data visualization with R. Springer, New York. Schiøtt M, Rogowska-Wrzesinska A, Roepstorff P, Boomsma JJ (2010) Leaf-cutting ant fungi produce cell
wall degrading pectinase complexes reminiscent of phytopathogenic fungi. BMC Biology, 8, 156.Seifert B (2007) Die Ameisen Mittel- und Nordeuropas. Lutra, Görlitz. Selten R, Hammerstein P (1984) Gaps in Harley argument on evolutionarily stable learning rules and in
the logic of Tit for Tat. Behavioural and Brain Sciences, 7, 115-116. Severance EG, Karl SA (2006) Contrasting population genetic structures of sympatric, mass-spawning
Caribbean corals. Marine Biology, 150, 57-68. Sherratt T, Roberts G (1998) The evolution of generosity and choosiness in cooperative exchanges.
Journal of Theoretical Biology, 193, 167-177.Simon JC, Baumann S, Sunnucks P, et al. f(1999) Reproductive mode and population genetic structure of
the cereal aphid Sitobion avenae studied using phenotypic and microsatellite markers. MolecularEcology, 8, 531-545.
Simon JC, Carrel E, Hebert PDN, Dedryver CA, Bonhomme J, LeGallic JF (1996) Genetic diversity andmode of reproduction in French populations of the aphid Rhopalosiphum padi L. Heredity, 76, 305-313.
173
RE
FER
EN
CE
S
A.Ivens-diss 16-10-2012 11:15 Pagina 173
fSimon JC, Rispe C, Sunnucks P (2002) Ecology and evolution of sex in aphids. Trends in Ecology &Evolution, 17, 34-39.
Smart L (1991) Asymmetric interactions between ants, aphids and plants. PhD Thesis, University of Bath.Smouse PE, Long JC, Sokal RR (1986) Multiple-regression and correlation extensions of the Mantel test
of matrix correspondence. Systematic Zoology, 35, 627-632. Smouse PE, Peakall R (1999) Spatial autocorrelation analysis of individual multiallele and multilocus
genetic structure. Heredity, 82, 561-573.Stachowicz JJ (2001) Mutualism, facilitation, and the structure of ecological communities. Bioscience,
51, 235-246. Stadler B, Dixon AFG (2005) Ecology and evolution of aphid-ant interactions. yAnnual Review of Ecology
Evolution and Systematics, 36, 345-372. Stadler B, Dixon T (2008) Mutualism: Ants and their insect partners. Cambridge University Press, Cambridge.Stamati K, Hollingsworth PM, Russell J (2007) Patterns of clonal diversity in three species of sub-arctic
willow (Salix lanata, Salix lapponum and Salix herbacea). Plant Systematics and Evolution, 269, 75-88.Stenberg P, Lundmark M, Knutelski S, Saura A (2003a) Evolution of clonality and polyploidy in a weevil
system. Molecular Biology and Evolution, 20, 1626-1632.Stenberg P, Lundmark M, Saura A (2003b) MLGsim: a program for detecting clones using a simulation
approach. Molecular Ecology Notes, 3, 329-331. Stoeckel S, Grange J, Fernandez-Manjarres JF, Bilger I, Frascaria-Lacoste N, Mariette S (2006)
Heterozygote excess in a self-incompatible and partially clonal forest tree species - Prunus avium L.Molecular Ecology, 15, 2109-2118.
Sunnucks P, DeBarro PJ, Lushai G, Maclean N, Hales D (1997) Genetic structure of an aphid studiedusing microsatellites: Cyclic parthenogenesis, differentiated lineages and host specialization.Molecular Ecology, 6, 1059-1073.
TTaylor PD (1988) An inclusive fitness model for dispersal of offspring.TT Journal of Theoretical Biology,
130, 363-378. Taylor P (1992) Altruism in viscous populations - an inclusive fitness model. TT Evolutionary Ecology, 6,
352-356. Teacher AGF, Griffiths DJ (2011) HapStar: automated haplotype network layout and visualization.TT
Molecular Ecology Resources, 11, 151-153.Tegelaar K, Hagman M, Glinwood R, Pettersson J, Leimar O (2011) Ant-aphid mutualism: the influenceTT
of ants on the aphid summer cycle. Oikos, 121, 61-66. yThompson J, Fernandez C (2006) Temporal dynamics of antagonism and mutualism in a geographically
variable plant-insect interaction. Ecology, 87, 103-112. Tibayrenc M, Kjellberg F, Ayala FJ (1990) A clonal theory of parasitic protozoa: The population struc-
tures of Entamoeba, Giardia, Leishmania, Naegleria, Plasmodium, TrichomonasTT , and TrypanosomaTT andtheir medical and taxonomical consequences. Proceedings of the National Academy of Sciences of theUnited States of America, 87, 2414-2418.
Trivers RL (1971) Evolution of reciprocal altruism. TT Quarterly Review of Biology, 46, 35-56. VVvvan Boheemen LA (2010) Ecological stress interacting with genetic diversity and fitness consequences of an
eusocial insect. M.Sc. Thesis, University of Groningen, Groningen.vvan Borm S, Buschinger A, Boomsma J, Billen J (2002) Tetraponera ants have gut symbionts related to
nitrogen-fixing root-nodule bacteria. Proceedings of the Royal Society of London Series B-BiologicalSciences, 269, 2023-2027.
VVan Damme E (1991) VV Stability and Perfection of Nash Equilibria, 2nd edn. Springer-Verlag, Berlin. VVan Doorn G, Hengeveld G, Weissing F (2003) The evolution of social dominance - I: Two-playerVV
models. Behaviour, 140, 1305-1332.VVantaux A, Billen J, Wenseleers T (2011a) Levels of clonal mixing in the black bean aphid VV Aphis fabae, a
facultative ant mutualist. Molecular Ecology, 20, 4772-4785.
174
RE
FER
EN
CE
S
A.Ivens-diss 16-10-2012 11:15 Pagina 174
VVantaux A, Parmentier T, Billen J, Wenseleers T (2012) Do VV Lasius niger kants punish low-quality blackbean aphid mutualists? Animal Behaviour, 83, 257-262.
VVantaux A, Van den Ende W, Billen J, Wenseleers T (2011b) Large interclone differences in melezitoseVVsecretion in the facultatively ant-tended black bean aphid Aphis fabae. Journal of Insect Physiology,57, 1614-1621.
VVeen GF (2011) VV Living apart together - Interactions between aboveground grazers, plants and soil biota.PhD Thesis, University of Groningen, Groningen.
VVerbruggen E, El Mouden C, Jansa J,VV et al. (2012) Spatial Structure and Interspecific Cooperation:Theory and an Empirical Test Using the Mycorrhizal Mutualism. American Naturalist, 179, E133-E146.
VVillate L, Esmenjaud D, Van Helden M, Stoeckel S, Plantard O (2010) Genetic signature of amphimixisyallows for the detection and fine scale localization of sexual reproduction events in a mainly
parthenogenetic nematode. Molecular Ecology, 19, 856-873. Völkl W, Woodring J, Fischer M, Lorenz MW, Hoffmann KH (1999) Ant-aphid mutualisms: the impact ofVölkl W, Woodring J, Fischer M, Lorenz MW, Hoffmann KH (1999) Ant-aphid mutualisms: the impact of
honeydew production and honeydew sugar composition on ant preferences. Oecologia, 118, 483-491.
VVorburger C (2006) Temporal dynamics of genotypic diversity reveal strong clonal selection in the aphidVVMyzus persicae. Journal of Evolutionary Biology, 19, 97-107.
WWWallisDeVries MF, Poschlod P, Willems JH (2002) Challenges for the conservation of calcareous grass-WW
lands in northwestern Europe: integrating the requirements of flora and fauna. BiologicalConservation, 104, 265-273.
WWalsh PS, Metzger DA, Higuchi R (1991) Chelex 100 as a medium for simple extraction of DNA forWWPCR-based typing from forensic material. Biotechniques, 10, 506-513.
WWay MJ (1963) Mutualism between ants and honeydew-producing Homoptera.WW fAnnual Review ofEntomology, 8, 307-344.
WWeber NA (1972) Fungus-culturing behaviour of ants.WW American Zoologist, 12, 577-587. WWeir BS, Cockerham CC (1984) Estimating F-Statistics for the analysis of population structure. WW Evolution,
38, 1358-1370.WWelch D, Meselson M (2000) Evidence for the evolution of bdelloid rotifers without sexual reproductionWW
or genetic exchange. Science, 288, 1211-1215. WWeng Y, Azhaguvel P, Michels GJ, Rudd JC (2007) Cross-species transferability of microsatellite markers
from six aphid (Hemiptera: Aphididae) species and their use for evaluating biotypic diversity in twocereal aphids. Insect Molecular Biology, 16, 613-622.
WWest SA, Griffin AS, Gardner A (2007) Evolutionary explanations for cooperation.WW Current Biology, 17,R661-R672.
WWest SA, Herre EA (1994) The ecology of the new-world fig-parasitizing wasps Idarnes and implicationsWWfor the evolution of the fig-pollinator mutualism. Proceedings of the Royal Society of London Series B-Biological Sciences, 258, 67-72.
WWest S, Pen I, Griffin A (2002) Conflict and cooperation - Cooperation and competition between rela-WWtives. Science, 296, 72-75.
WWest-Eberhard M (1975) Evolution of social behaviour by kin selection. WW Quarterly Review of Biology, 50,1-33.
WWeyl EG, Frederickson ME, Yu DW, Pierce NE (2010) Economic contract theory tests models of mutual-WWism. Proceedings of the National Academy of Sciences of the United States of America, 107, 15712-15716.
WWeyl EG, Frederickson ME, Yu DW, Pierce NE (2011) Reply to Kiers WW et al.: Economic and biologicalclarity in the theory of mutualism. Proceedings of the National Academy of Sciences of the UnitedStates of America, 108, E8-E8.
WWolf M, Van Doorn GS, Weissing FJ (2011) On the coevolution of social responsiveness and behaviouralWWconsistency. Proceedings of the Royal Society B-Biological Sciences, 278, 440-448.
175
RE
FER
EN
CE
S
A.Ivens-diss 16-10-2012 11:15 Pagina 175
W ffoodring J, Wiedemann R, Fischer MK, Hoffmann KH, Volkl W (2004) Honeydew amino acids in rela-WWftion to sugars and their role in the establishment of ant-attendance hierarchy in eight species of
aphids feeding on tansy (Tanacetum vulgareTT ). Physiological Entomology, 29, 311-319.WWulff JL (1985) Clonal organisms and the evolution of mutualism. In: WW Population biology and evolution
of clonal organisms w(eds. Jackson JBC, Buss LW, Cook RE) pp. 437-466 Yale University Press, NewHaven, CT.
XXXhaard C, Fabre B, Andrieux A, et al (2011) The genetic structure of the plant pathogenic fungus
Melampsora larici-populina- on its wild host is extensively impacted by host domestication. rMolecularEcology, 20, 2739-2755.
YYYYamamura N (1993) Vertical transmission and evolution of mutualism from parasitism. YY Theoretical
Population Biology, 44, 95-109. YYamamura N, Higashi M, Behera N, Wakano JY (2004) Evolution of mutualism through spatial effects.YY
Journal of Theoretical Biology, 226, 421-428. YYao I (2010) Contrasting patterns of genetic structure and dispersal ability in ant-attended and non-YY
attended TuberculatusTT aphids. Biology letters, 6, 282-286. YYao I, Akimoto S (2009) Seasonal changes in the genetic structure of an aphid-ant mutualism as revealedYY
using microsatellite analysis of the aphid Tuberculatus quercicolaTT and the ant Formica yessensis.FFJournal of Insect Science, 9, 1-18.
YYao I, Akimoto S (2001) Ant attendance changes the sugar composition of the honeydew of theYYdrepanosiphid aphid Tuberculatus quercicolaTT . Oecologia, 128, 36-43.
YYonezawa K, Ishii T, Nagamine T (2004) The effective size of mixed sexually and asexually reproducingYYpopulations. Genetics, 166, 1529-1539.
YYoung AG, Hill JH, Murray BG, Peakall R (2002) Breeding system, genetic diversity and clonal structureYYin the sub-alpine forb Rutidosis leiolepis F. Muell. (Asteraceae). Biological Conservation, 106, 71-78.
ZZhang C, Zhang J, Weissing FJ, Perc M, Xie G, Wang L (2012) Diferent reactions to adverse neighbours-
hoods in games of cooperation. Plos One, 7, e35183.Zwölfer H (1958) Zur systematik, biologie, and ökologie unterirdisch lebender Aphiden (Homoptera,
Aphidoidea). Zeitschrift für angewandte Entomologie, 40, 182-221.
176
RE
FER
EN
CE
S
A.Ivens-diss 16-10-2012 11:15 Pagina 176

177
A.Ivens-diss 16-10-2012 11:15 Pagina 177

A.Ivens-diss 16-10-2012 11:15 Pagina 178

Samenvatting
A.Ivens-diss 16-10-2012 11:15 Pagina 179
MUTUALISME
Mutualisme, een interactie tussen organismen die tot verschillende soorten behoren enwwaarvan beide ‘partners’ profijt hebben, komt veel voor in de natuur. We kunnen zelfsstellen dat mutualismen het leven op aarde zoals we dat kennen over miljoenen jarenhebben beïnvloed en ook nu nog steeds beïnvloeden. Zo wordt bijvoorbeeld de energie-vvoorziening in de cellen van de meeste organismen verzorgd door mitochondriën die langgeleden nog onafhankelijke, mutualistische bacteriën waren. Mutualismen in allerleivvormen en maten zijn ook belangrijk voor de stabiliteit van ecosystemen in onze verande-rende wereld; denk aan planten en hun bestuivende insecten en de verspreiding van zadendoor vogels en knaagdieren. Andere mutualismen die iedere dag weer van invloed zijn opons leven zijn de interacties tussen ons en ons vee en onze gewassen, maar ook bijvoor-beeld onze ‘samenwerking’ met de bacteriën in onze darmen: zij helpen de vertering vanons voedsel in ruil voor veilige ‘woonruimte’ en continue aanvoer van hun eigen nutriën-ten.
Ondanks het overduidelijke belang van mutualisme voor het leven op onze planeet isdit proces historisch onderbelicht gebleven in de evolutiebiologie; traditioneel kregen pro-cessen als competitie en gastheer-parasiet-interacties meer aandacht. Pas sinds de laatstetwee decennia beseffen evolutiebiologen dat het ontstaan van mutualismen en hun stabi-liteit over evolutionaire tijd niet vanzelfsprekend zijn en tot op heden onbegrepen zijngebleven.
Het doel van dit proefschrift was om meer inzicht te krijgen in de evolutie en ecologievvan mutualismen. Om deze inzichten te krijgen maakte ik gebruik van twee complemen-taire invalshoeken. Allereerst deed ik empirisch, (moleculair) kecologisch onderzoekaan één specifiek mutualisme, dat tussen de Gele weidemier en de wortelbladluizen inhaar nest. Ten tweede combineerde ik dit met theoretisch onderzoek in de vorm vansimulatiemodellen die de evolutie van samenwerking binnen en tussen soorten nabootsen.
DE PUZZEL DIE DE EVOLUTIE VAN SAMENWERKING HEET
De evolutie van samenwerking is één van de grootste vraagstukken binnen de evolutiethe-orie. Natuurlijke selectie is immers gebaseerd op competitie om voortplanting en overle-vving. Hoe hebben deze concurrerende organismen dan toch het vermogen ontwikkeldelkaar te helpen, terwijl ze vaak meer voordeel zouden kunnen behalen wanneer ze alleenvvan anderen zouden profiteren zonder zelf te investeren?
Samenwerking binnen soortenDit probleem is zeer uitgebreid onderzocht voor het geval van samenwerking tussen soort-genoten (‘binnen soorten’). De belangrijkste mechanismen die tot de evolutie van samen-wwerking kunnen leiden kunnen worden onderverdeeld in twee categorieën: (1) De eerste categorie bestaat uit mechanismen die ervoor zorgen dat potentiële samen-
kwerkingspartners niet willekeurig bij elkaar komen. Een voorbeeld van een dergelijkmechanisme is het zogeheten kin selection, waarbij samenwerking tussen familieleden
180
SA
ME
NV
AT
TIN
G
A.Ivens-diss 16-10-2012 11:15 Pagina 180
als bijkomend voordeel heeft dat gemeenschappelijke genen worden doorgegeven. Eenander voorbeeld is samenwerking die kan ontstaan wanneer individuele organismen,die de neiging hebben tot helpen, bij elkaar in de buurt blijven, bijvoorbeeld omdat zezich zelden verspreiden.
(2) De tweede categorie bevat mechanismen die de investering in samenwerking af latenhangen van de acties van anderen of van omgevingskenmerken. Een voorbeeld hiervanis Tit-for-TatTT :‘voor wat, hoort wat’.
Samenwerking tussen soortenKKin selection bleek één van de beste verklaringen te zijn voor samenwerking tussen soort-genoten. Voor mutualisme, de samenwerking tussen organismen van verschillende soorten(‘tussen soorten’), kan kin selection echter geen rol spelen: verschillende soorten delen hungenen per definitie niet. Het bestaan van mutualisme is daarom tot nu toe onverklaardgebleven en wordt gezien als één van de grote onopgeloste vraagstukken binnen de evolu-tiebiologie. Dit vraagstuk is tweeledig: (1) Ten eerste is het onduidelijk hoe mutualismenkunnenkk ontstaan. (2) Ten tweede is het onduidelijk hoe mutualismen als zodanig in standblijven. Dit laatste kan namelijk problematisch zijn omdat natuurlijke selectie altijd opbeide partners apart van toepassing zal zijn en niet op de interactie als geheel. Dat bete-k kent dat partners door natuurlijke selectie zullen worden geselecteerd om zoveel mogelijkvvan de interactie te profiteren en er zelf zo weinig mogelijk in te investeren. Met anderewwoorden: theoretisch zouden mutualisten door natuurlijke selectie moeten worden gedre-vven tot het parasiteren van hun partner. Toch wijst het wijdverbreid voorkomen van mutu-alisme erop dat een mutualistische interactie niet zomaar een parasitaire interactie wordt.Welke mechanismen zorgen ervoor dat dit niet gebeurt? En welke mechanismen zorgen erWWeigenlijk voor dat die mutualismen überhaupt vanuit het niets kunnen ontstaan? Hieronderzal ik de voornaamste theoretische ideeën over het ontstaan en in stand blijven van mutu-alismen behandelen.(1) Dit eerste idee betreft voornamelijk het ontstaan van mutualismen. Veel mutualismen
komen waarschijnlijk voort uit bijproduct-interacties. Dit zijn interacties waarbij er bijeen handeling van de ene soort een bijproduct ontstaat dat van waarde is voor eenandere soort. Belangrijke voorbeelden hiervan zijn honingdauwmutualismen. Hierbijscheiden insecten die leven op plantensappen (bijvoorbeeld bladluizen) een sui-kerachtig goedje uit (honingdauw) als uitwerpselen. Deze honingdauw wordt danweer opgegeten door bijvoorbeeld mieren, die in ruil daarvoor goed voor de bladlui-zen zorgen. In zulke gevallen is de verhouding tussen kosten en baten van de interac-tie voor de producent van het bijproduct laag: de luizen maken de honingdauw vrijwelgratis en krijgen er waardevolle bescherming voor terug.
(2) Het tweede idee heeft voornamelijk betrekking op het in stand blijven van mutualis-men. Dit betreft twee mechanismen die te maken hebben met wederkerigheid vangedrag tussen de partners. Deze mechanismen zijn de betrouwbaarheid van eenpartner over tijd en partnerkeuze en sancties tegen partners die niet samenwerken. Metbetrouwbaarheid wordt bedoeld dat de ene partner er voldoende op kan rekenen datde andere partner bij de volgende gelegenheid tot interactie ook weer beschikbaar is.Als deze betrouwbaarheid hoog is, kunnen partners op elkaar rekenen en is er een
181
SA
ME
NV
AT
TIN
G
A.Ivens-diss 16-10-2012 11:15 Pagina 181
goede basis voor mutualistische samenwerking in de toekomst. In de natuur komt eendergelijk hoge betrouwbaarheid voor wanneer twee samenwerkende soorten zich navoorplanting samen verspreiden, zoals bijvoorbeeld bacteriën die in het lichaam vaninsecten leven en zich tegelijkertijd voortplanten met deze insecten. Partnerkeuze ensancties zorgen ervoor dat partners actief kunnen kiezen samen te werken met ‘goede’partners en ‘slechte’ partners kunnen vermijden. Ook op deze manier ontstaat er eengoede basis voor samenwerking. Een voorbeeld van partnerkeuze en sancties in de
fnatuur kan gevonden worden in de interactie tussen planten en bacteriën die stikstofvoor hen fixeren in ruil voor voedingsstoffen: deze planten geven alleen voedingsstof-fen aan de bacteriën die het best presteren.
HET ‘KWEEKMUTUALISME’ TUSSEN DE GELE WEIDEMIER ENWORTELBLADLUIZEN
KweekmutualismenHet empirische deel van dit proefschrift staat in het teken van één specifieke mutualisti-sche interactie: die tussen de Gele weidemier Lasius flavus en meerdere soorten wortel-bladluizen die door deze mier in haar nest worden gehouden. Deze interactievvertegenwoordigt een bepaalde groep van mutualismen: de zogeheten ‘kweekmutualis-men’. In dergelijke interacties bevordert de ene soort, de ‘kweker’, de groei van de anderesoort, de ‘symbiont’, van wie de kweker afhankelijk is voor de voedselvoorziening.Kweekmutualismen komen in allerlei vormen en maten voor: Er zijn mieren en termietendie schimmels kweken in hun nest, in de zee houden bepaalde vissen keurige algentuintjesbij en er zijn zelfs ééncellige amoeben bekend die bacteriën kweken.
De Gele weidemier en haar wortelbladluizenHet systeem dat ik hier bestudeerde is een voorbeeld van veehouderij in de natuur: deGele weidemier bouwt in haar ondergrondse nesten kleine kamertjes die een beschermdeomgeving vormen waar de wortelbladluizen rustig van plantenwortels kunnen drinken. DeGele weidemier is afhankelijk van de luizen voor zowel suiker als eiwit: de mieren ‘melken’de luizen voor het suikerachtige goedje honingdauw en ‘slachten’ hun vee ook af en toevvoor hun stikstofvoorziening. Andersom zijn ook de luizen afhankelijk geworden van dezeinteractie: de lichaamsbouw van de luizen is volledig aangepast aan het leven bij demieren, waardoor ze niet meer onafhankelijk kunnen overleven. Er kunnen meer dandertien verschillende soorten luizen in de mierennesten voorkomen. De Gele weidemierenen hun wortelbladluizen zijn op meerdere plekken in noordwest Europa te vinden. Slechtsonder zeer specifieke ecologische omstandigheden maken ze hun grote karakteristiekemierenbulten. De kwelder van Schiermonnikoog is een dergelijke locatie en het meestevveldwerk voor dit proefschrift heeft dan ook daar plaatsgevonden.
Mogelijke conflicten tussen de partnersDe insteek van dit gedetailleerde onderzoek naar de evolutionaire ecologie van de Gelewweidemier-interactie was om de inzichten over dit kweekmutualisme te vergelijken met
182
SA
ME
NV
AT
TIN
G
A.Ivens-diss 16-10-2012 11:15 Pagina 182
gegevens van andere dergelijke interacties om op deze manier nieuwe algemene inzichtenover de ecologie en evolutie van kweekmutualismen te krijgen. De achtergrondgedachtehierbij is dat in dergelijke interacties beide partners er altijd een eigen agenda op zullennahouden. Voor de kweker is het bijvoorbeeld van belang dat hij erop kan rekenen dat desymbiont zoveel mogelijk in de buurt blijft en zoveel mogelijk energie investeert in hetproduceren van voedsel, terwijl de symbiont misschien ook energie wil investeren in onaf-hankelijke verspreiding of seksuele voortplanting (in plaats van bijvoorbeeld klonale voort-planting). Deze eigen agenda’s zouden mogelijk tot evolutionaire conflicten kunnen leidentussen de beide parters. In het onderzoek van dit proefschrift stonden drie mogelijke con-flicten tussen kweker en symbiont centraal: de potentiële conflicten over (1) de voortplan-tingswijze van de symbiont (sexueel of asexueel/klonaal), (2) de mate van verspreidingvvan de symbiont (veel of weinig) en (3) de (genetische) diversiteit van de symbiontenpo-pulatie (mengcultuur of monocultuur).
RESULTATEN VAN DE EMPIRISCHE STUDIES
Hoofdstuk 2 richtte zich op de wijze van voortplanting en mate van verspreiding van devvier meest voorkomende wortelbladluissoorten in de nesten van Lasius flavus. In dezestudie verzamelde ik wortelbladluizen uit mierenbulten op de kwelder van Schiermonnik-oog. Door middel van een populatiegenetische analyse, die ik verder toelicht in hoofd-stuk 3, toonde ik aan dat alle vier de luizensoorten zich voornamelijk (en mogelijk alleenmaar) klonaal voortplanten in deze eilandpopulatie. Luizenmoeders produceren dus enkeldochters die exacte kopieën zijn van zichzelf. Ook toonde ik aan dat de luizen zich maarzelden verspreiden vanuit de mierennesten: over het algemeen komen specifieke klonenslechts zeer lokaal voor. Deze bevinding werd verder ondersteund door de waarneming datgevleugelde luizen zeer zeldzaam zijn. Interessant genoeg is deze combinatie van klonalevvoortplanting en weinig verspreiding ook veelvoorkomend in andere kweekmutualismen.Ook de schimmel van schimmelkwekende mieren plant zich enkel klonaal voort en ver-spreiding die onafhankelijk van de verspreiding van mieren is, komt maar zelden voor.
In hoofdstuk 4 bracht ik de diversiteit aan luizensoorten en luizenklonen in de mie-renbulten verder in kaart. Deze studie laat zien dat in de meerderheid van de mierenbultenslechts één luizensoort voorkomt en dat er binnen die soort vaak maar één enkele kloonper mierennest voorkomt. Wanneer er meerdere soorten en/of klonen in een nest voorko-men, leven deze vaak gescheiden in aparte luizenkamers. Op bult-niveau is er dus somssprake van mengculturen, maar op luizenkamer-niveau komen er bijna uitsluitend mono-culturen voor. Deze vinding van monoculturen is in lijn met andere kweekmutualismen,zoals bijvoorbeeld de vissen met hun algentuinen die vaak slechts één soort alg kweken.Hoofdstuk 4 toont verder aan dat het aannemelijk is dat de mieren voornamelijk jongeluizen opeten voor hun eiwitvoorziening en een beperkter aantal van luizen (ongeveer 70)per bult bewaren voor de honingdauwvoorziening. De pilot-studie van Box A laat zien datmieren in keuzeexperimenten geen voorkeur laten zien voor luizen van verschillende soortof herkomst. Deze resultaten suggereren dat er wellicht geen actieve partnerkeuze doormieren aan deze lage diversiteit ten grondslag ligt. In plaats daarvan kan deze lage diver-
183
SA
ME
NV
AT
TIN
G
A.Ivens-diss 16-10-2012 11:15 Pagina 183
siteit verklaard worden uit de klonale voortplanting van de luizen en beperkte verspreidingdie daarop volgt.
Tot slot wordt de ontwikkeling van de genetische markers die gebruikt werden voor deTTstudies van hoofdstukken 2 en 4 verder toegelicht in hoofdstuk 5. Tevens wordt in BoxB de ontwikkeling van de software die gebruikt is voor deze genetische analyse toegelicht.
RESULTATEN VAN DE THEORETISCHE MODELLEN
In hoofdstukken 6 en 7 bestudeerde ik de evolutie van samenwerking binnen soortenen tussen soorten met behulp van computersimulaties. In hoofdstuk 6 ontwierp ik eenmodel voor samenwerking binnen één soort, waarbij ik als voorbeeld bacteriën in gedach-ten hield. In het model vormen deze bacteriën één enkele populatie, die is onderverdeeldin subpopulaties. De bacteriën kunnen een stofje uitscheiden dat voor hen kostbaar is omte maken, maar waar zijzelf en hun soortgenoten van kunnen groeien. De totale hoeveel-heid van het stofje wordt binnen de subpopulatie gedeeld. In het model liet ik de neigingtot investeren in het stofje samen evolueren met de neiging om de thuisbasis te verruilenvvoor een andere subpopulatie op basis van de hoeveelheid van het stofje die beschikbaarwwas. Hierbij verwachtte ik dat individuen beter zouden samenwerken (lees: meer van hetstofje zouden maken) als iedereen de neiging had weg te gaan uit ‘slechte’ subpopulaties.Het tegendeel bleek waar: in dit model bleek samenwerking juist te ontstaan wanneer debacteriën ‘goede’ subpopulaties verruilden voor ‘slechte’. Deze uitkomst is demografischgoed te verklaren: bacteriën die zijn opgegroeid in een goede subpopulatie verkeren in een
kdusdanig goede gezondheid dat ze de bacteriën in een slechte subpopulatie gemakkelijkk kunnen wegconcurreren als ze daarheen verhuizen. Kortom, zulke modellen die gebruikmaken van de evolutie van gedrag dat afhankelijk is van de acties van anderen kunnenvvaak tot verrassende nieuwe inzichten leiden.
Dit gold ook voor de resultaten van het model uit hoofdstuk 7. De basis van ditmodel was dezelfde als die van hoofdstuk 6, maar in deze simulaties modelleerde ik popu-laties van twee verschillende soorten bacteriën die met elkaar samenwerken, een voor-beeld van mutualisme dus. Beide soorten scheidden nu een stofje uit dat als voedseldiende voor de andere soort, maar niet voor henzelf. Iedere subpopulatie bestond uit bac-teriën van beide soorten en de keuze om te blijven of te vertrekken was gebaseerd ophoeveel de bacteriën van de andere soort van het stofje produceerden. Ook konden bacte-riën op basis hiervan kiezen naar welke nieuwe subpopulatie ze wilden gaan. Ook in ditmodel bleek samenwerking te evolueren wanneer bacteriën besloten weg te gaan uit goedesubpopulaties. Dit model bevestigde ook het belang van relatief lage kosten ten opzichtevvan baten: wanneer de kosten in verhouding hoog werden, evolueerde samenwerking nietmeer. Interessant genoeg bleken de mutualistische interacties die evolueerden vaak asym-metrisch te zijn: de ene bacteriesoort investeerde vaak meer dan de ander. Deze asymme-trie is een bekend fenomeen uit de natuur en is ook terug te zien in de verschillen tussenkwekers en symbionten in kweekmutualismen.
184
SA
ME
NV
AT
TIN
G
A.Ivens-diss 16-10-2012 11:15 Pagina 184
CONCLUSIE
De empirische resultaten geven aan dat het voor de evolutie van mutualisme van belang isdat (generaties van) partners gedurende langere tijdsspannes op elkaar kunnen rekenen(betrouwbaarheid). In de interactie van de Gele weidemier met haar wortelbladluizen komtdit sterk naar voren in de vorm van weinig verspreiding en weinig genetische diversiteit:de mieren kunnen dus min of meer rekenen op constante aanwezigheid van min of meerdezelfde luizen. Anderzijds geven aanpassingen in lichaamsbouw van de luizen en hetopgeven van sexuele reproductie aan dat ook de luizen in de loop van de tijd zijn gaan‘rekenen’ op de aanwezigheid van de mieren.
De theoretische resultaten wijzen er echter op dat deze dynamiek van op elkaar kunnenrekenen alleen van toepassing is onder specifieke populatiekenmerken: als partners zichpas verspreiden na de vruchten te hebben geplukt van de samenwerking kan het evolutio-nair ook voordelig zijn juist bij goede partners weg te gaan.
Zowel de empirische als de theoretische resultaten wijzen erop dat het aannemelijk isdat relatief lage kosten ten op zichte van de baten ten grondslag liggen aan de evolutie vanmutualismen (zogeheten bijproduct-mutualismen). Het is aannemelijk dat het honingdauw-mutualisme tussen de mieren en de luizen ooit ontstaan is vanuit mieren die de uitwerpse-len van luizen als voedingsbron ging benutten. Vanuit deze – voor de luizen- gratisinteractie kon het systeem zich verder ontwikkelen tot de huidige vorm van onderlingeafhankelijkheid van de mieren en de luizen. Deze bevinding wordt onderschreven door deresulaten van de simulatiemodellen: samenwerking in de natuur kan enkel van de grondkomen als de voordelen aanzienlijk groter zijn dan de gevraagde investering.
185
SA
ME
NV
AT
TIN
G
A.Ivens-diss 16-10-2012 11:15 Pagina 185

A.Ivens-diss 16-10-2012 11:15 Pagina 186

191
A.Ivens-diss 16-10-2012 11:15 Pagina 191
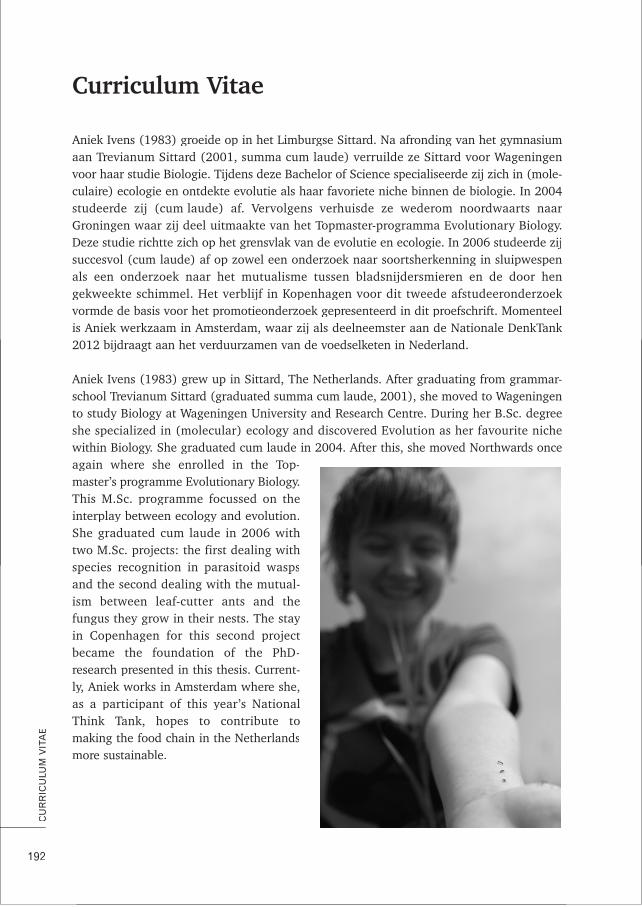
AAniek Ivens (1983) groeide op in het Limburgse Sittard. Na afronding van het gymnasiumaan Trevianum Sittard (2001, summa cum laude) verruilde ze Sittard voor Wageningenvvoor haar studie Biologie. Tijdens deze Bachelor of Science specialiseerde zij zich in (mole-culaire) ecologie en ontdekte evolutie als haar favoriete niche binnen de biologie. In 2004studeerde zij (cum laude) af. Vervolgens verhuisde ze wederom noordwaarts naarGroningen waar zij deel uitmaakte van het Topmaster-programma Evolutionary Biology.Deze studie richtte zich op het grensvlak van de evolutie en ecologie. In 2006 studeerde zijsuccesvol (cum laude) af op zowel een onderzoek naar soortsherkenning in sluipwespenals een onderzoek naar het mutualisme tussen bladsnijdersmieren en de door hen
kgekweekte schimmel. Het verblijf in Kopenhagen voor dit tweede afstudeeronderzoekvvormde de basis voor het promotieonderzoek gepresenteerd in dit proefschrift. Momenteel
kis Aniek werkzaam in Amsterdam, waar zij als deelneemster aan de Nationale DenkTank2012 bijdraagt aan het verduurzamen van de voedselketen in Nederland.
AAniek Ivens (1983) grew up in Sittard, The Netherlands. After graduating from grammar-school Trevianum Sittard (graduated summa cum laude, 2001), she moved to Wageningento study Biology at Wageningen University and Research Centre. During her B.Sc. degreeshe specialized in (molecular) ecology and discovered Evolution as her favourite nichewwithin Biology. She graduated cum laude in 2004. After this, she moved Northwards onceagain where she enrolled in the Top-master’s programme Evolutionary Biology.This M.Sc. programme focussed on theinterplay between ecology and evolution.She graduated cum laude in 2006 withtwo M.Sc. projects: the first dealing withspecies recognition in parasitoid waspsand the second dealing with the mutual-ism between leaf-cutter ants and thefungus they grow in their nests. The stayin Copenhagen for this second projectbecame the foundation of the PhD-research presented in this thesis. Current-ly, Aniek works in Amsterdam where she,as a participant of this year’s NationalThink Tank, hopes to contribute tomaking the food chain in the Netherlandsmore sustainable.
192
CU
RR
ICU
LUM
VIT
AE
Curriculum Vitae
A.Ivens-diss 16-10-2012 11:15 Pagina 192
AAniek B.F. Ivens● Theoretical Biology, Centre for Ecological and Evolutionary Studies, University of
Groningen, Nijenborgh 7, 9747 AG Groningen, The Netherlands
● Centre for Social Evolution, Department of Biology, University of Copenhagen,Universitetsparken 15, DK-2100 Copenhagen, Denmark.
E-mail: [email protected]
Daniel J.C. KronauerLaboratory of Insect Social Evolution, The Rockefeller University, 1230 York Avenue, NewYYork, NY 10065, USA. YYE-mail: [email protected]
Franz J. WeissingFFTheoretical Biology, Centre for Ecological and Evolutionary Studies, University ofGroningen, Nijenborgh 7, 9747 AG Groningen, The NetherlandsE-mail: [email protected]
Ido PenTheoretical Biology, Centre for Ecological and Evolutionary Studies, University ofGroningen, Nijenborgh 7, 9747 AG Groningen, The NetherlandsE-mail: [email protected]
Jacobus J. BoomsmaCentre for Social Evolution, Department of Biology, University of Copenhagen,Universitetsparken 15, DK-2100 Copenhagen, Denmark E-mail: [email protected]
Joke BakkerTheoretical Biology, Centre for Ecological and Evolutionary Studies, University ofGroningen, Nijenborgh 7, 9747 AG Groningen, The NetherlandsE-mail: [email protected]
Marten van de [email protected]
193
AU
THO
R A
FFIL
IATI
ON
S A
ND
CO
NTA
CT
INFO
RM
ATI
ON
A ff fAAuthor affiliations and contact information
A.Ivens-diss 16-10-2012 11:15 Pagina 193

A.Ivens-diss 16-10-2012 11:15 Pagina 194