Embed Size (px)
Citation preview

THE EVOLVING USE OF DATA IN UNIVERSITY RESEARCH ASSESSMENT AND MANAGEMENTHistory and practice in research assessment
JONATHAN ADAMS, Director, Research & Development
OPEN UNIVERSITY, MARCH 2013
2
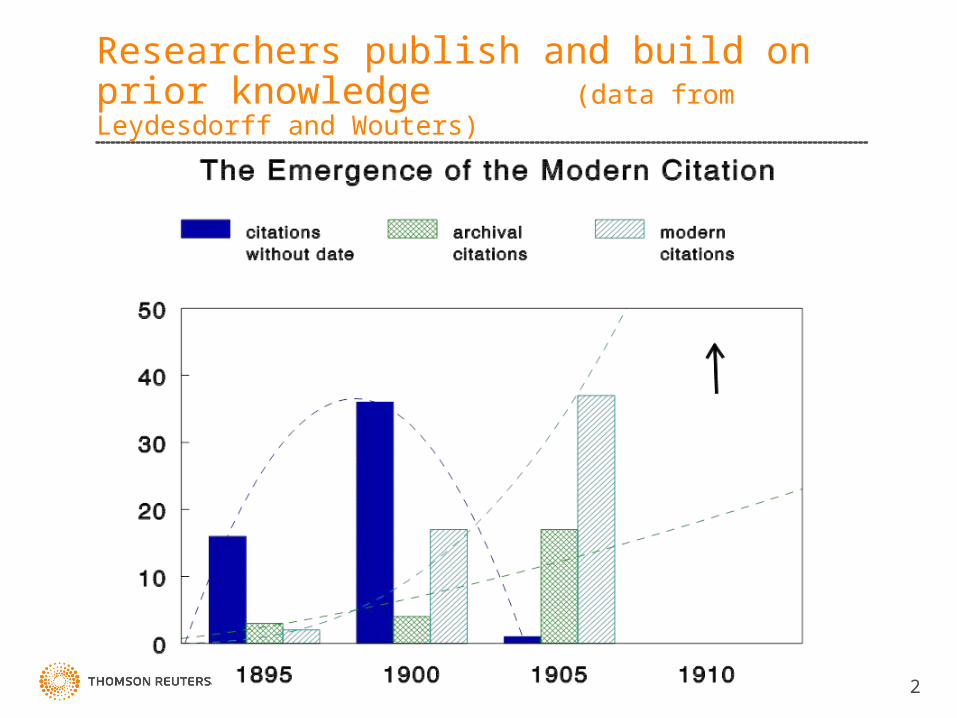
Researchers publish and build on prior knowledge (data from Leydesdorff and Wouters)

Dispersal in freshwater invertebrates
Bilton, D T; Freeland, J R; Okamura, B
ANNUAL REVIEW OF ECOLOGY AND SYSTEMATICS, Volume 32, Pages 159-181. Published: 2001
Times Cited: 265
Cited References: 147
Movement between discrete habitat patches can present significant challenges to organisms. Freshwater invertebrates achieve
dispersal using a variety of mechanisms that can be broadly categorized as active or passive, and which have important
consequences for processes of colonization, gene flow, and evolutionary divergence. Apart from flight in adult freshwater insects,
active dispersal appears relatively uncommon. Passive dispersal may occur through transport by animal vectors or wind, often
involving a specific desiccation-resistant stage in the life cycle. Dispersal in freshwater taxa is difficult to study directly, and rare but
biologically significant dispersal events may remain undetected. Increased use of molecular markers has provided considerable
insight into the frequency of dispersal in freshwater invertebrates, particularly for groups such as crustaceans and bryozoans that
disperse passively through the transport of desiccation-resistant propagules. The establishment of propagule banks in sediment
promotes dispersal in time and may be particularly important for passive dispersers by allowing temporal escape from unfavorable
conditions.
KeyWords: ADULT AQUATIC INSECTS; MITOCHONDRIAL-DNA VARIATION; MARKED CADDISFLY LARVAE; DAPHNIA-PULEX
COMPLEX; POPULATION-STRUCTURE; GENE FLOW; NORTH-AMERICAN; EGG BANK; LIMNOPORUS-CANALICULATUS;
MICROSATELLITE ANALYSIS
Addresses:
[ 1 ] Univ Plymouth, Benth Ecol Res Grp, Dept Biol Sci, Plymouth PL4 8AA, Devon, England [ 2 ] Open Univ, Dept Biol Sci, Milton Keynes MK7 6AA, Bucks, England [ 3 ] Univ Reading, Sch Anim & Microbial Sci, Reading RG6 6AJ, Berks, England
Web of Science Categories: Ecology; Evolutionary Biology
Article records contain rich associated metadata
Citation links and citation impact
Topical keywords
Collaborating organisations
Category with cognate literature 3

We index citations because rates vary by field and average counts grow over time
4
0
10
20
30
40
50
1991 1992 1993 1994 1995 1996 1997 1998 1999 2000 2001 2002 2003 2004 2005 2006 2007 2008 2009 2010
Average citations to papers published in that year
Biochemistry & Molecular Biology
Evolutionary Biology
Nanoscience & Nanotechnology
Chemistry -Organic
Physics -Condensed Matter
Engineering -Mechanical
Data and analysis: Evidence Thomson Reuters

We then find bibliometric impact and peer review are coherent across institutions
5
0.4
0.6
0.8
1
1.2
1.4
1.6
1.8
0 1 2 3 4 5 6
Ave
rag
e c
ita
tio
n im
pa
ct f
or
un
ive
rsit
y 1
99
6-2
00
0
Relative citation impact of articles submitted for RAE2001
Grade 5*
Grade 5
Grade 4
Grade 3a
Grade 3b
Spearman r = 0.57, P<0.001
Ratio mapped/NSI = 1.93
UoA18 Chemistry

Where did all this come from?• 1955
– Eugene Garfield’s Science paper on “Citation Indexes for Science”
• 1963– Science Citation Index (ISI >Thomson >Thomson Reuters)
• 1972– U.S. National Science Foundation initiates Science Indicators (later
Science & Engineering Indicators), including publication and citation data
• 1980s– Uptake of science indicators in Europe; research by SPRU, CWTS,
Hungarian Academy, as well as ISI
• 1992– Advisory Board for the Research Councils works with ISI on National
Science Indicators to benchmark UK
• 2004– Elsevier’s Scopus and Google Scholar are launched
6

Where did research evaluation come from?• 1960
– “The white heat of the technological revolution”, Harold Wilson
• 1970– “For the scientists, the party is over”, Shirley Williams
• 1980– UGC/ABRC consensus on selectivity
– 1986, Research Selectivity Exercise
– 1989, Research Assessment Exercise
• 1990– Evolution of research management and administration
– 1992-2008, RAE - the standard model, evolving grades
– 2014, Research Excellence Framework
7

Research policy and management is about ‘more, better research’
Research quality
Research black box
What we want to know
8

Output data have underpinned quantitative research evaluation
What we have to use
Research quality
Research black box
OUTPUTS
Journals and proceedings Citations
What we want to know
9

You can now use comprehensive research management information
Research quality
Research black box
Numbers –of researchers,
facilities, collaboration
OUTPUTS
Journals, books &
proceedings
IDEAS proposals,
applications and
partnerships
Trained people
Licences and spin outs
Patents
Deals and revenue
Citation and address
links
Skilled employment
Industrial contracts
Charitable awards
OUTCOMES
Reports and grey literature
Citations
Social policy change
What evaluators want to know
What evaluation needs to use
Research scholarships
Innovation funds
Research grants
INPUTS
What research users want to know
10
Data and analysis: Evidence Thomson ReutersThese data, added to peer review, create
a modern ‘gold standard’

They are proxy indicators, not metricsWe use multiple ‘bearings’ to assess our uncertainty
11

Responses to evaluation Research trajectory changed from mid-1980s
12
1.1
1.2
1.3
1.4
1.5
1981 1985 1989 1993 1997 2001 2005 2009
Rela
tive
impa
ct o
f UK
rese
arch
pub
licati
ons
UK citation impact
5 yr moving av'ge
Arrows indicate RAE years, e.g. 2001 and 2008

Responses to evaluationImprovement has been pervasive
0.6
0.8
1
1.2
1991 1992 1993 1994 1995 1996 1997 1998 1999 2000
Ave
rag
e n
orm
alis
ed i
mp
act
(wo
rld
ave
rag
e =
1.0
)
Grade 4 Grade 3A Grade 3B
16%
12%
17%
13
Note that bibliometric indicators are coherent across RAE peer review grades

Responses to evaluationBehavioural games - Goodhart’s Law
RAE1996Science Engineering Social sciences Humanities and arts
Outputs % Outputs % Outputs % Outputs %
Books and chapters 5,013 5.8 2,405 8.1 16,185 35.1 22,635 44.4
Conference proceedings 2,657 3.1 9,117 30.8 3,202 6.9 2,133 4.2
Journal articles 77,037 89.8 16,951 57.3 22,575 49.0 15,135 29.7
Other 1,104 1.3 1,122 3.8 4,154 9.0 11,128 21.8
RAE2001
Books and chapters 1,953 2.5 1,438 5.4 12,972 28.6 25,217 46.5
Conference proceedings 751 0.9 3,944 14.9 857 1.9 1,619 3.0
Journal articles 76,182 95.8 20,657 78.1 29,449 65.0 17,074 31.5
Other 618 0.8 408 1.5 2,008 4.4 10,345 19.1
RAE2008
Books and chapters 1,048 1.2 216 1.2 12,632 19.0 21,579 47.6
Conference proceedings 2,164 2.5 326 1.8 614 0.9 897 2.0
Journal articles 80,203 93.8 17,451 95.4 50,163 75.5 14,543 32.1
Other 2,125 2.5 301 1.6 3,018 4.5 8,287 18.3
14

The problem with simplistic indicators
• Research activity is complex and very skewed– Most research evaluation reports averages
– Tables focus on single indicators
– Ranking is even worse
• Average impact can be very misleading– Research Council studies reveal error of interpretation
– In skewed data, median much smaller than average
– Lots of papers are not cited
– The interesting bit is about how much is really, really cited lots
• So we we prefer Impact Profiles®, Research Footprints® and bubble diagrams
15

In the ‘changing geography’, China appears still to lag Europe on research impact ...
16
0.25
0.5
0.75
1
1.25
1.5
1991 1992 1993 1994 1995 1996 1997 1998 1999 2000 2001 2002 2003 2004 2005 2006 2007 2008 2009 2010
Cita
tion
impa
ct r
elati
ve to
wor
ld a
vera
ge
UK
Germany
USA
France
China
Data and analysis: Evidence Thomson Reuters

... but an Impact Profile® reveals that China is already producing excellent research
0%
10%
20%
30%
40%
uncited RBI > 0 < 0.125 ≥ 0.125 < 0.25 ≥ 0.25 < 0.5 ≥ 0.5 < 1 ≥ 1 < 2 ≥ 2 < 4 ≥ 4 < 8 ≥ 8
Perc
enta
ge o
f out
put
1999
-200
8
China 1999-2008 - 499,854 papers
UK 1999-2008 - 778,936 papers
Data and analysis: Evidence Thomson Reuters 17

UK background and ‘golden triangle’
0
5
10
15
20
25
uncited RBI > 0 < 0.125 RBI ≥ 0.125 < 0.25
RBI ≥ 0.25 < 0.5 RBI ≥ 0.5 < 1 RBI ≥ 1 < 2 RBI ≥ 2 < 4 RBI ≥ 4 < 8 RBI ≥ 8
Pe
rce
nta
ge
of o
utp
ut
20
02
-2
00
6
UK higher education sector, all research fields - 306661 papers UK 'golden triangle', all research fields - 87157 papers
This is the small but critical excess of really highly cited research output
18

Evaluation rests on impact as a proxy for performance, but there is no unique ‘impact’
19
Biochemistry & Molecular Biology
Cell Biology
Developmental Biology
Genetics & Heredity
Immunology
OncologyEMBL
LMB
MSKCC
Salk
Scripps
Data and analysis: Evidence Thomson Reuters
Research Footprint® scales nciF to maximum
value on each axis

Information from multiple cross-comparisonsNational Centre for Science and Technology Evaluation, CHINA
20
Chinese Academy of Sciences
Tsinghua University
Central South University
Shanghai Jiao Tong University
Zhejiang University
Fudan University
HIT
University of Science and Technology of
ChinaXiamen University
scale = 100 papers
Nankai University
0.0
1.0
2.0
3.0
4.0
0% 10% 20% 30% 40%
Citation impact
Percentage of papers in top 10%
Data & analysis: Thomson Reuters (Evidence)
Identify principal organizations publishing research about clean
vehicles in China and USA
Argonne National Laboratory
University of Texas
University of Michigan
UC Berkeley
US DoE
MIT
GM
UC Davis
Stanford University
scale = 100 papers
University of Maryland
0.0
1.0
2.0
3.0
4.0
0% 10% 20% 30% 40%
Citation impact
Percentage of papers in top 10%
Data & analysis: Thomson Reuters (Evidence)
Argonne National Laboratory
University of Texas
University of Michigan
UC Berkeley
US DoE
MIT
GM
UC Davis
Stanford University
scale = 100 papers
University of Maryland
0.0
1.0
2.0
3.0
4.0
0% 10% 20% 30% 40%
Citation impact
Percentage of papers in top 10%
Data & analysis: Thomson Reuters (Evidence)
China
US

Combine evaluation approaches to address multiple objectives
• Very few research programmes have a single objective
• Very few scientists agree on how best to evaluate outcomes!
• Some principles:– Evaluation as part of planning
– Compare like with like, respect diversity
– Recognise merit objectives• Capacity building, engagement with economy, social benefit
– Recognise research priorities• Timeliness, pervasiveness, excellence
• Exploitability, applicability, training
– Gather evidence and use quantitative indicators
– Make use of experience and expert judgment• Risk of conservatism, need for challenge mechanisms
21

How can we use ‘research analytics’ in evaluation and management?
22

THE EVOLVING USE OF DATA IN UNIVERSITY RESEARCH ASSESSMENT AND MANAGEMENTHistory and practice in research assessment
JONATHAN ADAMS, Director, Research & Development
OPEN UNIVERSITY, MARCH 2013