Embed Size (px)
Citation preview

The exclusion of medians from meta-analyses:A snapshot of the problem and a proposed
solution
Cumming TB1, Sena ES1,2, Churilov L1
1Florey Institute of Neuroscience and Mental Health, University of Melbourne, Australia2School of Clinical Sciences, University of Edinburgh, Scotland
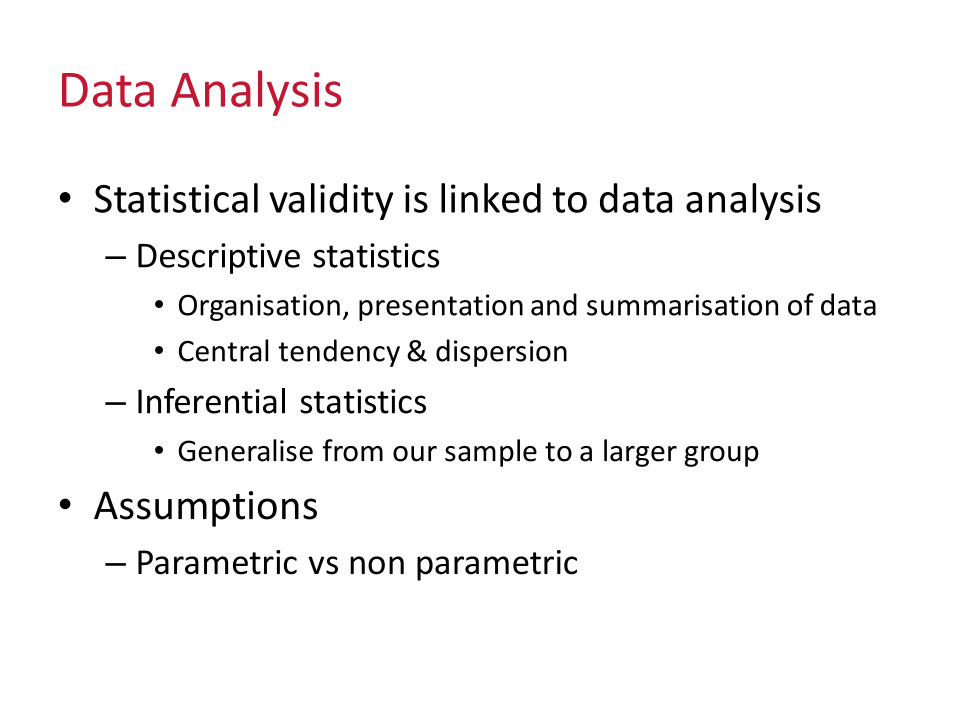
Data Analysis
• Statistical validity is linked to data analysis
– Descriptive statistics
• Organisation, presentation and summarisation of data
• Central tendency & dispersion
– Inferential statistics
• Generalise from our sample to a larger group
• Assumptions
– Parametric vs non parametric

Scale Process Data Some Appropriate Statistics
Descriptive Inferential
Ratio
Equal intervals
ParametricMean
SD
T test
ANOVA
ANCOCA
Factor Analysis
True Zero
Ratio relationship
IntervalEqual intervals
No true zero
Ordinal Ranked in order
Nonparametric
Median Mann-Whitney
Quartile deviation Wilcoxin
NominalClassified and
countedMode
Chi-square
Sign

The inconvenience of ordinal data
“The last 15 metres were very difficult”.Eric ‘the eel’ Moussambani, Equatorial Guinea.
Rank Swimmer Time
1 Pieter van den Hoogenband 47.84
2 Alexander Popov 48.69
3 Gary Hall, Jr. 48.73
4 Michael Klim 48.74
5 Eric Moussambani 1:52.72
https://www.youtube.com/watch?v=oQ7uWpn4DTs
2:00
4TH3RD1ST 2ND5TH
0
Rank Swimmer
1 Pieter van den Hoogenband
2 Alexander Popov
3 Gary Hall, Jr.
4 Michael Klim
5 Eric Moussambani

Impairment rating scales• Ordinal scales are common in research where the emphasis is on
evaluating impairment.• Means and SDs don’t make sense in this context – we don’t know
distance between scale points, only their order.
Score
0 No symptoms
1 No significant disability
2 Slight disability
3 Moderate disability
4 Moderately severe disability
5 Severe disability
6 Dead
MODIFIED RANKIN SCALE
Score
0 No deficit
1 Forelimb flexion
2 Forelimb flexion, decreasedresistance to lateral push
3 Forelimb flexion, decreasedresistance to lateral push, circle to paretic side
MODIFIED Bederson

A meta-analysis achilles heel
Meta-analysis: considered the gold standard of evidence-based health care.
BUT• Only as good as the quality of source data.• A major limitation of current techniques is the
inability to pool ordinal data.• Cochrane Handbook (section 9.2.4): “difficulties
will be encountered if studies have summarised their results using medians”.

Aims
1. How are impairment rating scale data are reported and analysed in individual studies in the CAMARADES database?
a. Preclinical- Focal ischaemia studies- All behavioural studies
b. Clinical- Covered the conditions MS, AD, ALS, PD and HD.- We identified the 6 most commonly used clinical rating scales.
2. How are these rating scale data pooled in meta-analysis?- We searched the Cochrane Database for reviews that included the 6 scales.- We recorded the meta-analytic technique used.
3. How can ordinal data be included in meta-analysis?- We developed a statistical technique for calculating an effect size measure for ordinal data that can be used in meta-analysis.

Type of behavioural tests in preclinical stroke
• 432 studies
• 1582 experiments

Analysis of ordinal data in preclinical stroke

Individual studies – central tendency
0%
10%
20%
30%
40%
50%
60%
70%
80%
90%
100%
MMSE EDSS UPDRS ADAS-cog UHDRS ALSFRS
Per
cen
tage
of s
tud
ies
Neither
Both
Median
Mean
• 103 studies, 128 instances of data from the 6 scales being reported.• 80% reported means alone, only 13% reported medians.

Individual studies - analysis• 40% used parametric statistics alone, 34% used non-parametric, 26%
didn’t include analysis or didn’t specify type.
0%
10%
20%
30%
40%
50%
60%
70%
80%
90%
100%
MMSE EDSS UPDRS ADAS-cog UHDRS ALSFRS
Per
cen
tage
of s
tud
ies
Neither
Both
Non-parametric
Parametric

Mis-match
0%
10%
20%
30%
40%
50%
60%
70%
80%
90%
100%
MMSE EDSS UPDRS ADAS-cog UHDRS ALSFRSP
erc
en
tag
e o
f st
ud
ies
Neither
Both
Median
Mean
0%
10%
20%
30%
40%
50%
60%
70%
80%
90%
100%
MMSE EDSS UPDRS ADAS-cog UHDRS ALSFRS
Per
cen
tage
of s
tud
ies
Neither
Both
Non-parametric
Parametric
MEANS ONLY
PARAMETRIC ANALYSIS ONLY

Meta-analysis• 70 systematic reviews identified, 60 included meta-analysis.• 88% used mean difference, 22% used difference in proportions, none
included medians.
0%
10%
20%
30%
40%
50%
60%
70%
80%
90%
100%
MMSE EDSS UPDRS ADAS-cog UHDRS ALSFRS
Per
cen
tage
of s
yste
mat
ic r
evie
ws
No meta-analysis
Proportion
Mean difference

Why the status quo is a problem
• Reliance on means, SDs and standardised mean differences in the context of ordinal scales violate statistical assumptions and bias interpretation of results.
• Yet correct reporting of medians, IQRs will disqualify data from subsequent meta-analysis, not only reducing the available information but potentially selecting out higher quality studies.
• We require a method for reporting ordinal data that:- does not assume a certain underlying distribution.- does not necessitate dichotomisation.- facilitates pooling of results in meta-analysis.- does not inflict a harsh reporting burden on study authors.

A simple solution
Agresti’s generalised odds ratio1
• Considers all possible pairs of observations: 1 from treatment group, 1 from control group.
• Measures the ratio of the probabilities that a randomly chosen pair favours treatment or favours control (discards the ties).
Wilcoxon-Mann-Whitney generalised odds ratio (WMW GenOR)• Same logic as Agresti, but does not ignore the ties.• Tied observations are split evenly between better and worse outcomes.
1. Agresti (1980), Biometrics

An illustration
1. Churilov et al. (2014), Int J Stroke

Benefits of the GenOR1
• A simple, assumption-free effect size that can be compared with similar outcomes (including continuous ones) from other studies.
• Easily computable closed-form asymptotic expressions for CIs, p-values.
• Extends to stratified analyses, allowing adjustment for covariates.
• Natural relationship to the Number-Needed-to-Treat calculated on an ordinal scale2.
• Can be entered into meta-analysis like an odds ratio generated from a binary outcome, enabling consistent visual representation in forest plots.
• Can be calculated given only minimal information (N of the groups, Mann-Whitney U statistic, associated p-value).
1. Churilov et al. (2014), Int J Stroke2. Bath et al. (2011), Int J Stroke
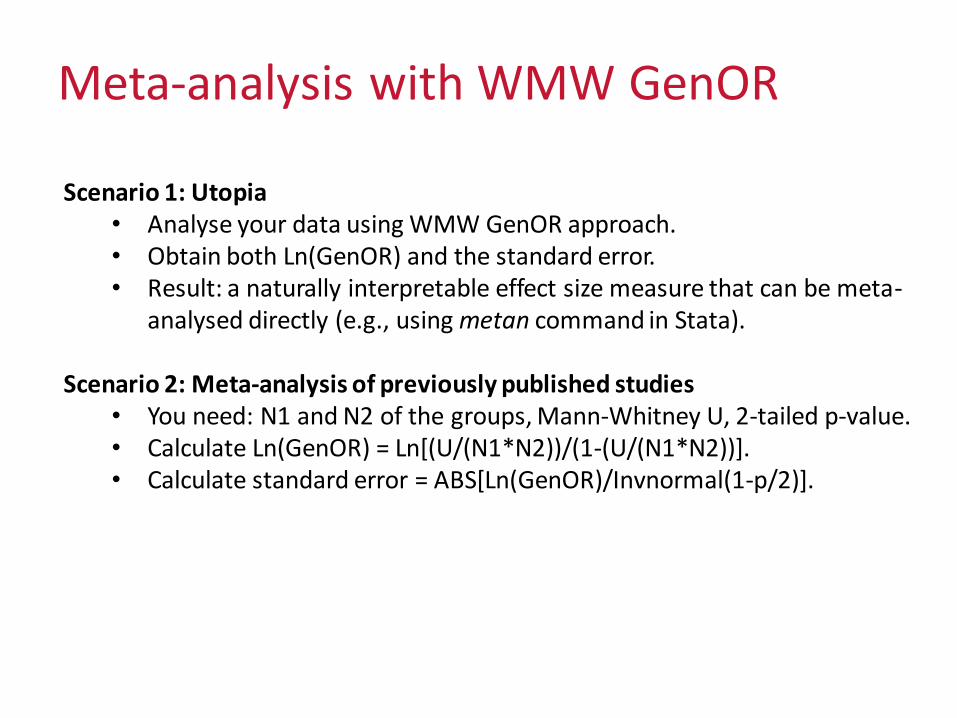
Meta-analysis with WMW GenOR
Scenario 1: Utopia• Analyse your data using WMW GenOR approach.• Obtain both Ln(GenOR) and the standard error.• Result: a naturally interpretable effect size measure that can be meta-
analysed directly (e.g., using metan command in Stata).
Scenario 2: Meta-analysis of previously published studies• You need: N1 and N2 of the groups, Mann-Whitney U, 2-tailed p-value.• Calculate Ln(GenOR) = Ln[(U/(N1*N2))/(1-(U/(N1*N2))].• Calculate standard error = ABS[Ln(GenOR)/Invnormal(1-p/2)].

Conclusions
• At the individual study level, it is important that ordinal data can be reported appropriately and not be excluded from meta-analyses.
• Using means, SDs for ordinal scales gives an impression of exactness, but it is false precision.
A proposed solution – WMW GenOR
• Assumption-free, easy to compute, readily combined in meta-analysis.
• We hope that adoption of WMW GenOR will have the dual effect of improving the reporting of ordinal data in individual studies while also increasing the representativeness of meta-analyses.

Acknowledgements
www.florey.edu.au
@CummingToby
Mahsa Keshtkaran for help with data retrieval.
Hanna VesterinenCadi IrvineMalcolm MacleodPeter Connick Kieren Egan Gary Carmichael Afiyah Tariq Sue Pavitt Jeremy Chataway Siddharthan Chandran

Implementation – EDSS mock data
Control gp (sample 0) and 5 treatment gps (samples 1-5), all non-normal.

Forest plot – EDSS mock data
• More appropriate and more likely to be sensitive to treatment effects.• Sample 0 vs 3: Mann-Whitney (z = -2.0, p = 0.045), t-test (t = 1.8, p = 0.073).

Common Clinical neurological rating scales
MMSE: Cognitive screening tool, 30 points, often treated as continuous.Data typically skewed towards ceiling, e.g. post-stroke population: median 26, IQR 22-271.
EDSS: Ordinal rating scale, 0-10 in half-point increments, used to evaluate function in MS. Distribution is rarely normal, predominant pattern is bimodal2.
UPDRS: Ordinal rating scale used to assess function in Parkinson’s disease.Includes 42 items that are mostly scored on a 5 point scale (0 normal, 4 most severe).
ADAS: Screening tool for Alzheimer’s disease, includes cognitive subscale (ADAS-cog).ADAS-cog scored from 0-70, generally treated as continuous.
UHDRS: Ordinal rating scale used to test function in Huntington’s disease.Its 6 components each have a different scoring format, typically reported separately3.
ALSFRS: Ordinal rating scale, used to measure function in ALS/MND, revised to ALSFRS-R.ALSFRS-R has 12 items, scored 0 (most severe) to 4 (normal).Distribution is often skewed, more than 80% of patients ‘mild’ or ‘moderate’ (>24)4.
1. Cumming et al. (2013), Acta Neurol Scand2. Hohol et al. (1995), Neurology3. Landwehrmeyer et al. (2007), Annals Neurol4. Mioshi et al. (2012), J Clin Neurosci