Embed Size (px)
Citation preview
The existence of low balling on the Swedish
audit market A study of companies listed on the NASDAQ OMX Stockholm
that voluntarily changed audit firm 2002-2010
University of Gothenburg
School of Business, Economics and Law
FEA50E Degree Project in Business Administration for
Master of Science in Business and Economics, 30.0 credits
Spring term 2014
Tutors: Mikael Cäker & Kristina Jonäll
Authors: Caroline Karlsson & Ylva Molde

1
Abstract
Type of thesis: Degree Project in Business Administration for Master of Science in
Business and Economics, 30.0 credits
University: University of Gothenburg, School of Economics, Business and Law.
Semester: Spring 2014
Authors: Caroline Karlsson and Ylva Molde
Tutors: Mikael Cäker and Kristina Jonäll
Titel: The existence of low balling on the Swedish audit market -A study of
companies listed on the NASDAQ OMX Stockholm that voluntarily changed audit
firm 2002-2010 Background and Problem: The lack of auditor independence is discussed being one
of the reasons to scandals such as Enron and HQ. A pricing strategy that has been
debated impairing auditor independence is low balling. To win a new client in a
tender process, audit firms supposedly offer an audit fee below cost and then increase
the fee the following years to recover the initial loss. The auditors’ future financial
interest in the company due to the initial loss is by some believed to impair auditor
independence, which makes low balling in Sweden a relevant phenomenon to study.
Aim of study: This thesis aims to explain if low balling exists on the Swedish audit
market and if the size of companies affects the results of low balling.
Methodology: To achieve the purpose of this thesis, a statistical study was
conducted. Data, found in annual reports of companies listed on NASDAQ OMX
Stockholm that changed audit firm 2002-2010, were analysed before and after the
change. 107 companies that changed audit firm during the period were identified. 56
of these fulfilled our inclusion criteria; 21 companies listed on Small cap, 21 on Mid
cap, and 14 on Large cap.
Analysis and conclusions: This study indicates that low balling exists on NASDAQ
OMX Stockholm and in Sweden. The average initial audit fee discount was -17.53%,
the second year after the change the discount was -4.57%, and the fees were almost
back to normal levels by the third year, -0.61%, from the estimated normal audit fee.
The results correlate with the most recent research on the subject done in Sweden and
Germany. Our findings suggest that the extent of low balling varies between the caps;
it exists among companies listed on Small and Large cap but not on Mid cap.
Keywords: Low balling, audit pricing, initial fee discount, and audit firm switch.

2
Table of Contents
1. Introduction ................................................................................................................ 5
1.1 Background .......................................................................................................... 5
1.2 Problem discussion .............................................................................................. 6
1.3 Problem statement ................................................................................................ 7
1.4 Purpose ................................................................................................................. 7
2. Frame of references .................................................................................................... 8
2.1 Auditing ............................................................................................................... 8
2.2 The tender process ............................................................................................... 8
2.3 Initial costs ........................................................................................................... 9
2.4 Determinants of audit fees ................................................................................... 9
2.4.1 NASDAQ OMX Stockholm ....................................................................... 10
2.5 Low balling ........................................................................................................ 10
2.5.1 Earlier studies on low balling internationally ............................................. 12
2.5.2 Earlier studies on low balling in Sweden .................................................... 14
2.6 Research questions ............................................................................................. 14
3. Methodology ............................................................................................................ 16
3.1 Research design ................................................................................................. 16
3.1.1 Credibility ................................................................................................... 16
3.1.2 Literature ..................................................................................................... 17
3.2 Criteria to be included in this study ................................................................... 17
3.2.1 Dropouts ...................................................................................................... 18
3.3 Data collection method ...................................................................................... 20
3.3.1 Explanation of terms ................................................................................... 21
3.3.2 Determination of auditee size ..................................................................... 21
3.3.3 Audit fee ratio ............................................................................................. 22
3.4 Data analysis ...................................................................................................... 22
4. Empirics ................................................................................................................... 24
4.1 Correlation ......................................................................................................... 24
4.2 The percentage changes in the Audit Fee ratio .................................................. 25
4.3 Different size companies .................................................................................... 27
3
4.3.1 Small cap ..................................................................................................... 27
4.3.2 Mid cap ....................................................................................................... 28
4.3.3 Large cap ..................................................................................................... 28
4.3.4 Summary of different size companies ......................................................... 28
5. Analysis.................................................................................................................... 30
5.1 Correlation ......................................................................................................... 30
5.2 Low balling on the Swedish audit market .......................................................... 30
5.2.1 Results compared to research done internationally .................................... 32
5.3 Low balling and different size companies ......................................................... 33
6. Conclusions .............................................................................................................. 35
7. Suggestions for future research ................................................................................ 36
Bibliography ................................................................................................................ 37
Appendices ................................................................................................................... 41
Appendix 1: Audit fees ............................................................................................ 41
Appendix 2: Company Turnover ............................................................................. 43
Appendix 3: Total Assets ......................................................................................... 45
Appendix 4: Correlation .......................................................................................... 48
Appendix 5: Audit fee ratio ..................................................................................... 49
Appendix 6: Changes in Audit fee ratios ................................................................. 51

4
List of Tables and Figures Table 1 illustrates previous research on low balling
Table 2 illustrates the dropouts of the study
Table 3 illustrates the different variables in this study
Table 4 illustrates the correlation between Audit fees and Company turnover as well as
the correlation between Audit fees and Total assets
Table 5 illustrates the average percentage changes on NASDAQ OMX Stockholm Total
Table 6 illustrates the average percentage changes on Small cap
Table 7 illustrates the average percentage changes on Mid cap
Table 8 illustrates the average percentage changes on Large cap
Table 9 illustrates the compiled results of this study
Figure 1 illustrates the shape of the distribution of the average percentage changes in
audit fees the year of the switch, 𝑡, for the Total of NASDAQ OMX Stockholm
Figure 2 illustrates the shape of the distribution of the average percentage changes in
audit fees year 𝑡!! for the Total of NASDAQ OMX Stockholm
Figure 3 illustrates the shape of the distribution of the average percentage changes in
audit fees year 𝑡!! for the Total of NASDAQ OMX Stockholm
Definitions Auditee: The client of the audit firm.
Big 4: The four largest audit firms since 2002 in Sweden as well as worldwide; PwC,
EY, KPMG and Deloitte.
Big 6: The six largest accounting firms 1989-1998; Ernst & Young, Arthur Andersen,
Coopers & Lybrand, Deloitte & Touche, Peat Marwick Mitchell and Price
Waterhouse.
Big 8: The eight largest audit firms before demises and mergers prior to 1989; Arthur
Andersen, Arthur Young & Co., Coopers & Lybrand, Ernst & Whinney, Deloitte
Haskins & Sells, Peat Marwick Mitchell, Price Waterhouse and Touche Ross.
Companies: In this thesis a company is considered to be the client of the audit firm.
Further, a company is considered to be the Group and thus not the Mother company.
FAR: The professional institute for authorized public accountants, approved public
accountants and other highly qualified professionals in the accountancy sector in
Sweden.

5
1. Introduction
This chapter aims to put the topic into context by providing the reader with
background. This is followed by the problem discussion that culminates in a problem
statement. The purpose of this thesis is presented in the end of this chapter.
1.1 Background
There have been many discussions about the role of auditors in a financial crisis. The
crisis in 2008 forced the EU to come up with regulations to stabilise the EU economic
and financial system. One major outcome of the discussion was to introduce
mandatory audit firm rotation every 10 years, with the possibility of member states to
choose additional 10 years (European Union 2013). This is believed to enhance audit
quality and auditor independence (European Union 2013). Schatzberg & Sevcik
(1994) defines auditor independence as “to be truthfully reporting an observed value
for a client”. The lack of independence is assumed to be one of the reasons to
scandals such as Enron in the US and HQ in Sweden (Grönboken 2010).
Independence is hence a fundamental element in audit engagements and is therefore
important to study.
A factor that has been discussed impairing independence is low balling (Simon &
Francis 1988; Schatzberg 1990). DeAngelo (1981) describes low balling as a pricing
strategy that aims to win a client at a low price that does not cover the audit’s cost,
and thereafter increases the audit fee the following years. By doing this, according to
the author, the higher price aims to compensate for the lower audit fee paid by the
auditee during the first couple of years. There have been arguments that discounting
initial audit fee is a threat to auditor independence due to auditors’ future interest in
the company (Simon & Francis 1988). To be able to recover the initial sunk costs, a
long-term audit engagement is needed. Further, there is also a possibility that auditors
impair their independence by the desire of not losing the client even if severe auditor-
client disagreements are present (Simon & Francis 1988). Schatzberg & Sevcik
(1994) found evidence in their experiments that when low balling occurred, auditor
independence was impaired since an observed value was less truthfully reported by

6
the auditors. DeAngelo (1981), however, opposes that low balling harms auditor
independence and claims instead that it is a normal outcome of a competitive market.
There are several studies regarding audit fees after a voluntary change of audit firm
and results differ. For instance, Simon & Francis (1988) found that audit fees in the
US declined the first three years after a voluntary change of audit firm. After four
years, the audit fees were back to the normal level. The reason for this would be the
discount given by auditing firms to win new clients (Simon & Francis 1988). In a
different study on the Australian market, Francis (1984) found that no low balling
existed, whereas in a recent study on the German market low balling was found
(Krauß, Quosigk & Zülch 2014). In Sweden, Jonasson & Tungel (2012) found that
low balling exists in Sweden.
1.2 Problem discussion
In prior research, studies have revealed many different factors that drive the audit fee
(Hay et al 2006). The main attribute of the client that affects the price of audit is the
size of auditee. This is possible to measure in two ways, by the Balance sheet
component Total Assets or by the Income statement component Company Turnover
(Hay et al 2006; Pong & Whittington 1994). Hay et al (2006) claim in a meta-analysis
of 25 years of research that approximately three quarters of previous research of audit
fees use Total Assets to measure the auditee size and remaining studies used
Company Turnover.
Total Assets, however, is somewhat misleading since a large proportion of this could
be an account where the audit fee does not correlate well with the size of that account.
For example, the same amount of work will be required on Goodwill and Cash and
Cash Equivalent independent of their size since a larger proportion of these accounts
not necessarily require more audit. There is also a possibility that similar companies
value assets differently, which has a direct effect on the size of Total Assets. The
auditee could also use “Off balance sheet” financing as leasing, and Total Assets
might therefore be misleading (Chan, Ezzamel & Gwilliam 1993). Company
Turnover, on the other hand, could be a better variable to determine the size of auditee
since no disruptive accounts occur. In the tender process, professional auditors

7
commonly use the ratio of Audit Fee and Company Turnover as a first approximation
of the audit fee, since Company Turnover is an estimate of workload that is needed in
audit (Oxera 2006).
Jonasson & Tungel (2012) maintained that low balling exists on the Swedish audit
market by the majority of companies listed on the NASDAQ OMX Stockholm that
voluntarily changed audit firm. However, ratios of Audit Fee and Total Assets
calculated for each year around the change were used to determine if low balling
existed. The above discussion shows that there could be a better way to measure
auditee size and it is therefore uncertain if low balling actually exists on the Swedish
audit market and consequently further studies on this are needed.
Arguments have been made that there is more room for a discount in a larger
company due to the importance of large clients to maintain status as well as the major
audit fees earned from these clients (Carson et al 2012). Earlier research does not
mention regarding if low balling differs between small, medium or large companies.
In Sweden, for example, Volvo is listed on NASDAQ OMX Stockholm Large cap
with almost 300,000 millions in sales (VOLVO 2012), whereas Odd Molly listed on
Small cap had sales of 228 millions the same year (Odd Molly International 2012).
More research on this area is needed to show not only if low balling exists, but also if
it varies between companies of different size.
1.3 Problem statement
Does low balling exist on the Swedish audit market and does the company size affect
the extent of low balling?
1.4 Purpose
The aim of this thesis is to explain if low balling exists on the Swedish audit market
and if the company size affects the results of low balling.

8
2. Frame of references
This section aims at a deeper understanding of the topic. Firstly, a wider description
of the subject is outlined, then the survey of relevant previous research follows as it is
used to analyse the empirics later in the thesis.
2.1 Auditing
Companies that are listed on a regulated market are required to have an auditor or an
audit firm that audit their financial statements. The audit should be conducted in
accordance with audit standards and regulations set by a government body (ABL
2005:551).
Audit firms and their auditors have a legal liability towards stakeholders (Lee & Gu
1998). To be able to make an accurate investment decision, financial statements are
needed, and a qualitative and independent audit is hence demanded for insurance that
the information presented reflects the financial position of the company (Oxera 2006;
ABL 2005:551).
2.2 The tender process
The tender process is an expensive and time-consuming process for auditees as well
as for audit firms. Consequently, only audit firms that are able to engage in the audit
commitment are invited to take part in the tender process (FAR 2005). To be able to
audit large global clients, a grand international network is needed as well as expertise
and resources (Carson et al 2012; Oxera 2006). Each firm has to estimate an expected
effort for the audit and state an estimated price. A fixed price of audit is forbidden,
since conditions under which the audit is performed could change (FAR 2005).
There has been mixed evidence regarding how companies choose audit firm. A study
ordered by the Department of Trade and Industry and the Financial Reporting Council
in the UK, called the Oxera study (2006), stated that audit committees, in general,
consider quality over price when choosing audit firm. Johnson & Lys (1990), on the

9
other hand, claim that clients choose audit firms that have the possibility to deliver
audit at the lowest price.
2.3 Initial costs
There are many different start-up costs that occur for the audit firm. Start-up costs
including checking the client’s initial balance sheets figures and the loss of specific
assets as mutual trust and familiarity are two main initial costs of audit (Arruñada &
Paz-Ares 1997). A survey made by Ridyard & De Bolle (1992) showed that it took
the auditor over a year to gain understanding of the auditee if the auditor had previous
experience in the industry where the auditee performed and over two years in an
industry where the auditor had no previous experience. Hence, with the above
discussion, the costs of audit should realistically be higher the year of the switch.
2.4 Determinants of audit fees
There are many different factors that are considered to affect the price of audit such as
the size, complexity, the number of subsidiaries, and the risk of the auditee (Simunic
1980). A factor that is highly significant and most important for setting the level of
audit fees, according to previous research, is the size of the auditee (Hay et al 2006).
The size of the auditee is possible to measure by Total Assets or Company Turnover
(Hay et al 2006; Pong & Whittington 1994). Total Assets have been the most
common figure used to measure auditee size in previous research of audit fee
determinants and low balling (Hay et al 2006; Simon & Francis 1988; Jonasson &
Tungel 2012), whereas Company Turnover is the figure which audit firms use as a
first approximation of audit fees (Oxera 2006).
There are positive as well as negative aspects of both measurements. Total Assets
include components that are risky from the audit point of view as inventories and
receivables, which is a positive aspect (Simunic 1980). However, Total Assets could
vary between otherwise comparable companies due to different accounting policies or
different age profile of assets (Chan, Ezzamel & Gwilliam 1993). As mentioned
earlier, Total Assets could include large proportions of misleading accounts as

10
Goodwill and Cash and Cash Equivalent do not necessarily require more audit.
Company Turnover excludes problems such as financial structure and different
accounting policies, but problems could still be present due to different turnover
definitions in different industries (Chan, Ezzamel & Gwilliam 1993).
Another factor that affects the price of audit is accounting and audit regulations. The
Oxera study (2006) stated that an increase of accounting and audit regulations could
lead to an increase in audit fees. Companies expect their auditors to provide
information about new accounting regulations; a larger number of work hours for
auditors are thus needed which drives the audit fee (Oxera 2006).
2.4.1 NASDAQ OMX Stockholm
As previously mentioned, the size of the company is the most important factor that
drives the price of audit (Hay et al 2006). Carson et al (2012) argue that large
corporations are important clients due to the major audit fees and status, which these
clients bring to the audit firm. Therefore, the possibility of larger audit fee discounts
increase. NASDAQ OMX Stockholm is divided into three different segments
depending on the size of the company: Large cap, Mid cap and Small cap. Companies
listed on Large cap have a market value of more than one billion euros, Mid cap
between 150 millions and one billion euros, whereas companies listed on Small cap
have a market value of less than one billion euros (Swedbank 2014). 2012-12-31, 55
companies were listed on NASDAQ OMX Stockholm Large cap, 62 on Mid cap and
104 on Small cap (Retriever 2014).
2.5 Low balling
DeAngelo (1981) describes low balling as a pricing strategy when auditors aim at
becoming the incumbent auditor to be able to earn extra profits on future audits
during audit tenure. The incumbent auditor has cost advantages over competitors due
to start-up costs and transaction costs that occur for the client when companies switch
auditors. To be able to earn these quasi-rents under subsequent years, audit firms are
supposedly willing to lower the initial audit fee. Hence, two requirements need to be
met. Firstly, the audit firm has to accept a loss the year of the switch by offering a fee

11
lower than the costs of audit engagement. Secondly, the audit fee under the following
years needs to cover for the initial loss as well as profit from the audit engagement
(DeAngelo 1981).
Low balling has been discussed impairing auditor independence (Simon & Francis
1988; Schatzberg 1990; Schatzberg & Sevcik 1994). The Cohen Report (1978),
written by the Commission of Auditors’ Responsibilities in the US, discussed possible
problems with low balling due to its signal of compliance to managers. Further, the
authors of the report argue that a threat to independence might be present when a deep
initial audit fee discount occurs since it creates a receivable. Consequently, it creates a
need for the audit firm to audit a financial success company to recover the initial loss
of the audit firm in the following years (The Cohen Report 1978). Opposite
arguments have been made by Lee & Gu (1998) who argue that low balling instead
enhances auditor independence. Lee & Gu (1998) conclude that initial audit fee
discounts are less costly than an ineffective market and reflects the competition over
clients. DeAngelo (1981) claims that low balling is a normal outcome of a
competitive market and thus not affecting auditor independence. Chan (1999) argues
that an industry specialisation of a new audit firm leads to lower audit fees due to
expertise and agrees with DeAngelo (1981) that low balling is a normal outcome of a
competitive market.
DeAngelo (1981) expects low balling in settings regardless of publicly disclosed audit
fees, whereas Dye (1991) predicts that low balling will only occur in settings where
audit fee figures are not publicly available, and the independence issue could
consequently be avoided through publicly disclosed audit fees.
12
2.5.1 Earlier studies on low balling internationally
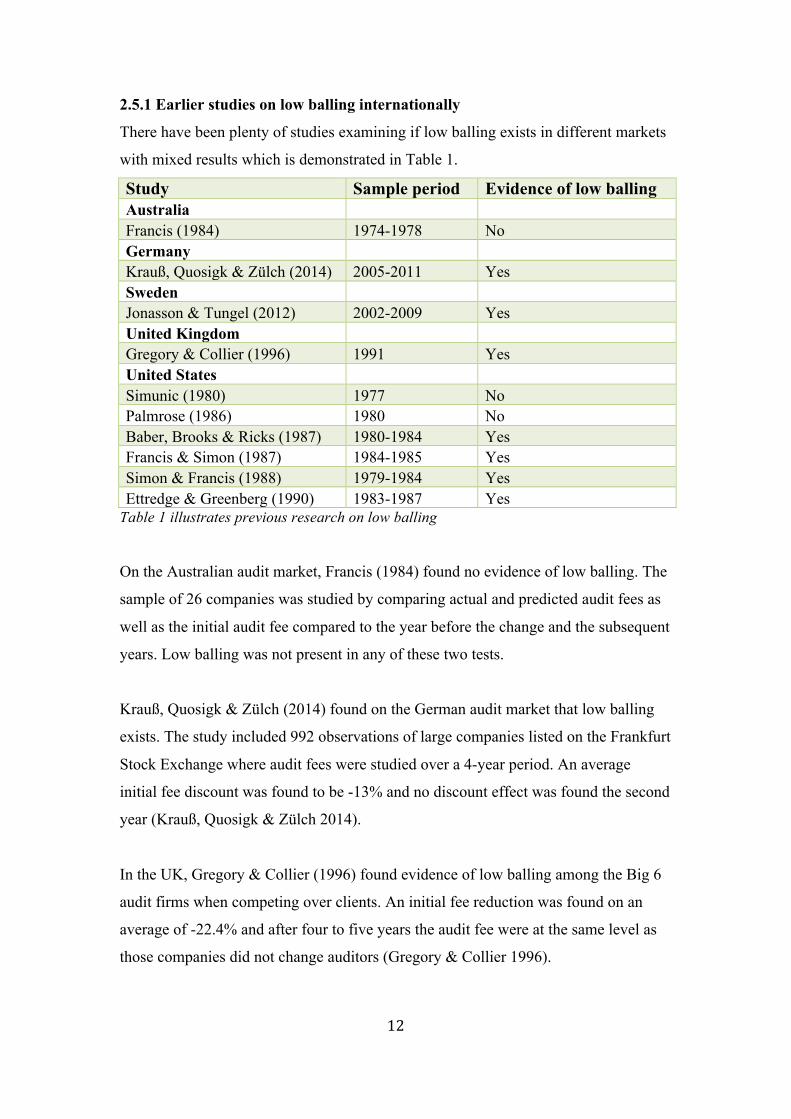
There have been plenty of studies examining if low balling exists in different markets
with mixed results which is demonstrated in Table 1.
Study Sample period Evidence of low balling Australia
Francis (1984) 1974-1978 No Germany
Krauß, Quosigk & Zülch (2014) 2005-2011 Yes Sweden
Jonasson & Tungel (2012) 2002-2009 Yes United Kingdom
Gregory & Collier (1996) 1991 Yes United States
Simunic (1980) 1977 No Palmrose (1986) 1980 No Baber, Brooks & Ricks (1987) 1980-1984 Yes Francis & Simon (1987) 1984-1985 Yes Simon & Francis (1988) 1979-1984 Yes Ettredge & Greenberg (1990) 1983-1987 Yes
Table 1 illustrates previous research on low balling
On the Australian audit market, Francis (1984) found no evidence of low balling. The
sample of 26 companies was studied by comparing actual and predicted audit fees as
well as the initial audit fee compared to the year before the change and the subsequent
years. Low balling was not present in any of these two tests.
Krauß, Quosigk & Zülch (2014) found on the German audit market that low balling
exists. The study included 992 observations of large companies listed on the Frankfurt
Stock Exchange where audit fees were studied over a 4-year period. An average
initial fee discount was found to be -13% and no discount effect was found the second
year (Krauß, Quosigk & Zülch 2014).
In the UK, Gregory & Collier (1996) found evidence of low balling among the Big 6
audit firms when competing over clients. An initial fee reduction was found on an
average of -22.4% and after four to five years the audit fee were at the same level as
those companies did not change auditors (Gregory & Collier 1996).
13
Simunic (1980) and Palmrose (1986) found no evidence of the existence of initial fee
discounts in the US. Simunic (1980) checked for initial fee discounts indirectly, by
using an audit tenure variable in his audit fee model. A survey was mailed, since audit
fees were not publicly disclosed during this time, with the response rate of 33% out of
the 1207 companies. 397 respondents were then divided into companies with a Big 8
or a non-Big 8 auditor. Palmrose (1986) studied price cutting directly and included
361 companies that responded to the mailed questionnaire. The companies were
domestic, public, and non-public companies.
Other studies have shown that low balling exists in the US (Baber, Brooks & Ricks
1987; Francis & Simon 1987; Simon & Francis 1988; Ettredge & Greenberg 1990).
Francis & Simon (1987), however, researched initial fee discounts as a side issue of
the paper which resulted in a small sample of 12 switches. Baber, Brooks & Ricks
(1987) studied 37 auditor switches in North Carolina county governments. To detect a
change of the initial audit fee, the initial fee was compared as a percentage of the
mean audit fee in North Carolina county governments.
Simon & Francis (1988) argue that low balling exists by presenting evidence of an
initial audit fee discount the year the switch took place. A sample of 214 companies
that switched auditors between 1979-1984 was researched, and the results were
compared to 226 companies that did not change auditors during the same period,
which served as an estimated normal audit fee. The average discount given was -24%
the first year, -15% the second and third year, while the audit fees were back to
normal levels by the fourth year (Simon & Francis 1988). These findings are similar
to evidence found by Ettredge & Greenberg (1990) who concluded that an average
discount of -25% existed the year a company switched audit firm. Ettredge &
Greenberg (1990) used a sample of 389 companies in their study. They included
factors as if the switch was to a Big 8 firm or not as well as the total numbers of firms
that were included in the tender process of the engagement (Ettredge & Greenberg
1990).

14
2.5.2 Earlier studies on low balling in Sweden
Jonasson & Tungel (2012) studied if low balling exists in Sweden. They identified 57
voluntarily changes of audit firm 2002-2009 on the NASDAQ OMX Stockholm that
were relevant to the study. 27 of these switches occurred on Small cap, 19 on Mid
cap, and 11 on Large cap. The authors include an auditee size in their study by
calculating a ratio of Audit Fees and Total Assets. An average value was calculated
two years before the change and two years after (𝑋). To avoid effects that could affect
the study negatively by drastical changes of the company around the switch, the value
two years before and after were also used (𝑋2). A relative value was calculated for
both 𝑋 and 𝑋2 by dividing Audit Fee with Total Assets, which were found in the
annual report of the auditee. A scarce majority of the companies in the study showed
evidence of low balling when examining 𝑋 and 𝑋2 (Jonasson & Tungel 2012).
For 𝑋, the average initial fee discount among companies listed on NASDAQ OMX
Stockholm was -27.06% followed by an increase of 14.55% when compared to the
year of the change. For 𝑋2, the average initial fee discount was -30.16% followed by
an increase of 13.67% when compared to the year of the change. By the third year,
𝑋2, the audit fees were 79.4% of the estimated normal fee (Jonasson & Tungel 2012).
2.6 Research questions
As discussed earlier in this chapter, there are many studies on low balling. These
studies have used different variables but they all have included auditee size as the
primary factor that affects the price (Hay et al 2006). This is possible to measure in
two ways, by Total Assets or Company Turnover. However, research done on low
balling has primarily used Total Assets (Simon & Francis 1988; Jonasson & Tungel
2012), whereas professional auditors use Company Turnover as a first approximation
of price (Oxera 2006). The most common definition used to explain low balling is the
one of DeAngelo (1981), namely an initial fee discount is present as well as an
increase in fee the following years to cover the initial loss as well as profit from the
audit engagement. To be able to see if an initial fee discount is present, a comparison
with the estimated normal fee and the disclosed fee in the year of the change of audit
firm was done. Previous research has shown mixed results regarding the length of

15
discount effect (Simon & Francis 1988; Gregory & Collier 1996; Krauß, Quosigk &
Zülch 2014). In our study, to be able to determine if low balling exists in Sweden, the
data was collected from audit firm switches made by companies listed on NASDAQ
OMX Stockholm. The data was gathered the year of the change as well as two years
before and after the change, which enabled capturing the phenomenon of low balling.
NASDAQ OMX Stockholm is divided into three different caps depending on the
market value of the company. As mentioned before, the size of the company is the
primary factor that drives the price of audit (Hay et al 2006). This leads us to
following research questions:
1) Which measure of auditee size, Total assets or Company turnover, correlates better
with the audit fee?
2) Does the ratio of Audit Fee/Company Turnover decrease the year of the change of
audit firm?
3) Does the ratio of Audit Fee/Company Turnover increase the following two years
after the change of audit firm?
4) Do the results differ among different caps?
16
3. Methodology
This chapter describes how the study has been conducted and what methodological
choices have been made to serve the purpose of this thesis. Later, the criteria of audit
firm switches are presented followed by a paragraph on data analysis that aims to
explain the methods of statistical analysis.
3.1 Research design
To serve the purpose of this thesis a statistical, quantitative study was conducted. This
is the most suitable approach to answer our research questions. There exists a theory
regarding the phenomena of low balling, and our study is deductive since we tested
this theory on the Swedish audit market (Saunders et al 2009).
The study was conducted and analysed after DeAngelo’s (1981) definition of low
balling, who claims that two observed aspects of an audit engagement should be
studied, the fees and the costs, to conclude if low balling occurs. Since the costs are
not publicly available, the average audit fee from two years prior to the change is an
estimation of a normal audit fee and was compared to the fees after the voluntary
change. This made it possible to see if there was an initial fee discount the first year
followed by an increase in fee the following years to conclude if low balling occurs.
3.1.1 Credibility
One can argue that a calculation of an average for only two years to estimate the
normal audit fee is not enough. However, if more years were included in this average,
more companies would be excluded due to the set of criteria of this study described in
chapter 3.2. A larger population is more valued in this study to be able to explain if
low balling exists than a possible limitation of a normal audit fee estimation.
Audit fees are publicly disclosed in the annual report of each company. The cost of
audit from the audit firm’s point of view is not available to the public, which makes
possible only an indirect way of measuring low balling (Krauß, Quosigk & Zülch
2014). For example, in a tender process, audit firms present the most suitable way the
audit will be conducted. An audit with a substantive testing approach demands more

17
work hours and is hence more costly than an internal control approach. It is possible
that the company has purchased a different service, for example a least-cost service
with the only purpose to make it possible for the audit firm to sign the Auditor’s
report. Therefore, a conclusion regarding low balling after a fee study could be
difficult to make since this information is unavailable to the public. Consequently,
there is a potential risk that a switch showing a “low balling effect” is in fact a
different audit service purchased. Nevertheless, a study of audit fee changes over time
is a common approach when researching low balling (Simon & Francis 1988; Krauß,
Quosigk & Zülch 2014).
Another factor that could affect the credibility of this study is changes in regulations.
If law requires a more thorough audit, the price of audit will consequently be higher
(Oxera 2006). An increase in fees after a voluntary change could hence be due to new
regulations and not low balling.
3.1.2 Literature
To find primary research for this study, several databases such as Web Of Science,
Scopus, Retriever and Business Source Premier have been used. The keywords that
were most successful in the databases were: “low balling”, “price-cutting”, “initial
fee”, discount, audit, fee, price, “audit change”, “audit pricing”, and “audit firm”. This
enabled peer-reviewed articles relevant and important to this study to be found. Some
articles that have been used are old, but to verify that they are still relevant, the
numbers of their recent citing were looked into. Other sources of information that
have been used are web pages of the European Union and FAR. Secondary literatures
that have been used are annual reports (Blumberg, Cooper & Schindler 2008). The
annual reports have been downloaded from the webpage of each company that are
included in this study or from Retriever.
3.2 Criteria to be included in this study
Each company listed on the NASDAQ OMX Stockholm that switched auditors during
2002-2010 are included in this study, to explain if low balling exists on the Swedish
audit market. NASDAQ OMX Stockholm was chosen since this Stock Exchange is
18
the largest in Sweden and is divided into different segments depending on company
size. Further, the study was based on the companies listed at the NASDAQ OMX
Stockholm 2012-12-31. Consequently, companies that were liquidated before this
date are not included in this study. However, for a company not to be qualified a
dropout a set of criteria needs to be fulfilled.
The first criterion is that the company must be publicly listed during the whole period
of study, that is two years before the change of audit firm as well as two years after;
five years are thus studied for each switch. This criterion is set due to the increased
costs of auditing which usually occurs when companies go public and is also a
common criterion in previous studies (Francis & Simon 1988; Jonasson & Tungel
2012).
The second criterion is that the company must use the same accounting period during
the years around the change. This criterion was set to enable comparisons between the
years and establish that the periods are of the same length. The study also requires a
new audit firm to have signed the Auditor’s report the year of the change to determine
that a change of audit firm has occurred. Additionally, not more than one change
should have occurred during the five-year period, since it would destroy the
possibilities to identify initial fee discounts as well as the following increase in fee
which are needed to conclude if low balling occurred. The last criterion is that the
switch of audit firm needs to be voluntarily done by the company and thus not forced.
3.2.1 Dropouts
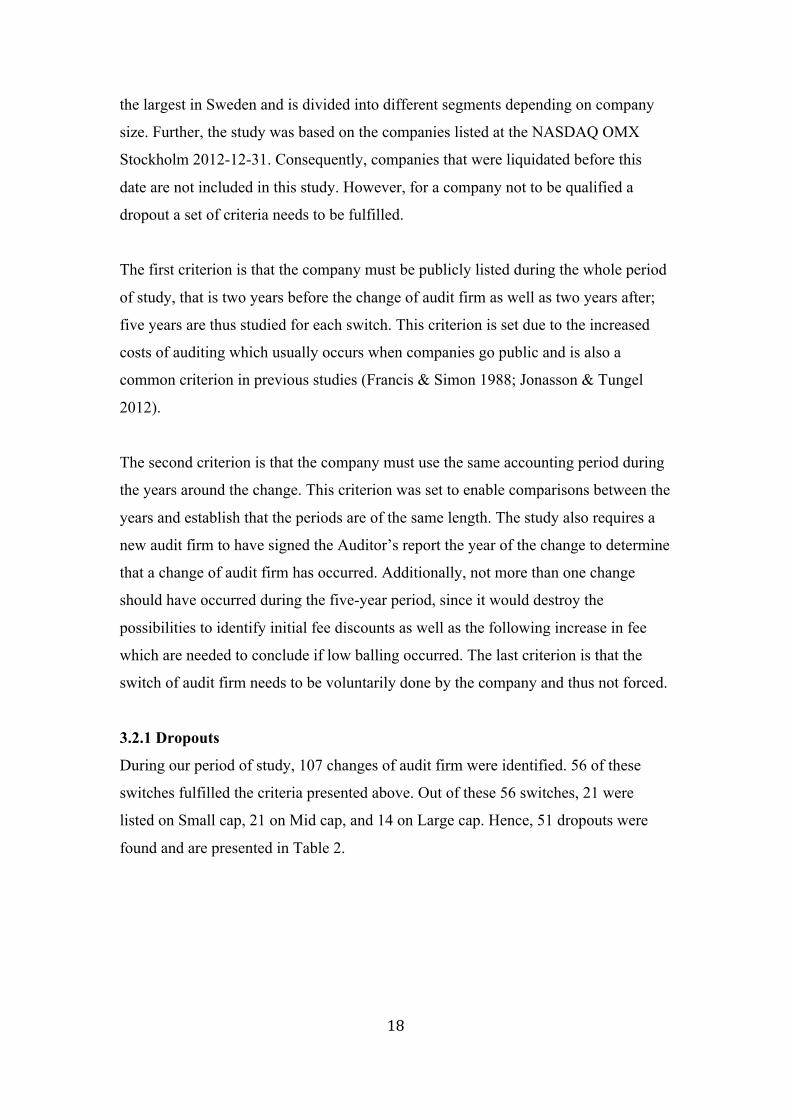
During our period of study, 107 changes of audit firm were identified. 56 of these
switches fulfilled the criteria presented above. Out of these 56 switches, 21 were
listed on Small cap, 21 on Mid cap, and 14 on Large cap. Hence, 51 dropouts were
found and are presented in Table 2.

19
Reason Dropouts Not publicly listed two years before the change 17 Small cap 14 Mid cap 2 Large Cap 1 Different accounting periods 12 Small cap 7 Mid cap 3 Large cap 2 Absence of a new audit firm signing the Auditor’s report 12 Small cap 3 Mid cap 2 Large cap 7 Information missing 7 Small cap 5 Mid cap 1 Large cap 1 Switches that occurred in the same period 2 Mid cap 2 The demise of Arthur Andersen 1 Small cap 1 Total 51
Table 2 illustrates the dropouts of the study
17 companies were excluded due to not being listed during the five years of study. As
presented in Table 2, Small Cap-listed companies stood for 14 of these exclusions that
is natural since these companies are not as established on the stock exchange as the
larger corporations. 12 companies had different accounting periods in the annual
reports under study and were excluded due to the potential bias in numbers.
12 companies were excluded due to the criteria of a new audit firm signing the
Auditor’s report. These companies had a joint audit engagement prior to the switch.
Companies that went from having two audit firms to only one of these firms were
excluded from the study as well as they only switched one of the two audit firms. This
is justified since the initial costs would be absent. However, switches from a joint
audit to a third audit firm were included in this study since the initial costs would still
occur.

20
In seven cases the information was missing or difficult to obtain, due to different
reasons. For example, in some annual reports audit fee and audit fee related costs
were not separately disclosed, and it would have been inaccurate to include these
companies.
Some companies have changed auditors more than one time during the five-year
period and a low balling effect, according to our methodology, was not possible to
measure; hence two switches were excluded.
The demise of the audit firm Arthur Andersen in 2002 forced their clients to change
audit firm. Most of the auditors as well as clients were taken over by Deloitte (SvD
2002) and therefore cannot be analysed in this thesis due to its non-voluntary nature.
Further, the switch does not have the increase in initial costs that is expected from a
change of audit firm and should be excluded from this study. One company was
excluded due to this reason.
3.3 Data collection method
To be able to examine if low balling exists in Sweden, voluntarily changes of audit
firms during the years 2002-2010 were studied. Since our study includes data from
five years, two years before the switch, the year of the switch and two years after, our
data collection period extends from 2000 to 2012. The companies whose annual
reports we chose to study are companies that were listed on the NASDAQ OMX
Stockholm (Small-, Mid- and Large cap) 2012-12-31. Retriever was used to establish
which companies were listed on each cap. The data was then collected from the
Annual report of each company and was either downloaded from their web page or
from Retriever were annual reports sent to Bolagsverket (The Swedish companies
registration office) are available.
The data collected from each annual report was: Company Turnover, Total Assets and
Audit Fee from the Group Income Statement, Balance Sheet and Notes as well as
which audit firm that signed the Auditor’s Report. Hence, five annual reports were
studied for each company that voluntarily changed audit firm. In some cases
21
companies changed accounting principles from one year to another during the period
under study. This resulted in different retroactive figures in the annual report as
required by law (IFRS 2012). Due to the lack of retroactive data for all five years, a
decision was made to always collect the data from the annual report of the
corresponding year. However, the differences between numbers due to changes in
accounting principles were not significant.
3.3.1 Explanation of terms
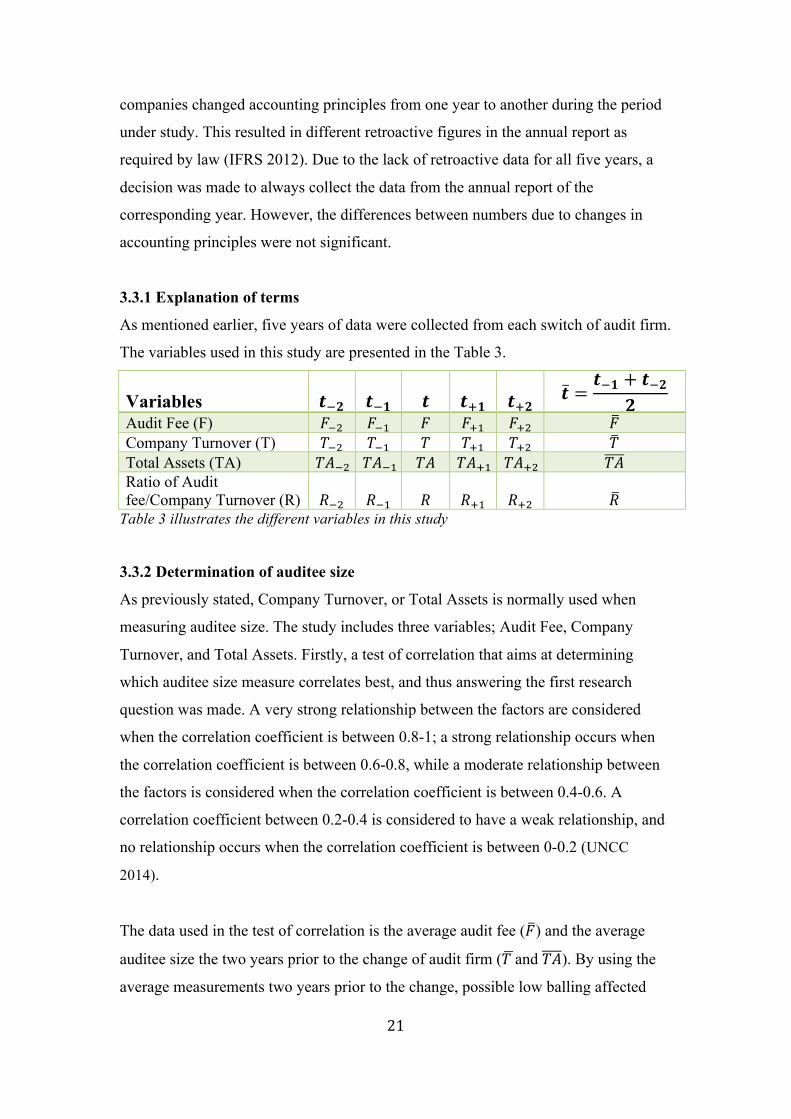
As mentioned earlier, five years of data were collected from each switch of audit firm.
The variables used in this study are presented in the Table 3.
Variables 𝒕!𝟐 𝒕!𝟏 𝒕 𝒕!𝟏 𝒕!𝟐 𝒕 =𝒕!𝟏 + 𝒕!𝟐
𝟐
Audit Fee (F) 𝐹!! 𝐹!! 𝐹 𝐹!! 𝐹!! 𝐹 Company Turnover (T) 𝑇!! 𝑇!! 𝑇 𝑇!! 𝑇!! 𝑇 Total Assets (TA) 𝑇𝐴!! 𝑇𝐴!! 𝑇𝐴 𝑇𝐴!! 𝑇𝐴!! 𝑇𝐴 Ratio of Audit fee/Company Turnover (R) 𝑅!! 𝑅!! 𝑅 𝑅!! 𝑅!! 𝑅
Table 3 illustrates the different variables in this study
3.3.2 Determination of auditee size
As previously stated, Company Turnover, or Total Assets is normally used when
measuring auditee size. The study includes three variables; Audit Fee, Company
Turnover, and Total Assets. Firstly, a test of correlation that aims at determining
which auditee size measure correlates best, and thus answering the first research
question was made. A very strong relationship between the factors are considered
when the correlation coefficient is between 0.8-1; a strong relationship occurs when
the correlation coefficient is between 0.6-0.8, while a moderate relationship between
the factors is considered when the correlation coefficient is between 0.4-0.6. A
correlation coefficient between 0.2-0.4 is considered to have a weak relationship, and
no relationship occurs when the correlation coefficient is between 0-0.2 (UNCC
2014).
The data used in the test of correlation is the average audit fee (𝐹) and the average
auditee size the two years prior to the change of audit firm (𝑇 and 𝑇𝐴). By using the
average measurements two years prior to the change, possible low balling affected

22
data is excluded. Each cap was examined separately as well as in total to answer
research questions number one and four.
3.3.3 Audit fee ratio
The variable that mainly drives the price is auditee size (Hay et al 2006; Pong &
Whittington 1994) and is therefore important to include in this study. To exclude
possible effects of the audit fee due to changes in auditee size, an audit fee ratio of
Audit Fee divided by Company Turnover was calculated.
3.4 Data analysis
To be able to answer the first part of our problem statement, if low balling exists on
the Swedish audit market, two aspects of the audit engagement needs to be studied,
according to DeAngelo’s (1981) definition. An initial fee discount as well as an
increase in fee the following years needs to be present. To enable answering if these
two aspects exist on the NASDAQ OMX Stockholm, an audit fee ratio was calculated
for each of five years to exclude possible changes in auditee size, which as previously
mentioned, has a big impact on audit fees. The auditee size measure that was used is
Company Turnover.
An average audit fee ratio, 𝑅, is calculated of the two years prior to the change of
audit firm. This serves as an estimated normal audit fee ratio. By comparing the ratios
of 𝑅 to 𝑅 (audit fee ratio the year of the change), a percentage change in audit fee
ratio was calculated to establish if an initial fee discount was present. To examine if
an increase in audit fee the subsequent years after the switch was present on the
NASDAQ OMX Stockholm, the ratios of the two years after the switch of audit firm,
𝑅!! and 𝑅!!, were compared to the estimated normal audit fee ratio, 𝑅, to establish
the percentage change.
To be able to answer the second part of the problem statement, if the size of the
company affects the extent of low balling, the data was divided into Small-, Mid- and
Large Cap as well as the Total for NASDAQ OMX Stockholm. The average
percentage change for each cap and year was then calculated and presented.

23
To gain some insight of the shape of the distribution, a histogram and standard
deviation are provided for the Total of NASDAQ OMX Stockholm for 𝑡, 𝑡!! and 𝑡!!.
Due to the relatively small size of the population a histogram was done for total, and
not for each cap.
The result of Mid cap the second year after the change, 𝑡!!, stands out from the
results of Small and Large cap as well as Total. An attempt was made to identify and
remove outliers that affected the results. To achieve a low balling effect on Mid cap,
nearly 20% of the companies had to be removed from the study. It would not have
been accurate or truthfully to seriously affect the results in this way, since the shape
of the distribution is widely spread out from the mean for the Total of NASDAQ
OMX Stockholm and the results are hence possible to manipulate in both directions.

24
4. Empirics
In this chapter the empirics of the thesis is presented. It starts by introducing the
results of the first research question as well as the differences between the caps
followed by the results of research questions number two, three and four.
4.1 Correlation
To find the answer to the first research question, “Which measure of auditee size,
Total assets or Company turnover, correlates better with the audit fee?” and the
supplementary research question number four “Do the results differ among different
caps?”, a test of correlation for each cap as well as total has been done and presented
in Table 4.
NASDAQ OMX Stockholm
Correlation Audit fees and Company Turnover
Correlation Audit fees and Total Assets
Small 0.88 0.66 Mid 0.82 0.47 Large 0.70 0.72 Total 0.83 0.82
Table 4 illustrates the correlation between Audit fees and Company turnover as well as
the correlation between Audit fees and Total assets
The correlation coefficient on Small cap is 0.88 between Audit fees and Company
Turnover and 0.66 between Audit Fees and Total Assets. On Mid cap, the correlation
coefficient is 0.82 for Company Turnover and 0.47 for Total Assets, whereas on
Large cap it is 0.7 for Company Turnover and 0.72 for Total Assets. As for the Total
of NASDAQ OMX Stockholm, the correlation coefficient is 0.83 between Audit Fees
and Company Turnover and 0.82 between Audit Fees and Total Assets.
Company Turnover has a higher degree of correlation with Audit Fees for companies
listed on Small and Mid cap as well as the Total of NASDAQ OMX Stockholm. On
Large cap, there is a slighter higher correlation, 0.02 units, between Audit Fees and
Total Assets.
The relationship between Audit Fees and Company Turnover is very strong on Small
and Mid cap as well as the Total of NASDAQ OMX Stockholm. The correlation
25
coefficient for Large cap shows only a strong relationship between Audit Fees and
Company Turnover. Audit Fees and Total Assets show a very strong relationship only
on the NASDAQ OMX Stockholm Total where the correlation coefficient is 0.82. On
Small and Large cap the relationship is strong, while on Mid cap the relationship is
moderate.
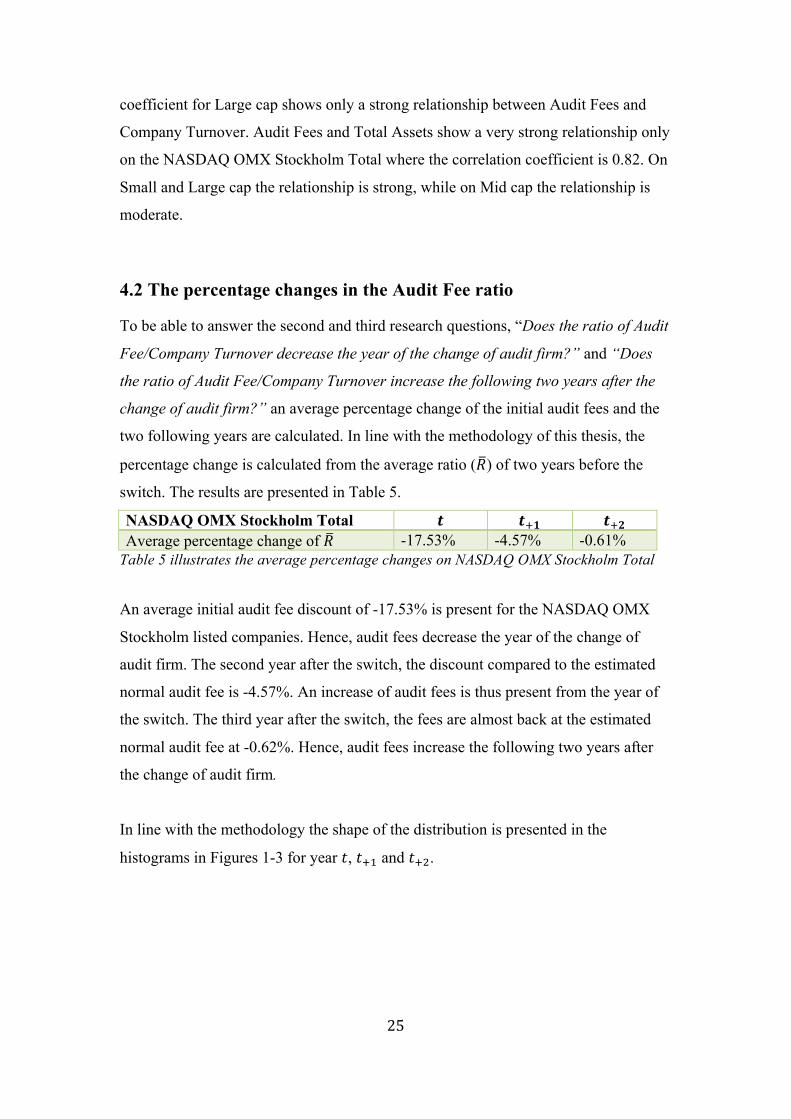
4.2 The percentage changes in the Audit Fee ratio
To be able to answer the second and third research questions, “Does the ratio of Audit
Fee/Company Turnover decrease the year of the change of audit firm?” and “Does
the ratio of Audit Fee/Company Turnover increase the following two years after the
change of audit firm?” an average percentage change of the initial audit fees and the
two following years are calculated. In line with the methodology of this thesis, the
percentage change is calculated from the average ratio (𝑅) of two years before the
switch. The results are presented in Table 5.
NASDAQ OMX Stockholm Total 𝒕 𝒕!𝟏 𝒕!𝟐 Average percentage change of 𝑅 -17.53% -4.57% -0.61%
Table 5 illustrates the average percentage changes on NASDAQ OMX Stockholm Total
An average initial audit fee discount of -17.53% is present for the NASDAQ OMX
Stockholm listed companies. Hence, audit fees decrease the year of the change of
audit firm. The second year after the switch, the discount compared to the estimated
normal audit fee is -4.57%. An increase of audit fees is thus present from the year of
the switch. The third year after the switch, the fees are almost back at the estimated
normal audit fee at -0.62%. Hence, audit fees increase the following two years after
the change of audit firm.
In line with the methodology the shape of the distribution is presented in the
histograms in Figures 1-3 for year 𝑡, 𝑡!! and 𝑡!!.
26
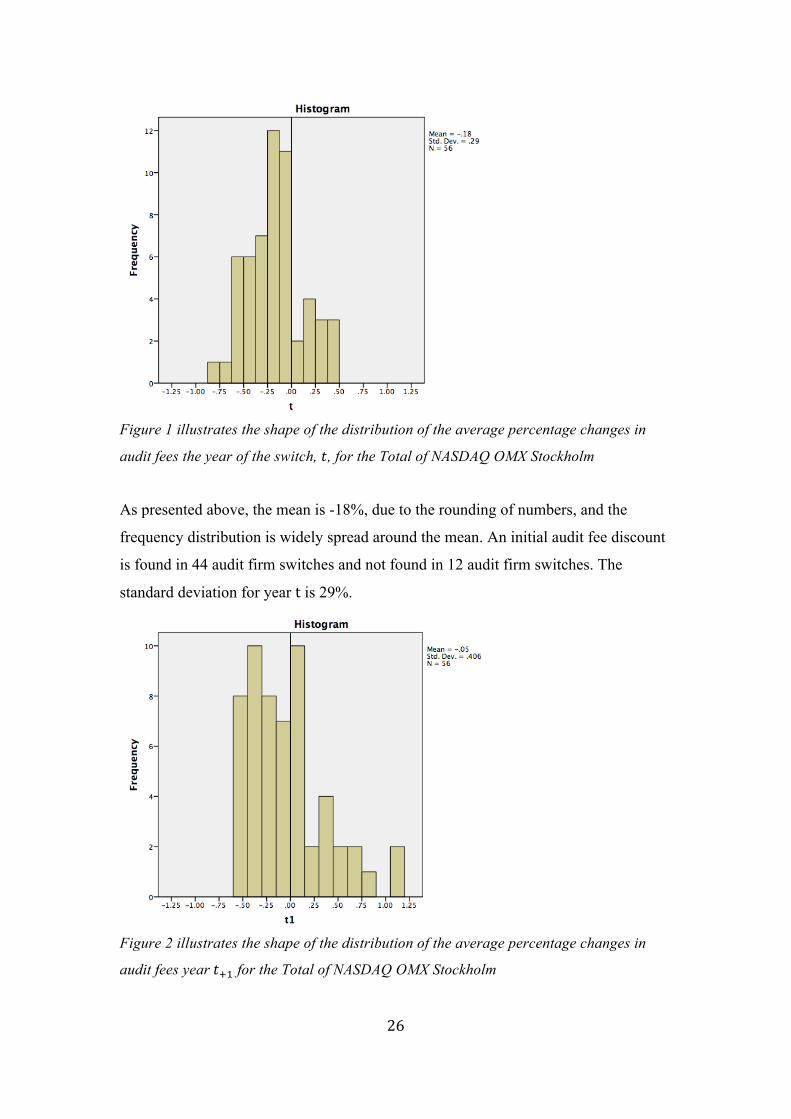
Figure 1 illustrates the shape of the distribution of the average percentage changes in
audit fees the year of the switch, 𝑡, for the Total of NASDAQ OMX Stockholm
As presented above, the mean is -18%, due to the rounding of numbers, and the
frequency distribution is widely spread around the mean. An initial audit fee discount
is found in 44 audit firm switches and not found in 12 audit firm switches. The
standard deviation for year t is 29%.
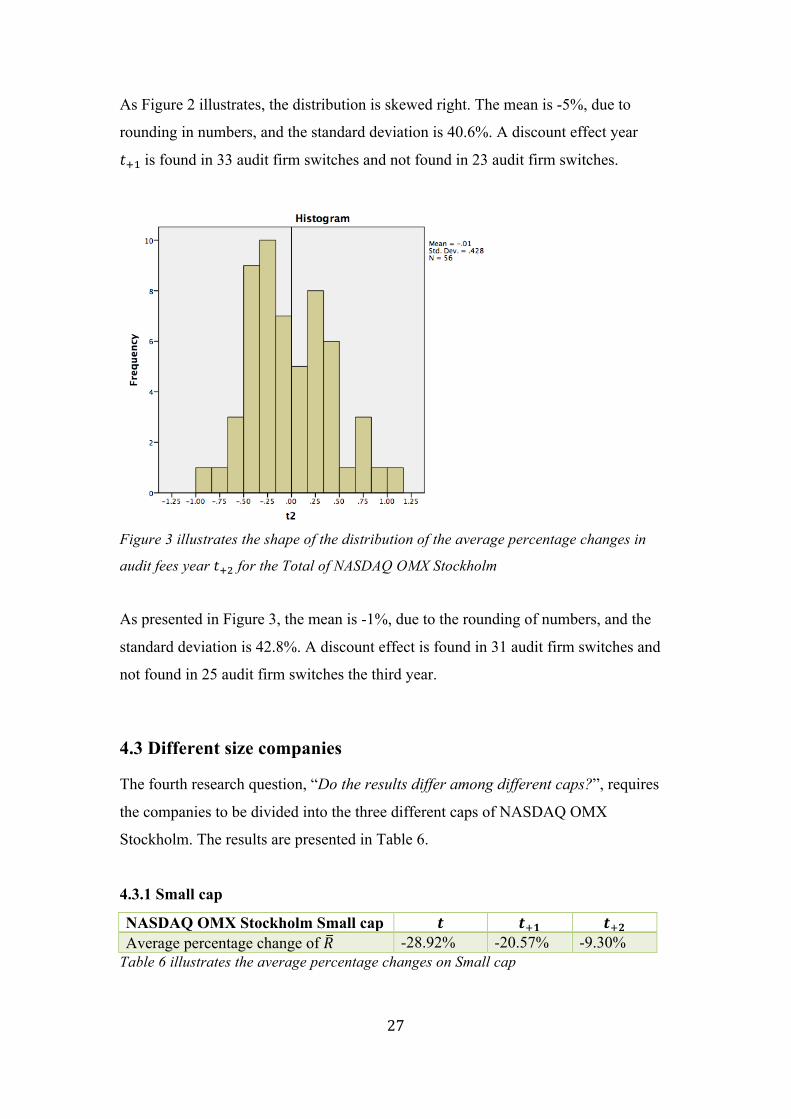
Figure 2 illustrates the shape of the distribution of the average percentage changes in
audit fees year 𝑡!! for the Total of NASDAQ OMX Stockholm
27
As Figure 2 illustrates, the distribution is skewed right. The mean is -5%, due to
rounding in numbers, and the standard deviation is 40.6%. A discount effect year
𝑡!! is found in 33 audit firm switches and not found in 23 audit firm switches.
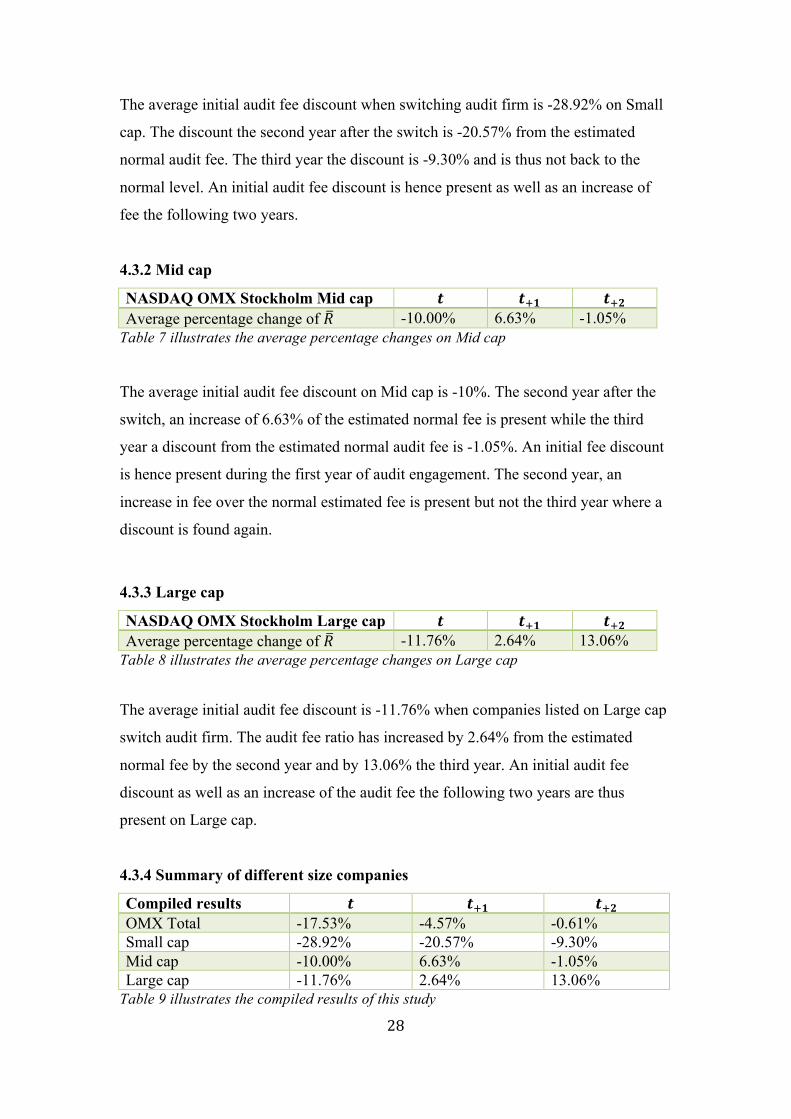
Figure 3 illustrates the shape of the distribution of the average percentage changes in
audit fees year 𝑡!! for the Total of NASDAQ OMX Stockholm
As presented in Figure 3, the mean is -1%, due to the rounding of numbers, and the
standard deviation is 42.8%. A discount effect is found in 31 audit firm switches and
not found in 25 audit firm switches the third year.
4.3 Different size companies
The fourth research question, “Do the results differ among different caps?”, requires
the companies to be divided into the three different caps of NASDAQ OMX
Stockholm. The results are presented in Table 6.
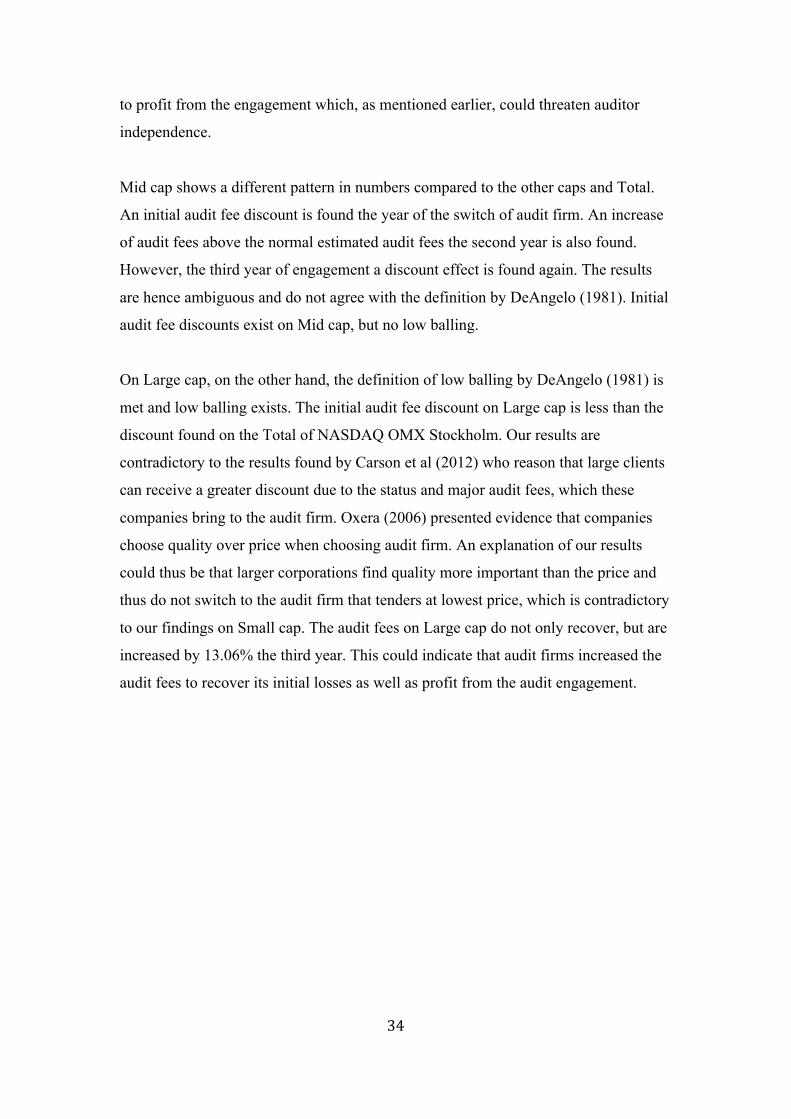
4.3.1 Small cap
NASDAQ OMX Stockholm Small cap 𝒕 𝒕!𝟏 𝒕!𝟐 Average percentage change of 𝑅 -28.92% -20.57% -9.30%
Table 6 illustrates the average percentage changes on Small cap
28
The average initial audit fee discount when switching audit firm is -28.92% on Small
cap. The discount the second year after the switch is -20.57% from the estimated
normal audit fee. The third year the discount is -9.30% and is thus not back to the
normal level. An initial audit fee discount is hence present as well as an increase of
fee the following two years.
4.3.2 Mid cap
NASDAQ OMX Stockholm Mid cap 𝒕 𝒕!𝟏 𝒕!𝟐 Average percentage change of 𝑅 -10.00% 6.63% -1.05%
Table 7 illustrates the average percentage changes on Mid cap
The average initial audit fee discount on Mid cap is -10%. The second year after the
switch, an increase of 6.63% of the estimated normal fee is present while the third
year a discount from the estimated normal audit fee is -1.05%. An initial fee discount
is hence present during the first year of audit engagement. The second year, an
increase in fee over the normal estimated fee is present but not the third year where a
discount is found again.
4.3.3 Large cap
NASDAQ OMX Stockholm Large cap 𝒕 𝒕!𝟏 𝒕!𝟐 Average percentage change of 𝑅 -11.76% 2.64% 13.06%
Table 8 illustrates the average percentage changes on Large cap
The average initial audit fee discount is -11.76% when companies listed on Large cap
switch audit firm. The audit fee ratio has increased by 2.64% from the estimated
normal fee by the second year and by 13.06% the third year. An initial audit fee
discount as well as an increase of the audit fee the following two years are thus
present on Large cap.
4.3.4 Summary of different size companies
Compiled results 𝒕 𝒕!𝟏 𝒕!𝟐 OMX Total -17.53% -4.57% -0.61% Small cap -28.92% -20.57% -9.30% Mid cap -10.00% 6.63% -1.05% Large cap -11.76% 2.64% 13.06%
Table 9 illustrates the compiled results of this study

29
As presented in Table 9 the results differ among different caps. The greatest initial
audit fee discount exists on Small cap with -28.92%. The initial audit fee discount on
Mid cap and Large cap are alike with discounts of -10.00% and -11.76%. The greatest
increase of audit fees the following two years after the change exists on Large cap
where an increase of 24.82 percentage points is found the third year. Companies listed
on Small cap have an average increase of audit fees by 19.62 percentage points the
third year after the change. Companies listed on Mid cap have an average increase of
audit fees by 8.95 percentage points the third year after the switch and is thus the cap
that has the lowest increase of audit fees. The results show that there are differences
among the different caps.

30
5. Analysis
In this section the results of this thesis are put in relation to previous research that is
outlined in the frame of references. The structure of the chapter is generally the same
as the empirics’ chapter to enable the reader to follow the connections between the
two chapters.
5.1 Correlation
The results of correlation in this study agree with earlier research (Hay et al 2006) that
auditee size is highly significant to set the level of audit fees. Company Turnover and
Total Assets show a very strong or strong correlation with Audit Fees across
companies listed on NASDAQ OMX Stockholm. However, Company Turnover
correlates better than Total Assets with Audit Fees on Small cap, Mid cap and Total
for all caps. Audit firms use Company Turnover as a first approximation of the price
of audit (Oxera 2006), which is reasonable due to the results of this study.
On Large cap, the correlation shows only a strong relationship with Audit Fees for
both Company Turnover and Total Assets. However, Audit Fees correlates slightly
better with Total Assets but the difference is insignificant. The lower correlation
coefficient of audit fees and auditee size could be due to other important factors that
affect the price of audit. Large corporations may have a greater number of
subsidiaries, which earlier studies have shown to be an important factor that affects
the price of an audit engagement (Simunic 1980).
5.2 Low balling on the Swedish audit market
The results show that low balling behaviour exists among audit firms when competing
over clients listed on NASDAQ OMX Stockholm since an initial audit fee discount is
present as well as an increase of audit fees the following two years after the switch.
The definition of low balling by DeAngelo (1981) is hence confirmed. This result
disagrees with Dye’s (1991) prediction that low balling only occurs in settings where
audit fees are not publicly disclosed. The results, however, show a lesser initial audit
fee discount, -17,53%, than the results presented by Jonasson & Tungel (2012) who

31
concluded that an initial audit fee discount of -27,06% occurred among companies
listed on NASDAQ OMX Stockholm. Further, Jonasson & Tungel (2012) found that
the audit fees were only 79.4% of the estimated normal fee the third year. The results
of our thesis indicate that audit fees are very close to the estimated normal level, -
0,61%, by the third year.
Figures 1-3 in the previous chapter show a distribution pattern widely spread around
the mean. Also, the standard deviation for all three years is high; 29% the year of the
switch, 40.6% the second year and 42.8% the third year after the switch. This is
logical due to the wide spread shown in the histograms. The results indicate that not
all audit firm switches have the characteristics of low balling. The year of the switch,
an initial audit fee discount is present among the majority, in 44 out of 56 companies
that switched audit firm. The second year after the switch, a discount effect is shown
by 33 of the companies, which also make the majority. The third year after the switch,
a discount effect is present among 31 of the companies that switched audit firm.
Hence, 25 companies are above the estimated normal audit fee by the third year. As
mentioned before, our results show that audit fees, at an average, are almost back to
normal levels by the third year. The histogram presented in Figure 3, however, shows
that only a minority of the companies are back to normal or higher levels of audit fees
the third year. This indicates that audit firms need longer audit tenures to recover the
initial losses.
The differences between the results presented by Jonasson & Tungel (2012) and the
results of our study could be due to the different measure of auditee size. The results
of correlation, however, in this thesis have shown a similar relationship between
Audit fees and Company turnover and Audit fees and Total assets of the Total of
NASDAQ OMX Stockholm. Since the correlation is fairly equal, the differences of
percentage changes of audit fees shown in this thesis and in the thesis by Jonasson &
Tungel (2012) could very likely be due to other factors.
The differences could suggestively be the differences in included switches. Jonasson
& Tungel (2012) have a larger proportion of switches from companies listed on Small
cap. As the results of Small cap in our thesis have shown, the initial fee discount is

32
larger, -28,92%, than the initial fee discount of the Total, -17,53%. Small cap-listed
companies also show that audit fees have not recovered to normal levels by the third
year where a discount of -9,30% is still present. The differences between the results
could hence be partly explained by the difference in proportion of Small cap-listed
companies, which, as this thesis has shown, have a larger initial fee discount and have
not recovered to normal levels by the third year. Jonasson & Tungel (2012) also used
a different methodology and a different composition of companies to calculate the
low balling effect, which could also have affected the results.
5.2.1 Results compared to research done internationally
Contradictory to the findings of Simunic (1980) and Palmrose (1986) in the US and
by Francis (1984) in Australia where no low balling was found, our study shows that
low balling exists on the Swedish audit market when competing over companies listed
on NASDAQ OMX Stockholm. However, the above studies only tested for low
balling indirectly or had a small sample, which could have affected their results.
These studies are also old, and the market of auditing as well as audit regulations have
changed since that time.
Other studies in the 1980’s and 1990’s in the US and UK found that low balling
existed since an initial audit fee discount of -22% to -25% occurred (Simon & Francis
1988; Ettredge & Greenberg 1990; Gregory & Collier 1996). The fees were back to
normal levels by the fourth year (Simon & Francis 1988; Gregory & Collier 1996).
Our study found a slightly smaller low balling effect on the Total of NASDAQ OMX
Stockholm, a lower initial fee discount and a quicker recovery to normal audit fees.
For audit firms to be able to profit from the audit engagement, longer audit tenures are
needed since the initial losses due to the initial discounts are not recovered during the
period of study. This could affect auditor independence if audit firms need their
clients to be financial success companies to recover the receivables created by the
initial audit fee discounts (The Cohen Report 1978). However, the new audit firms
could be more effective in their work due to expertise in the respective industry (Chan
1999) and hence be able to lower the audit fee and do not depend on future
receivables from the client. Auditor independence is thus not threatened, according to
Chan (1999).

33
Francis & Simon (1987) and Baber, Brooks & Ricks (1987) also concluded that low
balling existed in the US. However, their results are difficult to compare to ours.
Francis & Simon (1987) used a very small sample of 12 switches due to the question
of low balling being a side issue of the paper. Baber, Brooks & Ricks (1987)
researched low balling on North Carolina county governments which makes
comparisons difficult since our sample only includes publicly listed companies.
The most recent research done in the area of low balling is presented by Krauß,
Quosigk & Zülch (2014) in Germany. An initial audit fee discount was discovered to
be -13% (Krauß, Quosigk & Zülch 2014), which is a smaller initial audit fee discount
than our results, -17.53%. Krauß, Quosigk & Zülch (2014) found no discount effect
the second year, whereas our study shows a discount effect the second year after the
switch. However, Krauß, Quosigk & Zülch (2014) only included large corporations in
their study while our results of the Total of NASDAQ OMX Stockholm include Small
and Mid size companies as well. The results of Krauß, Quosigk & Zülch (2014) and
our results of companies listed on Large cap are more similar. Our study of Large cap
shows an initial fee discount of -11.76% as well as no discount effect the subsequent
years after the switch. This implies that the existence of low balling when audit firms
compete over large clients is similar in Sweden and Germany.
5.3 Low balling and different size companies
As stated in the previous chapter, the results of the different caps differ. The results of
Small cap indicate that an initial audit fee discount is present as well as an increase of
fee the following two years. The definition of low balling by DeAngelo (1981) is
hence met, and low balling occurs among audit firms when competing over clients
listed on Small cap. There is still a discount effect by the third year of audit tenure,
the audit fee is -9.30% of the estimated normal audit fee. The greatest initial audit fee
discount of all three caps occurs on Small cap. This could be explained by that
companies listed on Small cap find price as the most important factor when choosing
audit firm. This agrees with statements made by Johnson & Lys (1990). The results
indicate that audit firms need audit engagements to be longer on Small cap to be able
34
to profit from the engagement which, as mentioned earlier, could threaten auditor
independence.
Mid cap shows a different pattern in numbers compared to the other caps and Total.
An initial audit fee discount is found the year of the switch of audit firm. An increase
of audit fees above the normal estimated audit fees the second year is also found.
However, the third year of engagement a discount effect is found again. The results
are hence ambiguous and do not agree with the definition by DeAngelo (1981). Initial
audit fee discounts exist on Mid cap, but no low balling.
On Large cap, on the other hand, the definition of low balling by DeAngelo (1981) is
met and low balling exists. The initial audit fee discount on Large cap is less than the
discount found on the Total of NASDAQ OMX Stockholm. Our results are
contradictory to the results found by Carson et al (2012) who reason that large clients
can receive a greater discount due to the status and major audit fees, which these
companies bring to the audit firm. Oxera (2006) presented evidence that companies
choose quality over price when choosing audit firm. An explanation of our results
could thus be that larger corporations find quality more important than the price and
thus do not switch to the audit firm that tenders at lowest price, which is contradictory
to our findings on Small cap. The audit fees on Large cap do not only recover, but are
increased by 13.06% the third year. This could indicate that audit firms increased the
audit fees to recover its initial losses as well as profit from the audit engagement.

35
6. Conclusions
In this chapter the problem statement “Does low balling exist on the Swedish audit
market and does the size of the company affect the extent of low balling?” is
answered. The conclusions are drawn from the analysis.
To be able to answer the first part of the problem statement of this thesis, if low
balling exists on the Swedish audit market, the data on 56 identified switches of audit
firms during 2002-2010 on the NASDAQ OMX Stockholm were collected. The
results indicate that low balling exists on the Swedish audit market. An initial audit
fee discount as well as a following increase of audit fees is present among companies
listed on NASDAQ OMX Stockholm. The average initial audit fee discount is -
17.53% of the estimated normal audit fee. The second year the average audit fee
discount is -4.57%, and the third year the average audit fee discount is -0.61% of the
estimated normal audit fee. This indicates that audit fees are nearly back to normal
levels after three years of audit tenure. However, low balling does not appear in all
switches of audit firms but an initial audit fee discount occurs in the majority of
switches.
To be able to answer the second part of the problem statement of this thesis, if the size
of the company affects the extent of low balling, 56 identified switches were divided
into three groups depending on which cap the company was listed on. The results
show considerable differences between the three caps. The results indicate that low
balling exists on Small and Large cap. On Small cap, the average initial audit fee
discount is -28.92%, the second year an average audit fee discount is -20.57%, and
the third year the average audit fee discount is -9.30%, when compared to the
estimated normal audit fee. Large cap shows a lesser initial audit fee discount of -
11.76% the year of the switch, and the audit fees are over the estimated normal audit
fees the second year by 2.64% as well as 13.06% the third year. The results of
companies listed on Mid cap show an initial audit fee discount of -10.00% and an
increase of audit fees over the estimated normal audit fee by 6.63% the second year.
The third year after the switch, an audit fee discount is yet again found by -1.05%.
Hence, initial audit fee discounts exist on Mid cap, but not low balling.

36
7. Suggestions for future research
This chapter provides the reader with suggestions for future research in the area of
low balling. These suggestions are made in the light of the findings from our thesis.
Our study indicates that low balling exists when audit firms compete over clients
listed on NASDAQ OMX Stockholm; however, the possible effects on auditor
independence were not studied. There have been mixed results internationally in
previous studies on low balling influence on auditor independence (The Cohen Report
1978; DeAngelo 1981; Gu & Lee 1998; Chan 1999). Further research on this issue in
Sweden should obtain a deeper understanding of auditor independence since it is a
highly debatable issue, especially after the financial crisis in 2008 (European Union
2013).
New regulations from the European Union introducing mandatory audit firm rotation
every 10 years, with the possibility of member states to choose additional 10 years, to
enhance audit quality and auditor independence were presented in December 2013
(European Union 2013). The mandatory rotation of 10 or 20 years will enter in
Sweden in 2016. More frequent switches of audit firms and costly tender processes
among listed companies may occur after the legislative change and could possibly
lead to changes in competition on the audit market and difference in price pressure. It
would be interesting to study if the extent of low balling increases when there is a
time frame of the audit engagement. Another interesting subject to study is if the
anticipated effects on auditor independence are achieved after the legislative change.
The differential results shown on Mid cap in this thesis also requires further studies as
to why they differ from the other caps. Research on the phenomenon of low balling in
Sweden that includes more variables than auditee size is advisable for a deeper
understanding of the low balling extent. Examples of other factors that have been
discussed driving audit fees are variables such as number of subsidiaries as well as
location, different industries, and the risk of the auditee.
37
Bibliography
ABL 2005:551. Aktiebolagslag. http://www.notisum.se/rnp/sls/lag/20050551.htm
(Accessed March 20, 2014)
Arruñada, Benito & Paz-Ares, Cándido. (1997) Mandatory Rotation of Company
Auditors: A critical Examination. International Review of Law and
Economics, vol. 17, no. 1, pp. 31-61.
Baber, William R., Brooks, Eugene & Ricks, William E. (1987) An empirical
investigation of the market for audit services in the public sector. Journal of
Accounting Research, vol. 25, no. 2, pp. 293-305.
Blumberg, Boris., Cooper, Donald R & Schindler, Pamela S. (2008) Business
Research Methods Second European Edition. London: McGraw-Hill Higher
Education.
Carson, Elizabeth., et al. (2012) Changes in Audit Market Competition and the Big N
Premium. Auditing: A Journal of Practice & Theory, vol. 31, no. 3, pp. 47-73.
Chan, D.K. (1999) "Low-Balling" and Efficiency in a Two-Period Specialization
Model of Auditing Competition*. Contemporary Accounting Research, vol.
16, no. 4, pp. 609-642.
Chan, Philip., Ezzamel, Mahmoud & Gwilliam, David. (1993) Determinants of
Audit Fees for Quoted UK Companies. Journal of Business Finance &
Accounting, vol. 20, no. 6, pp. 765-786.
DeAngelo, Linda Elizabeth. (1981) Auditor Independence, “Low Balling”, and
Disclosure Regulation. Journal of Accounting and Economics, vol. 3, no. 2,
pp. 113-127.
Dye, Ronald A. (1991) Informationally motivated auditor replacement. Journal of
Accounting and Economics, vol. 14, no. 4, pp. 347–374.
Ettredge, Michael & Greenberg, Robert. (1990) Determinants of Fee Cutting on
Initial Audit Engagements. Journal of Accounting Research, vol. 28, no.1,
pp.198-210.
European Union. (2013) European commission Memo /13/1171 17/12/2013
http://europa.eu/rapid/press-release_MEMO-13-1171_en.htm?locale=en
(Accessed February 17, 2014)
Far. (2005) Vägledning vid upphandling av lagstadgad revision

38
http://www.advokatsamfundet.se/Documents/Advokatsamfundet_sv/Nyheter/
vagledning_upphandling_revision.pdf (Accessed March 20, 2014)
Francis, Jere R. (1984) The Effect of Audit Firm Size on Audit Prices: A Study of the
Australian Market. Journal of Accounting and Economics, vol. 6, no. 2, pp.
133-151.
Francis, Jere R. (2004) What do we know about audit quality? British Accounting
Review, vol. 36, no. 4, pp. 345-368.
Francis, Jere R & Simon, Daniel T. (1987) A test of audit pricing in the small-client
segment of the U.S. audit market. The Accounting Review, vol. 62, no.1, pp.
145-157.
Ghosh, Aloke & Lustgarten, Steven. (2006) Pricing of Initial Audit Engagements by
Large and Small Audit Firms. Contemporary Auditing Research, vol. 23, no.
2, pp. 333-368.
Gregory, Alan & Collier, Paul. (1996) Audit fees and auditor change: An
investigation of the persistence of the fee reduction by type of change. Journal
of Business Finance & Accounting, vol. 23, no. 1, pp. 13-28.
Grönboken. (2010) Revisionspolitik: Lärdomar från krisen
http://ec.europa.eu/internal_market/consultations/docs/2010/audit/green_paper
_audit_sv.pdf (Accessed March 12, 2014)
Hay, David C., Knechel, Robert W & Wong, Norman. (2006) Audit Fees: A Meta-
analysis of the Effect of Supply and Demand Attributes. Contemporary
Accounting Research, vol. 23, no. 1, pp. 141-191.
IFRS. (2012) IAS 8 Accounting Policies, Changes in Accounting Estimates and
Errors http://www.ifrs.org/Documents/IAS8.pdf (Accessed May 15, 2014)
Johnson, Bruce W. & Lys, Thomas. (1990) The market for audit services: Evidence
from voluntary auditor changes. Journal of Accounting and Economics, vol.
12, no. 1-3, pp. 281-308.
Jonasson, Gustav & Tungel, Caroline. (2012) Förekommer low-balling på svenska
revisionsmarknaden?. D-uppsats, Uppsala Universitet.
Krauß, Patrick., Quosigk, Benedikt M & Zülch, Henning. (2014) Effects of Initial
Audit Fee Discounts on Audit Quality: Evidence from Germany. International
journal of Auditing, vol. 18, no. 1, pp. 40-56.
Lee, Chi-Wen Jevons & Gu, Zhaoyang. (1998) Low Balling, Legal Liability and
39
Auditor Independence. The Accounting Review, vol. 73, no. 4, pp. 533-555.
Oxera. (2006) Competition and choice in the UK Audit Market
http://www.bis.gov.uk/files/file28529.pdf (Accessed March 13, 2014)
Odd Molly International. (2012) Årsredovisning 2013
http://mb.cision.com/Main/495/9555332/223104.pdf (Accessed March 20, 2014)
Palmrose, Zoe-Vonna. (1986) Audit Fees and Auditor Size: Further Evidence.
Journal of Accounting Research, vol. 24, no. 2, pp. 97-110.
Pong, C. M & Whittington, G. (1994) The determinants of audit fees: some empirical
models. Journal of Business Finance & Accounting, vol. 21, no. 8, pp. 1071-
1095.
Retriever. (2014) Small, Mid, Large Cap 201212
http://ret-web05.int.retriever.no.ezproxy.ub.gu.se/services/businessinfo.html
(Accessed April 15, 2014)
Ridyard, Derek & De Bolle, Jean. (1992) Competition and the regulation of auditor
independence in the EC. Journal of Financial Regulation and Compliance,
vol. 1, no. 2, pp.163-169.
Saunders, Mark., Lewis, Philip & Thornhill, Adrian. (2009) Research methods for
business Students. Fifth Edition. Harlow: Financial Times Prentice Hall.
Schatzberg, Jeffrey W. (1990) A Laboratory Market Investigation of Low Balling in
Audit Pricing. The Accounting Review, vol. 65, no. 2, pp. 337-362.
Schatzberg, Jeffrey W & Sevcik, Galen R. (1994) A Multiperiod Model and
Experimental Evidence of Independence and "Lowballing”. Contemporary
Accounting Research, vol. 11, no.1, pp. 137- 174.
Simon, Daniel T & Francis, Jere R. (1988) The Effects of Auditor Change on Audit
Fees: Tests of Price Cutting and Price Recovery. The Accounting Review, vol.
63, no. 2, pp. 255-269.
Simunic, Dan A. (1980) The pricing of Audit Services: Theory and Evidence. Journal
of Accounting Research, vol. 18, no. 1, pp. 161-190.
SvD. (2002) Andersen går ihop med Deloitte Sanminas ledning ber om ursäkt Bill
Gates till attack mot åklagare Telekom tyngde ner även i USA
http://www.svd.se/nyheter/inrikes/andersen-gar-ihop-med-deloitte-sanminas-
ledning-ber-om-ursakt-bill-gates-till-attack-mot-aklagare-telekom-tyngde-ner-
aven-i-usa_50701.svd (Accessed April 11, 2014)

40
Swedbank. (2014) Hur bolagen klassificeras
https://www.swedbank.se/privat/spara-och-placera/aktier/lar-mer-om-
vardepapper/aktieskola/hur-bolagen-klassificeras/index.htm (Accessed April
15, 2014)
The Cohen Report. (1978) The Commission on Auditors’ Responsibilities: Report,
Conclusions and Recommendations
http://documents.routledge-
interactive.s3.amazonaws.com/9780415508117/articles/commission.pdf
(Accessed April 23, 2014)
UNCC. (2014) Correlation Coefficients
http://coedpages.uncc.edu/cpflower/rsch8140/review/correlation.htm
(Accessed April 15, 2014)
VOLVO. (2012) Årsredovisninng 2013
http://www3.volvo.com/investors/finrep/ar13/ar_2013_sve.pdf (Accessed
March 20, 2014)

41
Appendices
Appendix 1: Audit fees
Appendix 1 shows audit fees paid by companies in absolute numbers in MSEK, if not
other specified, the year of the change as well as two years before and after.
Small Cap Year of the change 𝑭!𝟐 𝑭!𝟏 𝑭 𝑭!𝟏 𝑭!𝟐
ACAP Invest AB 2007 1.13 1.17 1.45 1.77 1.59 Addnode Group Aktiebolag 2003 1.06 0.20 0.81 1.15 1.27 Anoto Group AB 2008 0.32 0.38 0.35 0.31 0.31 CYBERCOM GROUP AB 2008 1.20 2.01 2.77 2.01 2.18 DORO AB 2007 1.50 1.10 1.10 0.90 1.20 Duroc Aktiebolag 2003 0.71 0.89 0.54 0.46 0.53 Duroc Aktiebolag 2006 0.46 0.55 0.47 0.83 1.20 Elanders AB 2008 1.68 2.13 2.17 2.46 2.02 Fingerprint Cards AB 2003 0.25 0.18 0.08 0.10 0.10 Image Systems AB 2002 0.44 0.37 0.16 0.20 0.22 Image Systems AB 2006 0.22 0.29 0.39 0.61 0.50 Micronic Mydata AB 2006 1.38 1.49 1.33 0.96 1.12 Midway Holding Aktiebolag 2005 2.60 2.80 1.30 1.90 2.40 NOTE AB 2008 1.61 1.59 0.95 1.24 1.10 NOVOTEK Aktiebolag 2003 0.24 0.21 0.21 0.22 0.20 Proact IT Group AB 2006 1.87 1.53 0.81 0.94 1.03 PROBI Aktiebolag 2002 0.07 0.08 0.12 0.20 0.25 ProfilGruppen AB 2007 0.80 0.80 0.60 0.70 0.70 Semcon Aktiebolag 2007 2.46 2.76 2.30 2.70 2.40 Stockwik Förvaltning AB 2008 1.38 1.05 0.31 0.53 0.48 Vitrolife AB 2007 0.46 0.53 0.39 0.39 0.48

42
Mid Cap Year of the change 𝑭!𝟐 𝑭!𝟏 𝑭 𝑭!𝟏 𝑭!𝟐
Avanza Bank Holding AB 2007 0.58 1.00 0.92 1.46 1.04 Betsson AB 2008 0.86 0.43 2.12 1.68 1.15 Eniro AB 2004 5.00 4.00 4.00 5.00 6.00 Fastighets AB Balder 2009 1.10 1.10 1.20 1.20 1.40 Fenix Outdoor AB 2006 0.72 0.75 0.40 1.12 1.63 G & L Beijer AB 2005 1.23 1.79 1.98 2.21 2.54 Gunnebo Aktiebolag 2008 10.80 10.20 7.40 8.80 7.10 Haldex Aktiebolag 2003 5.00 6.00 5.00 6.00 7.00 Heba Fastighets Aktiebolag 2007 0.28 0.25 0.32 0.35 0.37 Höganäs AB 2003 2.20 1.00 2.60 4.40 4.10 Intrum Justitia AB 2004 4.70 9.00 8.30 11.80 8.40 JM AB 2004 3.50 4.70 3.80 4.00 4.00 Net Entertainment NE AB 2008 0.16 0.25 0.51 0.72 0.91 Nobia AB 2007 9.00 10.00 10.00 11.00 12.00 Nolato Aktiebolag 2008 1.65 2.29 1.68 2.06 2.01 Nordnet AB 2004 2.34 1.71 1.62 2.69 2.53 Proffice Aktiebolag 2007 2.00 2.00 2.00 3.00 4.00 SkiStar Aktiebolag 2004 1.13 1.48 0.61 0.87 0.96 TradeDoubler AB 2009 2.80 5.30 4.73 6.77 4.46 ÅF AB 2003 1.80 2.00 1.60 2.21 2.73 ÅF AB 2007 2.73 3.49 2.35 3.17 3.55
Large Cap
Year of the change 𝑭!𝟐 𝑭!𝟏 𝑭 𝑭!𝟏 𝑭!𝟐
Aktiebolaget Electrolux 2002 28.00 31.00 38.00 45.00 46.00 Aktiebolaget SKF 2005 24.00 24.00 25.00 46.00 33.00 Atlas Copco Aktiebolag 2010 53.00 58.00 44.00 48.00 51.00 BillerudKorsnäs Aktiebolag 2009 2.00 3.00 1.00 2.00 2.00 Boliden AB 2009 6.00 6.00 5.00 5.00 5.00 Getinge AB 2008 10.00 16.00 13.00 17.00 18.00 NCC Aktiebolag 2008 12.00 14.00 13.00 15.00 15.00 Stora Enso AB, MEURO 2008 6.10 7.60 4.90 4.10 5.10 Swedish Match AB 2004 14.00 13.00 13.00 14.00 26.00

43
Tele2 AB 2004 17.00 17.00 15.00 21.00 30.00 TeliaSonera Aktiebolag 2004 28.00 53.00 41.00 49.00 82.00 Tieto Sweden AB 2006 4.09 3.81 2.00 2.11 2.20 Trelleborg AB 2004 16.00 16.00 22.00 26.00 30.00 Wallenstam AB 2006 1.00 1.00 1.30 1.40 1.90
Appendix 2: Company Turnover
Appendix 2 shows Company Turnover of the companies in absolute numbers in
MSEK, if not other specified, the year of the change as well as two years before and
after.
Small Cap
Year of the change 𝑻!𝟐 𝑻!𝟏 𝑻 𝑻!𝟏 𝑻!𝟐
ACAP Invest AB 2007 432.88 542.89 863.54 925.68 713.40 Addnode Group Aktiebolag 2003 315.01 29.11 196.42 322.15 579.94 Anoto Group AB 2008 108.73 168.77 182.20 205.86 208.40 CYBERCOM GROUP AB 2008 534.17 1155.99 1771.01 1714.43 1501.84 DORO AB 2007 621.30 433.20 346.30 632.50 488.40 Duroc Aktiebolag 2003 213.72 221.60 212.56 192.50 203.66 Duroc Aktiebolag 2006 192.50 203.66 199.48 560.40 698.00 Elanders AB 2008 1988.18 2035.62 2191.18 1756.74 1705.92 Fingerprint Cards AB 2003 2.05 4.41 5.17 2.85 2.71 Image Systems AB 2002 81.66 67.57 49.06 70.71 30.13 Image Systems AB 2006 30.13 59.66 78.53 114.80 59.00 Micronic Mydata AB 2006 839.48 1275.76 1204.14 522.98 568.62 Midway Holding Aktiebolag 2005 1949.10 2082.20 2070.90 2358.20 2449.50 NOTE AB 2008 1741.49 1743.79 1709.45 1200.06 1210.72 NOVOTEK Aktiebolag 2003 145.83 198.36 198.48 191.93 199.10 Proact IT 2006 833.59 689.22 756.48 864.77 641.98

44
Group AB PROBI Aktiebolag 2002 17.58 18.99 26.06 24.46 31.62 ProfilGruppen AB 2007 926.70 1086.90 1179.40 1086.10 764.30 Semcon Aktiebolag 2007 1495.73 1614.12 2497.40 3298.80 2281.10 Stockwik Förvaltning AB 2008 556.68 135.06 206.01 153.06 125.53 Vitrolife AB 2007 120.12 171.26 188.94 225.14 274.63
Mid Cap
Year of the change 𝑻!𝟐 𝑻!𝟏 𝑻 𝑻!𝟏 𝑻!𝟐
Avanza Bank Holding AB 2007 331.00 556.00 751.00 779.00 603.00 Betsson AB 2008 391.50 648.96 1037.76 1299.71 1603.21 Eniro AB 2004 4737.00 4901.00 4918.00 4827.00 6697.00 Fastighets AB Balder 2009 678.30 632.60 854.00 1333.00 1466.00 Fenix Outdoor AB 2006 540.16 655.55 742.77 844.97 961.06 G & L Beijer AB 2005 1400.92 1973.67 2332.87 2592.21 3135.97 Gunnebo Aktiebolag 2008 6726.60 7025.00 6903.20 6788.40 5938.00 Haldex Aktiebolag 2003 6225.00 6414.00 6036.00 6759.00 7486.00 Heba Fastighets Aktiebolag 2007 204.80 191.56 183.85 197.04 205.36 Höganäs AB 2003 3245.00 3249.00 3750.00 4162.00 4594.00 Intrum Justitia AB 2004 2774.90 2864.60 2848.80 2823.20 2939.60 JM AB 2004 8872.00 7787.00 8414.00 9887.00 12065.00 Net Entertainment NE AB 2008 99.48 131.15 204.60 299.72 368.17 Nobia AB 2007 12442.00 15590.00 16622.00 15991.00 15418.00 Nolato Aktiebolag 2008 2702.00 2421.00 2824.00 2602.00 3375.00 Nordnet AB 2004 200.08 228.67 358.17 623.34 960.47 Proffice Aktiebolag 2007 2421.00 2851.00 3791.00 4266.00 3909.00 SkiStar Aktiebolag 2004 886.13 959.01 989.95 977.01 1280.49 TradeDoubler 2009 2663.64 3456.70 3014.35 2840.07 2612.70
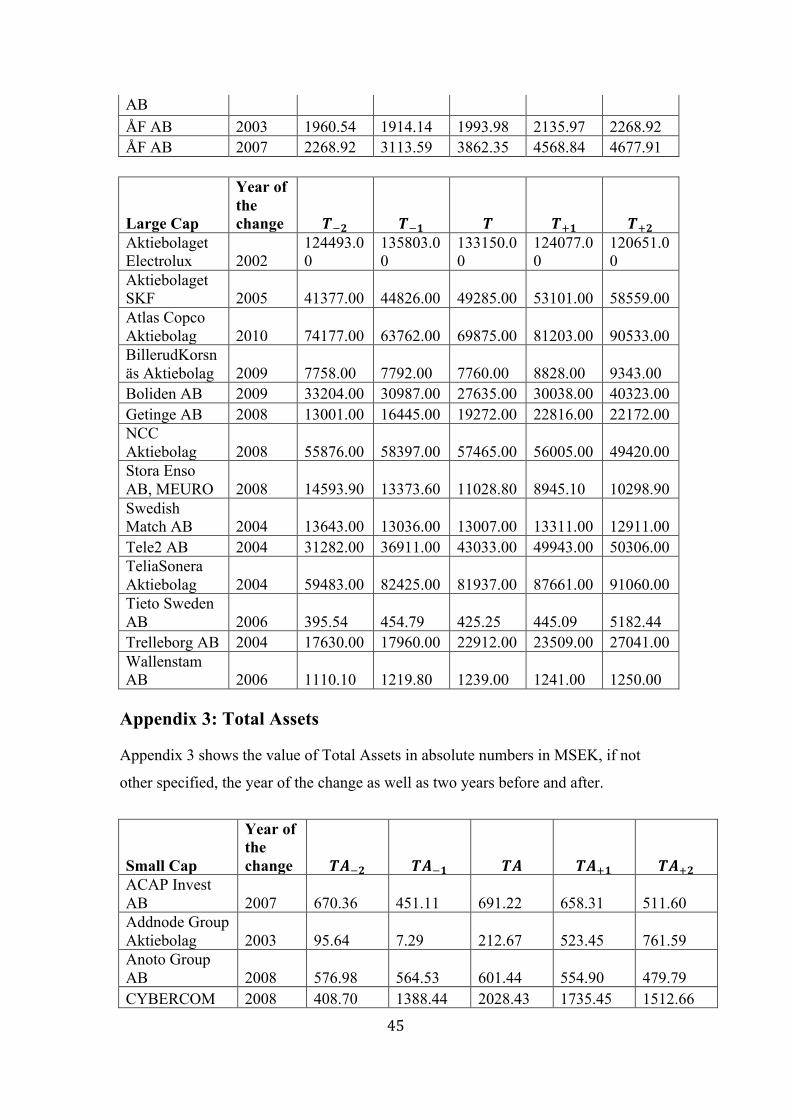
45
AB ÅF AB 2003 1960.54 1914.14 1993.98 2135.97 2268.92 ÅF AB 2007 2268.92 3113.59 3862.35 4568.84 4677.91
Large Cap
Year of the change 𝑻!𝟐 𝑻!𝟏 𝑻 𝑻!𝟏 𝑻!𝟐
Aktiebolaget Electrolux 2002
124493.00
135803.00
133150.00
124077.00
120651.00
Aktiebolaget SKF 2005 41377.00 44826.00 49285.00 53101.00 58559.00 Atlas Copco Aktiebolag 2010 74177.00 63762.00 69875.00 81203.00 90533.00 BillerudKorsnäs Aktiebolag 2009 7758.00 7792.00 7760.00 8828.00 9343.00 Boliden AB 2009 33204.00 30987.00 27635.00 30038.00 40323.00 Getinge AB 2008 13001.00 16445.00 19272.00 22816.00 22172.00 NCC Aktiebolag 2008 55876.00 58397.00 57465.00 56005.00 49420.00 Stora Enso AB, MEURO 2008 14593.90 13373.60 11028.80 8945.10 10298.90 Swedish Match AB 2004 13643.00 13036.00 13007.00 13311.00 12911.00 Tele2 AB 2004 31282.00 36911.00 43033.00 49943.00 50306.00 TeliaSonera Aktiebolag 2004 59483.00 82425.00 81937.00 87661.00 91060.00 Tieto Sweden AB 2006 395.54 454.79 425.25 445.09 5182.44 Trelleborg AB 2004 17630.00 17960.00 22912.00 23509.00 27041.00 Wallenstam AB 2006 1110.10 1219.80 1239.00 1241.00 1250.00
Appendix 3: Total Assets
Appendix 3 shows the value of Total Assets in absolute numbers in MSEK, if not
other specified, the year of the change as well as two years before and after.
Small Cap
Year of the change 𝑻𝑨!𝟐 𝑻𝑨!𝟏 𝑻𝑨 𝑻𝑨!𝟏 𝑻𝑨!𝟐
ACAP Invest AB 2007 670.36 451.11 691.22 658.31 511.60 Addnode Group Aktiebolag 2003 95.64 7.29 212.67 523.45 761.59 Anoto Group AB 2008 576.98 564.53 601.44 554.90 479.79 CYBERCOM 2008 408.70 1388.44 2028.43 1735.45 1512.66

46
GROUP AB DORO AB 2007 270.00 181.70 161.40 170.10 232.30 Duroc Aktiebolag 2003 277.13 244.72 181.40 194.57 207.49 Duroc Aktiebolag 2006 194.57 207.49 233.71 463.50 448.90 Elanders AB 2008 1641.08 2224.28 2386.74 2113.75 2012.32 Fingerprint Cards AB 2003 130.72 103.95 81.87 56.41 61.05 Image Systems AB 2002 106.91 83.82 49.47 39.61 22.50 Image Systems AB 2006 22.50 92.42 92.85 118.40 83.40 Micronic Mydata AB 2006 1571.78 1870.85 1709.73 1506.66 1376.43 Midway Holding Aktiebolag 2005 1197.70 1137.70 1254.70 1364.00 1403.30 NOTE AB 2008 888.21 948.11 948.28 753.05 693.53 NOVOTEK Aktiebolag 2003 106.81 120.58 140.37 132.22 141.70 Proact IT Group AB 2006 440.98 439.05 474.45 515.55 644.31 PROBI Aktiebolag 2002 111.46 110.39 75.32 72.23 93.07 ProfilGruppen AB 2007 616.90 606.30 615.90 563.60 499.30 Semcon Aktiebolag 2007 669.38 663.26 2103.80 1776.20 1264.30 Stockwik Förvaltning AB 2008 189.52 324.26 214.88 155.05 100.83 Vitrolife AB 2007 211.37 271.03 299.46 342.66 359.32
Mid Cap
Year of the change 𝑻𝑨!𝟐 𝑻𝑨!𝟏 𝑻𝑨 𝑻𝑨!𝟏 𝑻𝑨!𝟐
Avanza Bank Holding AB 2007 4505.00 8721.00 14449.00 15597.00 27795.00 Betsson AB 2008 592.55 843.61 1148.45 1392.19 1488.13 Eniro AB 2004 7320.00 7161.00 7163.00 19542.00 18213.00 Fastighets AB Balder 2009 7582.20 7945.90 13800.00 15065.00 18978.00 Fenix Outdoor AB 2006 410.93 470.30 520.81 588.21 639.65 G & L Beijer AB 2005 884.77 1429.00 1462.43 1542.15 1985.15 Gunnebo Aktiebolag 2008 4687.20 4837.30 5262.10 4336.30 3735.00

47
Haldex Aktiebolag 2003 4203.00 3859.00 3596.00 3885.00 4662.00 Heba Fastighets Aktiebolag 2007 2552.53 2687.32 3130.90 3058.49 3493.34 Höganäs AB 2003 4408.00 4205.00 4708.00 4742.00 5253.00 Intrum Justitia AB 2004 3737.30 3680.60 3547.50 4136.00 4461.50 JM AB 2004 10628.00 9145.00 8239.00 8155.00 8406.00 Net Entertainment NE AB 2008 56.56 98.09 162.01 248.68 306.87 Nobia AB 2007 7918.00 9624.00 10290.00 11338.00 10456.00 Nolato Aktiebolag 2008 1724.00 1918.00 2126.00 2113.00 2350.00 Nordnet AB 2004 1437.17 1814.02 2779.34 5873.67 10077.84 Proffice Aktiebolag 2007 987.00 1126.00 1432.00 1500.00 1571.00 SkiStar Aktiebolag 2004 1744.41 1670.48 1895.84 2038.09 2827.97 TradeDoubler AB 2009 2237.00 1551.29 1725.58 1415.73 1436.64 ÅF AB 2003 1276.33 1092.29 1121.77 1295.75 1220.13 ÅF AB 2007 1220.13 2300.23 2795.58 3609.53 3582.51
Large Cap
Year of the change 𝑻𝑨!𝟐 𝑻𝑨!𝟏 𝑻𝑨 𝑻𝑨!𝟏 𝑻𝑨!𝟐
Aktiebolaget Electrolux 2002 87289.00 94447.00 85424.00 77028.00 74932.00 Aktiebolaget SKF 2005 36326.00 35014.00 40349.00 46238.00 46331.00 Atlas Copco Aktiebolag 2010 75394.00 67874.00 71622.00 75109.00 81149.00 BillerudKorsnäs Aktiebolag 2009 9202.00 9021.00 9081.00 9200.00 9335.00 Boliden AB 2009 27231.00 30252.00 33258.00 35128.00 37615.00 Getinge AB 2008 15877.00 22970.00 33032.00 37498.00 34585.00 NCC Aktiebolag 2008 30603.00 34069.00 36247.00 29976.00 31104.00 Stora Enso AB, MEURO 2008 17440.30 15310.80 12240.80 11593.20 13036.70 Swedish Match AB 2004 15447.00 15102.00 14621.00 16806.00 15770.00 Tele2 AB 2004 46872.00 47970.00 47826.00 68283.00 66164.00 TeliaSonera Aktiebolag 2004 206656.00 190060.00 193018.00 203775.00 199392.00 Tieto Sweden AB 2006 1402.25 1575.45 1264.60 1331.90 2547.41

48
Trelleborg AB 2004 15400,00 22856.00 21799.00 24960.00 27557.00 Wallenstam AB 2006 14481,90 17330.20 19764.00 19747.00 20249.00
Appendix 4: Correlation
Appendix 4 shows the average value of two years before the change of auditors in
absolute numbers in MSEK, if not other specified, of Total Assets, 𝑇𝐴, Audit Fee, 𝐹
and Company Turnover, 𝑇. These numbers were used when calculating the
correlation coefficient.
Small Cap 𝑻𝑨 𝑭 𝑻 ACAP Invest AB 560.73 1.15 487.89 Addnode Group Aktiebolag 51.46 0.63 172.06 Anoto Group AB 570.76 0.35 138.75 CYBERCOM GROUP AB 898.57 1.61 845.08 DORO AB 225.85 1.30 527.25 Duroc Aktiebolag 260.93 0.80 217.66 Duroc Aktiebolag 201.03 0.51 198.08 Elanders AB 1932.68 1.90 2011.90 Fingerprint Cards AB 117.34 0.22 3.23 Image Systems AB 95.36 0.41 74.61 Image Systems AB 57.46 0.25 44.90 Micronic Mydata AB 1721.31 1.44 1057.62 Midway Holding Aktiebolag 1167.70 2.70 2015.65 NOTE AB 918.16 1.60 1742.64 NOVOTEK Aktiebolag 113.69 0.23 172.09 Proact IT Group AB 440.01 1.70 761.40 PROBI Aktiebolag 110.92 0.07 18.29 ProfilGruppen AB 611.60 0.80 1006.80 Semcon Aktiebolag 666.32 2.61 1554.92 Stockwik Förvaltning AB 256.89 1.22 345.87 Vitrolife AB 241.20 0.50 145.69
Mid Cap 𝑻𝑨 𝑭 𝑻 Avanza Bank Holding AB 6613.00 0.79 443.50 Betsson AB 718.08 0.64 520.23 Eniro AB 7240.50 4.50 4819.00 Fastighets AB Balder 7764.05 1.10 655.45 Fenix Outdoor AB 440.61 0.73 597.85 G & L Beijer AB 1156.89 1.51 1687.30 Gunnebo Aktiebolag 4762.25 10.50 6875.80

49
Haldex Aktiebolag 4031.00 5.50 6319.50 Heba Fastighets Aktiebolag 2619.93 0.27 198.18 Höganäs AB 4306.50 1.60 3247.00 Intrum Justitia AB 3708.95 6.85 2819.75 JM AB 9886.50 4.10 8329.50 Net Entertainment NE AB 77.33 0.21 115.31 Nobia AB 8771.00 9.50 14016.00 Nolato Aktiebolag 1821.00 1.97 2561.50 Nordnet AB 1625.60 2.02 214.37 Proffice Aktiebolag 1056.50 2.00 2636.00 SkiStar Aktiebolag 1707.44 1.31 922.57 TradeDoubler AB 1894.14 4.05 3060.17 ÅF AB 1184.31 1.90 1937.34 ÅF AB 1760.18 3.11 2691.25
Large Cap 𝑻𝑨 𝑭 𝑻 Aktiebolaget Electrolux 90868.00 29.50 130148.00 Aktiebolaget SKF 35670.00 24.00 43101.50 Atlas Copco Aktiebolag 71634.00 55.50 68969.50 BillerudKorsnäs Aktiebolag 9111.50 2.50 7775.00 Boliden AB 28741.50 6.00 32095.50 Getinge AB 19423.50 13.00 14723.00 NCC Aktiebolag 32336.00 13.00 57136.50 Stora Enso AB, MEURO 16375.55 6.85 13983.75 Swedish Match AB 15274.50 13.50 13339.50 Tele2 AB 47421.00 17.00 34096.50 TeliaSonera Aktiebolag 198358.00 40.50 70954.00 Tieto Sweden AB 1488.85 3.95 425.16 Trelleborg AB 19128.00 16.00 17795.00 Wallenstam AB 15906.05 1.00 1164.95
Appendix 5: Audit fee ratio
Appendix 5 shows the ratio between Audit Fees and Company Turnover of each
company the year of the change as well as two years before and after.
Small Cap 𝑹!𝟐 𝑹!𝟏 𝑹 𝑹!𝟏 𝑹!𝟐 ACAP Invest AB 0.0026 0.0021 0.0017 0.0019 0.0022 Addnode Group Aktiebolag 0.0034 0.0069 0.0041 0.0036 0.0022 Anoto Group AB 0.0029 0.0022 0.0019 0.0015 0.0015 CYBERCOM GROUP AB 0.0022 0.0017 0.0016 0.0012 0.0015 DORO AB 0.0024 0.0025 0.0032 0.0014 0.0025

50
Duroc Aktiebolag 0.0033 0.0040 0.0025 0.0024 0.0026 Duroc Aktiebolag 0.0024 0.0027 0.0024 0.0015 0.0017 Elanders AB 0.0008 0.0010 0.0010 0.0014 0.0012 Fingerprint Cards AB 0.1239 0.0410 0.0145 0.0335 0.0351 Image Systems AB 0.0054 0.0055 0.0032 0.0028 0.0071 Image Systems AB 0.0071 0.0048 0.0050 0.0053 0.0085 Micronic Mydata AB 0.0016 0.0012 0.0011 0.0018 0.0020 Midway Holding Aktiebolag 0.0013 0.0013 0.0006 0.0008 0.0010 NOTE AB 0.0009 0.0009 0.0006 0.0010 0.0009 NOVOTEK Aktiebolag 0.0017 0.0011 0.0011 0.0011 0.0010 Proact IT Group AB 0.0022 0.0022 0.0011 0.0011 0.0016 PROBI Aktiebolag 0.0038 0.0041 0.0045 0.0082 0.0079 ProfilGruppen AB 0.0009 0.0007 0.0005 0.0006 0.0009 Semcon Aktiebolag 0.0016 0.0017 0.0009 0.0008 0.0011 Stockwik Förvaltning AB 0.0025 0.0078 0.0015 0.0035 0.0038 Vitrolife AB 0.0038 0.0031 0.0021 0.0018 0.0017
Mid Cap 𝑹!𝟐 𝑹!𝟏 𝑹 𝑹!𝟏 𝑹!𝟐 Avanza Bank Holding AB 0.0017 0.0018 0.0012 0.0019 0.0017 Betsson AB 0.0022 0.0007 0.0020 0.0013 0.0007 Eniro AB 0.0011 0.0008 0.0008 0.0010 0.0009 Fastighets AB Balder 0.0016 0.0017 0.0014 0.0009 0.0010 Fenix Outdoor AB 0.0013 0.0011 0.0005 0.0013 0.0017 G & L Beijer AB 0.0009 0.0009 0.0009 0.0009 0.0008 Gunnebo Aktiebolag 0.0016 0.0015 0.0011 0.0013 0.0012 Haldex Aktiebolag 0.0008 0.0009 0.0008 0.0009 0.0009 Heba Fastighets Aktiebolag 0.0014 0.0013 0.0018 0.0018 0.0018 Höganäs AB 0.0007 0.0003 0.0007 0.0011 0.0009 Intrum Justitia AB 0.0017 0.0031 0.0029 0.0042 0.0029 JM AB 0.0004 0.0006 0.0005 0.0004 0.0003 Net Entertainment NE AB 0.0016 0.0019 0.0025 0.0024 0.0025 Nobia AB 0.0007 0.0006 0.0006 0.0007 0.0008 Nolato Aktiebolag 0.0006 0.0009 0.0006 0.0008 0.0006 Nordnet AB 0.0117 0.0075 0.0045 0.0043 0.0026 Proffice Aktiebolag 0.0008 0.0007 0.0005 0.0007 0.0010 SkiStar Aktiebolag 0.0013 0.0015 0.0006 0.0009 0.0008 TradeDoubler AB 0.0011 0.0015 0.0016 0.0024 0.0017 ÅF AB 0.0009 0.0010 0.0008 0.0010 0.0012 ÅF AB 0.0012 0.0011 0.0006 0.0007 0.0008

51
Large Cap 𝑹!𝟐 𝑹!𝟏 𝑹 𝑹!𝟏 𝑹!𝟐 Aktiebolaget Electrolux 0.0002 0.0002 0.0003 0.0004 0.0004 Aktiebolaget SKF 0.0006 0.0005 0.0005 0.0009 0.0006 Atlas Copco Aktiebolag 0.0007 0.0009 0.0006 0.0006 0.0006 BillerudKorsnäs Aktiebolag 0.0003 0.0004 0.0001 0.0002 0.0002 Boliden AB 0.0002 0.0002 0.0002 0.0002 0.0001 Getinge AB 0.0008 0.0010 0.0007 0.0007 0.0008 NCC Aktiebolag 0.0002 0.0002 0.0002 0.0003 0.0003 Stora Enso AB 0.0004 0.0006 0.0004 0.0005 0.0005 Swedish Match AB 0.0010 0.0010 0.0010 0.0011 0.0020 Tele2 AB 0.0005 0.0005 0.0003 0.0004 0.0006 TeliaSonera Aktiebolag 0.0005 0.0006 0.0005 0.0006 0.0009 Tieto Sweden AB 0.0103 0.0084 0.0047 0.0047 0.0004 Trelleborg AB 0.0009 0.0009 0.0010 0.0011 0.0011 Wallenstam AB 0.0009 0.0008 0.0010 0.0011 0.0015
Appendix 6: Changes in Audit fee ratios
Appendix 6 shows the estimated normal audit fee, 𝑅, and the initial change in audit
fee ratio the year of the switch as well as the two following years.
Small Cap 𝑹
Audit Fee percentage change, 𝒕
Audit Fee percentage change, 𝒕!𝟏
Audit Fee percentage change, 𝒕!𝟐
ACAP Invest AB 0.0024 -0.2903 -0.1926 -0.0588 Addnode Group Aktiebolag 0.0051 -0.1943 -0.3040 -0.5744 Anoto Group AB 0.0026 -0.2495 -0.4212 -0.4188 CYBERCOM GROUP AB 0.0020 -0.2138 -0.4105 -0.2708 DORO AB 0.0025 0.2825 -0.4255 -0.0080 Duroc Aktiebolag 0.0037 -0.3157 -0.3461 -0.2885 Duroc Aktiebolag 0.0026 -0.0719 -0.4187 -0.3285 Elanders AB 0.0009 0.0476 0.4809 0.2513 Fingerprint Cards AB 0.0825 -0.8243 -0.5935 -0.5748 Image Systems AB 0.0054 -0.4191 -0.4826 0.3118 Image Systems AB 0.0060 -0.1676 -0.1175 0.4168 Micronic Mydata AB 0.0014 -0.2154 0.3063 0.4002 Midway Holding Aktiebolag 0.0013 -0.5313 -0.3984 -0.2685 NOTE AB 0.0009 -0.3977 0.1257 -0.0101 NOVOTEK 0.0014 -0.2087 -0.1587 -0.2664

52
Aktiebolag Proact IT Group A 0.0022 -0.5229 -0.5153 -0.2835 PROBI Aktiebolag 0.0039 0.1415 1.0790 1.0025 ProfilGruppen AB 0.0008 -0.3638 -0.1940 0.1453 Semcon Aktiebolag 0.0017 -0.4507 -0.5118 -0.3725 Stockwik Förvaltning AB 0.0051 -0.7086 -0.3252 -0.2564 Vitrolife AB 0.0035 -0.3986 -0.4953 -0.5001
Mid Cap 𝑹
Audit Fee percentage change, 𝒕
Audit Fee percentage change, 𝒕!𝟏
Audit Fee percentage change, 𝒕!𝟐
Avanza Bank Holding AB 0.0018 -0.3075 0.0616 -0.0241 Betsson AB 0.0014 0.4295 -0.0953 -0.4977 Eniro AB 0.0009 -0.1309 0.1069 -0.0427 Fastighets AB Balder 0.0017 -0.1637 -0.4642 -0.4317 Fenix Outdoor AB 0.0012 -0.5612 0.0767 0.3769 G & L Beijer AB 0.0009 -0.0473 -0.0432 -0.0915 Gunnebo Aktiebolag 0.0015 -0.2988 -0.1520 -0.2179 Haldex Aktiebolag 0.0009 -0.0471 0.0211 0.0756 Heba Fastighets Aktiebolag 0.0013 0.3080 0.3151 0.3309 Höganäs AB 0.0005 0.4067 1.1449 0.8107 Intrum Justitia AB 0.0024 0.2050 0.7287 0.1819 JM AB 0.0005 -0.0950 -0.1893 -0.3356 Net Entertainment NE AB 0.0018 0.3924 0.3552 0.3928 Nobia AB 0.0007 -0.1184 0.0080 0.1406 Nolato Aktiebolag 0.0008 -0.2340 0.0166 -0.2365 Nordnet AB 0.0096 -0.5275 -0.5502 -0.7252 Proffice Aktiebolag 0.0008 -0.3093 -0.0793 0.3397 SkiStar Aktiebolag 0.0014 -0.5618 -0.3684 -0.4672 TradeDoubler AB 0.0013 0.2160 0.8454 0.3208 ÅF AB 0.0010 -0.1793 0.0551 0.2271 ÅF AB 0.0012 -0.4765 -0.4020 -0.3467
Large Cap 𝑹
Audit Fee percentage change, 𝒕
Audit Fee percentage change, 𝒕!𝟏
Audit Fee percentage change, 𝒕!𝟐
Aktiebolaget Electrolux 0.0002 0.2595 0.6006 0.6826 Aktiebolaget SKF 0.0006 -0.0905 0.5532 0.0104 Atlas Copco 0.0008 -0.2246 -0.2721 -0.3063
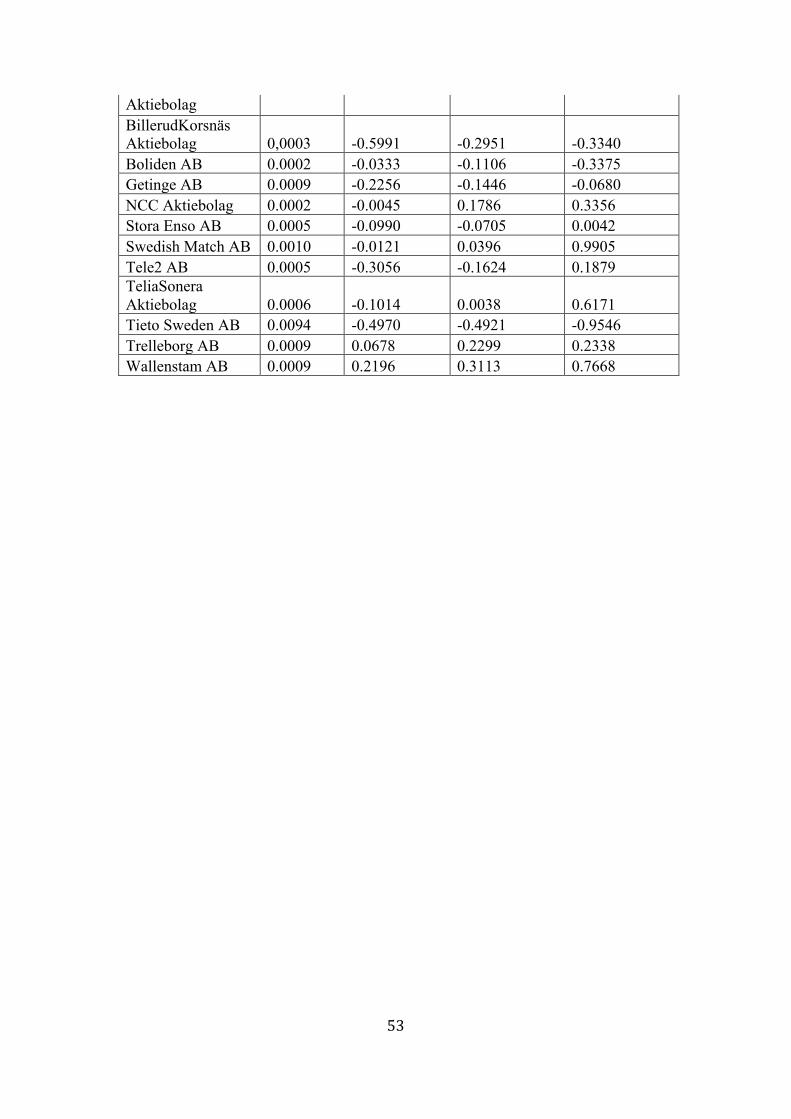
53
Aktiebolag BillerudKorsnäs Aktiebolag 0,0003 -0.5991 -0.2951 -0.3340 Boliden AB 0.0002 -0.0333 -0.1106 -0.3375 Getinge AB 0.0009 -0.2256 -0.1446 -0.0680 NCC Aktiebolag 0.0002 -0.0045 0.1786 0.3356 Stora Enso AB 0.0005 -0.0990 -0.0705 0.0042 Swedish Match AB 0.0010 -0.0121 0.0396 0.9905 Tele2 AB 0.0005 -0.3056 -0.1624 0.1879 TeliaSonera Aktiebolag 0.0006 -0.1014 0.0038 0.6171 Tieto Sweden AB 0.0094 -0.4970 -0.4921 -0.9546 Trelleborg AB 0.0009 0.0678 0.2299 0.2338 Wallenstam AB 0.0009 0.2196 0.3113 0.7668