Embed Size (px)
Citation preview
The European Journal of Comparative Economics Vol. 1, n. 1, pp. 87-106
ISSN 1824-2979
Available online at http://eaces.liuc.it
The Experience of Rising Inequality in Russia and China during the Transition1
James K. Galbraith
The University of Texas at Austin
Ludmila Krytynskaia Princeton University
Qifei Wang
The University of Texas at Austin
Abstract
This paper examines the changes in regional and sectoral inequality that accompanied economic transformation in Russia and China throughout the 1990s. The experiences of the two countries are widely viewed as having been polar opposites. While the Soviet collapse had adverse consequences for many parts of the post-Soviet population, the Chinese experience produced a continuing rise of average living standards. Nevertheless, both countries experienced a drastic increase in economic inequality. In both cases, regional inequalities rose more sharply than inequalities across sectors but within regions. In particular, major urban centers gained dramatically relative to the hinterlands. Also, in Russia as in China, those sectors exercising the largest degrees of monopoly power gained the most (or lost the least) in relative terms. In both countries, the respective position of finance improved greatly, while that of agriculture declined. The decline of agriculture in China, however, was not as precipitous as in Russia, and certain sectors, such as education and science, maintained their position in China in a way that was not possible for them in Russia.
JEL Classification: P52, P27, D39, C82
Keywords: Inequality, Russia, China, Provinces, Sectors
1. Introduction
The collapse of the Soviet Union and the acceleration of economic reforms in the People’s Republic of China were landmark events of the 1990s. Generally they are a study in contrasts. Economic liberalization produced chaos, hyperinflation, industrial collapse, and privation in post-Soviet Russia, whereas the Chinese experienced sustained economic growth and continuing, visible improvement in living standards. On the political front, Russia acquired the trappings of parliamentary democracy, with an independent commercial press. Meanwhile China continued under one-party rule
1 Acknowledgments: This paper is part of the work of the University of Texas Inequality Project,
http://utip.gov.utexas.edu, where the datasets underlying this paper are posted. We thank Alexey Sheviakov of the Center for Socioeconomic Measurement, the Russian Academy of Sciences, and officials of Goskomstat for assistance with Russian data. We also thank the Ford Foundation, through its support of Economists Allied for Arms Reduction, for facilitating our work in Russia. Finally, we are grateful to Deepshikha RoyChowdhury for last-minute checking and correction of our calculations for China.
Corresponding Author: James K. Galbraith, Lyndon B. Johnson School of Public Affairs, the University of Texas at Austin, Carnegie Scholar 2003. Austin, Texas 78713. Tel. 512-471-1244. Fax 512-471-1835 [email protected].
EJCE, vol. 1, n. 1 (2004)
Available online at http://eaces.liuc.it
88
guided by the Chinese Communist Party, and an independent media has not been permitted to exist.
It is well-known from studies such as Sheviakov and Kiruta (2001) that economic inequality rose drastically in Russia during the transition. The regional dimension of this increase figures prominently in the papers so far published, including Mikheeva (1999) and Bradshaw and Vartapetov (2003), who calculate regional dispersions for the periods 1990-1996 and 1990-2001, respectively. Federov (2002, p. 443), however, argues that inequality increases between Russian regions “leveled off and even reversed in the late 1990s.” Kislitsyna (2003) attempts a general explanation of the rise in income inequality using data from the Russian Longitudinal Monitoring Survey (for even-numbered years from 1992-2000), and also provides a useful comparison to the inequality of expenditures. Her work is however limited to a study of household characteristics, such as age, education, and household composition; from among these variables she identifies earnings status as a key to the rise in Russian income inequality.
For China, Khan et al. (1999) report a 42.5 percent increase in a Gini measure of household income inequality in China between 1988 and 1995 alone; Gustaffson and Li (2001) decompose this change to show the role of money income in rural China and of housing and pension benefits in urban areas, while Yang (1999) argued from data on two provinces that “widening sectoral gaps in recent years have caused the rising inequality in China.” Meanwhile, in a contrarian but narrow paper, Wei and Wu (2001) argue that urban-rural inequality between cities and adjacent countryside declined in areas experiencing greater exposure to international trade. Benjamin et al. (2004) document rising rural inequality from 1987 through 1999 with data from nine provinces, finding an accelerating increase in inequality since 1995, while Wu and Perloff (2004) estimate the shapes of whole distributions (rural, urban and the rural/urban gap) from interval statistics in the national household survey.
Overall, the information provided by sample surveys on this topic tends to be of a very general kind, and there are limitations of data. For Russia no study assesses the joint effect of regional and sectoral income changes, while for China, as Benjamin et al. (2004, 7) note, with one exception “there are no studies that track inequality...on anything approximating a continuous basis.” And equally there are limitations of method. As Wu and Perloff state (2004, 1) “...the Gini index only reflects some aspects of the underlying income distribution. A large amount of information is lost.” One generally learns less from these sources than one would like to know about the specific geographic and sectoral patterns of distributional change, and about the precise moments when changes accelerated or slowed down.
This paper takes a new look at the Chinese and Russian transitions, drawing on official sources such as the labor data of the State Committee of the Russian Federation on Statistics (hereafter, Goskomstat) and the Chinese State Statistical Bureau. From these sources we calculate our own measurement of economic inequality, a key concern especially in countries with a history of communism, and a driving force in the social development of any country. In particular, we examine the pattern of relative gains and losses in two dimensions: regions and sectors. That is, we look at the changing spatial distribution of economic activity in both countries, and in the relative prosperity and impoverishment of different branches of activity, as classified and measured by official sources.
We find that there are major similarities between the economic experiences of Russia and China in the 1990s, when looked at in this way. In both countries, inequality
James K. Galbraith et al., The Experience of Rising Inequality in Russia and China
Available online at http://eaces.liuc.it
89
rose as economic liberalization proceeded. In both, regional inequalities rose dramatically, creating major new divisions across geographic space. In both cases, certain sectors gained in relative position, notably those that were apparently able to exploit new-found market power to create and retain economic rents. Of these, finance, utilities and transportation were the most important in China, and finance and energy production (counted as part of industrial production in the official statistics) were dominant in Russia. However, China’s advantage shows up in two important respects. First, unlike in Russia, the region with the greatest gains is a major population center. And second, incomes in education and the social sectors have held up far better than in the Russian federation, a fact that surely reflects differences in the fiscal capacities of the two states.
The next section describes methods and data. Sections three and four describe the economic experiences of Russia and China, respectively. Section five presents brief conclusions.
2. Methods and Data
Previous work on inequality in both Russia and China relies mainly on sample
surveys, which have been conducted in both countries on a regular basis. And surveys show what we also will find: rising economic inequality has been a signal characteristic of both countries in the time of liberalization. What we present here is not novel in that respect.
Nevertheless, the survey approach to the study of inequality suffers from disadvantages. In the Russian case, Sheviakov and Kiruta (2001) raised questions about discrepancies between survey-based and macroeconomic measures of income and consumption. They indicate that the rise in inequality captured in survey measures may be overstated. In China, we are able to find broad measures of urban and rural income inequality up through 2001 , as is reported in Riskin et al. 2001 and updated in Wu and Perloff, 2004). But the level of detail is not high; measures are reported for urban areas, rural areas and the gap between them, leaving many questions on the cutting room floor.
Our approach relies not on surveys, but on the regularly gathered official measures of income by region and sector. In Russia, this information is collected and published by Goskomstat, mainly in annual hard copy publications. Russian data take the form of payroll and employment figures for fourteen major economic sectors, in each of 89 distinct geographic entities (city, republic, oblast, okrug, krai). There are 1232 province-sector cells in our data set for Russia, for each of eleven years from 1990 through 2000, inclusive.
In China, data at a sufficient level of detail are published annually in the China Statistical Yearbook, and are available in electronic format. For the year 2000 we have data for each of 16 sectors for 30 provinces in China, or 480 sector-province cells. The Chinese data experienced some changes in category structure over the years, which affects the continuity of our measures. The data extend back to 1987 on a reasonably consistent annual basis, and it is possible to extend the analysis as far back as 1979 with more highly aggregated information.
Our method is to compute the between-groups component of Theil’s T statistic across province-sector cells for both Russia and China. Theil’s T is a very simple measure of inequality, relying only on two bits of information about each cell: its weight
EJCE, vol. 1, n. 1 (2004)
Available online at http://eaces.liuc.it
90
in total population (or employment), and the ratio of average income within the cell to average income in the country as a whole. The mathematical properties of Theil’s T have been explored in detail elsewhere, and we need not repeat that discussion here (Conceição and Galbraith 2000, Conceição Galbraith and Bradford 2001). Theil’s T has properties that make it attractive for this type of calculation; in particular it is possible to sum row and column elements so as to arrive at cross-sector and cross-province measures of inequality. It is also possible to look directly at the contribution to overall inequality of each cell, sector or province, and to gauge the change in that contribution from year to year. We do not claim for these data more than one should: they are an incomplete record of the changing patterns of income dispersion. They nevertheless contain a wealth of information that deserves to be explored. In particular, they provide a very convenient way to visualize the winners and losers in the process of economic change.
3. The Case of Russia
The post Soviet economic implosion stemmed from several main sources:
decentralization and the physical breakup of the country, a complete collapse in investment (much of it unproductive, to be sure, but a provider of jobs and income nevertheless), and the cataclysmic effect of lower trade barriers on consumers’ willingness to continue to purchase home-made goods. Industrial production fell by nearly half. Meanwhile hyper-inflation devalued the savings of the Russian public, leaving many destitute, and both the government and enterprises sharply reduced social services of all kinds. The adverse consequences for many parts of the post-Soviet population included rising mortality rates, especially among older men, attributed in part to the stresses surrounding economic dislocation, in part to material impoverishment, and in part to the decline in the provision of health care in post Soviet Russia.
These misfortunes occurred even as the country underwent political transition. The transition was not smooth: born in the collapse of a coup d’état, it involved the bloody suppression of parliament in 1993. A riot of independent press in the early 1990s became consolidated, after a fairly short time, under the substantial control of a small number of media oligarchs. The transition from Yeltsin to Putin was a stage-managed event, elevating a figure with no previous political standing. And the country has suffered an ongoing war in Chechnya, with catastrophic effects on the people of that region. Yet, despite recent attempts by Putin to “manage democracy” and reign in the media, the Russian population today lives under a multi-party system, with political liberties never before available to it.
The Russian transition was marked by two years of profound crisis: the industrial collapse and hyper-inflation of 1992 and the financial collapse of 1998. Measures of inequality reveal the impact of these crises, particularly that of 1992. When measured across 1232 province-sector cells, inequality in Russia doubled between 1991 and 1992. After that inequality stabilized, for six years. But from 1998 to 1999 inequality rose another 39 percent, and it continued to rise into the year 2000. Table 1 gives the values of this measure.
James K. Galbraith et al., The Experience of Rising Inequality in Russia and China
Available online at http://eaces.liuc.it
91
Table 1. A Theil measure of Inequality for Russia, 1990-2001
1990 1991 1992 1993 1994 1995 1996 1997 1998 1999 20000.031 0.035 0.070 0.059 0.071 0.076 0.068 0.065 0.068 0.095 0.102
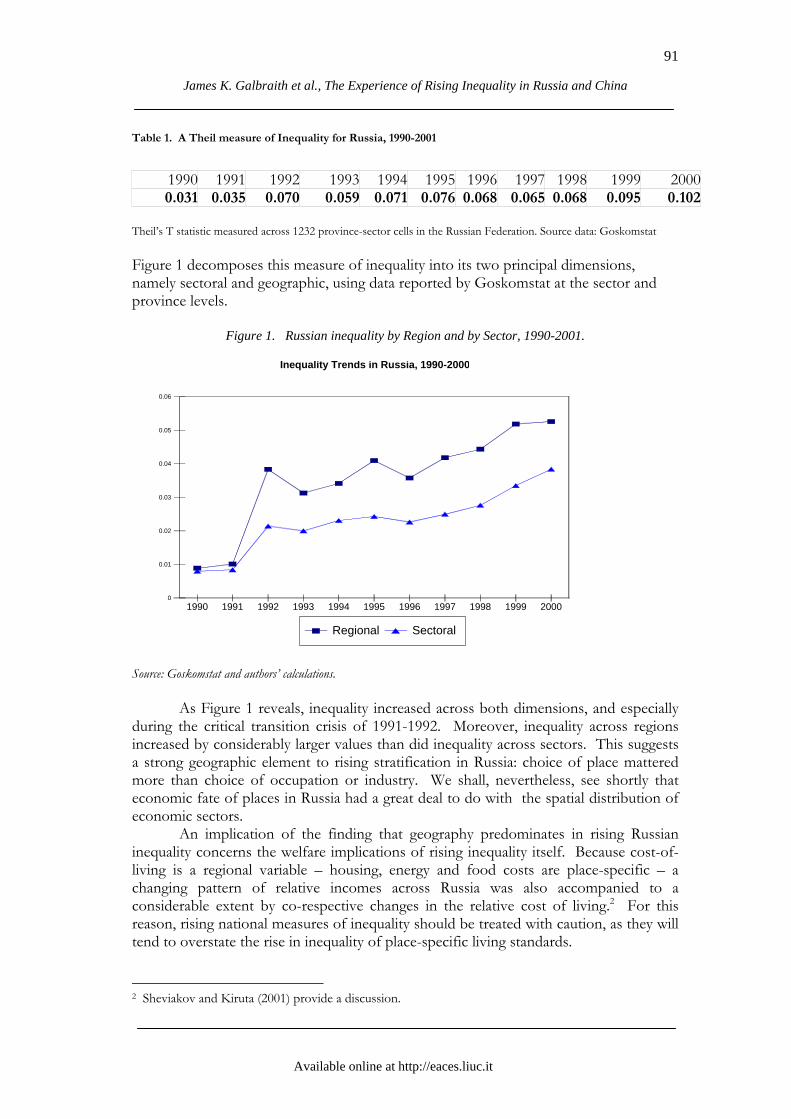
Theil’s T statistic measured across 1232 province-sector cells in the Russian Federation. Source data: Goskomstat Figure 1 decomposes this measure of inequality into its two principal dimensions, namely sectoral and geographic, using data reported by Goskomstat at the sector and province levels.
Figure 1. Russian inequality by Region and by Sector, 1990-2001.
0
0.01
0.02
0.03
0.04
0.05
0.06
1990 1991 1992 1993 1994 1995 1996 1997 1998 1999 2000
Regional Sectoral
Inequality Trends in Russia, 1990-2000
Source: Goskomstat and authors’ calculations.
As Figure 1 reveals, inequality increased across both dimensions, and especially
during the critical transition crisis of 1991-1992. Moreover, inequality across regions increased by considerably larger values than did inequality across sectors. This suggests a strong geographic element to rising stratification in Russia: choice of place mattered more than choice of occupation or industry. We shall, nevertheless, see shortly that economic fate of places in Russia had a great deal to do with the spatial distribution of economic sectors.
An implication of the finding that geography predominates in rising Russian inequality concerns the welfare implications of rising inequality itself. Because cost-of-living is a regional variable – housing, energy and food costs are place-specific – a changing pattern of relative incomes across Russia was also accompanied to a considerable extent by co-respective changes in the relative cost of living.2 For this reason, rising national measures of inequality should be treated with caution, as they will tend to overstate the rise in inequality of place-specific living standards.
2 Sheviakov and Kiruta (2001) provide a discussion.
EJCE, vol. 1, n. 1 (2004)
Available online at http://eaces.liuc.it
92
This point should not be interpreted as intended to dismiss the importance of rising inequality in the Russian Federation. It points rather to a need to analyze the political and social dimensions of the increase. As money incomes diverge across places, the worsening terms of trade of the lagging regions will induce migration to the more favored. And those who remain where money incomes are lower lose, to some extent, the economic capacity to interact with the rest of their own country. Thus regional disparities may tend to promote political regionalism, while violent conflict (as in the Caucasus) may be partly a product, and partly a cause of a declining relative economic position.
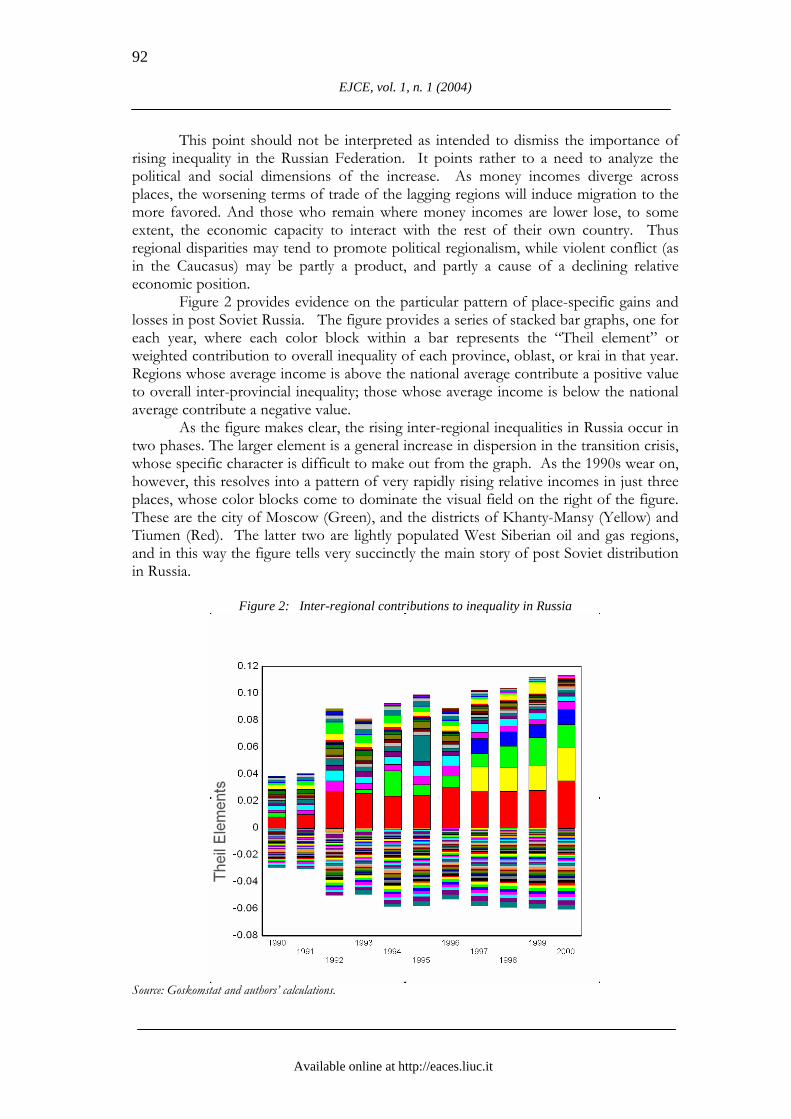
Figure 2 provides evidence on the particular pattern of place-specific gains and losses in post Soviet Russia. The figure provides a series of stacked bar graphs, one for each year, where each color block within a bar represents the “Theil element” or weighted contribution to overall inequality of each province, oblast, or krai in that year. Regions whose average income is above the national average contribute a positive value to overall inter-provincial inequality; those whose average income is below the national average contribute a negative value.
As the figure makes clear, the rising inter-regional inequalities in Russia occur in two phases. The larger element is a general increase in dispersion in the transition crisis, whose specific character is difficult to make out from the graph. As the 1990s wear on, however, this resolves into a pattern of very rapidly rising relative incomes in just three places, whose color blocks come to dominate the visual field on the right of the figure. These are the city of Moscow (Green), and the districts of Khanty-Mansy (Yellow) and Tiumen (Red). The latter two are lightly populated West Siberian oil and gas regions, and in this way the figure tells very succinctly the main story of post Soviet distribution in Russia.
Figure 2: Inter-regional contributions to inequality in Russia
Source: Goskomstat and authors’ calculations.
James K. Galbraith et al., The Experience of Rising Inequality in Russia and China
Available online at http://eaces.liuc.it
93
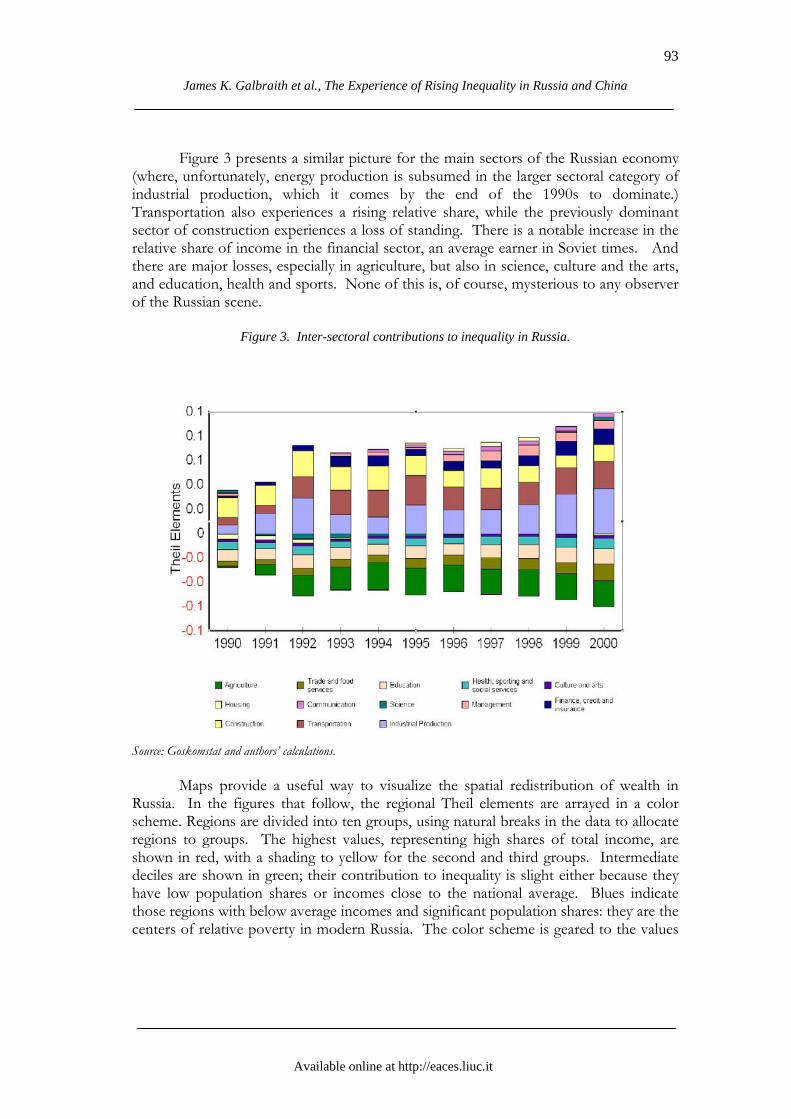
Figure 3 presents a similar picture for the main sectors of the Russian economy
(where, unfortunately, energy production is subsumed in the larger sectoral category of industrial production, which it comes by the end of the 1990s to dominate.) Transportation also experiences a rising relative share, while the previously dominant sector of construction experiences a loss of standing. There is a notable increase in the relative share of income in the financial sector, an average earner in Soviet times. And there are major losses, especially in agriculture, but also in science, culture and the arts, and education, health and sports. None of this is, of course, mysterious to any observer of the Russian scene.
Figure 3. Inter-sectoral contributions to inequality in Russia.
Source: Goskomstat and authors’ calculations.
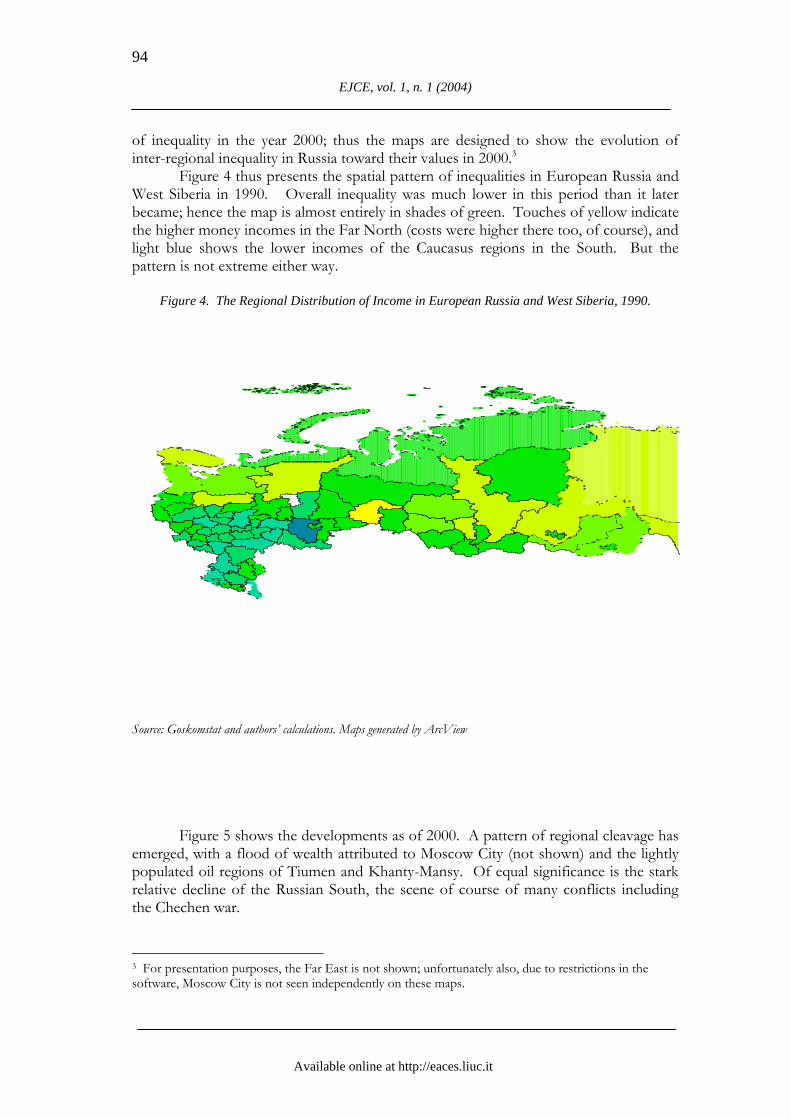
Maps provide a useful way to visualize the spatial redistribution of wealth in
Russia. In the figures that follow, the regional Theil elements are arrayed in a color scheme. Regions are divided into ten groups, using natural breaks in the data to allocate regions to groups. The highest values, representing high shares of total income, are shown in red, with a shading to yellow for the second and third groups. Intermediate deciles are shown in green; their contribution to inequality is slight either because they have low population shares or incomes close to the national average. Blues indicate those regions with below average incomes and significant population shares: they are the centers of relative poverty in modern Russia. The color scheme is geared to the values
EJCE, vol. 1, n. 1 (2004)
Available online at http://eaces.liuc.it
94
of inequality in the year 2000; thus the maps are designed to show the evolution of inter-regional inequality in Russia toward their values in 2000.3
Figure 4 thus presents the spatial pattern of inequalities in European Russia and West Siberia in 1990. Overall inequality was much lower in this period than it later became; hence the map is almost entirely in shades of green. Touches of yellow indicate the higher money incomes in the Far North (costs were higher there too, of course), and light blue shows the lower incomes of the Caucasus regions in the South. But the pattern is not extreme either way.
Figure 4. The Regional Distribution of Income in European Russia and West Siberia, 1990.
Source: Goskomstat and authors’ calculations. Maps generated by ArcView
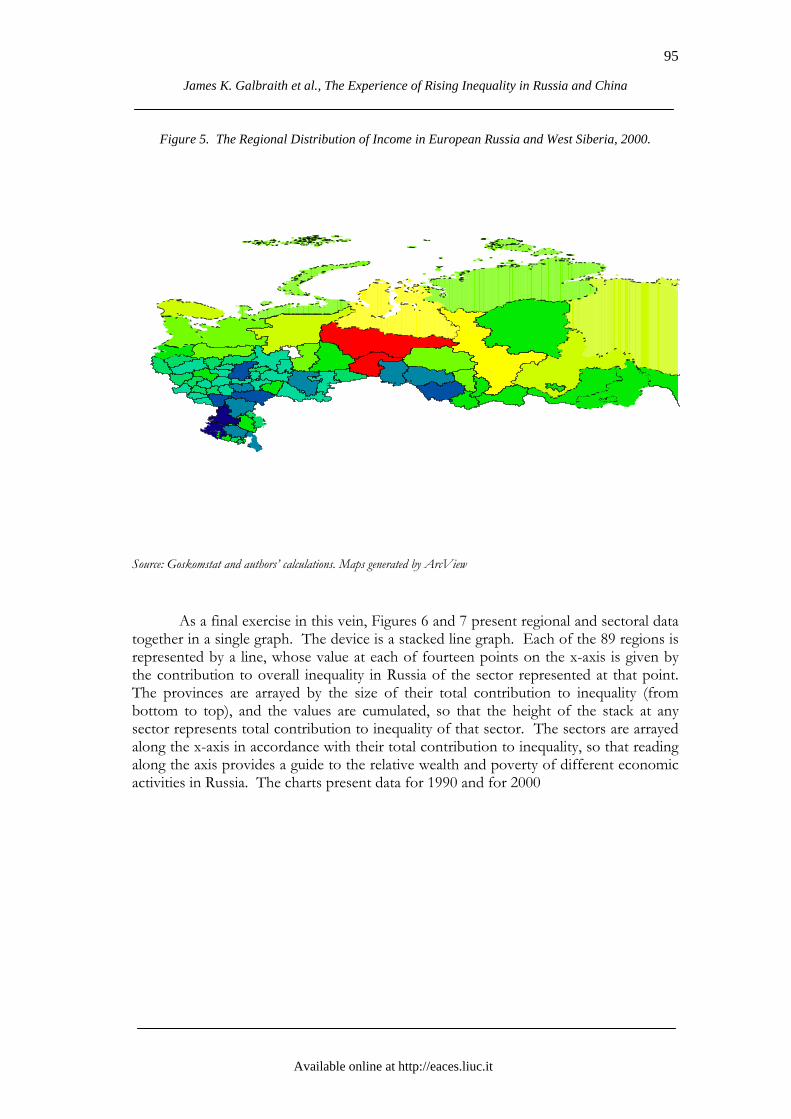
Figure 5 shows the developments as of 2000. A pattern of regional cleavage has
emerged, with a flood of wealth attributed to Moscow City (not shown) and the lightly populated oil regions of Tiumen and Khanty-Mansy. Of equal significance is the stark relative decline of the Russian South, the scene of course of many conflicts including the Chechen war.
3 For presentation purposes, the Far East is not shown; unfortunately also, due to restrictions in the software, Moscow City is not seen independently on these maps.
James K. Galbraith et al., The Experience of Rising Inequality in Russia and China
Available online at http://eaces.liuc.it
95
Figure 5. The Regional Distribution of Income in European Russia and West Siberia, 2000.
Source: Goskomstat and authors’ calculations. Maps generated by ArcView
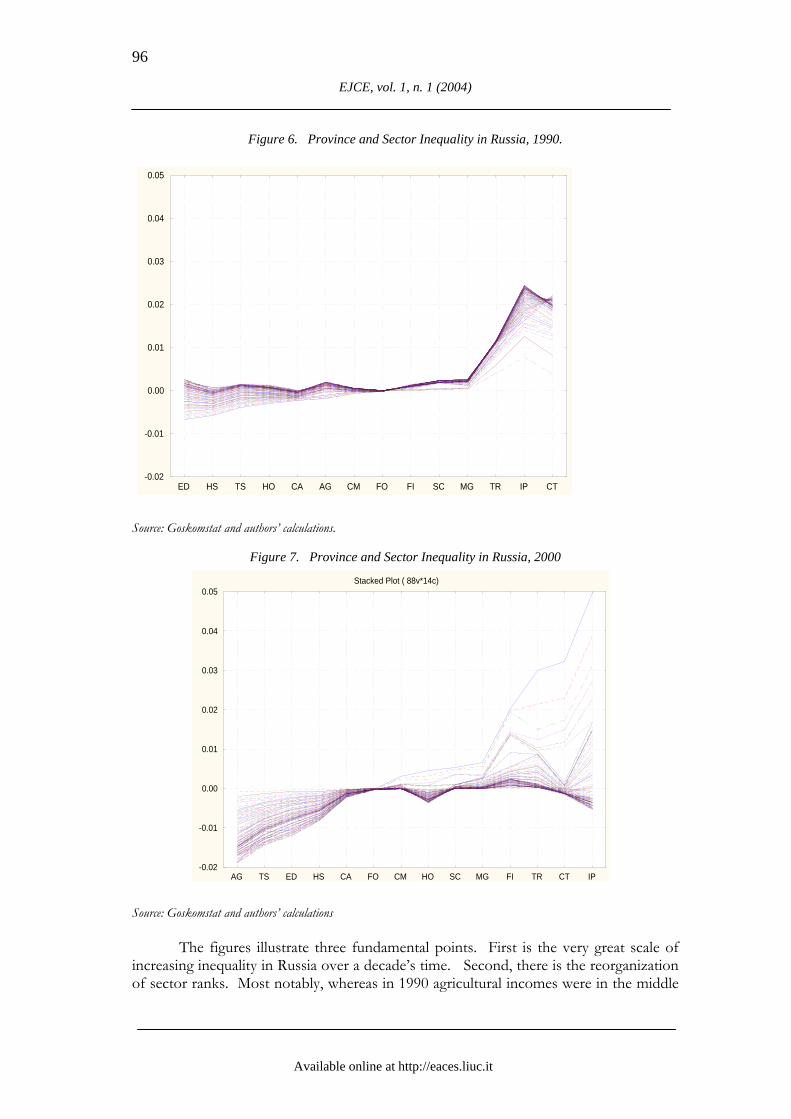
As a final exercise in this vein, Figures 6 and 7 present regional and sectoral data together in a single graph. The device is a stacked line graph. Each of the 89 regions is represented by a line, whose value at each of fourteen points on the x-axis is given by the contribution to overall inequality in Russia of the sector represented at that point. The provinces are arrayed by the size of their total contribution to inequality (from bottom to top), and the values are cumulated, so that the height of the stack at any sector represents total contribution to inequality of that sector. The sectors are arrayed along the x-axis in accordance with their total contribution to inequality, so that reading along the axis provides a guide to the relative wealth and poverty of different economic activities in Russia. The charts present data for 1990 and for 2000
EJCE, vol. 1, n. 1 (2004)
Available online at http://eaces.liuc.it
96
Figure 6. Province and Sector Inequality in Russia, 1990.
Source: Goskomstat and authors’ calculations.
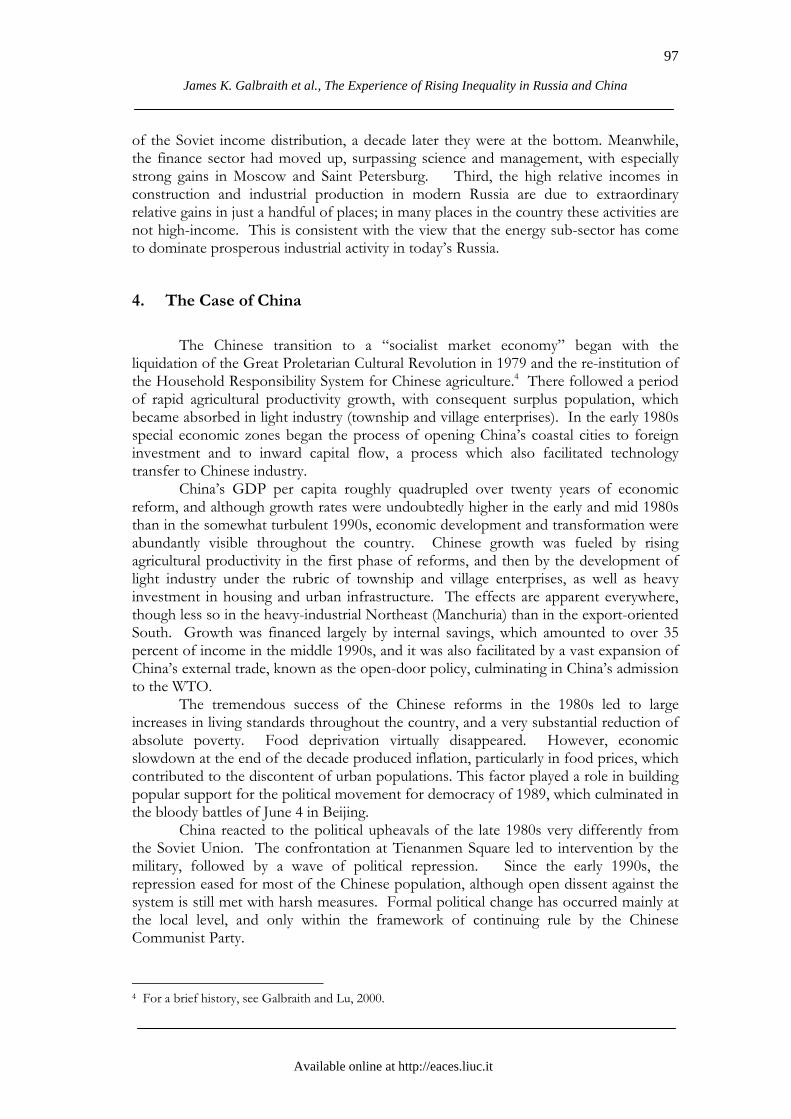
Figure 7. Province and Sector Inequality in Russia, 2000
Source: Goskomstat and authors’ calculations
The figures illustrate three fundamental points. First is the very great scale of
increasing inequality in Russia over a decade’s time. Second, there is the reorganization of sector ranks. Most notably, whereas in 1990 agricultural incomes were in the middle
Stacked Plot ( 88v*14c)
AG TS ED HS CA FO CM HO SC MG FI TR CT IP-0.02
-0.01
0.00
0.01
0.02
0.03
0.04
0.05
ED HS TS HO CA AG CM FO FI SC MG TR IP CT-0.02
-0.01
0.00
0.01
0.02
0.03
0.04
0.05
James K. Galbraith et al., The Experience of Rising Inequality in Russia and China
Available online at http://eaces.liuc.it
97
of the Soviet income distribution, a decade later they were at the bottom. Meanwhile, the finance sector had moved up, surpassing science and management, with especially strong gains in Moscow and Saint Petersburg. Third, the high relative incomes in construction and industrial production in modern Russia are due to extraordinary relative gains in just a handful of places; in many places in the country these activities are not high-income. This is consistent with the view that the energy sub-sector has come to dominate prosperous industrial activity in today’s Russia.
4. The Case of China
The Chinese transition to a “socialist market economy” began with the
liquidation of the Great Proletarian Cultural Revolution in 1979 and the re-institution of the Household Responsibility System for Chinese agriculture.4 There followed a period of rapid agricultural productivity growth, with consequent surplus population, which became absorbed in light industry (township and village enterprises). In the early 1980s special economic zones began the process of opening China’s coastal cities to foreign investment and to inward capital flow, a process which also facilitated technology transfer to Chinese industry.
China’s GDP per capita roughly quadrupled over twenty years of economic reform, and although growth rates were undoubtedly higher in the early and mid 1980s than in the somewhat turbulent 1990s, economic development and transformation were abundantly visible throughout the country. Chinese growth was fueled by rising agricultural productivity in the first phase of reforms, and then by the development of light industry under the rubric of township and village enterprises, as well as heavy investment in housing and urban infrastructure. The effects are apparent everywhere, though less so in the heavy-industrial Northeast (Manchuria) than in the export-oriented South. Growth was financed largely by internal savings, which amounted to over 35 percent of income in the middle 1990s, and it was also facilitated by a vast expansion of China’s external trade, known as the open-door policy, culminating in China’s admission to the WTO.
The tremendous success of the Chinese reforms in the 1980s led to large increases in living standards throughout the country, and a very substantial reduction of absolute poverty. Food deprivation virtually disappeared. However, economic slowdown at the end of the decade produced inflation, particularly in food prices, which contributed to the discontent of urban populations. This factor played a role in building popular support for the political movement for democracy of 1989, which culminated in the bloody battles of June 4 in Beijing.
China reacted to the political upheavals of the late 1980s very differently from the Soviet Union. The confrontation at Tienanmen Square led to intervention by the military, followed by a wave of political repression. Since the early 1990s, the repression eased for most of the Chinese population, although open dissent against the system is still met with harsh measures. Formal political change has occurred mainly at the local level, and only within the framework of continuing rule by the Chinese Communist Party.
4 For a brief history, see Galbraith and Lu, 2000.
EJCE, vol. 1, n. 1 (2004)
Available online at http://eaces.liuc.it
98
Following that profound political shock, Chinese economic reform continued but along revised lines. Continuing decentralization devolved power from the center to the provinces; sectoral liberalization devolved power toward industries whose strategic position involved elements of monopoly power. Meanwhile, the post-Tienanmen government particularly encouraged the municipal authorities of Shanghai (whence the top officials came) to pursue grand plans to restore that city to its position of financial preeminence in Asia, while the government also embarked on an extraordinary redevelopment of the capital city.
All of the above developments have visible effects on the pattern of income distribution in the People’s Republic of China over the 1990s.
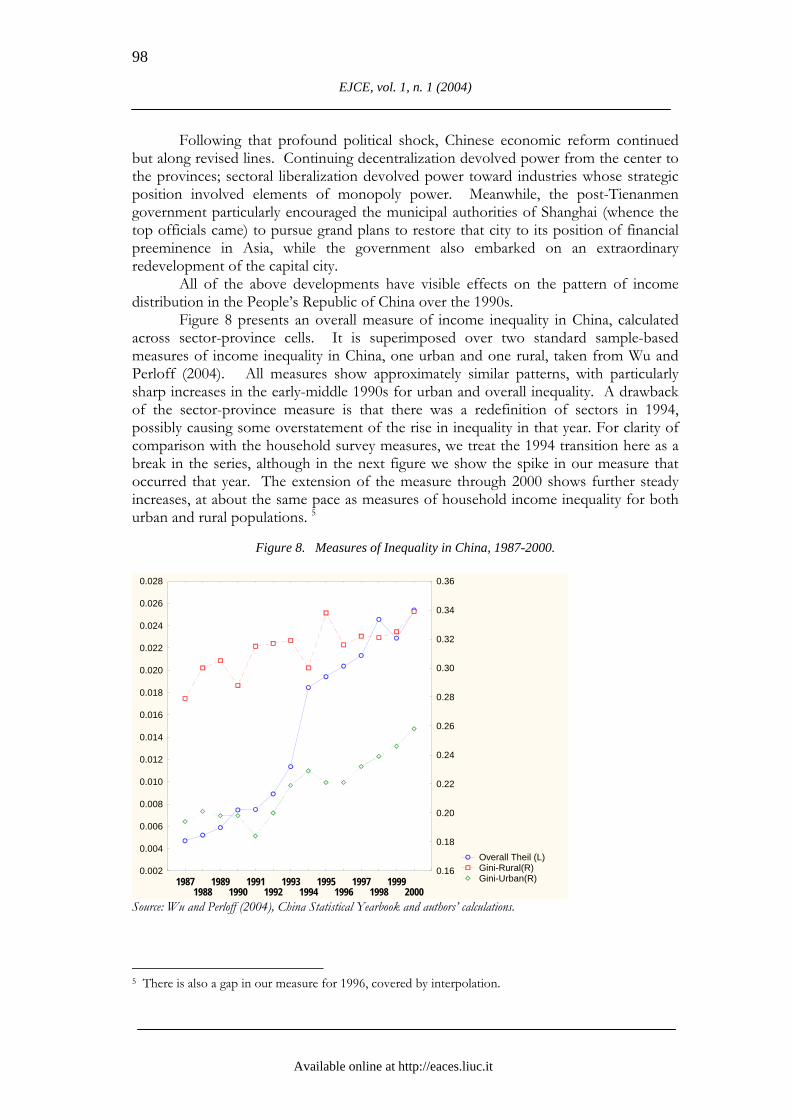
Figure 8 presents an overall measure of income inequality in China, calculated across sector-province cells. It is superimposed over two standard sample-based measures of income inequality in China, one urban and one rural, taken from Wu and Perloff (2004). All measures show approximately similar patterns, with particularly sharp increases in the early-middle 1990s for urban and overall inequality. A drawback of the sector-province measure is that there was a redefinition of sectors in 1994, possibly causing some overstatement of the rise in inequality in that year. For clarity of comparison with the household survey measures, we treat the 1994 transition here as a break in the series, although in the next figure we show the spike in our measure that occurred that year. The extension of the measure through 2000 shows further steady increases, at about the same pace as measures of household income inequality for both urban and rural populations. 5
Figure 8. Measures of Inequality in China, 1987-2000.
Overall Theil (L) Gini-Rural(R)Gini-Urban(R)1987
19881989
19901991
19921993
19941995
19961997
19981999
2000
0.002
0.004
0.006
0.008
0.010
0.012
0.014
0.016
0.018
0.020
0.022
0.024
0.026
0.028
0.16
0.18
0.20
0.22
0.24
0.26
0.28
0.30
0.32
0.34
0.36
Source: Wu and Perloff (2004), China Statistical Yearbook and authors’ calculations.
5 There is also a gap in our measure for 1996, covered by interpolation.
James K. Galbraith et al., The Experience of Rising Inequality in Russia and China
Available online at http://eaces.liuc.it
99
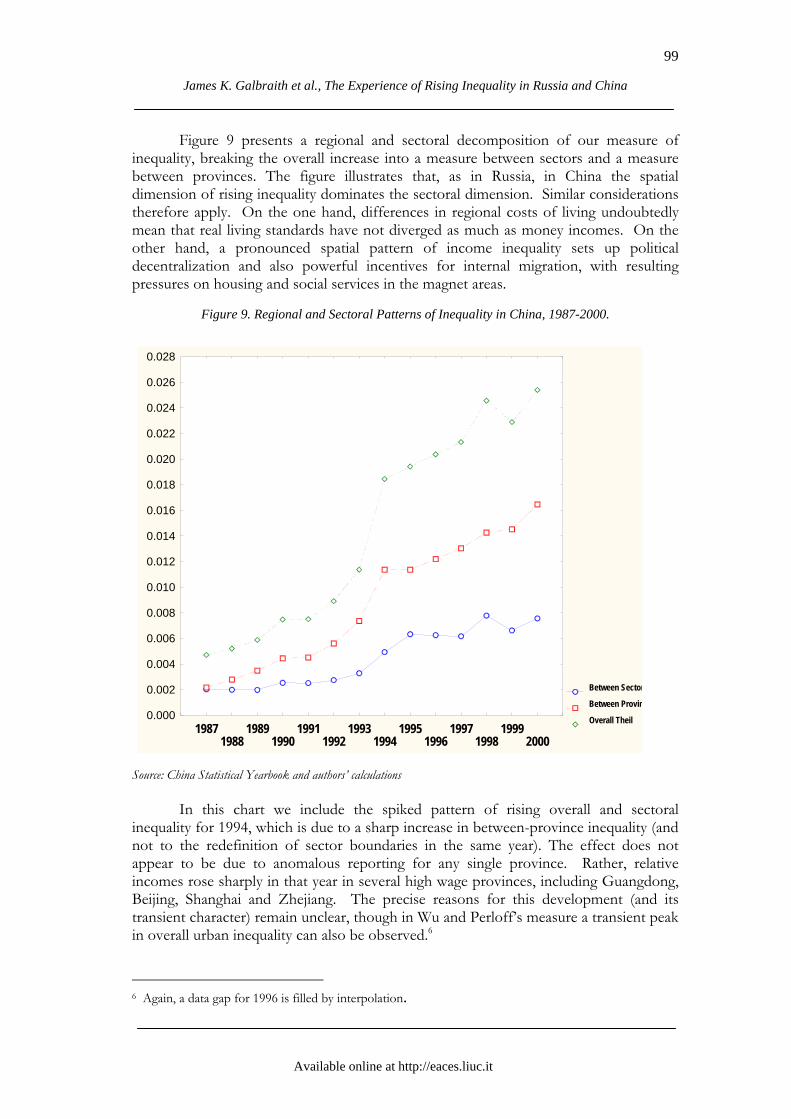
Figure 9 presents a regional and sectoral decomposition of our measure of inequality, breaking the overall increase into a measure between sectors and a measure between provinces. The figure illustrates that, as in Russia, in China the spatial dimension of rising inequality dominates the sectoral dimension. Similar considerations therefore apply. On the one hand, differences in regional costs of living undoubtedly mean that real living standards have not diverged as much as money incomes. On the other hand, a pronounced spatial pattern of income inequality sets up political decentralization and also powerful incentives for internal migration, with resulting pressures on housing and social services in the magnet areas.
Figure 9. Regional and Sectoral Patterns of Inequality in China, 1987-2000.
Source: China Statistical Yearbook and authors’ calculations In this chart we include the spiked pattern of rising overall and sectoral
inequality for 1994, which is due to a sharp increase in between-province inequality (and not to the redefinition of sector boundaries in the same year). The effect does not appear to be due to anomalous reporting for any single province. Rather, relative incomes rose sharply in that year in several high wage provinces, including Guangdong, Beijing, Shanghai and Zhejiang. The precise reasons for this development (and its transient character) remain unclear, though in Wu and Perloff’s measure a transient peak in overall urban inequality can also be observed.6
6 Again, a data gap for 1996 is filled by interpolation.
Between Sector
Between Provin
Overall Theil1987
19881989
19901991
19921993
19941995
19961997
19981999
2000
0.000
0.002
0.004
0.006
0.008
0.010
0.012
0.014
0.016
0.018
0.020
0.022
0.024
0.026
0.028
EJCE, vol. 1, n. 1 (2004)
Available online at http://eaces.liuc.it
100
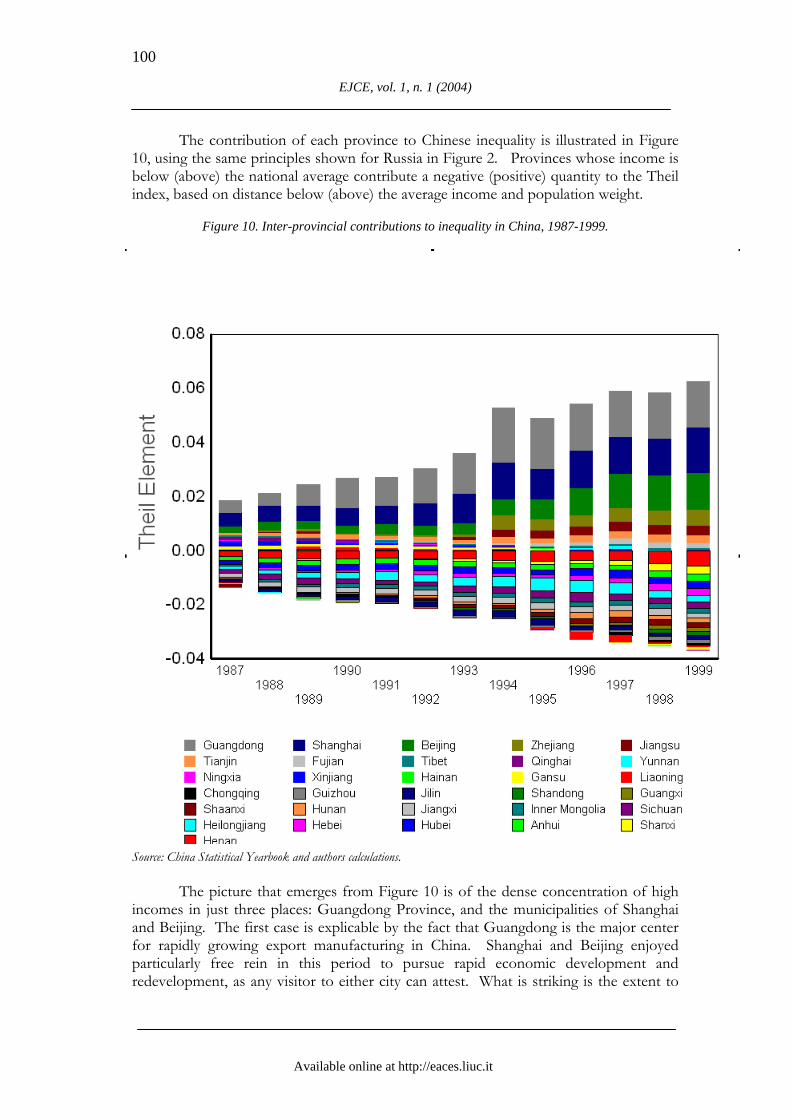
The contribution of each province to Chinese inequality is illustrated in Figure 10, using the same principles shown for Russia in Figure 2. Provinces whose income is below (above) the national average contribute a negative (positive) quantity to the Theil index, based on distance below (above) the average income and population weight.
Figure 10. Inter-provincial contributions to inequality in China, 1987-1999.
Source: China Statistical Yearbook and authors calculations.
The picture that emerges from Figure 10 is of the dense concentration of high incomes in just three places: Guangdong Province, and the municipalities of Shanghai and Beijing. The first case is explicable by the fact that Guangdong is the major center for rapidly growing export manufacturing in China. Shanghai and Beijing enjoyed particularly free rein in this period to pursue rapid economic development and redevelopment, as any visitor to either city can attest. What is striking is the extent to
James K. Galbraith et al., The Experience of Rising Inequality in Russia and China
Available online at http://eaces.liuc.it
101
which these cases appear to dominate the rise in inter-regional inequality, which is the dominant pattern in the rise of inequality in China generally speaking.
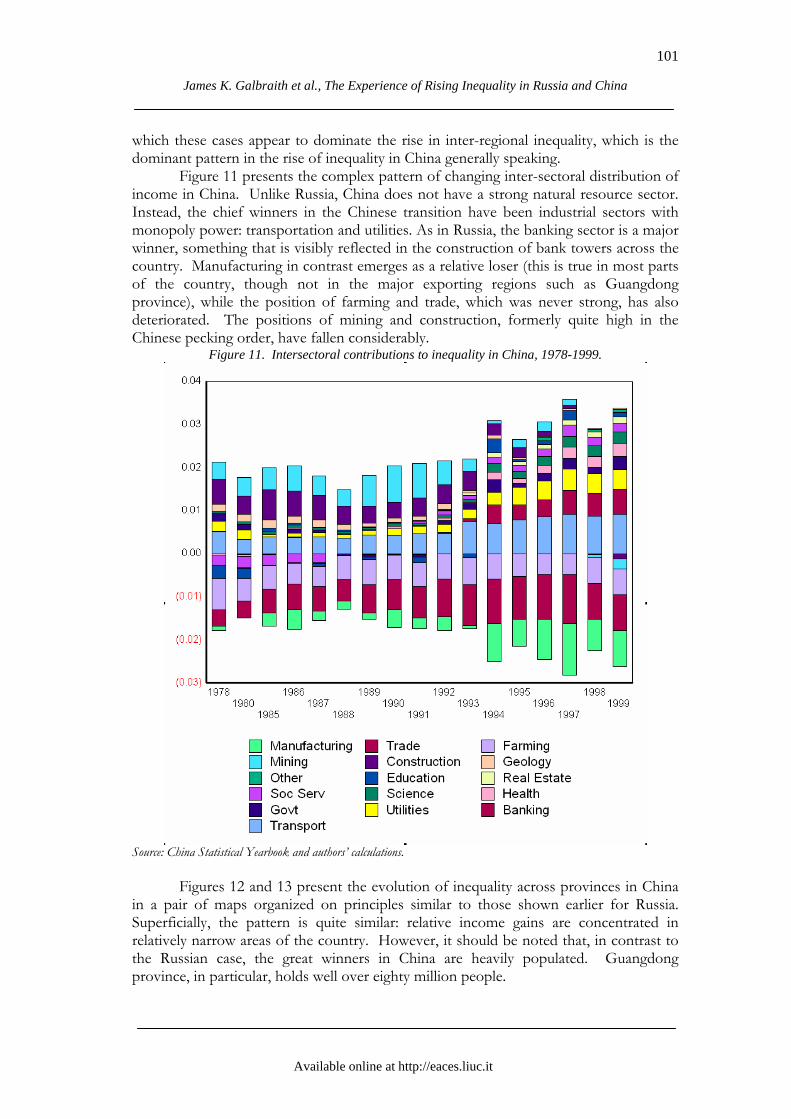
Figure 11 presents the complex pattern of changing inter-sectoral distribution of income in China. Unlike Russia, China does not have a strong natural resource sector. Instead, the chief winners in the Chinese transition have been industrial sectors with monopoly power: transportation and utilities. As in Russia, the banking sector is a major winner, something that is visibly reflected in the construction of bank towers across the country. Manufacturing in contrast emerges as a relative loser (this is true in most parts of the country, though not in the major exporting regions such as Guangdong province), while the position of farming and trade, which was never strong, has also deteriorated. The positions of mining and construction, formerly quite high in the Chinese pecking order, have fallen considerably.
Figure 11. Intersectoral contributions to inequality in China, 1978-1999.
Source: China Statistical Yearbook and authors’ calculations.
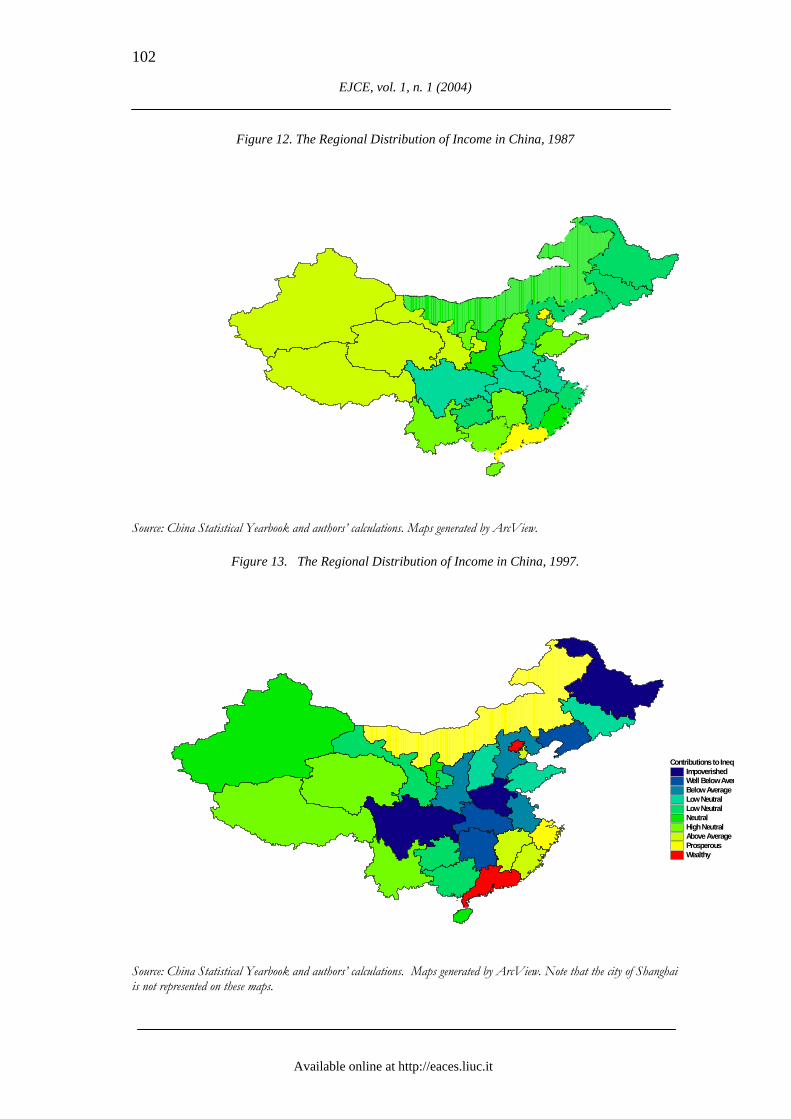
Figures 12 and 13 present the evolution of inequality across provinces in China
in a pair of maps organized on principles similar to those shown earlier for Russia. Superficially, the pattern is quite similar: relative income gains are concentrated in relatively narrow areas of the country. However, it should be noted that, in contrast to the Russian case, the great winners in China are heavily populated. Guangdong province, in particular, holds well over eighty million people.
EJCE, vol. 1, n. 1 (2004)
Available online at http://eaces.liuc.it
102
Figure 12. The Regional Distribution of Income in China, 1987 Source: China Statistical Yearbook and authors’ calculations. Maps generated by ArcView.
Figure 13. The Regional Distribution of Income in China, 1997.
Source: China Statistical Yearbook and authors’ calculations. Maps generated by ArcView. Note that the city of Shanghai is not represented on these maps.
Contributions to InequImpoverishedWell Below AverBelow AverageLow NeutralLow NeutralNeutralHigh NeutralAbove AverageProsperousWealthy
James K. Galbraith et al., The Experience of Rising Inequality in Russia and China
Available online at http://eaces.liuc.it
103
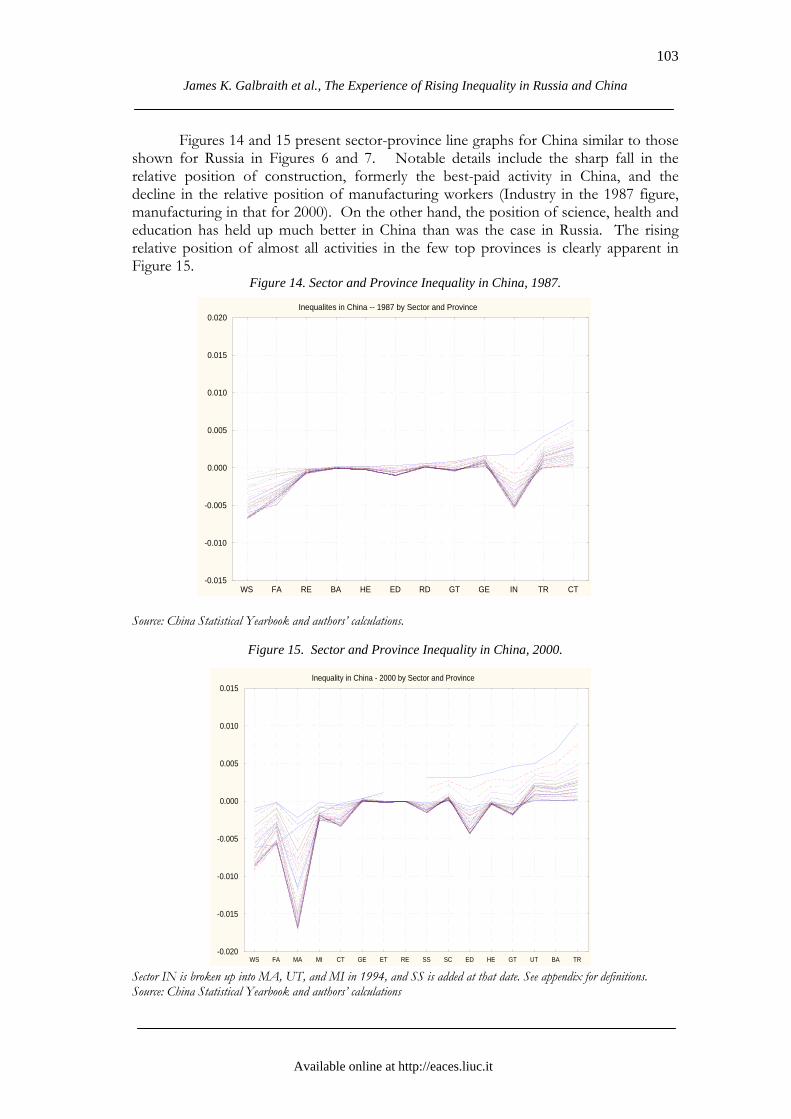
Figures 14 and 15 present sector-province line graphs for China similar to those shown for Russia in Figures 6 and 7. Notable details include the sharp fall in the relative position of construction, formerly the best-paid activity in China, and the decline in the relative position of manufacturing workers (Industry in the 1987 figure, manufacturing in that for 2000). On the other hand, the position of science, health and education has held up much better in China than was the case in Russia. The rising relative position of almost all activities in the few top provinces is clearly apparent in Figure 15.
Figure 14. Sector and Province Inequality in China, 1987. Source: China Statistical Yearbook and authors’ calculations.
Figure 15. Sector and Province Inequality in China, 2000.
Sector IN is broken up into MA, UT, and MI in 1994, and SS is added at that date. See appendix for definitions. Source: China Statistical Yearbook and authors’ calculations
Inequality in China - 2000 by Sector and Province
WS FA MA MI CT GE ET RE SS SC ED HE GT UT BA TR-0.020
-0.015
-0.010
-0.005
0.000
0.005
0.010
0.015
Inequalites in China -- 1987 by Sector and Province
WS FA RE BA HE ED RD GT GE IN TR CT-0.015
-0.010
-0.005
0.000
0.005
0.010
0.015
0.020
EJCE, vol. 1, n. 1 (2004)
Available online at http://eaces.liuc.it
104
5. Conclusions
Despite the radical differences between the macroeconomic experiences of
Russia and China in the transition, disconcerting similarities can be found. In both countries sharp rises in inequality coincided with macroeconomic crises. This was true of the industrial collapse of 1991 and the financial implosion of 1998 in Russia, and of the growth slowdown of 1993-1994 in China, known euphemistically in China as the period of “soft landing.” In both countries, incomes diverged more sharply on a regional than on a sectoral basis. In both, relative income rose most sharply in the financial and political centers (Moscow, Beijing, and Shanghai) and in the regions providing hard currency export earnings (West Siberia, Guangdong). In both, it seems likely that economic liberalization produced economic rents for those sectors enjoying monopoly power in the domestic market (transportation, energy, electricity and other utilities). And in both countries, the rise of finance capitalism produced large relative and no doubt also absolute gains for those employed in the financial sectors.
It is no surprise that rising inequality should be a characteristic feature of transition from a socialist to a capitalist system. This is true whether the transition is or is not an economic success. In the absence of strong agricultural support programs and social security systems -- such as exist in the United States and Europe -- a particular feature of redistribution is a sharp decline in the relative income of the countryside. It seems that there is no mechanism that works effectively to offset this tendency in the transition to the market economy.
Whether education, health care, and science suffer major losses of position under economic transition depends, on the other hand, on the tax system and public priorities of the government. China has protected these sectors and has expanded them in line with the growth of the Chinese economy overall. Indeed, a close analysis of changes in province-sector cells reveals that the education sectors in Shanghai and Beijing are among the most rapidly gainers of relative size and income in all of China during the late 1990s. In Russia these sectors have suffered absolute and relative losses, with serious consequences for the health, education and culture of the population.
It seems likely that the continuing presence of control over the capital account, and the corresponding suppression of capital flight from China, is a major factor in preserving the Chinese capacity to act in the social sectors.
References Benjamin, D., Brandt L., Giles J. (2004), “The Evolution of Income Inequality in Rural China.,”
William Davidson Institute Working Paper 654. Bradshaw M., Vartapetov K. (2003), “A New Perspective on Regional Inequalities in Russia,”
Eurasian Geography and Economics, 44, 403-429. Conceição P., Galbraith J. (2000), “Constructing Long and Dense Time Series of Inequality
Using the Theil Statistic,” Eastern Economic Journal, 26(1), 61-74. Conceição P., Galbraith J., Bradford P. (2001) “The Theil Index in Sequences of Nested and
Hierarchical Grouping Structures: Implications for the Measurement of Inequality Through Time, With Data Aggregated at Different Levels of Industrial Classification,” Eastern Economic Journal, 27, 491-514.
Federov L. (2002), Regional Inequality and Regional Polarization in Russia, 1990-99,” World Development, 30, 443-456.
James K. Galbraith et al., The Experience of Rising Inequality in Russia and China
Available online at http://eaces.liuc.it
105
Galbraith J., Lu J. (2000), Sustainable Development and the Open-Door Policy in China, A Paper from the Project on Development, Trade and International Finance. New York, Council on Foreign Relations.
Goskomstat (2001a). Regiony Rossii (Regions of Russia). Moscow. Goskomstat (2001b). Trud i zaniatost v Rossii (Labour and employment in Russia). Moscow.
Similar issues from earlier years. Gustaffson B., Li S. (2001), “The effects of transition on the distribution of income in China: A
study decomposing the GINI coefficient for 1988 and 1995,” Economics of Transition 9, 593-617. Khan A.R., Griffin K., Riskin R. (1999) “Income Distribution in Urban China during the Period
of Economic Reform and Globalization,” American Economic Review, 89, 296-300. Kislitsyna, O. (2003), “Income Inequality in Russia during Transition: How can it be explained?,
Economics Education and Research Consortium Working Paper Series 03/08, ISSN 1561-2422.
Mikheeva N. (1999), “Differentiation of Social and Economic Situation in the Russian Regions and Problems of Regional Policy,” Economic Education and Research Consortium, Russian Economic Research Program, Working Paper 99/09.
Riskin C., Zhao R., Li S., editors. (2001). China's retreat from equality : income distribution and economic transition, Armonk, N.Y. , M.E. Sharpe.
Sheviakov A., Kiruta A. (2001), Economic Inequality, standards of living, and poverty of population in Russia, Center for Socioeconomic Measurement, Russian Academy of Sciences and State Committee of the Russian Federation on Statistics.
State Statistical Bureau, China Statistical Yearbook, Beijing: China Statistical Publishing House, various issues.
Wei, S-J., Wu Y. (2001), “Globalization and Inequality: Evidence from within China,” National Bureau of Economic Research Working Paper 8611. Cambridge, MA.
Wu X., Perloff J.M., (2004), “China’s Income Distribution over Time: Reasons for Rising Inequality,” mimeo.
Yang, D.T. (1999) “Urban-Biased Policies and Rising Income Inequality in China,” American Economic Review, 89, 306-310.
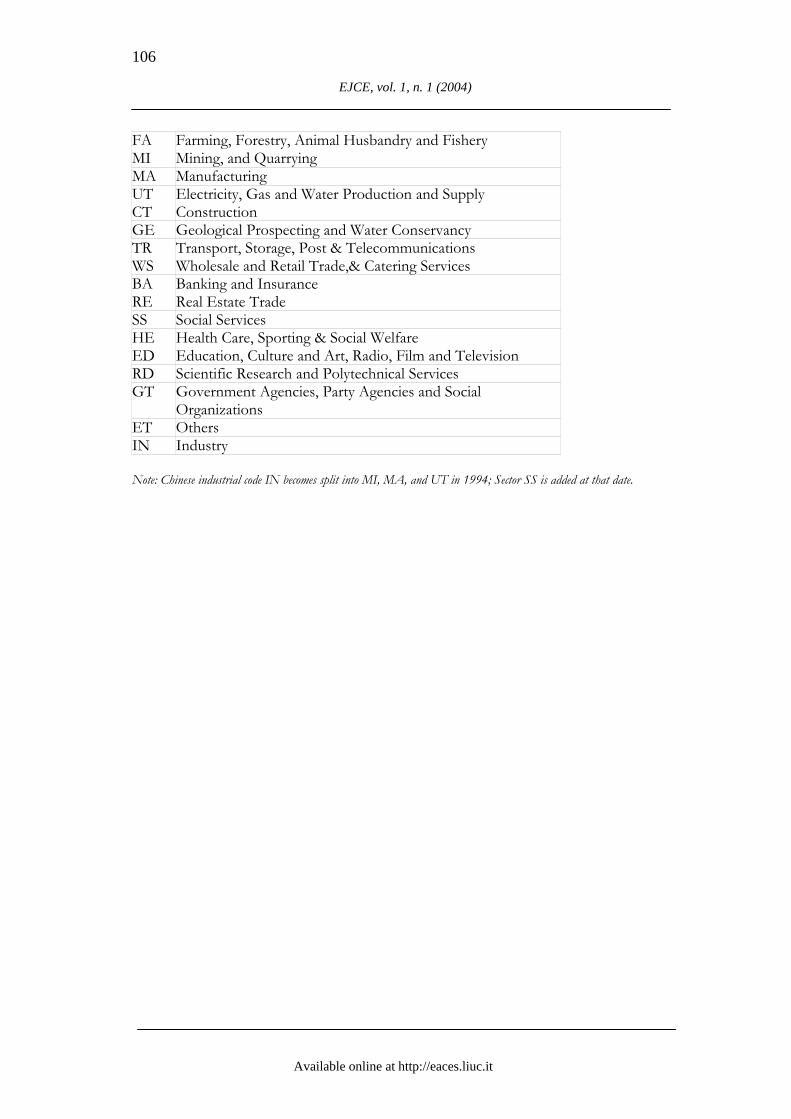
Appendix Sector Codes in Russia and China Russia
IP Industrial Production AG Agriculture FO Forestry CT Construction TR Transportation CM Communication TS Trade and food services HO Housing HS Health, sporting and social services ED Education CA Culture and arts SC Science FI Finance, credit and insurance MG Management China
EJCE, vol. 1, n. 1 (2004)
Available online at http://eaces.liuc.it
106
FA Farming, Forestry, Animal Husbandry and Fishery MI Mining, and Quarrying MA Manufacturing UT Electricity, Gas and Water Production and Supply CT Construction GE Geological Prospecting and Water Conservancy TR Transport, Storage, Post & Telecommunications WS Wholesale and Retail Trade,& Catering Services BA Banking and Insurance RE Real Estate Trade SS Social Services HE Health Care, Sporting & Social Welfare ED Education, Culture and Art, Radio, Film and Television RD Scientific Research and Polytechnical Services GT Government Agencies, Party Agencies and Social
Organizations ET Others IN Industry Note: Chinese industrial code IN becomes split into MI, MA, and UT in 1994; Sector SS is added at that date.