Embed Size (px)
Citation preview

© Crown copyright 2006 Page 1
The Exploitation of Satellite Data
at the U.K. Met Office
Roger Saunderswith the help of Steve English
Bill Bell, Mary Forsythe,
Brett Candy, James Cameron
and many others
© Crown copyright 2006 Page 2
Talk topics
The Met Office satellite group and NWP SAFCurrent status of models and observation useRecent upgrades to use of satellite dataSatellite data impactsResearch into use of new data types Meteosat Second GenerationMETOP

© Crown copyright 2006 Page 3
Satellite Group
HeadJohn Eyre
Radiance assimilation
Steve English
Imagery for NWPand forecastersRoger Saunders
Active sensorsDave Offiler
Data ProcessingDick Francis
Hi res modelsBryan Conway
Reading
Satellite Radiance Assimilation GroupSatellite Imagery Application GroupSatellite Active Sensing GroupSatellite Applications ReadingNWP/nowcasting/imagery
© Crown copyright 2006 Page 4
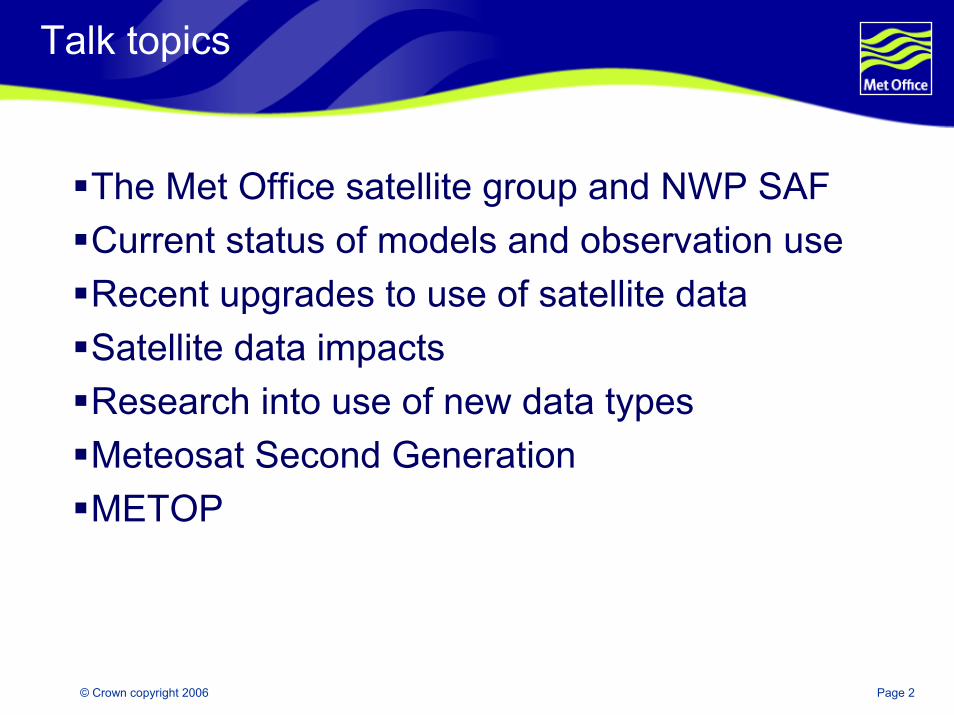
Satellite Group Funding
SA Funding 2006/07 31 Staff in total
Core GovtEUMETSATDefenceAviationESAClimate
© Crown copyright 2006 Page 5
NWP Satellite Application Facility
The Met Office leads the NWP SAFIn final year of initial operational phasePreparing proposal for follow-on operational phase (5 years) to start in March 2007.Major deliverables are:
AAPP (ATOVS/AVHRR direct readout software)RTTOV (Fast radiative transfer model)1DVAR (Met Office and ECMWF versions)Satellite data monitoring (Radiance, AMVs, O3)Scatterometer processor Reports on many aspects of satellite data
Also involved in GRAS (GPS RO) SAF

© Crown copyright 2006 Page 6
Summary of model –AIRS observations
© Crown copyright 2006 Page 7
Talk topics
The Met Office satellite groupCurrent status of models and observation useRecent upgrades to use of satellite dataSatellite data impactsResearch into use of new data types Meteosat Second GenerationMETOP
© Crown copyright 2006 Page 8
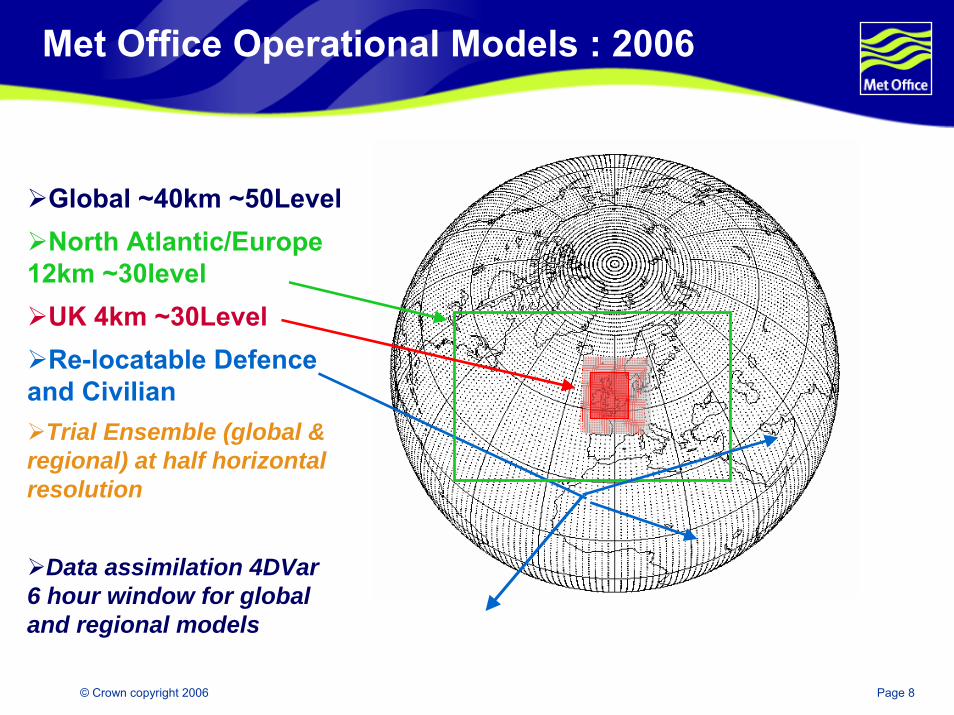
Met Office Operational Models : 2006
Global ~40km ~50LevelNorth Atlantic/Europe
12km ~30levelUK 4km ~30LevelRe-locatable Defence
and CivilianTrial Ensemble (global &
regional) at half horizontal resolution
Data assimilation 4DVar 6 hour window for global and regional models

© Crown copyright 2006 Page 9
Operational data usage (Apr 2006)
Observation group ObservationSub-group
Items used Daily extracted % used inassimilation
Ground-based vertical profiles
TEMPPILOTPROFILER
T, V, RH processed to model layer average
As TEMP, but V onlyAs TEMP, but V only
12508506500
87,92,509240
Satellite-based vertical profiles
AMSU-A/BNOAA-15/16/18Aqua AIRS
Radiances directlyassimilated with channel
selection dependent onsurface instrument and
cloudiness
430000 3
Aircraft Manual AIREPSAutomatedAMDARS
T, V as reported with duplicate checking and blacklist
24000185000
1428
Satellite atmospheric motion vectors
GOES 10,12 BUFRMeteosat 5, 8 BUFRMTSAT SATOBAqua/Terra MODIS
High resolution IR windsIR, VIS and WV windsIR and VIS windsIR and WV
1100001900004000
10555
Satellite-basedsurface winds
SSMI-13,15Seawinds, ERS-2
In-house 1DVAR wind-speed retrieval
NESDIS retrieval of ambiguous winds. Ambiguity removal in 4DVAR.
30000001800000
11.5
Ground-basedsurface
Land SYNOPSHIP, Fixed BuoyDrifting BUOY
Pressure only (processed to model surface)
Pressure and windPressure
28000670010000
7594, 9276

© Crown copyright 2006 Page 10
Talk topics
The Met Office satellite groupCurrent status of models and observation useRecent upgrades to use of satellite dataSatellite data impactsResearch into use of new data types Meteosat Second GenerationMETOP
© Crown copyright 2006 Page 11
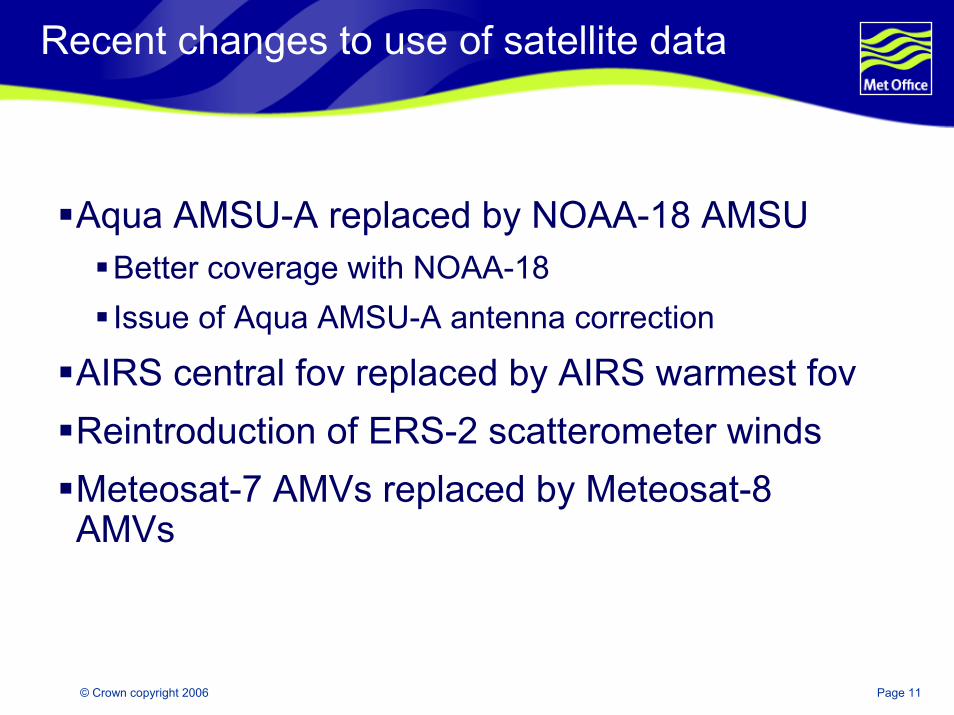
Recent changes to use of satellite data
Aqua AMSU-A replaced by NOAA-18 AMSUBetter coverage with NOAA-18Issue of Aqua AMSU-A antenna correction
AIRS central fov replaced by AIRS warmest fovReintroduction of ERS-2 scatterometer windsMeteosat-7 AMVs replaced by Meteosat-8 AMVs

© Crown copyright 2006 Page 12
Satellite data delays
0 60 120 180 240 300 360 420 480 540
ATOVS Aqua
ATOVS N15
ATOVS N16
ATOVS N18
AIRS
QuikScat
SSMIS
MODIS Aqua
MODIS Terra
SSMI F13
SSMI F14
SSMI F15
Delay (minutes)
Max DelayAverage Delay
Main run data cutoff

© Crown copyright 2006 Page 13
Average AMSU Data Assimilated for a Main forecast Run
02000400060008000
100001200014000
N15 N16 N18 Aqua Total
02000400060008000
100001200014000
N15 N16 N18 Aqua Total
Control Experiment

© Crown copyright 2006 Page 14
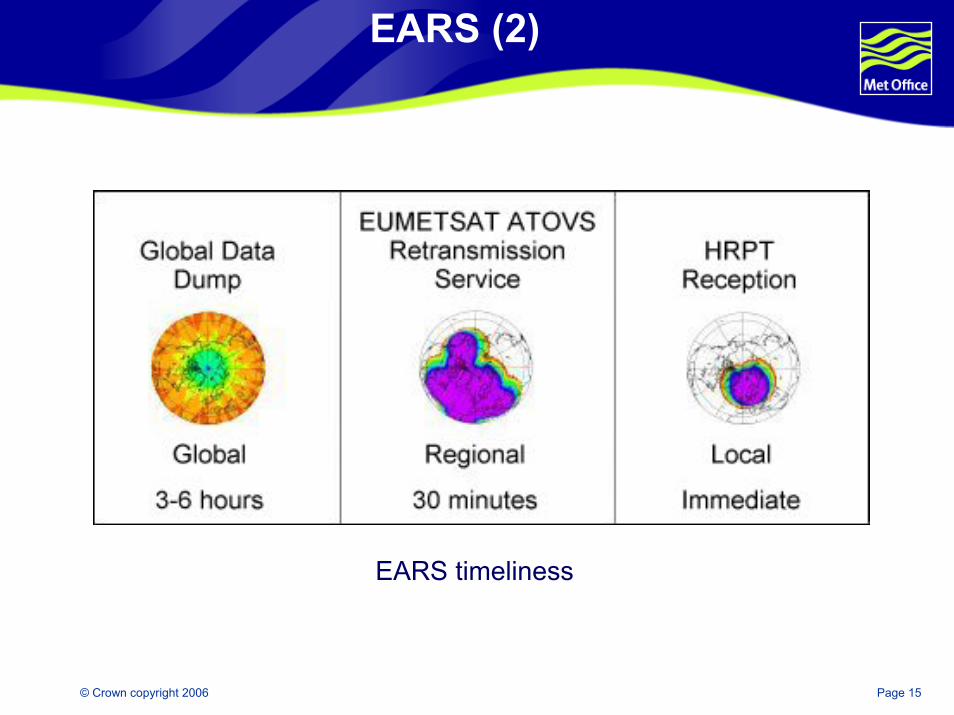
EARS System Overview
EARS-Mitigating Data Delay
© Crown copyright 2006 Page 15
EARS timeliness
EARS (2)

© Crown copyright 2006 Page 16
EARS coverage There are plans to:• extend coverage of EARS to the
whole extra-tropical NH • develop other regional systems (e.g. S. America, Australia / NZ)
EARS (3)

© Crown copyright 2006 Page 17
Arrival Times of Data
• North Atlantic Region
• six-hour window
09/09/2003 09:00-15:00
window
0
10
20
30
40
50
60
70
80
90
100
09 00 10 00 11 00 12 00 13 00 14 00 15 00 16 00 17 00 18 00
Perc
enta
ge o
f Obs
erva
tions
Global 109229 obs EARS 93979 Obs
Main RunNESDIS 25%EARS 75%
Update Run both 100%
First Overpass

© Crown copyright 2006 Page 18
Moved to use AIRS warmest FOV
Centre FOV Warmest FOVany of 9
This results in an increased coverage of AIRS clear sky radiances

© Crown copyright 2006 Page 19
Removed Double Peaked AIRS Channels
Channel 2107 at 2386cm-1 (4.19 microns), FWHM 1.880cm-1
The sharp, strong absorption CO2 lines cause a double peak in the Jacobian.

© Crown copyright 2006 Page 20
AIRS q increments
No AIRSAIRSWF
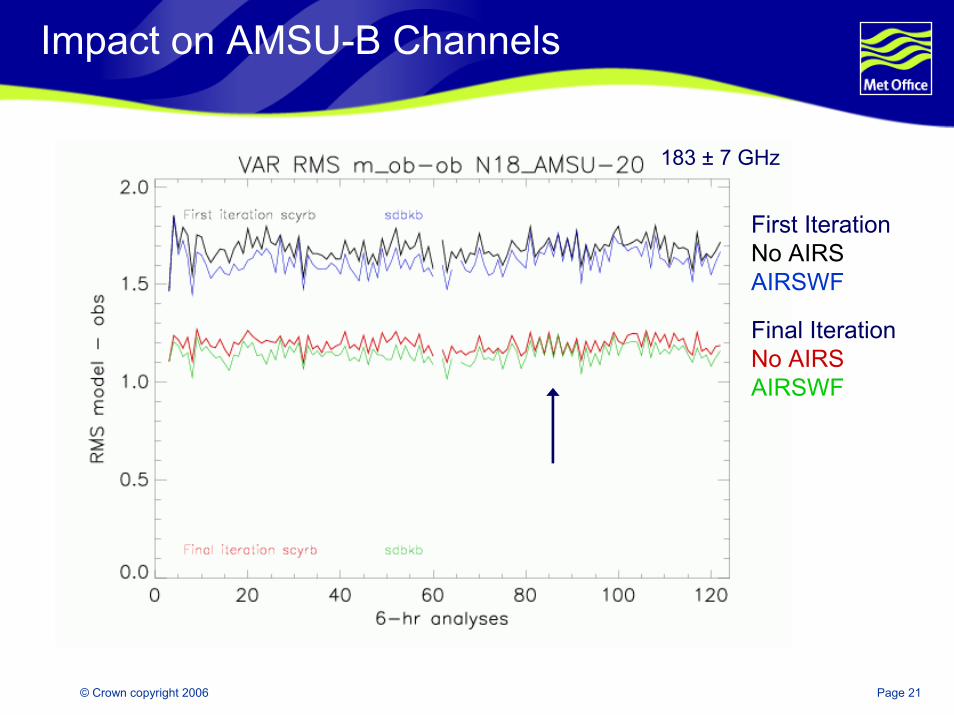
© Crown copyright 2006 Page 21
Impact on AMSU-B Channels
183 ± 7 GHz
First IterationNo AIRSAIRSWF
Final IterationNo AIRSAIRSWF

© Crown copyright 2006 Page 22
Summary
Assimilating AIRS leads to significant humidity changes.All AIRS trials show improved fits to SSMI TCWV (not assimilated) and all AMSU-B channels.An improvement to RH is not confirmed by sondes, where no particular effect is apparent. We have not seen a big improvement in forecasts going from AIRS to AIRSWF.

© Crown copyright 2006 Page 23
What is the NWP SAF AMV monitoring?
NWP SAF – Numerical Weather Prediction Satellite Application FacilityA EUMETSAT-funded initiative, led by the Met Office, with partners ECMWF, KNMI
and Météo-FranceAim to improve the benefits derived by European National Met. Services from NWP
by developing techniques for more effective use of satellite data and to prepare for effective exploitation of new data/products.
AMV MonitoringDisplays comparable AMV monitoring output from different NWP centres in order to help identify and partition error contributions from AMVs and NWP models.
Analysis reports produced periodically (planned every 2 years to coincide with winds workshops).
Intended to stimulate discussion and to lead to improvements in AMV derivation and AMV use in NWP.
http://www.metoffice.gov.uk/research/interproj/nwpsaf/satwind_report

© Crown copyright 2006 Page 24
GOES-10 GOES-12 Meteosat-8 Meteosat-5 MTSAT-1R
Data used - Mar 2006
SATOB
BUFR
equator
60N
60S
MODIS polar winds (TERRA and AQUA)
1. 8th Feb 05 - Introduce NESDIS MODIS polar winds2. 14th Jun 05 – GOES SATOB IR -> GOES BUFR IR
and cloudy WV3. 1st Sep 05 – start using MTSAT-1R SATOB4. 14th Mar 06 – Meteosat-7 -> Meteosat-8
© Crown copyright 2006 Page 25
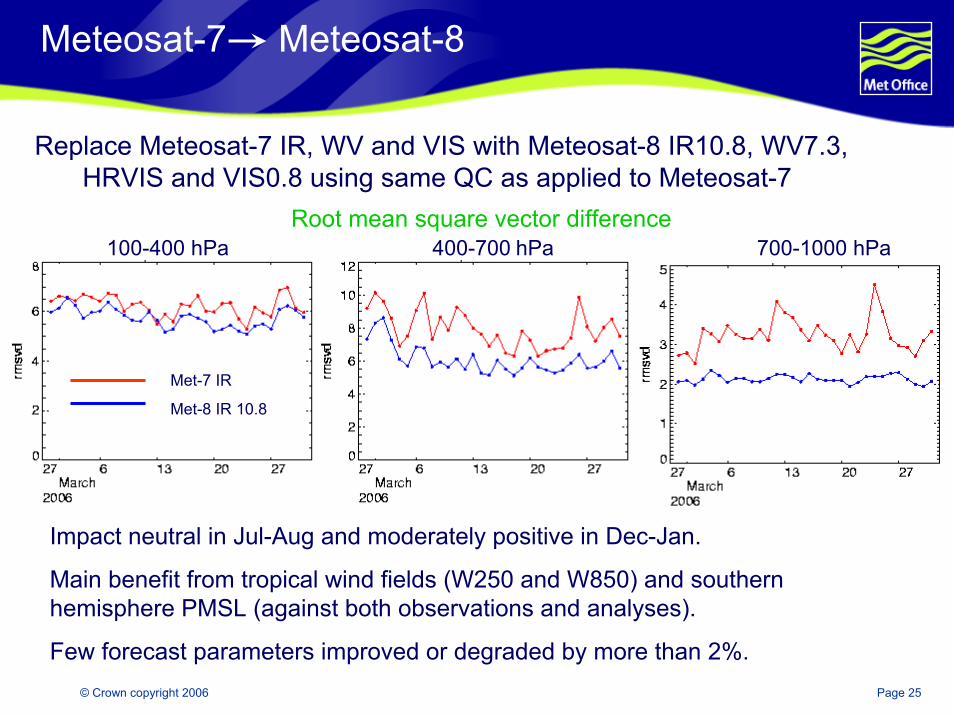
Meteosat-7 Meteosat-8
Replace Meteosat-7 IR, WV and VIS with Meteosat-8 IR10.8, WV7.3, HRVIS and VIS0.8 using same QC as applied to Meteosat-7
Impact neutral in Jul-Aug and moderately positive in Dec-Jan.
Main benefit from tropical wind fields (W250 and W850) and southern hemisphere PMSL (against both observations and analyses).
Few forecast parameters improved or degraded by more than 2%.
100-400 hPa 400-700 hPa 700-1000 hPaRoot mean square vector difference
Met-7 IR
Met-8 IR 10.8

© Crown copyright 2006 Page 26
MODIS winds

© Crown copyright 2006 Page 27
Forecast error evolution Aug 14th, 2004
CONTROL MODIST+24 T+48 T+24 T+48
T+72 T+96 T+72 T+96
T+120 T+144 T+120 T+144
500 hPa geopotential height

© Crown copyright 2006 Page 28
AMVs
Why do we struggle to see impact from AMVs?
Is it poor height assignment of some winds?
We are starting to investigate this
Discussed at IWW in Beijing
© Crown copyright 2006 Page 29
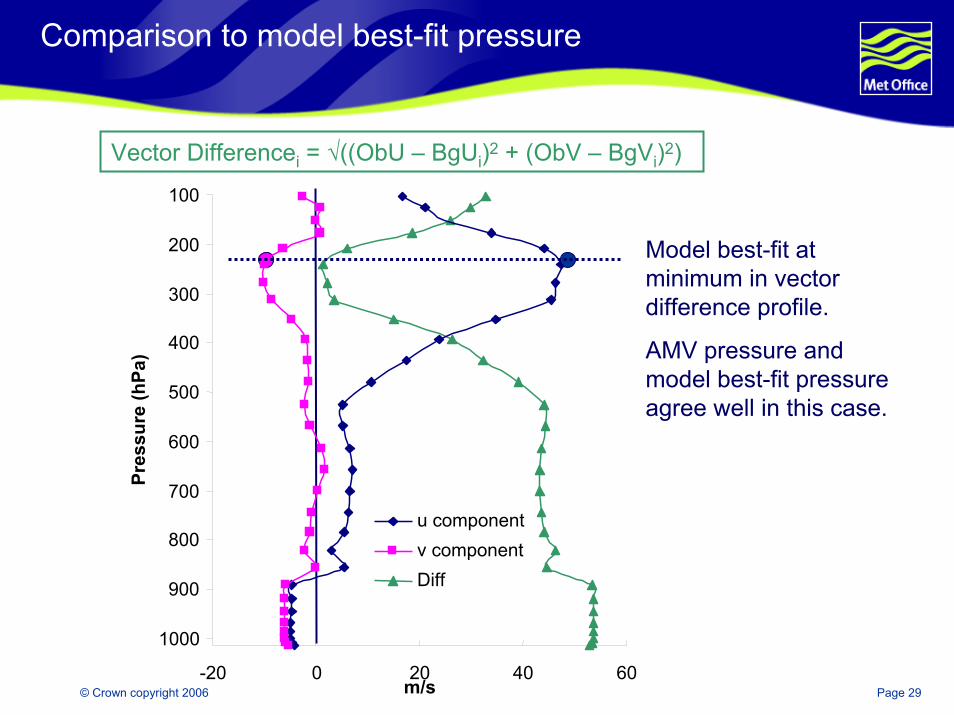
Comparison to model best-fit pressure
Vector Differencei = √((ObU – BgUi)2 + (ObV – BgVi)2)
100
200
300
400
500
600
700
800
900
1000
-20 0 20m/s
40 60
Pres
sure
(hPa
)
u componentv componentDiff
Model best-fit at minimum in vector difference profile.
AMV pressure and model best-fit pressure agree well in this case.

© Crown copyright 2006 Page 30
MSG wind height (hPa) MSG wind – model best fit (hPa)
From 7th December 21:00 UTC to 8th
December 2005 3:00UTC (night time)MODIS Cloud Top Pressure (hPa)
Can also compare to other cloud top pressure products
Case studies – Sahara 8th Dec

© Crown copyright 2006 Page 31
Talk topics
The Met Office satellite groupCurrent status of models and observation useRecent upgrades to use of satellite dataSatellite data impactsResearch into use of new data types Meteosat Second GenerationMETOP
© Crown copyright 2006 Page 32
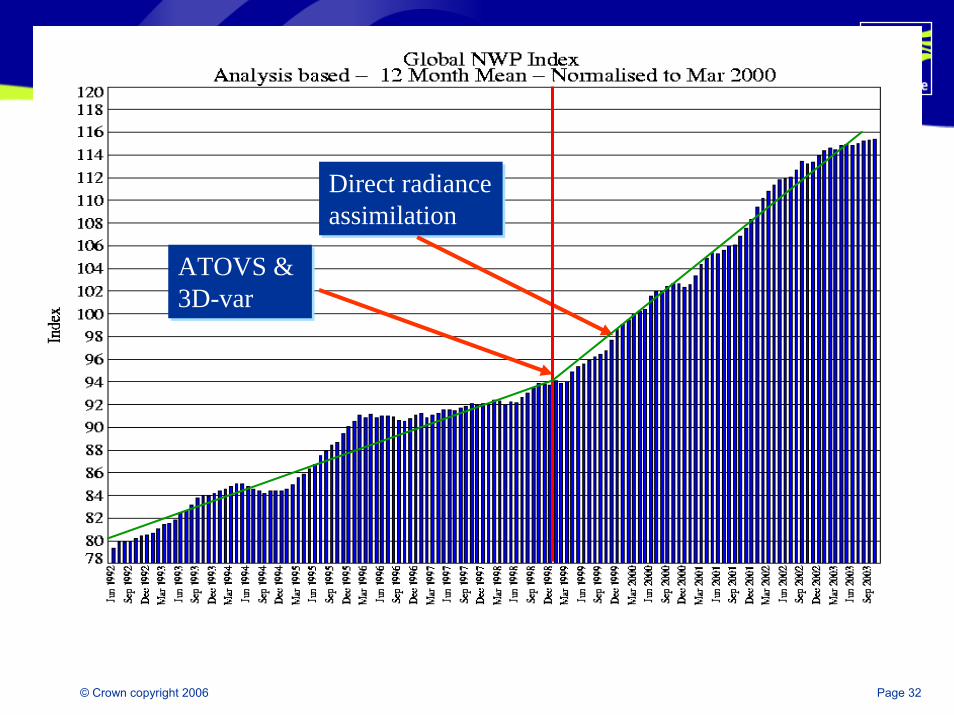
ATOVS & 3D-varATOVS & 3D-var
Direct radiance assimilation Direct radiance assimilation
© Crown copyright 2006 Page 33
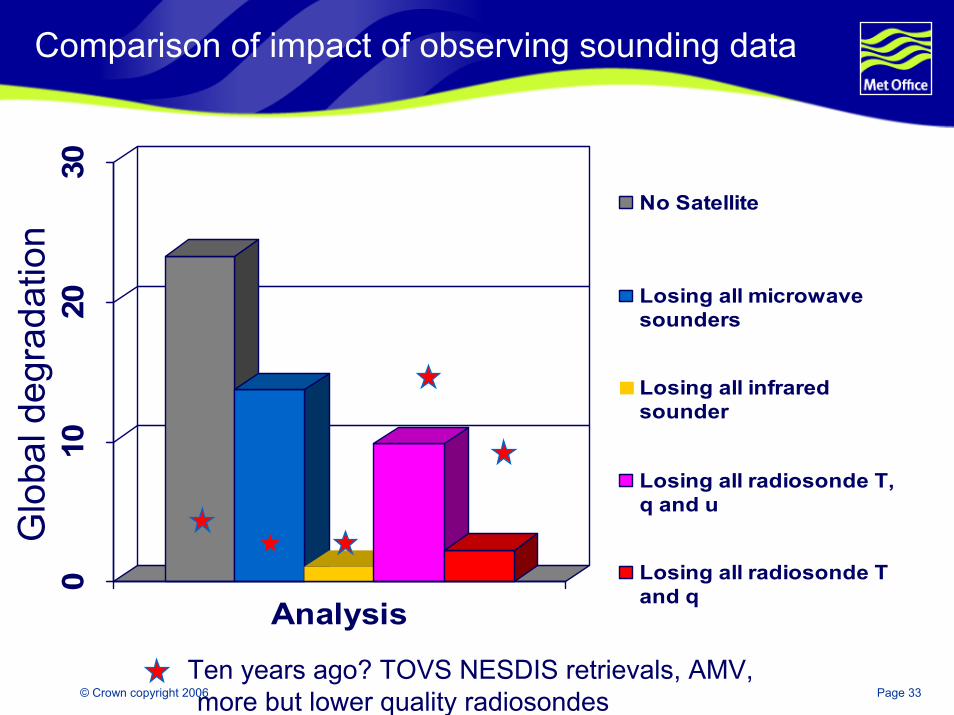
Comparison of impact of observing sounding data0
1020
30
Analysis
No Satellite
Losing all microwavesounders
Losing all infraredsounder
Losing all radiosonde T,q and u
Losing all radiosonde Tand q
Glo
bal d
egra
datio
n
Ten years ago? TOVS NESDIS retrievals, AMV, more but lower quality radiosondes

© Crown copyright 2006 Page 34
Forecast skill vs time
More forecast busts without satellite data

© Crown copyright 2006 Page 35
Talk topics
The Met Office satellite groupCurrent status of models and observation useRecent upgrades to use of satellite dataSatellite data impactsResearch into use of new data typesMeteosat Second GenerationMETOP
© Crown copyright 2006 Page 36
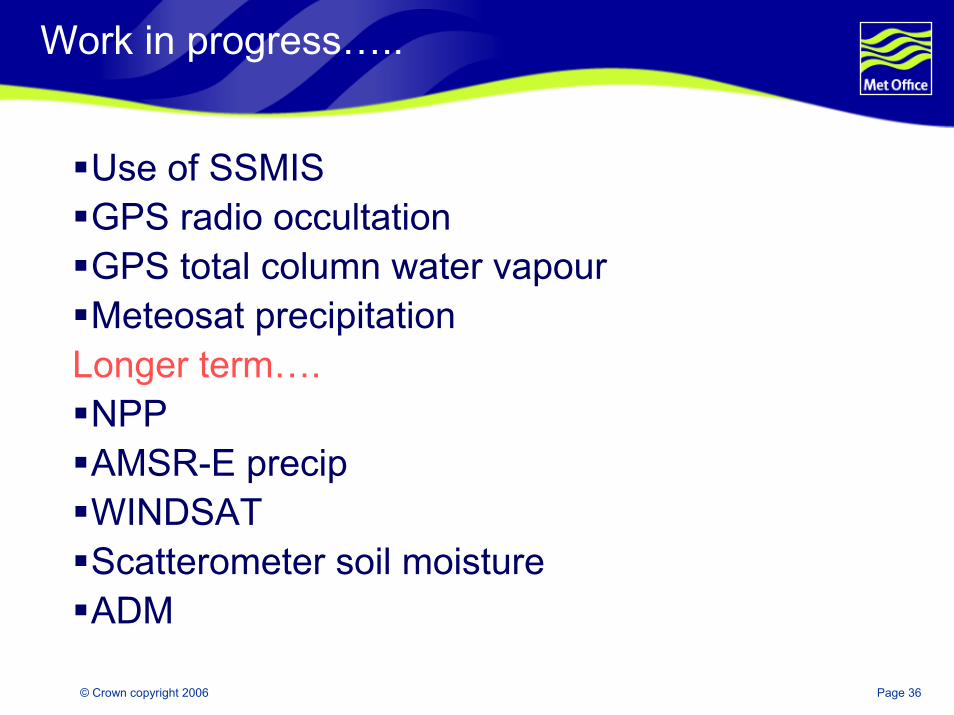
Work in progress…..
Use of SSMIS GPS radio occultationGPS total column water vapourMeteosat precipitation
Longer term….NPPAMSR-E precipWINDSATScatterometer soil moistureADM
© Crown copyright 2006 Page 37
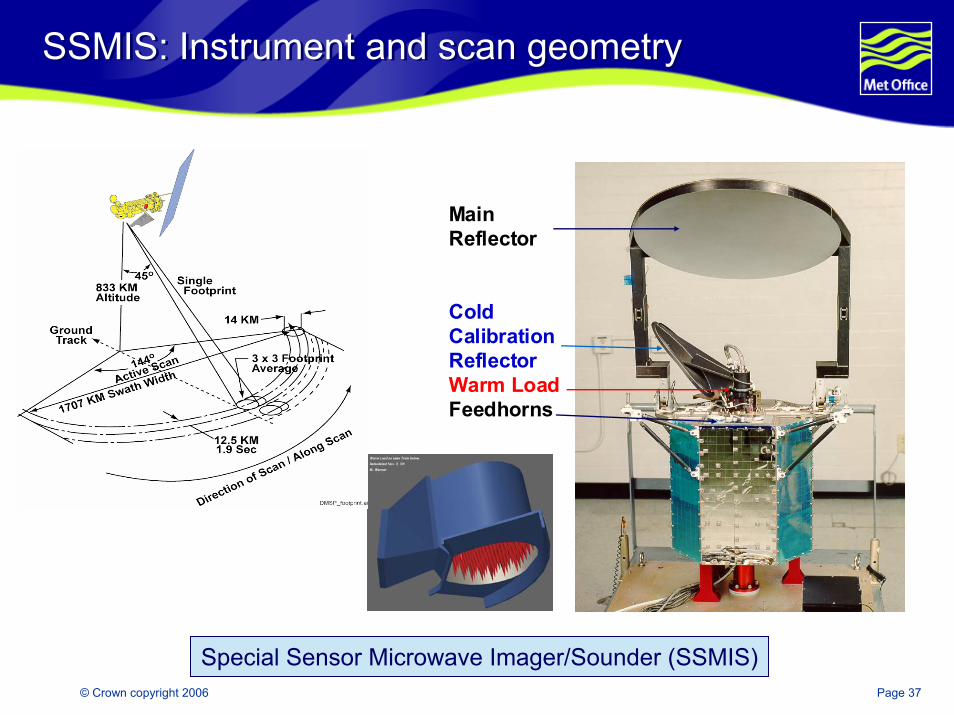
SSMIS: Instrument and scan geometrySSMIS: Instrument and scan geometry
MainReflector
ColdCalibrationReflectorWarm LoadFeedhorns
Special Sensor Microwave Imager/Sounder (SSMIS)

© Crown copyright 2006 Page 38
N
N15
N16
N18
NAQUA
F13
N
F15F16
SSMI (WS)SSMIS (T, q, WS)
ATOVS (T & q) AIRS (T & q)
Orbit coverage of operationally assimilated sounders / imagers
06
12
18
00
F17 – F20 planned for 2006 – 2011

© Crown copyright 2006 Page 39
Background: Accuracy Requirements and Initial Performance
Require U(TB) ~ 0.2K Initial evaluation indicated U(TB) ~ 0.5 K

© Crown copyright 2006 Page 40
Time series of averaged innovationscontinue to be a useful tool for the study ofSSMIS calibration issues
Instrumental Biases: warm load solar intrusions
wc
cc
wl
radiometer counts
Brightnesstemperature
Tb0 Tb
sc

© Crown copyright 2006 Page 41
Flagging solar intrusions
Yellow : rejectedBlack: OK(30 - 40% data flagged)
Improved corrections under testAt NRL/ NESDIS – will allow recovery of this data

© Crown copyright 2006 Page 42
Problems in ascending nodenot evident in descending node
Reflector emission
80K
1K

© Crown copyright 2006 Page 43
SSMIS – reflector emission correctionusing constructed antenna T
1 2
/
0
( ) ( ) ( )T
armant arm
dTT t T t c ce t ddt
τ σ τ τ−= + −∫
Consistent with solution of heat transferequation, assuming conductive cooling

© Crown copyright 2006 Page 44
Characterising TANT & ε : Chs 2 – 7
Ch 1 - 5 : ε = 0.016,7 : ε = 0.02
T corr = 30 – 40 K
(effectively calibrating reflector emissivity using NWP T fields!?)
Temp sounding channelstrop – lower strat(AMSUA like)

© Crown copyright 2006 Page 45
-3-2.5
-2-1.5
-1-0.5
00.5
11.5
2
chan
ge in
RM
SE (%
)
PM
SL
T+24
PM
SL
T+48
PM
SL
T+72
PM
SL
T+96
PM
SL
T+12
0
GH
T T+
24
GH
T T+
48
GH
T T+
72
PM
SL
T+24
PM
SL
T+48
PM
SL
T+72
PM
SL
T+96
PM
SL
T+12
0
GH
T T+
24
GH
T T+
48
GH
T T+
72
FORECAST VARIABLES
-3-2.5
-2-1.5
-1-0.5
00.5
11.5
2
chan
ge in
RM
SE (%
)
PM
SL
T+24
PM
SL
T+48
PM
SL
T+72
PM
SL
T+96
PM
SL
T+12
0
GH
T T+
24
GH
T T+
48
GH
T T+
72
PM
SL
T+24
PM
SL
T+48
PM
SL
T+72
PM
SL
T+96
PM
SL
T+12
0
GH
T T+
24
GH
T T+
48
GH
T T+
72
FORECAST VARIABLES
NH
SH
OPNS vs OPNS +SSMIS(OPNS – N15 ATOVS)
vs(OPNS – N15 ATOVS) + SSMIS
SSMIS Assimilation trials at the Met Office
Conservative use of SSMIS gives significant improvement in SH forecasts of PMSLfor forecast days 1 - 4 on top of 2 and 3 satellite systems

© Crown copyright 2006 Page 46
Summary
• NWP DA systems require high quality radiances (U(TB) ~ 0.2K) in temperature sounding channels to deliver improvements to forecast accuracy
• Post launch Cal/Val program has identified two sources of significant bias associated with solar intrusions into cal warm load and thermal emission from the main reflector.
• Correction strategies have been developed to deal with both effects and the resulting radiances are of comparable quality to those from AMSU-A for the tropospheric T sounding channels
• Assimilation experiments at the Met Office show significant benefit from assimilating T sounding channels for SSMIS in SH verified against baseline configurations with 2 and 3 AMSU’s.
• Assimilation experiments at ECMWF show SSMIS delivers > 50% the benefit of N15 AMSU against NOSAT controls.
• Further improvements are expected as correction algorithms are refined.

© Crown copyright 2006 Page 47
GPS Radio Occultation
RO Missions:
GPS/Met : 1995 – 2000
Ørsted : 1998 –
SunSat : 1999 –
SAC-C : 1999 –
CHAMP: 2000 –
GRACE-A/B : 2002 –
COSMIC : ? Apr 2006
GRAS : 17 Jul 2006

© Crown copyright 2006 Page 48
Radio Occultation
CHAMP Coverage

© Crown copyright 2006 Page 49
Radio Occultation impacts

© Crown copyright 2006 Page 50
Ground-based GPS
Uses standard GPS navigation signals and standard geodetic-quality receiversAtmospheric zenith total delay (ZTD) included in position solutionInformation on ‘dry’ (ZHD) and ‘wet’ (ZWD) componentsIWV = (ZTD-ZHD)/k = ZWD/k (k ~6.5)European collaboration via EUMETNET E-GVAP (& previously EU COST-715 & TOUGH)Semi-operational hourly data downloads from 500+ stations over EuropeProcessed to Total Zenith Delay in <2 hours

© Crown copyright 2006 Page 51
Ground-based GPS over Europe

© Crown copyright 2006 Page 52
Talk topics
The Met Office satellite groupCurrent status of models and observation useRecent upgrades to use of satellite dataSatellite data impactsResearch into use of new data types Meteosat Second GenerationMETOP

© Crown copyright 2006 Page 53
Meteosat vs MSG: Differences
Meteosat 7 Meteosat 8
30 Minutes 15 Minutes3 Channels 12 Channels2500 x 2500 pixels5 km at SSP (2.5km)
3712 x 3712 pixels3 km at SSP (1km)

© Crown copyright 2006 Page 54
High Res Vis imageMeteosat-8 Meteosat-7
© Crown copyright 2006 Page 55
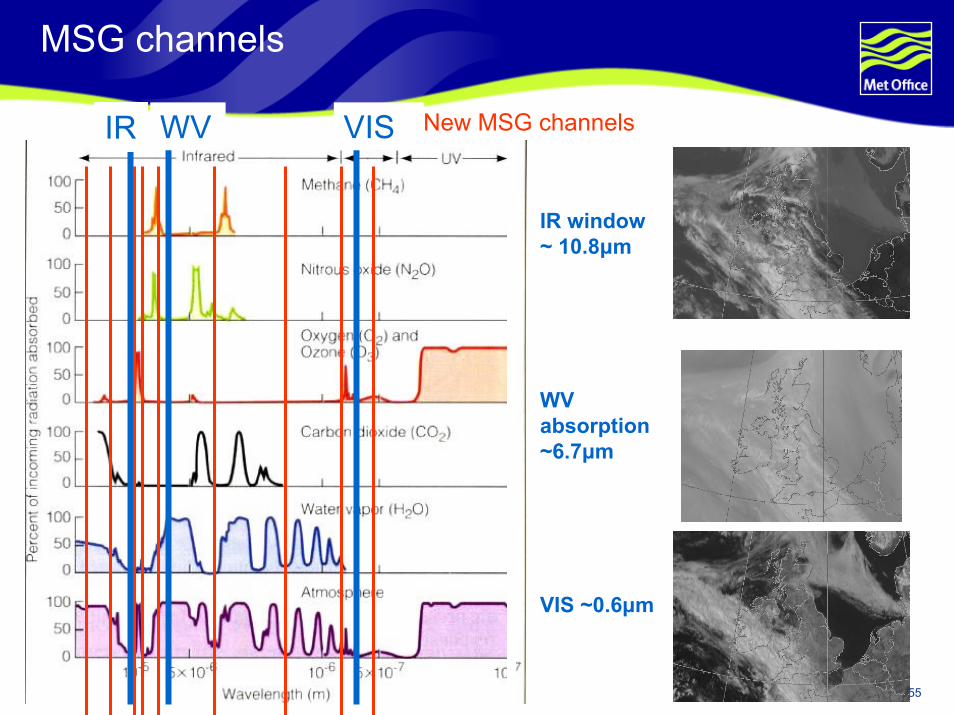
MSG channels
IR WV VIS
IR window ~ 10.8μm
WV absorption~6.7μm
VIS ~0.6μm
New MSG channels

© Crown copyright 2006 Page 56
Day-time correlations – 1200Z, 1st December 2005
2-d day (0.8 μm,10.8 μm)
c.c. = 0.61
3-d day (0.8 μm,3.9 μm,
10.8 μm)c.c. = 0.68
3-d day (0.8 μm,1.6 μm,
10.8 μm)c.c. = 0.75
4-d day (0.8 μm,1.6 μm,3.9 μm,
10.8 μm)c.c. = 0.78Radar
1-d (10.8 μm)
c.c. = 0.45
2-d night(10.8 μm,12.0 μm)
c.c. = 0.46
Combined

© Crown copyright 2006 Page 57
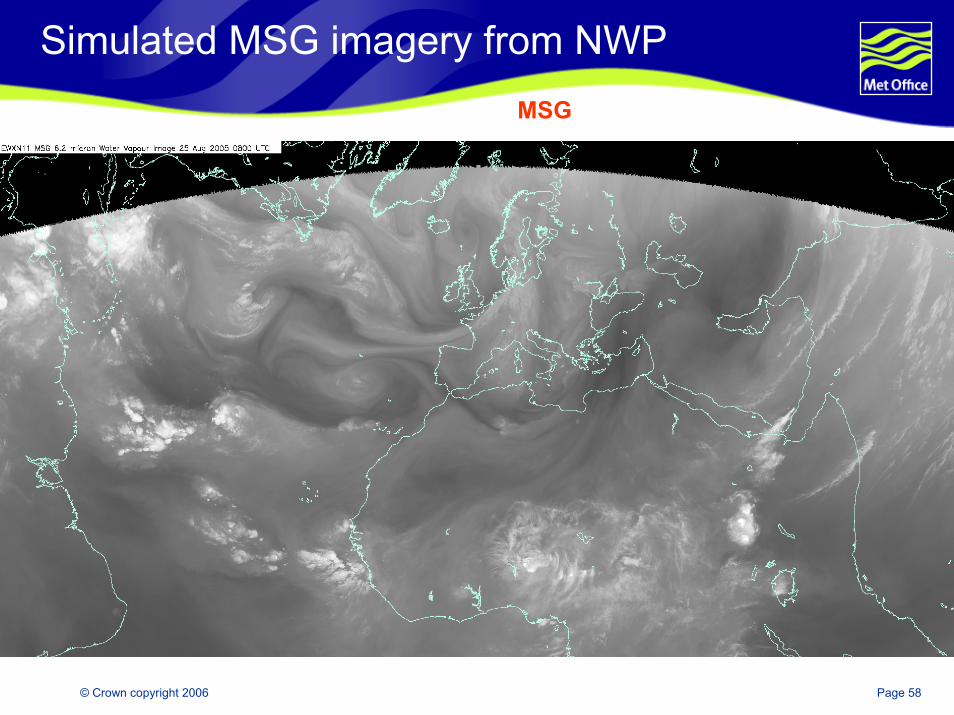
Simulated imagery at Met Office
Use regional NWP analysed fields of T(p), RH(p), Ts as input to fast RT model (RTTOV-7)Estimate cloud at each level from RH (if RH>80% then cloud fraction assigned 0-1)Compute cloud overlap (maximal or random)Run RTTOV with cloud layers seen by satelliteAll IR channels simulated for each model grid box (clear+cloudy)Display alongside measured SEVIRI imagery Only 6.2um used at present by forecasters
© Crown copyright 2006 Page 58
Simulated MSG imagery from NWPMSG

© Crown copyright 2006 Page 59
Simulated MSG imagery from NWPNWP

© Crown copyright 2006 Page 60
Talk topics
The Met Office satellite groupCurrent status of models and observation useRecent upgrades to use of satellite dataSatellite data impactsResearch into use of new data types Meteosat Second GenerationMETOP

© Crown copyright 2006 Page 61
METOP Payload
Denotes new sensor

© Crown copyright 2006 Page 62
METOP preparations
Launch on 17 July from BaikonurTesting systems using NCEP simulated METOP datasetsData reception tests using EUMETCAST Use ATOVS within a few months of launchUse ASCAT, GRAS and IASI within 18 months of launch
© Crown copyright 2006 Page 63
IASI Implementation
IASI poses huge challenges because of the volume of data
8461 channels, 120 observations per scan
We will reduce this data volume by using only 300 channels and one in four observations
Channels selected on the basis of information content
Reduces data volume of one IASI to about the level of three ATOVS
Initially, we will use the data in a very similar way to AIRS
Sea only
Clear only (via 1D-Var cloud detection)

© Crown copyright 2006 Page 64
IASI Channel Selection

© Crown copyright 2006 Page 65
Satellite data increases
0
10
20
30
40
50
60
No.
of i
nstr
umen
ts
1999 2000 2001 2002 2003 2004 2005 2006 2007 2008 2009 2010 2011
Year
Number of satellite sensors for NWP COSMICTERRAGMS/MTSATGOESMETEOSATCORIOLISADMADEOSAQUAQSCATNPPMETOPENVISATERSDMSPNOAA
+ FY-3?

© Crown copyright 2006 Page 66
Any questions?