Embed Size (px)
Citation preview

The External Environment for Developing Countries
March 2009The World Bank
Development EconomicsProspects Group
2.0
2.3
2.5
2.8
3.0
3.3
Jan-09 Jan-09 Jan-09 Feb-09 Mar-09 Mar-094.5
5.0
5.5
6.0
6.5
Source: Thomson/Datastream.
Federal Reserve’s “quantitative easing” spurs quick fall in long rates
U.S. ten-year T-note, 30-year fixed- and ARM mortgage rates, percent
Ten-year note [left]
30-year fixed mortgage [right]
Variable ARM rate [right]

55
60
65
70
75
80
85
90
95
100
105
Sep-08 Oct-08 Nov-08 Dec-08 Jan-09 Feb-09 Mar-09
Source: Thomson/Datastream.
... sustaining longest equity rally since end-2008
Indexes: 100 on September 15, 2008 [Lehman Brothers]
MSCI-Emerging Markets
CAC- France
DJIA USA
Topix Japan
Industrial countries
2.8
-0.5
-3.8
-6.2
-8
-6
-4
-2
0
2
4
6
Q2-2008 Q3-2008 Q4-2008 F Q4-2008 R
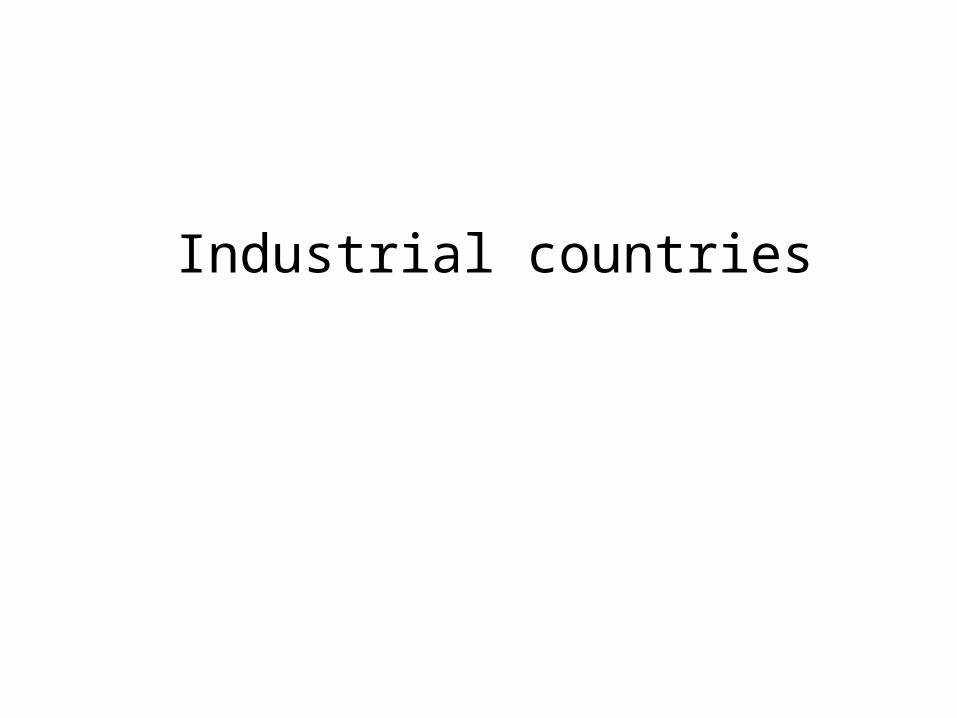
Source: Department of Commerce and DECPG calculations.
U.S. GDP revised to substantial 6.2% decline in fourth quarter 2008
growth of real GDP, and contributions to growth in percentage points
StocksGovernmentConsumption
InvestmentNet Exports
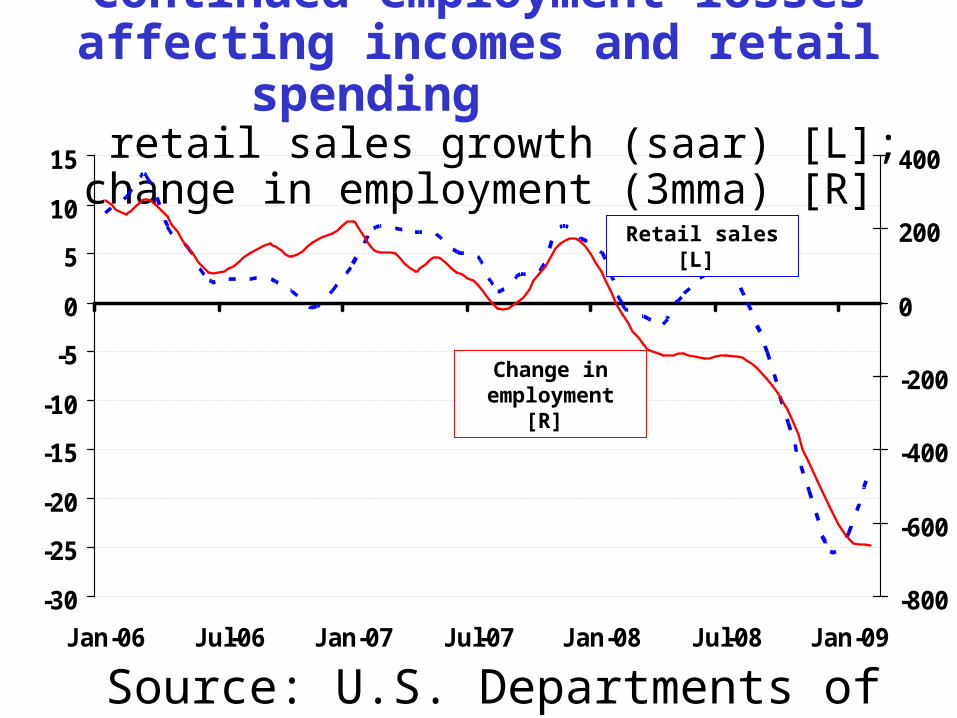
Continued employment losses affecting incomes and retail spending
retail sales growth (saar) [L]; change in employment (3mma) [R]
-30
-25
-20
-15
-10
-5
0
5
10
15
Jan-06 Jul-06 Jan-07 Jul-07 Jan-08 Jul-08 Jan-09
-800
-600
-400
-200
0
200
400
Source: U.S. Departments of Commerce and Labor.
Retail sales [L]
Change in employment [R]
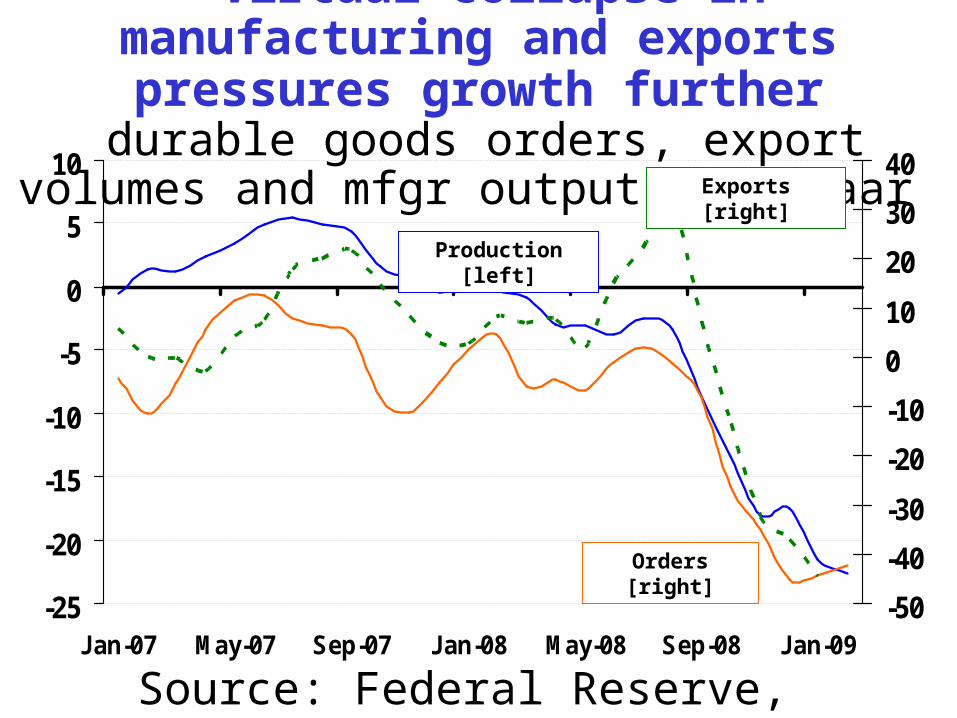
Virtual collapse in manufacturing and exports pressures growth further
durable goods orders, export volumes and mfgr output, ch% saar
-25
-20
-15
-10
-5
0
5
10
Jan-07 May-07 Sep-07 Jan-08 May-08 Sep-08 Jan-09
-50
-40
-30
-20
-10
0
10
20
30
40
Source: Federal Reserve, Department of Commerce.
Orders [right]
Production [left]
Exports [right]
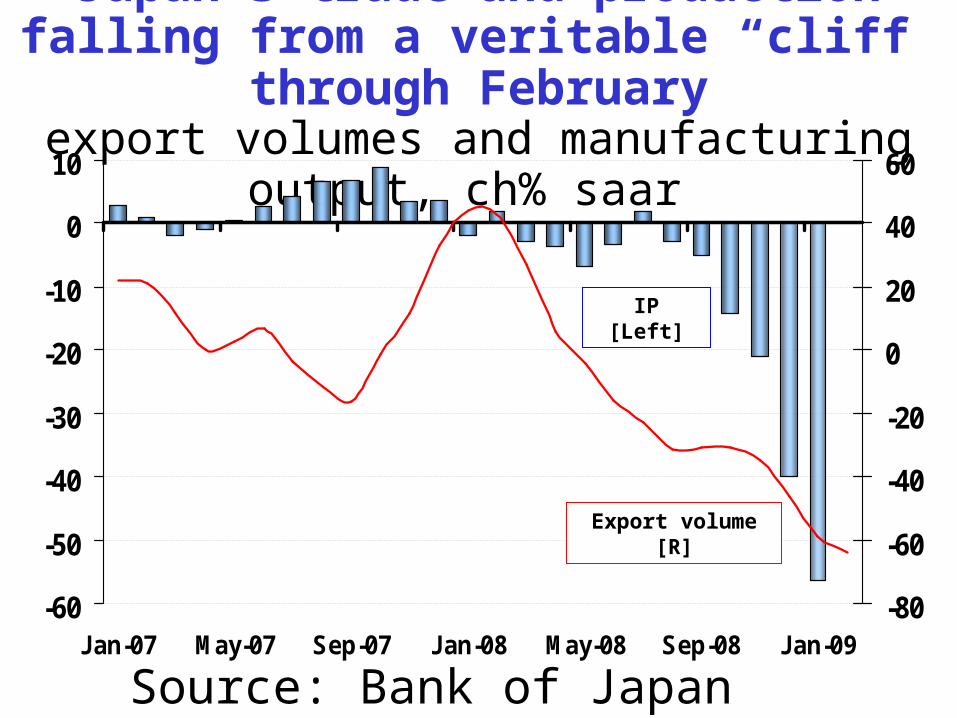
Japan’s trade and production falling from a veritable “cliff” through February
export volumes and manufacturing output, ch% saar
-60
-50
-40
-30
-20
-10
0
10
Jan-07 May-07 Sep-07 Jan-08 May-08 Sep-08 Jan-09
-80
-60
-40
-20
0
20
40
60
Source: Bank of Japan and Japan Cabinet Office.
IP [Left]
Export volume [R]
-15-12-9-6-30369
1215
Q1-2008 Q2-2008 Q3-2008 Q4-2008
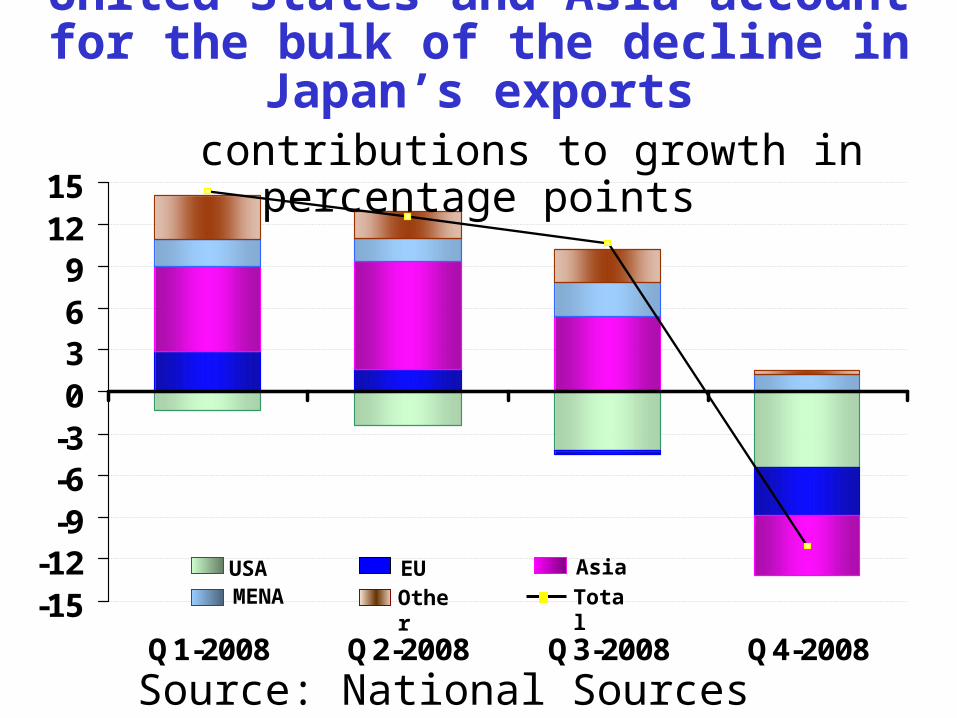
Source: National Sources through Thomson/Datastream.
United States and Asia account for the bulk of the decline in Japan’s exports contributions to growth in percentage
points
USAMENA
EUOther
Asia
Total
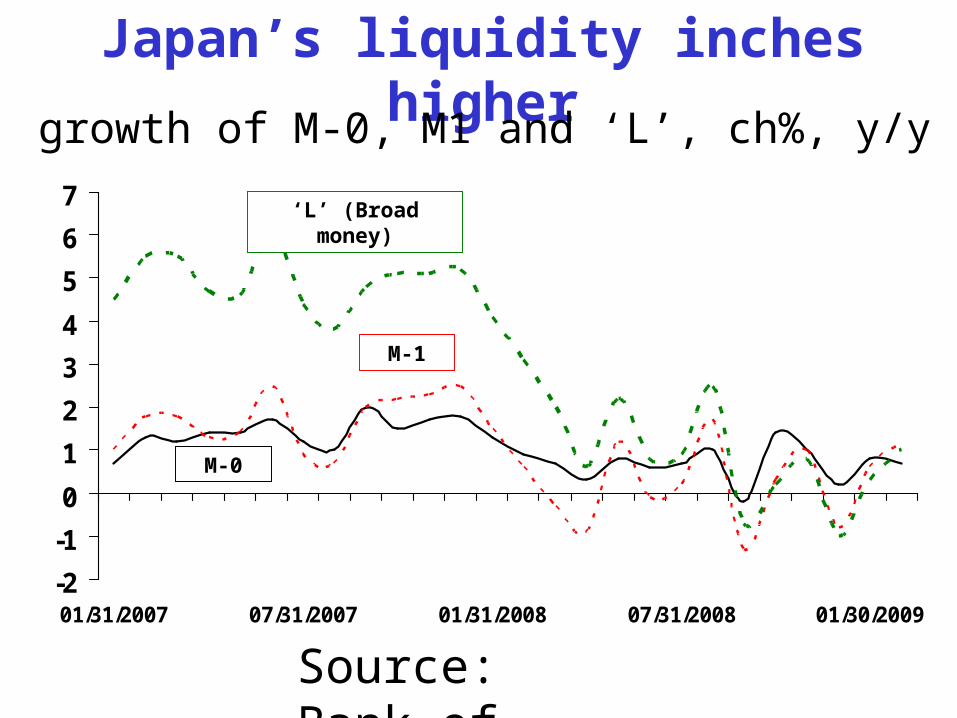
Japan’s liquidity inches higher
-2
-1
0
1
2
3
4
5
6
7
01/31/2007 07/31/2007 01/31/2008 07/31/2008 01/30/2009
Source: Bank of Japan.
growth of M-0, M1 and ‘L’, ch%, y/y
‘L’ (Broad money)
M-1
M-0
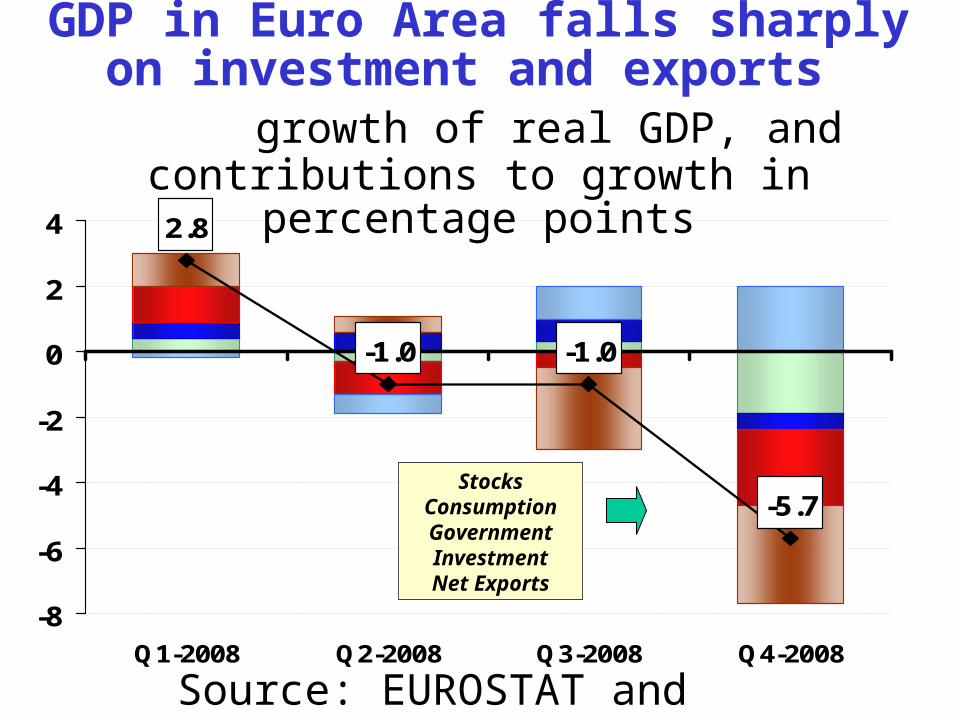
2.8
-1.0 -1.0
-5.7
-8
-6
-4
-2
0
2
4
Q1-2008 Q2-2008 Q3-2008 Q4-2008
Source: EUROSTAT and DECPG calculations.
GDP in Euro Area falls sharply on investment and exports
growth of real GDP, and contributions to growth in percentage points
StocksConsumptionGovernmentInvestmentNet Exports

Trade is sapping the German economy of any forward momentum
export orders and factory output, ch% saar
-70
-60
-50
-40
-30
-20
-10
0
10
20
30
Jan-07 May-07 Sep-07 Jan-08 May-08 Sep-08 Jan-09
Source: EUROSTAT through Thomson/Datastream.
Export orders
IP Manufacturing
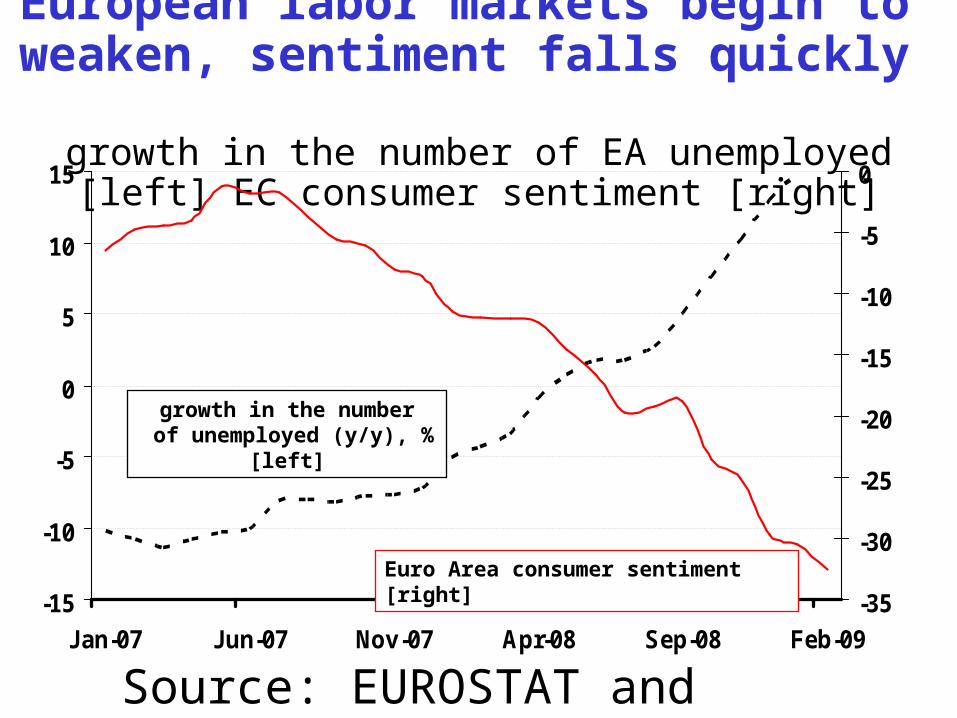
European labor markets begin to weaken, sentiment falls quickly
growth in the number of EA unemployed [left] EC consumer sentiment [right]
-15
-10
-5
0
5
10
15
Jan-07 Jun-07 Nov-07 Apr-08 Sep-08 Feb-09
-35
-30
-25
-20
-15
-10
-5
0
Source: EUROSTAT and European Commission.
Euro Area consumer sentiment [right]
growth in the number of unemployed (y/y), % [left]
Industrial production
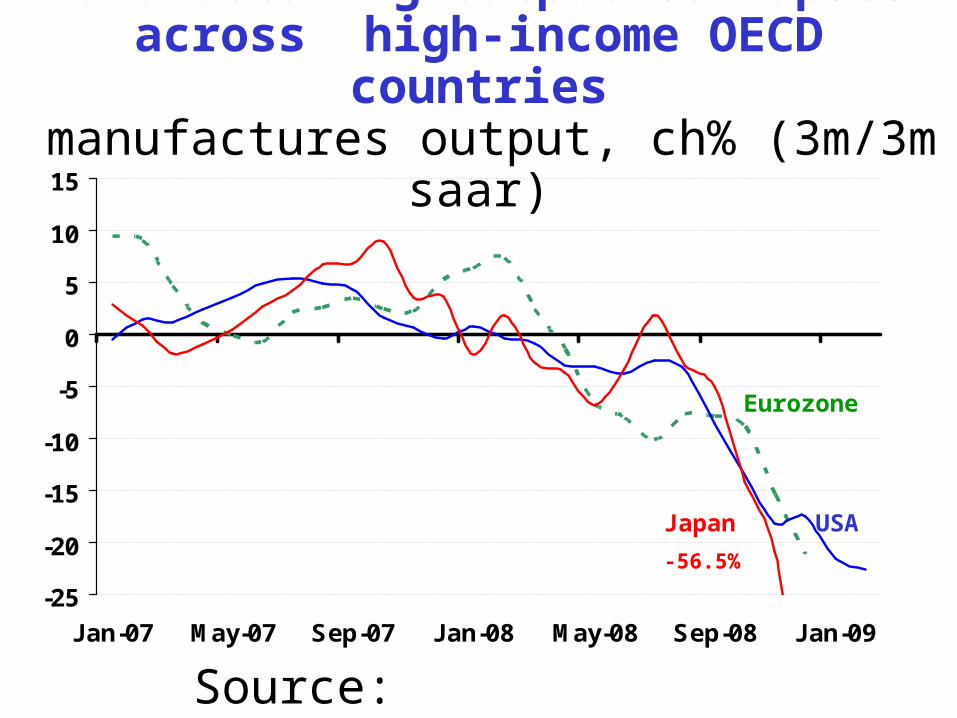
-25
-20
-15
-10
-5
0
5
10
15
Jan-07 May-07 Sep-07 Jan-08 May-08 Sep-08 Jan-09
Manufacturing output collapses across high-income OECD countries
manufactures output, ch% (3m/3m saar)
USA
Eurozone
-56.5%
Japan
Source: Thomson/Datastream, DECPG.
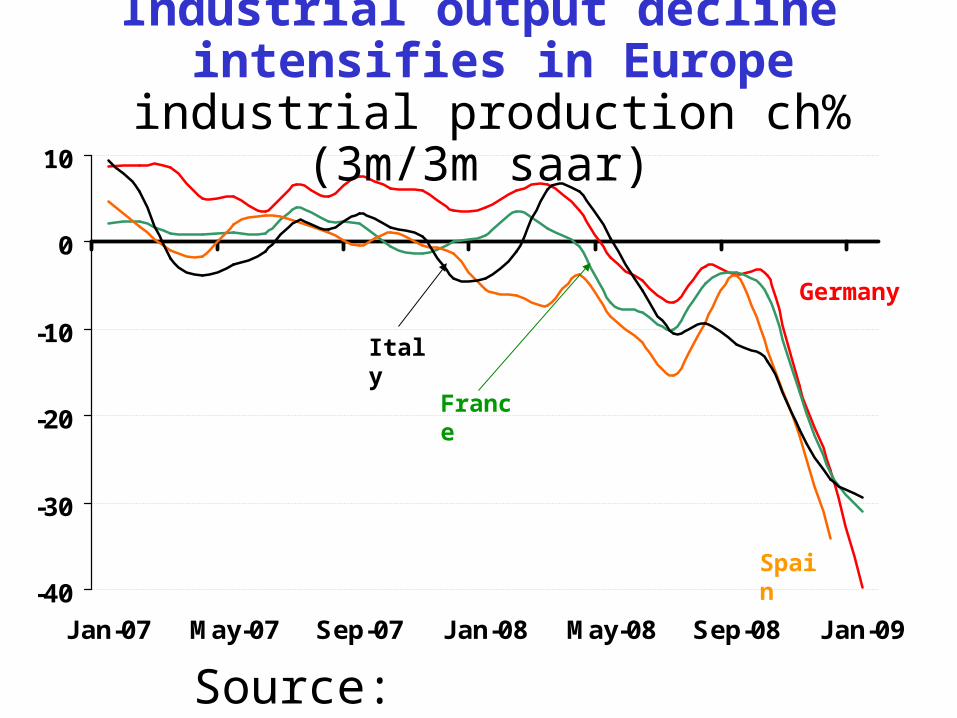
-40
-30
-20
-10
0
10
Jan-07 May-07 Sep-07 Jan-08 May-08 Sep-08 Jan-09
Industrial output decline intensifies in Europe
industrial production ch% (3m/3m saar)
Germany
Italy
Spain
France
Source: Thomson/Datastream, DECPG.
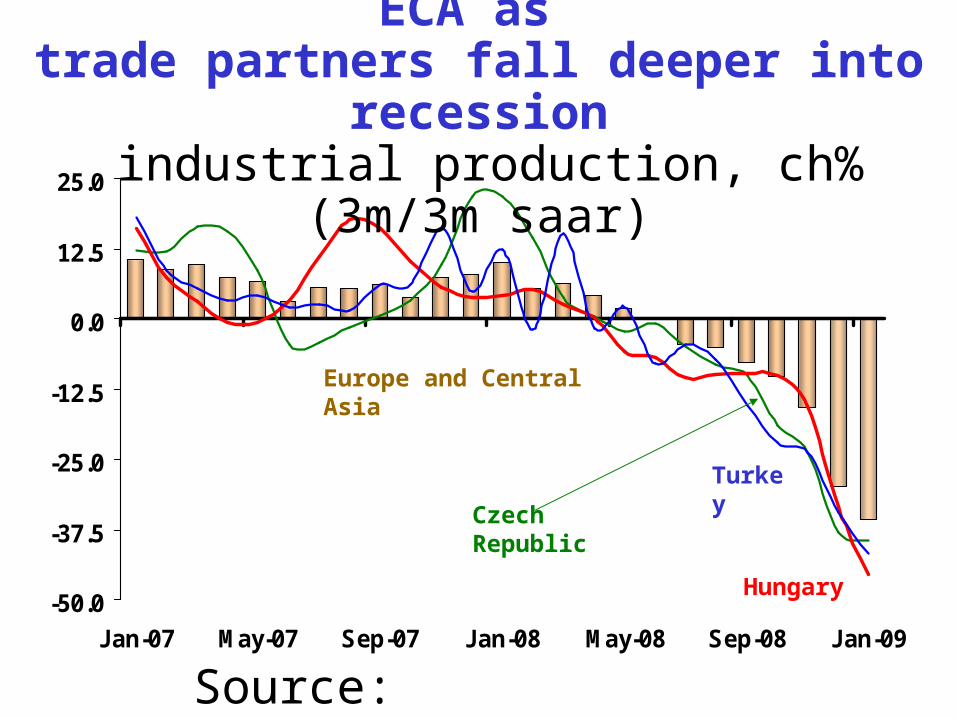
-50.0
-37.5
-25.0
-12.5
0.0
12.5
25.0
Jan-07 May-07 Sep-07 Jan-08 May-08 Sep-08 Jan-09
Industrial output collapses in ECA as trade partners fall deeper into recession
industrial production, ch% (3m/3m saar)
Czech Republic
Europe and Central Asia
Hungary
Turkey
Source: Thomson/Datastream, DECPG.
International trade
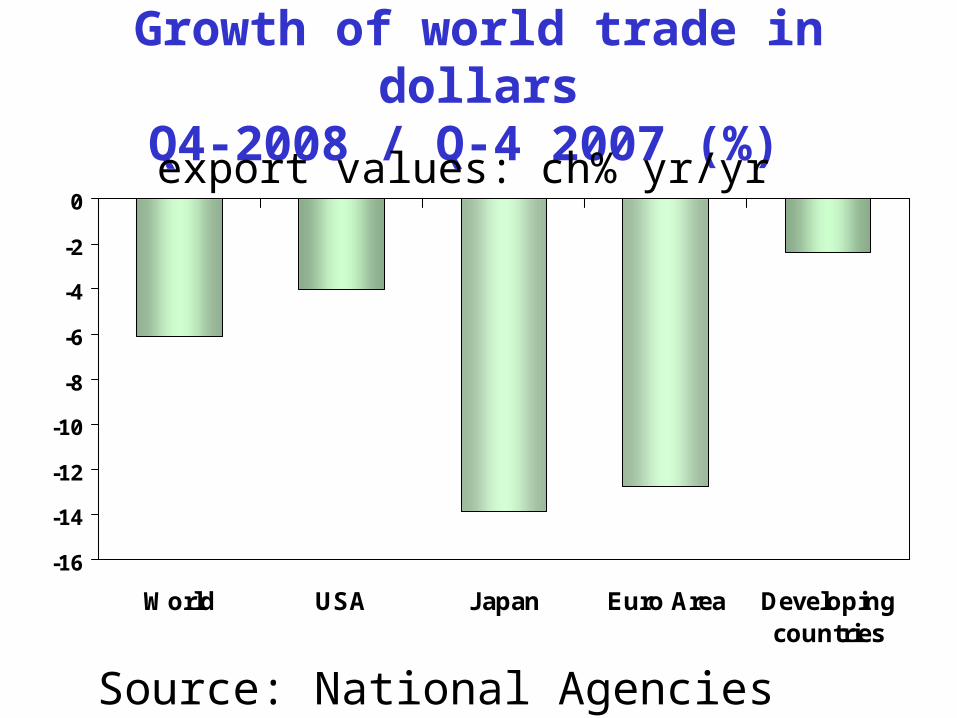
Growth of world trade in dollarsQ4-2008 / Q-4 2007 (%)
-16
-14
-12
-10
-8
-6
-4
-2
0
World USA Japan Euro Area Developingcountries
Source: National Agencies through Thomson/Datastream.
export values: ch% yr/yr
-250
-200
-150
-100
-50
0
50
100
Q4-2007 Q1-2008 Q2-2008 Q3-2008 Q4-2008
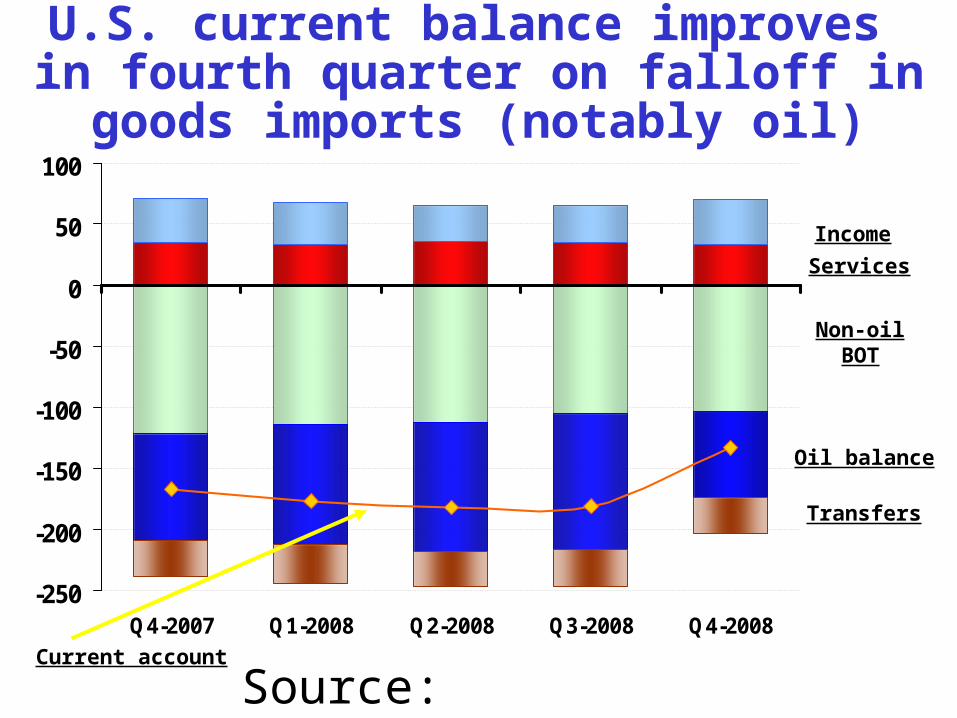
Source: Department of Commerce.
U.S. current balance improves in fourth quarter on falloff in goods
imports (notably oil)
Income
Services
Non-oilBOT
Oil balance
Transfers
Current account
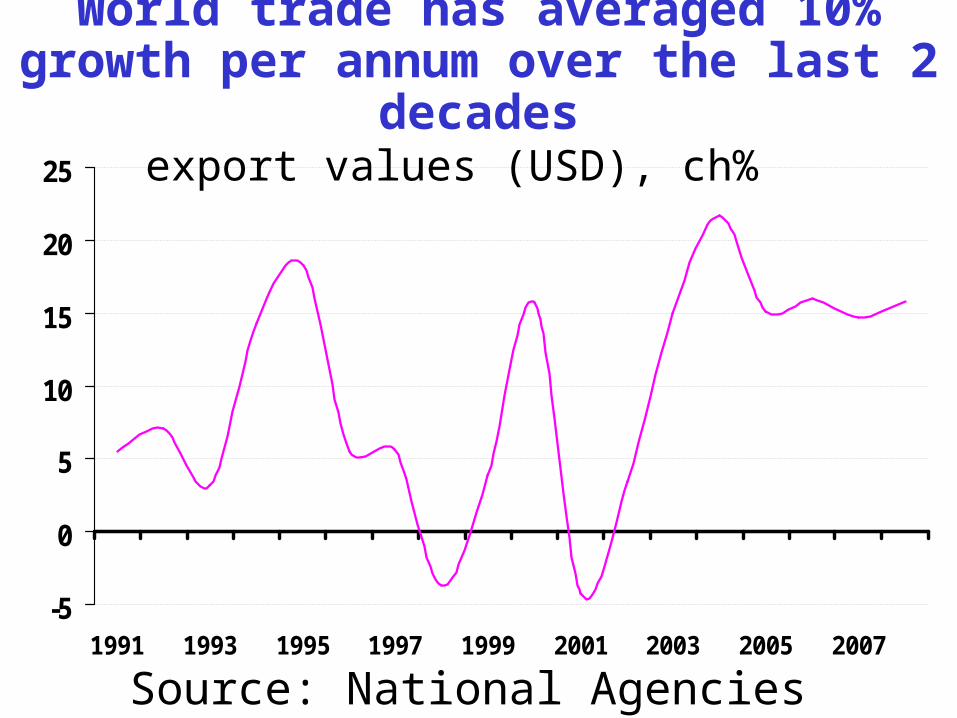
World trade has averaged 10% growth per annum over the last 2 decades
export values (USD), ch%
-5
0
5
10
15
20
25
1991 1993 1995 1997 1999 2001 2003 2005 2007
Source: National Agencies through Haver Analytics.

Oil prices
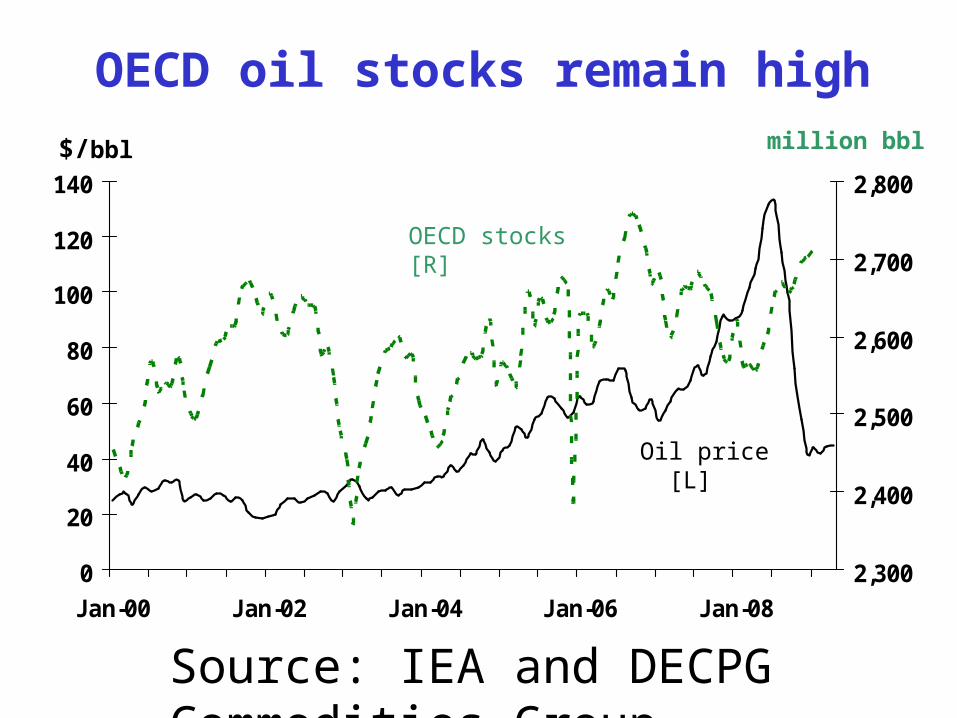
OECD oil stocks remain high
0
20
40
60
80
100
120
140
Jan-00 Jan-02 Jan-04 Jan-06 Jan-08
2,300
2,400
2,500
2,600
2,700
2,800$/bbl million bbl
Oil price [L]
OECD stocks [R]
Source: IEA and DECPG Commodities Group.
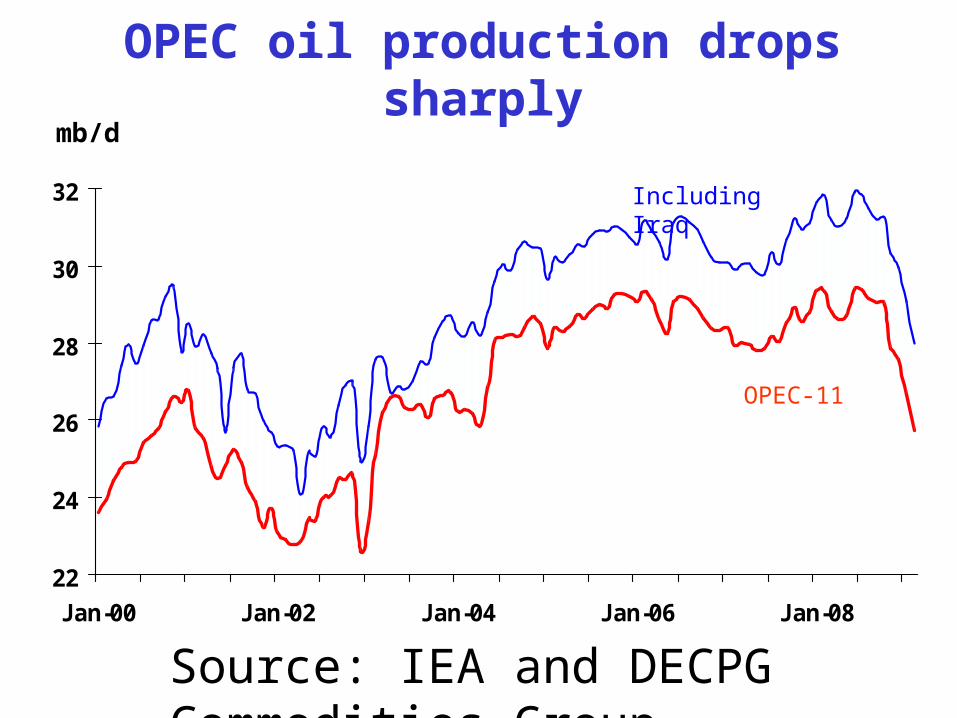
OPEC oil production drops sharply
22
24
26
28
30
32
Jan-00 Jan-02 Jan-04 Jan-06 Jan-08
mb/d
OPEC-11
Including Iraq
Source: IEA and DECPG Commodities Group.
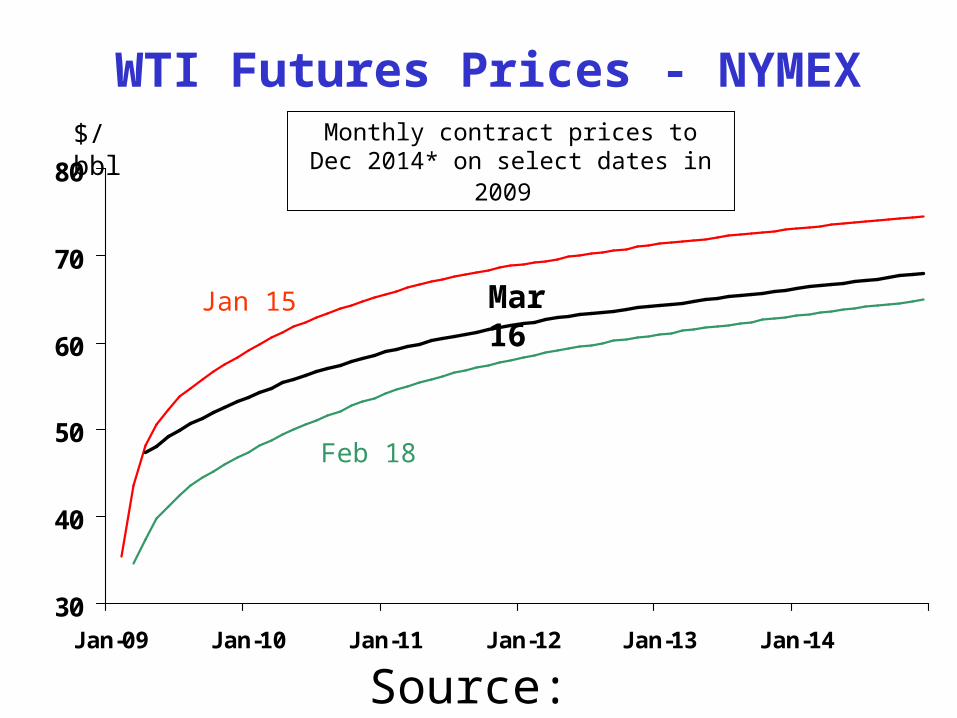
WTI Futures Prices - NYMEX
30
40
50
60
70
80
Jan-09 Jan-10 Jan-11 Jan-12 Jan-13 Jan-14
Mar 16
$/bbl Monthly contract prices to Dec 2014* on select dates in 2009
Feb 18
Jan 15
Source: NYMEX.
Non-oil commodity prices
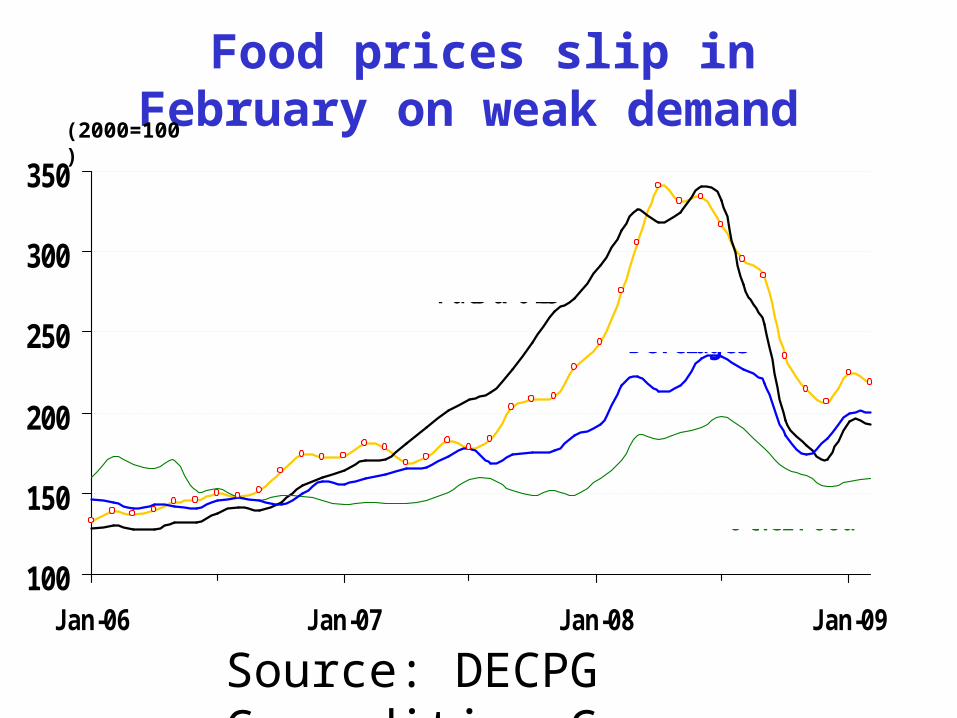
100
150
200
250
300
350
Jan-06 Jan-07 Jan-08 Jan-09
Grains
Fats & Oils
Beverages
Other Food
Food prices slip in February on weak demand (2000=100)
Source: DECPG Commodities Group.

Copper prices rise on Chinese restocking
2,000
3,000
4,000
5,000
6,000
7,000
8,000
9,000
Jan-06 Jan-07 Jan-08 Jan-09
50
100
150
200
250
300
350
400
450
500
550
$/ton ‘000 tons
Copper price
LME stocks
Source: LME and DECPG Commodities Group.

Freight rates revive on stronger trans-PAC bulk shipments
0
2,000
4,000
6,000
8,000
10,000
12,000
Jan-06 Jul-06 Jan-07 Jul-07 Jan-08 Jul-08 Jan-09
$/ton
Baltic dry freight index
Source: Datastream and DECPG Commodities Group.
International Finance
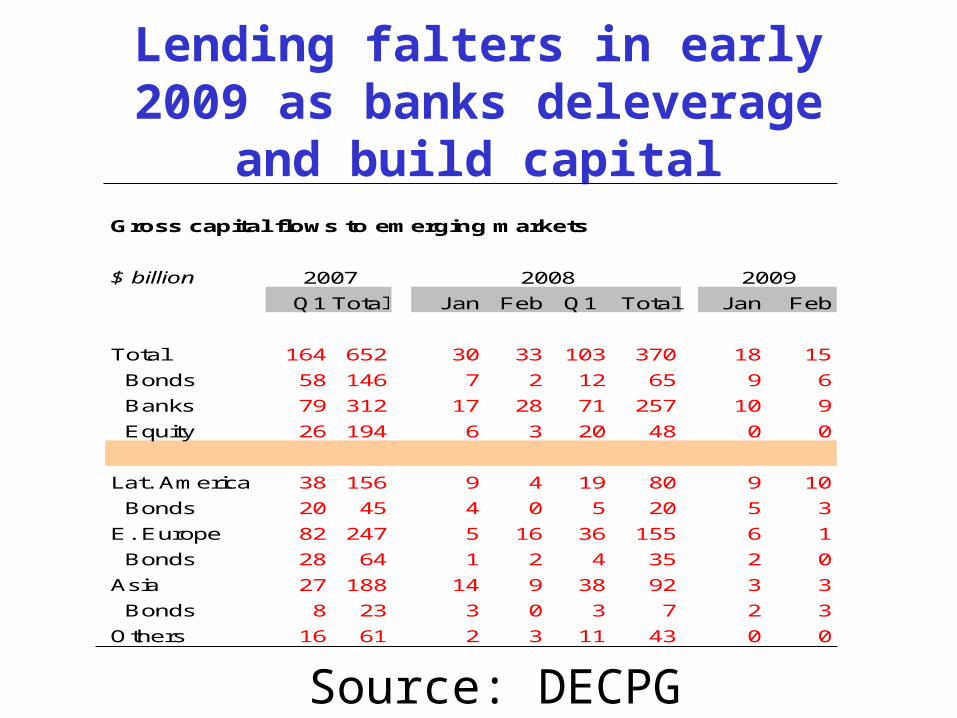
Lending falters in early 2009 as banks deleverage and build capital
Source: DECPG Finance Team.
Gross capital flows to emerging markets
$ billion
Q1 Total Jan Feb Q1 Total Jan Feb
Total 164 652 30 33 103 370 18 15
Bonds 58 146 7 2 12 65 9 6
Banks 79 312 17 28 71 257 10 9
Equity 26 194 6 3 20 48 0 0
Lat. America 38 156 9 4 19 80 9 10
Bonds 20 45 4 0 5 20 5 3
E. Europe 82 247 5 16 36 155 6 1
Bonds 28 64 1 2 4 35 2 0
Asia 27 188 14 9 38 92 3 3
Bonds 8 23 3 0 3 7 2 3
Others 16 61 2 3 11 43 0 0
2007 2008 2009
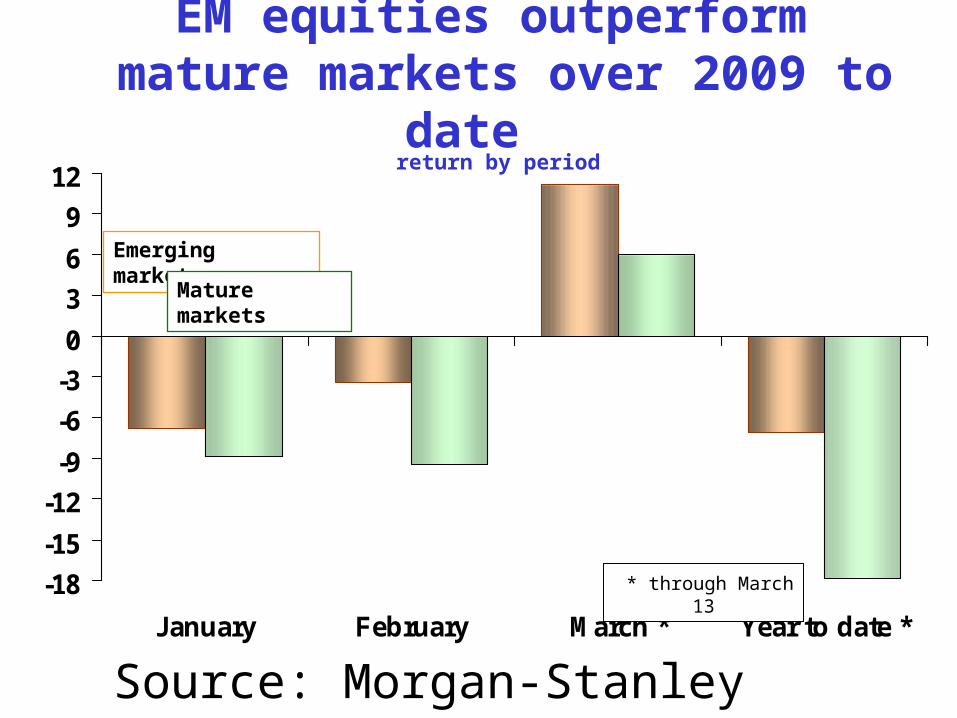
EM equities outperform mature markets over 2009 to date
-18
-15
-12
-9
-6
-3
0
3
6
9
12
January February March * Year to date *
Source: Morgan-Stanley through Thomson/Datastream
return by period
Emerging markets
Mature markets
* through March 13
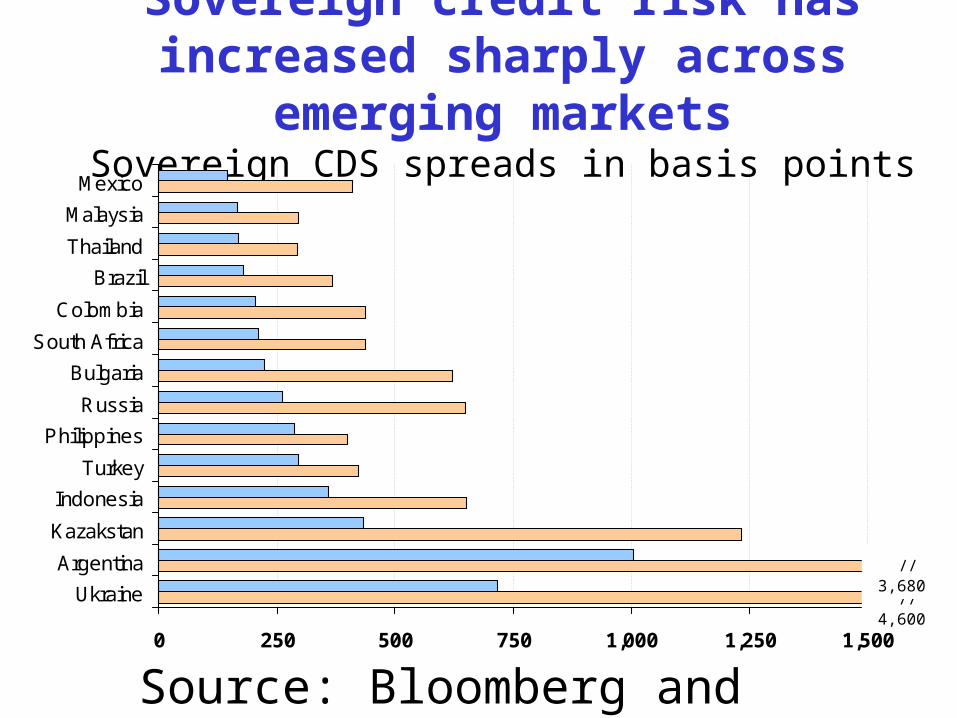
Sovereign credit risk has increased sharply across emerging markets
Sovereign CDS spreads in basis points
0 250 500 750 1,000 1,250 1,500
Ukraine
Argentina
Kazakstan
Indonesia
Turkey
Philippines
Russia
Bulgaria
South Africa
Colombia
Brazil
Thailand
Malaysia
Mexico
Source: Bloomberg and DECPG Finance Team.
// 4,600
// 3,680

Currencies
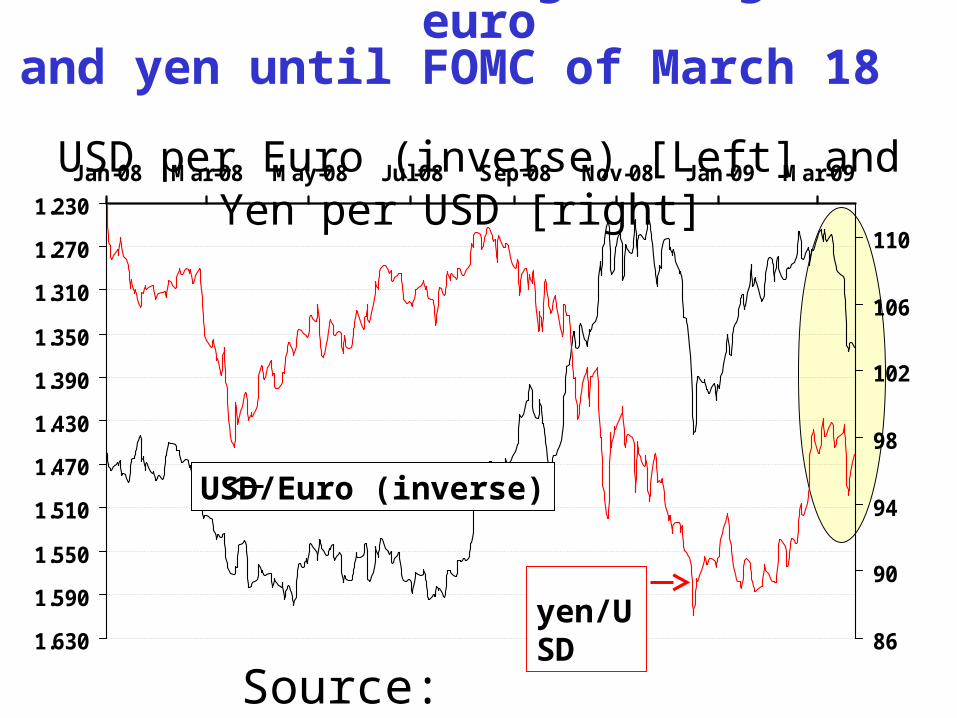
1.230
1.270
1.310
1.350
1.390
1.430
1.470
1.510
1.550
1.590
1.630
Jan-08 Mar-08 May-08 Jul-08 Sep-08 Nov-08 Jan-09 Mar-09
86
90
94
98
102
106
110
Source: Thomson/Datastream.
yen/USD
USD/Euro (inverse)
Dollar continues gains against euroand yen until FOMC of March 18
USD per Euro (inverse) [Left] and Yen per USD [right]
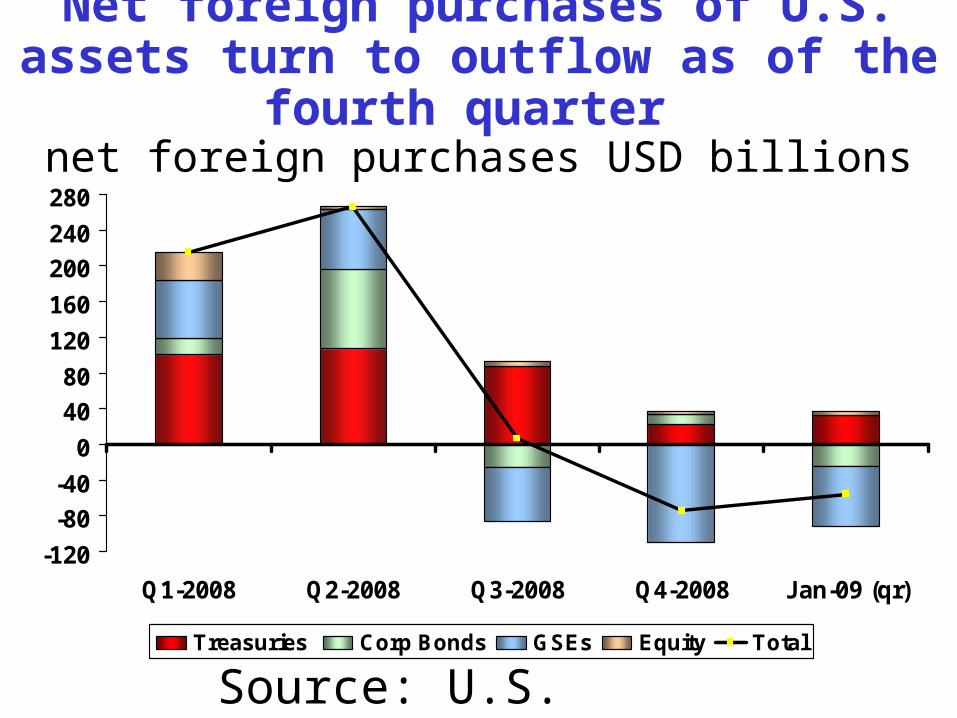
Net foreign purchases of U.S. assets turn to outflow as of the fourth quarter
net foreign purchases USD billions
-120
-80
-40
0
40
80
120
160
200
240
280
Q1-2008 Q2-2008 Q3-2008 Q4-2008 Jan-09 (qr)
Treasuries Corp Bonds GSEs Equity Total
Source: U.S. Treasury ‘TICS’ database.

Emerging market currencies down vs the dollar over 2009 to date
percentage change (USD per LCU) (%)
-30 -25 -20 -15 -10 -5 0 5
Rus Rbl
Pol zty
Hun frt
Mex pso
Cze crn
Tur lra
Brz rei
Ind rpe
Mys rgt
Indo rph
US NEER
Source: Thomson/Datastream.
The External Environment for Developing Countries
March 2009The World Bank
Development EconomicsProspects Group