Embed Size (px)
Citation preview

The fading abnormal returns of momentum strategies
Thomas Henker, Martin Martens and Robert Huynh*
First version: January 6, 2006 This version: November 20, 2006
We find increasingly large variations in returns from momentum strategies in recent years. Momentum strategies did not earn significant excess returns during the period of 1993-2004 which was due to their poor performance over the period from 2001-2004. Using sub-samples of smaller capitalization stocks increases momentum portfolio returns and reduces return volatity. We also evaluate momentum portfolios that are formed prior to the end of month portfolio formation universally used in the academic literature. Consistent with institutional momentum trading affecting end of month returns and volatility, we find that ‘front-running’ a momentum strategy generates similar, but less volatile returns than following a month-end strategy. JEL Classifications: Keywords: Momentum portfolio, front-running, abnormal return, portfolio selection
* Thomas Henker and Robert Hyunh are from the University of New South Wales, School of Banking and Finance, UNSW Sydney, NSW 2052, Australia. Martin Martens is from the Econometric Institute, Erasmus University Rotterdam, P.O. Box 1738, 3000 DR Rotterdam, The Netherlands. Corresponding author: Thomas Henker tel: +61 2 9385-5854, fax: +61 2 9385-6347, e-mail: [email protected]. We would like to thank participants of the 2006 Financial Management Association conference in Salt Lake City and the 2006 Australasian Fi nance and Banking Conference in Sydney for helpful comments and suggestions. The usual disclaimer applies.

Abstract
We find increasingly large variations in returns from momentum strategies in recent
years. Momentum strategies did not earn significant excess returns during the period of 1993-
2004 which was due to their poor performance over the period from 2001-2004. Using sub-
samples of smaller capitalization stocks increases momentum portfolio returns and reduces
return volatility. We also evaluate momentum portfolios that are formed prior to the end of
month portfolio formation universally used in the academic literature. Consistent with
institutional momentum trading affecting end of month returns and volatility, we find that
‘front-running’ a momentum strategy generates similar, but less volatile returns than
following a month-end strategy.
1. Introduction
Ever since the publication of the original Jegadeesh and Titman (1993) study
momentum strategies have captured the interest of finance academics and professionals alike.
The promise of risk-less arbitrage profits has led many investors to pursue momentum
investment strategies and many academics to search for possible causes for the pervasive
existence of these returns. We examine whether the widespread use and attention given to
momentum strategies has changed the profitability of these strategies in various samples for
shorter investment periods more likely to match the investment horizons of investors. If
institutional momentum trading affects month-end stock prices, evaluating a momentum
strategy prior to the month-end could generate returns in excess of that achieved by a regular
month-end strategy and also reduce the volatility of these returns. To explore this idea we
construct ‘front-running’ momentum strategies where we form momentum portfolios five
business days before the month-end. We then compare the return of these strategies with
those of conventional month-end strategies.
1

In contrast to previous studies using older data, we find that momentum returns are
not significant for our entire 12 year sample period. The widespread use of momentum
strategies has apparently reduced the profitability of the strategies based on the broad market,
large stocks and exchange controlled sub-samples. Excess returns that may be able to
overcome transaction costs were still achievable in size-controlled small and medium
company sub-samples. We find that the lack of excess returns is due to the period during and
after the market crash experiencing unusually low momentum returns in particular if the
sample includes large Nasdaq stocks in the period after 2000.
Consistent with institutional momentum trading affecting end of month returns, we
find that ‘front-running’ a momentum strategy generates economically significant returns in
excess of a month-end strategy only for small firms, but the returns of a ‘front-running’
strategies are consistently less volatile than those of the equivalent month-end strategies. The
‘front-running’ effect is most pronounced when we use a three-month ranking period.
Jegadeesh and Titman (1993) first reported that self-financing trading strategies that
buy stocks that had performed well in the past three to twelve months and sell stocks that had
performed poorly in that period realize significant returns. Refinements of the basic strategy
include a gap or skip period between the ranking and holding periods to avoid contamination
of the results by microstructure effects and the bid-ask bounce [Jegadeesh (1990) and
Lehmann (1990)]. Jegadeesh and Titman report that the returns of all the momentum
strategies they examine are positive and statistically significant, obtaining profits for self
financing portfolios of approximately one percent per month. They also find that momentum
strategies earn significant profits in small, medium and large firm, and across beta-based sub
samples. Further, Jegadeesh and Titman find that the abnormal performance of momentum
strategies is due to the long side of the portfolio, rather than the short side which suggests that
momentum profits are indeed obtainable for investors.
2

Momentum returns have subsequently been documented by a large number of follow-
up studies. For example, Rouwenhorst (1998) examines the momentum return patterns of 12
European markets over the period of 1978 through 1995. Replicating the methodology of
Jegadeesh and Titman (1993), he finds that an internationally diversified momentum portfolio
generates similar returns to that documented by Jegadeesh and Titman, with a return of
approximately one percent per month. Rouwenhorst also finds positive and significant returns
in individual country sub samples with the exception of Sweden. Momentum is indeed
pervasive and not restricted to a few individual markets. As with Jegadeesh and Titman,
Rouwenhorst finds that market risk is unable to explain momentum returns and that
momentum profits are present in both large and small-capitalization firms. Due to the high
correlation between the US market and the European markets examined, momentum could be
explained by a factor common to these markets. To analyze this concern, Chui, Titman and
Wei (2000) examine momentum returns in eight Asian countries with lower correlation with
the US market in one composite sample, finding a weak momentum effect. Excluding
Japanese stocks from the sample, Chui et al. find that the momentum effect is strong and
statistically significant, returning 1.45 % per month in the 1975-1997 sub period1. Griffin, Ji
and Martin (2003, 2005) further broaden the country sample and examine the profitability of
momentum strategies in the 40 countries with more than 50 stocks listed on the DataStream
International database. They also find that momentum strategies are generally profitable
across the countries examined, with momentum returns highly significant in Africa, the
Americas (excluding the US), Europe and the US but not in Asia.2
1 Chui et al. actually examine momentum returns over the 1975-2000 period. However, momentum returns were markedly different in the 1997-2000 subperiod after the Asian financial crisis., with an insignificant return of 0.530% per month. 2 Daniel, Hirshleifer, and Subrahmanyam (1998) suggest that the weak momentum effects observed in Asian markets is reflective of the low levels of biased self-attribution in these markets.
3

To examine whether the momentum anomaly is restricted to their original sample,
Jegadeesh and Titman (2001) obtain nine additional years of data (relative to their 1993
study) and perform an out-of-sample test of their original findings. They find that momentum
strategies are profitable over the post-sample period of 1990-1998, with a (significant)
monthly return of 1.39%. This compares favorably to the sample period (1965-1989) return
of 1.17%. Jegadeesh and Titman also find that the momentum effect has continued in the
1990s for both large and small stocks. Similarly, Griffin et al. (2003) find that momentum
returns are profitable around the world in a sub sample of 1990-2000. These results suggest
that momentum profits continued to exist since publication of their original paper and that
market participants have not altered their investment strategies in a way that would eliminate
momentum returns.
Given the extensive out-of-sample evidence that has documented momentum from
both geographic and temporal perspectives, the presence and robustness of momentum
returns is widely acknowledged. Indeed, Grinblatt and Moskowitz (2004) note that data
biases cannot explain momentum returns.
However, to date almost no research has been conducted on the pattern of momentum
returns during the boom period of the late 1990’s and the following market crash. One
exception is Boni and Womack (2004), who find insignificant momentum returns over the
1996-2002 period. However, Boni and Womack do not examine momentum returns in any
detail, with the focus of their study on analyst recommendations.
While the presence of momentum is widely accepted, there is no consensus on the
source and cause of momentum returns. Proposed explanations fall into three different
categories: priced risk factors in the arbitrage portfolio, industry momentum, and transaction
costs. Explanations based on priced risk factors have been examined among others by
Chordia and Shivakumar (2002), Fama and French (1996), Grundy and Martin (2001) but
4
none of the models can fully explain momentum portfolio returns. Carhard (1997) even
suggests to add a momentum factor to the Fama and French three-factor model. He finds that
this model is a substantial improvement on the CAPM and the three-factor model. Related to
risk factors are explanations based on industry factors causing stock level momentum. These
explanations suggests that the returns of momentum strategies are simply a compensation for
industry risk as the winner and loser portfolios tend to be concentrated in a few industries.
Examples for such industry momentum studies are Moskowitz and Grinblatt (1999),
Lewellen (2002), Scowcroft and Sefton (2005), and O’Neal (2000). Findings of industry
momentum are often strengthened if value weighted rather than equally weighted portfolios
are used in these studies. In summary, industry momentum cannot sufficiently explain
momentum returns of portfolios dominated by small stocks. Transaction costs where
considered by Jegadeesh and Titman (1993) and Hong, Lim and Stein (2000) as explanation
for why momentum returns continue to exist, but both papers find returns of momentum
portfolios in excess of transaction costs. In addition behavioral explanations such a positive
feedback trading or herding provide another possible explanation why momentum returns
exist although only limits to arbitrage can explain why these returns continue to exist.
The paper proceeds as follows, the next section describes the data followed by the
methodology, results are presented in section four and section five concludes.
2. Data
Our dataset consists of daily stock return data obtained from the Center for Research
in Security Prices (CRSP). The sample is then constructed from all stocks traded on the New
York Stock Exchange (NYSE), American Stock Exchange (AMEX) and Nasdaq stock
exchange excluding ADRs, REITs, closed-end funds, primes and scores and foreign
incorporated companies. We obtain monthly holding period returns for each security by
compounding the daily returns recorded by CRSP. The monthly returns take into account all
5

distributions received by stockholders and assume reinvestment of any distributions. Our
return data is adjusted for stock splits3, stock dividends, stock distributions, spin-offs, and
rights. In order to classify and sort stocks, we also obtain exchange and market capitalization
from CRSP. Our sample covers the period after publication of the original Jegadeesh and
Titman (1993) paper from January 1993 plus a prior ranking period through to December
2004.
When a stock is delisted, any return subsequent to the delisting is ignored. To
eliminate the bias this generates, we include final month delisting returns in the final month’s
returns. The delisting return is calculated by comparing the value of the security after it
delists from an exchange, with its price on the last day of trading. The amount after delisting
can itself be the off-exchange price, an off-exchange price quote, or the sum of a series of
distribution payments. In our dataset, there are 8,545 stocks that are delisted, merge or change
their ticker symbols during the sample period, representing 52.44% of the stocks in the
dataset. This process minimizes any survivorship or delisting bias.
3. Methodology
3.1. The Construction of Momentum Portfolios
The month-end momentum or relative strength portfolios are constructed using the
methodology of Jegadeesh and Titman (1993). At the start of each month, the ranking or
formation period return of each stock is calculated as the compounded total return over the
past J months. The stocks are hence ranked on:
)1()1)(1( 1)1( −−−− +++= tJtJtit rrrR K (1)
where rt is the month t return on stock i and J is the length of the ranking period in months.
From the universe of stocks, those stocks that have a return history of at least J months and
3 Failing to split adjust returns can severly affect results. Grundy and Martin (2001) find that one reverse stock split in their study reduces momentum profits by –40.625% in that investment month.
6

were traded at both the start and end of the formation period are ranked on their formation
period return. The restriction of the sample to traded stocks does not introduce a bias since all
information necessary is known prior to the investment period.
The stocks are then split into deciles, with the best performing decile referred to as the
‘winner’ portfolio (P1). Correspondingly, the worst performing decile is referred to as ‘loser’
portfolio (P10). Stocks within each portfolio are equally-weighted, and the relative strength
or momentum strategies we examine involve subsequently buying the winner portfolio and
selling the loser portfolio for a holding period of K months. As such, the momentum
strategies are zero-cost, self-financing strategies.
To mitigate the effects of short-term price reversals as reported by Lo and MacKinlay
(1990), Jegadeesh (1990) and Lehmann (1990) we also consider with a one month gap
between the ranking and holding periods. With regards to the specific momentum strategies
examined, past research, including that of Jegadeesh and Titman (1993) and Rouwenhorst
(1998) show the results of different momentum strategies are quite similar, with average
returns of approximately 1 percent per month when a ranking period of 6, 9 or 12 months is
used regardless of the length of the holding period4. Consequently, we only consider
strategies that use either a three-month or six-month ranking period. In all, this yields 16
different strategies.
Consistent with the vast majority of the momentum literature, we use overlapping
portfolios, whereby the investment strategy is followed every month, such that at any month
t, a series of momentum portfolios are held from the previous k-1 months. This entails that for
every month t, the strategy buys the winner portfolio and sells the loser portfolio, as well as
closing out the position initiated in month t-K. For example, during December 2000, the 3/0/3
4 The notation J/S/K denotes the momentum strategy with a ranking period of J months and a holding period of K months. S denotes the length in months of the skip period (if any) between the ranking and holding periods.
7

strategy consists of three different portfolio: the portfolio initiated in December employing a
ranking period of September to November 2000; that initiated in November 2000 based on
ranked returns from August to October 2000; and that initiated in October 2000 on the basis
of returns over the period of July to September 2000. The k individual momentum portfolios
are equally-weighted within the momentum strategy5. The use of overlapping portfolios also
reduces the volatility of momentum returns.
With the passage of time, the value of the individual momentum portfolios will
change, with those portfolios that had performed well during the holding period holding
greater value. To address this issue, Jegadeesh and Titman (1993) use a strategy whereby the
momentum portfolios are rebalanced monthly so that they continue to be equally weighted.
This rebalancing would involve selling a proportion of those portfolios with above average
performance (relative to the other momentum portfolios) during the portion of the holding
period that has elapsed, and with the proceeds buying the poorer performers. If stock prices
exhibit momentum, the sold portfolios will be expected to experience stronger performance
in the future than those bought. Consistent with this argument, Jegadeesh and Titman find
greater returns for a buy-and-hold strategy relative to the strategy where the series of
momentum portfolios are rebalanced monthly. Nevertheless, the difference between the
strategies is negligible, a result not unexpected given the minor difference in methodology.
Accordingly, much of the previous literature examines the returns of momentum strategies
that rebalance the individual momentum portfolios monthly. We will also follow the strategy
of monthly rebalancing. As such, the return of the momentum strategy in any month t is the
average return of the k individual momentum portfolios held in that month.
The holding period return of each individual momentum portfolio is calculated as the
average of the stocks within the portfolio (as the portfolios are equally-weighted). However,
5 Moskowitz and Grinblatt (1999) argue that the use of overlapping portfolios also reduces the effects of the bid-ask bounce, thereby providing cleaner results.
8

as was noted in the previous section a number of stocks within the sample are delisted during
the sample period. Where such stocks are included in momentum portfolios, no additional
returns are attributed to that stock for the balance of its holding period. This is the most
conservative method of handling delistings without introducing a selection bias. Employing
this most conservative technique results in a small bias against finding momentum returns.
3.2. ‘Front-running’ Momentum Portfolios
To date, academic research on the momentum effect has focused on portfolios formed at the
end of the month. The ‘front-running’ relative strength portfolios are constructed in a similar
fashion to that of the regular, month-end momentum portfolios. The fundamental difference
between these portfolios and the month-end portfolios is the portfolio evaluation date.
Conventional month-end momentum strategies rank stocks on their prior return at the end of
each month, such that portfolio positions can be entered at the start of the following month. In
contrast, the ‘front-running strategy’ involves evaluating ranking returns a period of five
business days before the end of the month. The portfolio positions are then entered into the
next business day, five days before the start of the following month. The stocks are hence
ranked on the compounded daily stock return for the month ending five business days before
the end of the month. For example, during April 2004, a normal, month-end momentum
portfolio using a 6/0/6 strategy ranks the universe of common stocks with at least six months
of return data over the period of 31st October 2003 to the 30th April 2004, holding the
resultant momentum portfolio from 1st May 2004 to the 29th October 2004. The
corresponding ‘front-running’ momentum strategy would rank the universe of stocks that
satisfy the above criteria on their performance over the period of 24th October 2003 to the 23rd
April 2004, holding the resultant momentum portfolio from 26th April 2004 to the 22nd
October 2004.
9
3.3 Size Sub samples
As prior research has found that the momentum effect is present in both small and
large-cap sub samples, of interest is whether this has continued in the sample period. As
noted by Jegadeesh and Titman (2001), the robustness of momentum to size sub samples
would provide strong evidence that momentum strategies are actionable. If however,
momentum returns are not present in a specific sub sample, this may indicate that
institutional trading has eliminated momentum returns for those stocks. As liquidity risk and
transaction costs may impede the usage of momentum strategies for smaller stocks, the
presence of momentum returns in large stocks would provide stronger evidence of the
momentum effect.
Size sub samples are also used to investigate whether the ‘front-running’ effect is
greater for any sub sample of stocks. We sort stocks into three groups, small capitalization
stocks, mid-capitalization stocks and large capitalization stocks with reference to the NYSE
market capitalization deciles. Specifically, at the portfolio evaluation date, firms with a
market capitalization that would place it in the two lowest market capitalization deciles of
listed NYSE stocks are classified as small stocks. Firms with a market capitalization above
the median NYSE-listed stock are classified as large stocks, with the remainder classified as
medium stocks.6
4. Results
We find that momentum returns are not significant in the entire 12 year sample
period. This is due to the period during and after the market crash experiencing unexpectedly
low momentum returns. The large firm momentum effect is quite sensitive to the 6 Alternatively, we could sort the stocks such that they contain a set proportion of the sample. However, as our sample includes Nasdaq and AMEX stocks, such a classification would result in the middle subsample consisting almost entirely of small capitalization stocks as Nasdaq and AMEX stocks are generally small. Approximately 60% of the stock months in our sample are for stocks with market capitalizations that would place them in the two lowest NYSE deciles. The use of market capitalization deciles thus results in more distinct subsamples.
10

specification of the sample and strategy. We also find that ‘front-running’ a momentum
strategy generates economically if not statistically significant returns in excess of a month-
end strategy only for small firms, but the returns of a ‘front-running’ strategy are consistently
less volatile than those of an equivalent month-end strategy. The ‘front-running’ effect is
most pronounced when using a three-month ranking period.
Panel A of table 1 presents the average monthly returns from several price momentum
strategies over the period from 1993 to 2004. We report results for the bottom decile portfolio
(R1), the top decile portfolio (R10) and the returns of a winner minus loser portfolio. Panel A
in table 1 shows that across the entire sample period, past winners outperform past losers by
about one percent a month although there is substantial variation in the profitability of
individual momentum strategies. To illustrate, a strategy that ranks stocks on prior three-
month returns and holds the resulting portfolios for three months (i.e. a 3/0/3 strategy) earns
0.28% per month, while a 6/1/3 strategy earns 1.01% per month.
The returns generated by momentum strategies in our study are comparable with those
of previous literature. For example, the oft-studied strategy that ranks stocks on the previous
six month returns and subsequently holds the momentum portfolio for the following six
months (a 6/0/6 strategy) returns an average of 1.01% per month. In comparison, Jegadeesh
and Titman (1993) report a corresponding return of 0.95% per month over the 1965 to 1989
period, whilst Jegadeesh and Titman (2001) report a return of 1.39% per month over the 1990
to 1998 period.
Insert Table 1 here
Although price momentum is still present in our sample, the returns generated by
momentum strategies are not statistically different to zero, with a t-statistic of 1.35 for the
6/0/6 strategy. In comparison, Jegadeesh and Titman (1993) and Jegadeesh and Titman
(2001) report t-statistics of 3.07 and 4.71 for the 6/0/6 strategy. The statistical insignificance
11
of our results is despite the obvious economic significance of the returns reported, with
returns of a self financing portfolio of up 1.01% a month. A closer examination of the results
shows that this is attributable to the highly volatile momentum returns in our sample, with the
standard deviation of momentum returns using a 6/0/6 strategy of 9.01%. Other strategies
have similar (if not higher) standard deviations. Figure 1 plots the monthly time-series of
returns for the 6/0/6 strategy. From the figure, it is readily apparent that the momentum
returns in the sample period are highly volatile explaining the statistical insignificance.
Insert Figure 1 here
The portfolios in Table 1 are formed at the end of the ranking period. Because bid-ask
bounce and other market microstructure effects are likely to attenuate the momentum effect,
we examine the returns of corresponding strategies that contain a ‘skip’ period of one month
between the end of the ranking and the start of the holding period. Previous research (for
example see Jegadeesh and Titman, 1993 and Rouwenhorst, 1998) has shown that such
strategies are superior to those that hold the momentum portfolios immediately. Significance
of these strategies would indicate that short-term microstructure effects and return reversals
are contaminating the intermediate-term price continuation effect. The results of strategies
including a one month skip period between the ranking and holding period are reported in
Panel B of table 1.
Consistent with prior literature, we find that momentum returns are greater when a
skip period is included. Nevertheless, the returns of all momentum strategies considered are
insignificant at the 5 percent level. We find that a 6/1/6 strategy generates an average return
of 1.17% per month (t-statistic 1.669) which is significant at the 10 percent level. The
standard deviation of returns for this strategy is 8.43%. The results therefore suggest that
although short-term effects attenuate momentum effects in our sample, they cannot explain
the insignificance of momentum returns in the sample period.
12

The results of the previous section indicate that while momentum strategies earn large
returns during the sample period, these returns are not statistically distinguishable from zero
for our sample period. This finding is in contrast to the bulk of the existing literature based on
older datasets, with few if any prior studies documenting insignificant momentum profits in
the US market.7 However, this result is not entirely unexpected since abnormal returns would
be expected to dissipate once investors place trades based on it. Furthermore, our sample
period is characterized by a bull market that resulted in a period of abnormally large
sustained stock market increases, followed by the subsequent market crash after September
2000. The strong stock market trends in the sample period are most pronounced amongst
high-technology firms, which experienced unprecedented growth in the late 1990’s and early
2000, a period commonly referred to as the ‘tech-boom’. The subsequent crash in technology
stocks beginning in March 2000 resulted in the Nasdaq declining almost 80% over the
following eighteen months.
To investigate the effects of the tech crash on momentum returns, we next examine
momentum returns over four-year sub periods. Table 2 documents the returns of the 6/1/6
strategy in each of the three four-year sub periods in the 1993 to 2004 sample. Our results
indicate that momentum returns are positive and significant in the 1993 to 1996 and 1997 to
2000 periods. However, during the 2001 to 2004 period, momentum returns are negligible,
with a winner minus loser portfolio returning 0.08% over this period. This indicates that the
insignificant momentum result for the entire sample period is a result of the non-existent
return subsequent to the tech crash and the increasing prevalence of momentum trading.
Insert Table 2 here
7 We are aware of only two studies that have documented insignificant momentum returns in the US. In the first, Chen et al. (2002) find that an equally-weighted 12/0/12 momentum strategy does not generate excess returns to the market over the 1963 to 2000 subperiod. In a more recent study, Boni and Womack (2004) find that an equally-weighted 6/1/6 strategy does not earn significant returns in the 1996 to 2002 period. But their paper focuses on the information value of analyst recommendations.
13

As the stock market crash of 2000 was most pronounced in the smaller, high-tech
firms, it is of interest whether the poor momentum return in the 2001 to 2004 sub period is
confined to smaller or high-tech stocks.
4.1 Size Sub samples
We first examine the returns of momentum strategies that exclude all stocks with
market capitalizations that would place them in either of the two smallest NYSE market
capitalization deciles. Given that momentum returns are not significant within our sample,
eliminating small firms serves to examine whether small or illiquid firms or bid-ask bounce
are contaminating our results.
Panel A of Table 3 presents the returns of the 6/1/6 strategy where the small
capitalization stocks are eliminated from the sample. The results reveal that eliminating small
stocks from the sample leads to a significant momentum return of 1.56% for the 6/1/6
strategy. Not only is this return less volatile than that of the full sample, but it is also
substantially larger. This suggests that momentum returns in our sample are weaker in small
capitalization stocks, in contrast to prior studies.
Insert Table 3 here
To examine the relationship between momentum and firm size in detail, we sort firms
by size and construct momentum portfolios for each size sub sample. Table 3 Panels B, C and
D report the average returns of a 6/1/6 strategy for small, medium and large firms
respectively. Consistent with Jegadeesh and Titman (1993), we find that momentum returns
are somewhat related to firm size. As implied by Panel A, momentum returns are weaker for
small stocks, with a marginally significant return of 1.15%. For the medium and large firms,
momentum returns are significant and 1.70% and 1.46% respectively. These results indicate
that the momentum effect has continued to exist in the period of 1993 to 2004 for all size sub
samples. The widespread use of momentum strategies subsequent to the initial Jegadeesh and
14

Titman (1993) finding of momentum has not eliminated momentum returns in the sample of
12 years.
Consistent with prior literature, we find that momentum returns are greatest for
medium-size firms. Nonetheless, in contrast to Jegadeesh and Titman (1993, 2001), we find
that momentum returns are greater in large firms than in small firms. The momentum return
for large firms within our sample is almost twice the 0.75% reported by Jegadeesh and
Titman (1993). An analysis of the sub period results shows that the large firm momentum
strategy earns significant returns in only the 1997 to 2000 sub period. Finally, we note that
the return of the large firm momentum strategy is predominantly driven by the loser portfolio.
For large firms, the winners outperform the value-weighted (equal-weighted) index by 0.37%
(-0.209%) per month, whereas the losers underperform the value-weighted (equal-weighted)
index by 1.09% (1.66%) per month.
The sub period returns show that while small and mid-size momentum strategies were
profitable during the 1993 to 1996 and 1997 to 2000 sub periods, their returns over the 2001
to 2004 sub period are not significantly different from zero. The insignificant momentum
return for the 2001 to 2004 sub period is robust to the choice of ranking and holding periods,
with many of the small firm strategies earning negative returns over this sub period. The poor
momentum return over the 2001 to 2004 sub period is not restricted to any size sub sample.
Nevertheless, the returns for small firms during this sub period are uniformly lower than that
of both medium and large firms.
The inclusion of Nasdaq-listed stocks in the sample is rare in the momentum
literature. To assess whether our results are due to the inclusion of Nasdaq-listed stocks in our
sample, we examine the returns of a sub sample including only stocks listed on the NYSE or
AMEX, and one consisting entirely of stocks listed on Nasdaq.
Insert Table 4 here
15
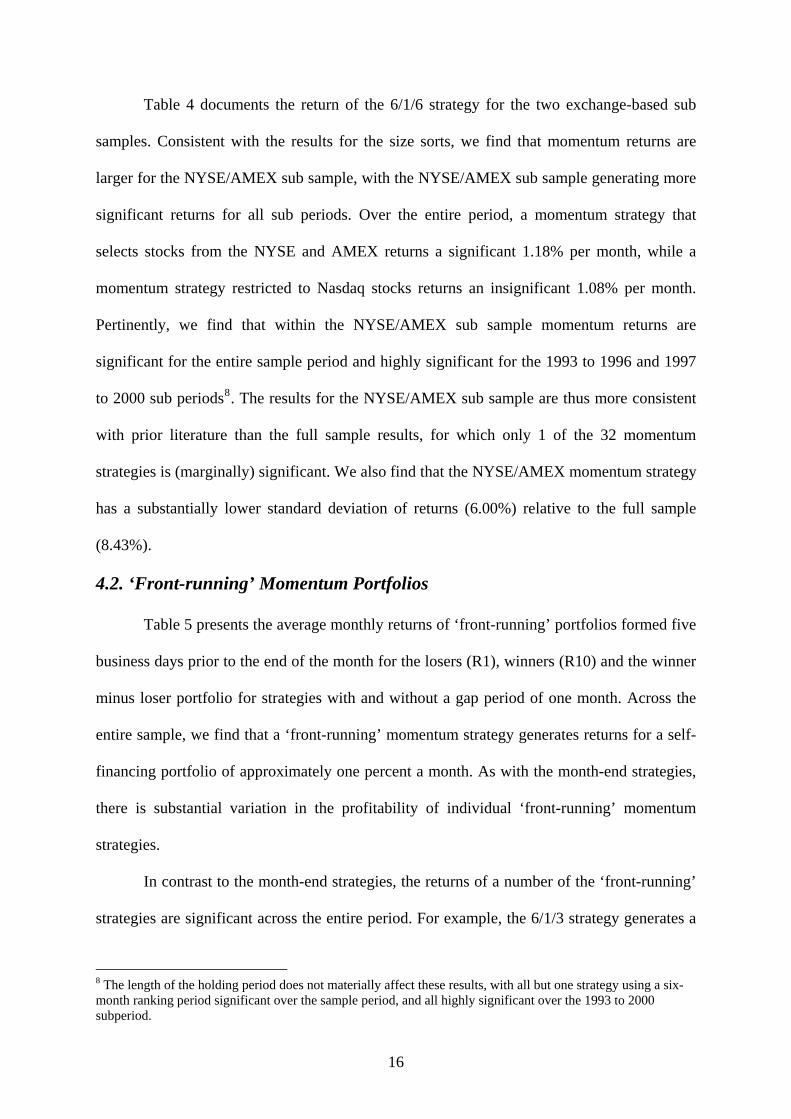
Table 4 documents the return of the 6/1/6 strategy for the two exchange-based sub
samples. Consistent with the results for the size sorts, we find that momentum returns are
larger for the NYSE/AMEX sub sample, with the NYSE/AMEX sub sample generating more
significant returns for all sub periods. Over the entire period, a momentum strategy that
selects stocks from the NYSE and AMEX returns a significant 1.18% per month, while a
momentum strategy restricted to Nasdaq stocks returns an insignificant 1.08% per month.
Pertinently, we find that within the NYSE/AMEX sub sample momentum returns are
significant for the entire sample period and highly significant for the 1993 to 1996 and 1997
to 2000 sub periods8. The results for the NYSE/AMEX sub sample are thus more consistent
with prior literature than the full sample results, for which only 1 of the 32 momentum
strategies is (marginally) significant. We also find that the NYSE/AMEX momentum strategy
has a substantially lower standard deviation of returns (6.00%) relative to the full sample
(8.43%).
4.2. ‘Front-running’ Momentum Portfolios
Table 5 presents the average monthly returns of ‘front-running’ portfolios formed five
business days prior to the end of the month for the losers (R1), winners (R10) and the winner
minus loser portfolio for strategies with and without a gap period of one month. Across the
entire sample, we find that a ‘front-running’ momentum strategy generates returns for a self-
financing portfolio of approximately one percent a month. As with the month-end strategies,
there is substantial variation in the profitability of individual ‘front-running’ momentum
strategies.
In contrast to the month-end strategies, the returns of a number of the ‘front-running’
strategies are significant across the entire period. For example, the 6/1/3 strategy generates a
8 The length of the holding period does not materially affect these results, with all but one strategy using a six-month ranking period significant over the sample period, and all highly significant over the 1993 to 2000 subperiod.
16
significant positive return when a ‘front-running’ evaluation date is used, whereas the
corresponding month-end strategy produces an insignificant return. In general, the
momentum returns of ‘front-running’ strategies are broadly similar to, if not slightly greater
than their equivalent month-end momentum strategies. In addition, the ‘front-running’
strategies are less volatile than the month-end strategies, with a lower standard deviation for
all of the 32 strategies examined.
The uniformly lower standard deviation of the ‘front-running’ strategies is particularly
interesting, as it indicates that there is increased return volatility at the end of the month,
consistent with institutional trading impacting on returns.
Insert Table 5 here
When using a three-month ranking period, the returns of ‘front-running’ momentum
strategies are higher than the corresponding month-end strategies for all investment horizons
with or without a gap period. The excess return of the ‘front-running’ momentum strategies
over their month-end counterparts ranges from an annualized return of 0.34% to 2.77%. The
magnitude of these differences suggests that using a ‘front-running’ strategy may generate
economically albeit not statistically significant returns in excess of a month-end strategy with
lower volatility. The t-statistic of all such strategies are higher when using a ‘front-running’
strategy, and of the strategies that employ a three-month ranking period, the returns of two
are statistically significant using a ‘front-running’ strategy. In contrast, none of the
corresponding month-end strategies generated significant returns. Indeed, consistent with our
hypothesis, the ‘front-running’ effect appears to be strongest in momentum strategies that use
a three-month ranking period. Conversely, the returns of ‘front-running’ strategies that use 6,
9 or 12 month ranking criteria are virtually identical to the equivalent month-end strategy.
It is possible that the insignificant differences of returns in Table 5 are caused by the
returns of the ‘front-running’ portfolio being contaminated by stocks that are not affected by
17

institutional momentum trading. If this is the case, restricting the sample to those stocks
likely to experience momentum trading should lead to a more distinct ‘front-running’ effect.
To this end, prior research has suggested that momentum trading is predominantly a winners
phenomena (Badrinath and Wahal, 2002), which is itself primarily a large firm phenomena
(Grinblatt et al., 1995). As such, one would expect that the ‘front-running’ effect would be
greater amongst large cap winners.
We examine the returns of month-end and ‘front-running’ momentum strategies for a
sub sample of large stocks. As previously noted, prior studies suggest that the ‘front-running’
effect would be strongest when a three-month ranking period is used. As our results also
indicate that the ‘front-running’ effect is strongest when a three-month ranking period is used,
we limit our analysis in this and following sections to ‘front-running’ strategies that use a
three-month ranking period.
The results in the leftmost of Table 6 indicate that the ‘front-running’ effect is not
more pronounced in large capitalization stocks nor can it be attributed to large capitalization
winners. Rather, we find that ‘front-running’ strategies have lower returns, standard
deviations and t-statistics amongst large capitalization stocks as compared to analogous
month-end strategies. Interestingly, the results also indicate that the momentum effect is not
present for large stocks within the period of 1993 to 2004 when using a three-month ranking
criterion. This implies that the large firm momentum effect is sensitive to the specification of
the ranking period.
Our findings suggest that momentum trading does not affect the return series of large
capitalization stocks as predicted. However, we note that momentum trading may not exert
significant price pressure on large capitalization stocks. In addition, the age of the Grinblatt et
al. (1995) findings raise the question of their applicability to the market of the recent past.
Recently, momentum trading is more likely to impact on small capitalization stocks, as these
18

are more likely to be affected by institutional trading imbalances. Indeed, Wermers (1999)
find that both herding and the relationship between institutional ownership and
contemporaneous returns is strongest in small stocks. Consequently, we also investigate
‘front-running’ momentum returns in small and medium capitalization stocks to examine
whether ‘front-running’ leads to greater returns. These results are reported in the rightmost
columns of Table 6.
Insert Table 6 here
For the small capitalization stocks, we find that a ‘front-running’ strategy generates
consistently higher returns, with the excess return peaking at 0.23% for the 3/0/3 strategy.
Further, the returns of the ‘front-running’ strategies are more significant than the month-end
strategies, with the 3/1/12 strategy (marginally) significant only when a ‘front-running’
strategy is used. Similarly, the 3/1/6 and 3/1/9 strategies are significant when a ‘front-
running’ strategy is used, whereas they are only marginally significant for the month-end
strategies. In general, the difference in returns is insignificantly larger for strategies that form
the portfolios immediately, with an average return difference of 0.13% per month compared
to 0.07% when the portfolio formation is delayed by a month. An analysis of the return
difference shows that the superior returns of the ‘front-running’ strategies are primarily
driven by the lower return of the loser portfolio relative to the month-end momentum
strategies. This is in contrast to our hypothesis.
For the medium size firms, ‘front-running’ momentum returns are similar to the
month-end counterparts for the medium size firms. This suggests that a ‘front-running’
strategy only generate an excess return relative to a month-end strategy for small firms. As
bid-ask bounce and infrequent trading is more prevalent for such stocks, we cannot rule out
that the increased returns generated by a ‘front-running’ strategy are due to stock illiquidity.
19
The ‘front-running’ strategies have lower standard deviations in all size sub samples, and for
all strategies examined within each size sub sample.
5. Conclusions
We find a large variability in returns from momentum strategies during the period of
1993 to 2004. Momentum strategies based on the broad market did not earn significant
returns which was due to their particularly poor performance over the period from 2001 to
2004. Returns of momentum portfolios restricted to NYSE and AMEX stocks are stronger
than when Nasdaq stocks are included. We find that the previously documented large firm
momentum effect is sensitive to the momentum strategy examined, and is in our sample
driven by the abnormal returns of large Nasdaq listed stocks. Momentum returns continue to
exist for the small and medium sized company sub-sample We also evaluate momentum
strategies that do not adhere to the end of month portfolio formation universally used in the
academic literature. We form portfolios one week prior to the end of month and call them
‘front-running’ momentum portfolios. Consistent with institutional momentum trading
affecting end of month returns and volatility, we find that ‘front-running’ a momentum
strategy generates economically significant returns in excess of a month-end strategy for
small firms. The returns of a ‘front-running’ strategy are consistently less volatile than that of
an equivalent month-end strategy. For all samples momentum portfolio returns are found to
be fading in the most recent period from 2001 to 2004.
20

6. Bibliography
Badrinath S.G., Wahal S., 2002, Momentum Trading by Institutions, Journal of Finance, Vol. 57, Issue 6 (Dec), p2449,-2478.
Boni L, Womack K, 2004, Analysts, Industries and Price Momentum, working paper.
Carhart, M., 1997. On persistence in mutual fund performance, Journal of Finance 52, 57–82.
Chordia, T., Shivakumar, L., 2002. Momentum, business cycle, and time-varying expected returns. Journal of Finance 57, 985–1019.
Chui, Andy C. W., Sheridan Titman, K. C. John Wei, 2000, Momentum, Legal Systems and Ownership Structure: An Analysis of Asian Stock Markets, Working paper, University of Texas at Austin.
Fama, E.F., French, K.R., 1996. Multifactor explanations of asset pricing anomalies, Journal of Finance, 51, 55–84.
Griffin JM, Ji S, Martin S, 2005, Global Momentum Strategies A Portfolio Perspective, forthcoming in the Journal of Portfolio Management, Winter 2005.
Griffin, J.M., Ji, X., Martin, J.S., 2003. Momentum investing and business cycle risk: evidence from pole to pole. Journal of Finance 58, 2515–2548.
Grinblatt M, Titman S, Wermers R, 1995, Momentum Investment Strategies, Portfolio Performance, and Herding: A Study of Mutual Fund Behavior, American Economic Review, Vol. 85 Issue 5, p1088-1105.
Grinblatt M., Moskowitz T, 2004, What do we really know about the cross-sectional relation between past and expected returns?, Journal of Financial Economics, 71, 541
Grundy, B.D., Martin, J.S., 2001. Understanding the nature of the risks and the source of the rewards to momentum investing. Review of Financial Studies 14, 29–78.
Hong, H., Lim, T., Stein, J.C., 2000. Bad news travels slowly: size, analyst coverage, and the profitability of momentum strategies. The Journal of Finance 55, 265–296.
Jegadeesh, N., 1990. Evidence of predictable behavior of security returns. Journal of Finance 45, 881–898.
Jegadeesh, N., Titman, S., 1993. Returns to buying winners and selling losers: implications for stock market efficiency. Journal of Finance 48, 65–91.
Jegadeesh, N., Titman, S., 2001. Profitability of momentum strategies: an examination of alternative explanations. Journal of Finance 56, 699–720.
Lehmann, 1990, Fads, Martingales, and Market Efficiency, Quarterly Journal of Economics, 105:1, 1-28
21

Lewellen J , 2002, Momentum and autocorrelation in stock returns, Review Of Financial Studies 15 (2): 533-563
Lo, A.W., MacKinlay, A.C., 1990, When are contrarian profits due to stock market overreaction?, Review of Financial Studies 3, 175– 205.
Moskowitz, T.J., Grinblatt, M., 1999. Do industries explain momentum?, Journal of Finance 54, 1249–1290.
O’Neal, E.S, 2000, Industry Momentum and Sector Mutual Funds, Financial Analysts Journal, 56:4, 37-46.
Rouwenhorst, K.G., 1998. International momentum strategies. Journal of Finance 53, 267–284.
Scowcroft A, Sefton J, 2005, Understanding Momentum, Financial Analysts Journal 61, 2, p64.
Wermers, R, 1999, Mutual fund herding and the impact on stock prices, Journal of Finance 54, 581–622.
22
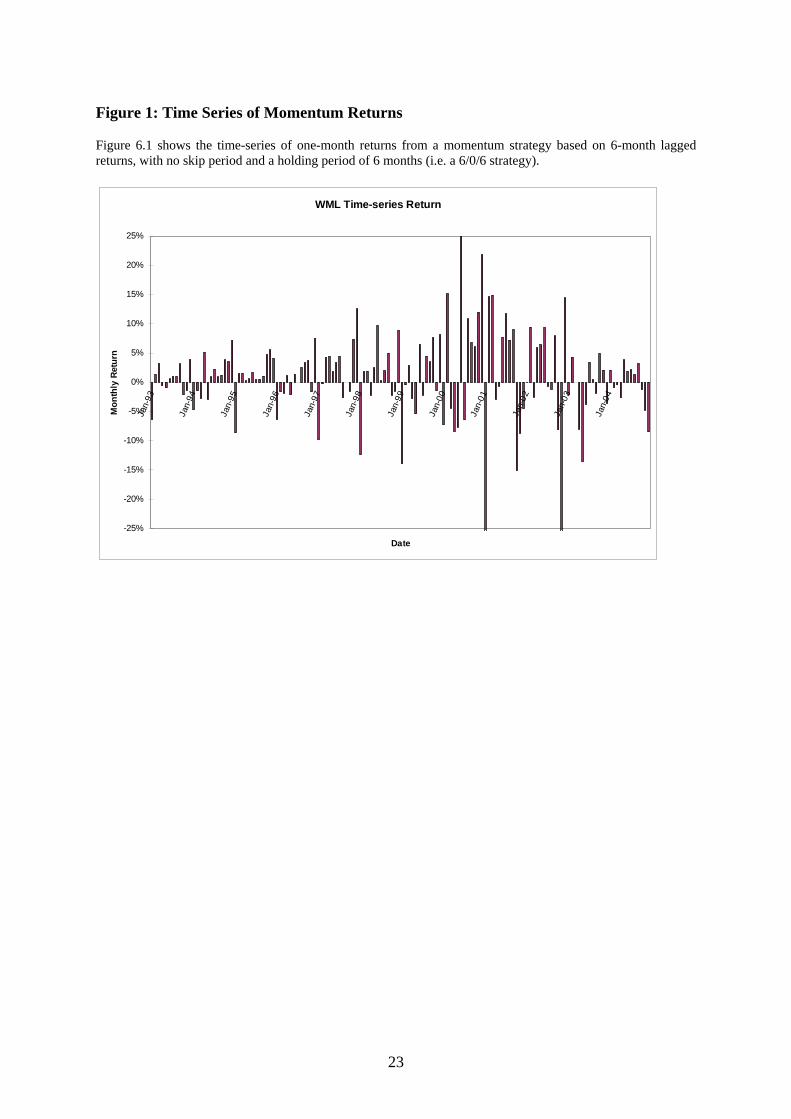
Figure 1: Time Series of Momentum Returns
Figure 6.1 shows the time-series of one-month returns from a momentum strategy based on 6-month lagged returns, with no skip period and a holding period of 6 months (i.e. a 6/0/6 strategy).
WML Time-series Return
-25%
-20%
-15%
-10%
-5%
0%
5%
10%
15%
20%
25%
Jan-
93
Jan-
94
Jan-
95
Jan-
96
Jan-
97
Jan-
98
Jan-
99
Jan-
00
Jan-
01
Jan-
02
Jan-
03
Jan-
04
Date
Mon
thly
Ret
urn
23
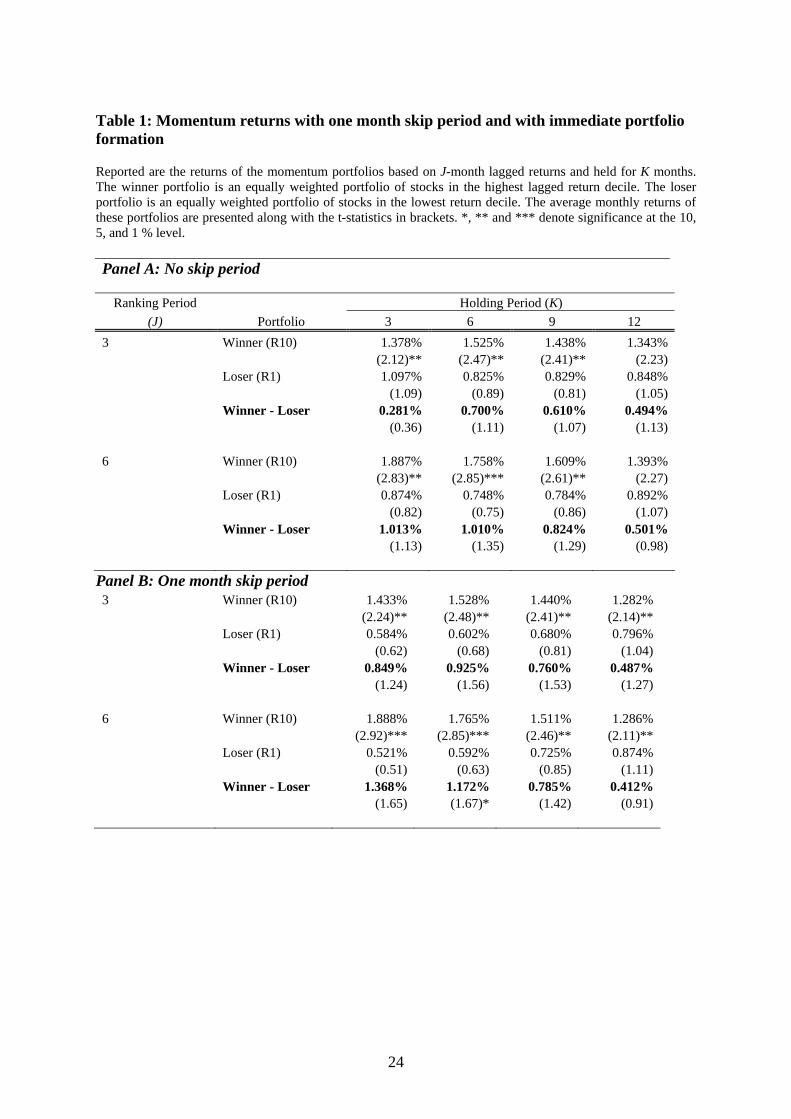
Table 1: Momentum returns with one month skip period and with immediate portfolio formation
Reported are the returns of the momentum portfolios based on J-month lagged returns and held for K months. The winner portfolio is an equally weighted portfolio of stocks in the highest lagged return decile. The loser portfolio is an equally weighted portfolio of stocks in the lowest return decile. The average monthly returns of these portfolios are presented along with the t-statistics in brackets. *, ** and *** denote significance at the 10, 5, and 1 % level. Panel A: No skip period
Ranking Period Holding Period (K)
(J) Portfolio 3 6 9 12 3 Winner (R10) 1.378% 1.525% 1.438% 1.343% (2.12)** (2.47)** (2.41)** (2.23) Loser (R1) 1.097% 0.825% 0.829% 0.848% (1.09) (0.89) (0.81) (1.05) Winner - Loser 0.281% 0.700% 0.610% 0.494% (0.36) (1.11) (1.07) (1.13) 6 Winner (R10) 1.887% 1.758% 1.609% 1.393% (2.83)** (2.85)*** (2.61)** (2.27) Loser (R1) 0.874% 0.748% 0.784% 0.892% (0.82) (0.75) (0.86) (1.07) Winner - Loser 1.013% 1.010% 0.824% 0.501% (1.13) (1.35) (1.29) (0.98)
Panel B: One month skip period 3 Winner (R10) 1.433% 1.528% 1.440% 1.282% (2.24)** (2.48)** (2.41)** (2.14)** Loser (R1) 0.584% 0.602% 0.680% 0.796% (0.62) (0.68) (0.81) (1.04) Winner - Loser 0.849% 0.925% 0.760% 0.487% (1.24) (1.56) (1.53) (1.27) 6 Winner (R10) 1.888% 1.765% 1.511% 1.286% (2.92)*** (2.85)*** (2.46)** (2.11)** Loser (R1) 0.521% 0.592% 0.725% 0.874% (0.51) (0.63) (0.85) (1.11) Winner - Loser 1.368% 1.172% 0.785% 0.412% (1.65) (1.67)* (1.42) (0.91)
24
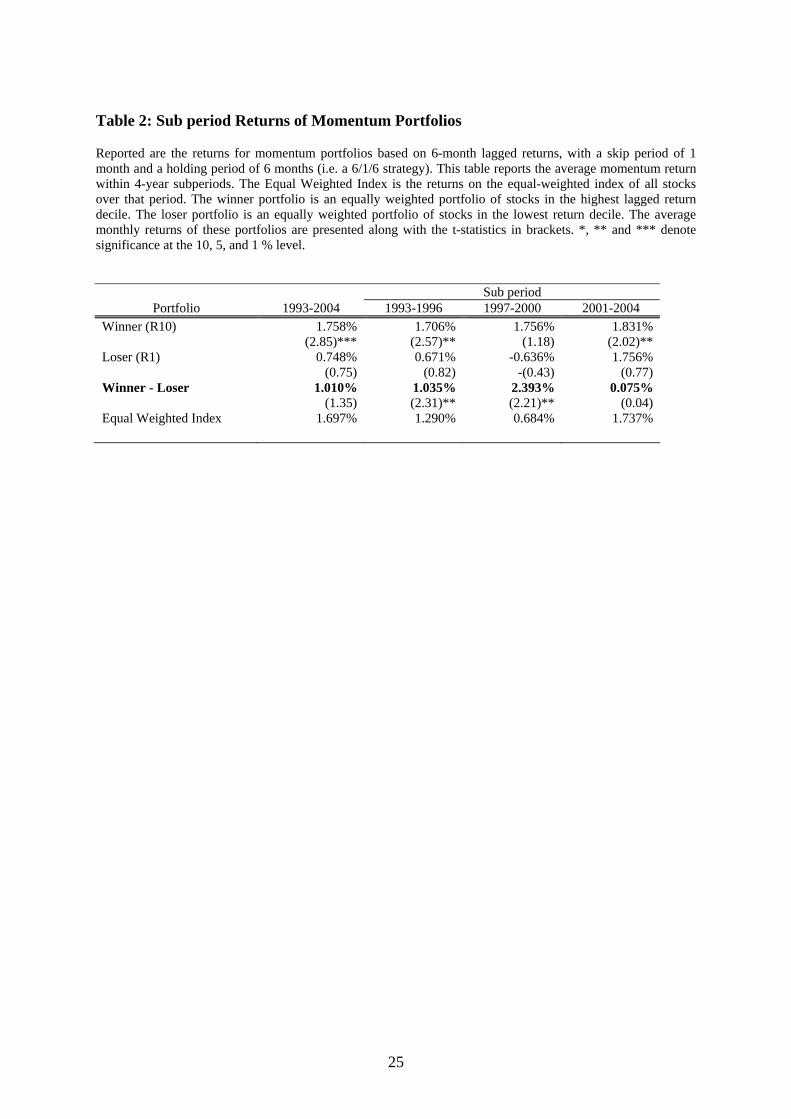
Table 2: Sub period Returns of Momentum Portfolios
Reported are the returns for momentum portfolios based on 6-month lagged returns, with a skip period of 1 month and a holding period of 6 months (i.e. a 6/1/6 strategy). This table reports the average momentum return within 4-year subperiods. The Equal Weighted Index is the returns on the equal-weighted index of all stocks over that period. The winner portfolio is an equally weighted portfolio of stocks in the highest lagged return decile. The loser portfolio is an equally weighted portfolio of stocks in the lowest return decile. The average monthly returns of these portfolios are presented along with the t-statistics in brackets. *, ** and *** denote significance at the 10, 5, and 1 % level.
Sub period
Portfolio 1993-2004 1993-1996 1997-2000 2001-2004 Winner (R10) 1.758% 1.706% 1.756% 1.831% (2.85)*** (2.57)** (1.18) (2.02)** Loser (R1) 0.748% 0.671% -0.636% 1.756% (0.75) (0.82) -(0.43) (0.77) Winner - Loser 1.010% 1.035% 2.393% 0.075% (1.35) (2.31)** (2.21)** (0.04) Equal Weighted Index 1.697% 1.290% 0.684% 1.737%
25
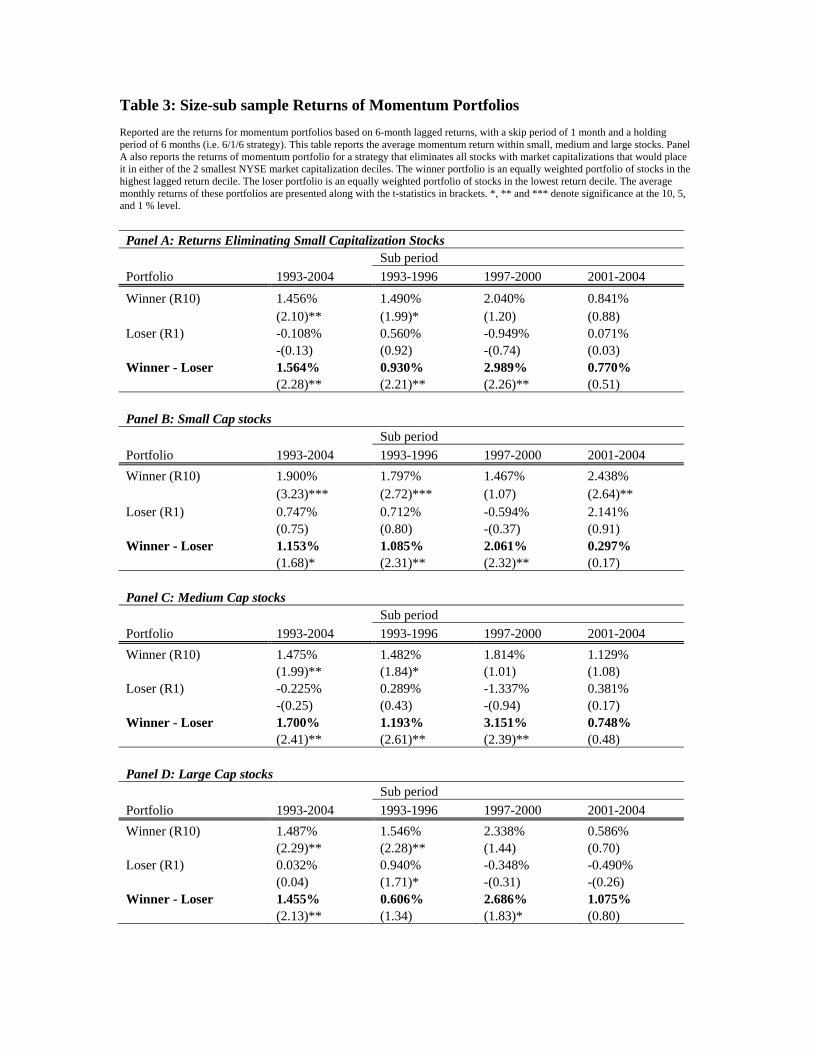
Table 3: Size-sub sample Returns of Momentum Portfolios Reported are the returns for momentum portfolios based on 6-month lagged returns, with a skip period of 1 month and a holding period of 6 months (i.e. 6/1/6 strategy). This table reports the average momentum return within small, medium and large stocks. Panel A also reports the returns of momentum portfolio for a strategy that eliminates all stocks with market capitalizations that would place it in either of the 2 smallest NYSE market capitalization deciles. The winner portfolio is an equally weighted portfolio of stocks in the highest lagged return decile. The loser portfolio is an equally weighted portfolio of stocks in the lowest return decile. The average monthly returns of these portfolios are presented along with the t-statistics in brackets. *, ** and *** denote significance at the 10, 5, and 1 % level. Panel A: Returns Eliminating Small Capitalization Stocks Sub period Portfolio 1993-2004 1993-1996 1997-2000 2001-2004
Winner (R10) 1.456% 1.490% 2.040% 0.841% (2.10)** (1.99)* (1.20) (0.88) Loser (R1) -0.108% 0.560% -0.949% 0.071% -(0.13) (0.92) -(0.74) (0.03) Winner - Loser 1.564% 0.930% 2.989% 0.770% (2.28)** (2.21)** (2.26)** (0.51) Panel B: Small Cap stocks Sub period Portfolio 1993-2004 1993-1996 1997-2000 2001-2004 Winner (R10) 1.900% 1.797% 1.467% 2.438% (3.23)*** (2.72)*** (1.07) (2.64)** Loser (R1) 0.747% 0.712% -0.594% 2.141% (0.75) (0.80) -(0.37) (0.91) Winner - Loser 1.153% 1.085% 2.061% 0.297% (1.68)* (2.31)** (2.32)** (0.17) Panel C: Medium Cap stocks Sub period Portfolio 1993-2004 1993-1996 1997-2000 2001-2004 Winner (R10) 1.475% 1.482% 1.814% 1.129% (1.99)** (1.84)* (1.01) (1.08) Loser (R1) -0.225% 0.289% -1.337% 0.381% -(0.25) (0.43) -(0.94) (0.17) Winner - Loser 1.700% 1.193% 3.151% 0.748% (2.41)** (2.61)** (2.39)** (0.48) Panel D: Large Cap stocks Sub period Portfolio 1993-2004 1993-1996 1997-2000 2001-2004 Winner (R10) 1.487% 1.546% 2.338% 0.586% (2.29)** (2.28)** (1.44) (0.70) Loser (R1) 0.032% 0.940% -0.348% -0.490% (0.04) (1.71)* -(0.31) -(0.26) Winner - Loser 1.455% 0.606% 2.686% 1.075% (2.13)** (1.34) (1.83)* (0.80)
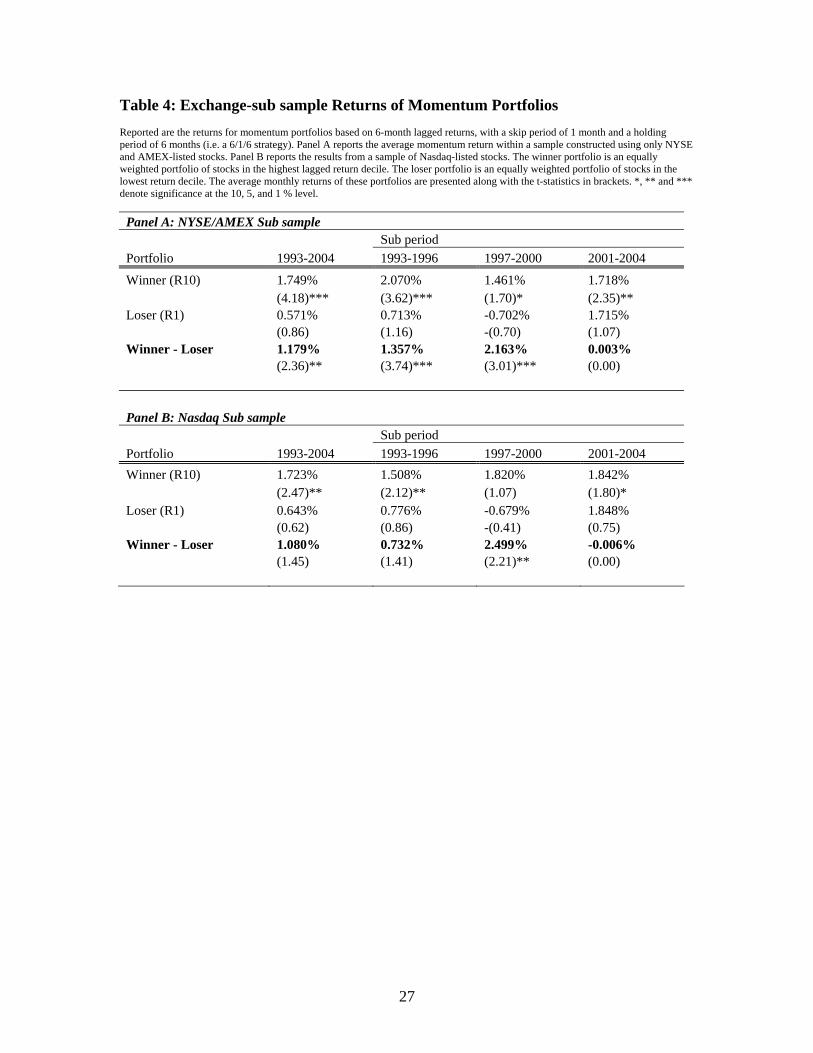
Table 4: Exchange-sub sample Returns of Momentum Portfolios Reported are the returns for momentum portfolios based on 6-month lagged returns, with a skip period of 1 month and a holding period of 6 months (i.e. a 6/1/6 strategy). Panel A reports the average momentum return within a sample constructed using only NYSE and AMEX-listed stocks. Panel B reports the results from a sample of Nasdaq-listed stocks. The winner portfolio is an equally weighted portfolio of stocks in the highest lagged return decile. The loser portfolio is an equally weighted portfolio of stocks in the lowest return decile. The average monthly returns of these portfolios are presented along with the t-statistics in brackets. *, ** and *** denote significance at the 10, 5, and 1 % level. Panel A: NYSE/AMEX Sub sample Sub period Portfolio 1993-2004 1993-1996 1997-2000 2001-2004
Winner (R10) 1.749% 2.070% 1.461% 1.718% (4.18)*** (3.62)*** (1.70)* (2.35)** Loser (R1) 0.571% 0.713% -0.702% 1.715% (0.86) (1.16) -(0.70) (1.07) Winner - Loser 1.179% 1.357% 2.163% 0.003% (2.36)** (3.74)*** (3.01)*** (0.00) Panel B: Nasdaq Sub sample Sub period Portfolio 1993-2004 1993-1996 1997-2000 2001-2004 Winner (R10) 1.723% 1.508% 1.820% 1.842% (2.47)** (2.12)** (1.07) (1.80)* Loser (R1) 0.643% 0.776% -0.679% 1.848% (0.62) (0.86) -(0.41) (0.75) Winner - Loser 1.080% 0.732% 2.499% -0.006% (1.45) (1.41) (2.21)** (0.00)
27
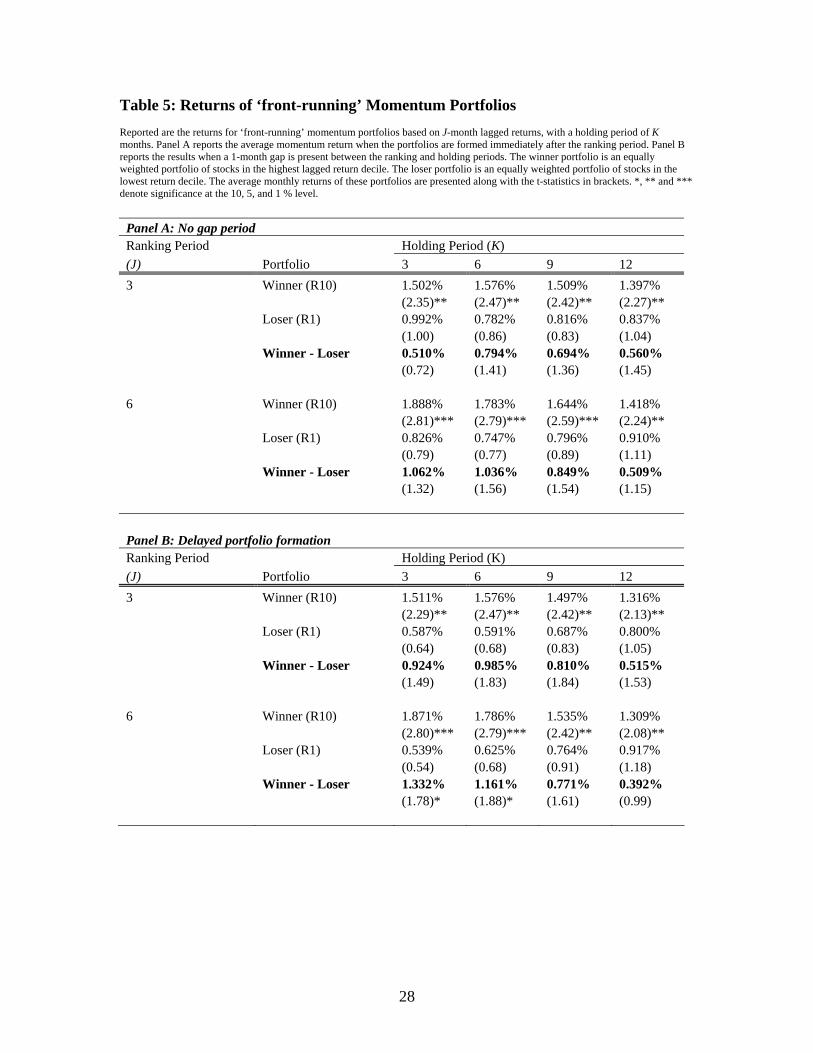
Table 5: Returns of ‘front-running’ Momentum Portfolios Reported are the returns for ‘front-running’ momentum portfolios based on J-month lagged returns, with a holding period of K months. Panel A reports the average momentum return when the portfolios are formed immediately after the ranking period. Panel B reports the results when a 1-month gap is present between the ranking and holding periods. The winner portfolio is an equally weighted portfolio of stocks in the highest lagged return decile. The loser portfolio is an equally weighted portfolio of stocks in the lowest return decile. The average monthly returns of these portfolios are presented along with the t-statistics in brackets. *, ** and *** denote significance at the 10, 5, and 1 % level. Panel A: No gap period Ranking Period Holding Period (K) (J) Portfolio 3 6 9 12 3 Winner (R10) 1.502% 1.576% 1.509% 1.397% (2.35)** (2.47)** (2.42)** (2.27)** Loser (R1) 0.992% 0.782% 0.816% 0.837% (1.00) (0.86) (0.83) (1.04) Winner - Loser 0.510% 0.794% 0.694% 0.560% (0.72) (1.41) (1.36) (1.45) 6 Winner (R10) 1.888% 1.783% 1.644% 1.418% (2.81)*** (2.79)*** (2.59)*** (2.24)** Loser (R1) 0.826% 0.747% 0.796% 0.910% (0.79) (0.77) (0.89) (1.11) Winner - Loser 1.062% 1.036% 0.849% 0.509% (1.32) (1.56) (1.54) (1.15) Panel B: Delayed portfolio formation Ranking Period Holding Period (K) (J) Portfolio 3 6 9 12 3 Winner (R10) 1.511% 1.576% 1.497% 1.316% (2.29)** (2.47)** (2.42)** (2.13)** Loser (R1) 0.587% 0.591% 0.687% 0.800% (0.64) (0.68) (0.83) (1.05) Winner - Loser 0.924% 0.985% 0.810% 0.515% (1.49) (1.83) (1.84) (1.53) 6 Winner (R10) 1.871% 1.786% 1.535% 1.309% (2.80)*** (2.79)*** (2.42)** (2.08)** Loser (R1) 0.539% 0.625% 0.764% 0.917% (0.54) (0.68) (0.91) (1.18) Winner - Loser 1.332% 1.161% 0.771% 0.392% (1.78)* (1.88)* (1.61) (0.99)
28
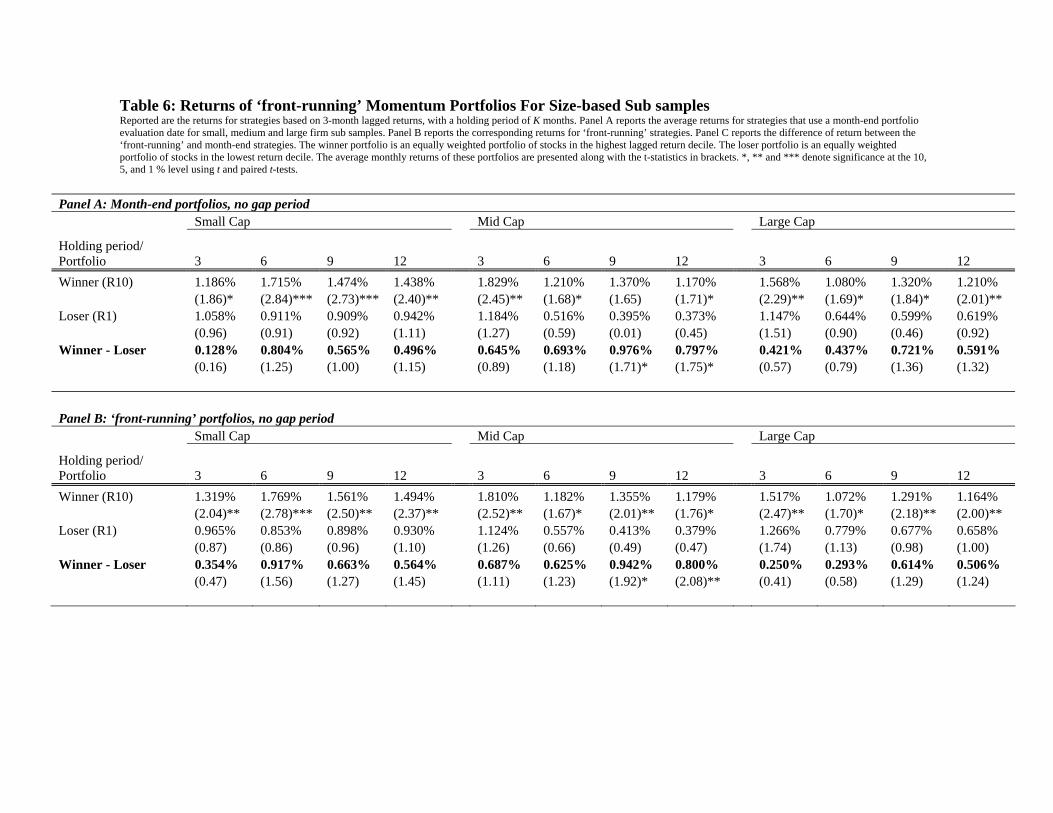
Table 6: Returns of ‘front-running’ Momentum Portfolios For Size-based Sub samples Reported are the returns for strategies based on 3-month lagged returns, with a holding period of K months. Panel A reports the average returns for strategies that use a month-end portfolio evaluation date for small, medium and large firm sub samples. Panel B reports the corresponding returns for ‘front-running’ strategies. Panel C reports the difference of return between the ‘front-running’ and month-end strategies. The winner portfolio is an equally weighted portfolio of stocks in the highest lagged return decile. The loser portfolio is an equally weighted portfolio of stocks in the lowest return decile. The average monthly returns of these portfolios are presented along with the t-statistics in brackets. *, ** and *** denote significance at the 10, 5, and 1 % level using t and paired t-tests.
Panel A: Month-end portfolios, no gap period Small Cap Mid Cap Large Cap
Holding period/ Portfolio 3 6 9 12 3 6 9 12 3 6 9 12 Winner (R10) 1.186% 1.715% 1.474% 1.438% 1.829% 1.210% 1.370% 1.170% 1.568% 1.080% 1.320% 1.210% (1.86)* (2.84)*** (2.73)*** (2.40)** (2.45)** (1.68)* (1.65) (1.71)* (2.29)** (1.69)* (1.84)* (2.01)** Loser (R1) 1.058% 0.911% 0.909% 0.942% 1.184% 0.516% 0.395% 0.373% 1.147% 0.644% 0.599% 0.619% (0.96) (0.91) (0.92) (1.11) (1.27) (0.59) (0.01) (0.45) (1.51) (0.90) (0.46) (0.92) Winner - Loser 0.128% 0.804% 0.565% 0.496% 0.645% 0.693% 0.976% 0.797% 0.421% 0.437% 0.721% 0.591% (0.16) (1.25) (1.00) (1.15) (0.89) (1.18) (1.71)* (1.75)* (0.57) (0.79) (1.36) (1.32) Panel B: ‘front-running’ portfolios, no gap period Small Cap Mid Cap Large Cap
Holding period/ Portfolio 3 6 9 12 3 6 9 12 3 6 9 12 Winner (R10) 1.319% 1.769% 1.561% 1.494% 1.810% 1.182% 1.355% 1.179% 1.517% 1.072% 1.291% 1.164% (2.04)** (2.78)*** (2.50)** (2.37)** (2.52)** (1.67)* (2.01)** (1.76)* (2.47)** (1.70)* (2.18)** (2.00)** Loser (R1) 0.965% 0.853% 0.898% 0.930% 1.124% 0.557% 0.413% 0.379% 1.266% 0.779% 0.677% 0.658% (0.87) (0.86) (0.96) (1.10) (1.26) (0.66) (0.49) (0.47) (1.74) (1.13) (0.98) (1.00) Winner - Loser 0.354% 0.917% 0.663% 0.564% 0.687% 0.625% 0.942% 0.800% 0.250% 0.293% 0.614% 0.506% (0.47) (1.56) (1.27) (1.45) (1.11) (1.23) (1.92)* (2.08)** (0.41) (0.58) (1.29) (1.24)
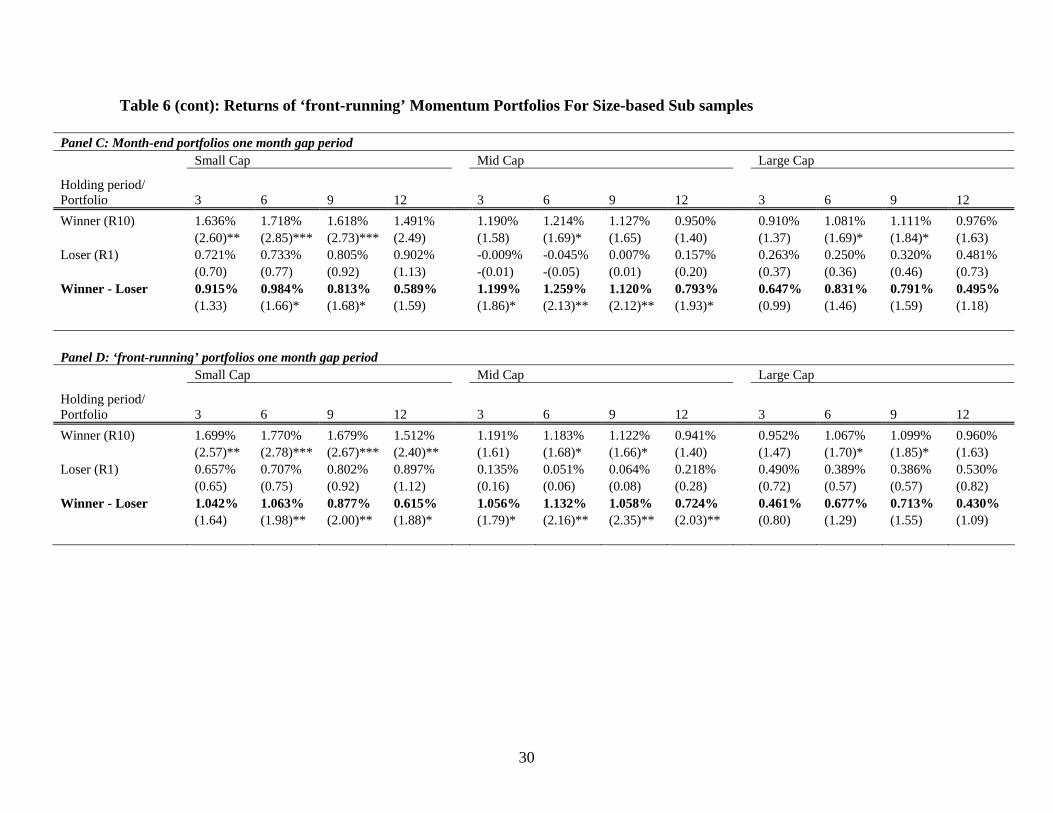
Table 6 (cont): Returns of ‘front-running’ Momentum Portfolios For Size-based Sub samples
Panel C: Month-end portfolios one month gap period Small Cap Mid Cap Large Cap
Holding period/ Portfolio 3 6 9 12 3 6 9 12 3 6 9 12 Winner (R10) 1.636% 1.718% 1.618% 1.491% 1.190% 1.214% 1.127% 0.950% 0.910% 1.081% 1.111% 0.976% (2.60)** (2.85)*** (2.73)*** (2.49) (1.58) (1.69)* (1.65) (1.40) (1.37) (1.69)* (1.84)* (1.63) Loser (R1) 0.721% 0.733% 0.805% 0.902% -0.009% -0.045% 0.007% 0.157% 0.263% 0.250% 0.320% 0.481% (0.70) (0.77) (0.92) (1.13) -(0.01) -(0.05) (0.01) (0.20) (0.37) (0.36) (0.46) (0.73) Winner - Loser 0.915% 0.984% 0.813% 0.589% 1.199% 1.259% 1.120% 0.793% 0.647% 0.831% 0.791% 0.495% (1.33) (1.66)* (1.68)* (1.59) (1.86)* (2.13)** (2.12)** (1.93)* (0.99) (1.46) (1.59) (1.18) Panel D: ‘front-running’ portfolios one month gap period Small Cap Mid Cap Large Cap
Holding period/ Portfolio 3 6 9 12 3 6 9 12 3 6 9 12 Winner (R10) 1.699% 1.770% 1.679% 1.512% 1.191% 1.183% 1.122% 0.941% 0.952% 1.067% 1.099% 0.960% (2.57)** (2.78)*** (2.67)*** (2.40)** (1.61) (1.68)* (1.66)* (1.40) (1.47) (1.70)* (1.85)* (1.63) Loser (R1) 0.657% 0.707% 0.802% 0.897% 0.135% 0.051% 0.064% 0.218% 0.490% 0.389% 0.386% 0.530% (0.65) (0.75) (0.92) (1.12) (0.16) (0.06) (0.08) (0.28) (0.72) (0.57) (0.57) (0.82) Winner - Loser 1.042% 1.063% 0.877% 0.615% 1.056% 1.132% 1.058% 0.724% 0.461% 0.677% 0.713% 0.430% (1.64) (1.98)** (2.00)** (1.88)* (1.79)* (2.16)** (2.35)** (2.03)** (0.80) (1.29) (1.55) (1.09)
30