Embed Size (px)
Citation preview

The Farmers Automobile Insurance Association
Report on Audits of Financial Statements - Statutory Basis
For the Years Ended December 31, 2013 and 2012

The Farmers Automobile Insurance Association
Table of Contents
Page(s)
Independent Auditor’s Report .......................................................................................... 1-2
Financial Statements: Statutory Balance Sheets as of December 31, 2013 and 2012 .............................................. 3
Statutory Statements of Operations and Changes in Policyholders’ Surplus for the Years Ended December 31, 2013 and 2012 ........................................................ 4
Statutory Statements of Cash Flow for the Years Ended December 31, 2013 and 2012 ................................................................................... 5
Notes to Statutory Basis Financial Statements .................................................................. 6-30
Independent Auditor’s Report on the Supplementary Information ........................................... 31
Summary Investment Schedule ........................................................................................ 32
Investment Risks Interrogatories ..................................................................................33-36
Reinsurance Interrogatories .........................................................................................37-38

‐ 1 ‐
INDEPENDENT AUDITOR’S REPORT To the Board of Directors The Farmers Automobile Insurance Association Pekin, Illinois We have audited the accompanying statutory balance sheets of The Farmers Automobile Insurance Association (the Association) as of December 31, 2013 and 2012, and the related statutory statements of operations, changes in policyholders’ surplus, and cash flow for the years then ended, and the related notes to the statutory financial statements. Management’s Responsibilities for the Statutory Financial Statements Management is responsible for the preparation and fair presentation of these financial statements in accordance with the accounting practices prescribed or permitted by the Illinois Department of Insurance. Management is also responsible for the design, implementation, and maintenance of internal control relevant to the preparation and fair presentation of financial statements that are free from material misstatement, whether due to fraud or error. Auditor’s Responsibility Our responsibility is to express an opinion on these financial statements based on our audits. We conducted our audits in accordance with auditing standards generally accepted in the United States of America. Those standards require that we plan and perform the audits to obtain reasonable assurance about whether the financial statements are free from material misstatement. An audit involves performing procedures to obtain audit evidence about the amounts and disclosures in the financial statements. The procedures selected depend on the auditor’s judgment, including the assessment of the risks of material misstatement of the financial statements, whether due to fraud or error. In making those risk assessments, the auditor considers internal control relevant to the Association’s preparation and fair presentation of the financial statements in order to design audit procedures that are appropriate in the circumstances, but not for the purpose of expressing an opinion on the effectiveness of the Association’s internal control. Accordingly, we express no such opinion. An audit also includes evaluating the appropriateness of accounting policies used and the reasonableness of significant accounting estimates made by management, as well as evaluating the overall presentation of the financial statements. We believe that the audit evidence we have obtained is sufficient and appropriate to provide a basis for our audit opinions.

‐ 2 ‐
Basis for Adverse Opinion on U.S. Generally Accepted Accounting Principles As described in Note 1 to the financial statements, the financial statements are prepared by the Association in accordance with accounting practices prescribed or permitted by the Illinois Department of Insurance, which is a basis of accounting other than accounting principles generally accepted in the United States of America, to meet the requirements of the state of Illinois. The effects on the statutory financial statements of the variances between the statutory basis of accounting described in Note 1 and accounting principles generally accepted in the United States of America have not been determined but are presumed to be material. Adverse Opinion on U.S. Generally Accepted Accounting Principles In our opinion, because of the significance of the matter discussed in the “Basis for Adverse Opinion on U.S. Generally Accepted Accounting Principles” paragraph, the financial statements referred to above do not present fairly, in accordance with accounting principles generally accepted in the United States of America, the financial position of the Association as of December 31, 2013 and 2012, and the results of its operations and its cash flow for the years then ended. Opinion on Regulatory Basis of Accounting In our opinion, the statutory financial statements referred to above present fairly, in all material respects, the financial position of the Association as of December 31, 2013 and 2012, and the results of its operations, changes in policyholders’ surplus, and its cash flow for the years then ended, in accordance with the accounting practices prescribed or permitted by the Illinois Department of Insurance described in Note 1.
Strohm Ballweg, LLP Madison, Wisconsin May 2, 2014

The accompanying notes are an integral part of the statutory financial statements.
-3-
The Farmers Automobile Insurance Association
Statutory Balance Sheets December 31, 2013 and 2012
2013 2012Admitted Assets:Bonds 623,969,700$ 600,474,918$ Common Stocks:
Affiliates 205,103,256 195,096,920 Other than Affiliates 37,076,225 28,546,741
Real Estate (Net of Accumulated Depreciation of$9,910,852 and $9,458,340) 11,035,609 7,446,329
Cash and Short-Term Investments 33,997,024 29,967,538 Securities Lending Reinvested Collateral Assets 42,951,417 39,763,541 Notes Receivable from Affiliate 575,000 425,000 Other Invested Assets 208,700 93,282
Cash and Invested Assets 954,916,931 901,814,269 Investment Income Accrued 6,496,783 6,623,985 Uncollected Premiums 152,856,851 140,648,826 Current Federal Income Tax Recoverable 12,469,727 4,464,365 Net Deferred Tax Asset 23,185,587 19,913,139 EDP Equipment (Net of Accumulated Depreciation
of $6,417,570 and $5,955,684) 1,097,538 924,886 Receivable from affiliate and subsidiary 2,043,605 - Intangible Pension Asset - 453,656 Recoverable from Reinsurers 454,348 4,815,697
Total Admitted Assets 1,153,521,370$ 1,079,658,823$
Liabilities:
Unpaid Losses, Net 268,410,295$ 245,133,767$ Unpaid Loss Adjustment Expenses, Net 60,399,256 56,395,830 Unearned Premiums, Net 209,728,090 196,409,548 Commissions, Expenses, Fees, and Taxes 30,465,597 28,066,808 Drafts Outstanding 19,542,367 20,508,476 Remittances and Items Not Allocated 1,472,839 1,369,563 Advance Premiums 6,043,463 4,891,581 Payable for Securities Lending 42,951,417 39,763,541 Pension Benefit Obligations 2,434,167 3,311,974 Post-Retirement Benefit Obligations 1,363,220 - Other Liabilities 12,911,264 12,552,937
Total Liabilities 655,721,975 608,404,025
Policyholders’ Surplus:
Special Surplus Fund 872,500 872,500 Unassigned Surplus 496,926,895 470,382,298
Total Policyholders’ Surplus 497,799,395 471,254,798
Total Liabilities and Policyholders’ Surplus 1,153,521,370$ 1,079,658,823$

The accompanying notes are an integral part of the statutory financial statements.
-4-
The Farmers Automobile Insurance Association
Statutory Statements of Operations and Changes in Policyholders’ Surplus Years Ended December 31, 2013 and 2012
2013 2012
Underwriting Income:Premiums Written 428,466,768$ 401,990,633$ Increase in Unearned Premiums (13,318,542) (18,172,907)
Net Premiums Earned 415,148,226 383,817,726
Losses and Expenses Incurred:Losses 270,584,309 255,489,709 Loss Adjustment Expenses 42,318,316 32,618,847 Underwriting Expenses 122,313,091 109,440,766
Net Losses and Expenses Incurred 435,215,716 397,549,322
Underwriting Loss (20,067,490) (13,731,596)
Net Investment Income 25,115,772 27,047,315 Net Realized Capital Gains 5,763,765 11,196,332 Other Income 2,800,406 2,952,878
Net Income Before Federal Income Tax 13,612,453 27,464,929
Federal Income Tax Expense 3,396,247 4,713,763
Net Income 10,216,206$ 22,751,166$
Statement of Changes in Policyholders' Surplus:Policyholders' Surplus - Beginning of Year 471,254,798$ 447,437,352$ Changes in Policyholders' Surplus:
Net Income 10,216,206 22,751,166 Net Unrealized Capital Gains:
Affiliates 6,770,342 7,206,270 Other than Affiliates 6,236,690 1,597,098
Non-Admitted Assets 844,620 840,294 Provision for Reinsurance 143,360 (76,979) Net Deferred Income Tax 3,272,448 (5,642,085) Pension Benefit Obligations 424,151 (2,858,318) Post-Retirement Benefit Obligations (1,363,220) -
Net Increase 26,544,597 23,817,446
Policyholders' Surplus - End of Year 497,799,395$ 471,254,798$

The accompanying notes are an integral part of the statutory financial statements.
-5-
The Farmers Automobile Insurance Association
Statutory Statements of Cash Flow Years Ended December 31, 2013 and 2012
2013 2012
Cash from Operations:Net Premiums Collected 417,934,324$ 381,870,530$ Net Investment Income Received 27,304,406 29,482,756 Other Income Received 2,800,406 2,952,880
Total Cash Received 448,039,136 414,306,166
Benefits and Loss Related Payments 242,946,432 247,198,552 Commissions, Expenses Paid and Other Deductions 157,472,139 140,017,413 Federal Income Taxes Paid 11,401,610 3,610,230
Total Cash Disbursed 411,820,181 390,826,195
Net Cash from Operations 36,218,955 23,479,971
Cash from Investments:Proceeds from Investments Sold, Matured or Repaid:
Bonds 85,366,393 158,716,016 Stocks 18,496,974 20,510,873 Other Invested Assets - 150,968 Miscellaneous - 9,327,741
Total Investment Proceeds 103,863,367 188,705,598
Cost of Investments Acquired:Bonds 108,442,237 172,964,579 Stocks 20,234,113 23,337,485 Real Estate 4,041,794 1,439,183 Other Invested Assets 150,000 4,191 Miscellaneous Applications 3,433,892 -
Total Investments Acquired 136,302,036 197,745,438
Net Cash from Investments (32,438,669) (9,039,840)
Cash from Financing and Miscellaneous Sources:
Other Cash Provided (Applied) 249,200 (8,032,992)
Net Cash from Financing and Miscellaneous Sources 249,200 (8,032,992)
Net Change in Cash and Short-Term Investments 4,029,486 6,407,139
Cash and Short-Term Investments at Beginning of Year 29,967,538 23,560,399
Cash and Short-Term Investments at End of Year 33,997,024$ 29,967,538$

The Farmers Automobile Insurance Association Notes to Financial Statements – Statutory Basis
-6-
1. Nature of Operations and Summary of Significant Accounting Practices
The Farmers Automobile Insurance Association (the “Association”) is a regional Midwest property and casualty insurance company domiciled in the State of Illinois. The Association sells insurance through independent agents. Insurance products primarily include private passenger and commercial automobile, homeowners, workers’ compensation, commercial multi-peril, general liability and business owners’ policies. Approximately 51 and 52 percent of the direct premium was written in the state of Illinois in 2013 and 2012, respectively.
The accompanying financial statements have been prepared principally for filing with regulatory agencies and, as such, are prepared in conformity with accounting practices prescribed or permitted by the Illinois Department of Insurance (statutory accounting practices).
Prescribed statutory accounting practices include the National Association of Insurance Commissioners (NAIC) “Accounting Practices and Procedures Manual”, as well as state laws, regulations and general administrative rules. Permitted statutory accounting practices encompass all accounting practices not so prescribed when such practices are approved by the insurance department of the insurer’s state of domicile. The Association does not use any permitted practices.
Accounting Estimates
The preparation of statutory financial statements requires management to make estimates and assumptions that affect the amounts reported in the financial statements and accompanying notes. Actual results could differ from those estimates. Estimates that are particularly susceptible to significant change in the near term relate to: 1) the estimated unpaid losses and loss adjustment expenses, 2) the assumptions regarding the other than temporary impairment analysis of the investment portfolio, 3) the assumptions, including the discount rate, used to determine the benefit obligations for the defined benefit pension plan and post-retirement benefit plan, and 4) the amount of deferred tax assets expected to be realized in future years.
Subsequent Events
Subsequent events were evaluated through May 2, 2014, which is the date the financial statements were available to be issued.
Summary of Significant Differences Between Statutory Accounting and GAAP
A description of the significant accounting practices used by the Association and significant variances from accounting principles generally accepted in the United States of America (GAAP) are as follows:
A. Investments
Bonds and stocks are valued in accordance with rules prescribed by the NAIC. Investment grade bonds (i.e., NAIC designation 1 or 2) not backed by other loans are stated at amortized cost using a scientific method. Below investment grade bonds (i.e., NAIC designation 3 or higher) not backed by other loans are stated at the lesser of fair value or amortized cost with any change in the carrying value of the bond being treated as an unrealized gain/loss and credited/charged directly to surplus. Common stocks of non-affiliated companies are carried at market value and common stocks of insurance company affiliates are accounted for using the statutory equity method in which undistributed earnings are reported as unrealized gains and losses; under GAAP, the financial statements of wholly owned subsidiaries would be consolidated with those of the parent.

The Farmers Automobile Insurance Association Notes to Financial Statements – Statutory Basis
-7-
Loan-backed securities (mortgage-backed and asset-backed securities) are stated at amortized cost using a prospective basis. The prospective approach recognizes, through the recalculation of the effective yield to be applied to future periods, the effects of all cash flow whose amounts differ from those estimated earlier. Changes in amortization and amortized cost will occur in future periods. Assumptions for loan-backed securities are updated on a quarterly basis. Agency pass-through and collateralized mortgage obligations use the three-month generic prepayment speed assumption. Non-agency collateralized mortgage obligations and asset-backed securities are updated using projected principal payment windows.
Investment income is recorded when earned. Realized gains and losses on sale or maturity of investments are determined on the basis of specific identification. Aggregate unrealized capital gains and losses are credited or charged directly to unassigned surplus without income tax effect. Unrealized capital losses on investments that are determined to be other than temporary declines in value must be recognized as realized capital losses. The Association reviews its investment portfolio on a periodic basis to determine other than temporary declines in value. In evaluating whether a decline in value is other than temporary, management considers several factors including, but not limited to: 1) the Association’s ability and intent to retain the security for a sufficient amount of time for it to recover, 2) the extent and duration of the decline in value, 3) the probability of collecting all cash flows according to contractual terms in effect at acquisition or restructuring, 4) relevant industry conditions and trends, and 5) the financial condition and current and future business prospects of the issuer. There were no declines deemed other than temporary for the years ended December 31, 2013 and 2012.
Under GAAP, equity securities that have readily determinable fair values and debt securities would be classified into three categories: held-to-maturity, trading, and available-for-sale. Held-to-maturity securities would be reported at amortized cost. Trading securities would be reported at fair value, with unrealized gains and losses included in earnings. Available-for-sale securities would be reported at fair value, with unrealized gains and losses, net of applicable taxes, reported as a separate component of unassigned surplus.
An occupancy rental charge on home office real estate owned is recorded as investment income and as offsetting rental expense; under GAAP, no such rental charge would be recognized.
B. Unpaid Losses and Loss Adjustment Expenses
The liabilities for unpaid losses and loss adjustment expenses are based upon management’s estimates of reported and unreported losses determined on the basis of claim evaluation and past statistical experience. These liabilities are reported net of anticipated salvage and subrogation receivable. Reinsurance recoverables related to unpaid losses and loss adjustment expenses are netted with the respective liabilities; under GAAP, these reinsurance recoverables would be shown on a separate gross basis.
C. Policy Acquisition Costs
The costs of acquiring premium income are immediately charged against operations, whereas premium income is deferred over the periods covered by the policies. Under GAAP, costs which vary directly with the production of new and renewal business would be capitalized and amortized as premium is earned.

The Farmers Automobile Insurance Association Notes to Financial Statements – Statutory Basis
-8-
D. Income Taxes
Deferred income taxes are provided for differences between the financial statement and the tax bases of assets and liabilities and are reduced by a valuation allowance when it is more likely than not that some portion or all of the deferred tax assets will not be realized. Additionally, under statutory accounting practices, limitations are placed on the admissibility of deferred tax assets. Most changes in deferred tax assets and liabilities are reported as changes in surplus, and state income taxes are not included in deferred tax calculations; under GAAP, there is no admissibility concept, and changes in deferred tax assets and liabilities would be reported through operations and/or surplus depending on their characteristics.
E. Special Surplus Fund
The special surplus fund is an appropriation of unassigned surplus established to meet Wisconsin statutory requirements.
F. Non-Admitted Assets
Certain assets designated as non-admitted assets, aggregating $5,425,852 and $6,270,472 at December 31, 2013 and 2012, respectively, are not recognized by statutory accounting practices. These assets are excluded from the balance sheet, and the net change in such assets is charged or credited directly to unassigned surplus. Non-admitted deferred tax assets are not included in the amounts above. The change in the non-admitted deferred tax asset is charged or credited directly to unassigned surplus. Under GAAP, such assets would be recognized at the lower of cost or net realizable value.
G. Premium Income Recognition
Premiums are earned over the terms of the related insurance policies and reinsurance contracts on a daily pro rata basis. Unearned premium reserves are established to cover the unexpired portion of premiums written and are computed on a pro rata basis. The Association determined that a premium deficiency reserve was not necessary for the years ended December 31, 2013 and 2012. The Association does not anticipate investment income as a factor in the calculation of a potential premium deficiency reserve.
H. Cash and Short-Term Investments
For purposes of reporting cash flows, the Association follows statutory accounting practices and considers cash in checking accounts, certain money market funds, and highly liquid debt instruments purchased with an original maturity of one year or less to be cash and short-term investments.
The Association has on deposit in a financial institution a balance in excess of amounts insured by the Federal Deposit Insurance Corporation. The Association does not believe it is exposed to any significant credit risks on this account.
I. Other
Real estate consists of home office properties. Depreciation of real estate and other admitted and non-admitted assets is computed using the straight-line method over the estimated useful or class life.
Commissions on reinsurance ceded are credited to income at the time the premium is ceded; under GAAP, commissions on ceded premium would be deferred and recognized as income over the periods covered by the policies.

The Farmers Automobile Insurance Association Notes to Financial Statements – Statutory Basis
-9-
The Association, at the approval of the Board of Directors, has a line of credit with The Northern Trust Company not to exceed $30 million. The Association did not borrow any amounts against this line of credit during 2013 or 2012.
Statutory financial statements are prepared in a form using language and groupings substantially the same as the annual statement filed with the NAIC and state regulatory authorities which differ from the presentation and disclosure of financial statements that would be presented under GAAP.
Necessary reclassifications are made in prior period financial statements, whenever appropriate, to conform to the current presentation.
2. Affiliated Entity Transactions
The Association and its wholly owned subsidiary, Pekin Insurance Company, owned 79.30 percent and 77.62 percent of Pekin Life Insurance Company (PLIC) at December 31, 2013 and 2012, respectively. Specifically, the Association owned 71.72 percent and 70.04 percent of PLIC as of these dates.
The Association and Pekin Insurance Company occupy the same building, and, along with PLIC, utilize many common facilities, management, administrative and office personnel, and services. Since 1966, the Association and Pekin Insurance Company have had a reinsurance pooling agreement under which underwriting income and expense and other administrative expenses are prorated to the Association (80%) and to Pekin Insurance Company (20%). The proration does not include provisions for federal income taxes or results of investment transactions. In addition, the Association and PLIC allocate related expenses to one another. Intercompany balances are paid periodically throughout the year based on estimates and settled within 45 days after year-end based on actual allocated expenses. Such net expenses allocated to PLIC, and therefore not included in the accompanying statements of income, were $6,999,482 in 2013 and $6,321,250 in 2012.
In connection with structured settlements, the Association purchased 15 annuities from PLIC in 2013 and 20 annuities in 2012, of which the Association’s claimant is the payee, but for which the Association is contingently liable. The single premium for these annuities totaled $891,237 and $650,500 in 2013 and 2012, respectively. The reserve carried by PLIC at December 31, 2013 and 2012, was $5,323,101 and $4,779,670, respectively.

The Farmers Automobile Insurance Association Notes to Financial Statements – Statutory Basis
-10-
3. Bonds and Common Stocks
The admitted value, unrealized gain and loss, and market value of investments in bonds as of December 31, 2013, are as follows:
The admitted value, unrealized gain and loss, and market value of investments in bonds as of December 31, 2012 are as follows:
Admitted Unrealized Unrealized MarketObligation Value Gain Loss Value
U.S. Government 2,202,698$ 26,707$ 6,405$ 2,223,000$ Other Government 5,736,635 150,842 - 5,887,477 U.S. States, Territories and Possessions 13,515,222 1,270,275 - 14,785,497 U.S. Political Subdivisions of States and Territories 27,946,277 1,703,945 353,049 29,297,173 U.S. Special Revenue and Special Assessment 95,258,815 7,923,201 67,040 103,114,976 Industrial and Miscellaneous 323,812,102 15,012,272 8,455,978 330,368,396 Loan-Backed Securities 155,497,951 3,473,692 3,575,703 155,395,940
Total 623,969,700$ 29,560,934$ 12,458,175$ 641,072,459$
2013
Admitted Unrealized Unrealized MarketObligation Value Gain Loss Value
U.S. Government 2,142,954$ 50,615$ -$ 2,193,569$ Other Government 2,733,483 338,134 - 3,071,617 U.S. States, Territories and Possessions 15,625,816 2,006,952 - 17,632,768 U.S. Political Subdivisions of States and Territories 30,691,890 2,931,524 - 33,623,414 U.S. Special Revenue and Special Assessment 103,253,257 11,759,338 - 115,012,595 Industrial and Miscellaneous 307,763,254 30,975,519 237,245 338,501,528 Loan-Backed Securities 138,264,264 8,710,541 3,118 146,971,687
Total 600,474,918$ 56,772,623$ 240,363$ 657,007,178$
2012

The Farmers Automobile Insurance Association Notes to Financial Statements – Statutory Basis
-11-
The admitted value and market value of bonds at December 31, 2013, by contractual maturity, are shown below:
The Association does not engage in direct subprime residential mortgage lending. The Association’s minimal exposure to subprime lending is limited to investments within the fixed maturity investment portfolio which contain securities collateralized by mortgages that have characteristics of subprime lending such as adjustable rate mortgages and alternative documentation mortgages. These investments are in the form of asset-backed securities collateralized by subprime mortgages and collateralized mortgage obligations backed by alternative documentation mortgages. The total carrying value of these investments was $198,750 and $298,131 as of December 31, 2013 and 2012, comprising 0.03 and 0.05 percent of the Association’s total bond portfolio, respectively.
The adjusted cost, unrealized gain and loss, and statement value of investments in common stock as of December 31, 2013 are as follows:
The adjusted cost, unrealized gain and loss, and statement value of investments in common stock as of December 31, 2012 are as follows:
Admitted MarketValue Value
Due in One Year or Less 14,952,669$ 15,210,660$ Due After One Year Through Five Years 110,494,685 116,763,871 Due After Five Years Through Ten Years 308,288,678 315,917,849 Due After Ten Years 34,735,719 37,784,138 Total 468,471,751 485,676,518 Loan-Backed Securities 155,497,949 * 155,395,941
Total 623,969,700$ 641,072,459$
* The admitted value of loan-backed securities includes $1,326,748 and $1,902,574 of U.S. Government Guaranteed Securities for 2013 and 2012, respectively.
Adjusted Unrealized Unrealized StatementCommon Stocks Cost Gain Loss Value
Other Than Affiliates 26,613,013$ 10,783,696$ 320,484$ 37,076,225$ Affiliates 65,959,851 139,143,405 - 205,103,256
Total 92,572,864$ 149,927,101$ 320,484$ 242,179,481$
2013
Adjusted Unrealized Unrealized StatementCommon Stocks Cost Gain Loss Value
Other Than Affiliates 24,320,217$ 4,931,971$ 705,447$ 28,546,741$ Affiliates 62,723,856 132,373,064 - 195,096,920
Total 87,044,073$ 137,305,035$ 705,447$ 223,643,661$
2012

The Farmers Automobile Insurance Association Notes to Financial Statements – Statutory Basis
-12-
Securities with unrealized losses based on estimated market values as of December 31, 2013 are shown below:
Securities with unrealized losses based on estimated market values as of December 31, 2012 are shown below:
Proceeds from sales of bonds, excluding calls and maturities, during 2013 and 2012 were $64,908,652 and $154,236,016, respectively. Gross gains of $2,202,407 and $9,551,394 and gross losses of $174,549 and $40,032 were realized on those sales, respectively.
Bonds carried at $2,096,848 and $2,035,004 at December 31, 2013 and 2012, respectively, were on deposit with the Illinois Department of Insurance as required by law. A certificate of deposit in the amount of $100,000 was on deposit with the Arizona Department of Insurance at December 31, 2013 and 2012 as required by law.
Market Unrealized Market Unrealized Market Unrealized
Description of Securities Value Losses Value Losses Value Losses
U. S. Government 1,072,500$ 6,405$ -$ -$ 1,072,500$ 6,405$
U.S. Political Subdivisions of States and Territories 4,679,995 353,049 - - 4,679,995 353,049
U.S. Special Revenue and Special Assessment 3,758,641 67,040 - - 3,758,641 67,040
Industrial and Miscellaneous 113,537,736 6,180,583 29,369,835 2,275,395 142,907,571 8,455,978
Loan-Backed Securities 77,421,315 3,575,703 - - 77,421,315 3,575,703
Subtotal Debt Securities 200,470,187 10,182,780 29,369,835 2,275,395 229,840,022 12,458,175
Common Stock - Unaffiliated 2,734,680 163,807 497,750 156,677 3,232,430 320,484
Total Securities WithUnrealized Losses 203,204,867$ 10,346,587$ 29,867,585$ 2,432,072$ 233,072,452$ 12,778,659$
Less Than 12 Months 12 Months or More Total
Market Unrealized Market Unrealized Market Unrealized
Description of Securities Value Losses Value Losses Value Losses
Industrial and Miscellaneous 36,374,760$ 237,245$ -$ -$ 36,374,760$ 237,245$
Loan-Backed Securities 873,568 388 328,060 2,730 1,201,628 3,118
Subtotal Debt Securities 37,248,328 237,633 328,060 2,730 37,576,388 240,363
Common Stock - Unaffiliated 5,065,159 342,406 3,125,809 363,041 8,190,968 705,447
Total Securities WithUnrealized Losses 42,313,487$ 580,039$ 3,453,869$ 365,771$ 45,767,356$ 945,810$
Less Than 12 Months 12 Months or More Total

The Farmers Automobile Insurance Association Notes to Financial Statements – Statutory Basis
-13-
Securities Lending
The Association lends securities to agreed upon borrowers through an agreement with its custodian. The Association’s policy is to require initial collateral from the borrower in an amount not less than 102 percent and 105 percent of the fair value of the domestic and foreign securities loaned at the outset of the contract as collateral. All collateral so received is held either in the physical custody of the custodian or for the account of the custodian by their agent or a central bank. The offsetting collateral liability is included in Payable for Securities Lending. At December 31, 2013 and 2012, the amount of securities loaned was $42,834,588 and $38,977,363, respectively, and the related collateral was $43,786,212 and $39,590,854. At December 31, 2013, collateral assets valued at $2,154,282 had maturity dates beyond one year. The aggregate amount of cash collateral received as of December 31, 2013 and 2012, is shown below by maturity date:
The aggregate amount of cash collateral reinvested as of December 31, 2013 and 2012, is shown below by maturity date:
As of December 31, 2013, the Association had $75,610,691 in gross restricted assets related to securities lending agreements. This amount represents securities that are available to be borrowed and as such are not available for general use by the Company.
2013 2012
Maturity Date Fair Value Fair Value
Open 7,250,997$ 6,001,973$ 30 Days or Less 5,573,985 6,429,554 31 to 60 Days 8,507,661 6,116,787 61 to 90 Days 9,637,345 7,553,935 Greater Than 90 Days 12,816,224 13,488,605
Total Collateral Received 43,786,212$ 39,590,854$
Amortized Fair Amortized FairCost Value Cost Value
30 Days or Less 12,581,825$ 12,581,921$ 11,153,884$ 11,153,982$ 31 to 60 Days 8,345,540 8,346,214 6,072,394 6,072,732 61 to 90 Days 4,941,017 4,941,367 3,660,207 3,660,498 91 to 120 Days 7,034,469 7,034,897 3,336,902 3,338,162 121 to 180 Days 3,592,678 3,593,462 4,885,307 4,886,611 181 to 365 Days 4,346,081 4,344,259 4,007,565 4,009,674 1 to 2 Years 1,974,040 1,974,557 1,547,798 1,547,893 2 to 3 Years 135,767 135,761 1,593 1,593 Greater Than 3 Years - - 5,097,891 5,091,120
Total Collateral Reinvested 42,951,417$ 42,952,438$ 39,763,541$ 39,762,265$
2013 2012

The Farmers Automobile Insurance Association Notes to Financial Statements – Statutory Basis
-14-
4. Fair Value Measurement
Statutory Accounting Practices establishes a framework for measuring fair value. That framework provides a fair value hierarchy that prioritizes the inputs to valuation techniques used to measure fair value. The hierarchy gives the highest priority to unadjusted quoted prices in active markets for identical assets (level one measurements) and the lowest priority to unobservable inputs (level three measurements). The three levels of the fair value hierarchy under statutory accounting are described below:
Level 1 – Inputs to the valuation methodology are unadjusted quoted prices for identical assets in active markets that the Association has the ability to access.
Level 2 – Inputs to the valuation methodology include quoted prices for similar assets in active markets; quoted prices for identical or similar assets in inactive markets; inputs other than quoted prices that are observable; or inputs that are derived principally from or corroborated by observable market data by correlation or other means.
The fair values of the Level 2 securities are obtained from independent pricing services or from the Association’s investment manager and are determined using quoted market prices from an orderly market at the reporting date for those or similar investments.
Level 3 – Inputs to the valuation methodology are unobservable and significant to the fair value measurement.
The following tables set forth by level, within the fair value hierarchy, the Association’s financial instruments that are reported at fair value as of December 31, 2013 and 2012:
The Association did not have any liabilities measured at fair value at December 31, 2013 and 2012.
Description Level 1 Level 2 Level 3 Total
Common Stock - Other Than Affiliates 33,750,334$ 3,325,891$ -$ 37,076,225$
2013
Description Level 1 Level 2 Level 3 Total
Common Stock - Other Than Affiliates 25,851,483$ 2,424,735$ 270,523$ 28,546,741$
2012

The Farmers Automobile Insurance Association Notes to Financial Statements – Statutory Basis
-15-
Shown below are the fair value measurements in Level 3 of the fair value hierarchy as of December 31, 2013:
Shown below are the fair value measurements in Level 3 of the fair value hierarchy as of December 31, 2012:
The aggregate fair value of all financial instruments as of December 31, 2013, is shown below.
The aggregate fair value of all financial instruments as of December 31, 2012, is shown below.
Total TotalBeginning Gains/ Gains/ Purchases, EndingBalance (Losses) (Losses) Transfers Issuance, Balance
Common January 1, Included in Included in Out Of Sales, and December 31,Stock 2013 Net Income Surplus Level 3 Settelements 2013
Ivans 270,523$ -$ -$ -$ (270,523)$ -$ Total Level 3 270,523$ -$ -$ -$ (270,523)$ -$
Total TotalBeginning Gains/ Gains/ Purchases, EndingBalance (Losses) (Losses) Transfers Issuance, Balance
Common January 1, Included in Included in Out Of Sales, and December 31,Stock 2012 Net Income Surplus Level 3 Settelements 2012
Ivans 306,124$ -$ (35,601)$ -$ 270,523$
Monster Beverage Corp 80,070 (80,070) - Total Level 3 386,194$ -$ (35,601)$ (80,070)$ -$ 270,523$
Aggregate AdmittedFair Value Assets (Level 1) (Level 2) (Level 3)
Bonds 641,072,459$ 623,969,700$ 2,223,000$ 638,849,459$ -$ Common Stock: Affiliates 205,103,256 205,103,256 - 88,000,869 117,102,387 Other Than Affiliates 37,076,225 37,076,225 33,750,334 3,325,891 - Short-Term Investments 10,007,696 10,007,696 9,882,696 125,000 - Notes Receivable 575,000 575,000 - 575,000 - Agency Loans Receivable 208,700 208,700 - - 208,700
Aggregate AdmittedFair Value Assets (Level 1) (Level 2) (Level 3)
Bonds 657,007,178$ 600,474,918$ 2,193,569$ 651,871,212$ 2,942,397$ Common Stock: Affiliates 195,096,920 195,096,920 - 83,484,694 111,612,226 Other Than Affiliates 28,546,741 28,546,741 25,851,483 2,424,735 270,523 Short-Term Investments 8,268,846 8,268,846 8,113,846 155,000 - Notes Receivable 480,744 425,000 - 425,000 55,744 Agency Loans Receivable 93,282 93,282 - - 93,282

The Farmers Automobile Insurance Association Notes to Financial Statements – Statutory Basis
-16-
The type of security included within each hierarchy in the above table is as follows:
Level 1 Measurements
Bonds: Comprised of actively traded U.S. Treasury notes. Common Stock: Comprised of actively traded exchange listed mutual funds and common stocks. Short-Term Investments: Comprised of money market mutual funds. Level 2 Measurements Bonds: Comprised primarily of Political Subdivisions, Special Revenue, Industrial and Miscellaneous, and Loan-Backed securities. Common Stock: Comprised of common stock of affiliate which is not actively traded and is recorded at the statutory equity method; and comprised of common stock other than affiliates with an NAIC market indicator of “U” for which the price given for a share of common stock is the price listed on any market or exchange, including a foreign exchange, other than the New York Stock Exchange, the American Stock Exchange or the NASDAQ National Market System.
Short-Term Investments: Comprised of collateral loans. Notes Receivable: Comprised of a note receivable from affiliate. Level 3 Measurements Bonds: Certain asset-backed bonds comprised primarily of corporate pass-through bonds. Common Stock: Comprised of certain common stocks not actively traded on the national stock exchange and common stock of affiliates recorded at the statutory equity method. Notes Receivable: Comprised of collateral loans from other than affiliates. Agency Loans Receivable: Comprised of uncollateralized loans.

The Farmers Automobile Insurance Association Notes to Financial Statements – Statutory Basis
-17-
5. Liability for Unpaid Losses and Loss Adjustment Expenses
Activity in the liability for loss and loss adjustment expense reserves is summarized as follows:
As a result of actual claim payments varying from previous estimates of insured events and subsequent reserve changes, the provision for loss and loss adjustment expenses decreased by $20,793,543 and $19,754,407 in 2013 and 2012, respectively. The decrease in incurred loss and loss adjustment expenses in 2013 and 2012 is primarily attributable to favorable development of general liability, workers’ compensation, automobile liability, and homeowners estimated loss and loss adjustment expenses reserves.
Estimates of anticipated salvage and subrogation recoveries on losses and loss adjustment expenses have been recorded as a reduction to the liabilities for unpaid loss and unpaid loss adjustment expenses amounting to $12,041,505 and $11,535,679 at December 31, 2013 and 2012, respectively.
6. Reinsurance
The Association has reinsurance treaties in place for its property and casualty insurance business to reduce exposure to large losses. Although reinsurance does not relieve the Association of its legal liability to its policyholders, it provides a measure of protection against catastrophic losses and provides a means of risk reduction on individual losses. In order to maintain an appropriate balance between the cost of reinsurance and surplus growth, the Association periodically evaluates its retention levels correlated to specific types of property and casualty insurance policies.
The Association is also a party to an intercompany pooling agreement with Pekin Insurance Company. All direct business written by the Company is subject to the intercompany pool. Under this agreement, underwriting income and expenses and other administrative expenses are prorated to the Association (80%) and to Pekin Insurance Company (20%). An immaterial portion of business is ceded to third parties.
2013 2012
Balance at January 1 324,426,991$ 307,630,397$ Less Reinsurance Recoverable (22,897,394) (13,828,130)
Net Balance at January 1 301,529,597 293,802,267 Incurred Related to:
Current Year 333,696,168 307,862,963 Prior Years (20,793,543) (19,754,407)
Total Incurred 312,902,625 288,108,556 Paid Related to:
Current Year 181,967,369 177,075,593 Prior Years 103,655,302 103,305,633
Total Paid 285,622,671 280,381,226 Net Balance at December 31 328,809,551 301,529,597
Plus Reinsurance Recoverable 37,638,258 22,897,394
Balance at December 31 366,447,809$ 324,426,991$

The Farmers Automobile Insurance Association Notes to Financial Statements – Statutory Basis
-18-
The direct unearned premium reserve was $111,592,692 and $112,253,271 at December 31, 2013 and 2012, respectively. Commission equity on unearned premium which would be due to the reinsurer if all reinsurance contracts were cancelled at year-end was $7,914,607 and $7,482,741 at December 31, 2013 and 2012, respectively.
7. Pension Plan, Post-Retirement Benefits, and Deferred Compensation
Retirement Benefits
The Association and its affiliates participate in a trusteed non-contributory defined benefit pension plan. This plan covers full-time employees who have completed one year of service and have reached the age of 21. Effective January 1, 2013, the Association adopted an amendment to freeze participation in the Plan for employees hired after January 1, 2013. The Association’s funding policy is to contribute annually an amount that represents the current cost of the benefits expected to be earned in the current year offset by the expected asset return higher than the discount rate, but no more than the maximum amount that can be deducted for federal income tax purposes. Each affiliate is charged for its applicable share of such contributions based on a percentage of the projected benefit obligation.
Pursuant to a retirement plan for Directors elected prior to 2004, eligible Directors will receive a retirement benefit equal to the annual retainer in effect on the Directors’ retirement date. The benefits paid were $43,250 in 2013 and 2012, respectively. The liability for the Directors’ retirement benefit was $1,235,446 and $1,267,480 at December 31, 2013 and 2012, respectively.
401(k) Savings Plan
The Association and its affiliates participate in a voluntary 401(k) savings plan for eligible participants. New full-time employees are automatically enrolled in the Plan with instant entry after approximately 30 days of employment. The Association may elect, at its sole discretion, to contribute a matching contribution to the savings plan. In 2012, the Association elected to match 25 percent of each employee’s contribution up to a maximum match of $400. In 2013, the same matching was offered to employees hired prior to January 1, 2013.
Employees hired after January 1, 2013, may receive, at the discretion of the Association, a contribution from the Association based on a percentage of eligible earnings and an Association match of the employee’s percentage of contribution. For 2013, the Association contributed 3.5 percent of employees’ eligible earnings and a 75.0 percent match of the employees’ percentage of contribution not to exceed 6.0 percent.
Employer contributions of $200,205 and $125,703 respectively, were made to this plan in 2013 and 2012.
Post-Retirement Benefits
In addition to providing pension benefits, the Association and its affiliates provide certain health care and life insurance benefits (post-retirement benefits) for retired employees. Substantially all employees may become eligible for these benefits if they reach retirement age while working for the Association.
The unfunded post-retirement benefit obligation for retirees and other fully eligible or vested plan participants included in loss adjustment expense reserves and accrued expenses was $3,841,849 and $5,756,636 respectively, at December 31, 2013 and $3,605,304 and $4,368,800, respectively, at December 31, 2012.

The Farmers Automobile Insurance Association Notes to Financial Statements – Statutory Basis
-19-
Deferred Compensation
The Association maintains a deferred compensation plan for the Directors. This plan allows for voluntary deferral of all or any part of compensation to which a Director might otherwise be entitled to as Directors’ fees, in accordance with the plan provisions. During 2013 and 2012, $41,000 and $37,000 of Directors’ fees were deferred. The liability for Directors’ deferred compensation was $473,378 and $447,607 at December 31, 2013 and 2012, respectively.
Expected Cash Flows
The Association expects to contribute $4,800,000 to the Pension Plan and $1,599,800 to the Post-Retirement Benefit Plan in 2014.
The following benefit payments, which reflect expected future service, as appropriate, are expected to be paid:
Assets, Obligations, and Assumptions
A summary of assets, obligations, and assumptions of the Pension and Post-Retirement Benefit Plans of the Association is as follows at December 31:
The projected benefit obligation of the Association in relation to the total obligation of the Association and its affiliates (excluding inactive participants) is the basis for allocating the plan assets and the net periodic benefit cost. The net periodic benefit cost of the Post-Retirement Benefit Plan is measured on a seriatim basis that projects future benefit costs participant by participant based on demographic characteristics. The projected costs are discounted to a present value.
Pension Post-RetirementYear Benefits Benefits2014 1,878,061$ 1,364,614$ 2015 2,422,921 1,529,6822016 3,030,435 1,720,3912017 3,824,328 1,869,4332018 4,778,428 2,052,931
2019 to 2023 31,474,967 12,902,533
2013 2012 2013 2012
77,178,255$ 69,459,340$ 22,580,859$ 26,773,865$ 5,099,120 4,097,231 1,966,885 1,362,743 3,118,431 3,422,457 2,281,090 1,365,818
(8,386,053) 3,891,761 1,288,048 (5,944,617) (12,013,519) (3,692,534) (854,128) (976,950)
Plan Amendments 1,954,290 - 22,841,823 -
66,950,524$ 77,178,255$ 50,104,577$ 22,580,859$
Benefit Obligation at
Pension Benefits Post-Retirement BenefitsUnderfunded Underfunded
Change in Benefit Obligation:
End of Year
Beginning of YearService CostInterest CostActuarial Loss (Gain)Benefits Paid
Benefit Obligation at

The Farmers Automobile Insurance Association Notes to Financial Statements – Statutory Basis
-20-
A summary of the plan assets, funded status, and net periodic benefit cost of the Pension and Post-Retirement Benefit Plans for the Association is as follows for the years ended December 31:
The settlement expense is reflective of a portion of unrecognized loss due to total annuity purchases and lump sum distributions in excess of total service cost and interest cost for the year. The settlement expense is charged to income as a component of net periodic benefit cost.
2013 2012 2013 2012
43,606,347$ 38,469,765$ 13,755,041$ 12,573,977$ 6,487,668 4,889,116 567,956 567,703 9,944,100 3,940,000 3,314,364 1,313,202
(12,013,519) (3,692,534) (630,249) (699,841)
48,024,596$ 43,606,347$ 17,007,112$ 13,755,041$
Accrued Benefit Costs 4,850,324$ 5,134,492$ 9,819,422$ 8,192,013$ Liability for Pension Benefits 2,434,167 3,348,428 1,363,220 -
Total Liabilities Recognized 7,284,491$ 8,482,920$ 11,182,642$ 8,192,013$ 7,856,251$ -$ 15,295,330$ -$
Accumulated Benefit Obligation 47,665,055$ 53,831,449$ 50,104,577$ 22,580,859$
3,671,264 3,106,932 1,573,427 1,090,194 2,245,208 2,595,249 1,824,777 1,092,654
(1,987,211) (2,025,314) (723,487) (467,168) Transition Obligation 65,049 67,630 2,835 - Net Losses 991,100 13,289 - - Prior Service Cost 475,627 1,137,468 1,780,454 161,122 Settlement Expense 1,531,825 - - -
6,992,862$ 4,895,254$ 4,458,006$ 1,876,802$
Actual Return on Plan Assets
Pension Benefits Post-Retirement Benefits
Change in Plan Assets:Fair Value of Plan Assets
at Beginning of Year
Unrecognized Liabilities
Employer ContributionBenefits PaidFair Value of Plan Assets at
End of Year
Funded Status:Recognized Liabilities
on Plan Assets
Total Net Periodic Benefit Cost
Components of Net Periodic Benefit Cost:
Service CostInterest CostExpected (Return) Loss
The Farmers Automobile Insurance Association Notes to Financial Statements – Statutory Basis
-21-
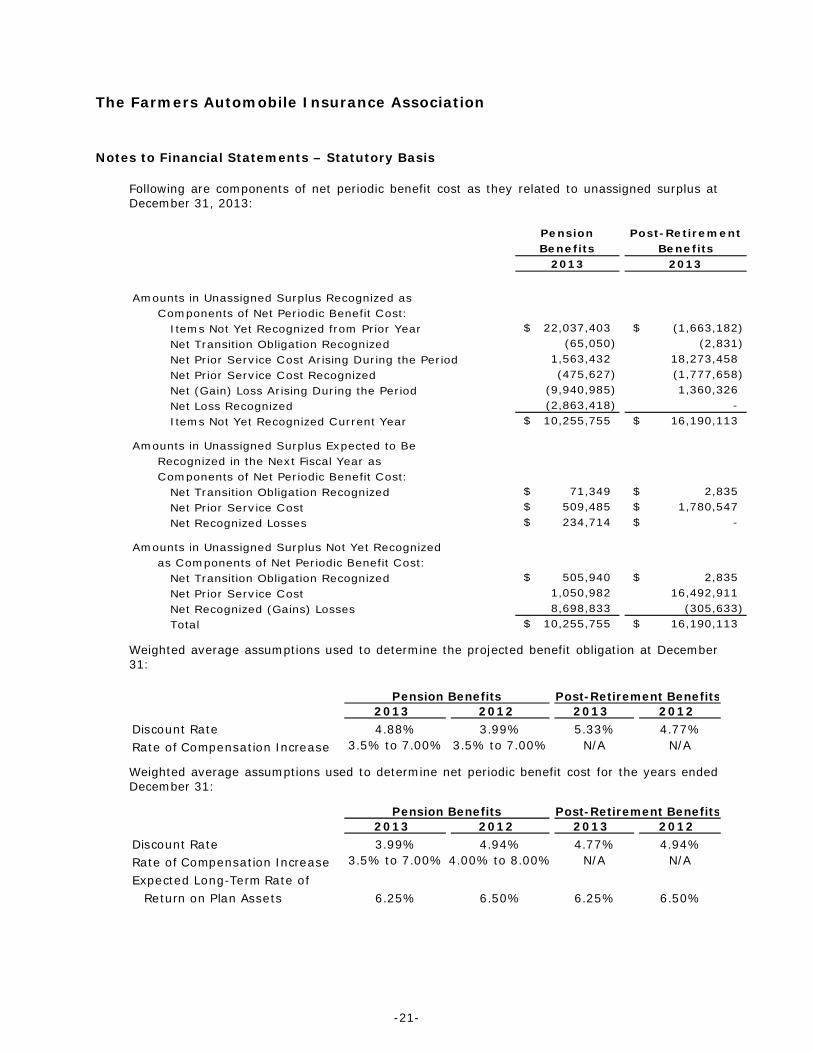
Following are components of net periodic benefit cost as they related to unassigned surplus at December 31, 2013:
Weighted average assumptions used to determine the projected benefit obligation at December 31:
Weighted average assumptions used to determine net periodic benefit cost for the years ended December 31:
Pension Post-RetirementBenefits Benefits
2013 2013
Amounts in Unassigned Surplus Recognized asComponents of Net Periodic Benefit Cost:
Items Not Yet Recognized from Prior Year 22,037,403$ (1,663,182)$ Net Transition Obligation Recognized (65,050) (2,831) Net Prior Service Cost Arising During the Period 1,563,432 18,273,458 Net Prior Service Cost Recognized (475,627) (1,777,658) Net (Gain) Loss Arising During the Period (9,940,985) 1,360,326 Net Loss Recognized (2,863,418) - Items Not Yet Recognized Current Year 10,255,755$ 16,190,113$
Amounts in Unassigned Surplus Expected to BeRecognized in the Next Fiscal Year as
Net Transition Obligation Recognized 71,349$ 2,835$ Net Prior Service Cost 509,485$ 1,780,547$ Net Recognized Losses 234,714$ -$
Amounts in Unassigned Surplus Not Yet Recognizedas Components of Net Periodic Benefit Cost:
Net Transition Obligation Recognized 505,940$ 2,835$ Net Prior Service Cost 1,050,982 16,492,911 Net Recognized (Gains) Losses 8,698,833 (305,633) Total 10,255,755$ 16,190,113$
Components of Net Periodic Benefit Cost:
2013 2012 2013 2012Discount Rate 4.88% 3.99% 5.33% 4.77%Rate of Compensation Increase 3.5% to 7.00% 3.5% to 7.00% N/A N/A
Pension Benefits Post-Retirement Benefits
2013 2012 2013 2012Discount Rate 3.99% 4.94% 4.77% 4.94%Rate of Compensation Increase 3.5% to 7.00% 4.00% to 8.00% N/A N/AExpected Long-Term Rate of
Return on Plan Assets 6.25% 6.50% 6.25% 6.50%
Pension Benefits Post-Retirement Benefits

The Farmers Automobile Insurance Association Notes to Financial Statements – Statutory Basis
-22-
The health care portion of the post-retirement benefit plan is contributory, with participants’ contributions adjusted annually as determined by the Association; the life insurance portion of the post-retirement benefit plan is non-contributory. The health care cost trend rate in 2013 was assumed to be 8.5 percent for one year, then 8.0 percent for one year, then 5.0 percent by 2022. In 2012 the health care cost trend rate was 7.0 percent for one year, then 6.0 percent for three years, then 5.5 percent thereafter.
Assumed health care cost trend rates have a significant effect on the amounts reported for the health care plans. A one-percentage-point change in assumed health care trend rates would have the following effects:
During 2013, the Association adopted Statement of Statutory Accounting Principle No. 102, Accounting for Pensions, which requires the difference between the projected benefit obligation and the fair value of plan assets to be recorded on the statutory balance sheet. If the projected benefit obligation is greater than the fair value of plan assets, a liability is recorded. However, if the projected benefit obligation is less than the fair value of plan assets, a non‐admitted asset is recorded. In addition, non-vested participants are to be included in calculations such as the projected benefit obligation and net periodic pension cost. The surplus impact of this new pronouncement can be recognized upon adoption or amortized over a period not to exceed ten years. As of December 31, 2013, the Association has recognized $2,434,167 and anticipates the remaining liability of $7,856,251 will be recognized over a three-year period.
Additionally, the Association adopted Statement of Statutory Accounting Principle No. 92, Accounting for Postretirement Benefits Other Than Pensions, which requires a liability, equal to the accumulated post-retirement benefit obligation, be established for vested and non‐vested employees. The surplus impact of this new pronouncement can be recognized upon adoption or amortized over a period not to exceed ten years. As of December 31, 2013, the Association has recognized $1,363,220 and anticipates the remaining liability of $15,295,330 will be recognized over a nine-year period.
The retirement plan assets are held in a deposit administration contract and equity securities. The Trustees of the Farmers Automobile Insurance Association Retirement Plan maintain a deposit administration contract with Pekin Life Insurance Company for pension benefits. The fund is a group annuity contract consisting of employer contributions with guaranteed interest, less annuities purchased to provide benefit payments to retirees and lump sum benefits paid directly to participants. The fair value of the account included in plan assets of the Association and its affiliates was $25,225,265 and $27,974,521 as of December 31, 2013 and 2012, respectively, or 42 and 50 percent of total plan assets. Equity securities comprise the remaining plan assets. At December 31, 2013 and 2012, equity securities amounted to $35,327,650 and $27,723,868, respectively, or 58 and 50 percent of total plan assets.
The expected long-term rate of return on plan assets was selected based upon current market conditions, Association experience, and future Association expectations.
One Percentage One PercentagePoint Increase Point Decrease
Effect on Total of Service and InterestCost Components 859,750$ (658,533)$
Effect on Post-Retirement Benefit Obligation 7,615,954$ (5,986,442)$

The Farmers Automobile Insurance Association Notes to Financial Statements – Statutory Basis
-23-
The specific goal of the investment portfolio is to maintain a fully funded plan over time to ensure the benefit for the plan participants. New contributions are invested in equity securities until the amount in equities exceeds 45 percent of the plan’s total assets. Additional amounts will be paid into the deposit administration fund, unless the equity portfolio falls under 45 percent. If the equity portfolio exceeds 60 percent of the plan’s assets, part of the equity portfolio will be liquidated and proceeds moved into the deposit administration fund within a reasonable time frame. There are three return objectives. The primary benchmark is the projected annual rate of return used by the plan’s actuary. The average annualized investment performance of the invested assets, net of investment related expenses, should be equal to or in excess of this benchmark. The secondary (equity) benchmark is the percent total rate of return of a balanced portfolio comprised of a 70 percent weighting of the Standard & Poor’s 500 Index and a 30 percent weighting of the Barclay’s Government Corporate Index. The secondary (fixed income) benchmark is the weighted average rate of return of the Association’s mortgage-backed securities portfolio less 0.75 percent for expenses (0.25 percent) and spread (0.50 percent). All plan assets in excess of those funds targeted for short-term cash flow needs should be invested in a manner consistent with the basic principles of prudent long-term portfolio management. Derivatives, private placement securities, and commodity contracts are prohibited investment vehicles. The Trustees of the plan recognize the long-term nature of the majority of the plan’s assets.
The Association’s Retirement Plan maintains a contract to partially fund health benefits provided to certain retirees and eligible dependents through a deposit administration contract with Pekin Life Insurance Company. The permissible contract funding was determined in accordance with generally recognized and accepted actuarial principles and practices which are consistent with the Actuarial Standards of Practice. At December 31, 2013 and 2012, the fair value of the account was $21,225,504 and $17,048,871 respectively. Contributions of $4,232,911 and $1,666,500 were made in 2013 and 2012, respectively, into this deposit administration fund. The Association’s share of the contribution was $3,314,364 and $1,313,202, in 2013 and 2012, respectively.
The Company utilizes the following valuation techniques in determining the level, within the fair value hierarchy, of the Pension Plan and Post-Retirement Plan assets:
Level 1 – Quoted market prices reported on the active markets on which the individual stocks and money market funds are traded.
Level 3 – Principal valuation technique is discounted cash flow. Unobservable inputs are credit rate and payout date.

The Farmers Automobile Insurance Association Notes to Financial Statements – Statutory Basis
-24-
The following table sets forth by level, within the fair value hierarchy, the total assets for the Association and its affiliate, Pekin Life Insurance Company, of the Pension Plan and Post-Retirement Plan at fair value as of December 31, 2013:
Level 1 Level 2 Level 3 TotalPension Plan Assets:
Equity Securities Consumer Discretionary 3,027,080$ -$ -$ 3,027,080$ Consumer Staples 3,487,485 - - 3,487,485 Energy 3,576,100 - - 3,576,100 Financials 5,914,907 - - 5,914,907 Health Care 2,538,950 - - 2,538,950 Industrials 4,856,775 - - 4,856,775 Information Technology 3,545,385 - - 3,545,385 Materials 918,950 - - 918,950 Telecommunications 1,029,222 - - 1,029,222 Utilities 6,282,090 - - 6,282,090
Total Equity Securities 35,176,944$ -$ -$ 35,176,944$
Cash and Cash Equivalents 150,706 - - 150,706 Deposit Administration Contract - - 25,225,265 25,225,265
Total Pension Plan Assets 35,327,650$ -$ 25,225,265$ 60,552,915$
Post-Retirement Plan Assets:Deposit Administration Contract - - 21,225,504 21,225,504
Total Post-Retirement Plan Assets -$ -$ 21,225,504$ 21,225,504$
Assets at Fair Value as of December 31, 2013

The Farmers Automobile Insurance Association Notes to Financial Statements – Statutory Basis
-25-
The following table sets forth by level, within the fair value hierarchy, the total assets for the Association and its affiliate, Pekin Life Insurance Company, of the Pension Plan and Post-Retirement Plan at fair value as of December 31, 2012:
The table below sets forth a summary of changes in the fair value of the Pension Plan and Post Retirement Plan’s level three assets for the years ended December 31:
Level 1 Level 2 Level 3 TotalPension Plan Assets:
Equity Securities Consumer Discretionary 2,237,510$ -$ -$ 2,237,510$ Consumer Staples 2,899,210 - - 2,899,210 Energy 2,392,003 - - 2,392,003 Financials 4,027,180 - - 4,027,180 Health Care 1,943,212 - - 1,943,212 Industrials 3,657,415 - - 3,657,415 Information Technology 2,568,766 - - 2,568,766 Materials 787,730 - - 787,730 Telecommunications 891,524 - - 891,524 Utilities 6,117,465 - - 6,117,465
Total Equity Securities 27,522,015$ -$ -$ 27,522,015$
Cash and Cash Equivalents 201,853 - - 201,853 Deposit Administration Contract - - 27,974,521 27,974,521
Total Pension Plan Assets 27,723,868$ -$ 27,974,521$ 55,698,389$
Post-Retirement Plan Assets:Deposit Administration Contract - - 17,048,871 17,048,871
Total Post-Retirement Plan Assets -$ -$ 17,048,871$ 17,048,871$
Assets at Fair Value as of December 31, 2012
2013 2012 2013 2012Balance, Beginning of Year 27,974,521$ 26,304,752$ 17,048,871$ 15,503,357$ Interest Income 1,067,354 1,218,603 732,465 720,939 Purchases 12,700,000 5,000,000 4,232,911 1,666,500 Withdrawals (16,516,610) (4,548,834) (788,743) (841,925) Balance, End of Year 25,225,265$ 27,974,521$ 21,225,504$ 17,048,871$
Level 3 AssetsPension Benefits Post-Retirement Benefits

The Farmers Automobile Insurance Association Notes to Financial Statements – Statutory Basis
-26-
8. Income Taxes
Current law governing the taxation of property and casualty insurance companies requires substantial adjustments to statutory net income in arriving at taxable income. The effective tax rate differs from the federal income tax rate of 34 percent in 2013 and 2012 due to the following differences between statutory and tax valuations of assets and liabilities:
2013 2012
Federal Income Tax, at Expected Rates 4,628,234$ 9,612,725$ Tax Exempt Interest (1,610,787) (1,773,230) Capital Gains, Statutory vs. Taxable (32,026) (3,368,458) Dividends Received Deduction (390,713) (470,734) Adjustment for Prior Year (Over) Under Accrual (816,039) 993,716 Unearned Premium 905,661 1,272,103 Pension Benefits (96,617) 716,132 Post-Retirement Benefits 332,368 - Loss Reserve Discounting 7,262 (1,190,425) Salvage and Subrogation (20,084) 13,441 Bonus Depreciation 85,030 140,000 Alternative Minimum Tax - (1,107,063) Other 403,958 (124,444)
Federal Income Tax Expense 3,396,247$ 4,713,763$

The Farmers Automobile Insurance Association Notes to Financial Statements – Statutory Basis
-27-
The components of the net deferred tax asset at December 31, 2013 and 2012 are as follows:
Ordinary Capital Total
Gross Deferred Tax Assets 30,219,409$ -$ 30,219,409$ Statutory Valuation Allowance - - - Adjusted Gross Deferred Tax Assets 30,219,409 - 30,219,409 Deferred Tax Assets Non-Admitted - - - Subtotal Net Admitted Deferred Tax Asset 30,219,409 - 30,219,409 Deferred Tax Liabilities 1,146,664 5,887,158 7,033,822 Net Admitted Deferred Tax Assets 29,072,745$ (5,887,158)$ 23,185,587$
Ordinary Capital Total
Gross Deferred Tax Assets 27,756,239$ -$ 27,756,239$ Statutory Valuation Allowance - - - Adjusted Gross Deferred Tax Assets 27,756,239 - 27,756,239 Deferred Tax Assets Non-Admitted 3,136,618 - 3,136,618 Subtotal Net Admitted Deferred Tax Asset 24,619,621 - 24,619,621 Deferred Tax Liabilities 1,236,675 3,469,807 4,706,482 Net Admitted Deferred Tax Assets 23,382,946$ (3,469,807)$ 19,913,139$
Ordinary Capital Total
Gross Deferred Tax Assets 2,463,170$ -$ 2,463,170$ Statutory Valuation Allowance - - - Adjusted Gross Deferred Tax Assets 2,463,170 - 2,463,170 Deferred Tax Assets Non-Admitted (3,136,618) - (3,136,618) Subtotal Net Admitted Deferred Tax Asset 5,599,788 - 5,599,788 Deferred Tax Liabilities (90,011) 2,417,351 2,327,340 Net Admitted Deferred Tax Assets 5,689,799$ (2,417,351)$ 3,272,448$
Change
2013
2012

The Farmers Automobile Insurance Association Notes to Financial Statements – Statutory Basis
-28-
The net admitted deferred tax asset was determined using the guidance related to admissibility provided in the following paragraphs of NAIC Statement of Statutory Accounting Principles No. 101 (SSAP 101).
Ordinary Capital Total
Admissible Under Paragraph:11a. Ability to Recover Taxes Paid
in Prior Years 8,717,847$ -$ 8,717,847$ 11b. Expected to be Realized, After
Application of Threshold Limitations 16,595,700 - 16,595,700
11c. Offset of Deferred Tax Liabilities 4,905,862 - 4,905,862
Total Admitted Deferred Tax Assets 30,219,409$ -$ 30,219,409$
Ordinary Capital Total
Admissible Under Paragraph:11a. Ability to Recover Taxes Paid
in Prior Years 3,720,000$ -$ 3,720,000$ 11b. Expected to be Realized, After
Application of Threshold Limitations 16,193,139 - 16,193,139
11c. Offset of Deferred Tax Liabilities 4,706,482 - 4,706,482
Total Admitted Deferred Tax Assets 24,619,621$ -$ 24,619,621$
Ordinary Capital Total
Admissible Under Paragraph:11a. Ability to Recover Taxes Paid
in Prior Years 4,997,847$ -$ 4,997,847$ 11b. Expected to be Realized, After
Application of Threshold Limitations 402,561$ -$ 402,561$
11c. Offset of Deferred Tax Liabilities 199,380$ -$ 199,380$
Total Admitted Deferred Tax Assets 5,599,788$ -$ 5,599,788$
Change
2013
2012
2013 2012
Ratio used to determine recovery period and threshold limitation amount under paragraph 11b 944% 984%
Amount of Adjusted Capital and Surplus used todetermine recovery period and thresholdlimitation under paragraph 11b 478,567,354$ 454,401,196$

The Farmers Automobile Insurance Association Notes to Financial Statements – Statutory Basis
-29-
The major components of current income taxes incurred and net deferred tax assets as of December 31, 2013 and 2012, are as follows:
2013 2012 ChangeCurrent Income Tax
Federal & Foreign 4,183,247$ 4,827,110$ (643,863)$ Prior Year Under (Over) Accrual of Tax Reserves (197,302) 993,716 (1,191,018) Alternative Minimum Tax (589,698) (1,107,063) 517,365 Federal Income Tax Expense 3,396,247$ 4,713,763$ (1,317,516)$
Deferred Tax Assets:Ordinary
Discounting of unpaid losses 6,489,768$ 6,482,342$ 7,426$ Unearned premium reserve 14,261,510 13,355,849 905,661 Advance Premium 329,591 266,102 63,489 Compensation and benefits accrual 585,071 568,448 16,623 Pension accrual 1,649,110 1,745,727 (96,617) Post-retirement benefit reserve discount 332,368 193,331 139,037 Post-retirement/health care accrual 3,338,604 1,559,480 1,779,124 Transition liability for pension benefits 827,617 - 827,617 Transition liability for post-retirement benefits 463,495 - 463,495 Nonadmitted assets 1,592,337 2,131,960 (539,623) Other 349,938 1,453,000 (1,103,062) Total Ordinary Deferred Tax Assets 30,219,409 27,756,239 2,463,170
Statutory Valuation Allowance - - - Non-admitted - 3,136,618 (3,136,618) Admitted Ordinary Deferred Tax Assets 30,219,409 24,619,621 5,599,788 Admitted Capital Deferred Tax Assets - - - Admitted Deferred Tax Assets 30,219,409$ 24,619,621$ 5,599,788$
Deferred Tax Liabilities:Ordinary
Salvage and Subrogation 180,380$ 200,464$ (20,084)$ Fixed assets bonus depreciation 842,530 - 842,530 Other 123,754 1,036,211 (912,457) Total Ordinary Deferred Tax Liabilities 1,146,664 1,236,675 (90,011)
CapitalUnrealized Gains 5,887,158$ 3,469,807$ 2,417,351$ Total Capital Deferred Tax Liabilities 5,887,158 3,469,807 2,417,351 Total Deferred Tax Liabilities 7,033,822$ 4,706,482$ 2,327,340$
Net Deferred Tax Assets 23,185,587$ 19,913,139$ 3,272,448$

The Farmers Automobile Insurance Association Notes to Financial Statements – Statutory Basis
-30-
The Association has no tax-planning strategies that had a material impact on adjusted gross and net admitted deferred tax assets.
The 2013 Federal income tax incurred of $3,396,247 includes tax of $1,946,607 on realized capital gains. Federal income taxes which would be available for recoupment in the event of future tax losses are $4,172,080 and $4,545,767 for 2013 and 2012, respectively. There are no capital losses available to be carried forward to offset future capital gains.
Federal income tax returns of the Association have been examined by the Internal Revenue Service for all years through 2010. In the opinion of management, the liability for federal income taxes is sufficient to cover computed taxes for the current and prior years that are currently payable. A state income tax expense of $1,062,790 and $1,085,417 in 2013 and 2012, respectively, is included in underwriting expenses.
As of December 31, 2013, the Association has not identified any material loss contingencies arising from uncertain tax positions.
9. Structured Settlements
The Association has purchased annuities of which the claimant is payee, but for which the Association is contingently liable. The aggregate amount of annuities from all life insurers was $7,477,812 and $6,406,947 at December 31, 2013 and 2012, respectively.
10. Capital and Surplus
The Association is required to maintain minimum capital and surplus as established by the Department. The Association is also subject to Risk-Based Capital (RBC) requirements promulgated by the NAIC and adopted by the Department. The RBC standards establish uniform minimum capital requirements for insurance companies. The RBC formula applies various weighting factors to financial balances or various levels of activities based on the perceived degree of risk. At December 31, 2013, the Association’s surplus exceeded the minimum levels required by the Department and RBC standards.
The Association’s unassigned surplus was increased (reduced) by the following cumulative amounts at December 31, 2013 and 2012, respectively:
2013 2012
Net Unrealized Gains 149,606,617$ 136,599,588$ Non-Admitted Assets (5,425,852) (6,270,472)Provision for Reinsurance (20,789) (164,151)

SUPPLEMENTAL FINANCIAL INFORMATION

-31-
Independent Auditor’s Report on the Supplementary Information
To the Board of Directors The Farmers Automobile Insurance Association Pekin, Illinois
Our audits were made for the purpose of forming an opinion on the statutory financial statements taken as a whole. The supplementary information is presented for purposes of additional analysis and is not a required part of the statutory financial statements. The supplementary information is the responsibility of management and was derived from, and relates directly to, the underlying accounting and other records used to prepare the financial statements. This information is presented in a format consistent with the Annual Statement filed by the Association with the regulatory authorities. Such information has been subjected to the auditing procedures applied in the audit of the statutory financial statements and certain additional procedures, including comparing and reconciling such information directly to the underlying accounting and other records used to prepare the financial statements or to the financial statements themselves, and other additional procedures in accordance with auditing standards generally accepted in the United States of America. In our opinion, the information is fairly stated in all material respects in relation to the statutory financial statements as a whole.
Strohm Ballweg, LLP
Madison, Wisconsin May 2, 2014

The Farmers Automobile Insurance Association Summary Investment Schedule December 31, 2013
See Independent Auditor’s Report on the Supplementary Information
-32-
SecuritiesLending
ReinvestedCollateral Total
Amount % Amount Amount Amount %
1. Bonds:1.1 U.S. Treasury Securities 2,202,698$ 0.2 2,202,698$ -$ 2,202,698$ 0.21.2 U.S. Government Agency Obligations:
1.21 Issued by U.S. Government Agencies - - - - - -1.22 Issued by U.S. Government Sponsored Agencies - - - 3,668,381 3,668,381 0.4
1.3 Foreign Government (Including Canada, Excluding MBS) 5,736,635 0.6 5,736,635 619,354 6,355,989 0.71.4 Securities Issued by States, Territories, and Possessions
and Political Subdivisions in the U.S.:1.41 U.S. States and Territories and Possessions
General Obligations 13,515,222 1.4 13,515,222 - 13,515,222 1.41.42 Political Subdivisions of U.S. States, Territories
and Possessions and Political SubdivisionsGeneral Obligations 27,946,277 2.9 27,946,277 - 27,946,277 2.9
1.43 Revenue and Assessment Obligations 95,258,815 10.0 95,258,815 - 95,258,815 10.01.44 Industrial Development and Similar Obligations - - - - - -
1.5 Mortgage-Backed Securities (Includes Residentialand Commercial MBS):1.51 Pass-Through Securities:
1.511 Issued or Guaranteed by GNMA 1,326,748 0.1 1,326,748 - 1,326,748 0.11.512 Issued or Guaranteed by FNMA and FHLMC 95,696,215 10.0 95,696,215 - 95,696,215 10.01.513 All Other - - - - - -
1.52 CMO's and REMIC's1.521 Issued by GNMA, FNMA and FHLMC or VA 1,398,478 0.1 1,398,478 - 1,398,478 0.11.522 Issued by Non-U.S. Government Issuers
and Collateralized by Mortgage-BackedSecurities Issued or Guaranteed by Agencies Shown in Line 1.521 - - - 1,028,003 1,028,003 0.1
1.523 All Other 60,738,281 6.4 60,738,281 - 60,738,281 6.42. Other Debt Securities (Excluding Short Term):
2.1 Unaffiliated Domestic Securities(Includes Credit Tenant Loans and Hybrid Securities) 242,388,142 25.5 242,388,142 - 242,388,142 25.5
2.2 Unaffiliated Foreign Securities (Including Canada) 77,762,189 8.1 77,762,189 - 77,762,189 8.12.3 Affiliated Securities - - - - - -
3. Equity Interests:3.1 Investments in Mutual Funds - - - - - -3.2 Preferred Stocks - - - - - -3.3 Publicly Traded Equity Securities (Excl. Preferred Stocks):
3.31 Affiliated - - - - - -3.32 Unaffiliated 33,819,484 3.5 33,819,484 - 33,819,484 3.5
3.4 Other Equity Securities3.41 Affiliated 205,103,256 21.5 205,103,256 - 205,103,256 21.53.42 Unaffiliated 3,256,741 0.3 3,256,741 - 3,256,741 0.3
3.5 Tangible Personal Property Under Lease4. Mortgage Loans - - - - - -5. Real Estate Investments
5.1 Property Occupied by Company 9,601,047 1.0 9,601,047 - 9,601,047 1.05.2 Property Held for Production of Income 1,434,562 0.2 1,434,562 - 1,434,562 0.25.3 Property Held for Sale - - - - - -
6. Contract Loans - - - - - -7. Derivatives - - - - - -8. Receivable for Securities - - - - - -9. Securities Lending Reinvested Collateral Assets 42,951,417 4.5 42,951,417 - - -10. Cash and Short-Term Investments 33,997,024 3.6 33,997,024 37,635,679 71,632,703 7.511. Other Invested Assets 783,700 0.1 783,700 - 783,700 0.112. Total Invested Assets 954,916,931$ 100.0 954,916,931$ 42,951,417$ 954,916,931$ 100.0
Admitted Assets asGross Investment Reported in the
Holdings Annual Statement

The Farmers Automobile Insurance Association Investment Risks Interrogatories December 31, 2013
See Independent Auditor’s Report on the Supplementary Information
-33-
1. State the reporting entity's total admitted assets as reported on Page 2 of the annual statement. 1,153,521,370$
2. State the 10 largest exposures to a single issuer/borrower/investment, excluding U.S. government, U.S. government agency securities, and those U.S. Government money market funds listed in the Appendix to the SVO Purposes and Procedures Manual as exempt, property occupied by the companyand policy loans:
1 2 3 4Percentage
of TotalIssuer Description of Exposure Amount Admitted Assets
2.01 Pekin Insurance Company Affiliated Common Stock 117,101,387$ 10.2%2.02 Pekin Life Insurance Company Affiliated Common Stock 88,000,869$ 7.6%2.03 Fannie Mae (FN, FNR, FNMA) Bond 50,763,844$ 4.4%2.04 Freddie Mac (FH, FHLM, FHR, FG) Bond 46,330,849$ 4.0%2.05 CCCIT Bond 4,561,413$ 0.4%2.06 Apple Inc Bond/Stock 4,412,156$ 0.4%2.07 Univ of North Carolina NC Sys Bond 4,404,664$ 0.4%2.08 Cleveland OH Bond 4,257,123$ 0.4%2.09 Austin TX Revenue Bond 4,224,688$ 0.4%2.10 Triborough NY Bridge & Tunnel Bond 4,054,333$ 0.4%
3. State the amounts and percentages of the reporting entity's total admitted assets held in bonds and preferred stocks by NAIC rating:
Bonds 1 2 Preferred Stocks 3 4
3.01 NAIC-1 558,122,586$ 48.4% 3.07 P/RP-1 -$ 0.0%3.02 NAIC-2 75,729,811$ 6.6% 3.08 P/RP-2 -$ 0.0%3.03 NAIC-3 -$ 0.0% 3.09 P/RP-3 -$ 0.0%3.04 NAIC-4 -$ 0.0% 3.10 P/RP-4 -$ 0.0%3.05 NAIC-5 -$ 0.0% 3.11 P/RP-5 -$ 0.0%3.06 NAIC-6 -$ 0.0% 3.12 P/RP-6 -$ 0.0%
4. Assets held in foreign investments:1 2
4.01 Are assets held in foreign investments less than 2.5%of the reporting entity's total admitted assets?
4.02 Total admitted assets held in foreign investments 76,967,639$ 6.7%
5. Aggregate foreign investment exposure by NAIC sovereign rating:1 2
5.01 Countries rated NAIC-1 67,353,387$ 6.1%5.02 Countries rated NAIC-2 9,614,252$ 0.8%5.03 Countries rated NAIC-3 or below -$ 0.0%
Yes [ ] No [ X ]
The Farmers Automobile Insurance Association Investment Risks Interrogatories December 31, 2013
See Independent Auditor’s Report on the Supplementary Information
-34-
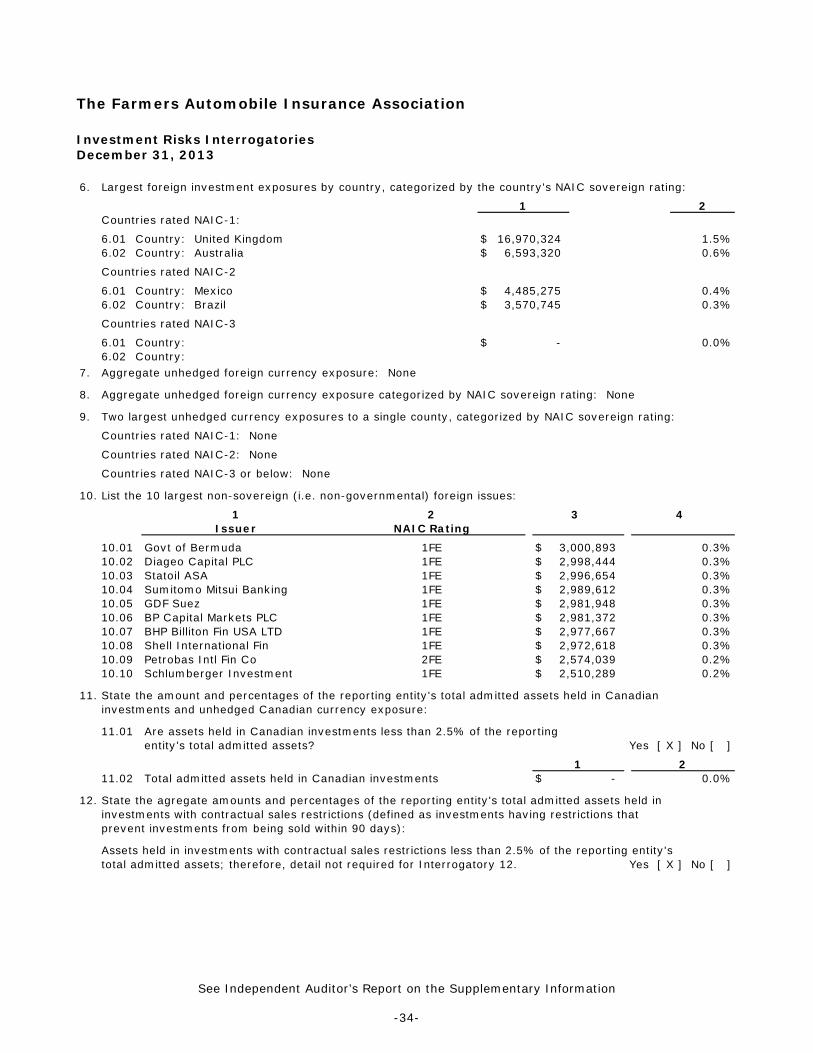
6. Largest foreign investment exposures by country, categorized by the country's NAIC sovereign rating:
1 2Countries rated NAIC-1:
6.01 Country: United Kingdom 16,970,324$ 1.5%6.02 Country: Australia 6,593,320$ 0.6%
Countries rated NAIC-2
6.01 Country: Mexico 4,485,275$ 0.4%6.02 Country: Brazil 3,570,745$ 0.3%
Countries rated NAIC-3
6.01 Country: -$ 0.0%6.02 Country:
7. Aggregate unhedged foreign currency exposure: None
8. Aggregate unhedged foreign currency exposure categorized by NAIC sovereign rating: None
9. Two largest unhedged currency exposures to a single county, categorized by NAIC sovereign rating:
Countries rated NAIC-1: None
Countries rated NAIC-2: None
Countries rated NAIC-3 or below: None
10. List the 10 largest non-sovereign (i.e. non-governmental) foreign issues:
1 2 3 4Issuer NAIC Rating
10.01 Govt of Bermuda 1FE 3,000,893$ 0.3%10.02 Diageo Capital PLC 1FE 2,998,444$ 0.3%10.03 Statoil ASA 1FE 2,996,654$ 0.3%10.04 Sumitomo Mitsui Banking 1FE 2,989,612$ 0.3%10.05 GDF Suez 1FE 2,981,948$ 0.3%10.06 BP Capital Markets PLC 1FE 2,981,372$ 0.3%10.07 BHP Billiton Fin USA LTD 1FE 2,977,667$ 0.3%10.08 Shell International Fin 1FE 2,972,618$ 0.3%10.09 Petrobas Intl Fin Co 2FE 2,574,039$ 0.2%10.10 Schlumberger Investment 1FE 2,510,289$ 0.2%
11. State the amount and percentages of the reporting entity's total admitted assets held in Canadianinvestments and unhedged Canadian currency exposure:
11.01 Are assets held in Canadian investments less than 2.5% of the reportingentity's total admitted assets? Yes [ X ] No [ ]
1 211.02 Total admitted assets held in Canadian investments -$ 0.0%
12. State the agregate amounts and percentages of the reporting entity's total admitted assets held ininvestments with contractual sales restrictions (defined as investments having restrictions thatprevent investments from being sold within 90 days):
Assets held in investments with contractual sales restrictions less than 2.5% of the reporting entity'stotal admitted assets; therefore, detail not required for Interrogatory 12. Yes [ X ] No [ ]

The Farmers Automobile Insurance Association Investment Risks Interrogatories December 31, 2013
See Independent Auditor’s Report on the Supplementary Information
-35-
13. Assets held in equity interests less than 2.5% of the reporting entity's total admitted assets, therefore detail not required for interrogatory 13: Yes [ ] No [ X ]
2 3
13.02 Pekin Insurance Company 117,101,387$ 10.2%13.03 Pekin Life Insurance Company 88,000,869$ 7.6%13.04 Pfizer Inc 895,039$ 0.1%13.05 American International Group 753,753$ 0.1%13.06 Celgene Coprp 619,407$ 0.1%13.07 Morgan Stanley 616,444$ 0.1%13.08 Eaton Corp PLC 549,813$ 0.0%13.09 Ameriprise Financial Inc 548,213$ 0.0%13.10 Wells Fargo & Co 536,083$ 0.0%13.11 Lyondellbasell Indu-CL A 523,265$ 0.0%
14. State the amounts and percentages of the entity's total admitted assets held in nonaffiliated, privately placed equities (included in other equity securities) and excluding securities eligible for sale under Securities Exchange Commission (SEC) Rule 144a or SEC Rule 144 without volume restrictions:
Assets held in nonaffiliated, privately placed equities less than 2.5% of the reporting entity's total admitted assets, therefore detail not required for interrogatory 14. Yes [ X ] No [ ]
15. State the aggregate amounts and percentages of the entity's total admitted assets held in general partnership interests (included in other equity securities):
Assets held in general partnership interests less than 2.5% of the reporting entity's total admitted assets, therefore detail not required for interrogatory 15. Yes [ X ] No [ ]
16. With respect to mortgage loans reported in Schedule B, state the amounts and percentages of the reporting entity's total admitted assets held:
Mortgage loans reported in Schedule B less than 2.5% of the reporting entity's total admitted assets, therefore detail not required for interrogatories 16 and 17. Yes [ X ] No [ ]
17. Aggregate mortgage loans having the following loan-to-value ratios as determined from the most current appraisal as of the annual statement date: None
18. Are assets held in investments held in real estate reported less than 2.5% of the reporting entity's total admitted assets? Yes [ X ] No [ ]
19. Are assets held in investments held in mezzanine real estate loans less than 2.5% of the reporting entity's total admitted assets? Yes [ X ] No [ ]
Issuer1
20. State the amounts and percentages of the reporting entity's total admitted assets subject to the following types of agreements:
At End ofEach Quarter
(Unaudited) (Unaudited) (Unaudited)1st Qtr 2nd Qtr 3rd Qtr
1 2 3 4 520.01 Securities lending (do not
include assets held ascollateral for suchtransactions) 42,834,588$ 3.7% 50,486,849$ 43,277,588$ 45,306,140$
At Year-End

The Farmers Automobile Insurance Association Investment Risks Interrogatories December 31, 2013
See Independent Auditor’s Report on the Supplementary Information
-36-
21. State the amounts and percentages indicated below for warrants not attached to other financial instruments, options, caps, and floors: None
22. State the amounts and percentages indicated below of potential exposure (defined as the amount determined in accordance with the NAIC Annual Statement Instructions) for collars, swaps, and forwards: None
23. State the amounts and percentages indicated below of potential exposure (defined as the amount determined in accordance with the NAIC Annual Statement Instructions) for futures contracts: None

The Farmers Automobile Insurance Association Reinsurance Interrogatories December 31, 2013
See Independent Auditor’s Report on the Supplementary Information
-37-
7.1 Has this reporting entity reinsured any risk with any other entity under a quota share reinsurancecontract that includes a provision that would limit the reinsurer's losses below the stated quota sharepercentage (e.g., a deductible, a loss ratio corridor, a loss ratio cap, an aggregate limit or any similarprovisions)?
Yes [ ] No [ X ]
9.1 Has the reporting entity ceded any risk under any reinsurance contract (or under multiple contracts withthe same reinsurer or its affiliates) for which during the period covered by the statement: (i) it recordeda positive or negative underwriting result greater than 5% of prior year-end surplus as regardspolicyholders or it reported calendar year written premium ceded or year-end loss and loss expensereserves ceded greater than 5% of prior year-end surplus as regards policyholders; (ii) it accounted forthat contract as reinsurance and not as a deposit; and (iii) the contract(s) contain one or more of thefollowing features or other features that would have similar results:
a. A contract term longer than two years and the contract is noncancellable by the reporting entityduring the contract term;
b. A limited or conditional cancellation provision under which cancellation triggers an obligation by thereporting entity, or an affiliate of the reporting entity, to enter into a new reinsurance contract withthe reinsurer, or an affiliate of the reinsurer;
c. Aggregate stop loss reinsurance coverage;
d. A unilateral right by either party (or both parties) to commute the reinsurance contract, whetherconditional or not, except for such provisions which are only triggered by a decline in the credit status of the other party;
e. A provision permitting reporting of losses, or payment of losses, less frequently than on a quarterlybasis (unless there is no activity during the period); or
f. Payment schedule, accumulating retentions from multiple years or any features inherently designedto delay timing of the reimbursement to the ceding entity.
Yes [ ] No [ X ]
9.2 Has the reporting entity during the period covered by the statement ceded any risk under anyreinsurance contract (or under multiple contracts with the same reinsurer or its affiliates), for which,during the period covered by the statement, it recorded a positive or negative underwriting resultgreater than 5% of prior year-end surplus as regards policyholders or it reported calendar yearwritten premium ceded or year-end loss and loss expense reserves ceded greater than 5% of prioryear-end surplus as regards policyholders; excluding cessions to approved pooling arrangements orto captive insurance companies that are directly or indirectly controlling, controlled by, or undercommon control with (i) one or more unaffiliated policyholders of the reporting entity, or (ii) anassociation of which one or more unaffiliated policyholders of the reporting entity is a member where:
a. The written premium ceded to the reinsurer by the reporting entity or its affiliates represents fiftypercent (50%) or more of the entire direct and assumed premium written by the reinsurer basedon its most recently available financial statement; or
b. Twenty-five percent (25%) or more of the written premium ceded to the reinsurer has beenretroceded back to the reporting entity or its affiliates in a separate reinsurance contract.
Yes [ ] No [ X ]

The Farmers Automobile Insurance Association Reinsurance Interrogatories December 31, 2013
See Independent Auditor’s Report on the Supplementary Information
-38-
9.3 If yes to 9.1 or 9.2, please provide the following information in the Reinsurance Summary SupplementalFiling for General Interrogatory 9:
a. The aggregate financial statement impact gross of all such ceded reinsurance contracts on thebalance sheet and statement of income;
b. A summary of the reinsurance contract terms and indicate whether it applies to the contractsmeeting the criteria in 9.1 or 9.2; and
c. A brief discussion of management's principle objectives in entering into the reinsurance contractincluding the economic purpose to be achieved.
9.4 Except for transactions meeting the requirements of paragraph 32 of SSAP No. 62R, Property andCasualty Reinsurance, has the reporting entity ceded any risk under any reinsurance contract(or multiple contracts with the same reinsurer or its affiliates) during the period covered by thefinancial statement and either:
a. Accounted for that contract as reinsurance (either prospective or retroactive) under statutoryaccounting principles ("SAP") and as a deposit under generally accepted accounting principles("GAAP"); or
b. Accounted for that contract as reinsurance under GAAP and as a deposit under SAP?
Yes [ ] No [ X ]