Embed Size (px)
Citation preview

Delft University of Technology
Master Thesis
The feasibility research of standard quay wallsfor the port of Rotterdam
Author:Iran Tisheh
Supervisors:Prof.Ir. T. Vellinga
Ass.Prof.dr.ir.J.G. de GijtDr.ir.C.R. BraamDr.ir.P. TanejaIr.E.J. Broos
A thesis submitted in fulfilment of the requirementsfor the degree of Master of Science in Civil Engineering
Department of Hydraulic StructuresTU-Delft Hydraulic Engineering
March 2015

“Genius is one percent inspiration and ninety-nine percent perspiration.”
Thomas Edison 1847-1931

DELFT UNIVERSITY OF TECHNOLOGY
AbstractDepartment of Hydraulic Structures
TU-Delft Hydraulic Engineering
Master of Science
The feasibility research of standard quay walls for the port of Rotterdam
by Iran Tisheh
Future-proof design of quay walls is an interesting issue in civil Engineering, because of the dynamic environ-ment in which quay walls are operating. Designers are confronted with time-changing requirements such aslarger retaining heights and heavier loads. However, a technical and financial analysis has revealed that thedesign of new quay structures can, under certain conditions, be made future-proof by standardization. Bystandardizing the design, this may achieve a certain degree of flexibility. This means that a quay wall can beconverted for multiple types of vessels or multiple types of cargo and therefore becomes future-proof. Variousstandard principle solutions are applicable. However, it should be noted that the exact dimensions of quaywall components, for instance the substructure (the front wall) and the superstructure (the capping beam orrelieving platform), can in principle not be standardized. The dimensions depend namely on major factorssuch as local geotechnical conditions, surcharges, retaining height and the presence of a relieving platform.Nevertheless, standardization is possible in two ways. Firstly, by driving the front wall to a deeper layer thanit is necessary in the first instance and dredging the front side of the quay wall at a later stage. Secondly,by making a strategic choice for a particular quay component or a particular port area. Both ways lead tohigher initial investment costs but results in a quay wall which is significantly more future-proof.

Acknowledgements
This report is part of the graduation project at the Faculty of Civil Engineering & Geosciences at the Delft
University of Technology. This thesis has been carried out under the guidance of Rotterdam Port Authority,
Public Works Rotterdam and the Delft University of Technology.
I would like to thank my supervisors Prof.ir.T. Vellinga, Ass.Prof.dr.ir.J.G. de Gijt, Dr.ir.C.R. Braam, Dr.ir.P.
Taneja & Ir.E.J. Broos for their guidance, comments and recommendations. My special thanks goes to
Ass.Prof.dr.ir.J.G. de Gijt; his ideas and advices were very much appreciated. I would also like to thank
everybody at the Port of Rotterdam Authority and Public Works Rotterdam for providing me with the
necessary information and advice, in particular Henk Brassinga, Ruud van Rooijen, Peter Hoek and Alfred
Roubos.
Finally, I want to thank my family and my partner who have given me unconditional support during my
thesis.
iii

Contents
Abstract ii
Acknowledgements iii
Contents iv
List of Tables vii
List of Figures ix
Abbreviations xii
Nomenclature xiii
1 Introduction 1
1.1 General . . . . . . . . . . . . . . . . . . . . . . . . . . . . . . . . . . . . . . . . . . . . . . . . 1
1.2 Research description . . . . . . . . . . . . . . . . . . . . . . . . . . . . . . . . . . . . . . . . . 2
1.3 Goal of the study . . . . . . . . . . . . . . . . . . . . . . . . . . . . . . . . . . . . . . . . . . . 4
1.4 Research methodology . . . . . . . . . . . . . . . . . . . . . . . . . . . . . . . . . . . . . . . . 5
2 Background 6
2.1 Port of Rotterdam . . . . . . . . . . . . . . . . . . . . . . . . . . . . . . . . . . . . . . . . . . 6
2.2 Uncertain future . . . . . . . . . . . . . . . . . . . . . . . . . . . . . . . . . . . . . . . . . . . 7
2.2.1 Flow of goods . . . . . . . . . . . . . . . . . . . . . . . . . . . . . . . . . . . . . . . . . 7
2.2.2 Developments in the shipping industry . . . . . . . . . . . . . . . . . . . . . . . . . . . 10
2.2.3 Crane size . . . . . . . . . . . . . . . . . . . . . . . . . . . . . . . . . . . . . . . . . . . 13
3 Quay walls 15
3.1 The main types of quay wall . . . . . . . . . . . . . . . . . . . . . . . . . . . . . . . . . . . . . 15
3.1.1 Gravity type structures . . . . . . . . . . . . . . . . . . . . . . . . . . . . . . . . . . . 16
3.1.2 Sheet pile walls . . . . . . . . . . . . . . . . . . . . . . . . . . . . . . . . . . . . . . . . 17
3.1.3 Structures with relieving platforms . . . . . . . . . . . . . . . . . . . . . . . . . . . . . 17
3.1.4 Open berth structures/ piled structures . . . . . . . . . . . . . . . . . . . . . . . . . . 18
3.2 Quay walls in the port of Rotterdam . . . . . . . . . . . . . . . . . . . . . . . . . . . . . . . . 20
3.2.1 Anchored sheet pile walls . . . . . . . . . . . . . . . . . . . . . . . . . . . . . . . . . . 20
3.2.2 Quay walls with relieving structure . . . . . . . . . . . . . . . . . . . . . . . . . . . . . 20
3.3 Quay wall elements . . . . . . . . . . . . . . . . . . . . . . . . . . . . . . . . . . . . . . . . . . 21
3.3.1 Superstructure . . . . . . . . . . . . . . . . . . . . . . . . . . . . . . . . . . . . . . . . 21
3.3.2 Substructure . . . . . . . . . . . . . . . . . . . . . . . . . . . . . . . . . . . . . . . . . 22
iv

Contents v
4 Standardization 27
4.1 Effects of standardization of quay walls . . . . . . . . . . . . . . . . . . . . . . . . . . . . . . 27
4.1.1 Potential positive impacts of standardization . . . . . . . . . . . . . . . . . . . . . . . 27
4.1.2 Potential negative impacts of standardization . . . . . . . . . . . . . . . . . . . . . . . 29
4.2 Effects of standardization in different life cycle phases . . . . . . . . . . . . . . . . . . . . . . 30
5 Research design 32
5.1 Design philosophy . . . . . . . . . . . . . . . . . . . . . . . . . . . . . . . . . . . . . . . . . . 32
5.1.1 Limit states . . . . . . . . . . . . . . . . . . . . . . . . . . . . . . . . . . . . . . . . . . 33
5.1.2 Representative values, design values . . . . . . . . . . . . . . . . . . . . . . . . . . . . 34
5.1.3 Load combinations . . . . . . . . . . . . . . . . . . . . . . . . . . . . . . . . . . . . . . 34
5.1.4 Determination of design water levels . . . . . . . . . . . . . . . . . . . . . . . . . . . . 35
5.2 Design models and calculation methods . . . . . . . . . . . . . . . . . . . . . . . . . . . . . . 36
5.2.1 Blum method . . . . . . . . . . . . . . . . . . . . . . . . . . . . . . . . . . . . . . . . . 37
5.2.2 Beam on elastic foundation . . . . . . . . . . . . . . . . . . . . . . . . . . . . . . . . . 38
5.2.3 Finite Element Analysis . . . . . . . . . . . . . . . . . . . . . . . . . . . . . . . . . . . 39
5.3 Requirements & boundary conditions . . . . . . . . . . . . . . . . . . . . . . . . . . . . . . . . 39
5.3.1 Introduction . . . . . . . . . . . . . . . . . . . . . . . . . . . . . . . . . . . . . . . . . 39
5.3.2 Boundary conditions . . . . . . . . . . . . . . . . . . . . . . . . . . . . . . . . . . . . . 39
5.3.3 Functional Program of requirements . . . . . . . . . . . . . . . . . . . . . . . . . . . . 42
5.3.4 Technical requirements . . . . . . . . . . . . . . . . . . . . . . . . . . . . . . . . . . . . 43
6 Design cases 49
6.1 General . . . . . . . . . . . . . . . . . . . . . . . . . . . . . . . . . . . . . . . . . . . . . . . . 49
6.2 Different research cases . . . . . . . . . . . . . . . . . . . . . . . . . . . . . . . . . . . . . . . 50
7 Platform Analysis 56
7.1 General . . . . . . . . . . . . . . . . . . . . . . . . . . . . . . . . . . . . . . . . . . . . . . . . 56
7.2 Modelling of the loads . . . . . . . . . . . . . . . . . . . . . . . . . . . . . . . . . . . . . . . . 57
7.3 Schematization SCIA-engineering . . . . . . . . . . . . . . . . . . . . . . . . . . . . . . . . . . 58
7.4 Results from SCIA-engineering . . . . . . . . . . . . . . . . . . . . . . . . . . . . . . . . . . . 58
8 Sheet pile wall analysis 60
8.1 General . . . . . . . . . . . . . . . . . . . . . . . . . . . . . . . . . . . . . . . . . . . . . . . . 60
8.2 Schematization D-sheet . . . . . . . . . . . . . . . . . . . . . . . . . . . . . . . . . . . . . . . 61
8.3 Sheet pile profiles . . . . . . . . . . . . . . . . . . . . . . . . . . . . . . . . . . . . . . . . . . . 62
8.4 Result from D-sheet analysis . . . . . . . . . . . . . . . . . . . . . . . . . . . . . . . . . . . . 64
8.5 Dimensioning and verification . . . . . . . . . . . . . . . . . . . . . . . . . . . . . . . . . . . . 68
8.5.1 Substructure (front wall) . . . . . . . . . . . . . . . . . . . . . . . . . . . . . . . . . . 68
8.5.2 Superstructure . . . . . . . . . . . . . . . . . . . . . . . . . . . . . . . . . . . . . . . . 69
8.5.3 Vertical bearing capacity . . . . . . . . . . . . . . . . . . . . . . . . . . . . . . . . . . 70
8.5.4 Anchor . . . . . . . . . . . . . . . . . . . . . . . . . . . . . . . . . . . . . . . . . . . . 70
9 Future adaptation 72
9.1 General . . . . . . . . . . . . . . . . . . . . . . . . . . . . . . . . . . . . . . . . . . . . . . . . 72
9.2 Storage of dry bulk . . . . . . . . . . . . . . . . . . . . . . . . . . . . . . . . . . . . . . . . . . 72
10 Cost estimation 74
10.1 General . . . . . . . . . . . . . . . . . . . . . . . . . . . . . . . . . . . . . . . . . . . . . . . . 74
10.2 Construction costs . . . . . . . . . . . . . . . . . . . . . . . . . . . . . . . . . . . . . . . . . . 74
10.2.1 Quay walls used by inland barges in the City port . . . . . . . . . . . . . . . . . . . . 75
10.2.2 Quay walls used by inland barges in Europoort and Maasvlakte . . . . . . . . . . . . . 77
10.2.3 Quay walls used by seagoing vessels in Europoort and Maasvlakte . . . . . . . . . . . 79
10.2.4 Cost components . . . . . . . . . . . . . . . . . . . . . . . . . . . . . . . . . . . . . . . 83

Contents vi
11 Conclusions and reflections 86
11.1 General . . . . . . . . . . . . . . . . . . . . . . . . . . . . . . . . . . . . . . . . . . . . . . . . 86
11.2 Research questions . . . . . . . . . . . . . . . . . . . . . . . . . . . . . . . . . . . . . . . . . . 86
11.3 Answers to the research questions . . . . . . . . . . . . . . . . . . . . . . . . . . . . . . . . . . 87
11.4 Reflection . . . . . . . . . . . . . . . . . . . . . . . . . . . . . . . . . . . . . . . . . . . . . . . 92
Bibliography 95

List of Tables
2.1 Classification tankers . . . . . . . . . . . . . . . . . . . . . . . . . . . . . . . . . . . . . . . . . 11
2.2 Classification bulk carriers . . . . . . . . . . . . . . . . . . . . . . . . . . . . . . . . . . . . . . 12
2.3 Container categories . . . . . . . . . . . . . . . . . . . . . . . . . . . . . . . . . . . . . . . . . 13
3.1 Classification tankers . . . . . . . . . . . . . . . . . . . . . . . . . . . . . . . . . . . . . . . . . 20
3.2 Overview of foundation elements . . . . . . . . . . . . . . . . . . . . . . . . . . . . . . . . . . 24
3.3 Overview of anchorages . . . . . . . . . . . . . . . . . . . . . . . . . . . . . . . . . . . . . . . 25
4.1 Overview of pros and cons of standardization . . . . . . . . . . . . . . . . . . . . . . . . . . . 30
5.1 Reliability class and design life according to NEN-EN 1990 . . . . . . . . . . . . . . . . . . . 33
5.2 Partial load factors Ultimate Limit State (γF ), according to NEN-9997 . . . . . . . . . . . . . 34
5.3 Partial factors for soil materials (γM ), according to NEN-9997 . . . . . . . . . . . . . . . . . . 34
5.4 Load combinations in Ultimate limit state . . . . . . . . . . . . . . . . . . . . . . . . . . . . . 35
5.5 Recommended reduction factors for load combinations . . . . . . . . . . . . . . . . . . . . . . 35
5.6 Load combinations used for the design . . . . . . . . . . . . . . . . . . . . . . . . . . . . . . . 35
5.7 Fundamental water pressure difference with drainage . . . . . . . . . . . . . . . . . . . . . . . 36
5.8 Accidental water pressure difference with drainage . . . . . . . . . . . . . . . . . . . . . . . . 36
5.9 Characteristic values of soil properties area 1 . . . . . . . . . . . . . . . . . . . . . . . . . . . 40
5.10 Characteristic values of soil properties area 2&3 . . . . . . . . . . . . . . . . . . . . . . . . . . 40
5.11 Tidal data . . . . . . . . . . . . . . . . . . . . . . . . . . . . . . . . . . . . . . . . . . . . . . . 41
5.12 The exceedance frequencies . . . . . . . . . . . . . . . . . . . . . . . . . . . . . . . . . . . . . 42
5.13 Characteristics of seagoing vessels for area 2 (Europoort) & area 3 (Maasvlakte) . . . . . . . 43
5.14 Characteristics of inland vessels for area 1 (City port), area 2 (Europoort) & area 3 (Maasvlakte) 43
5.15 Total retaining height for three areas . . . . . . . . . . . . . . . . . . . . . . . . . . . . . . . . 44
5.16 Design values surcharge load due to containers . . . . . . . . . . . . . . . . . . . . . . . . . . 45
5.17 Characteristics container crane for area 2&3 . . . . . . . . . . . . . . . . . . . . . . . . . . . . 46
5.18 Characteristics Grab crane for area 2&3 . . . . . . . . . . . . . . . . . . . . . . . . . . . . . . 46
5.19 Characteristics mobile crane . . . . . . . . . . . . . . . . . . . . . . . . . . . . . . . . . . . . . 46
5.20 The bollard forces . . . . . . . . . . . . . . . . . . . . . . . . . . . . . . . . . . . . . . . . . . 47
5.21 Line forces acting on the quay . . . . . . . . . . . . . . . . . . . . . . . . . . . . . . . . . . . . 47
5.22 Berthing energy . . . . . . . . . . . . . . . . . . . . . . . . . . . . . . . . . . . . . . . . . . . . 48
6.1 Sub-cases inland barges area 1 . . . . . . . . . . . . . . . . . . . . . . . . . . . . . . . . . . . 55
6.2 Sub-cases inland barges area 2&3 . . . . . . . . . . . . . . . . . . . . . . . . . . . . . . . . . . 55
6.3 Sub-cases seagoing vessels area 2&3 . . . . . . . . . . . . . . . . . . . . . . . . . . . . . . . . 55
7.1 Loads acting on the relieving platform . . . . . . . . . . . . . . . . . . . . . . . . . . . . . . . 57
7.2 Governing reaction forces . . . . . . . . . . . . . . . . . . . . . . . . . . . . . . . . . . . . . . 59
8.1 Characteristics of AZ-profiles . . . . . . . . . . . . . . . . . . . . . . . . . . . . . . . . . . . . 63
8.2 Characteristics of intermediate sheet piles . . . . . . . . . . . . . . . . . . . . . . . . . . . . . 63
8.3 Characteristics MV-pile . . . . . . . . . . . . . . . . . . . . . . . . . . . . . . . . . . . . . . . 71
vii

List of Tables viii
9.1 Minimum distance to the front of a quay wall . . . . . . . . . . . . . . . . . . . . . . . . . . . 73
10.1 Costs regarded to retaining height . . . . . . . . . . . . . . . . . . . . . . . . . . . . . . . . . 74
10.2 Construction costs for each component . . . . . . . . . . . . . . . . . . . . . . . . . . . . . . . 75
10.3 Construction costs for several design cases in area 1 . . . . . . . . . . . . . . . . . . . . . . . 75
10.4 Percentage of increase by increasing retaining height and surcharge in area 1 . . . . . . . . . 77
10.5 Construction costs for several design cases in area 2 & 3 . . . . . . . . . . . . . . . . . . . . . 78
10.6 Percentage of increase by increasing retaining height and surcharge in area 2 & 3 . . . . . . . 79
10.7 Construction costs for several deep-sea quay walls in area 2 & 3 . . . . . . . . . . . . . . . . . 80
10.8 Percentage of increase by increasing retaining height and surcharge for case C and D . . . . . 82
10.9 Percentage of increase by increasing retaining height and surcharge for case D and E . . . . . 83
10.10Percentage of increase by increasing retaining height and surcharge for case D and F . . . . . 83
11.1 Extra investment costs . . . . . . . . . . . . . . . . . . . . . . . . . . . . . . . . . . . . . . . . 92

List of Figures
1.1 The increase of water depth and retaining height . . . . . . . . . . . . . . . . . . . . . . . . . 1
1.2 Decreasing of the functional use of quay walls Rotterdam . . . . . . . . . . . . . . . . . . . . 3
1.3 Research methodology . . . . . . . . . . . . . . . . . . . . . . . . . . . . . . . . . . . . . . . . 5
2.1 Overview port of Rotterdam . . . . . . . . . . . . . . . . . . . . . . . . . . . . . . . . . . . . . 7
2.2 Realised throughput vs. 4 scenario prognoses . . . . . . . . . . . . . . . . . . . . . . . . . . . 8
2.3 Total throughput 2010 vs. 2030 . . . . . . . . . . . . . . . . . . . . . . . . . . . . . . . . . . . 9
2.4 Distribution of existing fleet in TEU categories . . . . . . . . . . . . . . . . . . . . . . . . . . 13
2.5 Evolution of Gantry cranes . . . . . . . . . . . . . . . . . . . . . . . . . . . . . . . . . . . . . 14
2.6 Increase outreach of cranes over time . . . . . . . . . . . . . . . . . . . . . . . . . . . . . . . . 14
3.1 Overview of types of quay walls . . . . . . . . . . . . . . . . . . . . . . . . . . . . . . . . . . . 15
3.2 Principle of a block wall, an L-shaped wall and a caisson . . . . . . . . . . . . . . . . . . . . . 16
3.3 Principle of an anchored sheet pile wall . . . . . . . . . . . . . . . . . . . . . . . . . . . . . . 17
3.4 Principle of a structure with a high and low relieving platform . . . . . . . . . . . . . . . . . 18
3.5 Principle of an open berth . . . . . . . . . . . . . . . . . . . . . . . . . . . . . . . . . . . . . . 19
3.6 Fendering of SFRHPC, EMO coal quay Rotterdam . . . . . . . . . . . . . . . . . . . . . . . . 26
4.1 Life Cycle phases of a project . . . . . . . . . . . . . . . . . . . . . . . . . . . . . . . . . . . . 30
5.1 Blum’s assumption regards horizontal pressure . . . . . . . . . . . . . . . . . . . . . . . . . . 37
5.2 Free support method . . . . . . . . . . . . . . . . . . . . . . . . . . . . . . . . . . . . . . . . . 37
5.3 Fixed support method . . . . . . . . . . . . . . . . . . . . . . . . . . . . . . . . . . . . . . . . 38
5.4 Interaction model used for the elastically supported beam . . . . . . . . . . . . . . . . . . . . 38
5.5 Overview navigation channels . . . . . . . . . . . . . . . . . . . . . . . . . . . . . . . . . . . . 41
5.6 Important factors influencing the total retaining height . . . . . . . . . . . . . . . . . . . . . . 44
5.7 Schematization of surcharge loads . . . . . . . . . . . . . . . . . . . . . . . . . . . . . . . . . . 45
5.8 Crane in operational mode . . . . . . . . . . . . . . . . . . . . . . . . . . . . . . . . . . . . . . 47
6.1 Different design cases . . . . . . . . . . . . . . . . . . . . . . . . . . . . . . . . . . . . . . . . . 51
6.2 Design cases A1 and B1 . . . . . . . . . . . . . . . . . . . . . . . . . . . . . . . . . . . . . . . 52
6.3 Design cases A2 and B2 . . . . . . . . . . . . . . . . . . . . . . . . . . . . . . . . . . . . . . . 53
6.4 Design cases C, D, E and F . . . . . . . . . . . . . . . . . . . . . . . . . . . . . . . . . . . . . 54
7.1 Principle of a relieving platform . . . . . . . . . . . . . . . . . . . . . . . . . . . . . . . . . . . 56
7.2 Loads acting on the relieving platform . . . . . . . . . . . . . . . . . . . . . . . . . . . . . . . 57
7.3 Static determined system . . . . . . . . . . . . . . . . . . . . . . . . . . . . . . . . . . . . . . 58
8.1 Principe of moment distribution . . . . . . . . . . . . . . . . . . . . . . . . . . . . . . . . . . 60
8.2 schematization of a deep-sea quay wall in D-sheet . . . . . . . . . . . . . . . . . . . . . . . . . 61
8.3 Maximum moments CASE A1 . . . . . . . . . . . . . . . . . . . . . . . . . . . . . . . . . . . . 64
8.4 Maximum anchor forces CASE A1 . . . . . . . . . . . . . . . . . . . . . . . . . . . . . . . . . 64
8.5 Maximum moments CASE B1 . . . . . . . . . . . . . . . . . . . . . . . . . . . . . . . . . . . . 64
8.6 Maximum anchor forces CASE B1 . . . . . . . . . . . . . . . . . . . . . . . . . . . . . . . . . 64
ix

List of Tables x
8.7 Maximum moments CASE A2 . . . . . . . . . . . . . . . . . . . . . . . . . . . . . . . . . . . . 65
8.8 Maximum anchor forces CASE A2 . . . . . . . . . . . . . . . . . . . . . . . . . . . . . . . . . 65
8.9 Maximum moments CASE B2 . . . . . . . . . . . . . . . . . . . . . . . . . . . . . . . . . . . . 65
8.10 Maximum anchor forces CASE B2 . . . . . . . . . . . . . . . . . . . . . . . . . . . . . . . . . 65
8.11 Maximum moments CASE C . . . . . . . . . . . . . . . . . . . . . . . . . . . . . . . . . . . . 66
8.12 Maximum anchor forces CASE C . . . . . . . . . . . . . . . . . . . . . . . . . . . . . . . . . . 66
8.13 Maximum moments CASE D . . . . . . . . . . . . . . . . . . . . . . . . . . . . . . . . . . . . 66
8.14 Maximum anchor forces CASE D . . . . . . . . . . . . . . . . . . . . . . . . . . . . . . . . . . 66
8.15 Maximum moments CASE E . . . . . . . . . . . . . . . . . . . . . . . . . . . . . . . . . . . . 67
8.16 Maximum anchor forces CASE E . . . . . . . . . . . . . . . . . . . . . . . . . . . . . . . . . . 67
8.17 Maximum moments CASE F . . . . . . . . . . . . . . . . . . . . . . . . . . . . . . . . . . . . 67
8.18 Maximum anchor forces CASE F . . . . . . . . . . . . . . . . . . . . . . . . . . . . . . . . . . 67
8.19 Cross-section superstructure . . . . . . . . . . . . . . . . . . . . . . . . . . . . . . . . . . . . . 69
8.20 Principle of a MV-pile . . . . . . . . . . . . . . . . . . . . . . . . . . . . . . . . . . . . . . . . 71
9.1 Minimum distance to the front of a quay wall, for surcharge 20kN/m2 . . . . . . . . . . . . . 73
10.1 Construction costs for several design cases in area 1 . . . . . . . . . . . . . . . . . . . . . . . 76
10.2 Increase of percentage by increasing surcharge in area 1 . . . . . . . . . . . . . . . . . . . . . 77
10.3 Increase of percentage by increasing retaining height in area 1 . . . . . . . . . . . . . . . . . . 77
10.4 Construction costs for several design cases in area 2 & 3 . . . . . . . . . . . . . . . . . . . . . 78
10.5 Total material costs for several design cases in area 2 & 3 . . . . . . . . . . . . . . . . . . . . 79
10.6 Increase of percentage by increasing retaining height in area 2 & 3 . . . . . . . . . . . . . . . 79
10.7 Construction costs for surcharge 20kN/m2 . . . . . . . . . . . . . . . . . . . . . . . . . . . . . 80
10.8 Construction costs for surcharge 60kN/m2 . . . . . . . . . . . . . . . . . . . . . . . . . . . . . 81
10.9 Construction costs for surcharge 100kN/m2 . . . . . . . . . . . . . . . . . . . . . . . . . . . . 81
10.10Increase of percentage by increasing surcharge for case C and D . . . . . . . . . . . . . . . . . 82
10.11Increase of percentage by increasing retaining height for case C and D . . . . . . . . . . . . . 82
10.12Increase of percentage by increasing surcharge for case D and E . . . . . . . . . . . . . . . . . 83
10.13Increase of percentage by increasing retaining height for case D and E . . . . . . . . . . . . . 83
10.14Increase of percentage by increasing retaining height for case D and F . . . . . . . . . . . . . 84
10.15Increase of percentage by increasing surcharge for case D and F . . . . . . . . . . . . . . . . . 84
10.16Cost components for surcharge 100kN/m2 . . . . . . . . . . . . . . . . . . . . . . . . . . . . . 84
10.17Cost components for retaining height 30m . . . . . . . . . . . . . . . . . . . . . . . . . . . . . 85
11.1 Overview costs of all cases, for surcharge 20kN/m2 . . . . . . . . . . . . . . . . . . . . . . . . 90
11.2 Overview costs of all cases, for surcharges 40and60kN/m2 . . . . . . . . . . . . . . . . . . . . 90
11.3 Overview costs of all cases, for surcharge 100kN/m2 . . . . . . . . . . . . . . . . . . . . . . . 91
11.4 Amazonehaven southside (topleft), quay Brammen terminal (top right), Euromax (bottomleft), Amazonehaven EMO5 (bottom right) . . . . . . . . . . . . . . . . . . . . . . . . . . . . 93

List of Tables xi
————————————————————————————–

Abbreviations
ALS Accidental Limit State
CPT Cone Penetration Test
DWT Deadweight Tonnage
GL Ground Level with respect to NAP
GWL Ground Water Level with respect to NAP
LC Load Combination
LLWS Low Low Water Spring with respect to NAP
LNG Liquefied Natural Gas
LPG Liquefied Petroleum Gas
LWS Low Water Spring with respect to NAP
MLLWS Mean Lowest Low Water Spring with respect to NAP
MSL Mean Sea Level with respect to NAP
MV-pile Muller Verfahren Pile
NAP Normaal Amsterdams Peil
NGD Nautical Guaranteed Depth
OPEC Organization of the Petroleum Exporting Countries
OWL Outer Water Level
SLS Serviceability Limit State
TEU Twenty-foot Equivalent Unit
ULCV Ultra Large Container Vessel
ULCC Ultra Large Crude Carrier
ULS Ultimate Limit State
VLCC Very Large Crude Carrier
WL Water Level
xii

Nomenclature
Symbol Description Unit
Fd Design value of loads [kN ]
Fk Characteristic value of loads [kN ]
γf Partial factor for loads [−]
γM Partial factor for material properties [−]
γϕ′ Material factor for tanϕ [−]
γc′ Material factor for c [−]
γcu Material factor for cu [−]
γγ Material factor for γ [−]
γ Weight density [kNm−3]
c′ Effective cohesion in drained conditions [kPa]
cu Undrained shear strength [kPa]
ϕ′ Effective angle of internal friction of soil [◦]
Xd Design value of material properties [var]
Xk Characteristic value of material properties [var]
γf ;q Load factor for variable load [−]
γf ;g Load factor for permanent load [−]
β Reliability index [−]
ξj Reduction factor [−]
γG Partial factor for permanent action (permanent load) [−]
γQ Partial factor for variable action (variable load) [−]
Gk Characteristic value of permanent load [kN ]
Qk Characteristic value of variable action (variable load) [kN ]
Ad Design value of an accidental load [kN ]
ψ0 Combination factor for loads [−]
ψ1 Momentary factor [−]
ψ2 Quasi permanent factor [−]
Grep Characteristic value of permanent load [kN ]
xiii

Nomenclature xiv
Fa;rep Characteristic value of accidental load [kN ]
δ Structure ground interface friction angle or wall friction angle [◦]
ms Mass of the ship [kg]
vs Velocity of the ship and water [m/s]
CH Hydrodynamic coefficient [−]
CE Eccentricity coefficient [−]
CS Softness coefficient [−]
CC Configuration coefficient [−]
A Section Area [m2]
h Height [m]
q Surcharge [kN/m2]
γsat Saturated weight density of the soil [kNm−3]
γd Dry weight density of soil [kNm−3]
ϕ Angle of internal friction [◦]
∆h Water depth difference [m]
σd Design value of the occurring steel stress N/mm2
σy Maximum allowed steel stress N/mm2
Ntot,d Design value of the total axial force in the wall [kN/m]
As Cross section of the steel [mm2]
Wy,el Elastic section modulus [mm3]
α Anchored slope [−]
Md Design value of the bending moment according to D-Sheet calculations [kNm/m]
Fr,max Maximum bearing force [kN ]
Fr,max,shaft Maximum tip resistance force [kN ]
Atip Surface area of the tip of the pile [m2]
Pr,max,shaft Maximum pile shaft friction to the sounding [MPa]
Pr,max,tip Maximum tip resistance according to the sounding [MPa]
Op,avg Circumference of the pile shaft [m]
∆L Length of the pile [m]
Fax,d Design value of the total axial force on the wall [kN ]
Fnsf,d Design value of the negative shaft friction [kN ]
γm Material factor (1,25) [−]
ξ Correlation factor (1,32) [−]
Ra Holding capacity anchor [kN/m]
Leff length of the anchor part in the sand layer [m]
qc Average cone resistance in the layer [m]

Dedicated to my Degree in Master of Science in Hydraulic Engineering
xv

Chapter 1
Introduction
1.1 General
The port of Rotterdam is one of the most important pillars of the Dutch economy. Since the mid-nineteenth
century the port of Rotterdam showed extensive growth, especially after the completion of the New Waterway
in 1872. This entrance reduced the travel time of ships and made the access of larger ships possible. The
increase of transport over water led to the use of larger and faster ships, and the role of quay walls in
determining the future design of ports has increased also [1]. To facilitate the transshipment of goods in an
efficient manner, advanced quay walls are needed.
Quay walls retain soil for the area behind the quay, provide berthing and mooring facilities for ships and
form the foundation for the purpose of transshipment equipment (cranes). In the 17th century the first quay
walls were constructed in Rotterdam. The tremendous increase in ship dimensions has influenced the quay
wall design. The need for large, deep and long quay walls has increased over the years. Figure 1.1 shows the
progressive development of the water depth in the course of the centuries and therefore an increase in the
retaining height. In the last 30 years, many alternative designs have been developed for the quay walls. Each
alternative is unique and presents new challenges when it comes to design, construction and maintenance.
Figure 1.1: The increase of water depth and retaining height [1]
1

Part A. Introduction 2
1.2 Research description
Quay walls form some of the most important parts of port infrastructure. This infrastructure is predominantly
required for transfer of cargo. The lifetime of quay walls can be distinguished into:
• Technical lifetime or design lifetime (50 years)
• Service lifetime (5 – 30 years)
• Economic lifetime (25 years)
The technical program of requirements postulates a certain technical value that determines the technical
lifetime of a quay wall. The minimum technical value is equal to the value at which the safety of the con-
struction is insured. During the management and exploitation phase, the elements of the quay wall, such as
concrete steel, wood, etc., degrade. The degradation continues up to the critical point where the construction
is unsafe. The models of degradation that are available these days, enable predictions of the quality of quay
walls during their entire lifetime. According to the Eurocode, a minimal technical lifetime of 50 years is
required.
A quay wall serves a number of purposes. The functional requirements are listed in the program of re-
quirements, which leads to a functional design lifetime. The functional design lifetime is equal to the service
lifetime of a quay wall. During the management and exploitation phase it becomes apparent that all require-
ments are subject to dynamic changes in the course of time. Therefore, the service lifetime is often much
shorter than the technical lifetime.
The economic lifetime is the expected period of time during which a quay wall is useful to the owner.
The economic life of a quay wall can be, and often is, different than the actual technical lifetime of the quay.
The economic life ends when the costs to maintain the quay wall in service exceed the calculated revenues.
This has induced Rotterdam Port Authority to depreciate quay walls and pay off of the investment in the
construction, in 25 years. In most cases quay walls are still structurally sound after 25 years and can still be
put to economic use, provided they meet the requirements of the new client.
Figure 1.2 shows that the quay walls from the 19th century are still in use while the quays on Maasvlakte,
which were completed much later, have a significantly shorter service life. Most recently constructed quay
walls often do not meet the time-changing functional requirements, while their technical lifetime (the period
which the structures are designed for) is far from being expired.

Part A. Introduction 3
Figure 1.2: Decreasing of the functional use of quay walls Rotterdam [1]
The time-changing requirements imposed on the quay walls are firstly caused by the developments in the
shipping industry, particularly the increase in size and capacity of the ships. Sometimes, based on the eco-
nomic lifetime, quay walls are built at relatively shallow depth, while the area can be accessed by larger
ships. Secondly, higher loads are imposed on the quay walls by the continually enlarging quay equipment
and intensive use of the area behind the quays. Thirdly, the changes in the layout or the exploitation of the
available space within the port can set new requirements for the quay walls.
Up to now the custom made quay walls are built in a way that when small structural changes are needed,
implementing these changes becomes very expensive. The choices that determine the total investment costs
are made during the concept- and design phase of the quay walls, during the construction and exploitation
stages it’s too late for most modifications to be applied. Interim changes to improve functionality often lead
to costs on top of the calculated costs.
Therefore, design of new quay structures should not only relate to the current functional and technical
requirements, but should also be able to follow the future developments during the intended service time.
During design, future developments could be taken into consideration. The quay walls’ dimensions should be
suitable for future requirements, and not only meet the specifications of current clients. The Port Authority
is searching for solutions to reduce the difference between the technical and economic lifetime of quay walls.
A standardized design is pointed out as a possible solution. Quay walls will be made more flexible by stan-
dardization. Flexibility of quay walls means that a quay wall can be converted for multiple types of vessels
or multiple types of cargo and therefore becomes more future-proof.
The Port Authority is searching for solutions to reduce the difference between the technical and economic
lifetime of quay walls. A standardized design is pointed out as a possible solution. Quay walls will be
made more flexible by standardization. Flexibility of quay walls means that a quay wall can be converted
for multiple types of vessels or multiple types of cargo and therefore becomes more future-proof. Once
standard principle solutions for quay walls are developed, Rotterdam Port Authority can include these in
contracts with contractors. These solutions have the character of a concept design. Within an actual project,
these concepts can be further elaborated by engineering companies and/or contractors into a definitive design.

Part A. Introduction 4
The scope of this thesis is to investigate the feasibility of standardization of quay walls. The following re-
search questions can be derived:
Main research questions:
• Is standardization of quay walls technically and economically feasible in the Port of Rotterdam? If so,
under which circumstances is it advisable?
Additional questions:
• Which existing quay wall solutions are eligible for standardization? Is a distinction between quay walls
for inland barges and/or seagoing vessels necessary or is the type of terminal (container and dry bulk)
more relevant?
• Which components of quay walls are suitable for standardization? Is it possible to standardize the
retaining wall?
• is a combined wall preferable to a sheet pile wall? Is it possible to determine at which retaining height
the turning point is located?
• What is the role of major factors such as the retaining height, the surcharge load and a relieving
platform on the design and the costs of a quay wall?
• Should the Port Authority choose for a larger initial investment to accommodate futures changes
(adaptive port design) or adapt at a later stage (if needed)?
1.3 Goal of the study
The main goal of the research presented in this thesis is the development of potential standard designs for
the quay walls in the Port of Rotterdam, which are applicable to future new quay walls. The research will
focus on the technical and economical feasibility. The results of this investigation should lead to one or more
principle standard solutions of quay walls which can be used in the future by the port owner. Hereby, a
distinction is made between inland barges and seagoing vessels. Short-sea quay walls are beyond the scope
of this research.
The objectives are:
• To investigate a number of possible alternatives of quay walls for standardization, which are relevant
within the conditions of Rotterdam. The advantages and disadvantages should be examined.
• To investigate the possible principle solutions for inland and deep-sea quay wall and determine which
components of these quay walls are suitable for standardization.
• To determine the dimensions and materials of the elements of the quay walls.
• To determine the turning point from a sheet pile wall to a combined wall, for the inland barges. This
will be based on a cost estimation related to the retaining height of a quay wall.
• To perform a comparison between an anchored combined wall without a relieving platform and a
combined wall with a relieving platform. The comparison will be made from the viewpoints of economics
and design.

Part A. Introduction 5
The design studies which have been carried out for different projects in the port of Rotterdam will be used
as reference projects (examples are: the Waalhaven, Amazonehaven[2] and Euromax[3]).
1.4 Research methodology
The principle solutions of quay walls will be developed based on findings from literature study and experi-
ences of the Port Authority. The methodology used in this research can be described as follows:
Part A: Introduction
In this part the problem, the goal and scope of the study are defined.
Part B: Literature & Theory
The theory and literature study are presented according to the defined goals and scope. This part is divided
in two sections. The first section describes mainly the background information of Port of Rotterdam, quay
walls and standardization. In the second part the relevant data and information collected is presented and
discussed.
Part C: Analysis
In this part, the collected data and information are processed and used in order to set up models in calcula-
tion programs. The analysed data, models and result are discussed.
Part D: Final Assessment
In this part the conclusions and recommendations are presented based on the results and findings of the
previous parts.
Figure 1.3: Research methodology

Chapter 2
Background
2.1 Port of Rotterdam
The history of the port of Rotterdam began in the centre of the present city as a fishing port. In the course of
time the port has changed significantly and has been Europe’s biggest port for liquid, dry bulk and containers,
for decades. Due to the connection of the river Maas to the river Rhine, the port has access to an intensively
producing part of the European market. The port and industrial complex of Rotterdam forms thereby an
important link in the transport of large volumes of cargo to a large array of hinterland destinations. The
port of Rotterdam stretches out 40 km in length: from the heart of the city to the Maasvlakte 2 along the
‘Nieuwe Waterweg’ canal. Characteristic of a ‘mainport’ like Rotterdam is that all kinds of different flows of
goods come together.
The port is clustered as much as possible:
• The city port (oldest part): Especially transshipment of containers takes place here as well as Ro-Ro
activities and other general cargo transshipments. In this area a gradual transformation is taking place
to urban functions.
• The Botlek: Oil refineries, chemical products, tank storage and distribution centres are located in this
area.
• The Europoort: Particularly oil refining and oil storage takes place. Activities such as storage and
transshipment of chemicals, Ro-Ro and dry bulk are also concentrated here.
• The Maasvlakte 1 & 2: Mainly containers and chemicals are stored and processed.
In Figure 2.1 an overview of the entire port of Rotterdam is given, which features the different clusters.
6

Part B Literature overview 7
Figure 2.1: Overview port of Rotterdam[4]
2.2 Uncertain future
Quay walls operate in an uncertain environment. As we mentioned in the introduction, quay walls are con-
tinually subject to new requirements. Their economic lifetime, the period that a quay wall can fulfil its
functional requirements, becomes shorter as the period of uniform use becomes more uncertain [5]. The
influences of uncertainties on the port is being increasingly recognized. Over time there has been a lot of
research on this topic. These uncertainties are extensively discussed in the PhD thesis of P. Taneja [6].
From time to time the functional requirements are changing due to different developments. The major-
ity of uncertainties have indirect effects on the design of quay walls. The direct effects and their impact on
the design of quay walls are described in this section.
2.2.1 Flow of goods
The flow of goods is strongly related to the uncertainty in demand and the demand is linked to the uncertain
developments of the (global) economy. Of course, the developments of flow of goods influences the ship
dimensions and the transhipment equipment and hence the design of quay walls. To come up with quantified
requirements for a quay wall design, it is important to determine the progress of the flow of goods as good as
possible. The most important factors in estimating the flow of goods are the economic growth, the volume of
world trade, oil prices and the environmental policy. Based on these factors, four different economic scenarios
are selected for estimating the possible development of throughput in 2030.
It concerns the following four scenarios:
1. Low Growth: low economic growth and low oil prices; fossil fuels remain dominant and environmental
policy is moderate.

Part B Literature overview 8
2. High Oil Price: high oil prices, strict environmental legislation, moderate economic growth and rela-
tively rapid sustainable industry and logistics.
3. European Trend: existing policy and a moderate growth in the economy.
4. Global Economy: further globalization with low oil prices leading to high economic growth and a
moderate environmental policy.
In 2011 the first version of the Port Vision 2030 was approved and released. A growth was predicted for all
four scenarios. In scenario 1 the total throughput increases from 430 million tonnes in 2010 to approximately
475 million tonnes in 2030. For scenario 2 the total throughput is predicted to be 575 million tonnes, for
scenario 3 approximately 650 million tonnes and scenario 4 750 million tonnes [7].
Since the publication of the Port Vision 2030 in 2011, there have been some new developments or there
has been an extra impulse to the existing ones. Despite signs of recovery of the economy, the next decade
seems to be characterized by an average low economic growth (scenario 1). The total throughput in the Port
of Rotterdam in 2013 was below the number of Low scenario, with only 440.5 million tonnes. The expec-
tation is that with continued low economic growth and increasing competition, the growth in throughput
remains over the coming years at this low scenario [8]. Figure 2.2 shows an overview prediction of the total
throughput. For scenario 1 there is an increase of the total throughput till 2020 and then a decrease until 2030.
Figure 2.2: Realised throughput vs. 4 scenario prognoses [8]
Despite the unstable Dutch and European economies, the expectation is that the overall throughput increases
in the port of Rotterdam. However, this does not apply to all types of cargo in each scenario. See Figure 2.3
below.

Part B Literature overview 9
Figure 2.3: Total throughput 2010 vs. 2030 [7]
In the remainder of this section a brief description will be given of the development of the cargo throughput
in relation to the first scenario. We continue with the Low Growth scenario because it can be observed from
Figure 2.2 that it is the most likely scenario.
The goods are broadly divided into four groups of commodity, namely:
• Liquid bulk
• Dry bulk
• Containers
• General cargo/ Ro-Ro
Liquid bulk
Crude oil, oil products (paraffin, diesel oil, gas oil) and chemicals are part of the liquid bulk. This flow of
goods, with a percentage of approximately 47% in 2013 [9], the most bulky group of goods. This is partly due
to the presence of four refineries, an extensive pipeline network, a strong petrochemical cluster and enormous
storage capacity. In the Low Growth scenario, the increase of chemical products is fairly limited as a result
of the slow growth of the basic chemicals. LNG is developing into a new commodity for Rotterdam. Due
to a stable energy demand in the Low Growth scenario, there is less need for diversification of the energy
sources and thus less need for LNG [7].
The throughput of crude oil is mainly determined by the refinery capacity in Northwestern Europe and the
development of alternative energy sources. The decline was sharpest in the Low Growth scenario, in which,
due to the low economic growth, this market is shrinking[7].
Dry bulk
Dry bulk includes: Iron ore and scrap, coal, agribulk (grains) and minerals. The largest part of the dry bulk
consists of iron ore and coal. Given the good nautical accessibility of the port of Rotterdam (in contrast to
the surrounding ports), the largest bulk carriers can safely berth. Dry bulk goods accounted for approxi-
mately 20, 3% [9] of the total volume that was transhipped in the port of Rotterdam in 2013. The growth

Part B Literature overview 10
in the transshipment of dry bulk will be limited till 2030 or will substantially decrease in scenario 1. The
transshipment of iron ore is the leading cause of descend in the throughput, which is directly linked to the
blast furnace capacity in Northwestern Europe. The throughput of other dry bulk is also decreasing in Low
Growth [7].
Containers
The container, which arose as a transportation unit in the sixties, has steadily seized the cargo market.
Currently it is without doubt the most important type of unit load. The great success of the container is the
multimodal applicability; the containers can be transferred very efficiently between different modes of trans-
port (sea transport, inland waterways, road and rail traffic). The port of Rotterdam is the largest container
port in Europe. The port handles yearly about 12 million TEU. The container is becoming increasingly
important for the port. In 2010 it accounted for 25% of the throughput and in 2030 this will possibly be
42% of the total quantity of goods. Rotterdam has the ability to fully facilitate this potential growth, in
particular with the opening of ‘Maasvlakte 2’ and the maintained depth of the deep-sea port[7].
General cargo/ Ro-Ro
The remaining cargo consists of: chemical products, agricultural products, foods, steel products and other
goods. The Ro-Ro consists of: freight trucks, passenger cars, or other loads that can be driven on board.
The total transshipment volume of general cargo and Ro-Ro is approximately 5, 3% [9] (in 2013) of the total
amount of transshipment.
2.2.2 Developments in the shipping industry
The design of quay walls is mainly determined by the dimensions of the vessels. Since the shipping indus-
try has experienced a rapid evolution, it is important to look at previous developments and possible future
changes. Tankers, dry bulk carriers and container vessels are the groups of largest vessels. A brief description
is given below.
Tankers (Liquid bulk)
The first tankers were used for transportation of bulk liquids by the end of the 19th century. Until 1956,
tankers were designed to be able to transit the Suez Canal. In the fifties and sixties, the development
of tankers has evolved at a rapid rate alongside the oil industry. During the closing of the canal in 1956
(Suez crisis: war between Israel and Arab world), tankers were forced to transport oil around the Cape of
Good Hope. Since there were no size restrictions anymore, ship owners realized that cost-efficiency could
be achieved by using bigger tankers. It can be said that tankers are the most economically efficient when
it comes to transport of bulk liquids, as they maximize economies of scale based on volume per trip[10].
The maximum dimensions of tankers grew from 85,000 DWT in 1968 to 260,000 DWT in 1972 and 560,000
DWT in 1976[11]. Nowadays, tankers play a major role in international trade with 33 percent of the world
tonnage[Connector].
Depending on the products carried by the tankers, these may be divided into Crude oil tanker, chemical
tanker, product tanker and gas tanker. The gas tankers (LNG & LPG) are different from the other three
types of tankers and do not moor at quay walls, but at jetties. Therefore, gas tankers are not dealt with in

Part B Literature overview 11
the remainder of this study[12].
Dimensions of tankers vary from Handysize tankers to Ultra Large Crude Carriers (ULCC) with a maxi-
mum DWT of 550,000. A classification of tankers by size is shown in Table 2.1
Table 2.1: Classification tankers
Class DWT RemarkAframax 80,000–120,000 Mid-sized: due to their size, these tankers are able
to enter most ports in the world.Panamax 50,000–80,000 Mid-sized: The largest acceptable size to transit
the Panama Canal. The dimensions of tankers aredetermined principally by the dimensions of thecanal’s lock chambers. These tankers are primar-ily used for petroleum and crude oil products.
Suezmax 120,000–200,000 Medium to large-sized: These tankers are thelargest vessels that can navigate the Suez canalin a loaden condition.
Very Large Crude Carriers(VLCC)
180,000–320,000 Very large: The very large tankers are able to passthe Suez Canal in Egypt. Therefore, they are usedmainly around the North Sea, Mediterranean andWest Africa.
Ultra Large Crude Carriers(ULCC)
320,000–550,000 Ultra large: Due to their huge size, they are ableto serve limited number of ports in the world.These tankers are mainly used for very long dis-tance crude oil transportation, particularly fromthe Persian Gulf to Asia, Europe and North Amer-ica.
The enormous tankers built (VLCC, ULCC) in the seventies appeared to be less favourable than expected.
The economics of scale that can be reached by these enormous tankers is limited. Based on the experience
it is not expected that tankers with a capacity larger than 500,000 DWT will ever be built. Several reasons
for this are:
• Some large tankers have served as storage for oil instead of transportation, others are demolished
without ever having sailed.
• There are fundamental changes in the energy market. Gas and biomass become more important.
• The tanker market is very sensitive to the level of production within the Arab OPEC (Organization of
the Petroleum Exporting Countries) countries.
• The enormous tankers do not meet the restrictions of the improved Suez Canal.
• These tankers can only enter a limited number of ports. This aspect reduces the flexibility of the vessels
and worsened their competitive position.
• The vessels cannot navigate into the relatively shallow Malacca Straits.
Dry bulk carriers
Unpacked bulk cargo is transported by bulk carriers. A comparable growth in vessel dimensions happened
also in dry bulk shipping. Before World War II, the demand for bulk products was low. After the war, an
international bulk trade developed. The transport took place primarily between Europe, US and Japan.

Part B Literature overview 12
Bulkers are categorized into six major categories according to their size: small, Handysize, Handymax,
Panamax, Capesize and Very Large. A classification of tankers by size is shown in Table 2.2.
Table 2.2: Classification bulk carriers
Class DWT RemarkHandysize 10,000 – 35,000 Due to their size, these carriers are able to serve
all ports in the world.Handymax 35,000 – 59,000 These bulk carriers are able to navigate into small
ports with length and draught restrictions.Panamax 60,000 – 80,000 The dimension of a Panamax vessel is limited by
the lock chambers of Panama canal.Capesize 80,000 – 200,000 Capesize vessels are too large for the Panama
canal. Due to improving of the Suez canal, mostcapsize vessels can pass through it.
Very large >200,000
For a very long time the MV Berge Stahl, built in 1986, was the world’s largest bulk carrier. This carrier
has a DWT of 365,000 tons and the following main dimensions: length 343m, width 63,5m and draught 23m.
However, since 2011 is the ‘’Valemax” the largest bulk carrier with 400,000 DWT. Main dimensions: length
362m, width 65m and draft 23m. The Handysize and Handymax vessels represent, with approximately 70%,
the major part of all bulk carriers over 10,000 DWT and have the highest rate of growth[13]. As in the case
of tankers, the following restrictions apply also for bulk carriers:
• The giant bulk carriers do not meet the restrictions of the improved Suez Canal.
• The large carriers can only enter a limited number of ports. This aspect reduces the flexibility of the
vessels and worsened their competitive position.
• The vessels cannot navigate into the relatively shallow Malacca Straits.
Container vessels
During the World War II the use of containers started and in 1960 the first vessel specifically for container
transportation was designed. From its introduction, container shipping has become the fastest growing seg-
ment in world shipping over the last fifty years. The fast development resulted in a rapid increase of both
dimension and number of container vessels[11] [14].
In 1988, when the dimension of container vessels increased to approximately 5,000 TEU, it was necessary to
exceed the width (W=32,3m) of the existing Panamax vessel. Subsequently, the post-Panamax was intro-
duced. Nowadays, container vessels of approximately 18,000 TEU are travelling around the world and vessels
of 22,000 TEU are already under construction[15]. Depending on the number of TEU and hull dimensions,
container vessels can be divided into six main classes: Small feeder, feeder, Panamax, post-Panamax, New
Panamax. Ultra Large Container Vessel (ULCV). A classification of container vessels by size is shown in
Table 2.3.

Part B Literature overview 13
Table 2.3: Container categories[1] [16]
Class/ name TEU Dimension [m]1st generation (small feeder) 300 – 1,100 L = 200, W = 27, D = 92nd generation (feeder) 800 – 1,700 L = 240, W = 30, D = 10,53rd generation (Feedermax) 1,700 – 3,000 L = 300, W = 32, D = 11,54th generation (Panamax) 4,000 – 4,500 L = 310, W = 32,3, D = 12,5Post Panamax 4,300 – 8,000 L = 340, W = 39,4-45, D = 13,56th generation 8,680 L = 347, W = 42,8, D = 14,52New panamax 13,000 L = 366, W = 49, D = 15,2CMA Marco Polo (ULCV) 16,000 L = 396, W = 54, D = 16Maersk Mc Kinney Moller (ULCV) 18,000 L = 400, W = 59, D = 14,5Near future (ULCV) 21,000/22,000 L = 440, W = 59, D = 16,50Future (ULCV) 25,000 – 30,000 L = 500, W = 70, D = 17
The dimensions of container vessels is growing continuously in order to reduce transportation costs. The
container vessels are grown mainly in width and length. The draught of the vessels is greatly restricted
by the depth of the Suez Canal and the relatively shallow Malacca Straits. Today’s container vessels with
capacities of approximately 18,000 TEU have 23 rows of containers across. Even though vessels of 22,000
TEU are not yet in service, some ports (including Rotterdam) are already equipped with container cranes
that can handle vessels up to 25 rows across [16] [15].
The increase in the maximum dimension of container vessels does not imply that the demand for small
feeder and coastal container vessels has decreased. Vessels with capacities between 100 and 3,000 TEU ac-
count for approximately 60% of all vessels operating. Vessels with capacity between 3,000 and 7,000 TEU
account for approximately 30% and the bigger vessels with above 7,000 TEU represent 10% [15] (Figure 2.4).
Figure 2.4: Distribution of existing fleet in TEU categories[15]
2.2.3 Crane size
The continuing growth of container vessels and the expansion of the Panamal Canal is requiring ports
worldwide to supersize their cranes. The increase in dimension of vessels has considerable impact on the
standard design of quay walls. The greater width of the vessels leads to a larger radius of cranes. As a
consequence, higher reaction forces are imposed on the quay wall and the rear craneway girders. This higher
forces acting on the wall results in increasing dimensions of quay wall constructions.

Part B Literature overview 14
In the Figure 2.6, the increase of crane size over the years is shown.
Figure 2.5: Evolution of Gantry cranes[17]
Currently, vessel size and capacity demands lead to continued growth of quay cranes. The total maximum
weight of containers (1 container is approx. 27 tonnes) will not increase in the future with regard to the
valid regulations for the container size. However, in recent years, quay cranes have been equipped to handle
two 40’ or four 20’ containers for each lift. These cranes offer high potential capacity, but are also heavier
and have bigger wheel loads. The outreach of present-day cranes enables them to serve vessels with 22-25
containers on deck. The future growth of the outreach of cranes is limited by the parameters of the Suez
Canal and the Malacca Strait.
The graph below represents, for different cranes (type vessel in Figure ??), the relation between the maximum
moment and the outreach of cranes. In the first instance, lifting one container is studied (blue dots). It can
be observed that the graph increases almost linearly. Quay cranes used for loading and unloading of Triple-E
vessels can also lift two containers simultaneously. This is represented with a red dot.
Figure 2.6: Increase outreach of cranes over time [17]

Chapter 3
Quay walls
3.1 The main types of quay wall
Soil retaining structures are divided in four different types: gravity structures, sheet pile structures, structures
with relieving platform and piled structures (jetties). The choice of the type of quay wall depends on the
local conditions, cost of materials, construction method, durability and shipping requirements. The different
types of quay wall are shown in Figure 3.1.
Figure 3.1: Overview of types of quay walls
15

Part B. Literature overview 16
Quay walls have the following main functions:
• Berthing and mooring facility of ships
• Foundation for the purpose of cargo handling equipment, the cranes
• Separation of land and water, soil retaining
A brief description of the various types is given below. It should be noted that the figures are not to scale.
3.1.1 Gravity type structures
Gravity types of structures are robust and relatively simple structures and develop their resistance from soil
pressure caused by their own weight. Locations where the subsoil does not permit pile driving and where
severe marine environmental conditions (large waves, large temperature differences, heavy ice loads) are
present, gravity type of structures can be applied. For this kind of structures, a shallow foundation is used
and therefore the underlying soil must have sufficient bearing capacity. Over time, several designs of gravity
based quay walls haven been developed. Advantages:
• Relatively simple structures
• Continuous construction and high repetition factor
• Large resistance, robust
Disadvantages:
• Sufficient bearing capacity of subsoil needed, which may require soil consolidation, causing extra build-
ing time
• High costs because of possible soil improvement
• Connection of elements
• Sensitive to erosion
• A deep excavation is required when constructed on land
Examples of gravity structures are (Figure 3.2) block walls, L shaped walls, caissons.
Figure 3.2: Principle of a block wall, an L-shaped wall and a caisson[1]

Part B. Literature overview 17
3.1.2 Sheet pile walls
Sheet pile walls obtain their soil retaining function and stability by penetration of sheeting below the dredge
line, possibly in combination with anchors. Areas where the adequate soil properties can be found in deep
layers and penetration is easy, this kind of structures is preferred. Penetrability of the subsoil is of utmost
importance. The height of the structure, live loading and the kind of foundation material are decisive for the
type of sheeting and anchorage[18]. In the Netherlands the sheet pile wall is the most popular type of quay
wall. Advantages:
• Limited groundwork
• Relatively simple structure
• No construction pit needed
• Both construction methods possible: ‘onshore’ and ‘offshore’
Disadvantages:
• Relatively large deformation of the wall
• If anchored, a lot of space and ground work required for installation of the anchors
• Heavy sheet pile wall and driving equipment needed for large retaining height
• Risk of interlock openings. Repair of interlocks are elaborate and expensive
• Construction risks pile driving
Examples of sheet pile wall structures are: anchored walls (Figure 3.3), combined walls, cofferdams and the
diaphragm walls.
Figure 3.3: Principle of an anchored sheet pile wall[1]
3.1.3 Structures with relieving platforms
In fact this is also a sheet pile wall. This concept consists of a superstructure (relieving platform) that is
supported by a bearing sheet pile wall on the waterside and a system of tension and bearing piles. The
foundation system supports the platform but is also providing stability to the quay wall. The earth-retaining
function is provided by the sheet piles. The forces on the underlying retaining wall and the tensile forces
in the foundation are greatly reduced by the relieving platform. Sheet pile walls with relieving platform are
preferred in cases where soils have low bearing capacity and there is a sensitivity to settlements[15].

Part B. Literature overview 18
Advantages:
• Optimization between ground-, piling and concrete work is possible
• Many variation possibilities regarding foundation elements and concrete structure. Optimization pos-
sible
• Limited groundwork
• Easily applicable in weak subsoil
• Fast construction time
• Inexpensive if the price of steel is favourable
• Wide experience available in the Netherlands/ Germany
Disadvantages:
• Corrosion of steel
• More transitions. As a result, more attention required for the connection elements
• A dense pile field can behave like an extra sheet pile wall screen
• Risk of interlock openings. Repair of interlocks are difficult and expensive
• Construction risk when driving foundation elements. Pile driving becomes difficult for long and heavy
profiles
A distinction is made between structures with a shallow relieving platform and those with a deep relieving
platform see Figure 3.4.
Figure 3.4: Principle of a structure with a high and low relieving platform[1]
3.1.4 Open berth structures/ piled structures
These are jetty-like structures consisting of a deck slab, which rests on piles. The stability of this kind of
structures depends on pile bearing and lateral load-carrying capacity. Open piled structures are preferred

Part B. Literature overview 19
in cases where the height difference may be overcome by a slope. A revetment is needed to prevent erosion
caused by currents and waves.
Advantage:
• Limited groundwork
• ’Light’ structures
• Relatively low cost
• Simple structure (requires no specialisms)
• No construction pit required
• Almost no groundwork besides the dredging
Disadvantages:
• Sensitive for overload and collision. In case of a calamity is a part of the deck for a long period of time
out of use
• Sensitive to erosion
• Stable slope necessary in order to limit the width of the jetty
• The piles must be safe from buckling
• Pile driving can be risky for the stability of the slope
• In case of future deepening, additional problems will occur relating to the dredging and protection of
the slope between the piles.
Examples of jetty like structures are (Figure 3.5): open berth quays over a slope and open berth quays over
a slope with a retaining wall.
Figure 3.5: Principle of an open berth[1]

Part B. Literature overview 20
3.2 Quay walls in the port of Rotterdam
The history of the port of Rotterdam can be analysed from the quay walls that were built in the course of the
centuries. Up to now, designers have always struggled with time-changing requirements. Larger retaining
heights and heavier loads on relatively soft soil has made the designs more complex. Table 3.1 shows the
development of quay walls in the port of Rotterdam.
Table 3.1: Classification tankers
Category Type of quay wall Location DateOldest quay walls
• Quay on shallow founda-tion
• Pile supported masonryblock wall
• Quay on fascine mattress
City port Beginning of the17th century tillend of the 19thcentury
Gravity structures Caisson City port 1900-1960Soil retaining structures Anchored sheet pile wall City port 1930-1960Relieving structures onpiles • Delta girder
• Cylindrical beam
• L-shaped wall
• Botlek
• Europoort
• Maasvlakte
1960-present
Piled structures Jetty• Port Botlek
• Europoort
• Maasvlakte
1960-present
As can be seen in the table above, many different types of quay walls have been built in the port of Rotterdam.
The two most popular types of quay walls are: the anchored sheet pile walls and quay walls with a relieving
structure. In the port of Rotterdam, when heavy loads and large retaining heights were involved, preferably
a combined steel quay wall with a concrete relieving platform was constructed. Since begin 1990, this type
of structure has been a standard in Rotterdam for some time [5][6].
3.2.1 Anchored sheet pile walls
In some cases the anchored sheet pile wall can be used as a quay wall. Hereby the superstructure at the
top (capping beam) joins the vertical elements of the wall. The sheet piles are connected to each other by
interlocks. The substructure consists often of sheet piles or a combination of steel tubes and sheet piles
(combined wall), horizontally supported by a rear wall anchor. Here the sheet pile wall solely fulfills the soil
retaining function. Crane rails are performed behind the quay wall such that the wall doesn’t need to bear
the vertical loads. The rails are provided by separate foundation.
3.2.2 Quay walls with relieving structure
As mentioned before, this method of construction is used when large retaining heights and heavy loads are
involved. Hereby cranes can be realized close to the water. In this case the wall fulfills both bearing and

Part B. Literature overview 21
retaining function. The wall is generally constructed as a combined wall and/or slurry wall. In order to
minimize the dimensions of the combined wall, a relieving platform is used. The essence of this part of the
structure is to relieve the earth pressures that work on the retaining sheet piles. The relieving platform can
be constructed at different heights. The choice depends on:
• Saving on sheet pile by reducing moments and pile depth
• Shortening the length of the sheet piles to limit the installation risks
• Restricting the length of foundation members such as tension and bearing piles in relation to availability
and feasibility
• Saving on the number of tension members in the pile trestle system by increasing the vertical load
component with soil.
3.3 Quay wall elements
Quay walls consist of several main components, namely: the superstructure, substructure, breasting equip-
ment and berthing equipment. For this research it is important to examine whether these components can
be standardized. A brief description of these components will be given below.
3.3.1 Superstructure
The superstructure is the visible part of the quay wall and has the following functions:
• Covering the soil retaining structure
• Dispersal of non-uniform loads and the distribution of loads over anchoring elements
• Forming the quay surface with edge protection
• Relieving platform
• Supporting the rail structure and provision of space for other services such as drainage pipes and cables
• Positions for berthing facilities and other quay equipment
• Earth retaining over the height of the superstructure
• Traffic bearing
• Load bearing floor for transhipment equipment
For the different situations in which quay walls are used, various types of superstructures are designed,
each having its own advantages and disadvantages. Examples are: capping beams and superstructure with
relieving platforms.
Capping beams
The simplest design of a superstructure is the capping beam, usually made of concrete but at times in steel
as well.
The steel capping beam is often used if the only function of the beam is to cover the wall and the soil retaining
height is small. Additional adjustments are required for placing of bollards. The concrete capping beam is

Part B. Literature overview 22
constructed as a massive beam and serves as a girder (horizontal connection). In contrast to a steel beam, a
concrete capping beam is suitable for spreading of loads, placing of bollards and supporting fendering.
A concrete capping beam is only suitable for a limited retaining height, limited surcharge load and a water-
side crane rail up to 2,5m from the quay front.
Hollow rectangular structures
A hollow beam can be preferred when a massive capping beam cannot longer be carried out or do not meets
the requirements. Often, the choice is based on economic reasons. After all, a hollow beam requires less
material. The beam is compared to a massive beam, less sensitive to deformation and accidental overloads
(collision). Peak loads are distributed through the rectangular structure and dispersed.
A hollow rectangular beam is usually used when there is a relatively short distance between the crane rails.
In this case, the distance from the front side of the quay wall to the crane rail is greater than 2,5m and a
service road for the crane rail is often desired. The rear wall of the hollow beam has the main function to
contribute the vertical loads (crane loads and other loads on the deck, formed by material and equipment)
to the relieving platform and to retain the soil behind the wall.
Superstructures with relieving platforms (L-shaped)
Superstructures with relieving platforms are preferred in cases where heavy loads and large retaining heights
are involved because a relieving platform provides far more load distribution. The horizontal and vertical
earth pressure on the relieving platform is transferred through the floor by bending and shear action, from
which the load carries over to the tensile and compressive elements below the floor, resulting in reduced earth
pressure on the combined wall on the water side. The moments and compressive forces in the combined wall
are thus considerably smaller, which results in a more economic design.
An L-shaped superstructure is often used in cases where the distance from the front side of the quay wall till
the crane rail is less than 2,5m.
3.3.2 Substructure
The substructure is the invisible part of the quay wall, since it is mainly submerged and under the ground.
The main functions of the substructure are:
• Retaining of soil
• Supporting of the superstructure
• Transferring loads to the subsoil
Regarding the superstructure, various systems have been developed for the substructure, each with its own
applicability. Sometimes the substructure is just composed of a front wall with an anchor. This is often
the case with inland quay walls where the retaining height is relatively small. In case of large retaining
heights, the superstructure is supported by a bearing sheet pile wall on the waterside and a system of tension
and bearing piles on the landside. The construction can be anchored by means of MV-piles, screw injection
anchors or an anchor wall.

Part B. Literature overview 23
Front wall (waterside substructure)
The main function of a sheet pile wall is soil retaining, with bearing capacity often being an important
secondary function. There are four main systems distinguished:
• Standard sheet pile walls
• Combined steel sheet pile wall systems
• Diaphragm walls
• Prefabricated concrete sheet pile walls
Standard sheet pile walls are applied when retaining heights up to 12 m are involved. When higher retaining
heights and heavy loads are involved, combined sheet pile wall systems, diaphragm walls and precast con-
crete sheet pile walls are preferred. The combined sheet pile wall is frequently used in the port of Rotterdam.
Combined walls are applied because they have economic advantages, high stability, high stiffness and high
bearing capacity.
The combined wall consists of stiff primary elements which are driven at fixed distances from each other.
The space between these elements is covered with secondary elements, consisting of standard sheet piles. The
primary elements are the main retaining elements and carry both horizontal loads (soil and water pressure)
and vertical loads (anchors and superstructure). The intermediary sheets are primarily used to transfer
horizontal loads to the primary elements and have a small (approx. 2%) contribution to the total section
modulus. Interlock openings should be prevented during the install of intermediate sheets.
Nowadays combined wall systems can be put together from extensive ranges of tubular piles and inter-
mediary sheet piles. The strength of a combined wall is largely determined by the steel grade, diameter,
sheet thickness and centre-to-centre distance of the tubular piles, and to a lesser degree by the characteristics
of the intermediate sheets. An optimized solution can be reached by varying all these parameters.
Foundation (landside substructure)
Pile foundations are often applied in quays with relieving platforms and open berth structures. The main
functions of pile foundations are:
• Transferring loads to the subsoil
• Supporting of the superstructure
The foundation elements consist of a combination of tensile and bearing (compressive) components. These
piles are driven at different angles depending on the forces and the chosen pile system. The most suitable
solutions are:
• Inclined precast concrete tension and bearing piles. This system is only suitable for lower retaining
heights.
• Combining the inclined precast concrete bearing piles with MV-tension piles at an angle of 45 ◦. The
MV-pile is often located close to the front wall. The vertical component of the tensile force in the MV-
pile is taken up by the main members of the sheet pile system. This system is often a good solution in
cases where a large retaining height is involved.

Part B. Literature overview 24
The most frequently used foundation elements are: precast concrete piles, piles cast in-situ, steel tubular
piles, steel H-piles. Each has its own applicability. An overview of the most frequently used foundation
elements can be found in Table 3.2.
Table 3.2: Overview of foundation elements
Pile type Name Installationmethod
Tension/bearing Remark
Precastconcrete
Reinforcedconcrete pile
Driven Tension & bearing The use of precast concretepiles is limited by the requiredheavy pile frames and limited pilelengths. However, because of eco-nomic and quality reasons is thistype of piles the most commonlyused in the Netherlands.
Cast in-situ Vibro pileand Frankipile
Driven Tension & bearing These alternatives are consider-ably more expensive. However,these type of piles are preferred toprecast concrete piles for reasonsof drivability. They can also ab-sorb great deformations and mo-ments.
Fundex pile,tubular pile
Screwed Tension & bearing
Steel Tubularpile, H-pileMV-pile
Driven Tension & bearing Tubular piles with both open andclosed ends are available. In caseof sandy ground, open tubularpiles should be driven deep intobearing layers
Anchoring
Soil retaining structures are supported by anchorages. The forces due to ground and water pressure and
other external loads are transferred to the earth behind the anchorage or to deeper earth bearing layers.
There are three main types of anchorages:
• Horizontal anchorages: bar anchors, cable anchors, screw anchors
• Tension piles: steel tubular piles, H-piles, MV-piles
• Anchors with grout body: grout anchors and screw injection anchors
Table 3.3 provides an overview of the different types of anchorages. The main characteristics are listed by
type of anchorage.

Part B. Literature overview 25
Table 3.3: Overview of anchorages
Category Name Tensile capac-ity [kN]
Remark
Horizontal an-chorages
Bar anchors, cable anchors, screwanchors
100 - 4000 This type of anchorages aremanly used in sandy subsoil.Greatest stiffness achieved at in-clinations smaller than 45%. Vul-nerable for cyclic loading. Largedeformations may occur.
Tension piles Tubular steel piles, steel H-profiles, MV-piles
100 to 9000 The tensile capacity of MV-pilesis strong related to the quality ofthe execution. Inserted at an an-gle of 45.
Anchors withgrout body
Grout anchors, screw injectionanchors
300 to 3000 Corrosion is an issue. Good pro-tection is required. Suitable incase of dense sand layers. Execu-tion requires specialization. Usu-ally prestressing is required.
Drainage
Nowadays the quay walls are often equipped with a reliable drainage system. Drainage systems can be used
for two purposes, namely:
• For lowering the phreatic level on the landside, thus reducing the groundwater.
• For consolidation of compressible soil layers
Drainage systems are necessary to redirect rainwater and restrict the flow of excess water behind the quay
wall. In tidal areas there is fluctuation of water level. From an economic point of view it is important to
reduce the differences in water pressure over the quay wall. Drainage systems often get damaged. Therefore,
maintenance is of great importance in order to ensure the functioning of the system during the lifetime of
the quay wall.
Large settlements are the result of backfilling on compressible soil layers. The initially high excess wa-
ter pressure causes high pressures on the quay wall. The consolidation can therefore take a long time. By
installing vertical drains, the pressure can be decreased and the consolidation process can be accelerated.
Breasting equipment
During berthing manoeuvres vessels can cause damage to both the quay and the vessel itself. The following
two systems can be applied for protection:
• Rigid fendering
• Flexible fendering
In case of a rigid fendering, the energy of berthing will be absorbed by deformation of both the rigid structure
and the vessel itself. The forces from berthing can be very high since the deformations are limited. So both
quay and fendering must be robust. Rigid structures can be applied in the form of hardwood, synthetic
vertical fender piles and horizontal beams or Steel Fibre Reinforces High Performance Concrete (SFRHPC).

Part B. Literature overview 26
In the port of Rotterdam, rigid fendering is preferably made of hardwood and not of steel and synthetic
material, because these are not favourable for the environmental and also require the necessary maintenance.
SFRHPC is a new development for quay walls and is applied once in the port of Rotterdam. Figure 3.6
shows the fendering system, consisting of SFRHPC slabs, used for the EMO coal quay wall.
Figure 3.6: Fendering of SFRHPC, EMO coal quay Rotterdam
Rigid fendering is only suitable for inland and short sea quay walls. In this case two main types of fendering
are distinguished, namely for push barges and without push barges. Fendering used by inland barges com-
posed of vertical beams and horizontal girders. The common practice has shown that push barges induce
more damage due to the sharp back side of the barges. These come between the girders and pulling it to
pieces. Therefore, rigid fendering used by push barges don’t have horizontal girders. In case of a flexible
fendering, the energy of berthing will be absorbed by the fender itself. Therefore, it is required that they
have a relatively high deformation capacity. Flexible structures are made of synthetic material of natural
rubber. Rubber fendering is available in different types and sizes.
Berthing equipment
Berthing facilities consist of bollards and quay ladders. These have already been standardized within the
port of Rotterdam. The facilities must satisfy requirements with regard to strength and safety use.

Chapter 4
Standardization
4.1 Effects of standardization of quay walls
For this research it is important to be aware of the benefits of standardization of quay walls. In this chapter
the positive and negative effects of standardization will be discussed. This is needed to analyse the choice of
quay walls.
Standardization can be defined as the strategy of development and implementation of designs to achieve
the required levels of interchangeability and flexibility in use[5]. Considering the life cycle of a quay wall,
standardization effects the economic efficiency. These effects can be both positive and negative. Standard-
ization can, for instance, increase efficiency within the life cycle of the construction, but it can also prolong
the existing life cycle, which leads to limited investment into the next life cycle[19]. The major dilemma in
standardization of certain quay wall elements is balancing the societal benefits of competition by stimulating
variety against the benefits of reducing variety[20]. Competition does not always lead to the best solution
but rather to the most inexpensive solution.
4.1.1 Potential positive impacts of standardization
Due to the uniformity and the growing simplicity of the processes, the development of standardization has a
lot of potential[21]. The following advantages can be distinguished:
• The most common advantage of standardization is the economy of scale. By standardizing in design,
uniformity is reached in quay walls and berthing and breasting equipment, which leads to higher
efficiency and lower control costs in the management phase. An example of this is profiting from
benefits of scale when buying materials or maintenance.
• Because of the standardized manufacturing process, the diversity in quay walls will be reduced and the
process will be optimized. The effects will also be seen in the operation and maintenance phases. By
standardizing, the whole process from preparation to construction of quay walls proceeds faster. The
most important benefit is the reduction of effort needed for design and a decrease in time-to-market
27

Part B. Literature overview 28
for next generation quay walls[22]. The time the Port Authority needs for engineering can be largely
reduced, this also goes for time needed for preparation. This would result in a rise in effectiveness and
efficiency.
• Standardization stimulates the process with the client. The Port Authority operates much more par-
allel to the process of the customer, which would make the interaction easier. Up to now customers
understand insufficiently the civil-technical questions of the Port Authority and don’t realize the impact
of these matters on the design.
• By standardizing (using standard principle solutions), engineering costs would drop because less effort is
needed. Engineering would also take less time because every design wouldn’t need a complete study, it
would be based on an existing standardized design. So the design cost will be reduced due to shortening
of the development cycle time. However, it is required to optimize based on (mainly) the geotechnical
conditions.
• Standardization can lead to lower transaction costs[23]. These are the costs needed for a contractor in
order to participate in a tender. The transaction costs per project for contractors would drop by a factor
of 5 (indication: e100.000 per contractor, max. 5 per tender). The reimbursement for calculations
made by the contractors that entered the call for bids will be reduced through standardization.
• For standardization, experts must reach a consensus on what the best way is to make a standardized
design. They do not need inventive steps, but they document good practice[24]. By standardizing,
the quality of the design will increase because experts in the field will be able to share and combine
their knowledge. The longer the standard is in use, the more the port authority can fine tune the
design. The market will be able to optimize the construction process because more information on the
performance of the quay walls will accumulate over time. Ultimately, less work will have to be done
when the standard is being implemented more often.
• Civil engineering projects often have a high degree of complexity and a relative low degree of repetitive
work. There are less variations due to standardization, so less expertise is needed and engineers are
able to work in more specialized areas. Standardization stimulates repetition. This has a positive effect
on the learning cycle of workforce and therefore results in reduction of failure during the process.
• Standardization also makes sure that so called “exotic” quay walls are excluded (for example the Delta
beam EECV, 1982). Experience shows that 80 to 90% of risks during the management phase are due to
“exotic” designs. For example, serious accidents occurred in the past as a result of excavations behind
a quay wall. Another reason is that “exotic” quay walls are complicated and therefore more expensive.
• Standardization of quay walls would also lead to more flexibility because it would cause a slight over-
dimensioning of the construction because standardized designs should be able to last through variable
circumstances. This would result in more robust quay walls that will be less sensitive to damage. The
structure would also be less sensitive to variable surcharge load.
• By standardizing, pro-active maintenance becomes a possibility, measures can already be taken into
account during the design. There is less variation which creates the possibility for specialized mainte-
nance.
• The total Life Cycle Cost can be estimated easier. Documentation of the recurring inspections and
construction errors will be the same for all main structures. This way the data becomes easier to
compare[25]. As a result, errors can be reduced.
• Another major benefit of standardization of quay elements is the possibility of re-use. The elements
are replaceable and can be re-used in new quay walls (if they are still in good condition). This applies

Part B. Literature overview 29
primarily to the substructure (combined wall/ sheet pile wall). The superstructure (relieving platform)
and the anchor (MV-pile) can be re-used only if the connection to the other quay components allows
this. The relieving platform can be connected to the combined wall by a sliding support. If necessary,
the substructure can be removed without damaging it. In the case of a MV-pile, the anchor can be cut
off in front of the combined wall (landside) and be pulled out.
• Standardization increases the degree of interchangeability of elements of a quay wall. If an element is
damaged, this could be replaced by a new one (same type).For explanation see the bullet above.
• Systems for measuring and modelling could be standardized and optimized for more accurate results.
4.1.2 Potential negative impacts of standardization
Standardization also has disadvantages. The following disadvantages can be distinguished:
• Reaching a standardized design requires a long preparatory process. Standardization needs to be
accepted and approved by several departments before it can be implemented. This process is time
consuming and drives development costs upward.
• Standardization can slow down research and development (R&D) and therefore has a significant collec-
tive effect on innovation[19]. It needs to be said that once a standardized design has been reached, it
will have a dynamic nature as opposed to a static one. The standardized design needs to be monitored
and adjusted if necessary.
• A standard design of a quay wall does not guarantee that this is a flawless design. Design errors in
standardized designs can lead to errors being present in all structures that have to be built according
to this design. This could be prevented by recurring evaluations, updates and optimizations.
• A standard quay wall design is developed according to the most extreme parameters (high/low water,
high surcharge load, extreme ship dimensions etc.) that could occur in the future. This will be used as
governing and is therefore the standard. This means that all the other quay walls, which are smaller
in size, will be over dimensioned. This is why over dimensioned structures are more expensive than
regular structures. However, when a standard quay is suitable for several types of transhipment, it can
be modified for other customers with relatively low costs. This is an advantage for the Port Authority
because it won’t have to build a new quay for new customers.
• A Project Engineer could implement a standard without thinking about it first, without considering
why the standard exists in the first place and without deviating from it if circumstances require it. This
may be due to time constraints or because of costs. This could be prevented by recurring evaluations,
updates and optimizations.
The positive and negative effects of standardization discussed in this chapter are listed in Table 4.1.

Part B. Literature overview 30
Table 4.1: Overview of pros and cons of standardization
Positive effects Negative effectsReduce of engineering effort Over dimensioningReduce of engineering time Long preparation processReduce of engineering costs Slow down research & developmentDecrease of time-to-market Errors may repeatMore efficiency (process & maintenance)Quality increases, reduce of failureMore robust quay wallIncrease of modularityFaster delivery timesFaster constructionReduces maintainabilityInterchangeable
4.2 Effects of standardization in different life cycle phases
As mentioned in the paragraphs above, standardization has several positive and negative effects. In this
paragraph an explanation will be given of how the standardization can reduce the costs in the different life
cycle phases. The different Life Cycle phases are given in Figure 4.1. The technical lifespan of a quay wall
is often 50 to 100 years while design and construction often take about 2 years. As the costs of maintenance
increases over time, it can be said that the turnaround of a design and constructions is limited compared to
operation and maintenance phase of a quay wall.
Figure 4.1: Life Cycle phases of a project
Design development phase
The design phase is a summary of the initiation phase and the continuous study of the feasibility of a design.
The costs of design development can be divided into:
• Engineering cost
• Drawing cost
• Design modification cost
• Management cost
Use of standard elements in quay walls reduces the development costs by replacing duplicate design research
and development efforts with one single development effort[26].
Construction phase
The construction costs can be divided into the following cost components:

Part B. Literature overview 31
• Material costs (material costs (unit costs), procurement costs, transport costs, material management
costs, etc)
• Facility costs (costs for equipment, storage space, etc)
• Production costs (labor costs, processing costs, production planning and scheduling costs, inspection
costs)
Reduction of the material costs is possible by reducing the material variety through standardization. Variety
reduction through standardization also triggers the reduction in equipment. The need for different storage
facilities and different types of equipment will be reduced[26].
Reducing the variety reduces the requirement of multi-skills of the workforces, leading to lower labor cost.
Another positive impact of standardization is the efficient learning of the workforce. They get the possibility
to specialize[26].
Operation & maintenance phase
During the use of a quay wall, costs are encountered as operational and maintenance costs. It is possible to
reduce these costs by standardization of elements. The maintenance cost depends on the labor time, labor
rate, tooling factor, training factor, cost of the replacement parts and the availability of the replacement of
parts.
The time needed to repair and the labor rate for repairing is usually less for the standardized component
than for the unique components since the technicians are more familiar with standardized elements. By
standardization the component variety will be reduced and thus the number of required tooling for repair
.Consequently, this results in lower tooling cost. The level of training required for reparation of components
depends on factors like complexity of repair and number of components variety to be repaired. Standard-
ization decreases the complexity and amount of component variety. Therefore, the required training cost
reduces due to component standardization. Standardization of components reduces the replacement cost and
at the same time increases the availability of components. By analysing the effect of these factors, it can be
seen that component standardization positively influences the maintenance cost[26].
Re-use & disposal phase
There are several reasons why a quay wall could reach its ‘end of life’. This could be reached by technical
(loss of strength) and/or functional (change in loading conditions) reasons. In this case the quay wall can be
removed or replaced. A major benefit of standardization of quay elements is the possibility of re-use. The
elements are replaceable and can be reused in new quay walls (if they are still in good condition). Standard-
ization reduces the tooling, the required skills and the time required for disassembling of the construction.
This results in lower costs.

Chapter 5
Research design
5.1 Design philosophy
The safety of a structure can be based on three different approaches, namely:
• Deterministic approach
• Probabilistic/ fundamental approach
• Semi-probabilistic approach
The deterministic approach has been used in the past in order to determine the safety of a construction.
This approach determines a margin between the characteristic values of loads acting on the construction and
the strength of the construction. The strength should be greater to guarantee the safety of the construction.
The probabilistic approach is based on the principle that the construction must satisfy a specific probability
of failure. Hereby, the parameters are assumed to be stochastic. The larger the consequence of failure, the
smaller the acceptable probability of failure.
Nowadays, the safety of constructions are verified using the Eurocode based on a semi-probabilistic ap-
proach. Here, partial factors are used to determine the design values for parameters. This method is used in
order to maintain the practicality of the design method.
During this research the guidelines described in the Eurocode (NEN-EN-standards) will be followed. In the
guidelines three reliability classes (RC1, RC2, RC3) are distinguished, in which the maximum probabilities
of failure for the limit states are defined. Reliability class 2 is usually used for the design of quay walls in
the port of Rotterdam. Table 5.1 provides the different reliability classes.
32

Part B. Theory 33
Table 5.1: Reliability class and design life according to NEN-EN 1990
Description of reliabilityclasses
Reliability in-dex β
Design life inyears
Example
RC1 Consequences of failure Riskof danger to life negligible Risk ofeconomic damage low
B = 3,3 50 Simple sheet pile struc-ture/quay wall for smallbarges. Retaining height till5 m.
RC2 Consequences of failure Riskof danger to life negligible Risk ofeconomic damage high
B = 3,8 50 Conventional quay wall forbarges and seagoing vessels.Retaining height >5 m.
RC3 Consequences of failure Riskof danger to life high Risk of eco-nomic damage high
B = 4,3 50 Quay wall in flooddefence/LNG-plant or nuclearplant (hazardous goods).
5.1.1 Limit states
A quay wall construction is considered to fail when one or more of the following main functions can no longer
be fulfilled:
• Soil retaining
• Load bearing
• Resistance to erosion
The failure of a quay wall can be caused by a variety of failure mechanisms. To analyse the failure of a quay
wall, various load combinations are imposed on the quay. The state in which the quay wall does not yet fail
and fulfils the requirements, is called a limit state. According to the standards a distinction is made between
Ultimate Limit States (ULS) and Serviceability Limit State (SLS).
In the case that the ULS is exceeded, the quay wall will collapse. In the ULS the following have to be
verified:
• Structural = Internal failure of the construction or exceptional deformations of the construction
– Failure of the sheet pile wall/combined wall
– Failure of anchorage
– Failure of steel or concrete piles
– Failure of joints between elements
• Geotechnical = Failure or exceptional deformation of the subsoil
– Failure of piling system
– Insufficient passive soil resistance
– Overall instability
• Hydraulic = Soil failure because of internal erosion by concentrated ground water flow in the subsoil
because of hydraulic gradients.
In the SLS the deformations have to be verified. If the SLS is exceeded due to too large deformations, the
quay wall is not capable to fulfil its functions anymore. However, the construction will not collapse.

Part B. Theory 34
5.1.2 Representative values, design values
The design of the quay walls is based on the governing load conditions. The design values can be determined
with help of load factors. According to the Eurocode, depending on the type of parameter, the design values
are determined by multiplying or dividing the representative values by the partial factor.
The design value of loads is determined from:
Fd = γf · Fk (5.1)
The design value of material properties is determined from:
Xd =Xk
γM(5.2)
The partial factors are shown in Table 5.2 and Table 5.3.
Table 5.2: Partial load factors Ultimate Limit State (γF ), according to NEN-9997
Action Symbol CombinationA1 A2
Other (check-ing overall sta-bility)
Retainingstructures(checkingstrength)
Permanent Unfavourable γf ;g 1,2 1 1Favourable γf ;g 0,9 1 1
Variable Unfavourable γf ;q 1,5 1,3 1,1Favourable γf ;q 0 0 0
Table 5.3: Partial factors for soil materials (γM ), according to NEN-9997
Soil parameter Symbol Sheet pile wall(simple quaywall)
Quay wall with relievingplatform on piles
Angle of friction γϕ′ 1,175 1,25Effective cohesion γc′ 1,25 1,45Undrained shear strength γcu 1,60 1,75Density γγ 1,00 1,00
5.1.3 Load combinations
A number of unfavourable load combinations are considered in the limit states. This is a combination of
permanent and several variable loads. It is important to investigate the governing load combinations for the
constructive quay members. This can be determined by using the following formulations:
∑j≥1
ξj · γG,j + γQ,1 ·Gk,1 +∑j≥1
γq,i · ψ0,i ·Qk,i (5.3)
∑j≥1
Gk,j +Ad + ψ2,1 ·Qk,1 +∑j≥1
ψ2,i ·Qk,i (5.4)

Part B. Theory 35
In this research only the fundamental combinations will be investigated. The calculations are based on
equation Equation 5.3, Equation 5.4 is not further used in the main calculations.
Table 5.4: Load combinations in Ultimate limit state
Permanent loads G Variable loads Q Accidental loadsUnfavourable Favourable Dominant Remainder
Fundamental γf ;g ·Grep;max γf ;g ·Grep;min γf ;q ·Q1;rep γf ;q · ψ0,j ·Qj;rep -Accidental γf ;g ·Grep;max γf ;g ·Grep;min γf ;q · ψ1,1 ·G1;rep γf ;q · ψ2,1 ·Q1;rep Fa;rep
Table 5.5: Recommended reduction factors for load combinations[1]
Action Combinationfactor, ψ0
Frequentvalue, ψ0
Quasi staticvalue, ψ0
Uniform surcharge load (cargo: containers,bulk goods)
0,7 0,5 0,3
Traffic loads (port vehicles) 0,6 0,4 0Crane loads 0,6 0,4 0Mooring loads (bollard pull/ hawser load) 0,7 0,3 0Ship berthing loads (reaction force fender-ing)
0,7 0,3 0
Earth pressures 1,0 1,0 1,0(Ground) water pressures 1,0 1,0 1,0Differential settlement 1,0 1,0 1,0Environmental/Meteorological loads (wind,waves, currents, temperature, ice)
0,7 0,3 0
Table 5.6: Load combinations used for the design
Load combinations LC1 LC2 LC3 LC4 LC5Vertical loadsDead load 1,0 1,0 1,1 1,1 1·1Earth pressure 1,0 1,0 1,1 1,1 1·1Surcharge load 1,1·1 1,1·1 1,1·0,7 1,1·0,7 1·0,3Crane 1,1·0,6 1,1·0,6 1,1·1 1,1·0,6Horizontal loadsCrane 1,1·0,6 1,1·0,6 1,1·1 1,1·0,6Bollard 1,1·0,7 1,1·7 1,1·1Fundamental water pressure X X X XAccidental loadsCollision 1·1Failure drainage X
5.1.4 Determination of design water levels
Drainage systems are used to lower the occurring ground water level in order to reduce the water pressure
on the quay wall. The assumption is that the soil conditions above the system are always permeable.
The combination of low water level (WL) and high ground water level (GWL) usually results usually in a
maximum water pressure difference over the quay wall. This maximum water pressure should be used in the
calculations.
The design groundwater levels are calculated assuming a reliable drainage system at NAP -0,63m (Mean Low
Water level). It may happen that the drainage (temporarily) does not function properly. This will result in

Part B. Theory 36
an extreme load combination. The design water levels presented in Table 5.7 and Table 5.8 are according to
the guidelines presented in the Handbook Quay walls.
Table 5.7: Fundamental water pressure difference with drainage
Water levelfluctuations
Soil conditions Outer Waterlevel (OWL)
Ground water level(GWL)
∆hmin ∆h(ULS)
Tidal condi-tions
- LLWS=NAP-0,84m
hdrainage+0,3m=NAP-0,33
>0,5m 0,51m
Table 5.8: Accidental water pressure difference with drainage
Accidentalactions
Fluctuations Soil con-ditions
Outer Water level(OWL)
Ground water ∆min ∆h(ALS)
(GWL)Flooding Tidal condi-
tions- GL-2· ∆htide;mean =
NAP +0,17m/ NAP+1,52m
GL-1,5·∆htide;mean =NAP +1,04m/NAP +2,39m
- 0,87m/0,87m
Extremelow water
- - LW1x250year= NAP -2,30m
hdrainage+0,3m=NAP -0,33
- 1,97m
Relievingplatform
- - LW1x250year= NAP -2,30m
LW1x250year=NAP -2,30m
- 0
Failuredrainage
Tidal condi-tions
Impermeable LW1xyear= NAP -1,50m MSL=NAP+0,07m
>1,5m 1,57m
Permeable LW1xyear= NAP -1,50m MSL=NAP+0,07m
>1,0m 1,57m
5.2 Design models and calculation methods
Over time a wide variety of design methods for retaining walls have been developed. Well known methods
for calculation are:
• Blum
• Beam elastic foundation
• Finite element analysis
Before the advent of computing, the analytical approaches of Blum (1931) were often used. Due to the
development of the computer in the 1960s numerical integration of equations was made possible. As a result,
the application of the method based on elastic foundation for retaining wall were allowed. Problems that
were more complex than those considered in the analytical approaches of Blum could be solved. The recent
developments in numerical modelling introduced the finite element method. This approach is applied for the
design of complex quay walls. In the remainder of this section, the three approaches will be explained in
more detail.

Part B. Theory 37
5.2.1 Blum method
With the classic method of Blum, a statically indeterminate system (the sheet pile wall and the ground
around it) is schematized as a static determined model. The deformation behaviour of the ground and the
sheet pile stiffness have no influence on the result of calculations. It is assumed that the displacement of the
wall will result in immediate yielding of active, respectively, passive failure of the ground on both sides of
the sheet pile wall. This implies that large soil deformations result in maximum shear stresses in the soil,
Figure 5.1. Based on the determined load distribution, the embedded depth can be determined. The deflec-
tion curve of the sheet pile wall can be derived from the moment distribution. The displacements calculated
with this method are nothing more than gross approximations.
Figure 5.1: Blum’s assumption regards horizontal pressure[27]
When using the method of Blum, two types of limit equilibrium analyses may be used: free or fixed earth
support method. The deformation behaviour of free earth supported wall and fixed supported wall is different.
The fixed supported method provides a better distribution of moments, resulting in a lighter sheet pile wall
(Figure 5.2 and Figure 5.3). A further increase in the embedded length (approx. 20%) is required to achieve
full fixity in the soil[28].
Figure 5.2: Free support method[27]

Part B. Theory 38
Figure 5.3: Fixed support method[27]
5.2.2 Beam on elastic foundation
With the calculation method based on the theory of elastically supported beam, it is made possible to enter
complex boundary conditions into the calculation programmes. Complicated conditions such as multiple
anchoring and construction phases. The input of different construction phases allows to carry the stress
history of the sheet pile to the following phase.
Also with this calculation method a modified modelling of soil behaviour is necessary. The soil mass is
modelled as a set of elasto-plastic springs. This is a simplification of the actual behaviour of the soil as the
effect of creep is excluded. The plastic behaviour of the surrounding soil is achieved by sufficient deformation
of the sheet pile wall. This results in the development of minimum active soil pressures and maximum passive
soil pressure.
Figure 5.4: Interaction model used for the elastically supported beam
Given the complexity and the amount of calculations, a computer is required to find a solution. The computer
programs are based on uncoupled springs with the effect of arch working of the soil not taken into account.
The basic principle of this method is the elementary beam theory. This is based on the following[29]:

Part B. Theory 39
• Normal to the neutral surface remain normal during deformation (Bernouilli)
• Hooke’s law
• Normal forces are low, so they do not contribute to the deformation
• Angle of rotation is small
• Uncoupled springs
Calculation program D-Sheet is developed by Deltares and is based on the theory of elastic supported beam.
This calculation model is now widely used in the Netherlands and is also used in this research.
5.2.3 Finite Element Analysis
The finite element method is based on a model in which the behaviour of the soil and therein contained
construction elements are integrated. Stress equilibrium and deformation of soil and bending behaviour
of construction elements are described by coupled system of partial and ordinary differential equations.
Computer programs such as PLAXIS are used to solve these equations numerically. The finite element
method can be used for the solution of two-dimensional and three-dimensional problems. The reliability of
the results of a calculation strongly depends on the entered constitutive equations for the relation between
stresses and deformations. This is more complicated for soil compared to construction elements. For a
meaningful application, a good understanding of both the construction and characteristics of the soil is
necessary.
5.3 Requirements & boundary conditions
5.3.1 Introduction
This section presents the requirements and additions for the design of standard quay wall in the port of
Rotterdam. A distinction is made between functional and technical requirements. The standard quay wall
will not be designed for one specific location in the port. Furthermore, a distinction is made in quay walls
for inland shipping and seagoing shipping.
To be able to provide an overview of the most important aspects which have to be taken into account for
the standard design, the current situation and the limitations are described first. Some important aspects
are strongly related to the characteristics of the subsoil, the surface level and the water depth in the navi-
gation channels. For example, the depth of the navigation channel determines how far the different vessels
can navigate into the port. That means that giant sea-going vessels cannot berth in the urban part of the port.
5.3.2 Boundary conditions
Geotechnical
The soil properties are of great importance for the choice of the quay’s foundation and the stability of the
quay walls. For this study, the entire port of Rotterdam will be considered. The port of Rotterdam is divided
into three areas with its own characteristic soil profiles, namely:

Part B. Theory 40
• Area 1: The city area up to the river Oude Maas
• Area 2: Europoort (The area between the river Oude Maas and the Maasvlakte)
• Area 3: The Maasvlakte (I + II)
Typical cone penetration test (CPT) results are included in Appendix A. The soil profiles are based on
these CPTs and the soil parameters are determined by use of the Eurocode 7 and CUR 166. Europoort and
Maasvlakte have just about the same soil profile. Therefore, the same profile is used for both areas. The
characteristic values of soil properties are shown in Table 5.9 and Table 5.10.
Table 5.9: Characteristic values of soil properties area 1[30]
Layer nr. Thickness layer [m+NAP ] Soil type γsat/γd[kN/m3] ϕ[o] δ[o] ka ka1 +3, 65−+2, 00 Fill sand 20/18 27,5 18,3 0,31 4,692 +2, 00−−5, 00 Soft clay 17/16 17,5 11,7 0,47 2,423 −5, 00−−8, 00 Soft peat 10 15 10 0,52 2,14 −8, 00−−15, 00 Soft clay 17/16 17,5 11,7 0,47 2,425 −15, 00−−25, 00 Sand 20/18 32 21,3 0,26 6,826 −25, 00−−27, 00 Loam 20 27,5 18,3 0,31 4,697 −27, 00−−40, 00 Sand 21/20 32 21,3 0,26 6,82
Table 5.10: Characteristic values of soil properties area 2&3 [30]
Layer nr. Thickness layer [m+NAP ] Soil type γsat/γd[kN/m3] ϕ[o] δ[o] kp kp1 +5, 00−−20, 00 Fine silty sand 20/18 25 16,7 0,35 3,912 −20, 00−−23, 00 Silty clay 20/18 22,5 15 0,38 3,303 −23, 00−−35, 00 Medium coarse
silty sand20/19 32 21,3 0,26 6,82
Surface level
The position of the Maeslantkering, as part of Holland’s protection against the sea (Delta works), has been
a determining factor on the chosen ground levels in the different areas of the port of Rotterdam. Locations
situated outside the flood barrier (= sea side) have ground levels of approximately NAP +5m. Locations
behind the barrier (=urban area) have ground levels of approximately NAP +3,5m. The top of the quay
walls on the sea side of the barrier should be higher than behind the barrier.
Navigation channel
The position of the port at the gateway of the European inland waterway network makes the port of Rotter-
dam ideally located for the transhipment of cargo. The depth of the navigation channels is decisive for the
draught of the vessels. Subsequently, the required retaining height of the quay wall depends on the draught
of the vessels. The depth of the main navigation channels are given below, see also Figure 5.5.
1. Eurogeul channel: Depth is reducing from 24,5 to 24,0m MLLWS and is dictated for vessels with a
draught of between 17,4 and 22,55m.The Eurogeul channel is not illustrated in Figure 5.5.
2. Maasgeul channel: The Euro Channel ends and the Maas Channel starts. Depth of the channel is
24,3m MLLWS.
3. Nieuwe Waterweg: After leaving the Maasgeul channel, the Splitsingsdam separates the Nieuwe Wa-
terweg from the Caland kanaal. Minimum depth is 14,20m MLLWS.

Part B. Theory 41
4. Nieuwe Maas: The Nieuwe Waterweg canal becomes the Nieuwe Maas. Minimum depth 13,80m MLLWS
to Waalhaven, from Waalhaven to Erasmusbrug 10,85m MLLWS.
5. Calandkanaal: Minimum depth is 22,75m MLLWS.
6. Beerkanaal: Entry to the Europoort area is via the Beer Canal. Minimum depth is 22,6m MLLWS.
Figure 5.5: Overview navigation channels
Huge sea-going vessels can only berth at the quays in the Maasvlakte and the Europoort. The Europoort
can be reached through the Calandkanaal.
Hydraulic conditions
Water levels:
The water levels are determined at location Hoek van Holland. These levels are representative for the port
of Rotterdam. Table 5.11 shows the tidal data. The reference level is the Normal Amsterdam Level (N.A.P).
Table 5.11: Tidal data[31]
TypeMean sea level [m +NAP] +0,07Mean High Water level [m +NAP] +1,11Mean Low Water level [m +NAP] -0,63Tidal difference (∆htide;mean) [m] +1,74Spring High Water level [m +NAP] +1,30Spring Low Water level [m +NAP] -0,60Tidal difference (∆htide;spring) [m] +1,90Low Low Water Spring [m +NAP] -0,84
The exceedance frequencies of water levels are presented in Table 5.12.
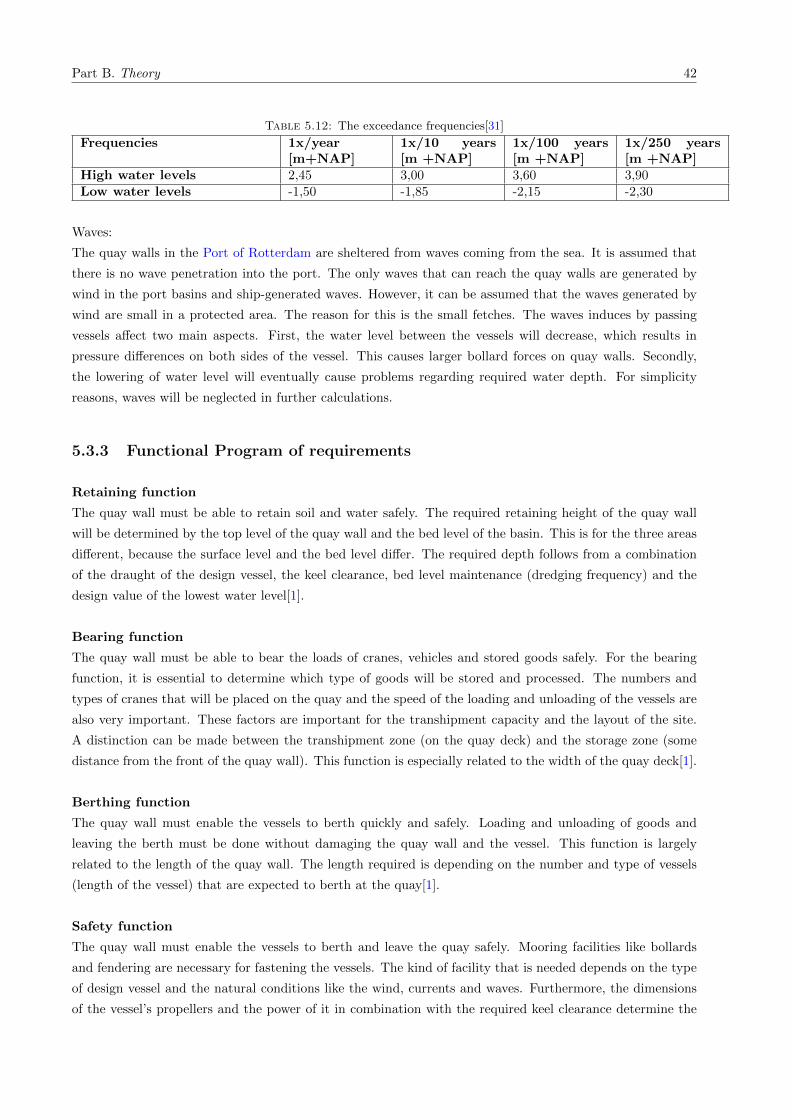
Part B. Theory 42
Table 5.12: The exceedance frequencies[31]
Frequencies 1x/year[m+NAP]
1x/10 years[m +NAP]
1x/100 years[m +NAP]
1x/250 years[m +NAP]
High water levels 2,45 3,00 3,60 3,90Low water levels -1,50 -1,85 -2,15 -2,30
Waves:
The quay walls in the Port of Rotterdam are sheltered from waves coming from the sea. It is assumed that
there is no wave penetration into the port. The only waves that can reach the quay walls are generated by
wind in the port basins and ship-generated waves. However, it can be assumed that the waves generated by
wind are small in a protected area. The reason for this is the small fetches. The waves induces by passing
vessels affect two main aspects. First, the water level between the vessels will decrease, which results in
pressure differences on both sides of the vessel. This causes larger bollard forces on quay walls. Secondly,
the lowering of water level will eventually cause problems regarding required water depth. For simplicity
reasons, waves will be neglected in further calculations.
5.3.3 Functional Program of requirements
Retaining function
The quay wall must be able to retain soil and water safely. The required retaining height of the quay wall
will be determined by the top level of the quay wall and the bed level of the basin. This is for the three areas
different, because the surface level and the bed level differ. The required depth follows from a combination
of the draught of the design vessel, the keel clearance, bed level maintenance (dredging frequency) and the
design value of the lowest water level[1].
Bearing function
The quay wall must be able to bear the loads of cranes, vehicles and stored goods safely. For the bearing
function, it is essential to determine which type of goods will be stored and processed. The numbers and
types of cranes that will be placed on the quay and the speed of the loading and unloading of the vessels are
also very important. These factors are important for the transhipment capacity and the layout of the site.
A distinction can be made between the transhipment zone (on the quay deck) and the storage zone (some
distance from the front of the quay wall). This function is especially related to the width of the quay deck[1].
Berthing function
The quay wall must enable the vessels to berth quickly and safely. Loading and unloading of goods and
leaving the berth must be done without damaging the quay wall and the vessel. This function is largely
related to the length of the quay wall. The length required is depending on the number and type of vessels
(length of the vessel) that are expected to berth at the quay[1].
Safety function
The quay wall must enable the vessels to berth and leave the quay safely. Mooring facilities like bollards
and fendering are necessary for fastening the vessels. The kind of facility that is needed depends on the type
of design vessel and the natural conditions like the wind, currents and waves. Furthermore, the dimensions
of the vessel’s propellers and the power of it in combination with the required keel clearance determine the

Part B. Theory 43
need for a scour protection[1].
5.3.4 Technical requirements
Nautical requirements
The required depth of a quay wall strongly depends on the draught of the design vessel. The largest draught
subsequently depends on the available water depth in each area. For this study, it is assumed that area 1
is only accessible for inland barges. The characteristics of the design vessels are shown in Table 5.13 and
Table 5.14.
Table 5.13: Characteristics of seagoing vessels for area 2 (Europoort) & area 3 (Maasvlakte)
Deep-sea vessel: containersAlphaliner 220,000 DWT (20,250 TEU)Length 440,0mWidth 59,0mDraught 17mDeep-sea vessel: dry bulkVery large ore vessels 440,000 DWTLength 362,0mWidth 65,0mDraught 23,0m
The characteristics of the design vessel: City port (area 1), Europoort and Maasvlakte (area 2&3)
Table 5.14: Characteristics of inland vessels for area 1 (City port), area 2 (Europoort) & area 3(Maasvlakte)
Inland vessels:Vorstenbosch 13,300 DWTLength 147,0mWidth 22,8mDraught 5,4m
Retaining function
The required nautical guaranteed depth (NGD) is equal to the level of:
LLWS - 1,1 x the maximum draught[1]
When determining the total retaining height, also other factors should be taken into account. The following
factors are important:
• Maintenance margin
• Dredging tolerances
• Survey inaccuracies
The required retaining height is now equal to: LLWS - 1,1 x the maximum draught - (maintenance margin
+ dredging tolerances + survey inaccuracies)
This is illustrated in Figure 5.6.

Part B. Theory 44
Figure 5.6: Important factors influencing the total retaining height[1]
For the different areas is the total required retaining height determined in Table 5.15. The values for the
maintenance margin, dredging tolerances and survey inaccuracies are described in Handbook of Quay walls,
Second Edition.
Table 5.15: Total retaining height for three areas
Inland vessels(area 1)
Inland vessels(area 1)
Deep-sea ves-sels containers(area 2&3)
Deep-sea ves-sels dry bulk(area 2&3)
Surface level NAP +3,65m NAP +5m NAP +5,0m NAP +5,0mLow Low Water Spring(LLWS)
NAP -0,84m NAP -0,84m NAP -0,84m NAP -0,84m
Draught of the vessel (D) 5,40m 5,40m 17m 23mKeel clearance (10%*D) 0,54m 0,54m 1,7m 2,3mMaintenance margin (unpro-tected)
0,5m 0,5m 0,5m 0,5
Dredging tolerances 0,5m 0,5m 0,7m 0,7Survey inaccuracies 0,1m 0,1m 0,1m 0,1required nautical guaranteeddepth
NAP -5,94m NAP -5,94m NAP -19,54m NAP -26,14m
Design depth NAP -7,88m NAP -7,88m NAP -20,84m NAP -27,44mRetaining height 11,53m 12,88m 25,84m 32,44m
Bearing function
Surcharge load:
Flexibility should be included in the design in order to have future-proof quay walls. The construction should
be able to facilitate different types of cargo in the future. Quay walls used for transhipment of containers
can also be used for other transhipment (for example dry bulk). However, container throughput has a much
lower surcharge load than dry bulk. Therefore, when bulk goods are stored behind the quay, it is necessary to
agree on the distance from the front of the quay. The surcharge load on the quay walls imposed by containers

Part B. Theory 45
is determined by the number of containers that are stacked on each other. According to Handbook of Quay
walls the design values presented in Table 5.16 can be used for calculations.
Table 5.16: Design values surcharge load due to containers
Max. weight full container 350 kNContainer on stack area, 2 layer 35 kN/m2
Container on stack area, 3 layer 45 kN/m2
Container on stack area, 4 layer 55 kN/m2
Container on stack area, 5 layer 70 kN/m2
For the design, the following uniform loads are investigated:
• 20kN/m2
• 60kN/m2
• 100kN/m2
For the quay walls used for seagoing vessels is in addition the influence of dry bulk investigated. According
to the Handbook of Quay walls a maximum surcharge load of 450kN/m2 must be taken into account. In the
design, the following load schemes are further analysed:
Figure 5.7: Schematization of surcharge loads
Crane loads:
In Handbook of Quay Walls recommendations have been included regarding crane loads. For this research,
a distinction is made between fixed rail cranes and mobile cranes. Fixed rail cranes are used for loading and
unloading of seagoing vessels. Here, a distinction is made between cranes for containers and dry bulk. Mobile
cranes are used for loading and unloading of inland barges.

Part B. Theory 46
Cranes used for seagoing vessels:
The crane used for the design of container quay walls, is the same as the Euromax container crane. The
characteristics are shown in Table 5.17 and Table 5.18.
Characteristics container crane:
• Number of wheels: 8
• Rail gauge: 30,48m
• Distance between wheels 1,05m
Table 5.17: Characteristics container crane for area 2&3[3]
Max. wheel load [kN] Load on corner [kN] Load per m [kN/m]Vertical loadsWaterside 2000 16000 2177Landside 2500 20000 2721Horizontal loadsWaterside 45 350 48Landside 45 350 48
The crane used for the design of dry bulk quay walls is a grab crane. The characteristic are shown in the
table below.
Table 5.18: Characteristics Grab crane for area 2&3[1]
Type of crane Outreachwaterside[m]
Rail gauge[m]
Max. ver-tical load[kN]
Max.wheel load[kN]
Number ofwheels
Wheel dis-tance [m]
Grab crane 45 24 12483 1560 8 1,57
Table 5.19: Characteristics mobile crane
Gottwald Mobile Harbour CraneTotal crane weight [t] 600Maximum load [t] 80Base [m2] 11,1 x 19,5Stabilizer pad size [m2] 2 x 4,5Radius [m] 39
The mobile cranes are able to move along the quay wall, differently than fixed rail cranes. Two different
modes are distinguished:
• Crane in travelling mode
• Crane in operation
The area covered by the crane in travelling mode is approx. 220m2. As such the uniformly distributed load
will be 6000/220 = 27kN/m2. Since this value is lower than the minimum surcharge load (35kN/m2 and
cannot occur at the same time, the value of the surcharge load is used for the calculations. When the crane
is in an operational mode, the load effects cannot be considered as uniformly distributed over the entire base.
Three different positions are possible, see Figure 5.8. The most unfavourable position is position II, where

Part B. Theory 47
the load is exerted on only one pas (A). The location of the crane on the quay contributes a large proportion
to the anchor force. The closer the crane on the edge of the quay wall, the greater the effect on the combined
wall. When the distance from the concrete beam is too small, the load will not end up on the combined
wall but will be distributed as a horizontal load in the concrete superstructure. For further calculations it is
assumed that the crane is located at a sufficient distance.
Figure 5.8: Crane in operational mode
Protective function
Bollard loads:
The bollard forces acting on the quay wall are dependent on the dimensions of the vessels. In the EAU
2012[32](table E 12-1) the characteristic values are given for the bollard load (Table 5.20). For the seagoing
vessels (area 2 and 3), the highest category is held for the bollard forces. In the case of the design vessel, a
water displacement of more than 250.000 tons occurs. This results in a bollard force of 2500 kN acting on
the quay wall.
Table 5.20: The bollard forces
Water displacement [tons] Bollard force [kN]Up to 10.000 300Up to 20.000 600Up to 50.000 800Up to 100.000 1000Up to 200.000 2000Up to 250.000 2500>250.000 2500
The inland barges have much smaller dimensions. The water displacement that occurs can reach up to a
maximum of 50.000tons. This results into a smaller bollard force. For the calculations a force of 800kN will
be used (Table 5.21).
Table 5.21: Line forces acting on the quay
Inland barges Deep-sea vesselsBollard force (line force) 800 kN 2500 kNC.t.c distance 15m-20m 15m-20m

Part B. Theory 48
Berthing loads:
The kinetic energy of berthing vessel needs to be absorbed by a suitable fender system. The calculation takes
into account the extreme combinations of vessel displacement, design velocity, angle and different types of
coefficients. The total amount of kinetic energy to be absorbed by the fender can be calculated as:
Ekin =1
2msv
2sCHCECSCC (5.5)
Vessels do not always berth under normal conditions. Sometimes collision may occur due to human error,
exceptional weather conditions, malfunctions or a combination of these factors.
With reference to the berthing angle and velocity of the design vessels, the following energies are considered
(Table 5.22):
Table 5.22: Berthing energy
Designvelocity[m/s]
Angle ofapproach[ ◦]
Berthingenergy[kNm]
Area 1,2&3 Inlandvessels
0,15 15 138
Area 2&3 Deep-seavessels
0,1 5 1595
Every type and dimension of fender has different characteristics. Regardless which type of fender is chosen,
they must have sufficient capacity to absorb the berthing energies of vessels.
Bottom protection
The dimensions of the vessel’s propellers and the power of it determine the need for a scour protection. The
scour protection will not be investigated in this master thesis.

Chapter 6
Design cases
6.1 General
For this research different quay walls are analysed to provide a technically and economically optimal design
of a quay wall. A number of factors are of great importance and are assessed through a parametric analysis.
These factors are:
• Area-related factors
• User-related
• Project-specific factors
Area-related factors include geotechnical data, water levels and accessibility of different vessels. Project-
specific factors are greatly related to existing infrastructure/interfaces (including foundation, old quay walls
etc.), geometric data (specific height ground level) and space requirements for construction (wet or dry).
User-related factors include different surcharge loads and the type of vessels. The development of the ship-
ping industry is here of great importance here. This has an impact on the design depth and the strength of
the quay walls.
The standard principle solutions investigated for this research have the character of a concept design. Within
an actual project, the project-specific factors can be further elaborated into a definitive design. Therefore,
the project-specific factors will not be further included in this research.
49

Part C. Analysis 50
6.2 Different research cases
A two dimensional parametric analysis is done for eight different cases to investigate the role of major factors
as the retaining height, surcharge load, soil profiles and a relieving platform on the design and the costs of
quay walls. Here, a distinction is made between quay walls for inland barges and seagoing vessels.
Inland barges
For the quay walls used by inland barges, a comparison is made between an anchored sheet pile wall and an
anchored combined wall. This is done in order to analyse the influence of the different type of walls.
The inland barges can, due to their shallow draught, berth in the entire port, therefore two different soil pro-
files (City port and the Europoort&Maasvlakte) are investigated. As described in the boundary conditions,
the soil conditions are different for these two areas.
Seagoing vessels
For the quay walls used by deep-seagoing vessels, first a comparison is made between an anchored combined
wall without a relieving platform and a combined wall with relieving platform. Secondly, some variation is
disposed in the relieving platform. The length and the depth of the relieving platform is varied.
The seagoing vessels can, due to their bigger draught, only berth at the quays in the Europoort and the
Maasvlakte. A parametric analysis is therefore only done for soil conditions in area 2&3 (Europoort&Maasvlakte).
The different cases are mentioned in the diagram Figure 6.1 below.

Part C. Analysis 51
Figure 6.1: Different design cases
In order to give a better image of the cases, the cross-sections of the quay walls are illustrated in the figures
below. The width of the beam of the relieving platform w, the anchor length La and the embedded depth
depend on the retaining height, surcharge and the soil profile.

Part C. Analysis 52
Anchored sheet pile wall (A1) and anchored combined wall (B1) in the City Port, used by
inland barges.
Figure 6.2: Design cases A1 and B1

Part C. Analysis 53
Anchored sheet pile wall (A2) and anchored combined wall (B2) in Europoort & Maasvlakte,
used by inland barges.
Figure 6.3: Design cases A2 and B2

Part C. Analysis 54
Combined wall in absence (C) and presence (D, E, F) of a relieving platform in Europoort &
Maasvlakte, used by deep seagoing vessels.
Figure 6.4: Design cases C, D, E and F

Part C. Analysis 55
The main cases are further divided into sub-cases. Depending on the area (ground level) and type of quay
wall (inland or seagoing), a number of retaining heights are investigated. For each retaining height, three
different surcharges are considered. The sub-cases listed in the tables below are elaborated in the remainder
of this report. For some sub-cases, an additional surcharge of 40kN/m2 is considered. This is indicated in
the tables by the sign ′∗′.
Table 6.1: Sub-cases inland barges area 1
SUB-CASES A1 and B1 (City port)Retaining height [m] Surcharge [kN/m2]
A11, B11 11,65 20A12, B12 11,65 60A13, B13 11,65 100A14, B14 12,65 20A15* 12,65 40A15, B15 12,65 60A16, B16 12,65 100A17, B17 13,65 20A18, B18 13,65 60A19, B19 13,65 100
Table 6.2: Sub-cases inland barges area 2&3
SUB-CASES A2 and B2 (Europoort&Maasvlakte)Retaining height [m] Surcharge [kN/m2]
A21, B21 13 20A22* 13 40A22, B22 13 60A23, B23 13 100A24, B24 14 20A25, B25 14 60A26, B26 14 100A27, B27 15 20A28, B28 15 60A29, B29 15 100
Table 6.3: Sub-cases seagoing vessels area 2&3
SUB-CASES (Europoort&Maasvlakte)Retaining height h [m] Surcharge q [kN/m2]
C1, D1, E1, F1 20 20C2, D2, E2, F2 20 60C3, D3, E3, F3 20 100C4, D4, E4, F4 25 20C5, D5, E5, F5 25 60C6, D6, E6, F6 25 100C7, D7, E7, F7 30 20C8, D8, E8, F8 30 60C9, D9, E9, F9 30 100

Chapter 7
Platform Analysis
7.1 General
The different research cases are discussed in the previous chapter. Case D, E and F have a relieving platform.
In quay walls, a relieving platform can be built to reduce earth pressure on the (combined/slurry) wall.
Figure 7.1 shows the principles on which the determination of the impact of a relieving platform is based. In
case of a relieving platform, the earth pressure starts on the level of the lower side of the relieving platform
instead of the ground level at the top. The line starting from the rear of the relieving platform can be used as
the upper bound, at the angle ϕ, and the lower bound, at the angle ϑ, of the transition zone. The influence
of the surcharge starts from the upper bound and the full influence is valid from the lower bound.
Figure 7.1: Principle of a relieving platform
56
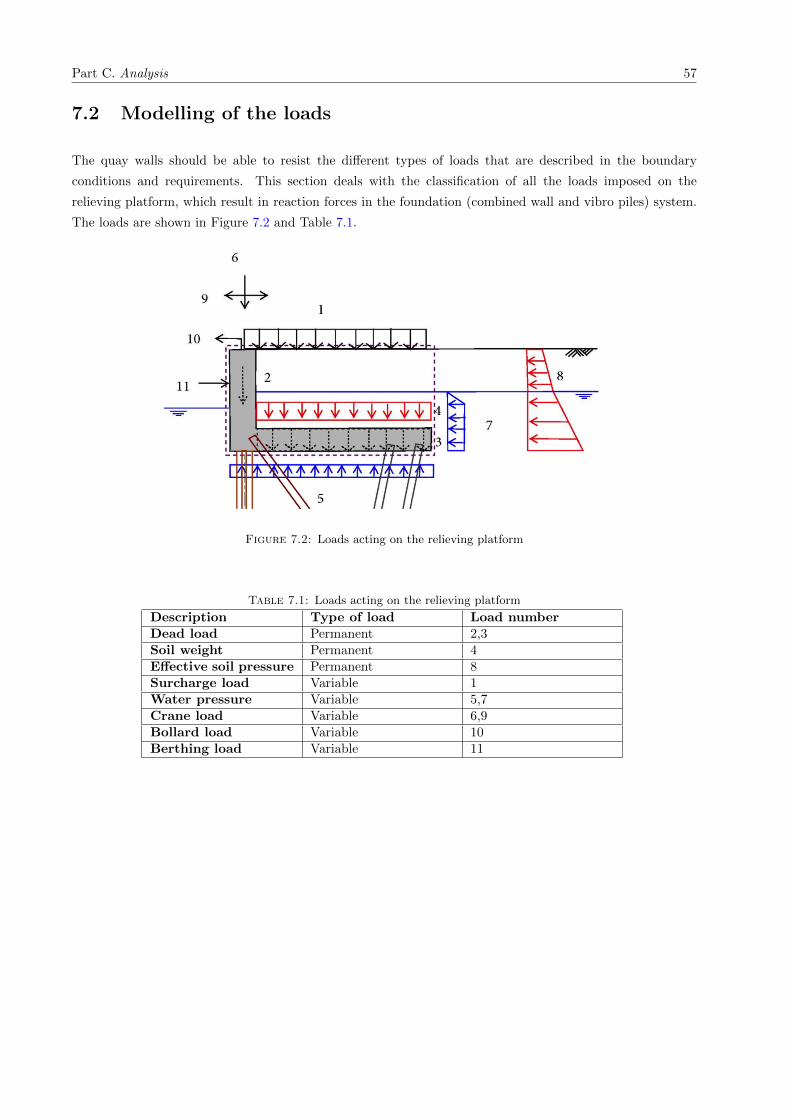
Part C. Analysis 57
7.2 Modelling of the loads
The quay walls should be able to resist the different types of loads that are described in the boundary
conditions and requirements. This section deals with the classification of all the loads imposed on the
relieving platform, which result in reaction forces in the foundation (combined wall and vibro piles) system.
The loads are shown in Figure 7.2 and Table 7.1.
Figure 7.2: Loads acting on the relieving platform
Table 7.1: Loads acting on the relieving platform
Description Type of load Load numberDead load Permanent 2,3Soil weight Permanent 4Effective soil pressure Permanent 8Surcharge load Variable 1Water pressure Variable 5,7Crane load Variable 6,9Bollard load Variable 10Berthing load Variable 11

Part C. Analysis 58
7.3 Schematization SCIA-engineering
Using the program SCIA-engineering, reaction forces caused by the load cases LC1 to LC4 (Table 5.6) are
calculated. The calculations are based on the statically determinate system shown below. The loads acting
on the relieving platform, for each sub-case, are presented in appendix B.
Figure 7.3: Static determined system
In the static model, the connection point A is simulated as a fixed hinge and point B as a roller. The
assumption of considering the combined wall and the vibro piles as respectively a hinged support and a
roller, reduces the degree of freedom. The simplified statically determinate model enforces all horizontal
loads to be absorbed by support A.
This assumption is justified by the fact that the vibro piles would absorb only a small part of the total acting
horizontal forces, compared to the share absorbed by the MV-piles. For this reason, the assumption is quite
conservative.
7.4 Results from SCIA-engineering
The, with SCIA-engineering calculated, reaction forces are shown in Table 7.2. It has to be noted that only
the governing values, which lead to a maximum stress in the combined wall, are included in this table. An
extensive table of all load combinations is included in Appendix C.

Part C. Analysis 59
Table 7.2: Governing reaction forces
SUB-CASESVertical reactionforce in point AFV,A[kN/m]
Horizontal reactionforce in point AFH,A[kN/m]
Vertical reactionforce in point BFV,B [kN/m]
D1 3137,72 293,63 1352,95E1 3250,22 564,40 1610,16F1 3591,42 293,67 1850,45D2 3344,46 408,47 1608,21E2 3506,16 744,80 1816,22F2 3868,70 408,47 2189,17D3 3551,20 523,27 1863,48E3 3762,09 925,20 2022,29F3 4145,99 523,27 2527,89D4 3223,56 293,63 1352,95E4 3331,15 564,40 1610,16F4 3642,92 293,67 1850,45D5 3430,30 408,47 1608,21E5 3587,09 744,80 1816,22F5 3920,21 408,47 2189,17D6 3637,03 523,15 1863,48E6 3437,34 904,08 2022,29F6 4197,49 523,27 2527,89D7 3360,90 293,63 1352,95E7 3520,00 564,40 1610,16F7 3763,10 293,67 1850,45D8 3567,64 408,47 1608,21E8 3775,93 744,80 1816,22F8 4040,38 408,48 2189,17D9 3774,37 523,27 2172,85E9 4031,86 925,20 2022,29F9 4317,66 523,27 2527,89
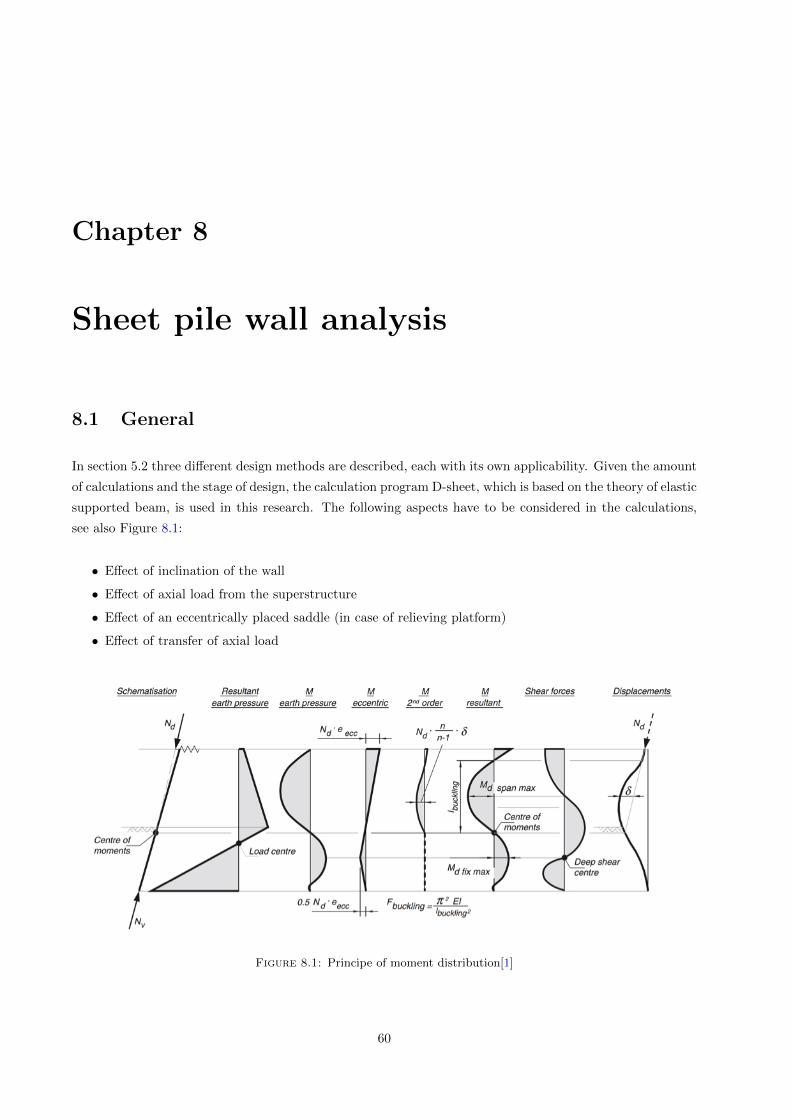
Chapter 8
Sheet pile wall analysis
8.1 General
In section 5.2 three different design methods are described, each with its own applicability. Given the amount
of calculations and the stage of design, the calculation program D-sheet, which is based on the theory of elastic
supported beam, is used in this research. The following aspects have to be considered in the calculations,
see also Figure 8.1:
• Effect of inclination of the wall
• Effect of axial load from the superstructure
• Effect of an eccentrically placed saddle (in case of relieving platform)
• Effect of transfer of axial load
Figure 8.1: Principe of moment distribution[1]
60

Part C. Analysis 61
It should be noted that:
• The sheet pile walls considered in the design cases, are positioned vertically. The favourable effect of
inclination of the wall on both active and passive earth pressures as well as the bending moment in the
sheet pile wall is not considered.
• The unfavourable 2nd order moment is considered negligible, considering the aforementioned, and has
not been taken into account. From the experience of the employees at the Public Works of Rotterdam,
it could be said that the 2nd order moment has a contribution of approximately 10% to the total
moment.
8.2 Schematization D-sheet
For the governing load combination, the horizontal force from the superstructure (FH,A) and the vertical
reaction to the combined wall (FV,A) are applied in D-sheet. The vertical reaction on the combined wall is
multiplied by the eccentricity of the saddle in point A (a connection between the relieving platform and the
combined wall), resulting in an external moment. The anchor is simulated as an infinite stiff spring. This
assumption will result in an upper limit for the anchor force since its stiffness is assumed infinite. This is
again a conservative assumption. The schematization in D-sheet is shown below.
Figure 8.2: schematization of a deep-sea quay wall in D-sheet
It should be noted that:
• In case of a relieving platform (case D, E, F), the soil weight is added to the surcharge and applied at
the level of the relieving platform.
• In case of a relieving platform (case D, E, F), the vertical reaction force FV,A is imposed on top of the
wall as an external load.
• In case of a quay wall without a relieving platform (case C), the vertical crane load is imposed on top
of the wall as an external load.
• In case of quay walls used by inland barges (A1, B1, A2, B1), there is no axial force applied in D-sheet
(Section 5.3.4).

Part C. Analysis 62
8.3 Sheet pile profiles
The two main steel sheet pile profiles are the Z- and the U-profiles. The characteristics of Z-profiles are
the continuous form of the web and the location of the interlocks which are symmetrically placed on each
side of the neutral axis, which result in a positive influence on the section modulus[33]. With U-profiles, the
interlocks are centrically placed (on the neutral axis).When U-profiles are used, the effect of oblique bending
should be considered. The main advantage of U-profiles is the wide range of profiles with different geometric
characteristics, making it possible to choose a profile that is both technically and economically most suitable.
Sheet pile walls are generally applied when retaining heights up to 12m are involved. When larger retaining
heights and heavy loads are involved, combined sheet pile wall systems are preferred. Section 3.3.2 provides
a detailed description of sheet pile walls and combined walls. For the quay walls used by inland barges, with
retaining heights up to 15m, a comparison is made between an anchored sheet pile wall and an anchored
combined wall. The choice of wall is prompted by the design and the feasibility of it. Each variant has its
advantages and disadvantages. The sheet pile wall has the advantage that it can easily be extracted from the
ground. But on the other hand, its applicability is limited considering the retaining height and the surcharge.
The combined wall is also applicable to larger retaining heights and larger surcharges.
For the design, the following is considered and applied:
• In order to minimize the risk of interlock openings, triple U-shaped intermediate sheets are applied in
combined walls.
• AU-profiles have achieved a weight reduction of about 10%[33]compared to the PU series. This is done
by optimising the geometric dimensions.
• For sheet pile walls, Z-profiles are applied.
• Combined walls are applied in steel quality X60 and X70.
• Sheet pile walls are applied in steel quality S355.
• The embedded level of the intermediate sheets is kept to at least 2 m below the point of zero shearing
force.
The characteristics of the sheet pile profiles used in the design of quay walls are presented in Table 8.1 and
Table 8.2. It should be noted that:
• As the influence of intermediate elements on the strength of combined walls is marginal, in each design
case the same sheet pile element was chosen. The tubular piles, which largely determine a combined
walls’ strength, haven been varied per case.
• The sheet pile profiles used for the design of quay walls for inland barges are differently per case.

Part C. Analysis 63
Table 8.1: Characteristics of AZ-profiles
Sheet pile profile (AZ)AZ40-700 AZ46 AZ48 AZ50
Thickness (tt) 17 18 19 20 [mm]Thickness (ts) 13,2 14 15 16 [mm]Width (b) 700 580 580 580 [mm]Height (h) 501 481 482 483 [mm]Section area (A) 244 291 307 322 [mm2/m]Mass (G) 192 229 241 253 [kg/m2]Moment of inertia (I) 1,0008*109 1,1045*109 1,1567*109 1,2106*109 [mm4/m]Section modulus (W) 3,995*106 4,595*106 4,800*106 5,015*106 [mm3/m]
Table 8.2: Characteristics of intermediate sheet piles
Intermediate elements (AU 20)Thickness (tt) 12 [mm]Thickness (ts) 10 [mm]Width (b) 750 [mm]Height (h) 444 [mm]Section area (A) 165 [mm2/m]Mass (G) 129 [kg/m2]Moment of inertia (I) 4,444*108 [mm4/m]Section modulus (W) 2*106 [mm3]

Part C. Analysis 64
8.4 Result from D-sheet analysis
The maximum moment and anchor force are summarised in the following graphs. The graphs present, for
different surcharges, the relation between the maximum moment/maximum anchor force and the retaining
height. Appendix D includes, for each case, the distribution of the internal forces along the beam axis. The
anchor force is obtained by multiplying the horizontal support reaction (Fsupport) with√
2.
Maximum moments and anchor forces for soil profile in the City port, inland barges
As it can be observed from the following graphs, the combined wall is less sensitive to larger retaining heights
and larger surcharges. The sheet pile wall can withstand a maximum surcharge of 60kN/m2, at retaining
heights up to 11, 65m and withstand maximum a surcharge of 40kN/m2 at retaining heights up to 12, 65m.
Whereas the combined wall can withstand surcharges up to 100kN/m2.
Figure 8.3: Maximum moments CASE A1 Figure 8.4: Maximum anchor forces CASE A1
Figure 8.5: Maximum moments CASE B1 Figure 8.6: Maximum anchor forces CASE B1

Part C. Analysis 65
Maximum moments and anchor forces for soil profile in Europoort & Maasvlakte, inland barges
The same can be said for the moments (Figure 8.7 and Figure 8.9) and anchor forces (Figure 8.8 and
Figure 8.10) in the Europoort and the Maasvlakte. The combined wall is, in comparison with the sheet pile
wall, less sensitive to larger retaining heights and larger surcharges. For the soil conditions in the Europoort
and the Maasvlakte, sheet pile walls can withstand a maximum surcharge of 40kN/m2 at retaining heights
up to 13m. Whereas the combined wall can withstand surcharges up to 100kN/m2.
Figure 8.7: Maximum moments CASE A2 Figure 8.8: Maximum anchor forces CASE A2
Figure 8.9: Maximum moments CASE B2 Figure 8.10: Maximum anchor forces CASE B2

Part C. Analysis 66
Maximum moments and anchor forces for soil profile in Europoort & Maasvlakte, seagoing
vessels
Figure 8.11: Maximum moments CASE C Figure 8.12: Maximum anchor forces CASE C
Figure 8.13: Maximum moments CASE D Figure 8.14: Maximum anchor forces CASE D

Part C. Analysis 67
Figure 8.15: Maximum moments CASE E Figure 8.16: Maximum anchor forces CASE E
Figure 8.17: Maximum moments CASE F Figure 8.18: Maximum anchor forces CASE F
If we compare the graphs of the maximum bending moment of the different quay walls used by sea going
vessels, we see significant differences. A quay wall without a relieving platform is more sensitive to larger
retaining heights and surcharges. The following can be derived from the graphs:
• In case of a quay wall without a relieving platform (case C), the graph increases for each surcharge
almost linearly. This, while in the cases of a quay wall without a relieving platform (case D, E, F), the
graphs increase more or less parabolic.
• In case of a quay wall without a relieving platform (case C), for each retaining height an increase of
bending moment is shown. This, while in the case of a quay wall without a relieving platform (case D,
E, F), the bending moment remains substantially the same.
• Increasing surcharges lead to larger difference in bending moment between a quay wall with relieving
platform (case C) and without a relieving platform (case D, E, F).
• Increasing retaining heights lead to larger difference in bending moment between a quay wall with
relieving platform (case C) and without a relieving platform (case D, E, F).

Part C. Analysis 68
• A deep relieving platform (case E), in comparison with a shallow relieving platform (case D), has
lower bending moments, yet higher anchor forces. The lower bending moments are favourable for the
dimensions of the combined wall.
• A long relieving platform (case F), in comparison with a slightly shorter relieving platform (case D),
has lower bending moments which is favourable for the dimensions of the combined wall.
8.5 Dimensioning and verification
8.5.1 Substructure (front wall)
The verification of the sheet pile wall and the combined wall is done by comparing the stresses, occurring as
a result of the bending moments and axial forces, to the design value of the yield stress. It should be noted
that the preliminary dimensions are obtained by means of an iteration process in D-sheet. This is done to
make a first estimation of the internal forces in the wall.
The following equations are used here:
σd ≤ σy (8.1)
σd =Ntot,dAs
+Mtot,d
Wy,el(8.2)
Ntot,d = Fsup,d + Fa,d · sin(α) (8.3)
The wall is loaded by a vertical component of the anchor force and an axial force due to the superstructure.
The summation of the axial force and the vertical component of the anchor force are equal to the total
axial force working on the wall. In case of a relieving platform, the axial force is equal to the vertical reac-
tion in point A. For quay walls without a relieving platform, the axial force is equal to the vertical crane load.
The results of the cross-section check are presented in appendix E. The conclusions drawn in Section 8.4, are
viewable in the dimensions of the wall. The following can be derived from the cross-section check:
Quay walls used by inland barges
• The dimension of the wall increases with increasing retaining height.
• The dimension of the wall increases with increasing surcharges.
• Sheet pile walls are not always applicable. The heaviest sheet pile profile can withstand a limited
surcharge.
• In area 2&3, the wall should be driven deeper in comparison with area 1. This is due to the intervening
layer of clay.
Quay walls used by seagoing vessels

Part C. Analysis 69
• In case of a quay wall without a relieving platform (case C) the dimensions of the wall are larger,
compared to a quay wall without a relieving platform (case D, E, F).
• In case of a quay wall without a relieving platform (case C), for each retaining height an increase of
dimension is shown. This while in the case of a quay wall without a relieving platform (case D, E, F),
the dimension remains substantially the same.
• A deep relieving platform (case E), in comparison with a shallow relieving platform (case D), has
smaller wall dimensions.
• A long relieving platform (case F), in comparison with a slightly shorter relieving platform (case D),
has smaller wall dimensions.
8.5.2 Superstructure
As can be seen from the previous section, the front wall has several dimensions. The dimension depends on
the retaining height, surcharge, geotechnical conditions and the presence or absence of a relieving platform.
The dimension of the superstructure is in turn related to the substructure (Section 8.5.1). The figures below
represent the two different investigated types of superstructure, the capping beam and the relieving platform.
Figure 8.19: Cross-section superstructure
The following is considered:
• The level of the upper side of the quay wall is equal to the height of the surface. Each area has a
characteristic surface level.
• The bottom of the capping beam and relieving platform is preferably located at NAP-2m (approx. 1m
below the LWS), as in that case all steel is below water level almost all the time, which in turn makes
a cathodic protection work well and there will be no need for coating in the splash zone. In case E, the
relieving platform is located deeper to investigate its influence.
• The width is equal to the summation of the required profile height of the sheet pile wall or the required
diameter of a combined wall and a tolerance of approximately 0,5m.
• The height of the platform is 10% of the length. This is derived from the rule of thumb, which is equal
to 1/10*L. The dimensions of the superstructures are summarised in appendix F.

Part C. Analysis 70
8.5.3 Vertical bearing capacity
The wall is loaded by a vertical component of the anchor and an axial load at the head of the wall (load of
the superstructure). By applying the anchor at an angle, a downwardly directed vertical force on the wall
comes into play. In this section, it is checked whether the wall has sufficient strength to support the total
vertical load.
The vertical bearing capacity of the wall is determined by the following components:
• Resulting force from the passive and active soil wedge (negative shaft friction)
• Shaft friction on the part of the wall below the point of zero shearing force
• Tip bearing capacity
The bearing capacity of shaft and tip are determined through the qc-method. The resulting force from the
passive and active soil wedges follows from D-sheet calculations.
The following equations are used here:
Fr,max = Fr,max,shaft + Fr,max,tip (8.4)
Fr,max,shaft = Op,avg ·∫ ∆L
0
Pr,max,shaftdz (8.5)
Fr,max,tip = Atip · Pr,max,tip (8.6)
The vertical load capacity should be checked on the following criteria:
Fr,maxξ · γm
> Fax,d + Fnsf,d (8.7)
Fr,max,d > Fax,d + Fnsf,d (8.8)
The result of the calculations are presented in appendix G.
8.5.4 Anchor
MV-piles are often used in quay designs since large anchor forces must be transferred to the ground. The
design cases investigated in this research are also provided by MV-piles. For reasons of comparing, the same
MV-pile is applied in each case. Depending on the surcharge, retaining height, geotechnical conditions and
the presence of a relieving platform, the centre-to-centre distance of anchors and the anchor length vary from
case to case.

Part C. Analysis 71
MV-piles consist of a steel H-beam which is coated with cement grout during installation. The holding
capacity of this kind of anchors is provided by means of friction between the surrounded ground and the with
cement grouted body. By applying an H-beam, a long contact area can be obtained with relatively small
profile. The holding capacity of an MV-pile is found by summation of the maximum shear stress along the
interface, between the hardened grout body and the sand, over a length of Leff . The following equation is
used for the calculation:
Ra =∑
O · Leff · qc (8.9)
It should be noted that the effective length that contributes to the holding capacity is situated outside the
active wedge. The principle is illustrated in the figure below.
Figure 8.20: Principle of a MV-pile[1]
From the many loading tests in the port area of Rotterdam is concluded, that the maximum shear stress
in the pleistocene sand layer is equal to 1, 4%[29] of the average cone resistance. However, the maximum
shear stress should be kept at 250kN/m2[29] and a safety factor of 1, 4[29] should be applied on the holding
capacity of the anchor. The characteristics of the chosen MV-pile are summarised in the table below.
Table 8.3: Characteristics MV-pile
Thickness(tw) [mm]
Thickness (tf)[mm]
Width B [mm] Height h [mm] Section area(A) [cm2]
HP 400x231 26 26 372 402 294,2

Chapter 9
Future adaptation
9.1 General
As discussed in the introduction of this report, different principle solutions for quay walls are investigated to
reduce the difference between the technical and economic lifetime of quays. By standardizing the design, a
certain degree of flexibility can be achieved. Flexibility of quay walls means that a quay wall can be converted
for multiple types of vessels or multiple types of cargo and therefore becomes more future-proof.
The Rotterdam Port Authority depreciates quay walls after 25 years. In most cases, quay walls are still
structurally sound after 25 years and can still be put to economic use, provided they meet the requirements
of the new client. When the new client has different requirements regarding the storage of cargo, this may
lead to adjustments on the quay wall which in turn can result in additional costs for the owner.
Quay walls used for transhipment of containers can also be used for other purposes such as dry bulk. How-
ever, container throughput has a much lower surcharge load than dry bulk. Therefore, when bulk goods are
stored behind the quay, it is necessary to agree on the distance from the front of the quay to the storage
boundary. In this chapter this distance will be discussed in terms of the stability of the existing quay wall.
It should be noted that this is done for the design cases of the deep-sea quay walls only.
9.2 Storage of dry bulk
Four different deep-sea quay walls are investigated in order to calculate the minimum distance between the
dry bulk and the front of the quay wall. The presence or absence of a relieving platform plays a major role.
Regarding the calculations, the following has been adopted:
• The dimensions of the combined wall remain the same.
• The anchor profile, length and the centre-to-centre distance of the anchors remains the same.
• The embedded level of the primary and the secondary elements is not changed.
72

Part C. Analysis 73
• The soil conditions for Europoort and Maasvlakte are looked at.
• The minimum distance to the front of the quay wall is equal to the width of the active soil wedge.
It should be noted that for each retaining height, the subcase with the smallest dimensions of the combined
wall (that is in case of surcharge 20kN/m2) is checked on dry bulk as surcharge. This is in fact the governing
case in relation to the dimensions.
The results of the calculations are represented in Table 9.1 and Figure 9.1. From the comparison of C with
the other cases, it can be concluded that the relieving platform is advantageous in the case of dry bulk,
in the sense that the surcharge can be placed closer to the quay wall. The depth and the length of the
relieving platform clearly have no influence on the bulk storage, but it has already had its positive influence
in determining the dimensions of tubular piles, which have been the starting point in these calculations.
It is remarkable that a quay wall without a relieving platform (case C), at a retaining height of 20m, requires
a relatively large distance to the front of the quay. This is explained by the fact that in this case the anchor
length is governing for the determination of the distance. The required distance should be large enough to
ensure that no adjustments are needed to the existing anchor (as in the case of container storage).
Table 9.1: Minimum distance to the front of a quay wall
CASEC
Distanceto thequay [m]
CASED
Distanceto thequay [m]
CASEE
Distanceto thequay [m]
CASEF
Distanceto thequay [m]
C1 70 D1 16 E1 15 F1 15C4 35 D4 16 E4 16 E4 20C7 35 D7 20 E7 20 E7 20
Figure 9.1: Minimum distance to the front of a quay wall, for surcharge 20kN/m2

Chapter 10
Cost estimation
10.1 General
A technical assessment of quay wall designs is carried out in previous chapters. In addition, a financial
assessment will be carried out in this chapter to give a better picture of the optimum price/quality relation.
In this way, the opportunity is given to choose the best solution.
CROW[1] is one of the various methods that can be used to determine the costs of civil engineering projects.
Within this sector, this approach is the most accepted way of assessing costs and can be used for every
project phase. The total construction cost can broadly be classified into direct and indirect costs. The direct
costs are divided into material, equipment and labour costs. The design cost is a part of the indirect costs.
For this study, only the indirect costs are considered. A rough estimation is accomplished in order to make
a comparison between the different design cases. For the first estimation some indices, available from the
literature, are used. In the Netherlands the total construction costs of quay walls per m’ retaining height are
as follows:
Table 10.1: Costs regarded to retaining height[1]
Retaining height [m] Cost per m’ [e]5-10 1050 - 125010-20 1250 - 150020-30 1500 - 1700
It should be noted that the table above does not include the costs of engineering, bottom protection, fendering
and dredging in front of the quay.
10.2 Construction costs
For the estimation of the construction costs, available values based on already attained projects from Public
Works of Rotterdam are used. The values used include equipment, production and formwork. See table
below for the used values. The analytical cost analysis of each quay wall component is found in appendix I.
74

Part C. Analysis 75
Table 10.2: Construction costs for each component
Quay component Value UnitSheet pile wall (steel) 1400 [e/ton]Combined wall (steel) 1300 [e/ton]Superstructure (concrete) 328 [e/m3]MV-piles 321 [e/m]Vibro piles 90 [e/m]
For reasons of comparison, the components listen in Table 10.2 are analysed, for each design case. Firstly, the
construction costs of the cases are compared. This is done for two different areas. Secondly, the increase of
percentage of these costs, due to increasing surcharges and retaining heights, is illustrated. Also, a comparison
is made between the cost for quay walls with and without relieving platform. In addition, the influence of
deeper and longer relieving platform on costs is also presented.
10.2.1 Quay walls used by inland barges in the City port
Construction costs
As it can be observed from the following table and graph, sheet pile walls are less expensive compared to
combined walls, in case of low surcharge. At retaining heights up to 12, 65m and surcharges up to 40kN/m2,
sheet pile walls are less expensive. In case of a surcharge of 60kN/m2, the sheet pile wall is still less expensive
but can only be applied to retaining heights up to 11, 65m. For larger retaining heights and larger surcharges,
the combined wall should be applied.
Table 10.3: Construction costs for several design cases in area 1
A1 Costs [e/m] B1 Costs [e/m]A11 9061 B11 10234A12 11661 B12 12869A13 - B13 15214A14 9657 B14 10634A15* 10770 B15 13077A15 - B16 16166A16 - B17 11481A17 10302 B18 14034A18 - B19 16770A19 -

Part C. Analysis 76
Figure 10.1: Construction costs for several design cases in area 1
Increasing retaining height and surcharge
In Figure 10.2 and Figure 10.3, the increase of costs is translated into percentages. Hereby, the increase in
costs is considered with respect to increasing surcharges and retaining heights. It can be observed that the
costs will increase faster in case of increasing surcharges than increasing retaining heights. This applies to
both, the sheet pile variant as to the combined wall. However, it should be noted that the surcharge is made
5 times larger, while the retaining height is increased with 2 meters. The percentages are higher in the case
of sheet pile wall in comparison with the combined wall, which is understandable since the sheet pile wall
more sensitive is to larger retaining heights and larger surcharges.
The starting point for the comparative analysis, is the smallest retaining height and the smallest surcharge.
All lines in the graphs are scaled to 100% (retaining height 20m and surcharge 20kN/m2 is taken as a basis),
even though all lines are independent. In other words, the separate lines have a common but also an individ-
ual reference point. In the abstract, the construction costs will increase with increasing retaining height and
increasing surcharges but in relative terms, the percentages are very close to each other. A small deviation
in numbers will have a major influence in percentages.

Part C. Analysis 77
Table 10.4: Percentage of increase by increasing retaining height and surcharge in area 1
A1 Percentage ofincrease by in-creasing q [%]
A1 Percentage ofincrease by in-creasing h [%]
B1 Percentage ofincrease by in-creasing q [%]
B1 Percentage ofincrease by in-creasing h [%]
A11 0 A11 0 B11 0 B11 0A12 22,3 A14 6,2 B12 20,5 B14 3,8A13 - A17 12,1 B13 32,7 B17 10,9A14 0 A12 - B14 0 B12 0A15* 10,3 A15* - B15 18,7 B15 1,6A15 - A15 - B16 34,2 B18 8,3A16 - A18 - B17 0 B13 0A17 - A13 - B18 18,2 B16 5,9A18 - A16 - B19 31,5 B19 9,3A19 - A19 -
Figure 10.2: Increase of percentage by in-creasing surcharge in area 1
Figure 10.3: Increase of percentage by in-creasing retaining height in area 1
10.2.2 Quay walls used by inland barges in Europoort and Maasvlakte
Construction costs
As it can be observed from the graph below, combined walls are less expensive in comparison with sheet pile
walls. In case of a surcharge of 20kN/m2, the cost differences between combined wall and sheet pile wall
are maximum 3%. Even though the combined wall variant is less expensive here, based on project-related
reasons, may nevertheless be chosen for a sheet pile variant. The sheet pile wall has the advantage that it
can easily be extracted from the ground. But on the other hand, its applicability is limited considering the
retaining height and the surcharge while the combined wall is also applicable to larger retaining heights and
larger surcharges.

Part C. Analysis 78
Table 10.5: Construction costs for several design cases in area 2 & 3
A2 Costs [e/m B1 Costs [e/mA21 14146 B21 13870A22* 15224 B22 15770A22 - B23 17387A23 - B24 14901A24 15396 B25 16234A25 - B26 19176A26 - B27 15930A27 16303 B28 17716A28 - B29 21078A29 -
Figure 10.4: Construction costs for several design cases in area 2 & 3
Increasing retaining height and surcharge
Also here, see Figure 10.5 and Figure 10.6, the increase of costs is translated into percentages. It can be
seen that the costs will increase with maximum 25%, if the surcharge increases 5 times. And the costs will
increase with 18%, if the quay wall is constructed 2 meters deeper.
It is remarkable that the percentages in area 2 & 3 are higher in comparison to those in area 1. However,
the wall should be driven deeper in are 2 & 3. This is due to the intervening layer of clay. Also the ground
surface level in this area is higher, NAP + 5m instead of NAP + 3, 65m. Naturally this results into higher
costs.

Part C. Analysis 79
Table 10.6: Percentage of increase by increasing retaining height and surcharge in area 2 & 3
A2 Percentage ofincrease by in-creasing q [%]
A2 Percentage ofincrease by in-creasing h [%]
B2 Percentage ofincrease by in-creasing q [%]
B2 Percentage ofincrease by in-creasing h [%]
A21 0 A21 0 B21 0 B21 0A22* 7,1 A24 8,1 B22 12 B24 6,9A22 - A27 13,2 B23 20 B27 12,9A23 - A22* - B24 0 B22 0A24 - A22 - B25 8,2 B25 2,9A25 - A25 - B26 22,3 B28 11A26 - A28 - B27 0 B23 0A27 - A23 - B28 10,1 B26 9,3A28 - A26 - B29 24,4 B29 17,5A29 - A29 -
Figure 10.5: Total material costs for sev-eral design cases in area 2 & 3
Figure 10.6: Increase of percentage by in-creasing retaining height in area 2 & 3
10.2.3 Quay walls used by seagoing vessels in Europoort and Maasvlakte
In the remainder of this section, the impact of a relieving platform is discussed. The cost of the relieving
platform is strongly related to the amount of concrete used for the superstructure and it is obvious that it
increases regardless of the depth and the width. The dimension of the superstructure is in turn related to
the substructure and influences the required total length and the cross-section of the combined wall.
Construction costs
From the graphs below, it can be concluded that in case of a surcharge of 20kN/m2 a quay wall without a
relieving platform (case C) is less expensive, compared to a quay wall with a relieving platform (case D, E,
F). This changes quickly when the surcharge increases. From Figure 10.8 and Figure 10.9, it can be observed
that in case of surcharges 60 and 100kN/m2, a quay wall with a relieving platform at NAP − 2m and length
15m (case D) becomes less expensive compared to the rest of the cases.

Part C. Analysis 80
Table 10.7: Construction costs for several deep-sea quay walls in area 2 & 3
C Costs [e/m] D Costs [e/m] E Costs [e/m] F Costs [e/m]C1 23545 D1 25062 E1 26661 F1 32361C2 26425 D2 26241 E2 27602 F2 32610C3 31265 D3 26513 E3 27939 F3 34038C4 29566 D4 30881 E4 31386 F4 35904C5 32348 D5 31311 E5 32413 F5 36115C6 37046 D6 31513 E6 33838 F6 36289C7 34803 D7 39872 E7 38666 F7 43660C8 41584 D8 40213 E8 41361 F8 44172C9 44426 D9 41293 E9 41941 F9 44400
Figure 10.7: Construction costs for surcharge 20kN/m2

Part C. Analysis 81
Figure 10.8: Construction costs for surcharge 60kN/m2
Figure 10.9: Construction costs for surcharge 100kN/m2
Increasing retaining height and surcharge, comparison case C versus D
Figure 10.11 shows that a quay wall without a relieving (case C) is more sensitive to higher surcharges,
compared to a quay wall with a relieving platform (case D). In absence of a relieving platform the cost

Part C. Analysis 82
increases by a percentage of maximum 25%. In case of a relieving platform, this percentage is reduced to 5%.
This is due to the fact that in this case the effect of the surcharge starts at a deeper point of the combined
wall. The impact on the costs due to increasing retaining heights, is almost equal for both variants, see
Figure 10.11.
Table 10.8: Percentage of increase by increasing retaining height and surcharge for case C and D
C Percentage ofincrease by in-creasing q [%]
C Percentage ofincrease by in-creasing h [%]
D Percentage ofincrease by in-creasing q [%]
D Percentage ofincrease by in-creasing h [%]
C1 0 C1 0 D1 0 D1 0C2 10,9 C4 20,4 D2 4,5 D4 18,8C3 24,7 C7 32,3 D3 5,5 D7 37,1C4 0 C2 0 D4 0 D2 0C5 8,6 C5 18,3 D5 1,4 D5 16,2C6 20,2 C8 36,5 D6 2 D8 34,7C7 0 C3 0 D7 0 D3 0C8 16,3 C6 15,6 D8 0,8 D6 15,9C9 21,7 C9 29,6 D9 3,4 D9 35,8
Figure 10.10: Increase of percentage byincreasing surcharge for case C-D
Figure 10.11: Increase of percentage byincreasing retaining height for case C-D
Increasing retaining height and surcharge, comparison case D versus E
A deep relieving platform (case E) is compared with a shallow relieving platform (case D). The impact on
the costs is illustrated below. It is remarkable that in case that the relieving platform is placed deeper, for
retaining heights of 25m and 30m, the percentages are higher for increasing surcharges, compared to a shallow
relieving platform. This is possible, because the reduction effect of a deep relieving platform is more or less
limited to smaller retaining heights. From Figure 10.13, it can be observed that the influence of increasing
retaining height in both cases is approximately equal.
Increasing retaining height and surcharge, comparison case D versus F
Here, a long relieving platform (case F) is compared with a slightly shorter relieving platform (case D). The
influence of the comparison is shown below. The costs of a long relieving platform increases less rapidly,
compared to the case of a 5m shorter platform. This applies both to increasing surcharges as for increasing
retaining heights.

Part C. Analysis 83
Table 10.9: Percentage of increase by increasing retaining height and surcharge for case D and E
D Percentage ofincrease by in-creasing q [%]
D Percentage ofincrease by in-creasing h [%]
E Percentage ofincrease by in-creasing q [%]
E Percentage ofincrease by in-creasing h [%]
D1 0 D1 0 E1 0 E1 0D2 4,5 D4 18,8 E2 3,4 E4 15,1D3 5,5 D7 37,1 E3 4,6 E7 31D4 0 D2 0 E4 0 E2 0D5 1,4 D5 16,2 E5 3,2 E5 14,8D6 2 D8 34,7 E6 7,2 E8 33,3D7 0 D3 0 E7 0 E3 0D8 0,8 D6 15,9 E8 6,5 E6 17,4D9 3,4 D9 35,8 E9 7,8 E9 33,4
Figure 10.12: Increase of percentage byincreasing surcharge for case D-E
Figure 10.13: Increase of percentage byincreasing retaining height for case D-E
Table 10.10: Percentage of increase by increasing retaining height and surcharge for case D and F
D Percentage ofincrease by in-creasing q [%]
D Percentage ofincrease by in-creasing h [%]
F Percentage ofincrease by in-creasing q [%]
F Percentage ofincrease by in-creasing h [%]
D1 0 D1 0 F1 0 F1 0D2 4,5 D4 18,8 F2 0,8 F4 9,9D3 5,5 D7 37,1 F3 4,9 F7 25,9D4 0 D2 0 F4 0 F2 0D5 1,4 D5 16,2 F5 0,6 F5 9,7D6 2 D8 34,7 F6 1,1 F8 26,2D7 0 D3 0 F7 0 F3 0D8 0,8 D6 15,9 F8 1,2 F6 6,2D9 3,4 D9 35,8 F9 1,7 F9 23,3
10.2.4 Cost components
In this section, the ratio of different quay wall components has been considered. This is done by investigating
the influence of the components on the construction cost. Two extreme cases are considered, surcharge of
100kN/m2 and a retaining height of 30m. From the graphs below, it can be concluded that in the case
of a quay wall without a relieving platform (case C), the cost consist for about 50% of the component of
combined wall. The contribution of the superstructure and the anchor is, for each, approximately 25%. In

Part C. Analysis 84
Figure 10.14: Increase of percentage byincreasing retaining height for case D-F
Figure 10.15: Increase of percentage byincreasing surcharge for case D-F
case of the presence of a relieving platform (D, E, F), the contribution of the superstructure increases and
is even dominant for case E and F. The costs for the anchor decreases since the centre-to-centre distance
increases and therefore the required number of anchors decreases. The bearing piles have a slight influence on
the construction costs. Furthermore, it can be seen that the ratio of the components for increasing surcharges
and increasing retaining heights remains similar.
Figure 10.16: Cost components for surcharge 100kN/m2

Part C. Analysis 85
Figure 10.17: Cost components for retaining height 30m

Chapter 11
Conclusions and reflections
11.1 General
Quay walls form some of the most important parts of port infrastructure. This infrastructure is predomi-
nantly required for transfer of cargo. The influences of an uncertain environment, in which quay walls are
operating, ensure that from time to time the functional requirements imposed on quay walls, changes due to
different developments. Therefore, the design of new quay structures should not only relate to the current
functional and technical requirements, but should also be able to follow the future developments during the
intended service time.
This master thesis is a feasibility study of standard quay walls for the port of Rotterdam, which requires a
technical and financial approach to the topic. In the remainder of this chapter, the several research questions
discussed at the beginning will be presented, followed by the answers found. Thereafter, suggestions will be
given for potential future research.
11.2 Research questions
The main research question was formulated as follows:
• Is standardization of quay walls technically and economically feasible in the Port of Rotterdam? If so,
under which circumstances is it advisable?
To be able to answer the main question, the following additional questions are answered:
1. Which existing quay wall solutions are eligible for standardization? Is a distinction between quay walls
for inland barges and/or seagoing vessels necessary or is the type of terminal (container and dry bulk)
more relevant?
2. Which components of quay walls are suitable for standardization? Is it possible to standardize the
retaining wall?
86

Part D. Final assessment 87
3. When is a combined wall preferable to a sheet pile wall? Is it possible to determine at which retaining
height the turning point is located?
4. What is the role of major factors such as the retaining height, the surcharge load and a relieving
platform on the design and the costs of a quay wall?
5. Should the Port Authority choose for a larger initial investment to accommodate futures changes
(adaptive port design) or adapt at a later stage (if needed)?
11.3 Answers to the research questions
Answer to question 1
The depth of the navigation channels is decisive for the draught of the vessels. Subsequently, the required
retaining height of the quay wall depends on the draught of the vessels. For that reason, deep-seagoing vessels
cannot berth at quay walls in the city port. On the other hand, inland barges can, from a technical point of
view, berth at deep-sea quay walls, provided that the berthing requirements are adjusted accordantly. The
type of fendering, the configuration and capacity of the bollards are of great importance. From a financial
point of view, occupation of a deep-sea quay wall by inland barges can be unfavourable. Seagoing vessels
are served by more cranes in comparison to inland barges and transship more cargo per meter quay wall.
By making a distinction in ’inland’ and ’seagoing’ quay wall, additional capacity at deep-sea quays is created.
The type of cargo which will be stored behind a quay wall, is important for the stability of a quay wall
but also for the required storage space (beyond the scope of this study). Dry bulk has a much higher sur-
charge load than container throughput. Therefore, when bulk goods are stored behind the quay, it is necessary
to agree to store at a certain distance from the front of the quay. When investigating the different variants
of deep-sea quay walls, it can be concluded that it is always possible to use a bulk quay for transhipment of
containers. On the other hand, quay walls without a relieving platform are required to keep the bulk load
at an adequate distance from the front of the quay. In absence of a relieving platform, the distance varies
between 35 and 70 meters. In case of a relieving platform, regardless of depth and length, the distance varies
between 15 and 20 meters. The distance depends on the retaining height and the presence or absence of a
relieving platform. For the purpose of future proof quay walls, a relieving platform provides more flexibility
regarding the increasing surcharges. Therefore, the distance can be standardized at approximately 20 meters
from the front of the quay.
Answers to questions 2, 3 and 4
For this study, the primary emphasis has been on the main structure, thus the superstructure and the sub-
structure. For both quay wall types (inland and deep-sea), it can be concluded that various standard principle
solutions are applicable (cross-sections illustrated in Section 6.2). However, it should be noted that the di-
mensions of the substructure (the front wall) and subsequently the superstructure will still show variations.
These dimensions in fact depend strongly on major factors such as local geotechnical conditions, surcharges,
retaining heights and the presence of a relieving platform. Nevertheless, standardization of the front wall is
under following conditions possible:
• By driving the front wall to a deeper layer than it is necessary in first instance (without dredging the
front side of the quay completely). This can be done by constructing all quay walls at equal depth, by

Part D. Final assessment 88
area. This is a decision based on the local depth of the navigation channels and the expected business
activity in the different areas.
• By making a strategic choice for a particular component or a particular area.
The first mentioned will be discussed when answering subquestion 5. Based on a technical and financial
assessment, the following can be concluded regarding to standardization by different areas.
Quay walls used by inland barges in the city port
Front wall:
• Keeping the required nautical depth at NAP − 7m all over the area.
• For retaining heights up to approx. 13 meters and surcharges up to 40kN/m2, applying sheet pile walls
with double Z-profiles.
• For retaining heights from 13 meters and surcharges from 40kN/m2, the combined wall should be
applied, with triple U-profiles.
• The embedded level of a sheet pile wall varies between NAP −16, 5 and NAP −18, 5m. This is in case
of retaining heights up to 13m and surcharges up to 40kN/m2.
• The embedded level of a combined wall varies between NAP −15, 5 and NAP −19, 5m. This is in case
of higher retaining heights and higher surcharges.
Capping beam:
• The level of the upper side of the quay wall is equal to the height of the surface, in the city port this
is equal to NAP + 3, 65m.
• The bottom of the capping beam is preferably located atNAP − 2m (approx. 1m below the LWS),
as in that case steel combined wall is below water level almost all the time, which in turn makes a
cathodic protection work well and there will be no need for coating in the splash zone. As such, less
maintenance will be required. Coatings which are currently in use have a lifespan of only 25 years and
will have to be redone at least twice over the 50 year-lifecycle of the quay wall.
• The width is equal to the summation of the required profile height of the sheet pile wall or the required
diameter of a combined wall and a tolerance of approximately 0,5m on both sides. For a sheet pile wall,
the with is equal to approx. 1,5m and in case of a combined wall 2,5m.
Quay walls used by inland barges in Europoort & Maasvlakte
Front wall:
• Keeping the required nautical depth at NAP − 7m all over the area.
• Combined walls are the most suitable for the retaining heights and surcharges in this area, see graphs
below.
• The embedded level varies between NAP − 27 and NAP − 29m. This level lies deeper than in the city
part due to a intervening layer of clay.

Part D. Final assessment 89
Capping beam:
• The level of the upper side of the quay wall is equal to the height of the surface, in this area this is
equal to NAP + 5m.
• The bottom of the capping beam is preferably located at NAP − 2m (approx. 1m below the LWS).
See for explanation above.
• The width is equal to the summation of the required diameter of a combined wall and a tolerance of
approximately 0,5m on both sides. For a combined wall, the width varies between 2 and 2,5m.
Quay walls used by seagoing vessels in Europoort & Maasvlakte
Front wall:
• In case of surcharges up to 20 kN/m2 a quay wall without a relieving platform (case C) is the most
suitable option, compared to a quay wall with a relieving platform (case D, E, F). In order to make the
quay walls more future-proof (flexible for larger surcharges), a relieving platform is recommended.
• From Figure 11 2 and Figure 11 3, it can be observed that in case of high surcharges a quay wall with
a relieving platform at NAP − 2m and length 15m (case D) becomes less costly compared to the rest
of the cases.
Capping beam/relieving platform:
• The level of the upper side of the quay wall is equal to the height of the surface, in the city port this
is equal to NAP + 5m.
• The bottom of the capping beam and the relieving platform is preferably located at NAP−2m (approx.
1m below the LWS). This is because of the same reasons as given above.
• The width is equal to the summation of the required diameter of a combined wall and a tolerance of
approximately 0,5m. In order to make the quay wall flexible for larger surcharges, a relieving platform
is recommended. The width of the beam of the relieving platform will then vary between 2 and 3,5m.
• In case of high surcharges, a relieving platform with a length of 15m is the most suitable option.
The graphs below present the construction cost of quay walls in Rotterdam (blue dotted line), around the
world (grey dotted line) and the investigated variants in this research (other lines). In the dissertation[34] of
J.G. de Gijt the costs of quay walls in different countries are discussed extensively. It is noticeable that all
lines in Figure 11.1, Figure 11.2 and Figure 11.3 show the same trend. It can also be seen that the influence
of the surcharge on the costs is less compared to the influence of increasing retaining height.

Part D. Final assessment 90
Figure 11.1: Overview costs of all cases, for surcharge 20kN/m2
Figure 11.2: Overview costs of all cases, for surcharges 40and60kN/m2

Part D. Final assessment 91
Figure 11.3: Overview costs of all cases, for surcharge 100kN/m2
From the discussed items above it is strongly advised to standardize on area level and on type of quay wall:
• City port & Maasvlaakte (Inland barges): Capping beam + combined wall
• Quay walls used by seagoing vessels: Relieving platform + combined wall
As can be observed from the graphs above, the impact of increasing surcharges (20, 60and100kN/m2) is very
limited. In case of a relieving platform at NAP − 2m and a length of 15m, the costs will increase with a
maximum of 5,5%, if the surcharge increases 5 times (20kN/m2: 1253 e/m’ and 100kN/m2: 1326 e/m’).
Therefore, it is advisable to standardize on a large surcharge (100kN/m2 or even 150kN/m2). Quay walls
used by inland barges are more sensitive to higher surcharges, compared to quay walls used by seagoing
vessels. In case of a combined wall with a capping beam (Europoort & maasvlate), the costs will increase
with a maximum 25%, if the surcharge increases 5 times (20kN/m2: 1062 e/m’ and 100kN/m2: 1405 e/m’).
Answer to question 5.
From the financial assessment, it appears that the costs of the front wall are the main contribution to the
construction costs. As the design of the front wall is strongly dependent on environmental and functional
requirements, this makes standardization of it more difficult. By driving the front wall to a deeper layer
(without dredging it completely) than it is necessary for the first client, standardization is possible. This
leads to higher initial investment but results in a quay wall which is significantly more future proof. It should
be noted that dredging the front side of the quay wall at a later stage, is less expensive than replacing the
existing quay wall. From the graphs above can be derived by which percentage the construction cost increases
in the case, the wall will be installed deeper. For 1 meter deeper, the following rates apply:

Part D. Final assessment 92
Table 11.1: Extra investment costs
Q=100 kN/m2 Percentage of increase at in-creasing h [%]
Inland barges, area 1 Approx. 5%Inland barges, area 2&3 Approx. 10%Seagoing vessels, area 2&3 Approx. 6%
11.4 Reflection
Standardization of quay walls is a broad topic and can be applied in various ways. As mentioned before,
standardization can be defined as the strategy of development and implementation of designs to achieve
the required levels of interchangeability and flexibility in use. In this research different standard principle
solutions for both inland and deep-sea quay walls have been developed. These solutions can be characterized
as concept design which have to be further elaborated into a definitive design.
The history of the port of Rotterdam can be analysed from the quay walls that were built in the course
of the centuries, many different types of quay walls have been built. When considering the quay walls
constructed in the recent years in the port of Rotterdam, it can be observed that they have been evolving to
two standards: the anchored combined walls and quay walls with a relieving structure. When heavy loads
and large retaining height are involved, a combined steel quay wall with a concrete relieving platform is
constructed and for inland barges a anchored combined wall is applied. In case of a relieving platform, the
floor is usually located somewhere between NAP + 0m and NAP − 3m with a length between 15 and 25m.
This rather conventional cross-section is the most economical one. This is also reflected in the results of this
research, see graphs above. Figure 11.4 presents the quay walls constructed in Rotterdam in the last few
years.
On Maasvlakte II and on the south side of Maasvlakte I, new deep-sea quay walls need to be constructed.
When observing what’s been built in the port of Rotterdam in the past few years, combined with the results
of this study, it is recommended to keep the design depth at NAP − 23m all over the area.

Part D. Final assessment 93
Figure 11.4: Amazonehaven southside (topleft), quay Brammen terminal (top right), Euromax (bottom
left), Amazonehaven EMO5 (bottom right)
A reflection on this research leads to the following recommendations for further research.
Calculation programme
• D-sheet is a powerful tool for calculating simple sheet pile walls; In case of non-uniform loads (for
example dry bulk) and relieving platforms, the results of the calculations are not entirely reliable. In
cases where a relieving platform is a component of the quay wall, it is advisable to run the models also
with PLAXIS. This also applies when a quay wall needs to be checked for dry bulk.
• Not all versions of the program give the same findings. It is strongly recommended to use the latest
version. The last version isn’t necessarily the best option. The method of modelling of different
parameters may influence the outcome. Certain tricks, such as modelling of non-uniform loads and
relieving platforms, which are ingrained, can cause strange results.
Technical part
• The soil profiles which were investigated, are assumed to be representative for the entire area. It is
advisable to carry out the investigation for some specific locations within the areas and compare the
obtained results.

Part D. Final assessment 94
• In order to compare the influence of the soil conditions, the investigated retaining heights should to be
kept equal in both areas.
• The dimensions of the combined walls are, in case of deep-sea quay walls, remarkably large. It is
recommended to check the different tubular piles also on buckling and driveability.
• The non-uniform loads are in D-sheet, modelled directly behind the quay wall. This may be the cause
of larger tube dimensions. In reality this is of course not the case, therefore it is advisable to model
the surcharge at a distance, for example 5m, and observe the effect.
• In this research, the anchors are simulated as an infinite stiff spring. This assumption will result in an
upper limit for the anchor force. This is a conservative assumption. It is recommended to investigate
the influence of the anchor stiffness.
Financial part
• There will always be some limitation in determining of the construction costs such as the feasibility
(required installation equipment) and the production (spirally welded seam or a longitudinally welded
seam) which may affect the costs. This investigation has resulted, in some cases, in remarkably large
tube dimensions. The aforementioned restrictions in combination with the large dimensions may result
in kinks in the cost graphs (no smooth lines). For example, if the tubes are too large, then there is
other installation equipment required and spirally welded seams can no longer be applied. This will
be reflected in the total costs. However, the construction costs in this research are expressed in costs
per unit (e/unit), see Table 10.2. The impact of production is included but it is recommended to
investigate the influence of drivability on the costs.
• To investigate the influence of anchors on the cost, it is advisable to consider different types of anchors.
Here is namely just the MV-pile considered.
• During the financial assessment, it is recommended to take into account the excavation and refill costs,
but also the dewatering costs.

Bibliography
[1] JG de Gijt and ML Broeken. Quay Walls, Second edition. SBRCURnet Publication 211E, 2014.
[2] Gemeentewerken Rotterdam and Ingenieursbureau Havenwerken. Diepwater terminal amazonehaven.
1989.
[3] Gemeentewerken Rotterdam. Variantenstudie euromax terminal. 2002.
[4] Port of Rotterdam Authority. Port development, 2014. URL http://www.portofrotterdam.com/en/
Port/port-maps/Pages/branches.aspx.
[5] JW Zwakhals, P Taneja, and H Ligteringen. Quay wall design for an uncertain future. Eighth interna-
tional conforence on coastal and port engineering in developing countries, 2012.
[6] P Taneja. The flexible port, 2013.
[7] Port of Rotterdam Authority. Havenvisie 2030. Port Compass, 2011.
[8] Port of Rotterdam Authority. Progress report port vision 2030. Port Compass, 2014.
[9] Port of Rotterdam Authority. Investeren in de toekomst. Jaarverslag 2013, 2013.
[10] The Robert S. Strauss Center. The tanker market, 2008. URL https://strausscenter.org/hormuz/
the-tanker-market.html.
[11] N Wijnolst, M Scholtes, and F Waals. Malacca-max the ultimate container carrier. 1999.
[Connector] Maritime Connector. Ship sizes. URL http://maritime-connector.com/wiki/ship-sizes/.
[12] MAN Diesel and Turbo. Propulsion trends in tankers. 2009.
[13] Handysize re-vamp: the next move in bulk carriers? The Naval Architect, (1), 2006.
[14] MAN Diesel and Turbo. Propulsion trends in container vessels. 2009.
[15] J Grabe. Ports dor container ships of future generations. International Conference, 2014.
[16] Various. Focus on ultra large container ships. Container ship update, (1), 2013.
[17] R Almeida. Bigger containerships means bigger gantry cranes, 2013. URL http://gcaptain.com/
bigger-containerships-gantry-cranes/.
[18] JG de Gijt. Structures in hydralic engineering. Delft University of Technology, 2004.
[19] G Tassey. Standardization in technology-based markets. Research Policy, (29), 2000.
95

References 96
[20] JW Bagby. The Key Role of Standardization on Technology Develoment, Transfer, Diffusion, and
Management. 2010.
[21] ASTM International. Mission statement, 2009. URL http://www.astm.org/ABOUT/
mission-statement.html.
[22] Y Sered and Y Reich. Standardization and modularization driven by minimizing overall process effort.
Computing-Aided Design, (38), 2005.
[23] Dresden and Karlsruhe. Economis benefits of standardization. 2000.
[24] P Hatto. Standards and standardisation. 2013.
[25] DJ Vanier. Why industry needs asset management tools. Computing in Civil Engineering, 2001.
[26] HSC Parera, N Nagarur, and MT Tabucanon. Component part standardization: A way to reduce the
life-cycle costs of products. International Journal of Production Economics, (60,61), 1999.
[27] Various. Manual Hydraulic Structures. Delft University of Technology, 2011.
[28] J Grabe. Sheet piling handbook design. 2008.
[29] CUR Bouw&Infra. Damwandconstructies. SBRCURnet Publication CUR166, 2012.
[30] Nederlands Normalisatie-instituut. Nen-en 1997, eurocode 7: Geotechnical design. 2012.
[31] Rijkswaterstaat. Hoek van holland slotgemiddelden 1991.0. -.
[32] J Grabe. Empfehlungen des arbeitsaussschusses ’ufereinfassungen’: Hafen und wasserstrassen eau 2012.
2012.
[33] ArcelorMittal. Steel foundation solutions. 2014.
[34] JG de Gijt. A history of quay walls; techniques, types, costs and future, 2010.


![Applied Ocean Research - yukselproje.com.tr€¦ · on block type quay walls at Derince Port in ˙Izmit (Yüksel et al. [3]). The design of block type quay walls should be performed](https://img.pdfslide.net/doc/110x75/60a26af78110e2658e7d2bb0/applied-ocean-research-on-block-type-quay-walls-at-derince-port-in-izmit-yksel.jpg)


![Risk-based target reliability indices for quay walls · In the Netherlands, the design handbooks for quay walls [29] and sheet pile walls [42] further elaborated the recommendations](https://img.pdfslide.net/doc/110x75/60d281abe920fe17973fd548/risk-based-target-reliability-indices-for-quay-walls-in-the-netherlands-the-design.jpg)