Embed Size (px)
Citation preview
The Federal Budget and Tax Policy
Lecture by Robert M. Coen
Emeritus Professor of Economics
Northwestern University
September 29, 2009
120
140
160
180
200
220
240
260
55 60 65 70 75 80 85 90 95 00 05
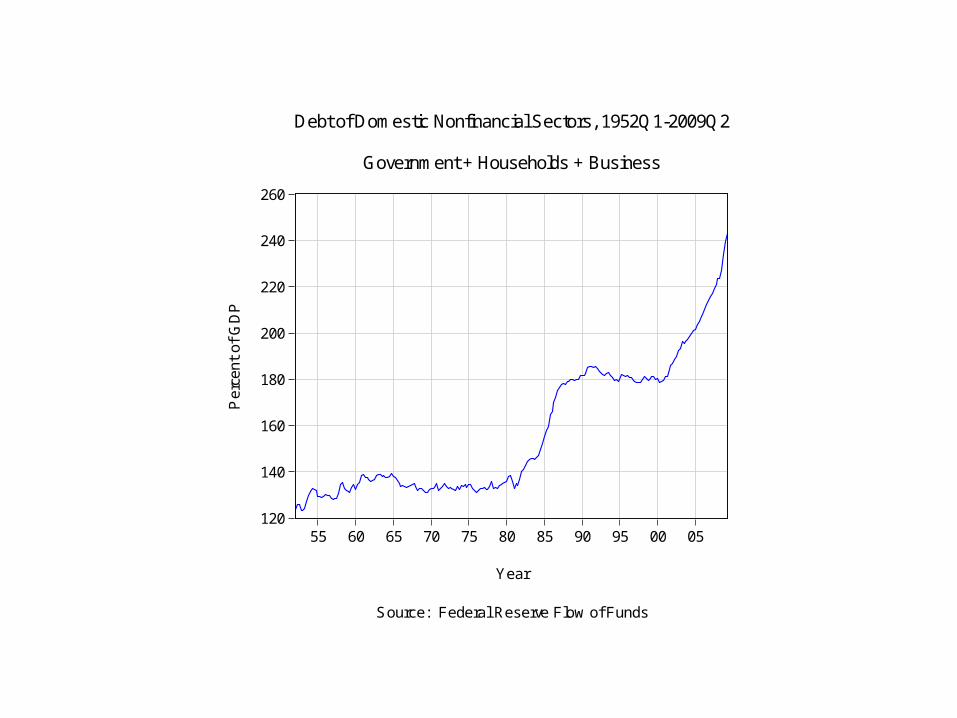
Debt of Domestic Nonfinancial Sectors, 1952Q1-2009Q2
Government + Households + Business
Per
cent
of
GD
P
Year
Source: Federal Reserve Flow of Funds
20
30
40
50
60
70
55 60 65 70 75 80 85 90 95 00 05
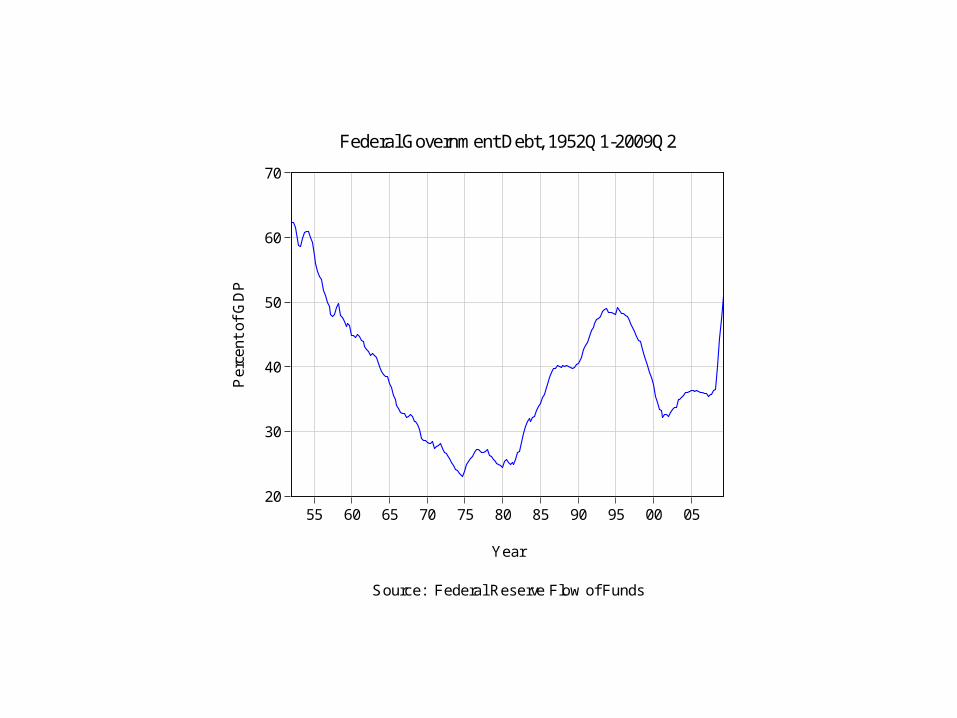
Federal Government Debt, 1952Q1-2009Q2
Per
cent
of
GD
P
Year
Source: Federal Reserve Flow of Funds
6
8
10
12
14
16
18
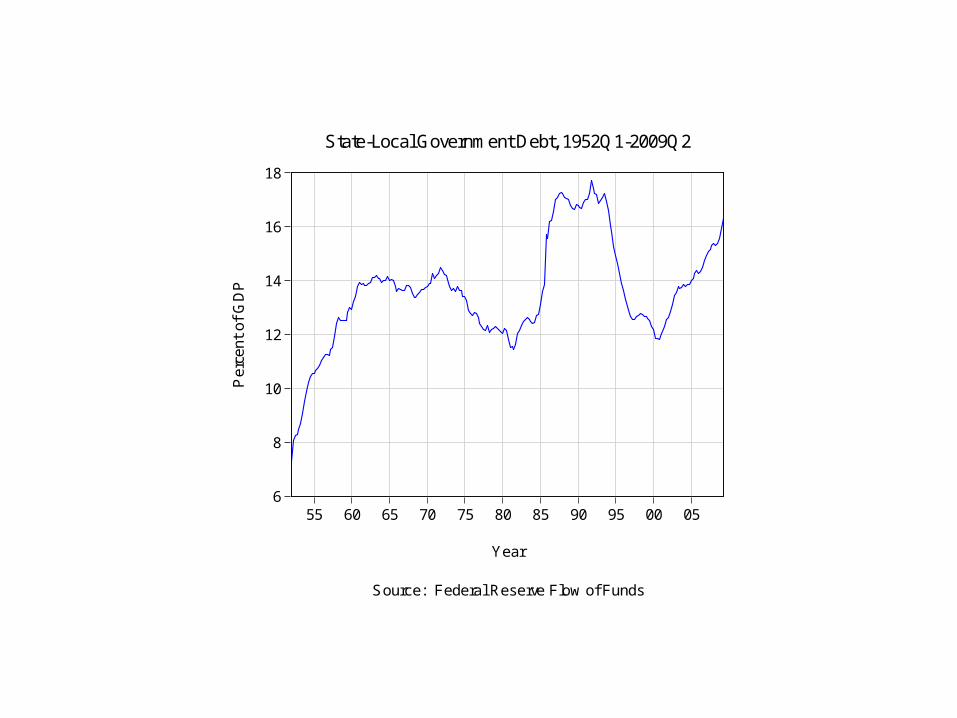
55 60 65 70 75 80 85 90 95 00 05
State-Local Government Debt, 1952Q1-2009Q2
Per
cent
of
GD
P
Year
Source: Federal Reserve Flow of Funds
20
30
40
50
60
70
80
90
100
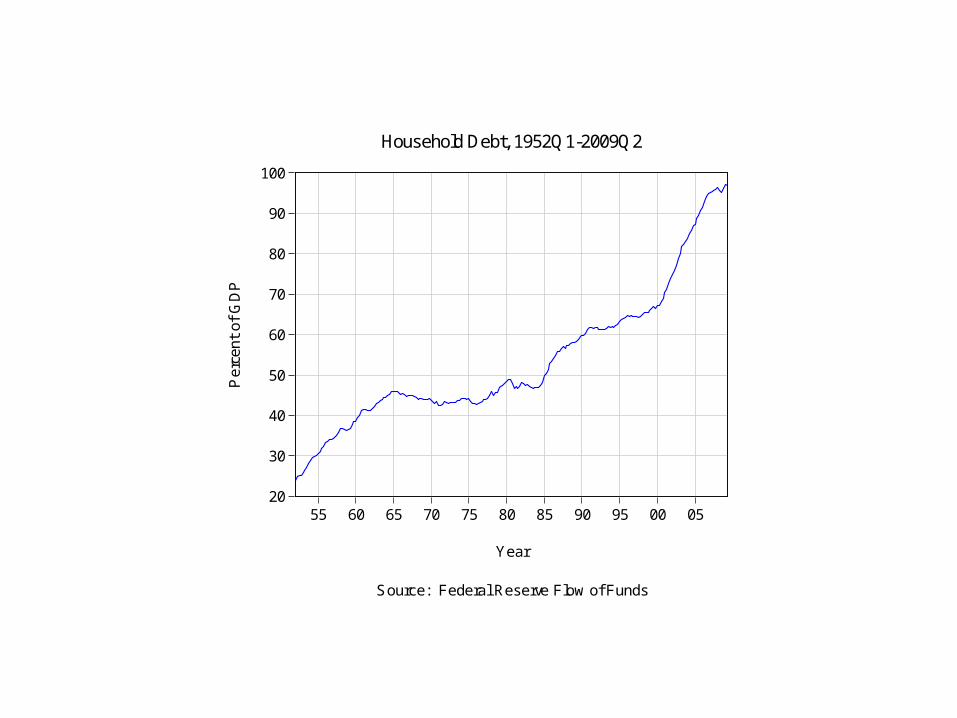
55 60 65 70 75 80 85 90 95 00 05
Household Debt, 1952Q1-2009Q2
Per
cent
of
GD
P
Year
Source: Federal Reserve Flow of Funds
20
30
40
50
60
70
80
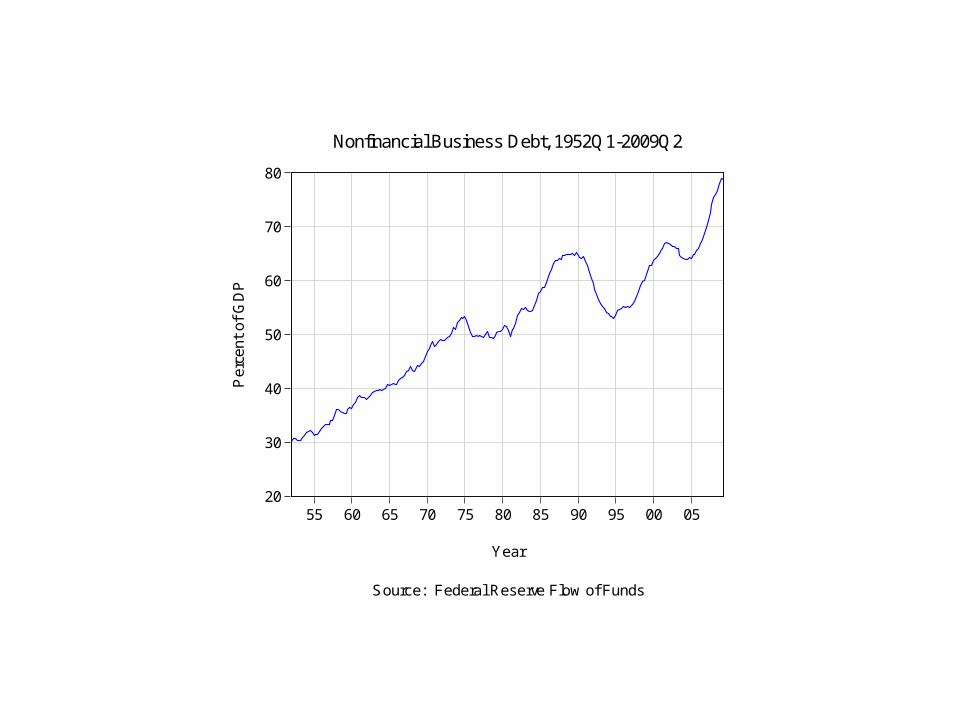
55 60 65 70 75 80 85 90 95 00 05
Nonfinancial Business Debt, 1952Q1-2009Q2
Per
cent
of
GD
P
Year
Source: Federal Reserve Flow of Funds
-10
-8
-6
-4
-2
0
2
4
6
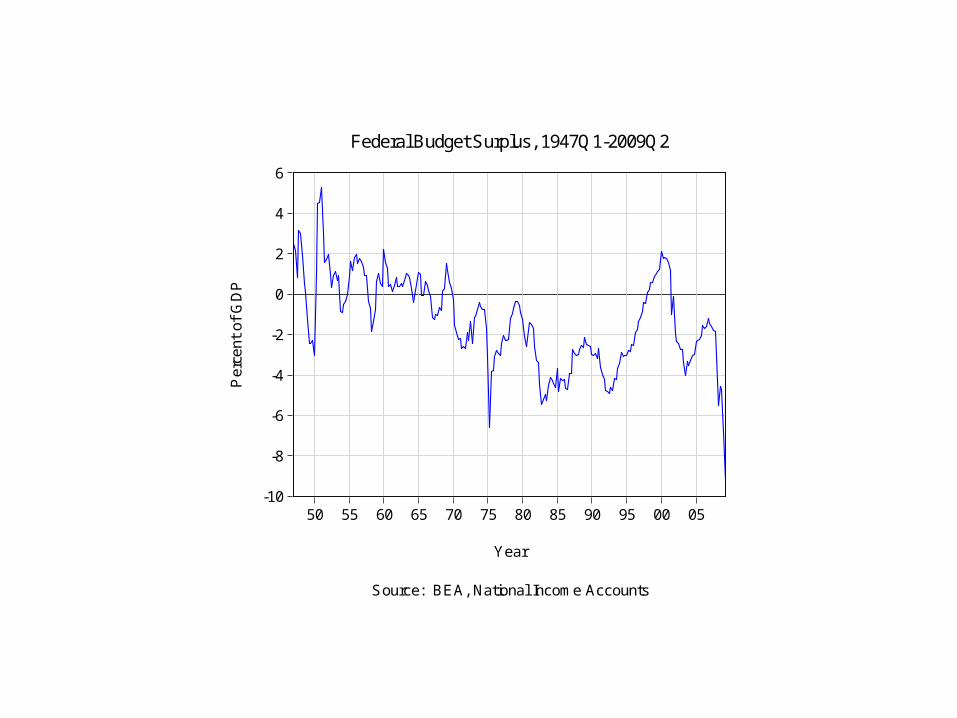
50 55 60 65 70 75 80 85 90 95 00 05
Federal Budget Surplus, 1947Q1-2009Q2
Per
cent
of
GD
P
Year
Source: BEA, National Income Accounts
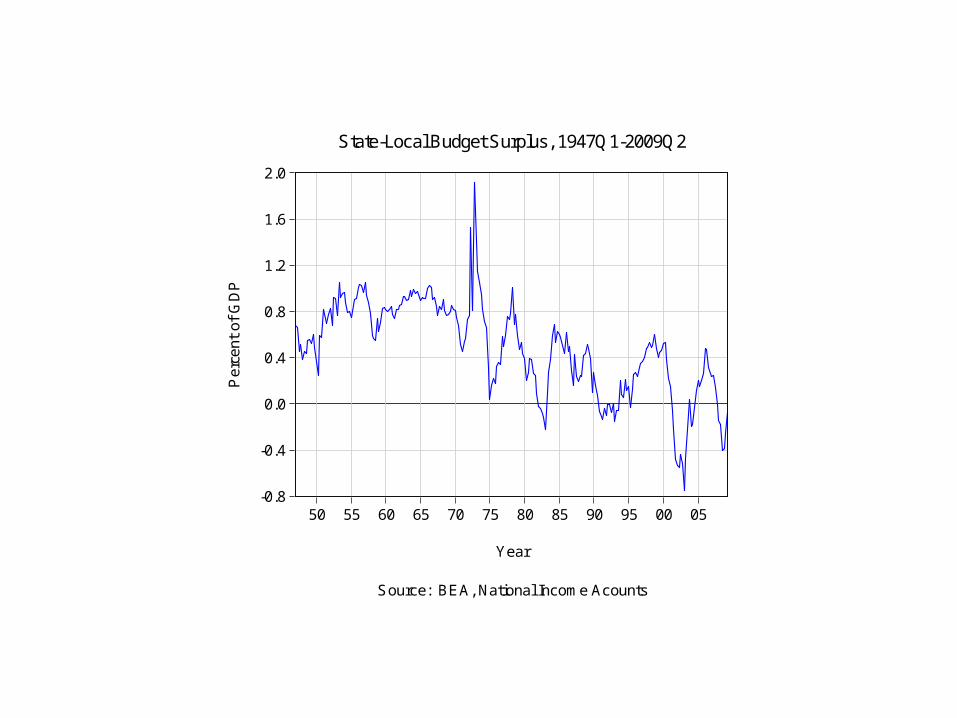
-0.8
-0.4
0.0
0.4
0.8
1.2
1.6
2.0
50 55 60 65 70 75 80 85 90 95 00 05
State-Local Budget Surplus, 1947Q1-2009Q2
Per
cent
of
GD
P
Year
Source: BEA, National Income Acounts
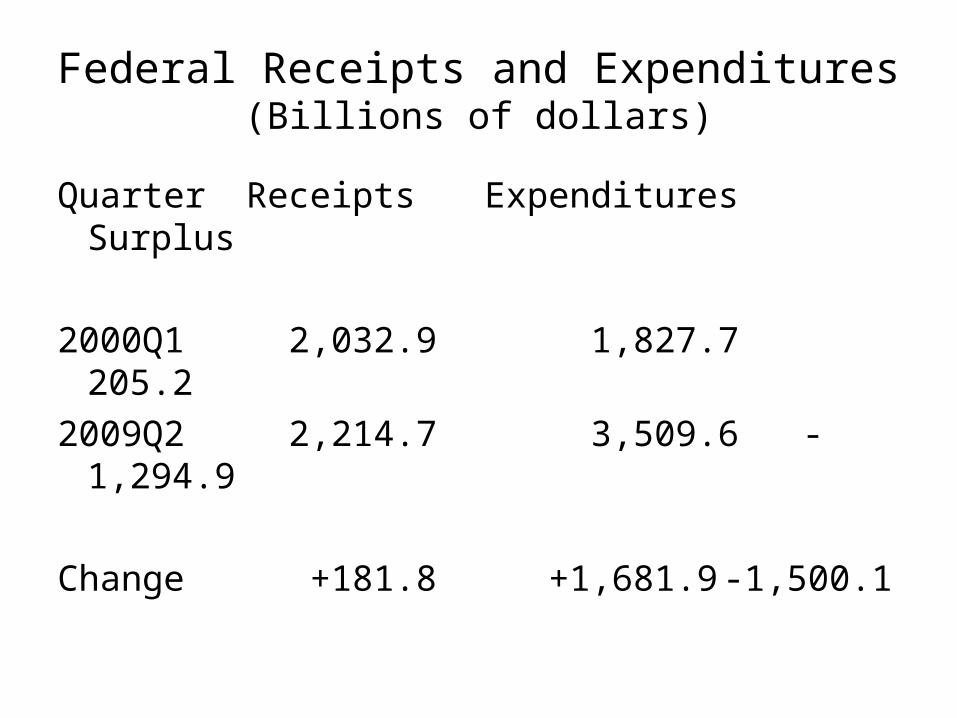
Federal Receipts and Expenditures(Billions of dollars)
Quarter Receipts Expenditures Surplus
2000Q1 2,032.9 1,827.7 205.2
2009Q2 2,214.7 3,509.6 -1,294.9
Change +181.8 +1,681.9 -1,500.1
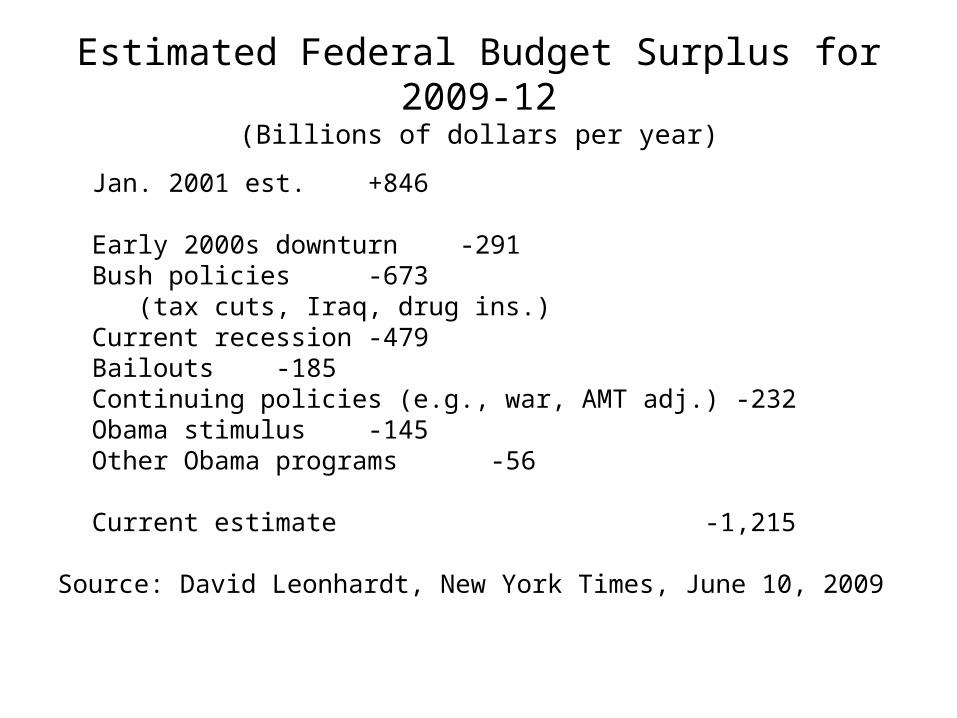
Estimated Federal Budget Surplus for 2009-12(Billions of dollars per year)
Jan. 2001 est. +846
Early 2000s downturn -291Bush policies -673
(tax cuts, Iraq, drug ins.)Current recession -479Bailouts -185Continuing policies (e.g., war, AMT adj.) -232Obama stimulus -145Other Obama programs -56
Current estimate -1,215
Source: David Leonhardt, New York Times, June 10, 2009
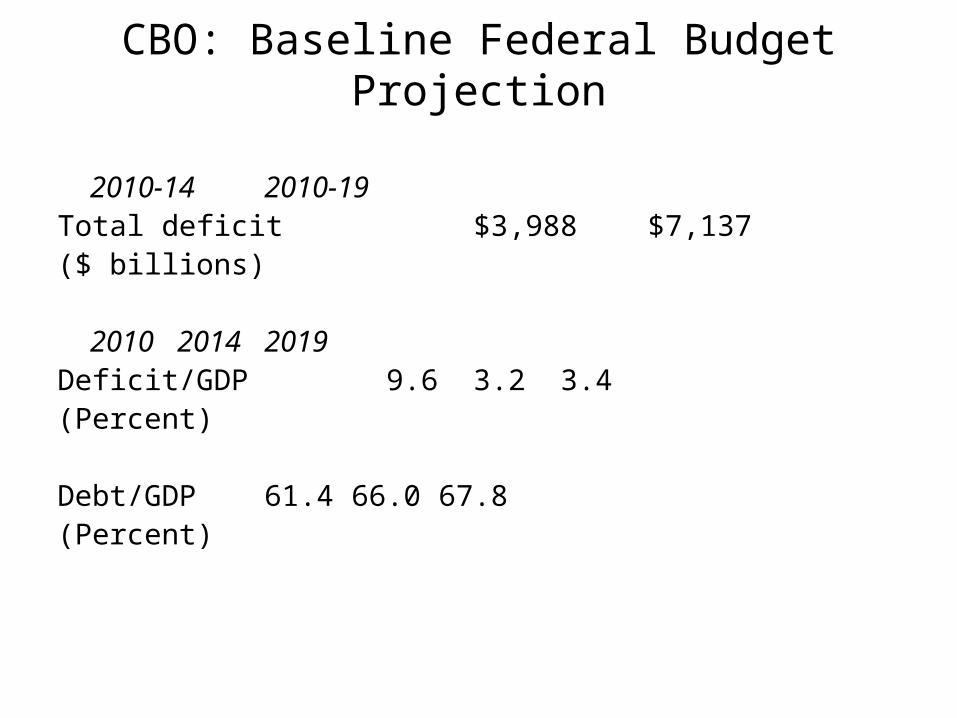
CBO: Baseline Federal Budget Projection
2010-14 2010-19Total deficit $3,988 $7,137($ billions)
2010 2014 2019Deficit/GDP 9.6 3.2 3.4(Percent)
Debt/GDP 61.4 66.0 67.8(Percent)
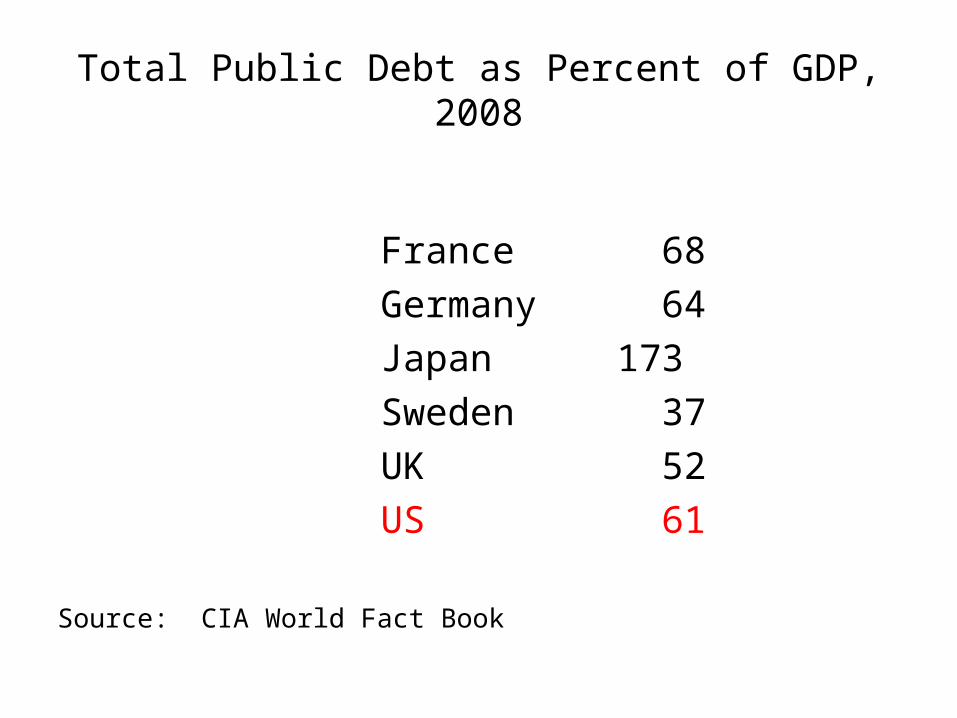
Total Public Debt as Percent of GDP, 2008
France 68
Germany 64
Japan 173
Sweden 37
UK 52
US 61
Source: CIA World Fact Book
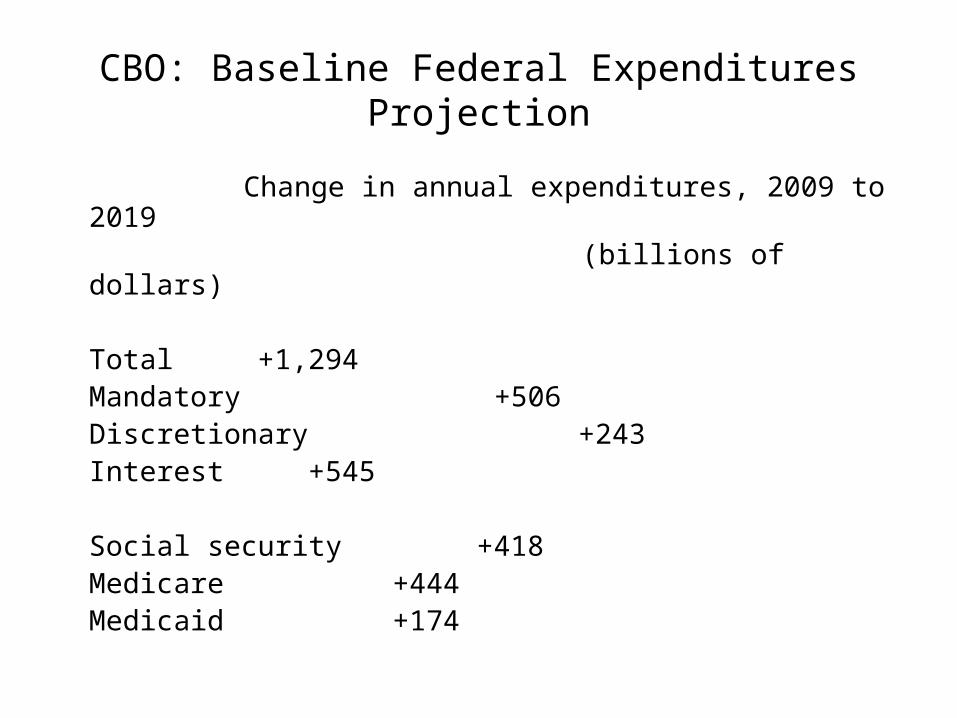
CBO: Baseline Federal Expenditures Projection
Change in annual expenditures, 2009 to 2019 (billions of dollars)
Total +1,294Mandatory +506Discretionary +243Interest +545
Social security +418Medicare +444Medicaid +174
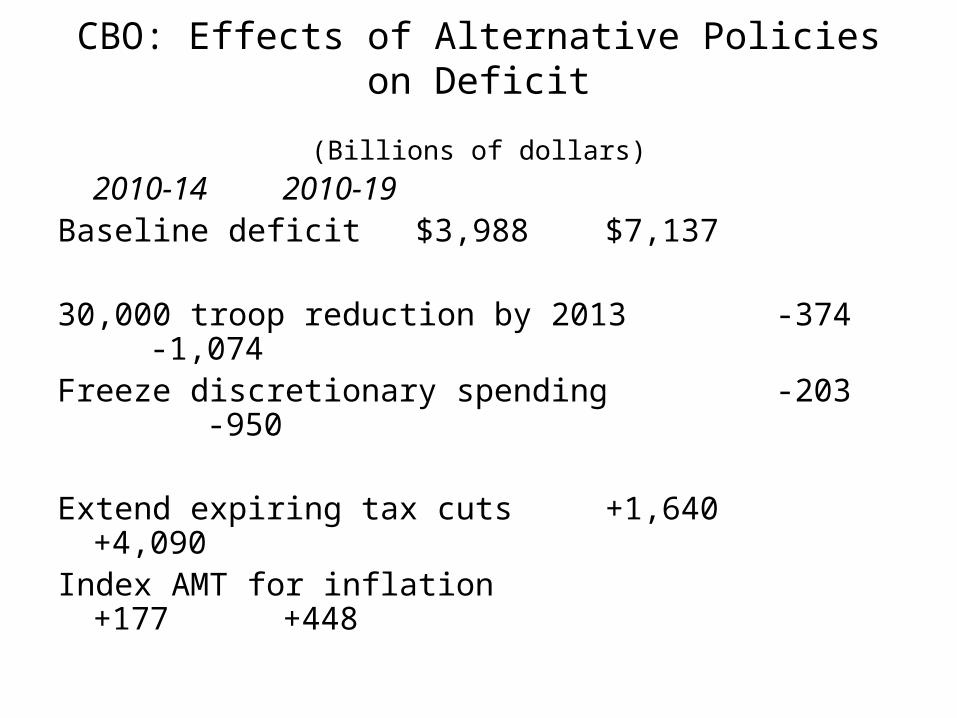
CBO: Effects of Alternative Policies on Deficit
(Billions of dollars)
2010-14 2010-19Baseline deficit $3,988 $7,137
30,000 troop reduction by 2013 -374 -1,074Freeze discretionary spending -203 -950
Extend expiring tax cuts +1,640 +4,090Index AMT for inflation +177 +448
2
4
6
8
10
12
14
16
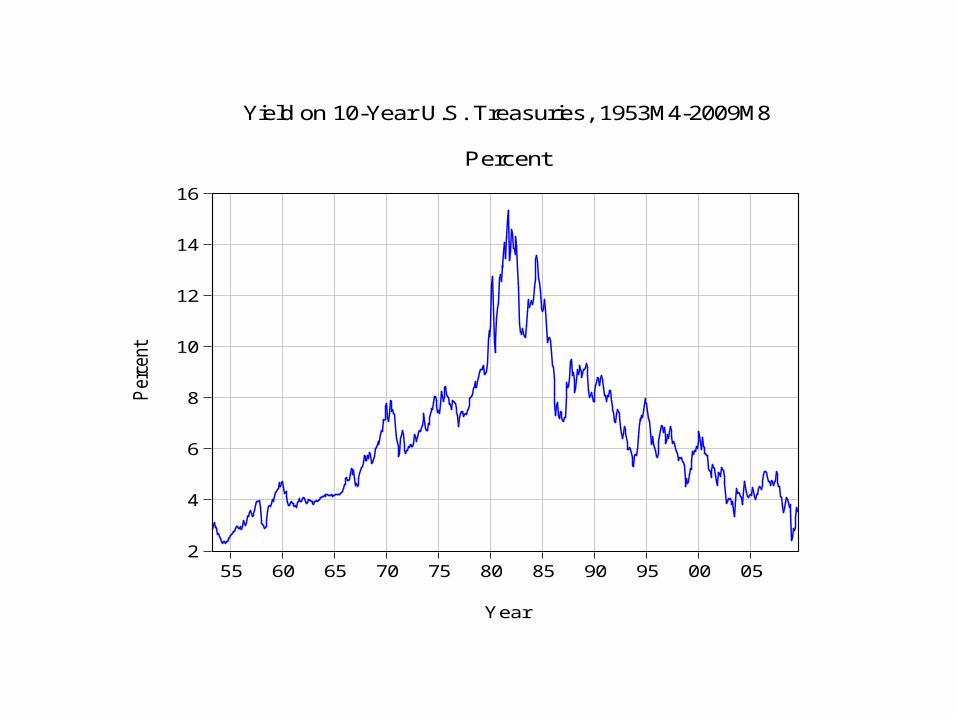
55 60 65 70 75 80 85 90 95 00 05
Yield on 10-Year U.S. Treasuries, 1953M4-2009M8
PercentP
erce
nt
Year
5
10
15
20
25
30
35
40
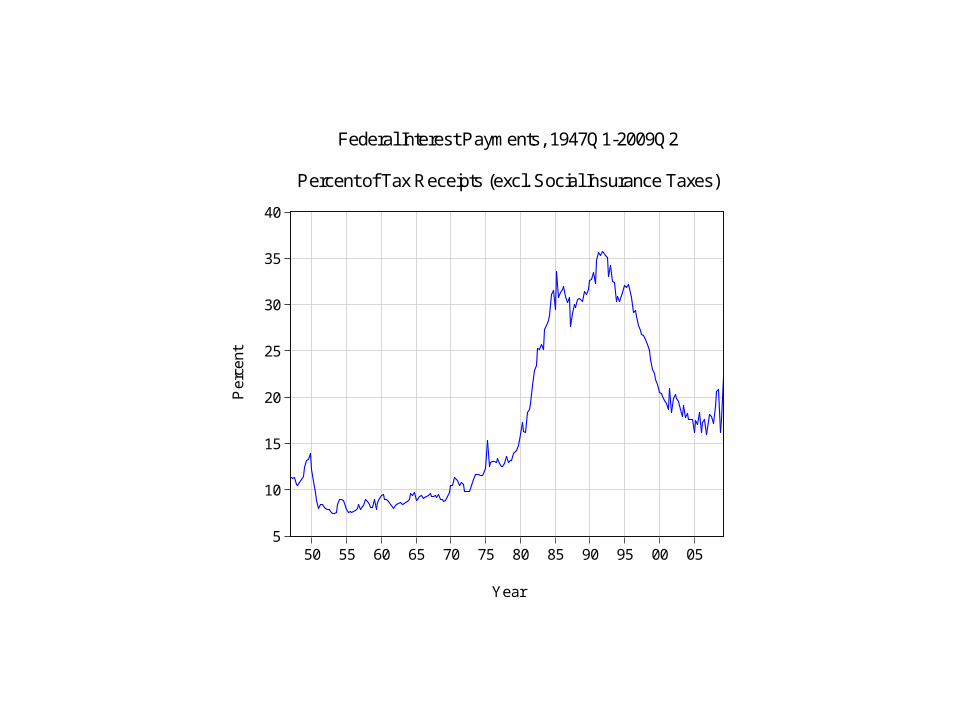
50 55 60 65 70 75 80 85 90 95 00 05
Federal Interest Payments, 1947Q1-2009Q2
Percent of Tax Receipts (excl. Social Insurance Taxes)
Per
cent
Year
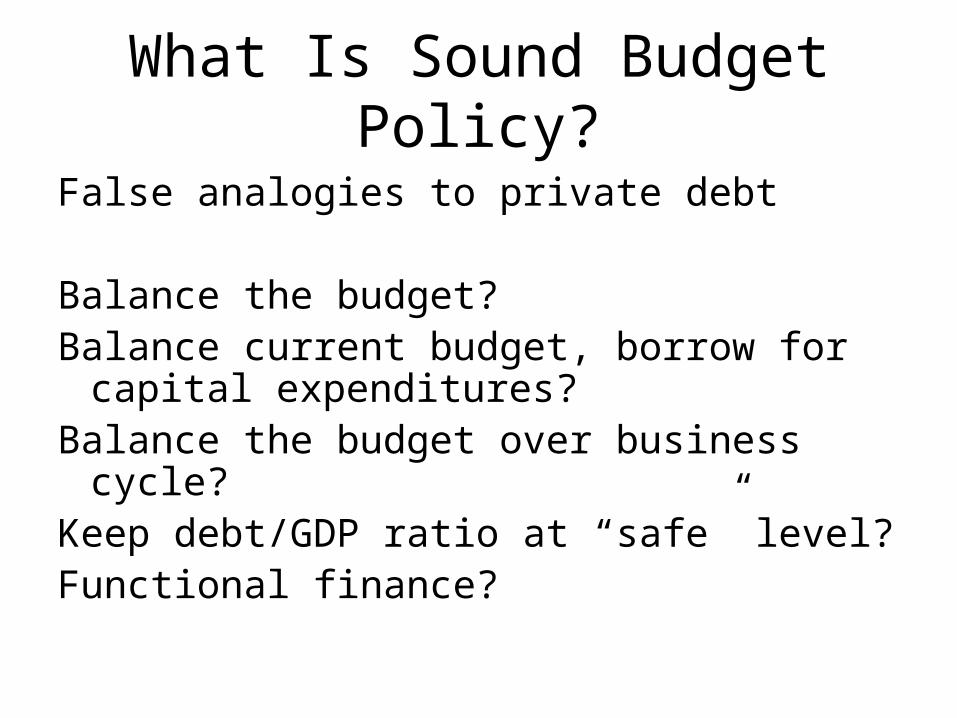
What Is Sound Budget Policy?
False analogies to private debt
Balance the budget?Balance current budget, borrow for capital
expenditures?Balance the budget over business cycle?Keep debt/GDP ratio at “safe” level?Functional finance?
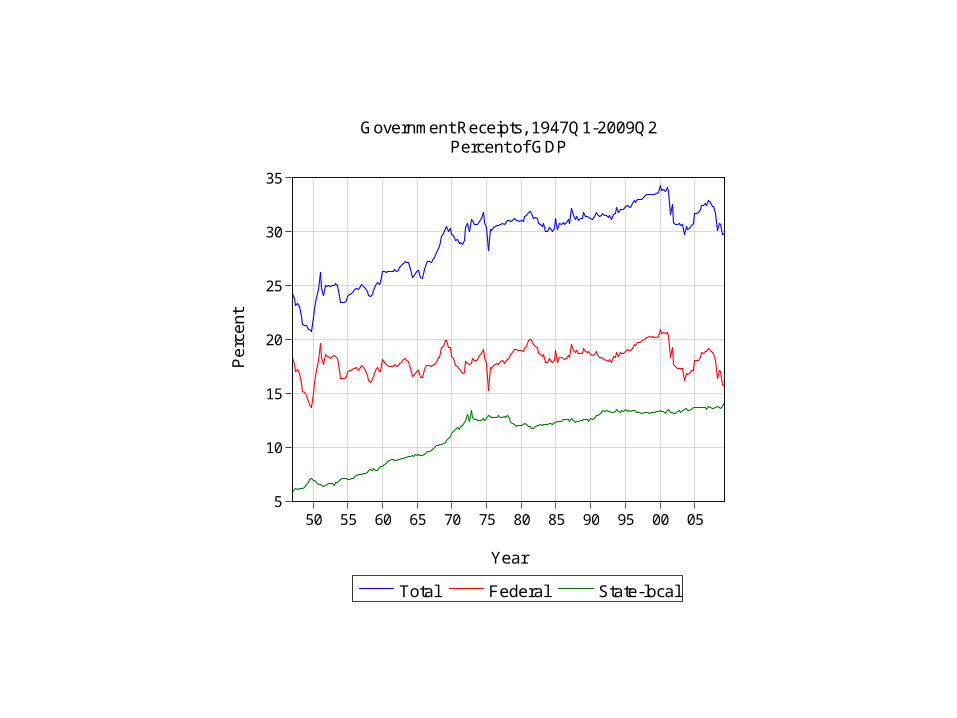
5
10
15
20
25
30
35
50 55 60 65 70 75 80 85 90 95 00 05
Total Federal State-local
Government Receipts, 1947Q1-2009Q2Percent of GDP
Pe
rce
nt
Year
6
7
8
9
10
11
12
13
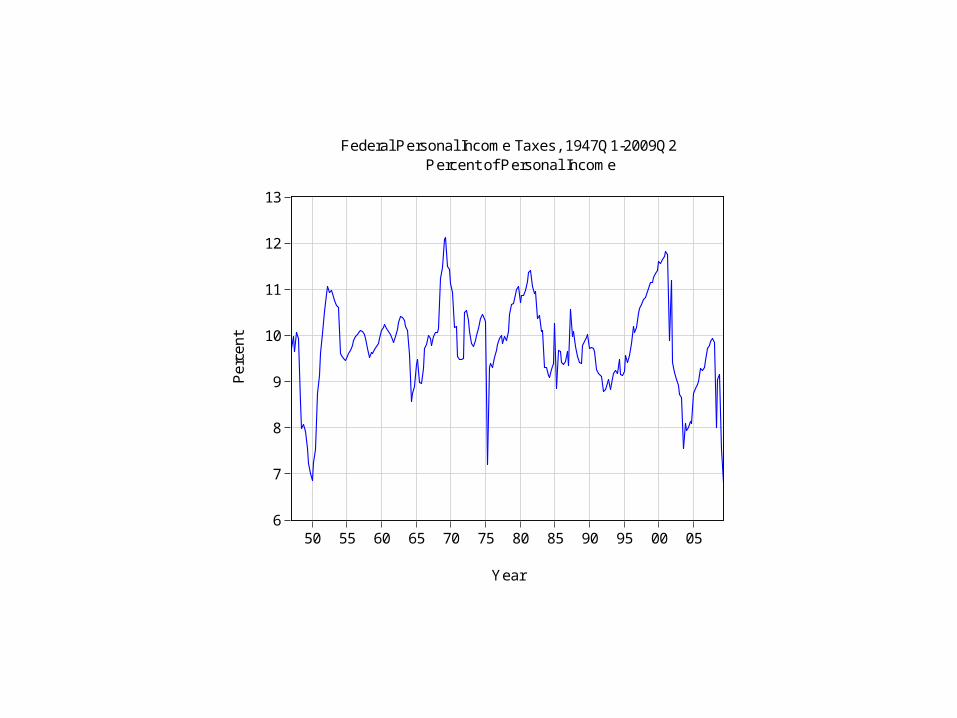
50 55 60 65 70 75 80 85 90 95 00 05
Federal Personal Income Taxes, 1947Q1-2009Q2 Percent of Personal Income
Per
cen
t
Year
10
20
30
40
50
60
70
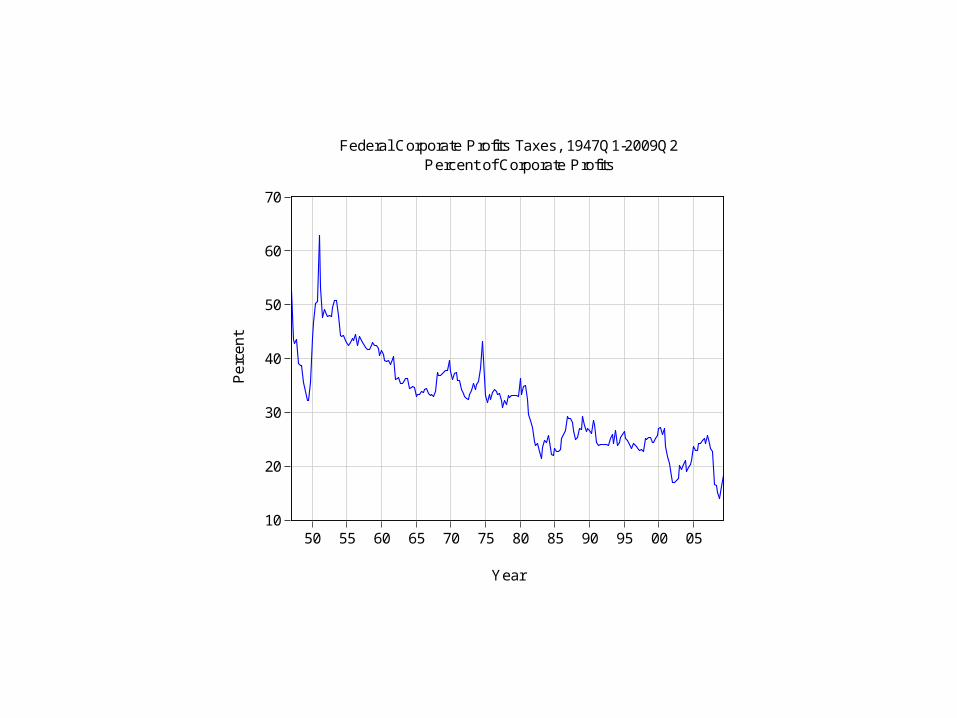
50 55 60 65 70 75 80 85 90 95 00 05
Federal Corporate Profits Taxes, 1947Q1-2009Q2 Percent of Corporate Profits
Per
cen
t
Year
0.5
1.0
1.5
2.0
2.5
3.0
3.5
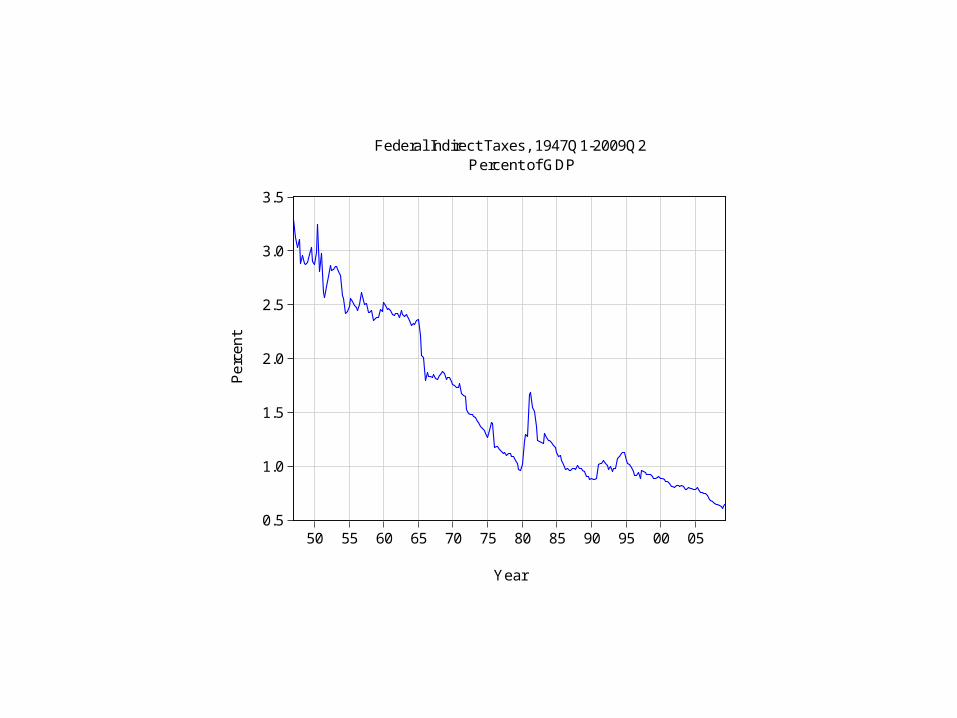
50 55 60 65 70 75 80 85 90 95 00 05
Federal Indirect Taxes, 1947Q1-2009Q2 Percent of GDP
Per
cen
t
Year
1
2
3
4
5
6
7
8
9
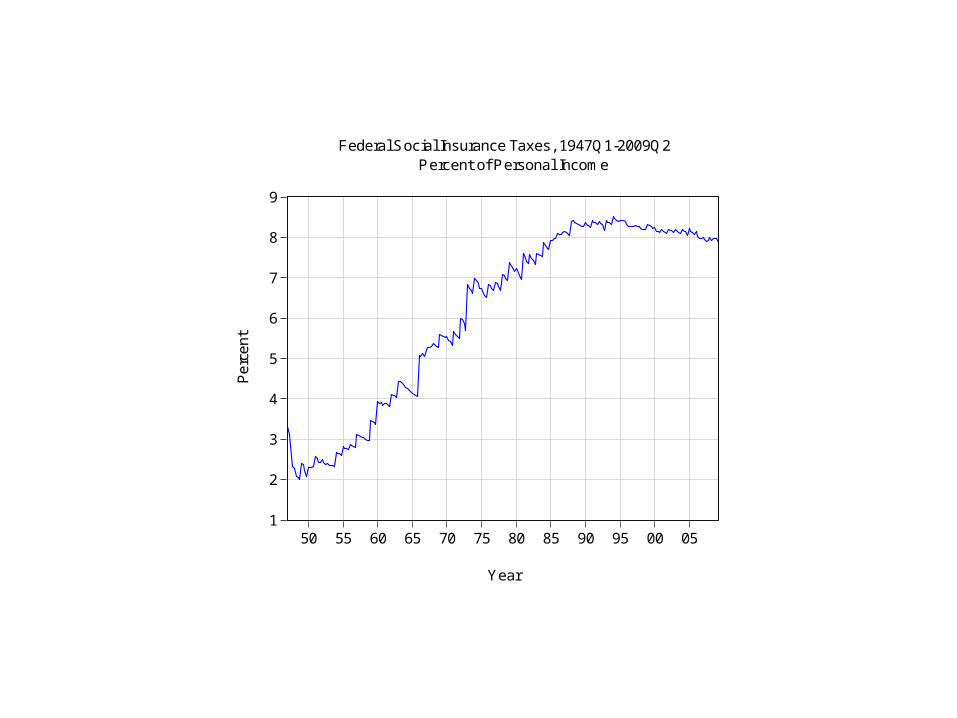
50 55 60 65 70 75 80 85 90 95 00 05
Federal Social Insurance Taxes, 1947Q1-2009Q2 Percent of Personal Income
Per
cen
t
Year
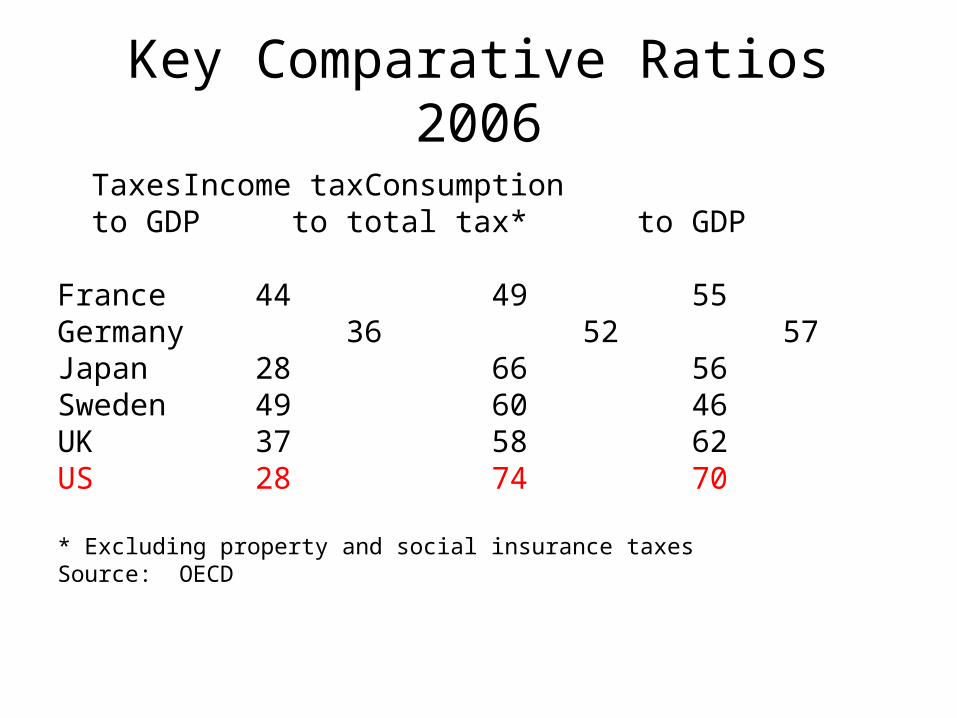
Key Comparative Ratios2006
Taxes Income tax Consumptionto GDP to total tax* to GDP
France 44 49 55Germany 36 52 57Japan 28 66 56Sweden 49 60 46UK 37 58 62US 28 74 70
* Excluding property and social insurance taxesSource: OECD
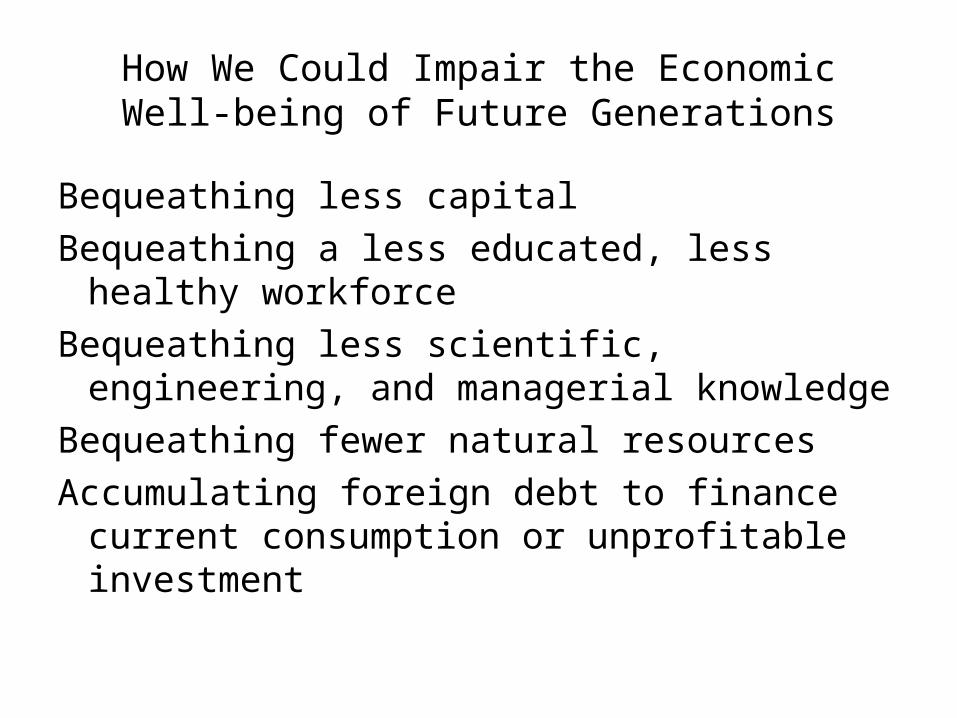
How We Could Impair the Economic Well-being of Future Generations
Bequeathing less capital
Bequeathing a less educated, less healthy workforce
Bequeathing less scientific, engineering, and managerial knowledge
Bequeathing fewer natural resources
Accumulating foreign debt to finance current consumption or unprofitable investment