Embed Size (px)
Citation preview
The Federal Design Dilemma: Congressional Intergovernmental Delegation
by
Pamela J. McCann
A dissertation submitted in partial fulfillment
of the requirements for the degree of
Doctor of Philosophy
(Political Science and Health Services Organization and Policy)
in the University of Michigan
2011
Doctoral Committee:
Professor Charles R. Shipan, Co-Chair
Assistant Professor Scott E. L. Greer, Co-Chair
Professor Elisabeth Gerber
Professor Paula M. Lantz

© Pamela J. McCann
2011

ii
Dedicated To Those Who Left Us Way Too Soon
iii
Acknowledgements
As I sit here contemplating how to acknowledge the many people who contributed
significantly to my dissertation, I am struck by how overwhelming the task seems. In the
past few years, since the beginning of this project, the sheer number of important
contributors to my work is staggering. So, as typical when faced with a challenge, I
decided a definition was in order. Dictionary.com provides the following, ―acknowledge:
to accept or admit the existence or truth of.‖ The truth of the writing of this project is that
it took many years, multiple undergraduates (thanks to the Undergraduate Research
Opportunity Program), innumerable meetings with various faculty members, and a few
gray hairs (not mine, of course). A large and diverse support network is what made it
possible. This is a heartfelt thank you in acceptance of how my dissertation would not
exist, nor my sanity, had it not been for you.
First, my colleagues in public health have always provided me with space. Not
just my physical office, where I have spent many late nights and weekends, but the
opportunity to explore the questions that made me most curious. Questions that most
health services researchers would not touch with a ten-foot pole. Peter D. Jacobson‘s
feedback and encouragement, my fellow HSOP (Health Services Organization and
Policy) peers‘ suggestions for improvement, Nancy Baum‘s wisdom about how to wrap
my head around the concepts of authority and discretion, as well as deal with life, Jenifer
Martin for aid in designing and contacts for conducting my fieldwork, Mindy Niehaus
iv
Fukuda and Connie Rockman for helping keep the marbles in my head, Brady West at the
Center for Consulting and Statistical Research and Danielle Lavaque-Manty at the
Sweetland Writing Center for skilled assistance. Paula Lantz extended expertise and
unending support as a committee member and mentor. Finally, I would like to offer a
sincere thank you to Scott E. L. Greer, my public health co-chair. Scott provided much
needed support while I dug into the guts of American politics and helped me not lose
sight of where I began.
Second, I would like to thank those from my political science world. Jenna
Bednar, Scott Page, Barry Rabe, Rick Hall, Rob Mickey, Rocio Titiunik, Ken Kollman,
Ann Lin, and the participants of the 2009 EITM workshop for providing the foundation
to pursue questions in political science, methodological help, and serving as sounding
boards for my ideas and working drafts. I also greatly appreciated the time and
thoughtful feedback provided by George Krause at the beginning, in the middle, and at
end of this project, Liz Gerber‘s sound and measured advice on everything spanning
career, family, estimation strategies, and life, and Skip Lupia‘s time and energy helping
me conceptualize many different models of legislators intergovernmental behavior. In
addition, Yanna Krupnikov, Adam Levine, and Robin Phinney provided concrete
suggestions on ways to make progress when the challenges seemed insurmountable.
Papia Debroy went above and beyond the call of friendship and provided the constructive
criticism and support needed at all stages of the project.
I would also like to thank my co-chair in political science, Chuck Shipan. At our
first meeting, he inquired whether I was certain I wanted him as an advisor, since he had
just arrived as faculty at Michigan. There was not a moment of hesitation when I said,

v
―yes‖ and the ensuing years have confirmed that decision. Chuck has read many, many
drafts of the various chapters in this dissertation. And, in his kind yet astute way has
unceasingly provided advice, challenges, well-placed commas, and a path forward. I owe
you more gratitude than I can express.
Finally, I would like to thank my friends and family. Tom Murray and Caroline
Kaganov and the staff at Conor O‘Neills have allowed me to work in the back corner
table. My siblings and parents listened, fed me, babysat my children, and made my life
delightful, for the most part. My husband, Shane, and children, Mathew, Brendan, and
Sidney, offered hugs and allowed me to neglect them on occasion—both were necessary,
but only the first was wanted. There is not a moment when I fail to realize how very
fortunate I am to have you all.
vi
Table of Contents
Dedication ........................................................................................................................... ii
Acknowledgements ............................................................................................................ iii
List of Figures ..................................................................................................................... x
List of Tables ..................................................................................................................... xi
Chapter 1: ............................................................................................................................ 1
The Federal Design Dilemma: ............................................................................................ 1
The Puzzle of Intergovernmental Delegation ..................................................................... 1
INTRODUCTION .......................................................................................................... 1
IMPORTANCE............................................................................................................... 4
MOTIVATING LITERATURE ..................................................................................... 8
Centralization versus Decentralization ....................................................................... 9
Policy Actors‘ Incentives .......................................................................................... 11
Delegation ................................................................................................................. 12
Unanswered Questions.............................................................................................. 14
CONTRIBUTION......................................................................................................... 16
REFERENCES ............................................................................................................. 21
Chapter 2 ........................................................................................................................... 25
A Theory of Intergovernmental Delegation ...................................................................... 25
INTRODUCTION ........................................................................................................ 25
FOUNDATIONAL ASSUMPTIONS .......................................................................... 28
Delegation ................................................................................................................. 28
Principal Agent Framework ...................................................................................... 31
Legislator Motivations .............................................................................................. 33
Discretion and Implementation ................................................................................. 34
Federalism Beliefs .................................................................................................... 36
THE MODELS ............................................................................................................. 39
Aggregate Model of Congress .................................................................................. 39
Individual-level Bargaining Model ........................................................................... 47
Political Uncertainty ................................................................................................. 61
THEORETICAL PREDICTIONS ................................................................................ 62
vii
APPENDIX .................................................................................................................... 65
Mathematical Appendix: ............................................................................................ 65
Aggregate Congress Model .................................................................................... 65
Individual Level Bargaining Game ........................................................................ 66
REFERENCES ............................................................................................................. 71
Chapter 3 ........................................................................................................................... 73
Measuring the Federal Allocation of Authority ................................................................ 73
INTRODUCTION ........................................................................................................ 73
DATA ........................................................................................................................... 74
Dependent Variable .................................................................................................. 74
Unit of Analysis and Selection of Data ................................................................. 74
Source ................................................................................................................... 76
Coding Choices ..................................................................................................... 77
Descriptive Statistics ................................................................................................. 81
Limitations ................................................................................................................ 88
Joint Policies ............................................................................................................. 88
Intergovernmental Delegation Theoretical Explanators ........................................... 92
Preferences ............................................................................................................ 92
The Concept of Party ............................................................................................ 93
Measuring Distance .............................................................................................. 94
Political Uncertainty ............................................................................................. 95
Alternative Arguments‘ Variables ............................................................................ 98
Control Variables .................................................................................................... 100
CONCLUSION ........................................................................................................... 103
APPENDIX .................................................................................................................. 104
Coding Rules ............................................................................................................ 104
Coding Protocol for Federal Policy Delegation ....................................................... 105
REFERENCES ........................................................................................................... 108
Chapter 4 ......................................................................................................................... 110
Congressional Intergovernmental Delegation of Authority from 1973-2008: ............... 110
An Empirical Analysis of Federal Policy Design ........................................................... 110
INTRODUCTION ...................................................................................................... 110
TESTING THE THEORY .......................................................................................... 111
DATA AND MEASUREMENT ................................................................................ 111
viii
Dependent Variable ................................................................................................ 112
Independent Variables ............................................................................................ 112
Preferences .............................................................................................................. 113
Political Uncertainty ............................................................................................... 117
Alternative Arguments‘ Variables .......................................................................... 118
Control Variables .................................................................................................... 119
EMPIRICAL ANALYSES ......................................................................................... 121
RESULTS ................................................................................................................... 122
DISCUSSION AND CONCLUSION ........................................................................ 132
APPENDIX .................................................................................................................. 136
REFERENCES ........................................................................................................... 138
Chapter 5 ......................................................................................................................... 141
Health Insurance Reform and Intergovernmental Delegation ........................................ 141
INTRODUCTION ...................................................................................................... 141
CONTEXT OF HEALTH INSURANCE REFORM ................................................. 144
THEORETICAL FRAMEWORK .............................................................................. 149
Intergovernmental Policy Design ........................................................................... 149
RESEARCH DESIGN AND METHODS .................................................................. 151
Federal Authority Allocation .................................................................................. 156
DATA ANALYSIS ..................................................................................................... 159
Institutions and Actors in the 111th
Congress ......................................................... 159
State Delegation ...................................................................................................... 165
Intergovernmental Context ..................................................................................... 171
Chamber Rules ........................................................................................................ 177
Other Concerns ....................................................................................................... 180
Theory of Federal Policy Design versus Rival Arguments .................................... 183
Electoral Concerns .................................................................................................. 187
Data Analysis Summary ......................................................................................... 188
DISCUSSION AND CONCLUSION ........................................................................ 188
APPENDIX .................................................................................................................. 193
Case Study Data Collection Methods ...................................................................... 193
One Page Information Sheet Used Prior to Interviews (original in 12 pt font): ...... 195
REFERENCES ........................................................................................................... 196
Chapter 6 ......................................................................................................................... 200
ix
Individual Legislators and Intergovernmental Delegation ............................................. 200
INTRODUCTION ...................................................................................................... 200
TESTING THE THEORY .......................................................................................... 202
DATA AND MEASUREMENT ................................................................................ 204
Conditional Analyses .............................................................................................. 205
Dependent Variable ................................................................................................ 205
Explanatory Variable .............................................................................................. 207
Control Variables .................................................................................................... 213
EMPIRICAL ANALYSES ......................................................................................... 213
RESULTS ................................................................................................................... 215
DISCUSSION AND CONCLUSION ........................................................................ 228
REFERENCES ........................................................................................................... 232
Chapter 7 ......................................................................................................................... 234
Conclusion ...................................................................................................................... 234
SUMMARY ................................................................................................................ 234
CONTRIBUTION....................................................................................................... 239
NEXT STEPS ............................................................................................................. 240
Passive States .......................................................................................................... 240
Joint Policies ........................................................................................................... 242
Cloture, Bargaining, and the House ........................................................................ 243
CONCLUSION ........................................................................................................... 244
x
List of Figures
Figure 1-1: Policy Centralization (Krause and Bowman 2005)......................................... 8
Figure 2-1: Aggregate Model Implications...................................................................... 42
Figure 2-3 with insets a-c: Individual Bargaining Model Game Tree ............................. 50
Figure 3-1: Overall Delegation Choices 1973-2008 ........................................................ 82
Figure 3-2: Variation in Federal Delegation Choices ...................................................... 83
Figure 3-3: Federal Authority Composition .................................................................... 85
Figure 3-4: Political Uncertainty Transformation............................................................ 98
Figure 4-1: Interaction Between Congress-State & Congress-National Distances ....... 129
Figure 6-1: Cloture Votes from 1973-2008 ................................................................... 207
xi
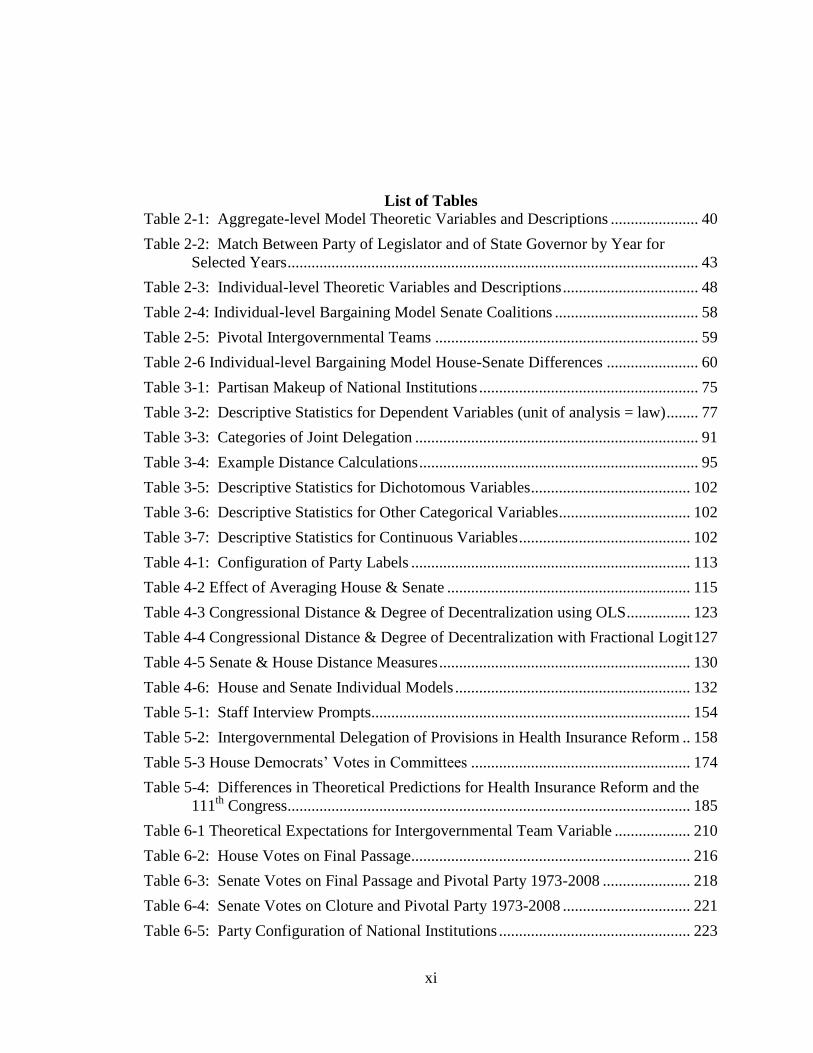
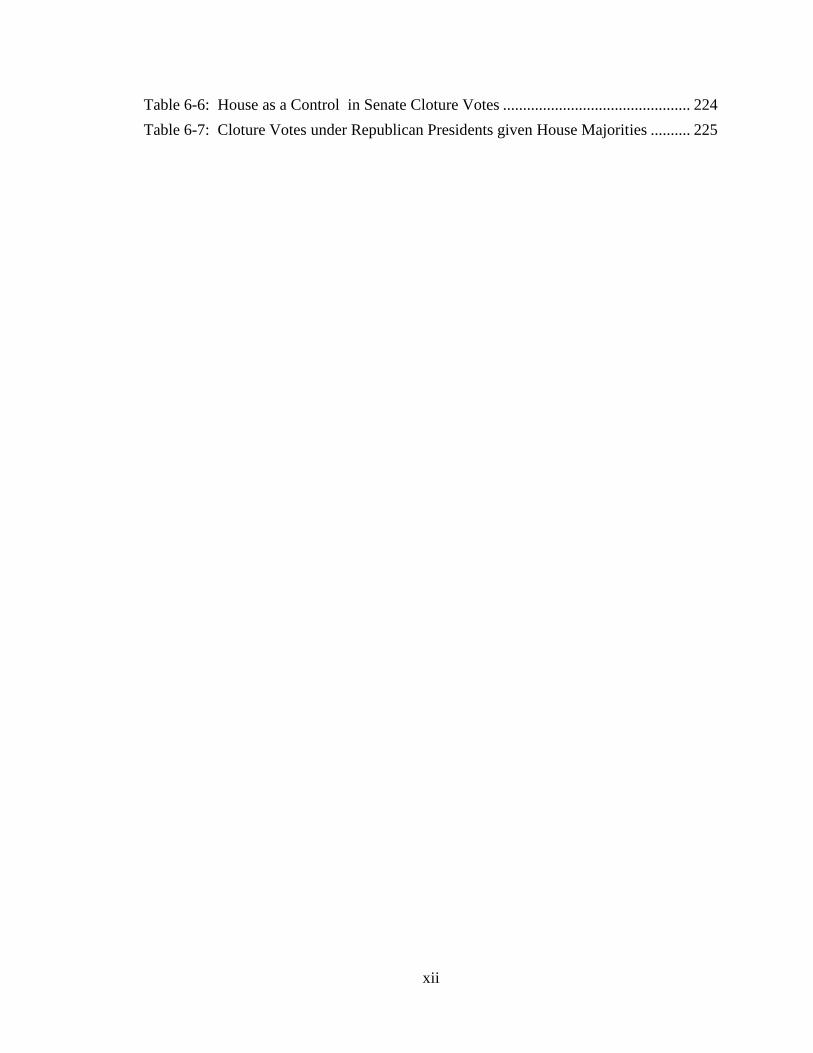
List of Tables
Table 2-1: Aggregate-level Model Theoretic Variables and Descriptions ...................... 40
Table 2-2: Match Between Party of Legislator and of State Governor by Year for
Selected Years ....................................................................................................... 43
Table 2-3: Individual-level Theoretic Variables and Descriptions .................................. 48
Table 2-4: Individual-level Bargaining Model Senate Coalitions .................................... 58
Table 2-5: Pivotal Intergovernmental Teams .................................................................. 59
Table 2-6 Individual-level Bargaining Model House-Senate Differences ....................... 60
Table 3-1: Partisan Makeup of National Institutions ....................................................... 75
Table 3-2: Descriptive Statistics for Dependent Variables (unit of analysis = law) ........ 77
Table 3-3: Categories of Joint Delegation ....................................................................... 91
Table 3-4: Example Distance Calculations ...................................................................... 95
Table 3-5: Descriptive Statistics for Dichotomous Variables ........................................ 102
Table 3-6: Descriptive Statistics for Other Categorical Variables ................................. 102
Table 3-7: Descriptive Statistics for Continuous Variables ........................................... 102
Table 4-1: Configuration of Party Labels ...................................................................... 113
Table 4-2 Effect of Averaging House & Senate ............................................................. 115
Table 4-3 Congressional Distance & Degree of Decentralization using OLS ................ 123
Table 4-4 Congressional Distance & Degree of Decentralization with Fractional Logit 127
Table 4-5 Senate & House Distance Measures ............................................................... 130
Table 4-6: House and Senate Individual Models ........................................................... 132
Table 5-1: Staff Interview Prompts................................................................................ 154
Table 5-2: Intergovernmental Delegation of Provisions in Health Insurance Reform .. 158
Table 5-3 House Democrats‘ Votes in Committees ....................................................... 174
Table 5-4: Differences in Theoretical Predictions for Health Insurance Reform and the
111th
Congress ..................................................................................................... 185
Table 6-1 Theoretical Expectations for Intergovernmental Team Variable ................... 210
Table 6-2: House Votes on Final Passage...................................................................... 216
Table 6-3: Senate Votes on Final Passage and Pivotal Party 1973-2008 ...................... 218
Table 6-4: Senate Votes on Cloture and Pivotal Party 1973-2008 ................................ 221
Table 6-5: Party Configuration of National Institutions ................................................ 223
xii
Table 6-6: House as a Control in Senate Cloture Votes ............................................... 224
Table 6-7: Cloture Votes under Republican Presidents given House Majorities .......... 225
1
Chapter 1:
The Federal Design Dilemma:
The Puzzle of Intergovernmental Delegation
INTRODUCTION
When policymakers craft and consider legislation, they make decisions about who
is responsible for the implementation of the policy. Congress delegates authority not just
to the national executive branch agents, but also to state and local entities (Epstein and
O‘Halloran 1999).1 Delegation to national and state actors is a choice about which level
of government is responsible for the policy, or how centralized or decentralized a policy
is. The variety of federal delegation options offers a number of intergovernmental design
alternatives for policymakers. In particular, how much authority should Congress
delegate to the states versus the national executive branch? If the states are charged with
more authority in implementing a law, the national executive branch receives less of that
responsibility. Alternatively, if more authority is centralized in the national executive
branch, the state allocation of authority in the national law decreases. Choosing how
much authority to decentralize to the states versus keep at the national level is what I
refer to as the federal design dilemma Congress faces.
Public health scholars often refer to the variation in federal design choices as a
―patchwork‖ of national and state authority across health policies (Institute of Medicine,
1 In this dissertation, I discuss authority, responsibility, and execution from the perspective of congressional
delegation of implementation. As a result, I use these terms inter-changeably.
2
IOM, 1988 and 2002). This patchwork of authority is identified by the IOM as a major
problem for public health due to overlapping authority in some areas and gaping holes in
others. Baker et al. (2005) warns ―the division of authority among governments at the
state, federal, and local levels has often led to inconsistency, ineffective resource
allocation, and uncertainty about their respective roles and responsibilities.‖ Health
policies, though, are not unique in this respect; education, social welfare, transportation,
environmental and energy policies exhibit variation in the decentralization of authority
across policies and over time (van Horn 1979, Wong 1994, Potoski and Woods 2002,
Scheberle 2005).
For example, in the 1971 Water Pollution Control amendments, an approved
House bill centralized power with the Environmental Protection Agency (EPA). In
contrast, a parallel Senate bill delegated more authority to the states than to the EPA.
Similarly, as Congress crafted the No Child Left Behind Act of 2001, a contentious issue
was the degree of state and local control over national dollars allocated to them for
educational spending. The House version of the bill gave states and local school districts
―unprecedented‖ flexibility in contrast to Senators who were concerned that this
discretion could alter the intent of national education programs (Congressional Quarterly
Almanac 2001). In both policies, the final law included a compromise between the
chambers over how much authority over implementation was given to the states versus
the national executive branch. Adjustments in state versus national executive branch
authority in Medicaid and the State Children‘s Health Insurance Program (SCHIP) have
also occurred over time and variation in state responsibility is evident across national
3
environmental laws, such as the Clean Water and Air Acts (Holahan et al. 2003, Nathan
2005, Lambrew 2007, Rabe 2008, Scheberle 2005).
A look at the language of national policy debates reveals the amount of authority
allocated to states evolves as bills progress through Congress. In addition, state roles in
national policy are closely monitored by legislators and can be contentious. Political
elites use language such as ―turn back to the states a greater measure of responsibility‖
(Nixon 1969), ―new concepts of cooperation, a creative federalism‖ (Johnson 1964), ―the
greatest grab for power ever made by the federal government‖ (Ervin 1972), and ―[t]he
only question is at what level [the policy] should be done‖ (Castle 1999).2 More recently,
Senator Snowe commented on the various policy options and degree of responsibility the
states have in national health insurance reform. She remarked, ―I think it is clear we all
struggle with the appropriate equilibrium [of state and national authority].‖3 These
quotes demonstrate the importance of and struggle over the intergovernmental delegation
of policy authority in policy debates.
Whether discussing big government, unfunded mandates, federal grants-in-aid, or
pre-emption of state regulation authority, the structure of federal delegation choices may
be the crux of the policy debate and has even been called the ―the cardinal question.‖4
Are changes in the design of federal delegation the result of random choices by national
legislators as Graves (1964) posits or are they deliberate choices with respect to the
2 All quotes were taken from the Congressional Quarterly Almanac On-line edition (various years). Nixon
and Johnson‘s statements were in the 1973 article entitled ―Nixon's New Federalism Debated in Senate
Hearings‖, Ervin in 1972 ―Equal Jobs: Approval of Court Enforcement Approach‖ and Castle‘s remark was
in the 1999 article ―New ‗Ed-Flex‘ Bill Allows States To Grant Waivers from Some Federal Regulations.‖ 3 Senator Snowe‘s quote is from an October 13, 2009 Finance Committee hearing on national health
insurance reform, which will be discussed at length in Chapter 5. 4 Wilson (1917) remarks that the relationship between the national and state governments is the cardinal
question that faces each generation.
4
location of policy authority? This dissertation seeks to explain why and how national
legislators use federal delegation in policy design. Two major questions are addressed:
What does federal delegation within and across policies look like?
Under what conditions do national legislators choose to delegate more or
less responsibility to the states?
In order to maintain a degree of clarity in this project, I refer to joint-partnership
decisions, policies, and programs as those characterized by a sharing of authority between
the national and state levels of governance. National programs and policies are those
specifically at the national level and state programs and policies are those with authority
delegated mainly to the state (or local) levels.5 The term federal is used more generally
to refer to characteristics of policies or responsibilities within the entire governance
system. This use of the term is a departure from conventional usage, where federal
typically refers to the national government. I follow Peterson‘s (1995) narrowing of the
definition to reduce confusion in this intergovernmental study of policymaking. For
instance, the federal delegation of authority for policies refers to the designation of which
level (national, state, or both) is in charge of a policy. This assignment includes
responsibility for making rules, oversight, translating policies into action, and financing.
Responsible parties can include national bureaucracies, independent commissions, state
and local actors (such as their legislatures or bureaucracies), and even private entities.
IMPORTANCE
The structural choices Congress makes have ―important consequences for the
content and direction of policy‖ (Moe 1989). The federal design, or intergovernmental
5 I assume local policies are subsumed into state policies. Local governments also likely play an important
role in intergovernmental relations and the decisions of policymakers. Narrowing the scope of the study in
this way will miss some of the nuances of intergovernmental relations that require further study.
5
structure, of policies, therefore, is fundamental for at least three major reasons. First, the
delegation of policy responsibility across levels of government yields different policy
outcomes because different actors with different ideas about the best policy outcome are
involved.6 Second, the design of federal authority delegation crucially affects policy
winners and losers because altering the federal location of policy responsibility changes
the scope of the issue (Schattschneider 1975) and creates opportunities for policy
entrepreneurs to change ―the distribution of advantage‖ (Baumgartner and Jones 1993).
Policy actors may increase or decrease the scope of the policy to achieve the ends they
specifically want (Nice 1987, Baumgartner and Jones 1993).
Third, and from the perspective of public health and health policy, changes in the
federal design of authority result in changes in population health outcomes for the two
reasons listed above and their impact on the delivery of public health and health care
programs and services. Whether states or the federal government are the lead, the
support, or sole actors involved in public health policy, whether states can tailor policies
to their population, and whether national law sets a ceiling or a floor for policy alter the
ability of public health practitioners to do their work. These choices lay the foundation
for which entity has power, which in turn has a direct effect on the choices made over the
intent of programs, distribution of resources and, ultimately, on health outcomes.
Although states were traditionally considered the core actor responsible for health policy,
the national legislature has utilized a combination of grants-in-aid, unfunded mandates,
and lenient judicial interpretations of the Constitution to dominate most policy areas,
including health (Gostin 2000).
6 The ―best policy outcome‖ loosely describes actors‘ preferences over policy outcomes or ideal policy
outcome. This terminology is sharpened in the theoretical chapter.
6
Despite the importance of these authority alternatives, we do not yet fully
understand why legislators choose to delegate authority for some policies more to the
national executive branch and others more heavily to the states. In public health
scholarship, for instance, although the patchwork of authority is often discussed, few
undertake research about the underlying causes of the mélange of intergovernmental
relationships. Because of the significance of federal delegation of authority and our
inability to pinpoint its determinants, this dissertation addresses how Congress solves its
federal design dilemma.
Previous policy and political science scholars have also noted the importance of
federal delegation. In 1984 Ripley and Franklin wrote that virtually all policies are a mix
of national and state actors following similar statements made by Elazar (1962). More
recently, Conlan and Posner observe that most domestic policies include a mixture of
responsibilities for national and state actors (2008) and Epstein and O‘Halloran (1992)
coin the term federal delegation (which they define in their study as delegation from
Congress to the states). Although details about state and local actors are not included in
Epstein and O‘Halloran‘s (1999) study, delegation to state and local actors represents a
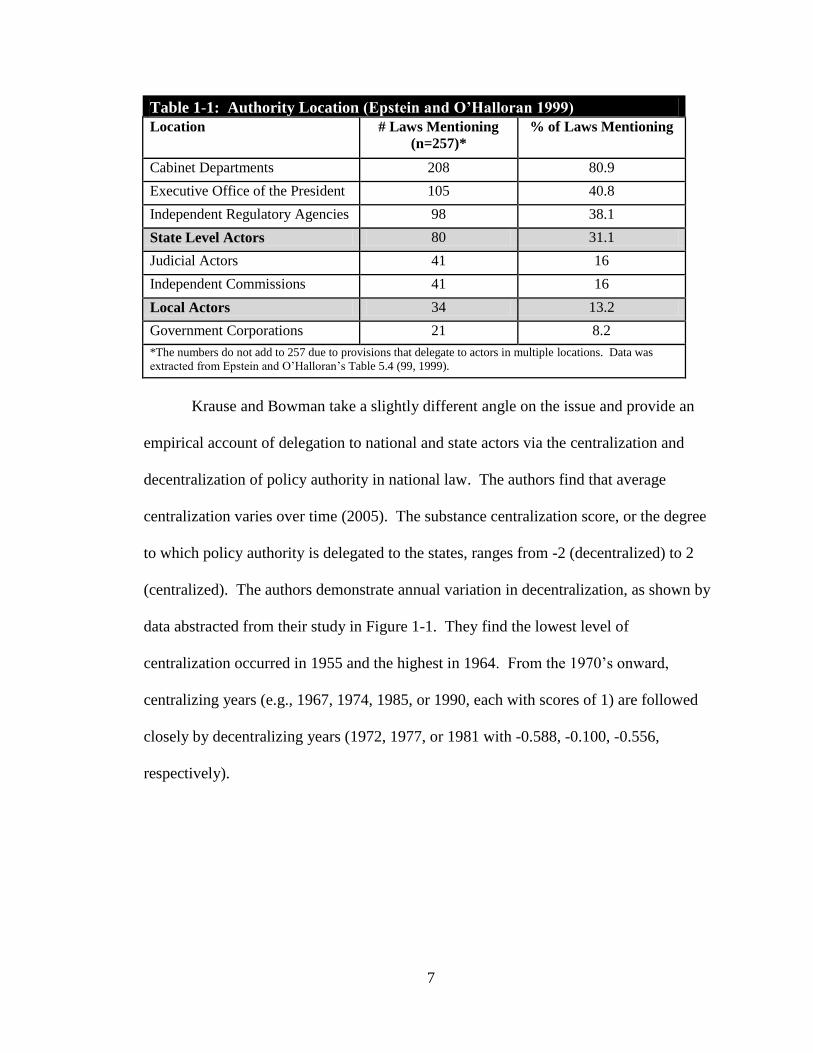
significant portion of congressional choices about where to locate policy authority. As
detailed in Table 1-1, state actors are mentioned in 31% and local actors in 13% of
Mayhew‘s important laws from 1947 through 1992.7
7 The degree of overlap in these two categories cannot be determined from details provided in text
accompanying their table.
7
Table 1-1: Authority Location (Epstein and O’Halloran 1999)
Location # Laws Mentioning
(n=257)*
% of Laws Mentioning
Cabinet Departments 208 80.9
Executive Office of the President 105 40.8
Independent Regulatory Agencies 98 38.1
State Level Actors 80 31.1
Judicial Actors 41 16
Independent Commissions 41 16
Local Actors 34 13.2
Government Corporations 21 8.2
*The numbers do not add to 257 due to provisions that delegate to actors in multiple locations. Data was
extracted from Epstein and O‘Halloran‘s Table 5.4 (99, 1999).
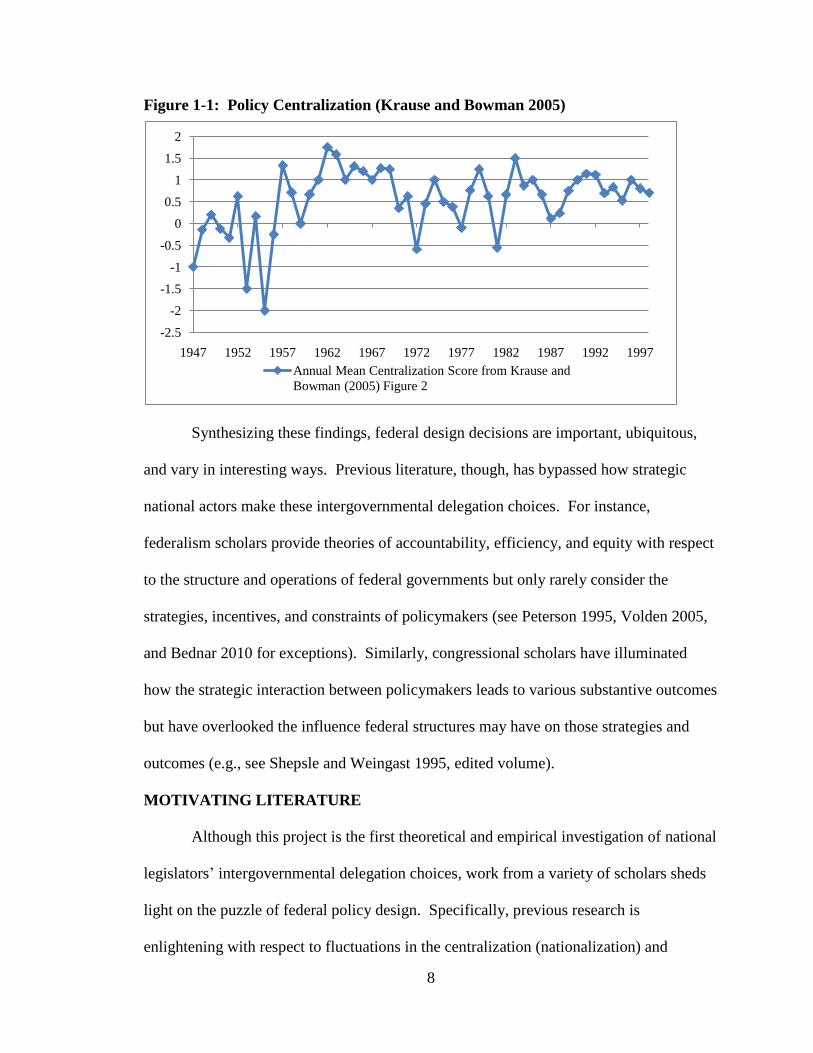
Krause and Bowman take a slightly different angle on the issue and provide an
empirical account of delegation to national and state actors via the centralization and
decentralization of policy authority in national law. The authors find that average
centralization varies over time (2005). The substance centralization score, or the degree
to which policy authority is delegated to the states, ranges from -2 (decentralized) to 2
(centralized). The authors demonstrate annual variation in decentralization, as shown by
data abstracted from their study in Figure 1-1. They find the lowest level of
centralization occurred in 1955 and the highest in 1964. From the 1970‘s onward,
centralizing years (e.g., 1967, 1974, 1985, or 1990, each with scores of 1) are followed
closely by decentralizing years (1972, 1977, or 1981 with -0.588, -0.100, -0.556,
respectively).
8
Figure 1-1: Policy Centralization (Krause and Bowman 2005)
Synthesizing these findings, federal design decisions are important, ubiquitous,
and vary in interesting ways. Previous literature, though, has bypassed how strategic
national actors make these intergovernmental delegation choices. For instance,
federalism scholars provide theories of accountability, efficiency, and equity with respect
to the structure and operations of federal governments but only rarely consider the
strategies, incentives, and constraints of policymakers (see Peterson 1995, Volden 2005,
and Bednar 2010 for exceptions). Similarly, congressional scholars have illuminated
how the strategic interaction between policymakers leads to various substantive outcomes
but have overlooked the influence federal structures may have on those strategies and
outcomes (e.g., see Shepsle and Weingast 1995, edited volume).
MOTIVATING LITERATURE
Although this project is the first theoretical and empirical investigation of national
legislators‘ intergovernmental delegation choices, work from a variety of scholars sheds
light on the puzzle of federal policy design. Specifically, previous research is
enlightening with respect to fluctuations in the centralization (nationalization) and
-2.5
-2
-1.5
-1
-0.5
0
0.5
1
1.5
2
1947 1952 1957 1962 1967 1972 1977 1982 1987 1992 1997
Annual Mean Centralization Score from Krause and
Bowman (2005) Figure 2
9
decentralization of policies over time, the incentives political actors face when
considering devolving policy authority to the states or centralizing authority with the
national executive branch, and the reasons for and ways in which legislators delegate
policy authority to another entity.
Centralization versus Decentralization
Explanations for variation in the decentralization of policies include party or
ideology with Republicans or conservatives favoring decentralized policies and
Democrats or liberals favoring centralization (empirical studies reviewed in Peterson
1995, also see Krause and Bowman 2005). Modernization, complexity, and
specialization (Beer 1978, Bowman and Krause 2003) and growth of the interest group
system (Baumgartner and Jones 1993, Walker 1981) are considered culprits for the
increasing interdependence and intergovernmental nature of national policies. Other
scholars cite randomness and lack of order for the reasons decentralization of authority
varies across laws (van Horn 1979, Graves 1964). The conventional wisdom is that
Republicans prefer to devolve authority to the states and Democrats prefer centralization.
This well-accepted argument appears to be based on conservative rhetoric, not on policy
actions (Scheiber 1996). As an example, the devolution revolution during the Reagan
administration is described by scholars in the following way: ―the concept of federalism
guiding their decisions remains as inconsistent and incoherent as it ever has been‖
(Peterson, Rabe and Wong 1986). In other words, empirical evidence shows Republicans
do not consistently devolve authority to the states.
Krause and Bowman add nuance to the conventional wisdom with a thoughtful
view of the influence of partisan preferences on decentralization (2005). They argue and
10
find empirically Republicans do not just devolve authority, but instead, Republicans at
the national level are more likely to decentralize authority to the states when the states are
more Republican and Democrats do the same when the states are more heavily
Democratic (what they term partisan congruence).8 In their view, national legislators
scan the average partisan makeup of states before choosing the degree of centralization of
policies and then decentralize when the states, on average, are of the same majority party
as the combined national institutions of governance.
Scholarship in fiscal federalism, alternatively, suggests policymakers design
authority structures to fit the situation or policy area at hand (see Oates 2005 for a review
or Peterson 1995 for an explication of ―functional federalism‖). Those policies best
(often defined as most efficiently) implemented at the state level are decentralized to the
states and those more efficiently handled by the central government are kept at the
national level. For instance, Peterson argues that national legislators craft decentralized
developmental policies and centralized redistributive policies since the states are more
competent at development than at redistribution (1995).9 Economic analyses similarly
focus on the most efficient division of responsibilities in a federal system (Tiebout 1956,
Olson 1969, Chubb 1985, Oates 2005). The classic result is that the central government
should deal with redistributive policies and local governments should concern themselves
8 In their study, the authors include controls for federal government spending growth, mean annual growth
of state revenue from the previous year, Krehbiel‘s gridlock interval measure, and a dummy variable for
civil rights and welfare issues (Krause and Bowman, 2005). 9 Peterson argues that after the 1970‘s, national legislators began to craft legislation with policy function in
mind. He defines developmental policies as those that ―provide the physical and social infrastructure
necessary to facilitate a country‘s economic growth‖ and redistributive policies as those that ―reallocate
societal resources from the haves to the have-nots‖ (17, 1995). Although Peterson‘s earlier work
emphasizes centralization from a local to state perspective (1981), in The Price of Federalism he focuses on
state to national concerns. For instance, in his formulation of the functional theory of federalism he argues
―the national government should assume the primary responsibility for redistribution, while state and local
governments assume primary responsibility for development‖ (18, 1995). Peterson juxtaposes this theory
to a legislative theory of federalism (where political actors are driven by self interest instead of efficiency)
and concludes that post-1970‘s the functional theory is most consistent with the data.
11
with developmental policies (Chubb 1985, Oates 2005).10
Yet, as Chubb puts it,
federalism is not ―an efficient system for sharing the economic, political, and
administrative responsibilities of modern government, but rather, one that, through the
initiative of the national government, has become wasteful, cumbersome, and, as often as
not, unsuccessful‖ (994, 1985). Chubb‘s perspective casts doubt on intergovernmental
delegation for reasons of efficiency.
Policy Actors’ Incentives
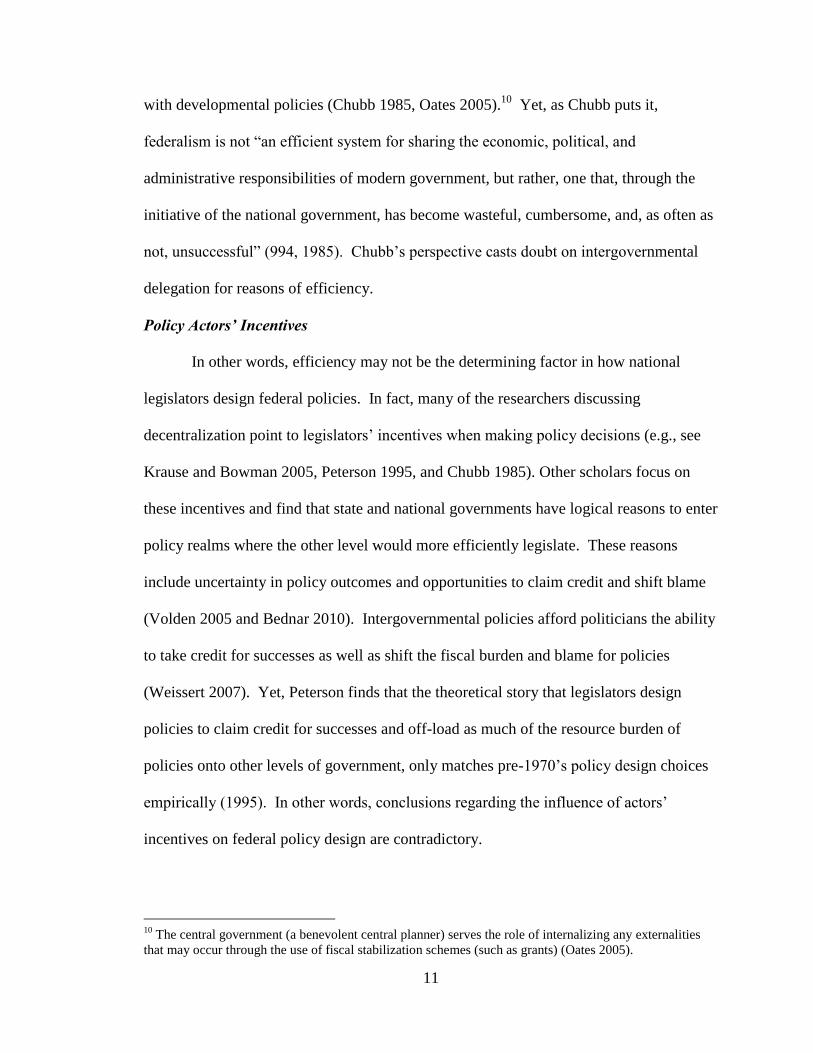
In other words, efficiency may not be the determining factor in how national
legislators design federal policies. In fact, many of the researchers discussing
decentralization point to legislators‘ incentives when making policy decisions (e.g., see
Krause and Bowman 2005, Peterson 1995, and Chubb 1985). Other scholars focus on
these incentives and find that state and national governments have logical reasons to enter
policy realms where the other level would more efficiently legislate. These reasons
include uncertainty in policy outcomes and opportunities to claim credit and shift blame
(Volden 2005 and Bednar 2010). Intergovernmental policies afford politicians the ability
to take credit for successes as well as shift the fiscal burden and blame for policies
(Weissert 2007). Yet, Peterson finds that the theoretical story that legislators design
policies to claim credit for successes and off-load as much of the resource burden of
policies onto other levels of government, only matches pre-1970‘s policy design choices
empirically (1995). In other words, conclusions regarding the influence of actors‘
incentives on federal policy design are contradictory.
10
The central government (a benevolent central planner) serves the role of internalizing any externalities
that may occur through the use of fiscal stabilization schemes (such as grants) (Oates 2005).
12
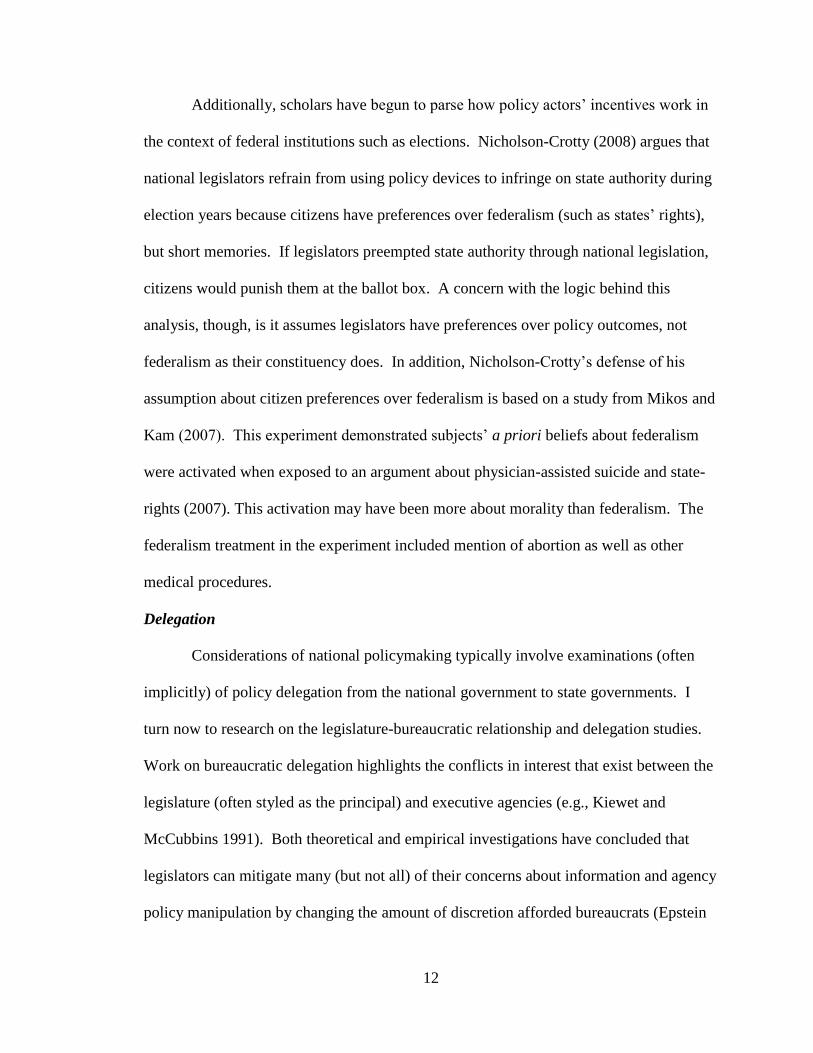
Additionally, scholars have begun to parse how policy actors‘ incentives work in
the context of federal institutions such as elections. Nicholson-Crotty (2008) argues that
national legislators refrain from using policy devices to infringe on state authority during
election years because citizens have preferences over federalism (such as states‘ rights),
but short memories. If legislators preempted state authority through national legislation,
citizens would punish them at the ballot box. A concern with the logic behind this
analysis, though, is it assumes legislators have preferences over policy outcomes, not
federalism as their constituency does. In addition, Nicholson-Crotty‘s defense of his
assumption about citizen preferences over federalism is based on a study from Mikos and
Kam (2007). This experiment demonstrated subjects‘ a priori beliefs about federalism
were activated when exposed to an argument about physician-assisted suicide and state-
rights (2007). This activation may have been more about morality than federalism. The
federalism treatment in the experiment included mention of abortion as well as other
medical procedures.
Delegation
Considerations of national policymaking typically involve examinations (often
implicitly) of policy delegation from the national government to state governments. I
turn now to research on the legislature-bureaucratic relationship and delegation studies.
Work on bureaucratic delegation highlights the conflicts in interest that exist between the
legislature (often styled as the principal) and executive agencies (e.g., Kiewet and
McCubbins 1991). Both theoretical and empirical investigations have concluded that
legislators can mitigate many (but not all) of their concerns about information and agency
policy manipulation by changing the amount of discretion afforded bureaucrats (Epstein
13
and O‘Halloran 1999), writing detailed statutes (Huber and Shipan 2002), using
competitive or redundant bureaucratic structures (Kunioka and Rothenberg 1993 and
Ting 2003), carefully crafting administrative procedures, involving specific interests in
agency processes (McCubbins, Noll, and Weingast 1987 and 1989) and utilizing different
types of oversight and monitoring mechanisms (McCubbins and Schwartz 1984 and
Lupia and McCubbins 1994). None of these scholars considered the importance of the
states as potential participants in administrative procedures, agency processes, or
oversight and monitoring. How would their conclusions change if they had taken an
intergovernmental perspective?
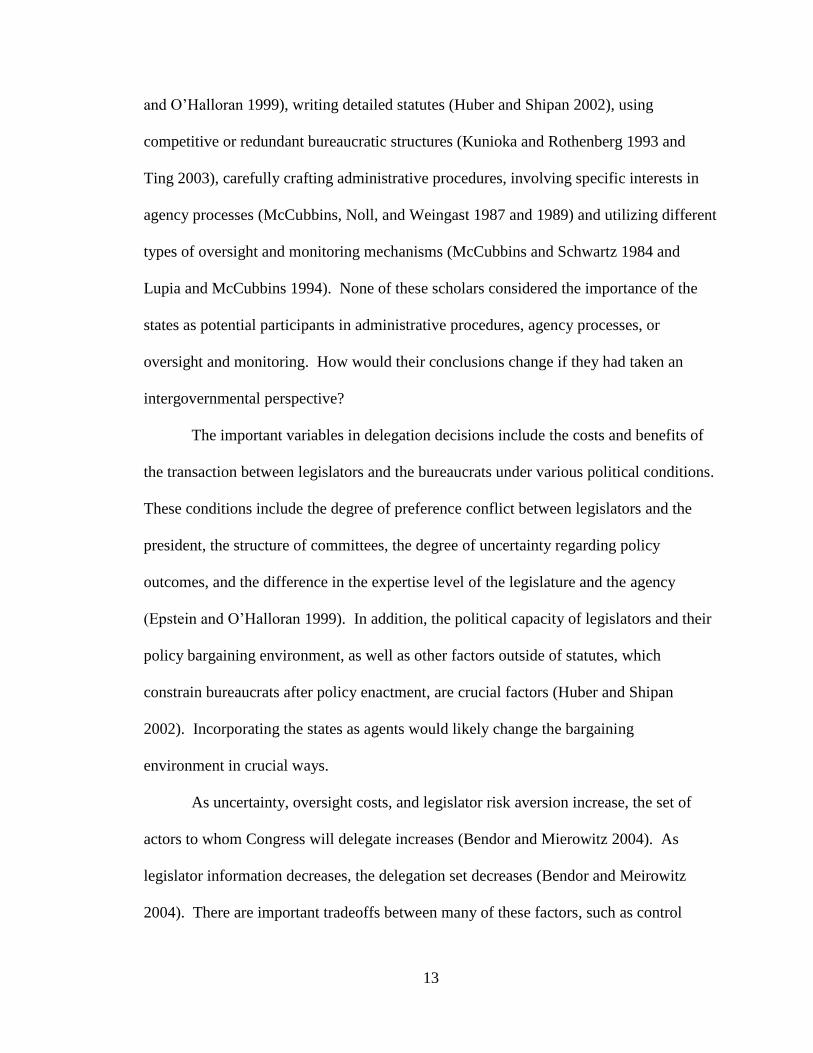
The important variables in delegation decisions include the costs and benefits of
the transaction between legislators and the bureaucrats under various political conditions.
These conditions include the degree of preference conflict between legislators and the
president, the structure of committees, the degree of uncertainty regarding policy
outcomes, and the difference in the expertise level of the legislature and the agency
(Epstein and O‘Halloran 1999). In addition, the political capacity of legislators and their
policy bargaining environment, as well as other factors outside of statutes, which
constrain bureaucrats after policy enactment, are crucial factors (Huber and Shipan
2002). Incorporating the states as agents would likely change the bargaining
environment in crucial ways.
As uncertainty, oversight costs, and legislator risk aversion increase, the set of
actors to whom Congress will delegate increases (Bendor and Mierowitz 2004). As
legislator information decreases, the delegation set decreases (Bendor and Meirowitz
2004). There are important tradeoffs between many of these factors, such as control
14
(amount of discretion allowed) and expertise (Bawn 1995), credible credit claiming for
successes and reduced traceability (Arnold 1990), or oversight and cost (Epstein and
O‘Halloran 1999).11
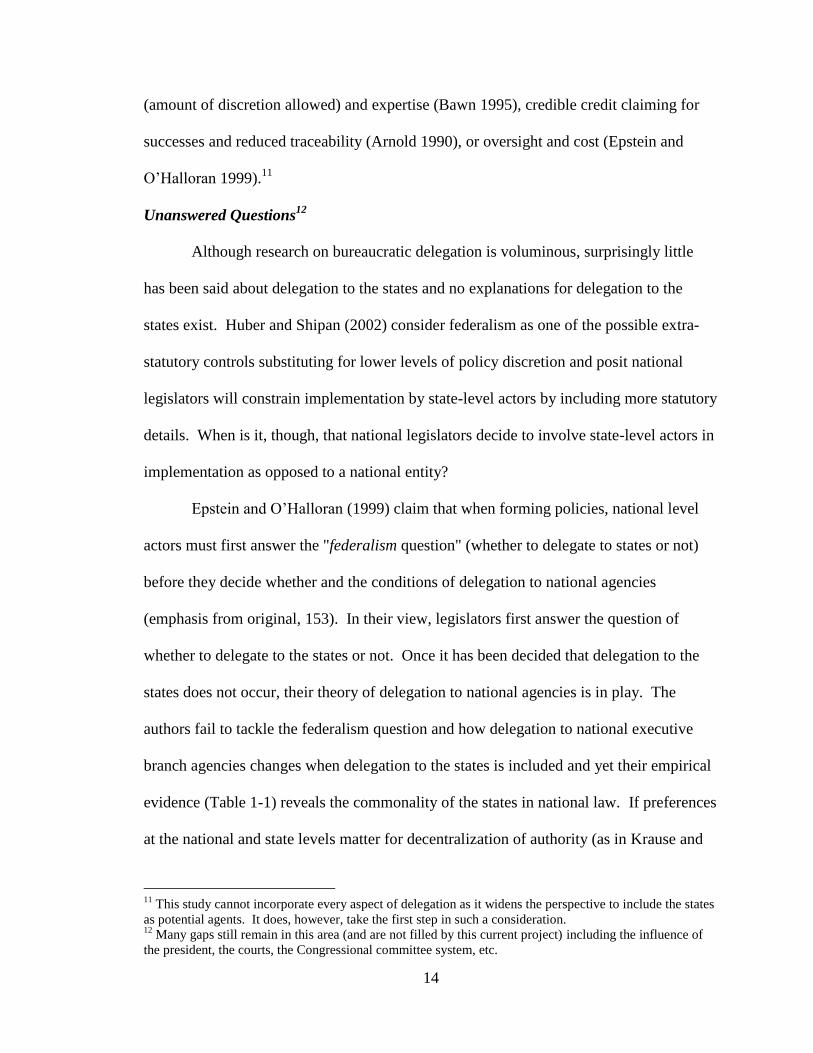
Unanswered Questions12
Although research on bureaucratic delegation is voluminous, surprisingly little
has been said about delegation to the states and no explanations for delegation to the
states exist. Huber and Shipan (2002) consider federalism as one of the possible extra-
statutory controls substituting for lower levels of policy discretion and posit national
legislators will constrain implementation by state-level actors by including more statutory
details. When is it, though, that national legislators decide to involve state-level actors in
implementation as opposed to a national entity?
Epstein and O‘Halloran (1999) claim that when forming policies, national level
actors must first answer the "federalism question" (whether to delegate to states or not)
before they decide whether and the conditions of delegation to national agencies
(emphasis from original, 153). In their view, legislators first answer the question of
whether to delegate to the states or not. Once it has been decided that delegation to the
states does not occur, their theory of delegation to national agencies is in play. The
authors fail to tackle the federalism question and how delegation to national executive
branch agencies changes when delegation to the states is included and yet their empirical
evidence (Table 1-1) reveals the commonality of the states in national law. If preferences
at the national and state levels matter for decentralization of authority (as in Krause and
11
This study cannot incorporate every aspect of delegation as it widens the perspective to include the states
as potential agents. It does, however, take the first step in such a consideration. 12
Many gaps still remain in this area (and are not filled by this current project) including the influence of
the president, the courts, the Congressional committee system, etc.
15
Bowman 2005), how do decentralization of authority and the preferences of the national
executive branch influence bureaucratic delegation?
There are three major issues with most of these arguments and their analyses.
First, delegation scholars fail to account theoretically for the states as potential agents.
As mentioned above, no previous scholars have incorporated the states as an option in
models of delegation. If delegation models were to incorporate the states, it is likely that
the design of delegation will change. For instance, state and national agents may offer
benefits to Congress through competition for scarce resources (e.g., funding) and they
may create concerns by increasing oversight challenges due to the number and
geographic distance of the states and the possibility of collusion between national and
state agents.
Second, much of the research considering the states and decentralization of
authority only obtains empirical support periodically. As an example, that policy type
determines which authority structure is designed has been an accepted theory for more
than two decades. Unfortunately, empirical scholars have had to redefine different types
of federalism to fit with how different types of policies are delegated to the states during
different time periods (e.g., layer cake federalism, marble cake federalism, picket fence
federalism, and so forth).13
The third concern is methodological. All studies of decentralization of authority
evaluate their theories using a subset of data selected because the policies deal
specifically with state pre-emption, federalism, or specific intergovernmental content.
These studies, in other words, select on the dependent variable leaving uncertainty with
13
See Nice (1987) for an overview of the different types of federalism and time periods and Wright (1973)
regarding cycles of state mandates.
16
respect to how the findings apply outside of their individual studies. This study attempts
to circumvent this issue by considering all significant pieces of legislation regardless of
their intergovernmental, federalism, or states‘ rights content.
In sum, previous literature has, for the most part, separately considered delegation
of policy authority to the states and strategic politicians centralizing and decentralizing
policies. These studies have often narrowly focused on just grants-in-aid (e.g., Peterson
1995) or confined definitions of mandates or delegation in their theories and empirics.
Formal theoretical work has begun to combine these policy actions and political
motivations (Volden 2005, Bednar 2010), but a broad analysis of federal design decisions
and national policymaking has not been undertaken. This project addresses the
intergovernmental design choices national legislators make when crafting policies. I
investigate why national legislators choose one type of federal design over another and
under what conditions they do so.
CONTRIBUTION
By providing an understanding of federal policy design, this dissertation will
inform legislative behavior, federalism, and health policy literatures. First, this project
illuminates current models of national legislative behavior by placing congressional
actions in a more realistic federal structure. Congress chooses the allocation of authority
between national and state agents and attempts to pull policy outcomes closer to its ideal
point by delegating to the closest actor, or to both jointly. Interestingly, if this simple
model underlies how Congress bargains in its chambers, the Senate and the House exhibit
extremely different situations due to their unique majoritarian thresholds (i.e., simple
majority in the House and supermajority due to the filibuster in the Senate). Specifically,
17
Senators must balance the authority allocation they prefer with the ability to appeal to
members from a minority intergovernmental team in order to successfully move policy
through the chamber. Second, this research builds on existing literature by providing
theoretical and empirical answers to the question of how legislators delegate in a federal
system as well as the conditions under which we should see centralization versus
decentralization. Finally, I inform public health scholarship by providing insight into the
strategies and actions of legislators as they make crucial policy design choices.
Theoretically, I develop formal models of legislators delegating authority to
actors at the national and state levels. I extend current theories of delegation and
formulate testable hypotheses. These conjectures are analyzed empirically using a new
policy-level dataset that encodes federal authority decisions as well as existing secondary
data. I ultimately argue that in making the federal delegation decision for a policy,
legislators‘ intergovernmental context matters. By intergovernmental context, I mean
that legislators come from specific states and consider how their state will implement
policy if authority is delegated to that level. Legislators compare potential policy
outcomes at the state and national level to their own preferences over outcomes. Scholars
studying legislative behavior often ignore that Congress is comprised of individual
legislators elected from their own states; the addition of this factor changes the way we
view delegation. And, the addition of intergovernmental context alters ideas about who
is pivotal in voting decisions.
From an empirical perspective, I create the first dataset of its kind that broadly
considers the intergovernmental delegation decisions Congress makes. This dataset is the
centerpiece of my dissertation and includes all significant pieces of domestic legislation
18
from 1973-2008. Over 24,000 provisions within those laws were coded to understand
which entity –national, state, or joint—received authority. By carefully collecting this
data, I am able to test, not only my theoretical explanations, but also rival arguments
regarding decentralization and centralization of policy over time and across laws. Thus, I
am able to understand the federal design of authority by examining how various factors
influence decentralization without selecting on the dependent variable.
In this study, I find most laws include the states as an agent of implementation.
Specifically, out of the 179 significant pieces of legislation, 102 delegated at least some
portion of the provisions to the states. This novel dataset allows for a more careful and
comprehensive study of federal policy design and intergovernmental delegation than is
found in any previous study. I demonstrate empirically not only do most domestic
policies involve delegation to the states, but there is a systematic explanation of variation
in the degree of state-level authority over time.14
To preview my results, I find the party difference between pivotal legislators in
Congress and their state governors is a crucial determinant to how much authority states
are given in national policy. When the pivotal legislator‘s party in Congress is different
from his state‘s governor‘s party, less authority is delegated to all states in national law.
In addition, the party difference between pivotal legislators and the president also matter.
Moreover, these intergovernmental structural choices are tempered by political
uncertainty at the state and national level. A case study brings to light the importance of
intergovernmental delegation in the health insurance reform process and provides
evidence supporting the mechanisms relied on in the formal models. In addition, the
14
Elazar (1962), Ripley and Franklin (1982), and Conlan and Posner (2008) (among others) suggest that
the majority of domestic policies are intergovernmental—requiring state participation in implementation.
These authors, though, do not demonstrate this as an empirical fact. This dataset does so.
19
results of this study show that the intergovernmental context of legislators influences how
they form coalitions to pass policy in the House and the Senate.
The dissertation proceeds as follows. Chapter 2 presents a theory of
intergovernmental policy design and delegation relying on two simple formal models.
Chapter 3 describes the data collected and coded to test this theory and Chapters 4 and 6
provide different levels of empirical analyses. In Chapter 4, I consider the choices of
Congress in the aggregate across time. In Chapter 5, I detail the mechanisms at play in
the empirical analyses through a study of the 2009-2010 health insurance reform process
and consider the usefulness of the assumed mechanisms from the theory in Chapter 2
through an in-depth consideration of the 2009-2010 health reform political process. This
case study also highlights the importance of individual legislators‘ choices and coalition
formation in the House and Senate leading into the second empirical analysis in Chapter
6. In Chapter 6, I empirically examine individual legislators‘ voting behavior in the
House and Senate to examine whether intergovernmental context matters in determining
vote choice. Finally in Chapter 7, I summarize the entire project and lay the groundwork
for future research in this area.
In the end, the motivation for this project is not on which level of government
should have responsibility for what policies. Instead, I focus on one step of the process:
the intergovernmental policy decisions made by national legislators in a federal structure.
By concentrating on the decisions of one set of policymakers, I develop and test a
positive theory of federal delegation decisions. This focus bypasses considerations of
efficiency and normative issues in federal stability.
20
Throughout this dissertation, I follow the logic of the statement of Nice (1987)
who said that beliefs about federalism are ―policy in disguise.‖ He notes that states‘
rights rhetoric is just that, rhetoric. Legislators who vehemently oppose tromping on
state authority in one policy were found to call for centralization in another and
legislators asking for decentralization in a particular policy decide in favor of its
centralization in later years. Or put similarly by Stewart (2011) in writing for the
Huffington Post about banking policy:
Most of the time, it turns out, federalism is the ultimate lip-
service doctrine. If state's rights get you to the outcome you
want, then you support state's rights. If not, well, federal
power's good, too. And it's not just self-interested economic
actors like banks who dance this dance.
In other words, the guiding force behind this dissertation is that debates about
centralization and decentralization are not simply debates about the appropriate level of
government. Instead, they are debates about the underlying policy itself and legislators
are dancing ―the dance‖ as they pursue their own ideal policy ends. This project delves
into the ―disguise‖ and ―the dance‖ and explains when the chosen option for Congress is
keeping authority at the national level versus giving some of it to the states.
The support I find in this project for the theory of intergovernmental delegation provides
an alternate empirical and theoretical explanation to literatures studying delegation,
policy and federalism, as well as health politics. The extensive data effort combined with
comprehensive empirical analyses, illuminative case study and theoretical insight provide
answers as to how Congress solves its policy design dilemma.
21
REFERENCES
Arnold RD. 1990. The Logic of Congressional Action. New Haven, Yale University
Press.
Baker EL, Potter MA, Jones DL, Mercer SL, Cioffi JP, Green LW, Halverson PK,
Lichtveld MY, Fleming DW. 2005. ―The Public Health Infrastructure and Our Nation‘s
Health,‖ Annual Review of Public Health 26:303–18.
Baumgartner FR and Jones BD. 1993. Agendas and Instability in American Politics.
Chicago, Chicago University Press.
Bawn K. 1995. ―Political Control versus Expertise: Congressional Choices about
Administrative Procedures.‖ American Political Science Review 89:62-73.
Bednar J. 2010. The Robust Federation: principles of design. Cambridge U.K.,
Cambridge University Press.
Beer SH. 1978. The New American Political System. Washington D.C., American
Enterprise Institute for Public Policy Research.
Bendor J. and Meirowitz A. 2004. ―Spatial Models of Delegation,‖ American Political
Science Review 98:293-310.
Bowman A O‘M. and Krause GA. 2003. ‗‗Power Shift: Measuring Policy Centralization
in U.S. Intergovernmental Relations, 1947–1998,‘‘ American Politics Research 31:301–
25.
Chubb JE. 1985. "The Political Economy of Federalism." American Political Science
Review 79(4):994-1015.
Congressional Quarterly, Inc. Various Years. Washington, D.C.: Congressional
Quarterly, Inc. On-line Editions last accessed at
http://library.cqpress.com.proxy.lib.umich.edu/cqalmanac/ on May 21, 2011.
Conlan T and Posner P. 2010. ―Inflection Point? Federalism and the Obama
Administration,‖ paper presented at the American Political Science Association,
Washington D.C., September 2.
Elazar DJ. 1962. The American Partnership: intergovernmental cooperation in the
United States, Chicago, Illinois, Chicago University Press.
Gostin LO. 2000. Public Health Law: Power, Duty, Restraint, Berkeley, University of
California Press.
22
Graves WB. 1964. American Intergovernmental Relations: Their Origins, Historical
Development, and Current Status. New York, Scribner.
Holahan J, Weil A, and Wiener JM. eds. 2003. Federalism and Health Policy, Urban
Institute Press.
Huber JD and Shipan CR. 2002. Deliberate Discretion? Cambridge, U.K., Cambridge
University Press.
Institute of Medicine, IOM. 1988. The Future of Public Health. Committee for the
Study of the Future of Public Health, Divisiono f Health Care Services, Institute of
Medicine, Washington D.C., National Academy Press.
Institute of Medicine, IOM. 2002. The Future of the Public’s Health in the 21st Century.
Institute of Medicine Committee on Assuring the Health of the Public in the 21st
Century, Washington D.C., National Academy Press.
Kiewiet DR and McCubbins MD. 1991. The Logic of Delegation: Congressional
Parties and the Appropriations Process, Chicago, Illinois, University of Chicago Press.
Krause G and Bowman A O‘M. 2005. ―Adverse Selection, Political Parties, and Policy
Delegation in the American Federal System‖ Journal of Law Economics and
Organization, 21(2):359-87.
Kunioka T and Rothenberg LS. 1993. ―The Politics of Bureaucratic Competition: The
Case of Natural Resource Policy‖ Journal of Policy Analysis and Management,
12(4):700-725.
Lambrew JM. 2007. The State Children’s Health Insurance Program: Past, Present,
and Future. The Commonwealth Fund.
Lupia A and McCubbins M. 1994. "Learning from Oversight: Fire Alarms and Police
Patrols Reconstructed. Journal of Law Economics and Organization, 10(1):96-125.
McCubbins MD, Noll RG, and Weingast BR. 1987. ―Administrative Procedures as
Instruments of Political Control‖ Journal of Law Economics and Organization, 3(2):243-
77.
McCubbins MD, Noll RG, and Weingast BR. 1989. ―Structure and Process, Politics and
Policy: Administrative Arrangements and the Political Control of Agencies.‖ Virginia
Law Review, 75(March):431–82.
McCubbins MD and Schwartz T. 1984. ―Congressional Oversight Overlooked: Police
Patrols versus Fire Alarms,‖ American Journal of Political Science, 28:165–179.
Mikos R and Kam C. 2005. ―The Impact of Federalism on Citizen Support for
23
Legislative Action.‖ American Law and Economics Association Annual Meetings
Paper5. Available at http://law.bepress.com/alea/15th/art5.
Moe T. 1989. "The Politics of Bureaucratic Structure." In John E. Chubb and Paul E.
Peterson, eds., Can the Government Govern? Washington, D.C., The Brookings
Institution: 267-329.
Nathan RP. 2005. ―Dimensions of Change: Federalism and Health Policy,‖ Health
Affairs, 24(6):1458-1466.
Nice DC. 1987. Federalism: the politics of intergovernmental relations. New York, St.
Martin Press.
Nicholson-Crotty S. 2008. ―National Election Cycles and the Intermittent Political
Safeguards of Federalism.‖ Publius: The Journal of Federalism 38(2):295-314.
Oates WE. 2005. ―Toward and Second Generation Theory of Fiscal Federalism.‖
International Tax and Public Finance 12:349-73.
Olson M. 1969. ―The Principle of "Fiscal Equivalence": The Division of Responsibilities
among Different Levels of Government‖ American Economic Review 59:479-87.
Peterson PE. 1995. The Price of Federalism. Washington D.C., Brookings Institution.
Peterson PE. 1981. City Limits. Chicago, Illinois, University of Chicago Press.
Peterson PE, Rabe B, Wong K. 1986. When Federalism Works. Washington, D.C.,
Brookings Institution.
Potoski M and Woods N. 2002. ―Dimensions of State Environmental Policies: Air
Pollution Regulation in the United States,‖ Policy Studies Journal 30(2): 208-227.
Rabe B. 2008 ―States on Steroids: The Intergovernmental Odyssey of American Climate
Policy,‖ Review of Policy Research 25(2):105-128.
Ripley RB and Franklin GA. 1982. Bureaucracy and Policy Implementation.
Homewood, Illinois, Dorsey Press.
Schattschneider EE. 1975. The Semi-Sovereign People: A Realist’s View of Democracy
in America. Fort Worth, Texas, Harcourt Brace Jovanovich College Publishers.
Scheberle D. 2005. ―The Evolving Matrix of Environmental Federalism and
Intergovernmental Relationships,‖ Publius: The Journal of Federalism 35(1):69-86.
24
Scheiber HN. 1996. ―Redesigning the Architecture of Federalism: An American
Tradition: Modern Devolution Policies in Perspective,‖ Yale Law and Policy Review
14(2):227-296.
Shepsle KA. and Weingast BR. 1995. Positive Theories of Congressional Institutions.
Ann Arbor, Michigan, University of Michigan Press.
Stewart DO. 2011. ―Bankers Dance the Federalism Tango,‖ Huffington Post, posted
April 29, 2009 at http://www.huffingtonpost.com/david-o-stewart/bankers-dance-the-
federal_b_192665.html.
Tiebout CM. 1956. ―A Pure Theory of Local Expenditures‖ Journal of Political
Economy 64(5):416-24.
Ting MM. 2003. ―A Strategic Theory of Bureaucratic Redundancy‖ American Journal
of Political Science 47(2):274-292.
van Horn CE. 1979. Policy Implementation in the Federal System: National Goals and
Local Implementers. Lexington, Massachusetts, Lexington Books.
Volden C. 2005. ―Intergovernmental Political Competition in American Federalism.‖
American Journal of Political Science 49(2): 327-342
Walker JL, 1983. ―The Origins and Maintenance of Interest Groups in America,‖
American Political Science Review 77(2):390-406.
Weissert, CA. 2007. ―Dividing the Job Revisited: The United States Case 1789-2003,‖ in
Leonardi R and Pagano MA The Dynamics of Federalism in National and Supranational
Political Systems. Houndmills, UK, Palgrave Macmillan.
Wong K. 1994. ―Chapter 6: Governance Structure, Resource Allocation, and Equity
Policy,‖ Review of Research in Education 20(1): 257-290.
Wood BD and Waterman RW. 1991. ―The Dynamics of Political Control of the
Bureaucracy,‖ American Political Science Review 85(3):801-28.
Wright DE and Peddicord TE. 1973. Intergovernmental Relations in the United States:
selected books and documents on federalism and national-state-local relations.
Philadelphia, Pennsylvania, Center for the Study of Federalism, Temple University.
25
Chapter 2
A Theory of Intergovernmental Delegation
INTRODUCTION
Congress faces a federal policy design dilemma: how much authority should be
delegated to the states versus kept at the national level? Our current explanations fall
short because they neglect crucial features about the way in which Congress makes
policy decisions. These arguments about partisanship, policy type, or elections do not
include strategic delegation of authority, the institutional constraints of the House and the
Senate, and uncertainty over policy implementation. In this chapter I provide a
framework for understanding why Congress varies the intergovernmental architecture of
the policies it makes and include these features in my theory. I argue the answer to the
design dilemma lies in understanding that Congress perceives of itself as the principal
and the states and the national executive branch as potential agents. Congress determines
how much authority to delegate to the states by comparing the outcomes that would result
from giving the states more or less authority in a policy and chooses the delegation option
that provides the most preferred outcome, or the outcome closest to its ideal point.
To draw out the logic of this comparison, I present two formal theoretic models.
The first, which I refer to as the ―aggregate-level model,‖ uses a decision theoretic model
of a pivotal legislator in Congress deciding to delegate to state and national-level agents.
This model highlights the intergovernmental nature of delegation and provides a
26
perspective of how Congress as a whole makes federal design choices. Congress, though,
is made up of individual legislators representing their own states. I provide a foundation
for the aggregate model with an additional model of individual-level legislative behavior.
In this ―individual-level‖ model, I demonstrate how legislators coalesce to form
successful policy coalitions altering the degree of state responsibility in bills in the House
and in the Senate. These coalitions provide the key for understanding the implications of
the initial aggregate model, because they identify who, or more accurately what, is
pivotal. Together, the aggregate and individual-level models produce a set of hypotheses
about the conditions under which Congress will increase or decrease the authority
delegated to the states in national policy and how individual legislators vote with respect
to intergovernmental delegation. These models, though, are short-sighted in that they
deal only with one time period. I conclude this theoretical chapter by informally
discussing the impact of uncertainty over the future preferences of the implementing
agents on delegation choices.
There are three key components to the entire theory (the two models, plus
informal insights): preferences, intra-chamber congressional institutions, and electoral
uncertainty. The outcome of the aggregate model is straightforward—Congress prefers
to delegate to the closest agent. In other words, if the preference of Congress lines up
closer to those of the national executive branch, Congress prefers to centralize authority;
but when Congress is aligned more closely with the states, devolution to the states is the
preferred choice. These simple conclusions, though, result in non-intuitive results when
played out under different circumstances. For instance, contrary to the conventional
wisdom that Republicans devolve and Democrats centralize authority, there are
27
conditions under which Republican majorities choose to centralize authority with national
executive branch agencies and other conditions where Democrats prefer to devolve
authority to the states. In addition, my theory offers an explanation for differences in
authority delegation decisions across chambers of Congress.
My aggregate model hinges on a pivotal legislator in Congress. The pivotal
legislator represents the ―outcome of how individual legislator preferences and the
existing legislative institution [interact] to produce a single legislative preference
ordering over the possible alternatives‖ (100, Lupia and McCubbins 1994). Many
scholars assume this pivotal legislator is the median legislator and assume away how
legislative preferences are aggregated within the institutional constraints of Congress
(e.g., McCarty and Meirowitz 2007). The individual-level model explicitly considers
how policy coalitions form in the House and in the Senate given the possibility of
intergovernmental delegation and who is pivotal, or which legislator‘s ideal point will
determine voting outcomes, in each chamber. The focus on intergovernmental delegation
at the individual level highlights how legislators‘ intergovernmental context and
institutional rules of each chamber influence coalition formation and state authority
allocation.
This chapter proceeds as follows: I begin by discussing the assumptions and
elements of the aggregate model, provide its solution, and discuss the logically coherent
hypotheses that follow. Next, I build on the aggregate model and detail the set-up and
solution of the individual-level model in each chamber of Congress. This second model
offers additional hypotheses about the choices legislators make. Finally, I discuss the

28
importance of uncertainty about who will be in power in the states and in the national
executive branch during policy implementation.
FOUNDATIONAL ASSUMPTIONS
Before showing the aggregate model, I describe several key assumptions of both
formal models. These assumptions frame the discussion of the model because they
narrow the focus to the intergovernmental aspects of federal policy design.
Delegation
First, I assume Congress always delegates authority for policy.15
There may be
rare instances where the legislature does not delegate authority, such as in the declaration
of the Martin Luther King Jr. Public Holiday (PL 98-144) or the Civil Rights Restoration
Act of 1987 (PL 100-259). 16
For the most part, though, delegation occurs. The reasons
why Congress may delegate authority are wide ranging and include reliance on the
greater expertise of specialists to evaluate alternative policies, freeing up legislators‘ time
to engage in other activities (such as constituency service or campaigning), or shifting
blame to the administrators of the law instead of Congress (Kiewit and McCubbins 1991,
Weingast and Marshall 1988, Fiorina 1977)
This delegation assumption is in contrast to some scholars who assume Congress
makes a choice about whether or not to delegate (e.g., Weingast 1984 or Epstein and
O‘Halloran 1992). Epstein and O‘Halloran, for instance, provide a table of twenty-five
15
This is not to say that delegation means regulation. Instead, delegation could mean that an agent has
received authority for (or over) a variety of policy instruments including regulation, taxation, grants-in-aid,
etc. 16
For Martin Luther King Jr. Public Holiday, the law simply states that it is a public holiday. For the Civil
Rights Restoration Act, the text of the law defines what is meant by ―program or activity‖ in response to
Supreme Court decisions that ―unduly narrowed or cast doubt upon the broad application of title IX of the
Education Amendments of 1972, section 504 of the Rehabilitation Act of 1973, the Age Discrimination Act
of 1975, and title VI of the Civil Rights Act of 1964; and (2) legislative action is necessary to restore the
prior consistent and long-standing executive branch interpretation and broad, institution-wide application of
those laws as previously administered.‖ (PL 100-259, March 22, 1988).
29
acts with no executive delegation (95, 1992). According to the authors, this table
includes nineteen laws with no delegation and six with delegation to non-executive
branch actors. In this list they include the two laws mentioned above as well as Public
Health Cigarette Smoking Act of 1970 (PL 91-222),17
the State and Local Fiscal
Assistance Act of 1972 (PL 92-512), and the Fair Labor Standards Amendments of 1989
(PL 101-157).
A thorough reading of these three laws reveals delegation occurs in each case. In
the Public Health Cigarette Smoking Act, for instance, a national comprehensive labeling
program for cigarettes was established. The Federal Trade Commission (FTC) was then
constrained in its actions with respect to this law. The fact that the FTC‘s actions were
limited by the law implies that the FTC was involved in some way with its execution.18
In the State and Local Fiscal Assistance Act, the Secretary of the Treasury was put in
charge of considering state and local applications for money and transmitting it to
successful applicants (within specified boundaries of action) and the states (and local
units) were given broad authority to use the money for a variety of purposes.19
Finally, in
the Labor amendments, the Secretary of Labor was given constrained authority to
17
Although enrolled by Congress in 1969, President Nixon did not sign the bill into law until 1970. 18
Specifically, FTC actions related to cigarette advertising regulations could not occur before July 1, 1971.
After this date, the FTC had to notify Congress that it determined action was necessary with respect to the
regulation. This notification had to include the text of the regulation rule and ―a full statement of the basis
for such determination. No such trade regulation rule adopted in such proceeding may take effect until six
months after the Commission has notified the Congress of the text of such rule, in order that the Congress
may act if it so desires.‖ (Section 7a, PL 91-222, 1970). 19
―Except as otherwise provided in this title, the Secretary shall, for each entitlement period, pay out of the
Trust Fund to- (1) each State government a total amount equal to the entitlement of such State government
determined under section 107 for such period, and (2) each unit of local government a total amount equal to
the entitlement of such unit determined under section 108 for such period. … the Secretary of the Treasury
shall be the trustee of the Trust Fund and shall report to the Congress…‖ (Section 101-107, PL 92-512,
1972).
30
develop regulations within the definitions set by Congress.20
In sum, even in cases that
previous scholars consider non-delegation, Congress does in fact delegate.21
Not only does the legislature delegate authority, but I also assume it has
alternatives over the recipients of that authority, the states or the national executive
branch. Empirical evidence provided by Epstein and O‘Halloran (1999) demonstrate
Congress delegates to national-level actors (such as the Executive Office of the President
or cabinet departments) and state and local actors, to name a few. The focus of this
project is on that choice to include delegation to the states in national-level laws and how
much of the authority is delegated to the states. This delegation choice rests upon the
assumption that Congress is the principal and the states, the national executive branch, or
some combination of the two are potential agents. In other words, Congress can alter the
amount of authority delegated to the states versus kept at the national level along a
continuum. If all responsibility for a policy is delegated to national executive branch
actors, no authority is delegated to the states (and vice versa). Additionally, Congress
can delegate a portion of the authority to the states and the remaining amount to the
national executive branch. These design choices result in diverse outcomes since
different actors are involved to varying extents.
20
―If the Secretary determines that an employer has taken an action in violation of subparagraph (A), the
Secretary shall issue an order disqualifying such employer from employing any individual at such wage. …
The Secretary of Labor shall issue regulations defining the requisite proof required of an individual. Such
regulations shall establish minimal requirements for requisite proof and may prescribe that an accurate list
of the individual's employers and a statement of the dates and duration of employment with each employer
constitute requisite proof. ― (Sections 2-6, PL 101-157, 1989). 21
Moreover, the data coding process of this project (chapter 3) did not reveal any additional instances
where delegation did not occur. The differences between Epstein and O‘Halloran‘s coding of non-
delegation and my reading of the full text of the laws is most likely due to the coding process Epstein and
O‘Halloran used. Specifically, they relied on Congressional Quarterly Almanac (CQ) summaries of the
laws included in their analyses. In the data chapter, I discuss the problems that arose when I utilized these
same summaries and the reasons why I chose to use Congressional Research Service (CRS) summaries
instead. In brief, I found that CRS summaries consistently provided more specific information about what
entities were charged with implementation of which provisions than did the CQ summaries.
31
Yet, it is not obvious that Congress is in a position to require the states to
participate in national policy. Specifically, Article I, Sections 8 and 9 of the Constitution,
as well as the10th amendment, circumscribe the limited power of the national
government and the immeasurable, residual power of the states (and the people). The
flexibility of the Constitution, though, with respect to delegation of authority and
expansive federal judicial decisions have allowed national authority to extend across all
areas of policy (Posner 1998, Eskridge and Ferejohn 1994, Harvard Law Review 1994).
Furthermore, from the New Deal forward national dollars have become a crucial part of
state-level policy activities, giving Congress the power of the purse (Nathan 1983, Chubb
1985, Rosenthal 1987, Inman 1988 McCoy and Friedman 1988, Harvard Law Review
1994, Zimmerman 2005). This sprawl and brawn of the national legislature have offered
Congress the opportunity to consider itself as the principal—with the states and the
national executive branch as potential agents—while crafting policy.
Principal Agent Framework
Because Congress delegates authority and because the states and the national
executive branch have the potential to receive that authority, I stylize the relationship
among Congress, the national bureaucracy, and the states as a simplified principal agent
model. In a standard principal agent model, a principal faces a choice about how much
authority to delegate to an agent (e.g., see McCubbins, Noll, and Weingast 1987; 1989;
Lupia 2001; or Alesina and Tabellini 2005). Problematic is that an agent may implement
the policy in a way that is dissimilar from what Congress itself would have done had it
chosen to retain authority for the policy. Agency problems occur because the agent (the
entity given control over the policy) prefers to act on its own behalf instead of for
32
Congress. This could entail shirking (not doing the work required in the policy) or
bureaucratic drift (also known as slack or slippage) where the agent implements a policy
that differs from that enacted (Kiewiet and McCubbins 1991).
Principal-agent problems arise when the principal has incomplete information
about an agent‘s actions and the principal has preferences that diverge from the agent.
One solution is that the legislature, as the principal, can attempt to structure the policy
and delegation relationship in such a way as to create incentives for the agent to do
exactly what Congress would do if they could implement the policy on their own either
through ex ante or ongoing controls (e.g., see McCubbins, Noll, and Weingast 1987,
1989). A common arrangement is the inclusion of oversight and monitoring
mechanisms—either directly to Congress, via an advisory committee, or by the inclusion
of interest groups in agency decisions. Unfortunately, from Congress‘ perspective,
monitoring is never perfect and both slippage and shirking remain.
In my model, I assume complete information to focus specifically on the
influence of preference divergence across governmental levels.22
Congress, as the
principal, faces a choice between delegating policy authority to a national agent, a state
agent, or some combination of the two (what I refer to as joint partnership policies). In
essence, Congress can choose to centralize authority with a national executive branch
actor (e.g., the Department of Health and Human Services or the Environmental
Protection Agency) or devolve more authority to the states.
Although the principal agent model is a dominant choice of Congress-centric
bureaucratic delegation scholars, my application of it is new because I add the states as
22
Future work should incorporate incomplete information to assess the extent to which congressional
uncertainty over policy outcomes, for instance, influences intergovernmental delegation choices.
33
potential agents to specifically consider intergovernmental delegation. Just as in other
principal agent models, goal conflict between the principal and agent is an important
factor (Waterman and Meier 1998, Bendor, Glazer, and Hammond 2001). With respect
to goal conflict, Congress, the national executive branch, and the fifty states may all have
different preferences when it comes to what they consider ideal policy outcomes. For
instance, Congress may prefer a liberal policy, the national executive branch may favor a
conservative approach, and the states may be heterogeneous with some states preferring
extremes (liberal or conservative) and others wanting more centrist outcomes. The extent
to which the goals of these three sets of actors diverge varies over time.
Legislator Motivations
In addition to assumptions about delegation and the relationship and potential
challenges between the states and Congress, I assume individual legislators are motivated
by policy outcomes and concerns about re-election.23
Legislators make choices about
policies, but have personal preferences over the outcomes produced by these policies.
Outcomes are the result of the actions of agents (the states and the national executive
branch) assigned the authority to implement the policy. When the states are given more
authority, state-level actions more heavily influence policy outcomes than when the
national executive branch is given more authority. When both the states and the national
executive branch are given approximately the same amount of authority, their actions
weigh equally on the outcome. In terms of the outcomes legislators prefer, they may be
motivated by re-election or even personal policy preferences (Mayhew 1974, Arnold
23
In addition, in the individual-level model discussed later, legislators receive a utility boost from forming
a successful coalition with their co-partisans. Thus, legislators are also motivated by partisan preferences,
just not by assumption.
34
1990).24
Because legislators worry more proximally about re-election, though, and are
re-elected by their congressional district, legislators in the model consider only those
outcomes in their individual state.25
In other words, a legislator in Massachusetts almost
certainly cares more what happens in his state than what happens in Wyoming or
Georgia.26
Discretion and Implementation
In contrast to Huber and Shipan (2002), who rely on a principal agent model to
examine the factors that influence how legislatures craft the boundaries of agent
discretion, I assume agents implement their own ideal point.27
Huber and Shipan argue
that legislators deliberately craft the amount of discretion given to agencies conditioned
on an array of factors, such as policy preferences, technical complexity, legislative
capacity, and the political environment (2002). Discretion is how much leeway an actor
has to make choices, or ―the policy latitude intentionally left to executive agents in the
implementing legislation‖ (57, Epstein and O‘Halloran 1999). A consideration of
discretion presupposes an agent has the authority to make those choices in the first place.
Epstein and O‘Halloran describe the relationship such that the number and type of
24
These scholars also suggest legislators may be motivated by career advancement. In this study, I assume
re-election is the necessary condition for career advancement, and therefore, do not consider it as an
explicit motive. 25
District is equal to the entire state for senators and at large representatives. I consider alternatives such as
concern over all states, which is more similar to personal policy preferences in Chapter 4 and find that this
motivation is not supported by the data. 26
In a later chapter, I describe interviews I conducted with health policy staffers regarding the health
reform debate during the summer of 2010 in detail. Statements made by these elites emphasized how
outcomes in their states were foremost in the minds of legislators as they constructed health reform
proposals, corroborating this assumption. Although legislators were interested in national outcomes, they
focused mainly on the policy outcomes that would occur in their state as they crafted the various provisions
of the health reform bills. In addition, getting re-elected (and the fact that outcomes were related to
elections) was listed as a concern. 27
Other well-known models considering agent discretion include Epstein and O‘Halloran (1999) or Bawn
(1995).
35
constraints on an agent‘s authority are inversely related to the amount of discretion an
agent has.
By assuming total discretion, my model fails to capture the effect of discretion on
implementation. What it does portray, nevertheless, is that Congress delegates contingent
on the knowledge the agent will implement its ideal point. This does not mean to say that
Congress has no disciplinary actions that could be utilized. With respect to the national
bureaucracy, for instance, punishment can include forcing oversight hearings, reducing
budgets, amending legislation, etc. (Aberbach 1990, 2002). Congress also has fiscal
power with respect to the states. National dollars are doled out to states in a variety of
ways, including grants-in-aid and direct budget allocations for inter-governmental
programs. The legislature can add crossover sanctions or crosscutting requirements to
grants-in-aid or they can eliminate or reduce direct allocations to punish deviators, or
those who do not implement in the way the legislature wants (Posner 1998, Zimmerman
2005).28
The ability to punish, though, must be backed up with the capacity and
willingness to monitor missteps and appropriately administer the penalty.
By assuming full agent discretion, I assume Congress cannot monitor or
appropriately punish the offender(s). There are myriad reasons for this inability. For
example, although Congress has hearings, crossover sanctions, and so forth, it cannot
effectively monitor all fifty states. And, oversight of the relationships among these fifty
states and the national executive branch is also extremely difficult, if not impossible. My
assumption matches empirical insights that the states are often able to find loopholes or
just simply do what they want in national programs (Anton 1997). In addition, Congress
28
Posner defines crosscutting requirements as conditions that cut across all or most grants (as of Posner‘s
1998 book, the Office of Management and Budget had categorized 60 different cross-cutting requirements).
Crossover sanctions are when mandates for states are sanctioned by removal of assistance.
36
may have difficulty determining whether national executive branch actions or state
behaviors were outside the bounds of discretion. Moreover, a new policymaking
coalition with different preferences—unwilling to punish deviators from the previous
policy—may exist at the national-level. As a result of this assumption, this model
focuses on the intergovernmental aspects of delegation, not on the degree of discretion
the agents have to exercise that authority. 29
Federalism Beliefs
I also assume legislators are not motivated by beliefs about federalism or
upholding the appropriate balance of state and national constitutional authority, where the
central government has limited and defined authority and the states have less restrained
residual powers.30 This assumption is supported by Nice (1987), who demonstrates that
policy actors focusing on states‘ rights or decentralized policy at one time in one policy
area are found to advocate for national policy at another time in the same area.
Alternatively, he finds those same actors vigorously opposing centralization in one policy
will demand it in another (Nice 1987). Nathan (2005) also states ―[w]here one stands [on
federalism] depends on where one has power. Although it might be easier and more
efficient for a political faction to advance its goals centrally, when one‘s faction is out of
power at the center, it is equally logical to advance them from the periphery‖ (1459).
Other scholars‘ support for a federalism belief includes an experiment and
partisan platform statements. Specifically, Mikos and Kam conduct an experiment that
Nicolson-Crotty (2008) uses to support preferences over federalism. Mikos and Kam
29
Future work should consider the influence of discretion on intergovernmental authority delegation—
including the variation in monitoring difficulty between the national executive branch and the states and the
difference in the power that the states versus the national executive branch may have to reject the dictates
of Congress. 30
Although I do not include federalism beliefs theoretically, I assess them empirically in Chapter 4.
37
demonstrated that subjects‘ a priori beliefs about federalism were activated when
exposed to an argument about physician-assisted suicide and state-rights (2007). This
activation may have been more about morality than federalism. The federalism treatment
in the experiment included mention of abortion as well as other medical procedures.
Furthermore, legislators may have a different perception of federalism than citizens,
given their occupational exposure to intergovernmental affairs. In my health policy
interviews, for example, one respondent said, ―We don‘t talk about whether a policy fits
with beliefs about federalism‖ and another commented that experts—including the
parliamentarians and constitutional scholars—helped to refine the language of the law to
fit within the constraints of the Constitution.
Finally, a review of party platforms over the last forty years reveals ambiguity in
how states‘ rights, big government, and even grants-in-aid are discussed from a
federalism perspective, leaving room and rhetoric upon which a legislator could build an
argument about why delegation to the national executive branch (centralizing authority)
is within their own party‘s principles. For instance, in 1964 the language of the
Republican party‘s platform read: ―Within our Republic the Federal Government should
act only in areas where it has Constitutional authority to act, and then only in respect to
proven needs where individuals and local or state governments will not or cannot
adequately perform‖ (Republican Platform 1964). Whereas the Democratic platform of
the same year uses the following language: ―The Democratic Party holds to the belief
that government in the United States—local, state and federal—was created in order to
serve the people. Each level of government has appropriate powers and each has specific
responsibilities. The first responsibility of government at every level is to protect the
38
basic freedoms of the people. No government at any level can properly complain of
violation of its power, if it fails to meet its responsibilities. The federal government exists
not to grow larger, but to enlarge the individual potential and achievement of the people.
The federal government exists not to subordinate the states, but to support them‖
(Democratic Platform 1964).31
No specific beliefs about federalism are clearly stated in
either platform. The 1964 Republican platform offers rhetoric both for why Congress
could centralize authority (inadequate performance) and why Congress could choose to
decentralize (constitutional constraints on action). The 1964 Democratic platform
similarly offers ambiguous support for legislators‘ positions on centralization or
decentralization—failure to meet responsibilities versus appropriate powers of each level
of government.
In sum, party platforms and fundamental beliefs about federalism and the
horizontal division of authority in the U.S. do not provide a solid foundation for choices
about whether to delegate authority to the states, to the national executive branch, or to
both through a joint partnership. Instead, legislators can use rhetoric to support almost
any delegation choice. For these reasons, I stylize the motivation of Congress as that of
re-election. In the following sections, I build on these assumptions and consider the
influence of preferences and, later, electoral uncertainty on intergovernmental delegation
of authority choices in a formal decision theoretic model and a coalition bargaining
model.
31
More recent platforms indicate a continuation of the same rhetoric: ―Republicans will uphold and defend
our party's core principles: Constrain the federal government to its legitimate constitutional functions
―(Republican Platform 2008). ―Given the economic crisis across the country, states, and territories today
face serious difficulties…states have had to innovate and take matters into their own hands—and they have
done an extraordinary job. Yet they should not have to do it alone…We will give these governmental
entities a partner in the federal government‖ (Democratic Platform 2008).
39
THE MODELS
Aggregate Model of Congress
In the aggregate model of Congress, the players include a unitary Congress,
represented by a pivotal legislator, L, the pivotal legislator‘s state, S, and the national
executive branch, N. Congress makes decisions about how much authority to delegate to
the states, or α, versus delegate to the national executive branch, or 1-α. Although the
pivotal legislator in Congress makes a choice over α, he has preferences over policy
outcomes, x. Policy outcomes are the result of how much authority state and national
actors have in a policy; specifically, , where S represents the ideal
point of the pivotal legislator‘s state and N the ideal point of the national executive
branch.
I theorize when faced with the federal design dilemma, Congress ponders the
potential outcomes that would result from delegation directly to the states, delegation
directly to the national executive branch, and delegation simultaneously to both before
making a decision about how to structure authority in the policy. The best possible
policy outcome for Congress is defined as the delegation choice that yields an outcome as
close to a pivotal legislator‘s ideal point (or the pivotal legislator‘s most preferred
outcome) as possible.
The pivotal legislator‘s utility is a quadratic loss function, ,
where L is the legislator‘s ideal point.32
Thus, a pivotal legislator prefers policy
outcomes closer to his ideal point to those farther away. As described above, the policy
outcome is simply a weighted combination of the pivotal legislator‘s state‘s actions and
32
In fact, I assume all legislators in Congress have this same utility function. I consider how utility
maximizing individual legislators in Congress coalesce in the next model.
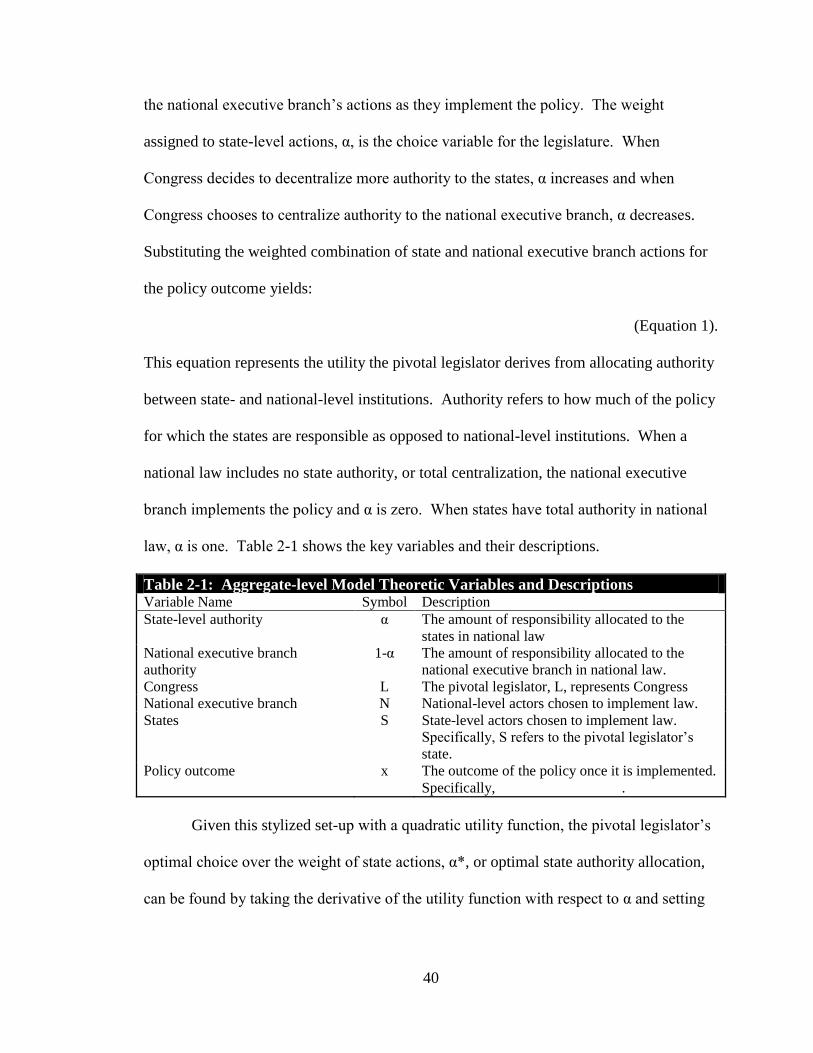
40
the national executive branch‘s actions as they implement the policy. The weight
assigned to state-level actions, α, is the choice variable for the legislature. When
Congress decides to decentralize more authority to the states, α increases and when
Congress chooses to centralize authority to the national executive branch, α decreases.
Substituting the weighted combination of state and national executive branch actions for
the policy outcome yields:
(Equation 1).
This equation represents the utility the pivotal legislator derives from allocating authority
between state- and national-level institutions. Authority refers to how much of the policy
for which the states are responsible as opposed to national-level institutions. When a
national law includes no state authority, or total centralization, the national executive
branch implements the policy and α is zero. When states have total authority in national
law, α is one. Table 2-1 shows the key variables and their descriptions.
Table 2-1: Aggregate-level Model Theoretic Variables and Descriptions
Variable Name Symbol Description
State-level authority α The amount of responsibility allocated to the
states in national law
National executive branch
authority
1-α The amount of responsibility allocated to the
national executive branch in national law.
Congress L The pivotal legislator, L, represents Congress
National executive branch N National-level actors chosen to implement law.
States S State-level actors chosen to implement law.
Specifically, S refers to the pivotal legislator‘s
state.
Policy outcome x The outcome of the policy once it is implemented.
Specifically, .
Given this stylized set-up with a quadratic utility function, the pivotal legislator‘s
optimal choice over the weight of state actions, α*, or optimal state authority allocation,
can be found by taking the derivative of the utility function with respect to α and setting
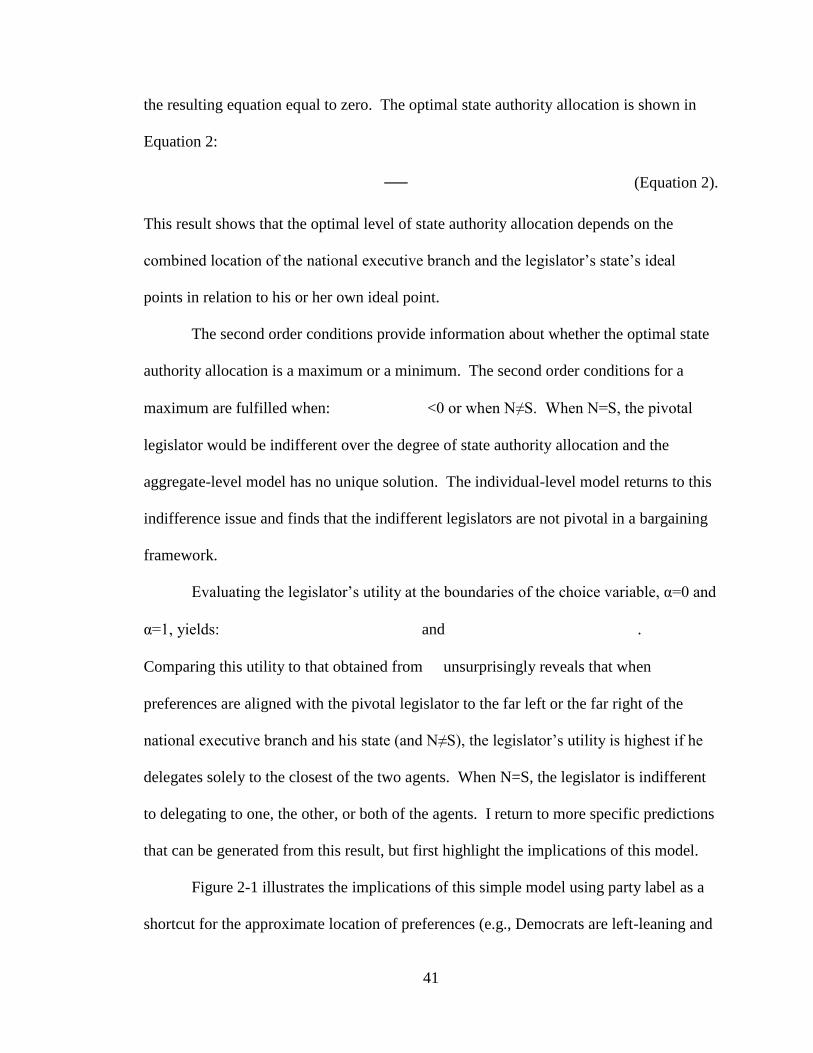
41
the resulting equation equal to zero. The optimal state authority allocation is shown in
Equation 2:
(Equation 2).
This result shows that the optimal level of state authority allocation depends on the
combined location of the national executive branch and the legislator‘s state‘s ideal
points in relation to his or her own ideal point.
The second order conditions provide information about whether the optimal state
authority allocation is a maximum or a minimum. The second order conditions for a
maximum are fulfilled when: <0 or when N≠S. When N=S, the pivotal
legislator would be indifferent over the degree of state authority allocation and the
aggregate-level model has no unique solution. The individual-level model returns to this
indifference issue and finds that the indifferent legislators are not pivotal in a bargaining
framework.
Evaluating the legislator‘s utility at the boundaries of the choice variable, α=0 and
α=1, yields: and .
Comparing this utility to that obtained from unsurprisingly reveals that when
preferences are aligned with the pivotal legislator to the far left or the far right of the
national executive branch and his state (and N≠S), the legislator‘s utility is highest if he
delegates solely to the closest of the two agents. When N=S, the legislator is indifferent
to delegating to one, the other, or both of the agents. I return to more specific predictions
that can be generated from this result, but first highlight the implications of this model.
Figure 2-1 illustrates the implications of this simple model using party label as a
shortcut for the approximate location of preferences (e.g., Democrats are left-leaning and
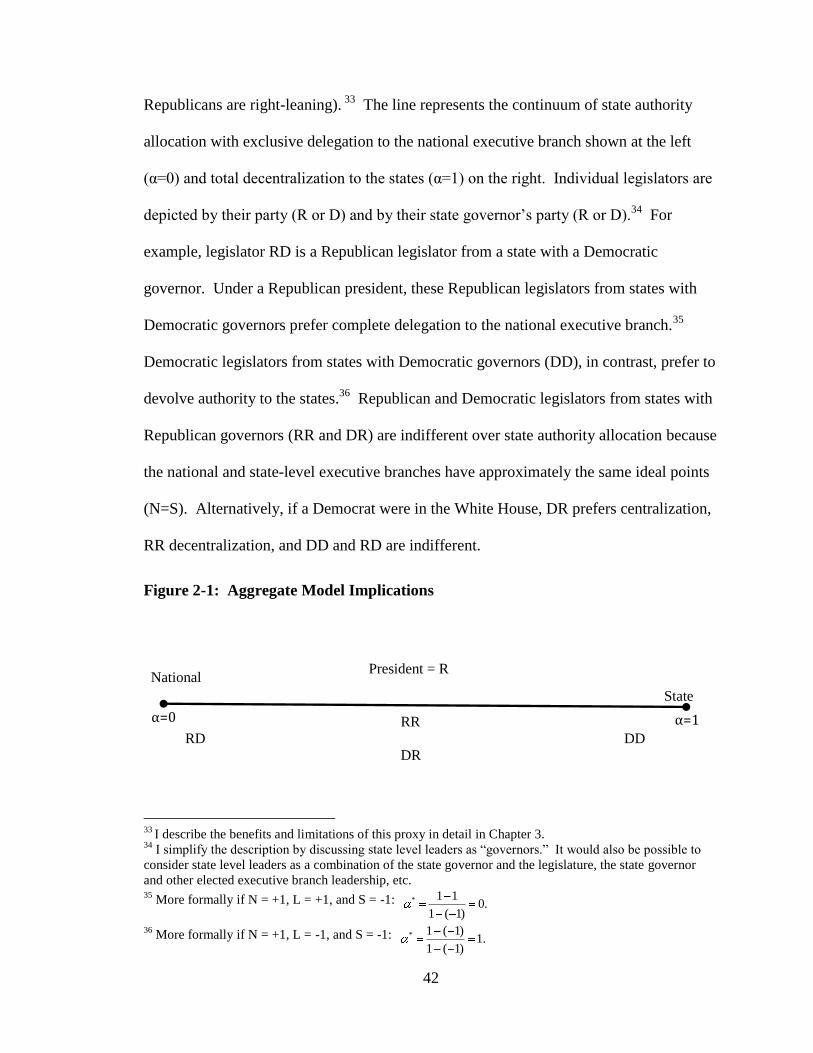
42
Republicans are right-leaning). 33
The line represents the continuum of state authority
allocation with exclusive delegation to the national executive branch shown at the left
(α=0) and total decentralization to the states (α=1) on the right. Individual legislators are
depicted by their party (R or D) and by their state governor‘s party (R or D).34
For
example, legislator RD is a Republican legislator from a state with a Democratic
governor. Under a Republican president, these Republican legislators from states with
Democratic governors prefer complete delegation to the national executive branch.35
Democratic legislators from states with Democratic governors (DD), in contrast, prefer to
devolve authority to the states.36
Republican and Democratic legislators from states with
Republican governors (RR and DR) are indifferent over state authority allocation because
the national and state-level executive branches have approximately the same ideal points
(N=S). Alternatively, if a Democrat were in the White House, DR prefers centralization,
RR decentralization, and DD and RD are indifferent.
Figure 2-1: Aggregate Model Implications
33
I describe the benefits and limitations of this proxy in detail in Chapter 3. 34
I simplify the description by discussing state level leaders as ―governors.‖ It would also be possible to
consider state level leaders as a combination of the state governor and the legislature, the state governor
and other elected executive branch leadership, etc. 35
More formally if N = +1, L = +1, and S = -1: .0)1(1
11*
36 More formally if N = +1, L = -1, and S = -1: .1
)1(1
)1(1*
National
State
α=0 α=1
DD
RR
RD
DR
President = R
43
Table 2.2 provides detail about the frequency with which the partisanship of
members of Congress does not match that of their governors, or how often we see RD
and DR legislators. I obtained the partisanship and state of individual legislators from
Congress from Voteview.com and matched these to the partisanship of their states‘
governors from the National Governors Association website for 1973 through 2010. On
average, the mismatch rate is 48% in both the Senate and the House, ranging from a high
of 57% in the Senate (2003) and 53% in the House (1997-2000 and 2004) to a low of
39% (2009) and 35% (1977-78) in the Senate and House respectively.
Table 2-2: Match Between Party of Legislator and of State
Governor by Year for Selected Years
Year
Same
Party
Different
Party
%
Mismatch
Same
Party
Different
Party
%
Mismatch
Senate House
1973 53 47 47% 224 210 48%
1976 50 50 50% 256 178 41%
1977 56 44 44% 284 150 35%
1978 56 44 44% 282 152 35%
1983 54 46 46% 232 202 47%
1984 57 43 43% 236 198 46%
1985 53 47 47% 227 207 48%
1990 57 42 42% 228 205 47%
1995 54 46 46% 207 227 52%
1996 50 50 50% 208 226 52%
1997 47 53 53% 202 232 53%
1998 47 53 53% 202 232 53%
1999 48 52 52% 206 228 53%
2000 46 54 54% 206 228 53%
2001 52 48 48% 214 220 51%
2002 52 48 48% 211 223 51%
2003 43 57 57% 215 219 50%
2004 47 53 53% 204 230 53%
2005 49 51 51% 209 225 52%
2006 49 51 51% 209 225 52%
2007 57 43 43% 234 201 46%
2008 54 46 46% 219 215 50%
2009 61 39 39% 234 200 46%
2010 57 43 43% 230 203 47%
Total 1,977 1,821 3,798 8,557 7,934 16,491
52.05% 47.95% 51.89% 48.11%
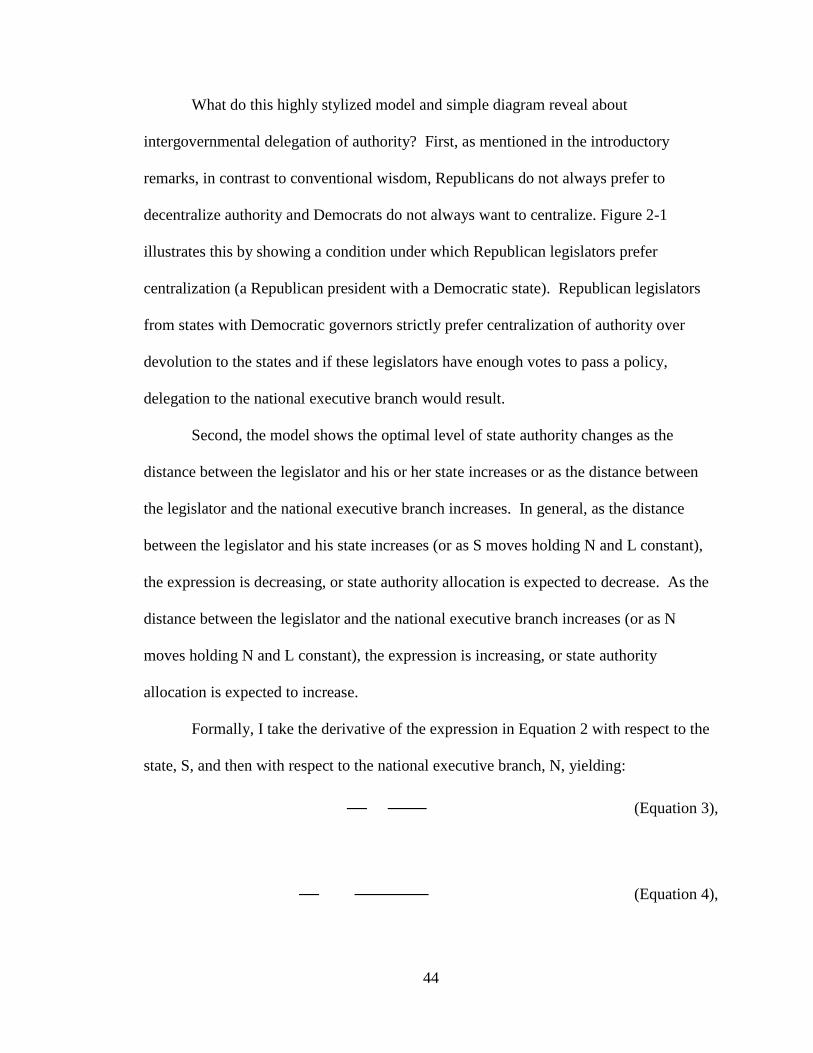
44
What do this highly stylized model and simple diagram reveal about
intergovernmental delegation of authority? First, as mentioned in the introductory
remarks, in contrast to conventional wisdom, Republicans do not always prefer to
decentralize authority and Democrats do not always want to centralize. Figure 2-1
illustrates this by showing a condition under which Republican legislators prefer
centralization (a Republican president with a Democratic state). Republican legislators
from states with Democratic governors strictly prefer centralization of authority over
devolution to the states and if these legislators have enough votes to pass a policy,
delegation to the national executive branch would result.
Second, the model shows the optimal level of state authority changes as the
distance between the legislator and his or her state increases or as the distance between
the legislator and the national executive branch increases. In general, as the distance
between the legislator and his state increases (or as S moves holding N and L constant),
the expression is decreasing, or state authority allocation is expected to decrease. As the
distance between the legislator and the national executive branch increases (or as N
moves holding N and L constant), the expression is increasing, or state authority
allocation is expected to increase.
Formally, I take the derivative of the expression in Equation 2 with respect to the
state, S, and then with respect to the national executive branch, N, yielding:
(Equation 3),
(Equation 4),
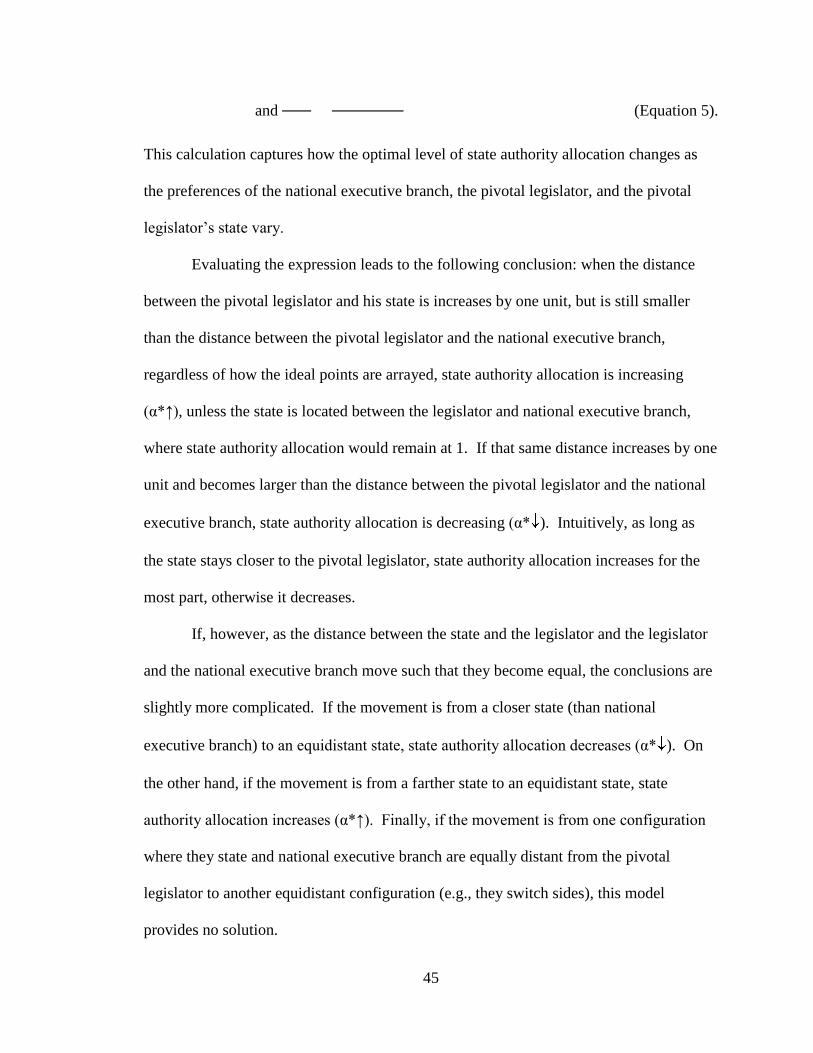
45
and (Equation 5).
This calculation captures how the optimal level of state authority allocation changes as
the preferences of the national executive branch, the pivotal legislator, and the pivotal
legislator‘s state vary.
Evaluating the expression leads to the following conclusion: when the distance
between the pivotal legislator and his state is increases by one unit, but is still smaller
than the distance between the pivotal legislator and the national executive branch,
regardless of how the ideal points are arrayed, state authority allocation is increasing
(α*↑), unless the state is located between the legislator and national executive branch,
where state authority allocation would remain at 1. If that same distance increases by one
unit and becomes larger than the distance between the pivotal legislator and the national
executive branch, state authority allocation is decreasing (α* ). Intuitively, as long as
the state stays closer to the pivotal legislator, state authority allocation increases for the
most part, otherwise it decreases.
If, however, as the distance between the state and the legislator and the legislator
and the national executive branch move such that they become equal, the conclusions are
slightly more complicated. If the movement is from a closer state (than national
executive branch) to an equidistant state, state authority allocation decreases (α* ). On
the other hand, if the movement is from a farther state to an equidistant state, state
authority allocation increases (α*↑). Finally, if the movement is from one configuration
where they state and national executive branch are equally distant from the pivotal
legislator to another equidistant configuration (e.g., they switch sides), this model
provides no solution.
46
If I assume a pivotal legislator represents the decisions of Congress, these
comparative statics yield the first two testable hypotheses:
Hypothesis 1: As the distance between the pivotal legislator and his state
increases, state authority allocation decreases except when the distance
between that legislator and the national executive branch is greater.
Hypothesis 2: As the distance between the pivotal legislator and the
national executive branch increases, state authority allocation increases
except when the distance between that legislator and his state is greater.
The aggregate model allows for a focus on intergovernmental delegation by
incorporating the states into a principal agent decision theoretic model of Congress and
offers a set of testable hypotheses. Yet, the question remains, who is pivotal? The figure
and the model reveal that there are four types of legislators in Congress with distinct
preferences over state authority allocation. I refer to these four categories of legislators
as intergovernmental teams. In a legislature in which one of these four
intergovernmental teams has the majority, the choice over state authority allocation
would be that team‘s α*, as that team is pivotal. But, in a legislature in which one team
does not have the majority, what is the choice? Returning to Figure 2-1, if RD must
partner with another intergovernmental team to successfully pass a bill (i.e. forms a
majority coalition), there are three choices: RR, DR, and DD. A bargain must be struck
with at least one, if not more of the other intergovernmental teams to pass a bill.
Therefore, I rely on a bargaining game with complete information and utility
maximization as before to structure a consideration of how these four teams would
coalesce around a bill.
47
Individual-level Bargaining Model37
In this individual-level model of legislative coalition formation between the four
intergovernmental teams, I rely on the same variables used in the aggregate model, with a
few notable additions as listed in Table 2-3. Specifically, the individual-level model
includes the previous variables plus a status quo level of state authority allocation, q, a
partisan benefit term, P, a transaction cost of making proposals, kn, a frequency of each
intergovernmental team in a chamber, wi, and a majoritarian threshold for a chamber, M,
or the number of legislators needed to successfully pass a policy. In addition, I utilize
party A to represent the majority party and party B for the minority party.
There are also four additional assumptions needed. First, given the power and
committee leadership positions of the majority party, I assume majority teams have
agenda control and the initial proposal power, but that minority teams are free to reject
initial offers and respond with an alternative offer. This is a one-period bargaining game,
but teams that receive the initial offer have the opportunity to make an alternative offer to
any of the other teams. Instead of an ultimatum game, though, this structure represents
both the agenda power of the majority party and the potential for political maneuvering of
the other members of Congress. Second, I assume voting in the House can be stylized as
a simple majority, but the Senate must be concerned about the ability to invoke cloture
(reach 60 votes) given the possibility of a filibuster, represented by M, the majority
threshold, in the game. This assumption is not to say that filibusters must always occur in
the Senate, just that the threat of them carries weight in the coalition formation process.
37
This coalition model is loosely based on Lupia and Strom‘s model of coalition bargaining and
termination (1995). The Lupia Strom model begins with an exogenous event and includes complete
information regarding setting up a coalition government with different partners. I substitute the quadratic
utility function typical of U.S. delegation models and include linear transaction costs and partisan benefit.
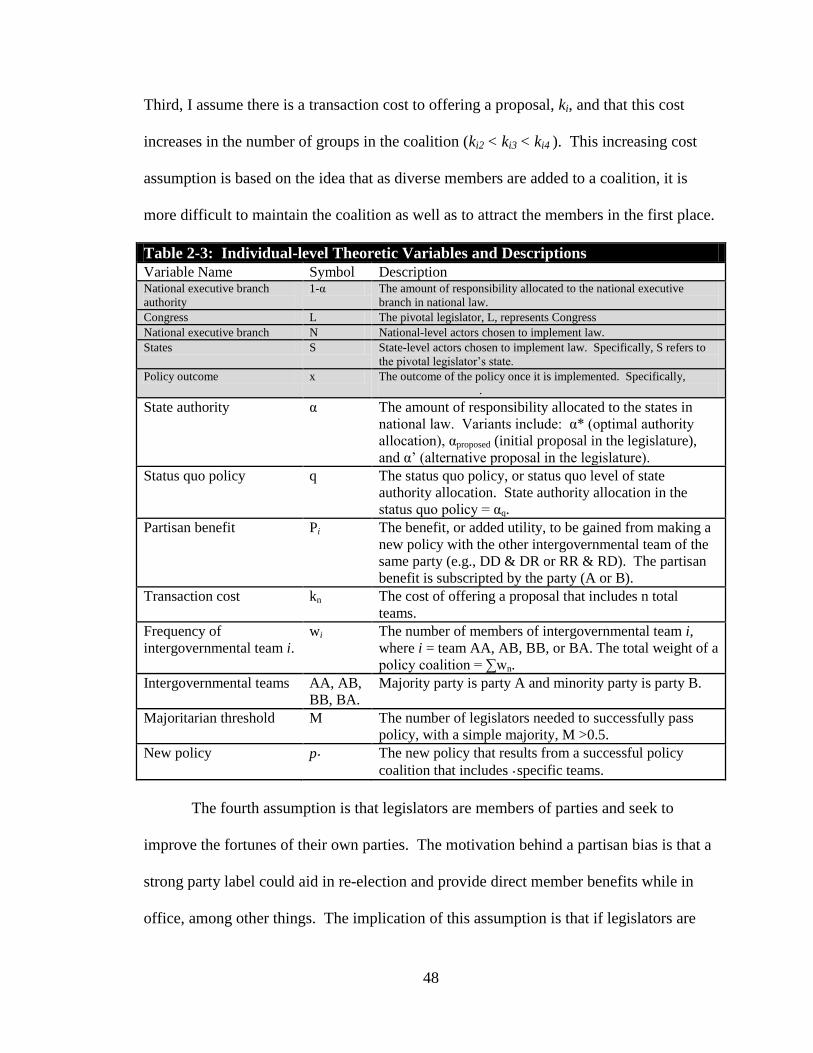
48
Third, I assume there is a transaction cost to offering a proposal, ki, and that this cost
increases in the number of groups in the coalition (ki2 < ki3 < ki4 ). This increasing cost
assumption is based on the idea that as diverse members are added to a coalition, it is
more difficult to maintain the coalition as well as to attract the members in the first place.
Table 2-3: Individual-level Theoretic Variables and Descriptions
Variable Name Symbol Description National executive branch
authority
1-α The amount of responsibility allocated to the national executive
branch in national law.
Congress L The pivotal legislator, L, represents Congress
National executive branch N National-level actors chosen to implement law.
States S State-level actors chosen to implement law. Specifically, S refers to
the pivotal legislator‘s state.
Policy outcome x The outcome of the policy once it is implemented. Specifically,
.
State authority α The amount of responsibility allocated to the states in
national law. Variants include: α* (optimal authority
allocation), αproposed (initial proposal in the legislature),
and α‘ (alternative proposal in the legislature).
Status quo policy q The status quo policy, or status quo level of state
authority allocation. State authority allocation in the
status quo policy = αq.
Partisan benefit Pi The benefit, or added utility, to be gained from making a
new policy with the other intergovernmental team of the
same party (e.g., DD & DR or RR & RD). The partisan
benefit is subscripted by the party (A or B).
Transaction cost kn The cost of offering a proposal that includes n total
teams.
Frequency of
intergovernmental team i.
wi The number of members of intergovernmental team i,
where i = team AA, AB, BB, or BA. The total weight of a
policy coalition = ∑wn.
Intergovernmental teams AA, AB,
BB, BA.
Majority party is party A and minority party is party B.
Majoritarian threshold M The number of legislators needed to successfully pass
policy, with a simple majority, M >0.5.
New policy p° The new policy that results from a successful policy
coalition that includes ° specific teams.
The fourth assumption is that legislators are members of parties and seek to
improve the fortunes of their own parties. The motivation behind a partisan bias is that a
strong party label could aid in re-election and provide direct member benefits while in
office, among other things. The implication of this assumption is that if legislators are
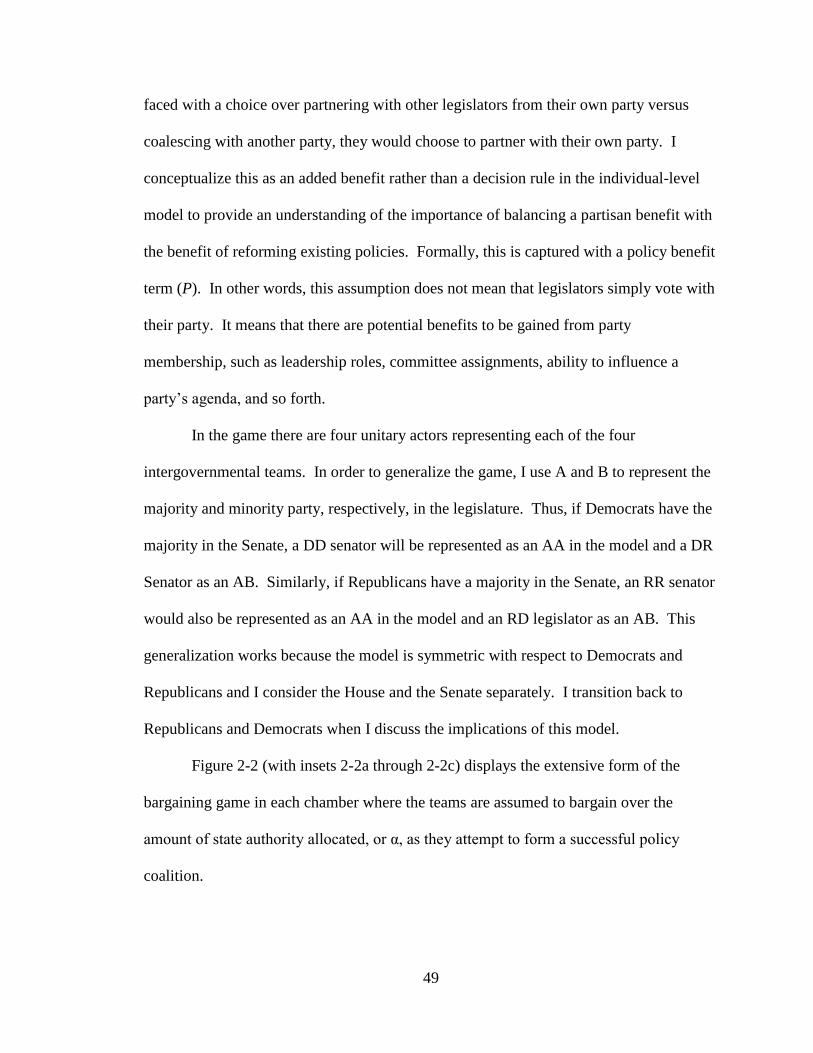
49
faced with a choice over partnering with other legislators from their own party versus
coalescing with another party, they would choose to partner with their own party. I
conceptualize this as an added benefit rather than a decision rule in the individual-level
model to provide an understanding of the importance of balancing a partisan benefit with
the benefit of reforming existing policies. Formally, this is captured with a policy benefit
term (P). In other words, this assumption does not mean that legislators simply vote with
their party. It means that there are potential benefits to be gained from party
membership, such as leadership roles, committee assignments, ability to influence a
party‘s agenda, and so forth.
In the game there are four unitary actors representing each of the four
intergovernmental teams. In order to generalize the game, I use A and B to represent the
majority and minority party, respectively, in the legislature. Thus, if Democrats have the
majority in the Senate, a DD senator will be represented as an AA in the model and a DR
Senator as an AB. Similarly, if Republicans have a majority in the Senate, an RR senator
would also be represented as an AA in the model and an RD legislator as an AB. This
generalization works because the model is symmetric with respect to Democrats and
Republicans and I consider the House and the Senate separately. I transition back to
Republicans and Democrats when I discuss the implications of this model.
Figure 2-2 (with insets 2-2a through 2-2c) displays the extensive form of the
bargaining game in each chamber where the teams are assumed to bargain over the
amount of state authority allocated, or α, as they attempt to form a successful policy
coalition.
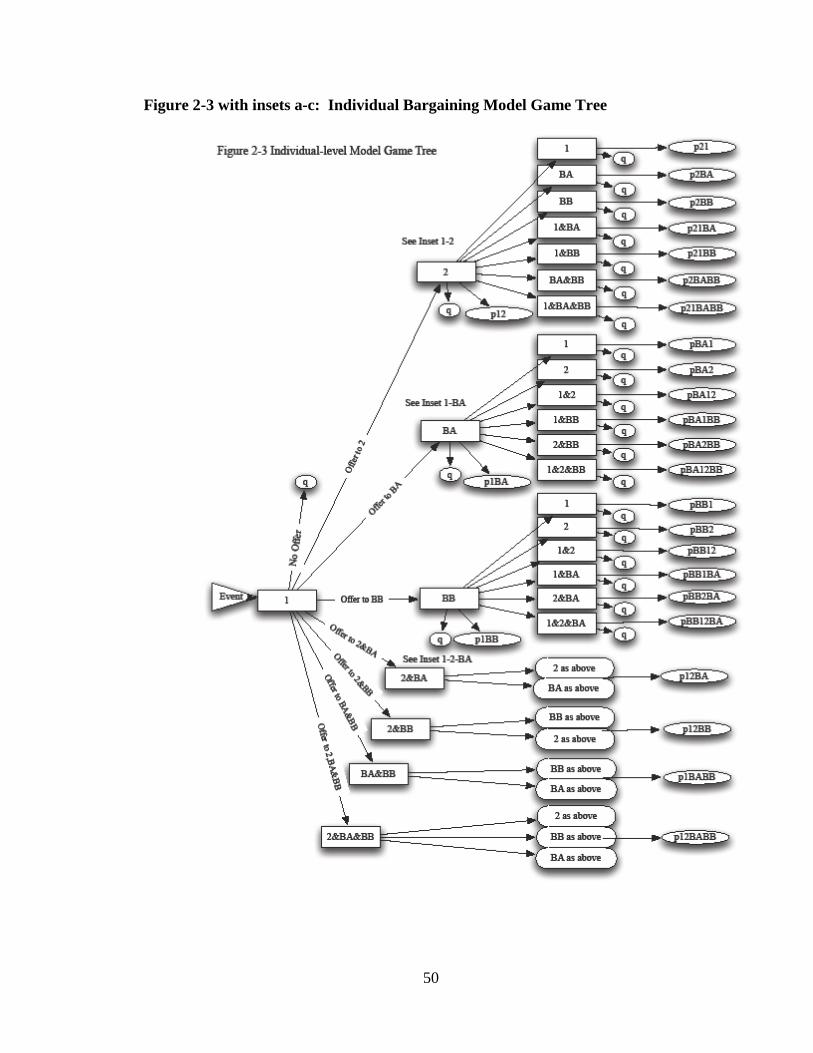
50
Figure 2-3 with insets a-c: Individual Bargaining Model Game Tree
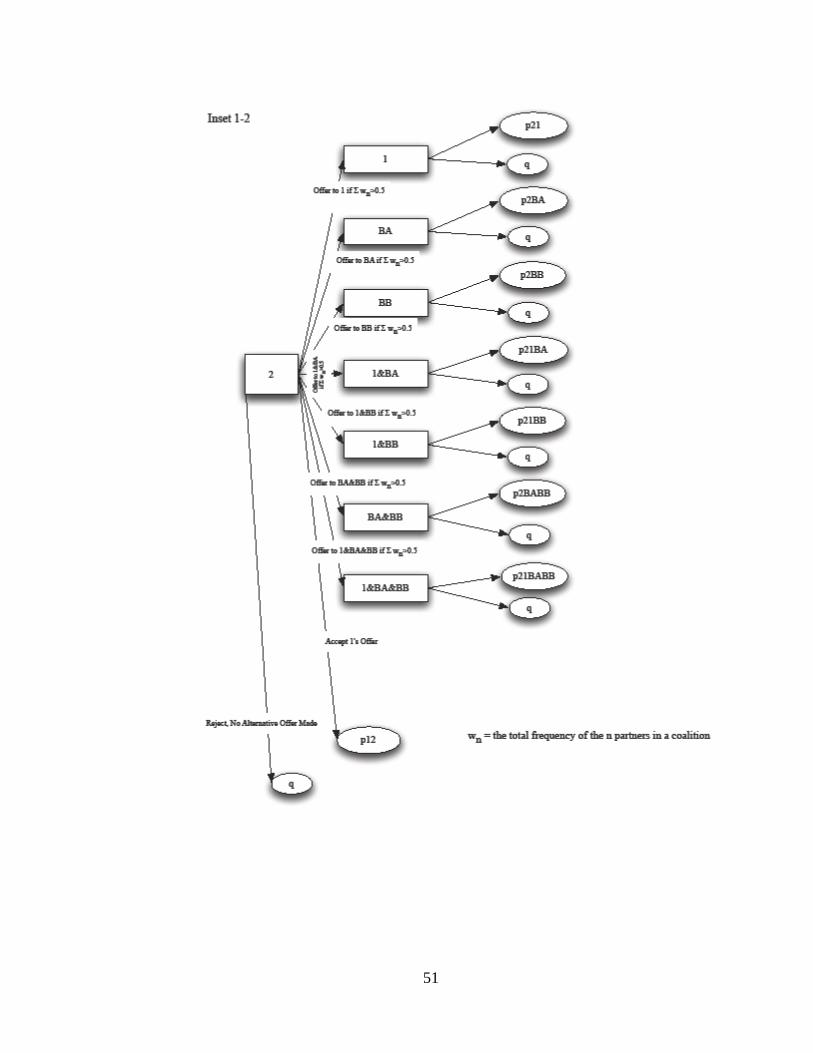
51
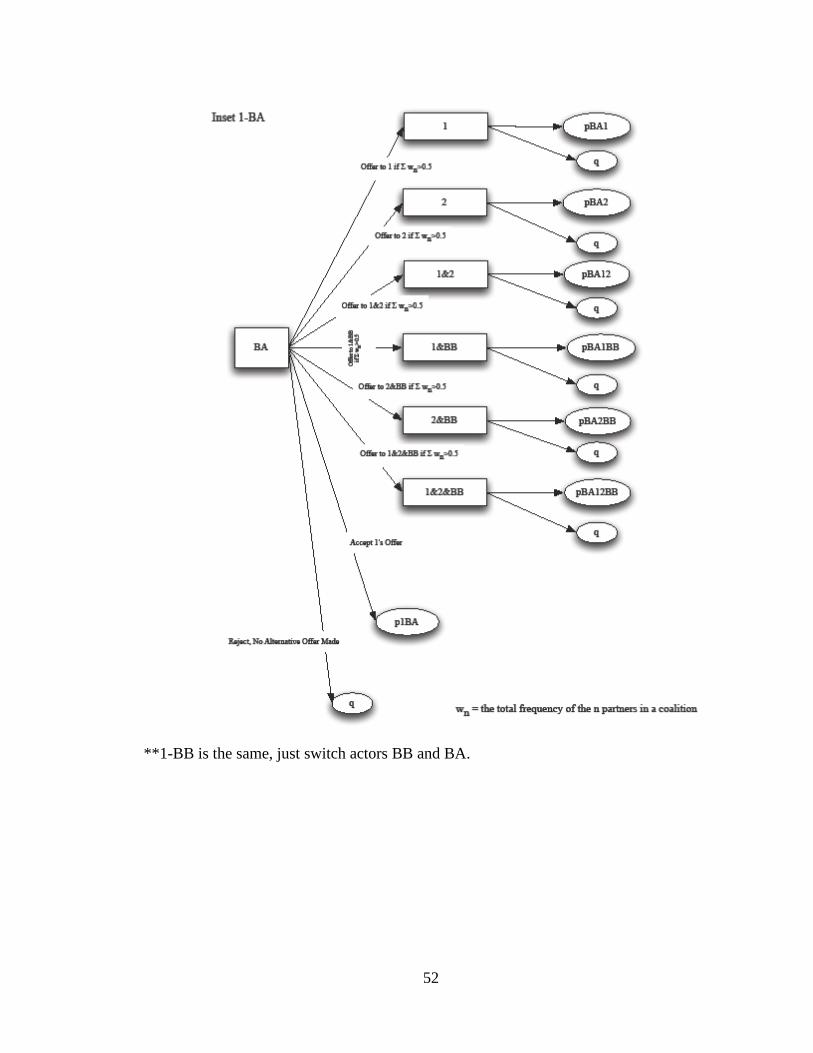
52
**1-BB is the same, just switch actors BB and BA.
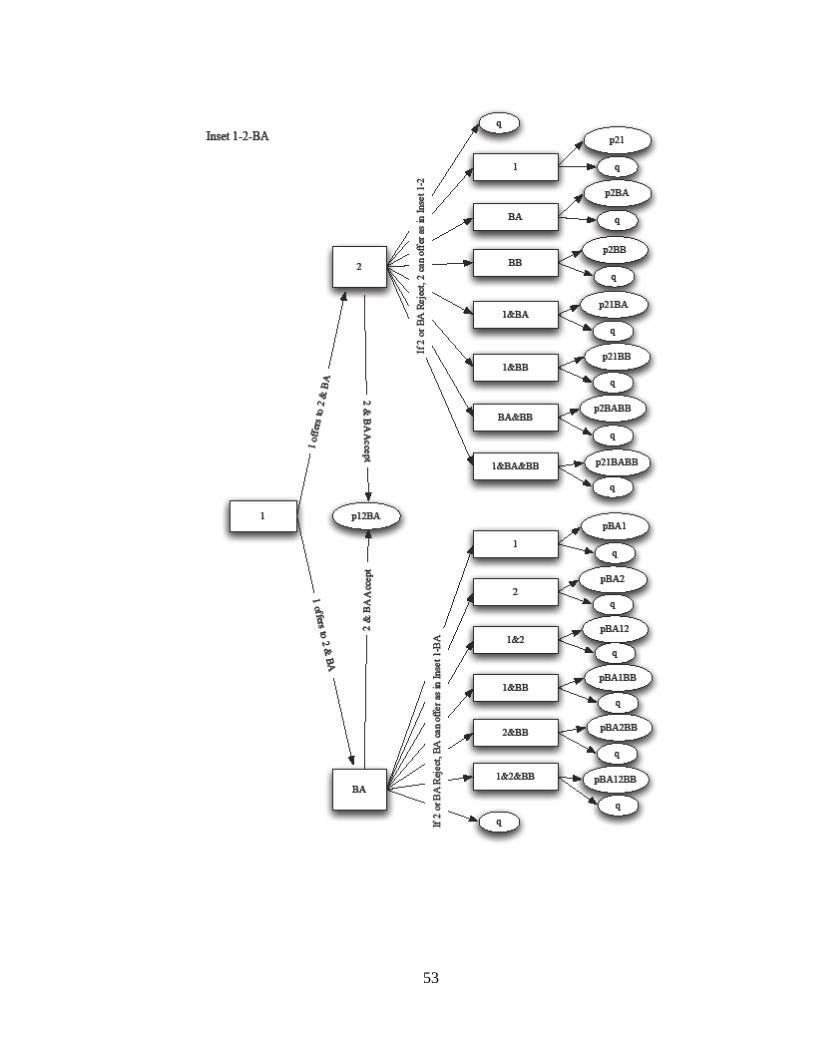
53
54
The unitary actors (more specifically, the intergovernmental teams) make an offer
to one or more of the other actors (where wi + wj + wk +… ≥ M and w is the frequency of
the intergovernmental team for that time period). The other team(s) can accept or reject
the offer. If a team j accepts the offer from team i, and wi + wj ≥ M, the new policy is
passed, the new allocation of authority is implemented, outcomes and payoffs are
realized. If the team rejects the offer, that team has the option of making an offer to any
of the other team(s) or making no offer in favor of the status quo. If more than one team
receives an offer, the offer is only successful and outcomes and payoffs realized if wi +
wj + wk + … ≥ M and all of the teams receiving the offer accept. If any one team rejects
the multiple-team offer, all of the teams receiving the offer have the option of making
offers to any one or more of the teams. If no teams form a policy coalition, the status
quo, q, prevails. If any one team forms the majority requirement on their own, they can
allocate authority according to their preferences, such as in the House in 1977-1978 when
DD members occupied 230 seats.
The game begins with some critical event. Perhaps a new administration takes its
place in the White House, a federal agency‘s missteps are widely publicized, the states
find themselves facing economic disaster, or some other exogenous push creates an
atmosphere of policy possibility in Congress. The majority party intergovernmental
teams (AA or AB) consider whether to offer a new division of authority between the
national executive branch and the states through a change in α from the status quo level.
Either team AA or team AB makes an offer first. This first mover team (or team 1 in the
extensive form) also contemplates to whom it will offer this division: to team 2 (the
other majority party intergovernmental team), team BB, team BA, or some combination
55
of the three. Since this is a complete information game, team 1 knows how each team (or
set of teams) will react to the proposal and makes a decision based on this knowledge.
To solve the game I use backward induction beginning at the final nodes and working my
way up through the game tree. The mathematical details are provided in the Appendix.
The solution to the bargaining game implies that when a chamber‘s majority party
is the same as the national executive branch and a simple majority is required to
successfully pass a bill, a policy coalition will include the two majority
intergovernmental teams. This result is due to the fact that in the finite model, there is
complete knowledge and the majority party teams receive a partisan benefit from
coalescing with each other (see Proposition 4, Appendix). The majority party
intergovernmental team will make an offer to the other majority team such that the
recipient will accept and play ends. If the first mover did not make an acceptable offer to
the other majority party team, the transaction costs would make it not in their interest to
offer anything at all and the status quo would prevail. Thus, the degree of state authority
included in the policy will be crafted to satisfy the mismatched majority party
intergovernmental team (team AB) under an A president and the matched team (team
AA) under a B president.
Consider that under an A president, the AA team is indifferent, but must craft a
proposal to gain AB‘s approval (if AA is the first mover). If AB is the proposer, though,
that team knows that AA will accept any offer they make. Since AB has strict
preferences over state authority allocation under an A president (α* for team AB is 0, or
centralization), AB can offer its most preferred allocation of state authority. Under a B
president, alternatively, team AB is indifferent and team AA strictly prefers to
56
decentralize authority to the states. Thus, regardless of which of these majority teams is
the first mover, a proposal is only made that will satisfy AA‘s preference over state
delegation, otherwise the proposal is rejected and the first mover is out the costs of
making a proposal in the first place. In sum, the policy will centralize authority to a
greater extent than the current degree of state responsibility in the policy in the first case
and decentralize it in the second.
For example, when a Republican is the president and there is a Republican
majority in the House, a successful House bill would centralize authority with the
Republican national executive branch. The same is true when there is a Democrat in the
White House and a Democratic majority in the House. Alternatively, if a Democrat were
president with a Republican House majority, the bill would decentralize authority to the
states. If a Republican were president with a Democratic House majority, the bill would
also decentralize authority. In these last two cases, the majority party must cater to the
AA intergovernmental team within the coalition (RR for the Republican House majority
and DD for the Democratic House majority). Under the conditions cited, these AA
legislators strictly prefer to decentralize authority to their states rather than centralize
authority under the opposing party‘s leadership in the national executive branch.
Given the supermajority requirements in the Senate, the solution to this model
suggests that successful policy coalitions look slightly different than in the House.
Specifically, when the Senate majority and the president are of the same party, the policy
coalition will include both majority intergovernmental teams (teams AA and AB in the
model) as well as the matched minority intergovernmental team (team BB) (see
Proposition 5 in the Appendix). When the Senate majority and the President are from
57
opposing parties, the policy coalition will include teams AA, AB and team BA (see
Proposition 6 in the Appendix). For instance, under a Republican president and
Republican majority in the Senate, a successful policy coalition will include Republican
senators from states with Republican governors (RR), Republican senators from states
with Democratic governors (RD), and Democratic senators from states with Democratic
governors (DD). Under a Republican president and Democratic majority, though, this
policy coalition will include RR, RD, and DR Senators.
These last two results, focusing on the Senate are presented in Table 2-5. The
first row shows when the two majority party intergovernmental teams have enough
legislators to reach the supermajority threshold, the coalitions have the same composition
as in the House. Under an A president, the coalition includes both majority party
intergovernmental teams and the Senate bill centralizes authority (α→0). Under a B
president, the coalition includes the same two teams, but the Senate bill decentralizes
authority (α→0). If, however, the majority party does not have enough members to
successfully invoke cloture (i.e. 60 votes), then the coalition under an A president will
also include the BB minority intergovernmental team and the state authority allocation
will decentralize authority just enough to entice some BB legislators to vote to invoke
cloture without losing AB legislators. Under a B president, the Senate coalition will
include the BA minority intergovernmental team and authority will be centralized just
enough to entice some BA legislators to vote to invoke cloture without losing AA
legislators.
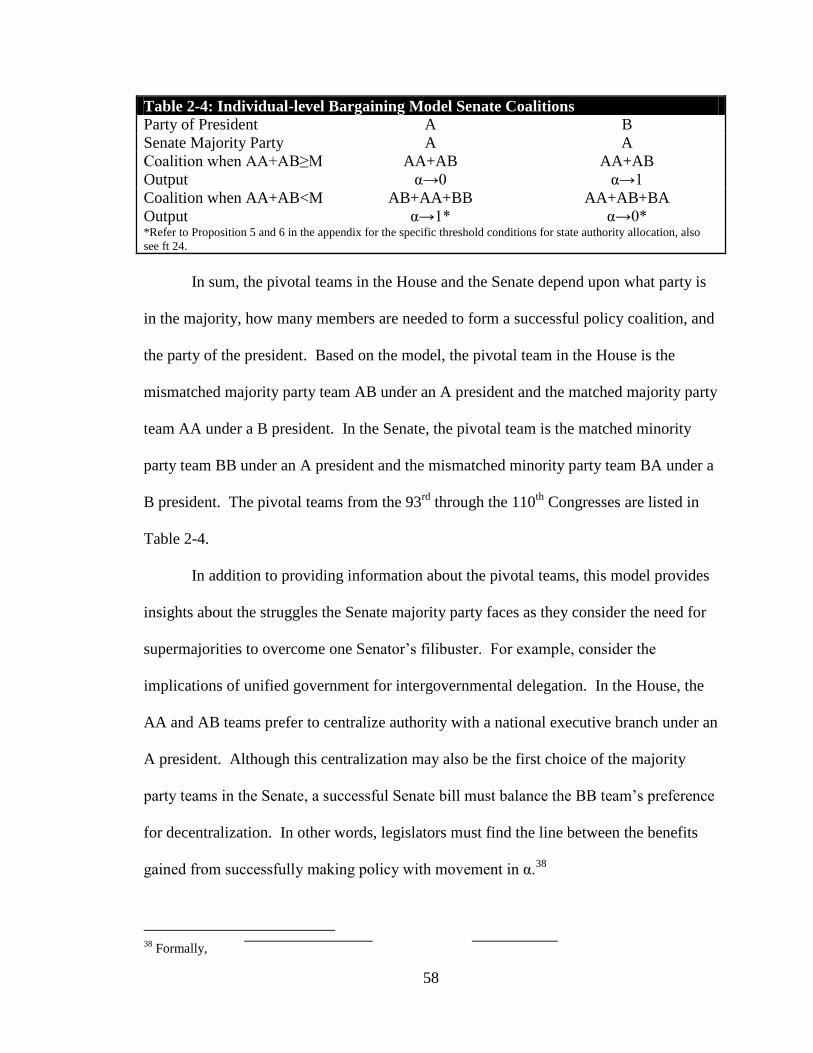
58
Table 2-4: Individual-level Bargaining Model Senate Coalitions
Party of President A B
Senate Majority Party A A
Coalition when AA+AB≥M AA+AB AA+AB
Output α→0 α→1
Coalition when AA+AB<M AB+AA+BB AA+AB+BA
Output α→1* α→0* *Refer to Proposition 5 and 6 in the appendix for the specific threshold conditions for state authority allocation, also
see ft 24.
In sum, the pivotal teams in the House and the Senate depend upon what party is
in the majority, how many members are needed to form a successful policy coalition, and
the party of the president. Based on the model, the pivotal team in the House is the
mismatched majority party team AB under an A president and the matched majority party
team AA under a B president. In the Senate, the pivotal team is the matched minority
party team BB under an A president and the mismatched minority party team BA under a
B president. The pivotal teams from the 93rd
through the 110th
Congresses are listed in
Table 2-4.
In addition to providing information about the pivotal teams, this model provides
insights about the struggles the Senate majority party faces as they consider the need for
supermajorities to overcome one Senator‘s filibuster. For example, consider the
implications of unified government for intergovernmental delegation. In the House, the
AA and AB teams prefer to centralize authority with a national executive branch under an
A president. Although this centralization may also be the first choice of the majority
party teams in the Senate, a successful Senate bill must balance the BB team‘s preference
for decentralization. In other words, legislators must find the line between the benefits
gained from successfully making policy with movement in α.38
38
Formally,
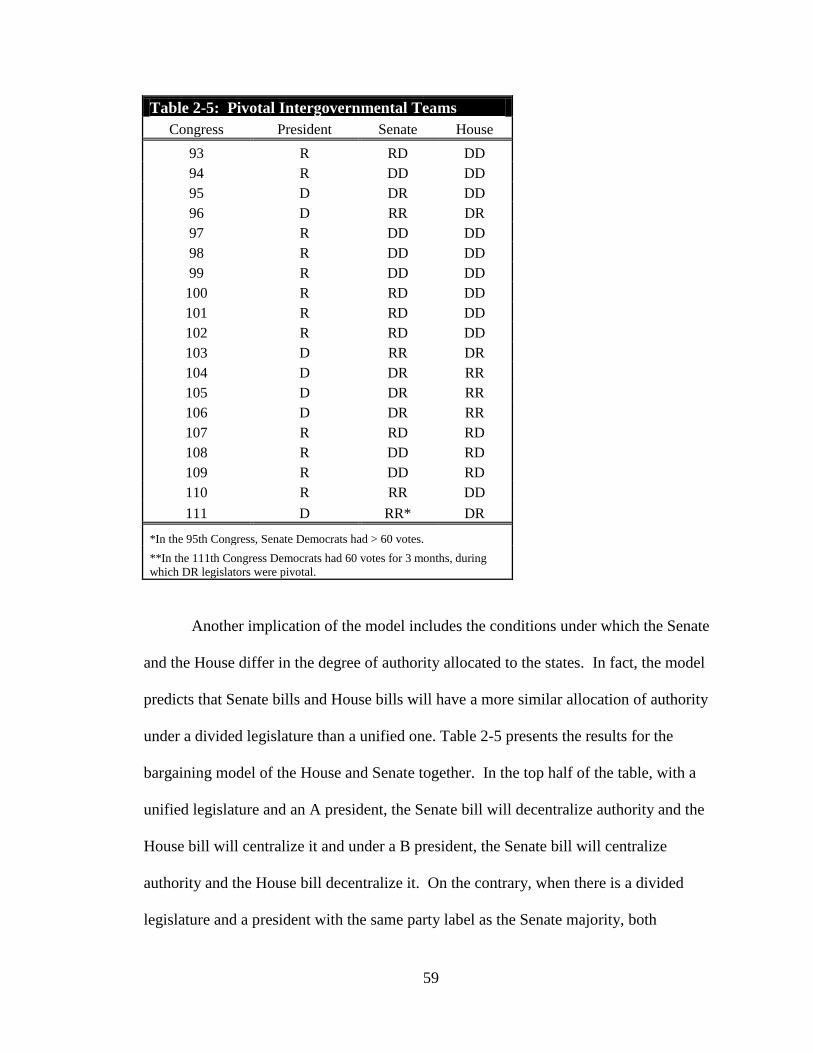
59
Table 2-5: Pivotal Intergovernmental Teams
Congress President Senate House
93 R RD DD
94 R DD DD
95 D DR DD
96 D RR DR
97 R DD DD
98 R DD DD
99 R DD DD
100 R RD DD
101 R RD DD
102 R RD DD
103 D RR DR
104 D DR RR
105 D DR RR
106 D DR RR
107 R RD RD
108 R DD RD
109 R DD RD
110 R RR DD
111 D RR* DR
*In the 95th Congress, Senate Democrats had > 60 votes.
**In the 111th Congress Democrats had 60 votes for 3 months, during
which DR legislators were pivotal.
Another implication of the model includes the conditions under which the Senate
and the House differ in the degree of authority allocated to the states. In fact, the model
predicts that Senate bills and House bills will have a more similar allocation of authority
under a divided legislature than a unified one. Table 2-5 presents the results for the
bargaining model of the House and Senate together. In the top half of the table, with a
unified legislature and an A president, the Senate bill will decentralize authority and the
House bill will centralize it and under a B president, the Senate bill will centralize
authority and the House bill decentralize it. On the contrary, when there is a divided
legislature and a president with the same party label as the Senate majority, both
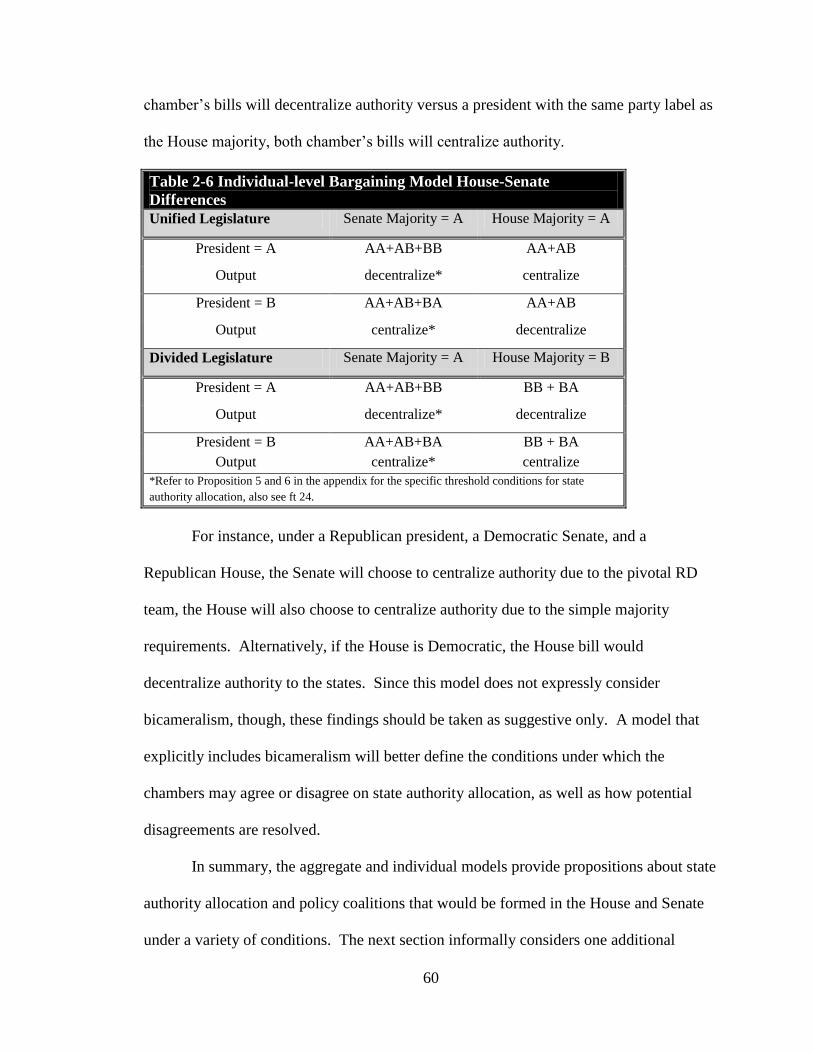
60
chamber‘s bills will decentralize authority versus a president with the same party label as
the House majority, both chamber‘s bills will centralize authority.
Table 2-6 Individual-level Bargaining Model House-Senate
Differences
Unified Legislature Senate Majority = A House Majority = A
President = A AA+AB+BB AA+AB
Output decentralize* centralize
President = B AA+AB+BA AA+AB
Output centralize* decentralize
Divided Legislature Senate Majority = A House Majority = B
President = A AA+AB+BB BB + BA
Output decentralize* decentralize
President = B AA+AB+BA BB + BA
Output centralize* centralize
*Refer to Proposition 5 and 6 in the appendix for the specific threshold conditions for state
authority allocation, also see ft 24.
For instance, under a Republican president, a Democratic Senate, and a
Republican House, the Senate will choose to centralize authority due to the pivotal RD
team, the House will also choose to centralize authority due to the simple majority
requirements. Alternatively, if the House is Democratic, the House bill would
decentralize authority to the states. Since this model does not expressly consider
bicameralism, though, these findings should be taken as suggestive only. A model that
explicitly includes bicameralism will better define the conditions under which the
chambers may agree or disagree on state authority allocation, as well as how potential
disagreements are resolved.
In summary, the aggregate and individual models provide propositions about state
authority allocation and policy coalitions that would be formed in the House and Senate
under a variety of conditions. The next section informally considers one additional
61
attribute of intergovernmental policymaking, uncertainty about the ideal points of future
implementers of a policy.
Political Uncertainty
The formal models discussed to this point have implicitly assumed that policies
are implemented under the same political conditions in which they are enacted. Policy
implementation, though, may occur years in the future. As a result, the current
preferences of the agents may not be the only concern legislators have as they consider
the downstream outcomes of their upstream policy decisions. More specifically, there is
a risk of national- or state-level executive replacement. This replacement could result in
a new administration in charge of implementing the policy with different preferences.
For instance, when legislators pass a law under a Republican president as he is leaving
office, they know implementation may be different under the incoming Democratic
president. The same is true at the state-level; changes in state governors will result in
changes in implementation.39
Uncertainty, then, refers to the chance of executive
replacement with a different party.
The influence of this political uncertainty depends on the relationship between the
legislator‘s partisanship and the party of the executive. If a legislator shares partisanship
with his state‘s governor, the influence of political uncertainty on state authority
allocation is negative. For instance, a Democratic legislator from a state with a
Democratic governor will choose to delegate less responsibility to the state as uncertainty
over the next executive‘s partisanship increases. On the other hand, if a legislator‘s party
39
I assume for simplicity that governors represent the ideal point of state agencies. Some governors, of
course, have more authority than others. In some states governors have the power to reorganize their
executive branches, spend federal money without legislative consent, etc. (National Association of Budget
Officers annual fiscal surveys and the Book of the States). In future work, scholars should include indices
of governor versus state legislative power.
62
label does not match that of his state governor‘s party, the influence of political
uncertainty on state authority allocation is positive. A Republican legislator from a state
with a Democratic governor may choose to delegate more responsibility to the states if
there is a high degree of political uncertainty over whether a Democratic will still be
governor during implementation.
The logic is the same for national political uncertainty. For legislators in the same
party as the president, as political uncertainty over what party will hold the presidency
during implementation increases, those legislators will prefer to delegate away from the
national executive branch (or increase state authority allocation). For legislators in the
opposing party, the effect of national political uncertainty is to reduce the state authority
allocation in favor of national executive branch implementation. Overall, as a legislator
becomes less certain that his party will be in power or more certain that the opposing
party will be in power, he decreases delegation of authority to that particular level.
THEORETICAL PREDICTIONS
This discussion over current and future preferences of legislators, the national
executive branch, and the states yields a set of testable predictions. In general, the
distance from the pivotal legislator in Congress to her pivotal state governor, the distance
between the pivotal legislator and the national executive branch, and state and national
political uncertainty—influence the level of state authority allocation in national law.
The specific hypotheses from the aggregate model are:
Hypothesis 1: As the distance between the pivotal legislator and his state
increases, state authority allocation decreases except when the distance
between that legislator and the national executive branch is greater.
63
Hypothesis 2: As the distance between the pivotal legislator and the
national executive branch increases, state authority allocation increases
except when the distance between that legislator and his state is greater.
Adding the informal influence of political uncertainty on state delegation choices:
Hypothesis 3: As state political uncertainty increases, state authority
allocation decreases for legislators that match their governor‘s party and
increase for legislators that do not match their governor‘s party.
Hypothesis 4: As national political uncertainty increases, state authority
allocation increases for legislators that match the president‘s party and
decreases for legislators that do not match the president‘s party.
From the bargaining model, a different set of hypotheses are indicated, including:
Hypothesis 5: Under a Republican president, Republican legislators from
states with Democratic governors (RD legislators) prefer to centralize
authority to a national Republican-led executive branch.
Hypothesis 6: Republican legislators from states with Republican
governors (RR legislators) prefer to decentralize policy under a
Democratic president.
Hypothesis 7: Democratic legislators from states with Democratic
governors (DD legislators) prefer to decentralize authority to the states
under a Republican president.
Hypothesis 8: Democratic legislators from states with Republican
governors (DR legislators) prefer to centralize authority to the states under
a Democratic president.
Hypothesis 9: When the Senate majority party is of the same party as the
president, a successful policy coalition will include the two majority party
intergovernmental teams and the matched minority party
intergovernmental team (i.e., team BB).
Hypothesis 10: When the Senate majority party is different than that of
the president, a successful policy coalition will include the two majority
party intergovernmental teams and the mismatched minority party
intergovernmental team (i.e., team BA).
To conclude, the theory of intergovernmental delegation specifically takes into
account the role of preferences over policy outcomes and the location of individual
64
legislators‘ preferences vis a vis the national executive branch and their own specific
state executive branch, the institutional voting rules of the House and the Senate, and
uncertainty over the preferences of future implementers of the policy in the determination
of how much authority is delegated to the states versus kept at the national level. Two
simple models, one at the aggregate level and the second at the individual level,
combined with an informal consideration of political uncertainty structure these
considerations and result in both intuitive and counter-intuitive predictions about which
legislative teams coalesce with each other and when Congress centralizes versus
decentralizes authority under different conditions.
The findings contrary to accepted wisdom are that Republicans prefer to
centralize and Democrats prefer to decentralize under a Republican president.
Additionally, successful policy coalitions in the Senate will include different types of
minority legislators depending upon the party of the president. For instance, under a
Democratic president and Democratic Senate majority, the policy coalition will include
RR legislators, but under a Republican president the coalition will include RD legislators.
The next chapter provides a descriptive of the data gathered to assess this theory of
federal policy design.
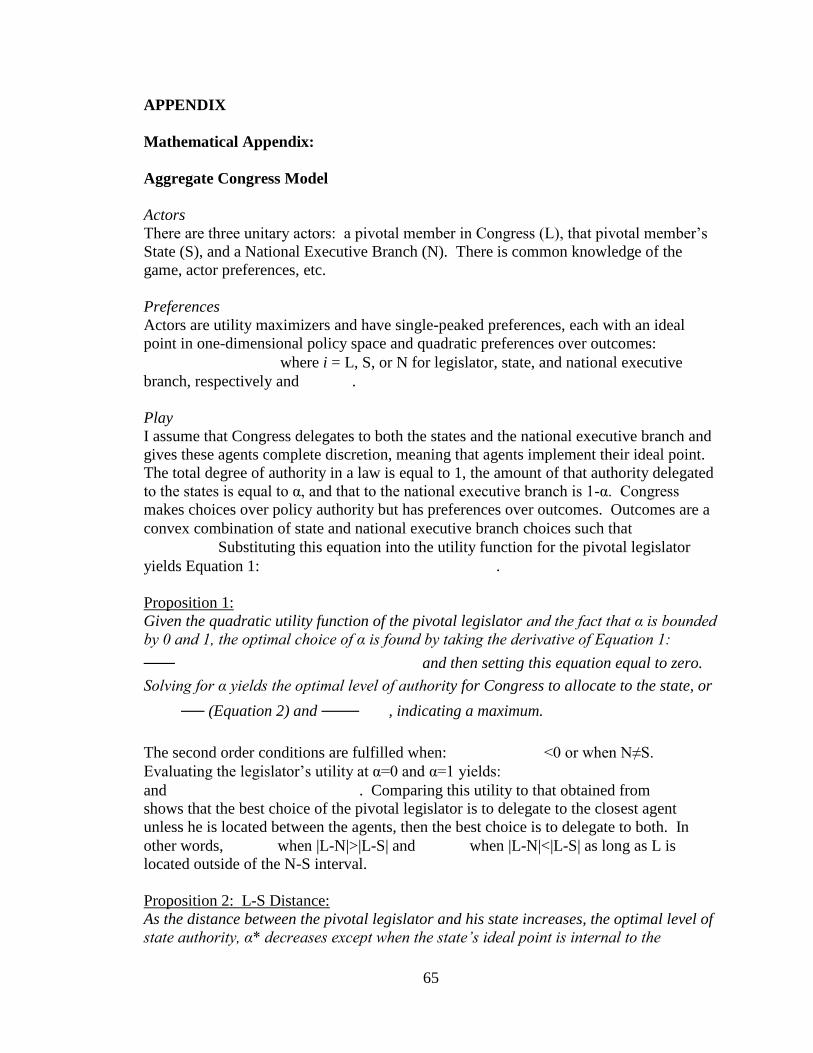
65
APPENDIX
Mathematical Appendix:
Aggregate Congress Model
Actors
There are three unitary actors: a pivotal member in Congress (L), that pivotal member‘s
State (S), and a National Executive Branch (N). There is common knowledge of the
game, actor preferences, etc.
Preferences
Actors are utility maximizers and have single-peaked preferences, each with an ideal
point in one-dimensional policy space and quadratic preferences over outcomes:
where i = L, S, or N for legislator, state, and national executive
branch, respectively and .
Play
I assume that Congress delegates to both the states and the national executive branch and
gives these agents complete discretion, meaning that agents implement their ideal point.
The total degree of authority in a law is equal to 1, the amount of that authority delegated
to the states is equal to α, and that to the national executive branch is 1-α. Congress
makes choices over policy authority but has preferences over outcomes. Outcomes are a
convex combination of state and national executive branch choices such that
Substituting this equation into the utility function for the pivotal legislator
yields Equation 1: .
Proposition 1:
Given the quadratic utility function of the pivotal legislator and the fact that α is bounded
by 0 and 1, the optimal choice of α is found by taking the derivative of Equation 1:
and then setting this equation equal to zero.
Solving for α yields the optimal level of authority for Congress to allocate to the state, or
(Equation 2) and , indicating a maximum.
The second order conditions are fulfilled when: <0 or when N≠S.
Evaluating the legislator‘s utility at α=0 and α=1 yields:
and . Comparing this utility to that obtained from
shows that the best choice of the pivotal legislator is to delegate to the closest agent
unless he is located between the agents, then the best choice is to delegate to both. In
other words, when |L-N|>|L-S| and when |L-N|<|L-S| as long as L is
located outside of the N-S interval.
Proposition 2: L-S Distance:
As the distance between the pivotal legislator and his state increases, the optimal level of
state authority, α* decreases except when the state’s ideal point is internal to the
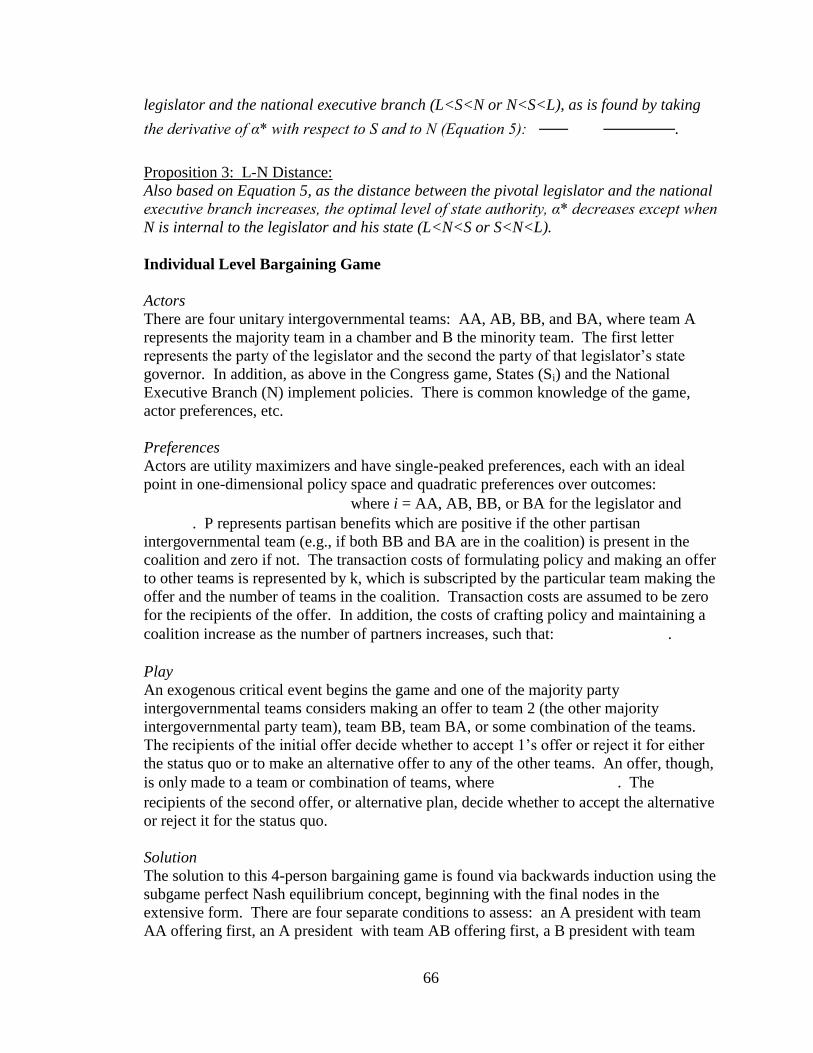
66
legislator and the national executive branch (L<S<N or N<S<L), as is found by taking
the derivative of α* with respect to S and to N (Equation 5): .
Proposition 3: L-N Distance:
Also based on Equation 5, as the distance between the pivotal legislator and the national
executive branch increases, the optimal level of state authority, α* decreases except when
N is internal to the legislator and his state (L<N<S or S<N<L).
Individual Level Bargaining Game
Actors
There are four unitary intergovernmental teams: AA, AB, BB, and BA, where team A
represents the majority team in a chamber and B the minority team. The first letter
represents the party of the legislator and the second the party of that legislator‘s state
governor. In addition, as above in the Congress game, States (Si) and the National
Executive Branch (N) implement policies. There is common knowledge of the game,
actor preferences, etc.
Preferences
Actors are utility maximizers and have single-peaked preferences, each with an ideal
point in one-dimensional policy space and quadratic preferences over outcomes:
where i = AA, AB, BB, or BA for the legislator and
. P represents partisan benefits which are positive if the other partisan
intergovernmental team (e.g., if both BB and BA are in the coalition) is present in the
coalition and zero if not. The transaction costs of formulating policy and making an offer
to other teams is represented by k, which is subscripted by the particular team making the
offer and the number of teams in the coalition. Transaction costs are assumed to be zero
for the recipients of the offer. In addition, the costs of crafting policy and maintaining a
coalition increase as the number of partners increases, such that: .
Play
An exogenous critical event begins the game and one of the majority party
intergovernmental teams considers making an offer to team 2 (the other majority
intergovernmental party team), team BB, team BA, or some combination of the teams.
The recipients of the initial offer decide whether to accept 1‘s offer or reject it for either
the status quo or to make an alternative offer to any of the other teams. An offer, though,
is only made to a team or combination of teams, where . The
recipients of the second offer, or alternative plan, decide whether to accept the alternative
or reject it for the status quo.
Solution
The solution to this 4-person bargaining game is found via backwards induction using the
subgame perfect Nash equilibrium concept, beginning with the final nodes in the
extensive form. There are four separate conditions to assess: an A president with team
AA offering first, an A president with team AB offering first, a B president with team
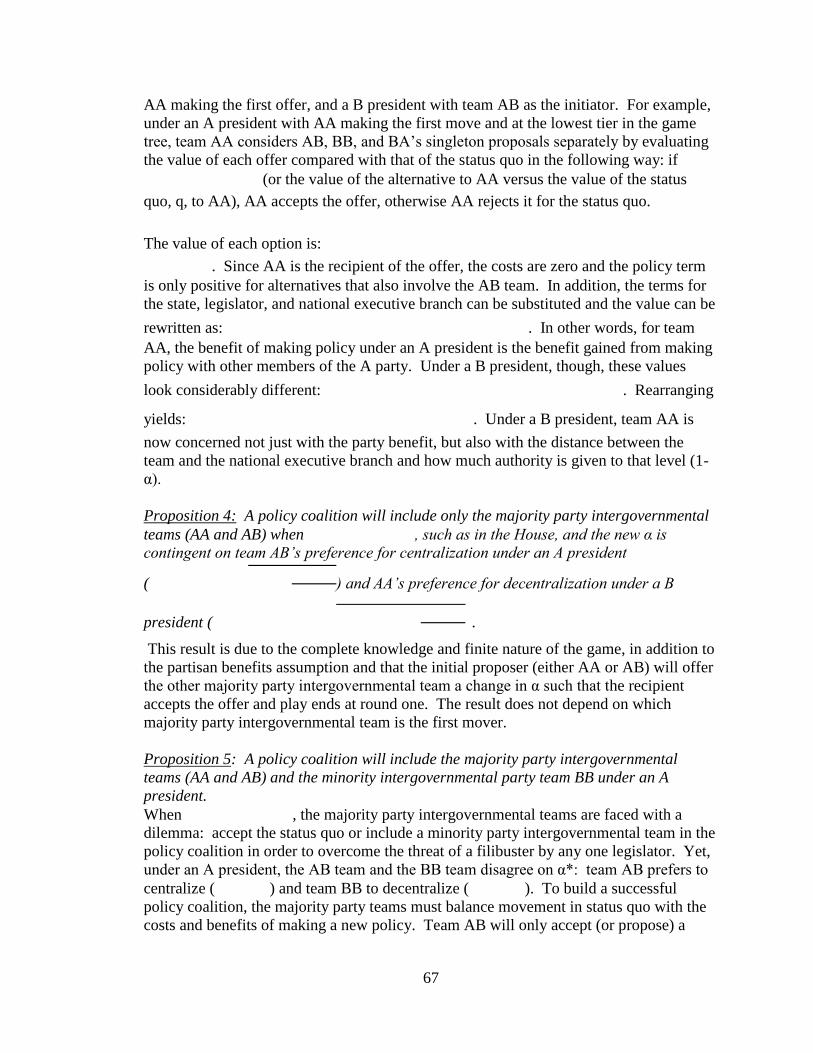
67
AA making the first offer, and a B president with team AB as the initiator. For example,
under an A president with AA making the first move and at the lowest tier in the game
tree, team AA considers AB, BB, and BA‘s singleton proposals separately by evaluating
the value of each offer compared with that of the status quo in the following way: if
(or the value of the alternative to AA versus the value of the status
quo, q, to AA), AA accepts the offer, otherwise AA rejects it for the status quo.
The value of each option is:
. Since AA is the recipient of the offer, the costs are zero and the policy term
is only positive for alternatives that also involve the AB team. In addition, the terms for
the state, legislator, and national executive branch can be substituted and the value can be
rewritten as: . In other words, for team
AA, the benefit of making policy under an A president is the benefit gained from making
policy with other members of the A party. Under a B president, though, these values
look considerably different: . Rearranging
yields: . Under a B president, team AA is
now concerned not just with the party benefit, but also with the distance between the
team and the national executive branch and how much authority is given to that level (1-
α).
Proposition 4: A policy coalition will include only the majority party intergovernmental
teams (AA and AB) when , such as in the House, and the new α is
contingent on team AB’s preference for centralization under an A president
( ) and AA’s preference for decentralization under a B
president ( .
This result is due to the complete knowledge and finite nature of the game, in addition to
the partisan benefits assumption and that the initial proposer (either AA or AB) will offer
the other majority party intergovernmental team a change in α such that the recipient
accepts the offer and play ends at round one. The result does not depend on which
majority party intergovernmental team is the first mover.
Proposition 5: A policy coalition will include the majority party intergovernmental
teams (AA and AB) and the minority intergovernmental party team BB under an A
president.
When , the majority party intergovernmental teams are faced with a
dilemma: accept the status quo or include a minority party intergovernmental team in the
policy coalition in order to overcome the threat of a filibuster by any one legislator. Yet,
under an A president, the AB team and the BB team disagree on α*: team AB prefers to
centralize ( ) and team BB to decentralize ( ). To build a successful
policy coalition, the majority party teams must balance movement in status quo with the
costs and benefits of making a new policy. Team AB will only accept (or propose) a
68
change in the degree of state authority if and team BB will
only accept a change where and is either the
status quo or another offer made by the recipient (either AA, AB, or BB).
Proposition 6: A policy coalition will include the majority party intergovernmental
teams (AA and AB) and the minority intergovernmental party team BA when
and there is a B president.
In this case, teams BA and AA have opposing preferences (for centralization and
decentralization, respectively) and the following condition results:
.
Propositions 5 and 6 rely on the subgame perfect equilibrium solution concept and the
assumption that a team rejects an offer for the status quo if it is indifferent. Specifically,
at the lowest tier in the game tree, teams 1 (the first mover majority team) and BB both
accept team 2‘s offer of α under certain circumstances. For the majority party team AB,
and for BB if , BB accepts. Team BA, though,
will only accept an offer that includes team BB, since BA is indifferent over α and will
only accept if the value of a policy change also includes partisan benefits.40
Similarly, at
the other nodes along this lowest tier, team AA accepts any offer of ,
team AB only accepts offers that include team AA, and team BA only accepts offers that
include team BB. The choices are made because of the following values (focusing on
one condition as an example, the other conditions can be found by substituting the new
values of the legislator, state, and presidential ideal points and using α‘ to generalize the
various alternative proposed across the extensive form):
Under an A president with team AA as the first mover, for the bottom tier of the
extensive form:
Team AA: V(α‘) versus V(q)
. The parenthetical indicates that partisan benefits only occur when the policy
coalition includes team AB as well. Reducing this equation yields 0>0 when the policy
coalition does not include team AB and AA or , when it does. In other words,
since the partisan benefit term is positive by definition, team AA only accepts an offer
that also includes team AB.
40
Alternatively, if I assume policy change wins at indifference, two things change: 1) team BA is in the
final policy coalition under an A president and team B under a B president and the policy change in both
instances is only constrained by the majority party intergovernmental teams. This assumption seems less
realistic than to assume a team rejects at indifference, given both the conventional wisdom regarding the
stability of the status quo and the influence of the minority party in the Senate. In the aggregate empirical
analysis chapter I provide the results relying on this alternative choice for indifference, which do not alter
the conclusions I draw.
69
Team AB: V(α‘) versus V(q) =
. Rearranging and reducing this equation yields: , or that
team AB will accept an alternative proposal iff if team AA is involved, or
iff , if not.
Team BA: V(α‘) versus V(q) =
. Reducing this equation yields 1<1 (when team BB is not included in the coalition)
and when team BB is included in the policy coalition. Thus, team BA rejects all
offers unless team BB is included. As long as there is a positive partisan benefit, team
BA accepts all offers that also include team BB.
Team BB: V(α‘) versus V(q) =
. Rearranging and reducing (relying on the fact that ) this equation yields the
following conclusion: as long as , BB accepts any offer that does not include
team BA, if not, BB rejects in favor of the status quo. If team BA is also included, BB
accepts any offer such that .
In the middle tier of the game tree, recipients of the initial proposal decide whether to
accept team 1‘s offer, to reject it for the status quo, or to reject 1‘s offer and make an
alternative offer given the known choices that will be made at the lowest tier. As an
example, team 2 must consider whether to accept team 1‘s proposal versus reject it to
make an alternative offer to any one or more of the teams (including back to team 1), or
even reject team 1‘s proposal and make no alternative offer in favor of the status quo.
Continuing the example from above (with an A president and team AA as the first mover,
which means team AB is team 2), team AB considers
.
These values can be read in the following manner: the value to team AB of the proposal
from AA to AB alone ( , the value to team AB of the proposal from AB to AA
alone ( , and the value to team AB of the proposal from AB to teams AA, BA, and
BB ( ).
The value of each option to AB is: . In other
words, the value of the options depends on the state authority allocation offered, the
potential partisan benefits, and the costs of making an offer. If team AA‘s offer is
, AB accepts AA‘s offer. If not, AB makes an alternative offer
to team AA as long as < . If not, AB chooses the status quo.
At the top node of the game tree, team 1 decides whether to make an offer to another
team or set of teams, and if so, which team(s). Due to the partisan benefit of offer to
team 2, the higher costs of maintaining a larger coalition, and team AA‘s indifference
over the level of state authority (under an A president), if team AA moves first, it offers a
change in state authority such that team AB accepts. If AB moves first, it only makes a
70
proposal if it can offer a change in state authority that has value given the costs and
benefits of policymaking. The same is the case under a B president, but given AB‘s
indifference and AA‘s preference over .
In detail, under an A president with team AA as the first mover, AA knows that AB will
accept a proposal where , that BA will only accept an offer
that also includes team BB, and that team BB will only accept an offer if
if team BA is included). If , AA will
offer a proposal to team AB such that AB accepts. If , AA will offer a
proposal to teams AB and BB (since k is increasing in the number of teams included and
team BA rejects offers that do not also include team BB) iff and both teams
accept. In order for both teams to accept, AA must offer the following proposal:
.
This result above suggests that the first mover team in the Senate (where
is likely) must balance the non-indifferent majority party team‘s preference and the
non-indifferent minority party team‘s preference over α with the costs and benefits of
changing the status quo policy leading to the final proposition.
71
REFERENCES
Aberbach JD. 2002. ―What‘s Happened to the Watchful Eye?,‖ Congress and the
Presidency 29(10):3-23.
Arnold RD. 1990. The Logic of Congressional Action. New Haven, Connecticut, Yale
University Press.
Bawn K. 1995. ―Political Control versus Expertise: Congressional Choices about
Administrative Procedures,‖ Annual Political Science Review 89:62-73.
Bendor J, Glazer A, and Hammond T. 2001. ―Theories of Delegation,‖ Annual Review
of Political Science 4:235-69.
Chubb JE. 1985. "The Political Economy of Federalism." Annual Political Science
Review 79(4):994-1015.
Harvard Law Review Notes. 1994. "Federalism, Political Accountability, and the
Spending Clause." Harvard Law Review 107(6):1419-36.
Inman RP. 1989. "Federal Assistance and Local Services in the United States: The
Evolution of a New Federalist Fiscal Order" (February). NBER Working Paper No.
W2283. Accessed at: http://ssrn.com/abstract=347056 December 2006.
Inman RP and Rubinfeld DL. "Designing Tax Policies in Federalist Economies: An
Overview" Journal of Public Economy 60:307-34, 1996.
Lupia A and McCubbins M. 1994. "Learning from Oversight: Fire Alarms and Police
Patrols Reconstructed. Journal of Law Economics and Organization, 10(1):96-125.
Mayhew DR. 1974. Congress: The Electoral Connection. New Haven, Connecticut,
Yale University Press.
McCarty N and Meirowitz A. 2007. Political Game Theory: An Introduction. New
York, Cambridge University Press.
McCoy TR and Friedman B. 1988. "Conditional Spending, Federalism's Trojan Horse"
Supreme Court Review, The Law School of the University of Chicago, pp85-128.
Nathan RP. 1983. "State and Local Governments under Federal Grants: Toward a
Predictive Theory." Political Science Quarterly 98(1):47-57.
Oates WE. 1999. "An Essay on Fiscal Federalism." Journal of Economic Literature,
37(3):1120-49.
Peterson PE. 1995. The Price of Federalism. Washington D.C., Brookings Institution.
72
Posner PL. 1998. The Politics of Unfunded Mandates: Whither Federalism?
Washington D.C., Georgetown University Press.
Rabe BG. 1999. "Federalism and Entrepreneurship: Explaining American and Canadian
Innovation in Pollution Prevention and Regulatory Integration." Policy Studies Journal,
27(2):288-306.
Rosenthal AJ. 1987. "Conditional Federal Spending and the Constitution" Stanford Law
Review 39(5):1103-64.
U.S. Congressional Research Service. 2003. "Federal Grants to State and Local
Governments: A Brief History" Report for Congress, February, 2003. Accessed at
http://usinfo.state.gov/usa/infousa/politics/states/fedgrants.pdf December, 2006.
U.S. General Accounting Office. 1996. "Federal Grants: Design Improvements Could
Help Federal Resources Go Further" Report to the Chairman, Committee on the Budget,
House of Representatives, December, 1996. Accessed at
http://www.gao.gov/archive/1997/ai97007.pdf December, 2006.
U.S. General Accounting Office. 2003. "Federal Assistance: Grant System Continues to
Be Highly Fragmented." Statement of Paul L Posner, Managing Director Federal Budget
Issues and Intergovernmental Relations, Strategic Issues, Testimony Before the
Subcommittee on Technology, Information Policy, Intergovernmental Relations and the
Census, Committee on Government Reform, House of Representatives, April 2003.
Accessed at http://www.gao.gov/new.items/d03718t.pdf December, 2006.
Waterman RW and Meier KJ. 1998. ―Principal-Agent Models: An Expansion?‖
Journal of Public Administration Research and Theory 8(2):173-202.
Weingast BR. 1984. ―The Congressional-Bureaucratic System: A Principal Agent
Perspective (with Applications to the SEC).‖ Public Choice 44:147-191.
Zimmerman JF. 2005. "The Nature and Political Significance of Preemption." PS:
Political Science and Politics 38:359-62.
73
Chapter 3
Measuring the Federal Allocation of Authority
INTRODUCTION
The first two chapters presented an empirical and theoretical puzzle: national
policy varies in the amount of responsibility given to the states both over time and across
laws. State involvement in policy can result in different policy outcomes than when the
states are not involved. Thus, what are the conditions under which Congress opts to
delegate more or less authority to the states? Using formal models of Congress
delegating authority to the national executive branch and the states, I derived a number of
hypotheses with respect to the effect of policy preferences of the states, Congress, and the
national executive branch. This theory of intergovernmental delegation must be tested
against current arguments related to the decentralization of authority. Conventional
wisdom, for instance, is that Republicans prefer to devolve authority while Democrats opt
to centralize. Scholars also posit the following three arguments: 1) when the party of the
national government is more similar to that of all state governments, decentralization is
more likely (partisan congruence) (Krause and Bowman 2005), 2) policy type determines
decentralization choices, where redistributional policies are more efficiently implemented
by a central government and developmental policies by subunit governments (Peterson
1995), and 3) Congress is less likely to decentralize during elections (Nicholson-Crotty
74
2008).41
In order to test the theory of intergovernmental delegation against these
alternative explanations, the concepts of federal delegation of authority, policy actor
preferences, political uncertainty, partisanship, partisan congruence, policy type, and
election timing must be operationalized.
DATA
Dependent Variable
Unit of Analysis and Selection of Data
To evaluate the conditions under which national legislators delegate authority to
federal actors, this study utilizes the law as the unit of analysis. The dataset includes
significant pieces of legislation from Mayhew‘s list of major laws from the 93rd
through
the 110th
Congresses (2005). The list of important laws was downloaded and
crosschecked with Mayhew‘s Table 4.1 for the years 1973-2002 (2005).42
This list
contains a total of 208 separate listings (from 1973-2008). Non-domestic legislation was
excluded from this list including 22 of Mayhew‘s entries.43
I also excluded D.C. Home
Rule and the declaration of Martin Luther King Jr. Birthday as a national holiday since
the first is specifically related only to the governance of the District of Columbia and the
second is a formal statement of a holiday. I counted each law as one unit, which means
each omnibus piece of legislation is counted as one enactment. This, for example,
combines Mayhew‘s listings of Omnibus Deficit Reduction Act of 1993 with a separate
41
Peterson defines developmental policies as those that ―provide the physical and social infrastructure
necessary to facilitate a country‘s economic growth‖ and redistributive policies as those that ―reallocate
societal resources from the haves to the have-nots‖ (17, 1995). 42
Downloaded from http://pantheon.yale.edu/~dmayhew/datasets.html on September 2008 and again
March 2010. 43
These included, for example, the Comprehensive Anti-Apartheid Act, 2002 Authorization for Use of
Force against those Responsible for Recent Terrorist Attacks, 2002 Authorization for Use of Force against
Iraq, HIV/AIDS funding for Africa and the Caribbean, 2008 Nuclear Trade Agreement with India, 1997
Chemical Weapons Convention ratification, and the 1978 Panama Canal treaties ratification.
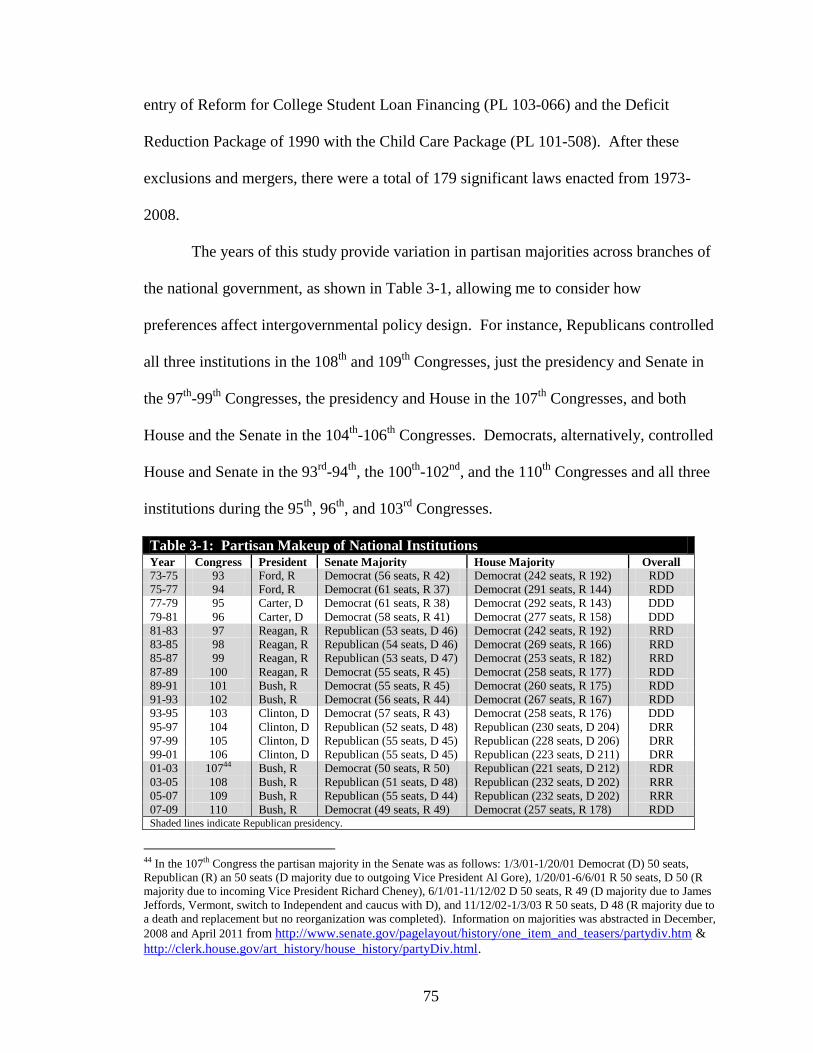
75
entry of Reform for College Student Loan Financing (PL 103-066) and the Deficit
Reduction Package of 1990 with the Child Care Package (PL 101-508). After these
exclusions and mergers, there were a total of 179 significant laws enacted from 1973-
2008.
The years of this study provide variation in partisan majorities across branches of
the national government, as shown in Table 3-1, allowing me to consider how
preferences affect intergovernmental policy design. For instance, Republicans controlled
all three institutions in the 108th
and 109th
Congresses, just the presidency and Senate in
the 97th
-99th
Congresses, the presidency and House in the 107th
Congresses, and both
House and the Senate in the 104th
-106th
Congresses. Democrats, alternatively, controlled
House and Senate in the 93rd
-94th
, the 100th
-102nd
, and the 110th
Congresses and all three
institutions during the 95th
, 96th
, and 103rd
Congresses.
Table 3-1: Partisan Makeup of National Institutions Year Congress President Senate Majority House Majority Overall
73-75 93 Ford, R Democrat (56 seats, R 42) Democrat (242 seats, R 192) RDD
75-77 94 Ford, R Democrat (61 seats, R 37) Democrat (291 seats, R 144) RDD
77-79 95 Carter, D Democrat (61 seats, R 38) Democrat (292 seats, R 143) DDD
79-81 96 Carter, D Democrat (58 seats, R 41) Democrat (277 seats, R 158) DDD
81-83 97 Reagan, R Republican (53 seats, D 46) Democrat (242 seats, R 192) RRD
83-85 98 Reagan, R Republican (54 seats, D 46) Democrat (269 seats, R 166) RRD
85-87 99 Reagan, R Republican (53 seats, D 47) Democrat (253 seats, R 182) RRD
87-89 100 Reagan, R Democrat (55 seats, R 45) Democrat (258 seats, R 177) RDD
89-91 101 Bush, R Democrat (55 seats, R 45) Democrat (260 seats, R 175) RDD
91-93 102 Bush, R Democrat (56 seats, R 44) Democrat (267 seats, R 167) RDD
93-95 103 Clinton, D Democrat (57 seats, R 43) Democrat (258 seats, R 176) DDD
95-97 104 Clinton, D Republican (52 seats, D 48) Republican (230 seats, D 204) DRR
97-99 105 Clinton, D Republican (55 seats, D 45) Republican (228 seats, D 206) DRR
99-01 106 Clinton, D Republican (55 seats, D 45) Republican (223 seats, D 211) DRR
01-03 10744 Bush, R Democrat (50 seats, R 50) Republican (221 seats, D 212) RDR
03-05 108 Bush, R Republican (51 seats, D 48) Republican (232 seats, D 202) RRR
05-07 109 Bush, R Republican (55 seats, D 44) Republican (232 seats, D 202) RRR
07-09 110 Bush, R Democrat (49 seats, R 49) Democrat (257 seats, R 178) RDD Shaded lines indicate Republican presidency.
44 In the 107th Congress the partisan majority in the Senate was as follows: 1/3/01-1/20/01 Democrat (D) 50 seats,
Republican (R) an 50 seats (D majority due to outgoing Vice President Al Gore), 1/20/01-6/6/01 R 50 seats, D 50 (R
majority due to incoming Vice President Richard Cheney), 6/1/01-11/12/02 D 50 seats, R 49 (D majority due to James
Jeffords, Vermont, switch to Independent and caucus with D), and 11/12/02-1/3/03 R 50 seats, D 48 (R majority due to
a death and replacement but no reorganization was completed). Information on majorities was abstracted in December,
2008 and April 2011 from http://www.senate.gov/pagelayout/history/one_item_and_teasers/partydiv.htm &
http://clerk.house.gov/art_history/house_history/partyDiv.html.
76
Source
To measure the dependent variable of intergovernmental delegation, I created a
new dataset of policy authority delegation across federal actors. I obtained a summary of
each law‘s major provisions from the Congressional Research Service (CRS) through the
Library of Congress THOMAS on-line service.45
CRS provides a summary of each
introduced bill and each enactment into law. Previous studies often utilize Congressional
Quarterly (CQ) Almanac summaries of laws (e.g., Epstein and O‘Halloran 1999,
Maltzman and Shipan 2008). A comparison coding of CQ summaries and CRS
summaries revealed that CQ summaries often provided ambiguous information on the
specific federal entity that received authority in each provision. CRS summaries,
alternatively, provided more details about which entities were responsible for each
provision included in the summary.
As a result, for this project, I used the CRS summary for the final enrolled
enactment for each major law.46
Given the structure of the summaries, each provision of
every law in the dataset was coded for delegation of responsibility. In each summary, the
provisions are demarcated by CRS as a new bullet in the text and each provision
separated by a blank line. The average number of provisions in a CRS summary is 134.
The summaries of significant legislation range from 1 to 1066 provisions—where the
large summaries included omnibus and budget reconciliation legislation (see Table 3-2).
45
Accessed November 2008-June, 2010 from http://thomas.loc.gov/home/bills_res.html. Please refer to
THOMAS ―About Summaries‖ website at http://thomas.loc.gov/bss/abt_dgst.html for more information. 46
Wawro (2001) also uses CRS summaries. In 1970 the Congressional Research Service (then named the
Legislative Reference Service) received additional resources through the Legislative Reorganization Act of
1970. Prior to this time, CRS summaries are extremely brief and often only provide a 2-3-sentence
summary of an entire bill.

77
Table 3-2: Descriptive Statistics for Dependent Variables (unit of analysis = law)
Variable N Mean Standard
Deviation
Min Max
Proportion of National Provisions 179 0.751 0.274 0 1
Proportion of Joint Provisions 179 0.22 0.257 0 1
Proportion of State Provisions 179 0.029 0.119 0 1
Degree of Decentralization 179 0.249 0.274 0 1
Total Number of Provisions 24,012 134.067 168.382 1 1066
In 1973, for example, Congress amended the Economic Stabilization Act of 1970
(PL 93-028). The CRS summary of this law included four provisions giving the
President authority (after public hearings) to set priorities and usage of petroleum
products, changing the definition of ―working poor,‖ delineating that the President‘s
authority does not include the ability to withhold or reserve obligated authority or funds,
and requiring industry to make their price reports public. At the other end of the
spectrum is the Omnibus Consolidated Appropriations Act of 1998 (1066 provisions),
which includes provisions related to agriculture, Medicare, foreign aid, the Food and
Drug Administration, the Post Office, the Child Online Privacy Act, and others. In total,
24,012 provisions were coded.
Coding Choices
To be able to later examine congressional delegation choices, the laws must be
coded as to which entity receives authority in a policy. A minimum of two coders relied
on specific definitions of authority and delegation to guide their coding processes.
Authority was defined as the power to determine, judge, enforce, and conduct the
activities laid out in a policy—or when Congress empowers another actor/group to make
choices and complete the tasks necessary to result in an outcome from the delegated
work. Congress relies upon this other entity (its agent, in a broad sense) to provide a set
of functions or to implement the policy. The conduct of activities included in this
78
definition included technical assistance, training, filling out paperwork, research, and the
provision of care or services as detailed in the policy, among others.
The coding procedures included assigning a provision as ―national‖ when a new
national agency was created, when an existing national agency or group was required to
perform a duty or implement the provision, or when the president was made responsible
for specific actions.47
―State‖ provisions were those that required state or local-level
action with no national involvement.48
―Joint‖ provisions included those where both
state- and national-level entities were assigned responsibility or required to establish or
maintain a state-national partnership.49
There were a number of ―other‖ categories that were also coded including public-
private partnerships, delegation to private contractors, delegation to the judiciary, and
delegation to international agents. When delegation categories were not obvious based
on the CRS summary, coders referred to the full text of the law and the appropriate year‘s
United States Code to assign delegation.
After two coders completed a law, a separate third coder reviewed the two
previous decisions and in cases where there were discrepancies, the differences were
aired at a conference where all coders discussed how the decision rules applied in that
situation, reviewed the full text of the law (for that provision), the text of the correct
United States Code, and any additional background material (such as agency websites).
47
When Congress retained authority, the provision was coded as ―no authority delegated.‖ If Congress
assigned an independent commission‘s membership, the commission was coded as ―other‖, if the
membership was assigned by the President (or national executive branch agency) they were categorized as
national and if by a combination of the state governors (or other state-level actors) and national actors, it
was categorized as joint. 48
I assume that local policies are subsumed into state policies. Local governments also likely play an
important role in intergovernmental relations and the decisions of policymakers. Narrowing the scope of
the study in this way will miss some of the nuances of intergovernmental relations that require further study
in future projects. 49
Please refer to the appendix for a detailed description of the coding rules.
79
After each law was coded, summary measures for that law were calculated including: the
total number of provisions in the law, the total number of national provisions, the total
number of joint provisions, the total number of state provisions and the total number of
other provisions. The percent agreement on the coding of national, state, and joint
authority between the initial two coders averaged 78.35%. Any law with less than 70%
agreement between those two coders was re-coded by the author.
We confined our determination of whom or what was given authority to each
individual provision unless it was apparent that a series of provisions were linked. In the
Education Flexibility Partnership Act of 1999 (P.L. 106-025), for instance, the first
summarized provision authorizes the Secretary of Education to allow states to participate
in the Education Flexibility Partnership program (Ed-Flex). The next seven provisions
set forth requirements, authorizations, and prohibitions for states that participate in the
program; therefore, even though these provisions circumscribe the authority of states,
they are not direct mandates for the states. Instead, these provisions refer to the authority
of the Secretary of Education in overseeing the entire program and are coded as joint
delegations of authority.
This coding provides a dramatic departure from previous empirical tests of
centralization and decentralization. Previous studies have either used preemption data
compiled by the National Conference of State Legislatures (mostly based on
Congressional Budget Office data) (Nicholson-Crotty 2008), data on grants-in-aid
(Peterson 1995), or have limited their coding to laws that specifically deal with states
(Krause and Bowman 2005).50
These datasets cover limited time periods (e.g. CBO only
50
CBO data is compiled as a result of the 1995 Unfunded Mandate Reform Act and is available from 1997
onward. Their data includes mandates on states, localities, tribes, and private entities. Mandates are
80
covers 1997 onward) and do not consider legislation that does not delegate authority to
the states—in other words, for my project they select on the dependent variable. For
instance, Krause and Bowman (2005) examined all public laws passed between 1947-
1998 (excluding appropriations bills, omnibus bills, and land transactions). Laws were
excluded if there was no intergovernmental content. This project, with its broader
perspective regarding the uses of federal delegation options for Congress, must consider
all designations of authority within legislation, whether they be grants-in-aid, mandates,
direct orders to states, traditional delegation to the national executive branch, or
otherwise.
Next, I create an overall federal delegation measure that takes into account both
joint and state delegation choices. For this variable, I create a blunt measure of overall
state policy delegation, or decentralization, by collapsing the categories of delegation into
a continuous measure within the bounds zero to one. This measure captures the degree of
authority delegated to the states in a law (the degree of decentralization) and is calculated
by adding the proportion of state provisions in a law (provisions that delegate entirely to
the states) to one-half the proportion of joint provisions (provisions that delegate partially
to the states and partially to the national executive branch).51
For example, a law with
100 provisions: 50 national, 40 joint, and 10 state would receive a decentralization score
of .30 (which is equal to (50*0 + 40*0.5 + 10*1)/100). Table 3-2 lists the descriptive
statistics for all four measures for the dependent variable.
defined as any duty imposed on these units. Excluded from this definition are voluntary grants-in-aid. See
CBO website for more details at http://www.cbo.gov/. 51
By using a measure that considers ½ of joint provisions, I implicitly assume that joint partnerships
allocate approximately half of the authority to the states and half to the national agents. Although this is
not necessarily true for each individual case, as an overall average it is a rough approximation. In the
empirical analyses, I consider a variety of other specifications and find my results are robust to changes in
this measure, including counting joint provisions as equal to state provisions, dichotomizing the delegation
into ―mostly state‖ versus not (and utilizing various thresholds of ―mostly state‖).
81
This choice implicitly treats all provisions summarized by the CRS as equally
important. While ideally I would weight by the importance of the provision, this choice
would be impractical given the scope of the study. This equality of provisions
summarized, though, is not a big problem because CRS is comprised of policy experts
who ―describ[e] the measure‘s most significant provisions.‖52
In other words, CRS has
already chosen the significant provisions. The coding team then codes those provisions
and I treat each of them equally.
Descriptive Statistics
As Table 3-2 indicates, the most common type of delegation in the dataset is
national with on average 75% of provisions (excluding ―other‖) delegated to national
entities, fitting the traditional perspective of bureaucratic delegation. The mean
proportion of provisions delegated to the states, in combination with national actors and
alone, is 0.22 and 0.03 respectively. Furthermore, the mean degree of decentralization in
a law is 0.249, which demonstrates that on average a quarter of the implementation
responsibility in significant national laws is delegated in some way to the states. In other
words, delegation of authority occurs not just to national actors, such as national-level
agencies, but also to the states.
Overall, I show federal delegation choices in Figure 3-1 (across all provisions and
including the ―other‖ category) and federal delegation choices for each year in the dataset
52
The quote is from the THOMAS website listed below. The Congressional Research Service has existed
since its statutory establishment in 1914 (then called the Legislative Reference Service). A major
reorganization occurred in 1970 with the Legislative Reorganization Act expanding the duties of the
department and changing the name. A consideration of CRS summaries prior to 1970 reveals substantial
differences in the amount of information provided in those summaries from those post-1970. The span of
this study is 1973-2008 due to these variations and the ability to access them electronically through
THOMAS. Some changes over subsequent years have likely occurred in CRS as well and will result in
measurement/coding errors. No changes have been publicized such that scholars can review the potential
impact of any changes. Information about CRS can be found at http://www.loc.gov/crsinfo/whatscrs.html
and information about the summaries at http://thomas.loc.gov/bss/abt_dgst.html.
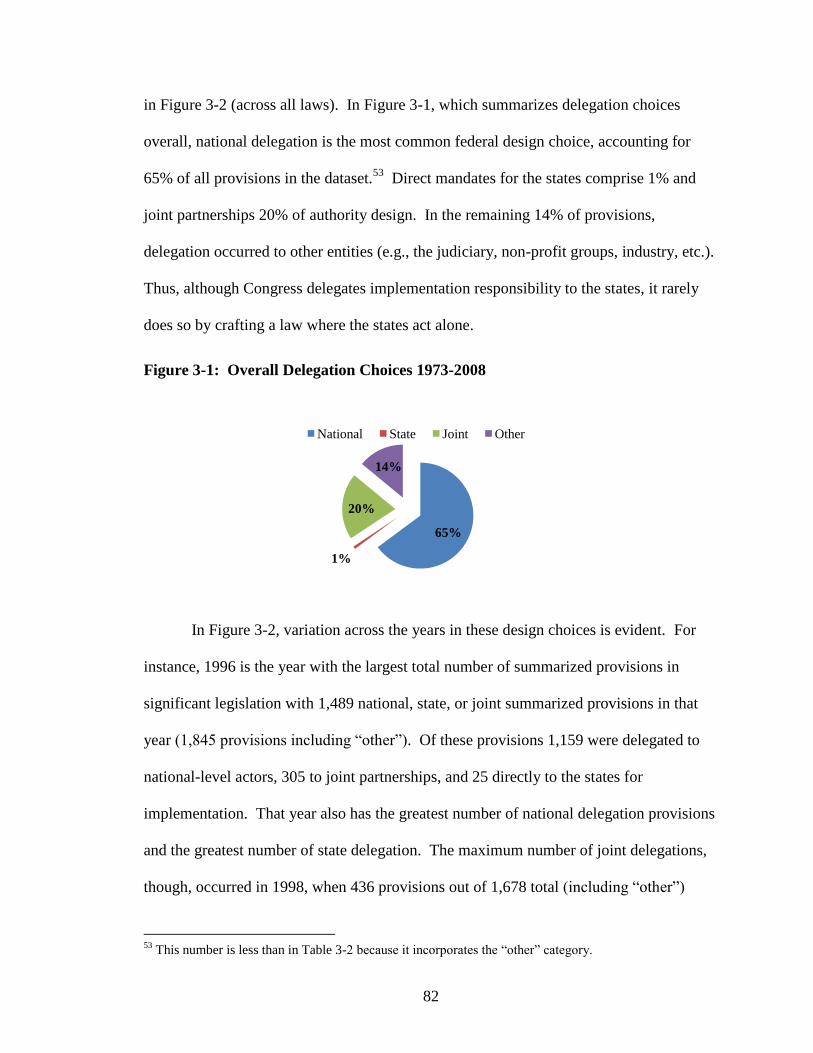
82
in Figure 3-2 (across all laws). In Figure 3-1, which summarizes delegation choices
overall, national delegation is the most common federal design choice, accounting for
65% of all provisions in the dataset.53
Direct mandates for the states comprise 1% and
joint partnerships 20% of authority design. In the remaining 14% of provisions,
delegation occurred to other entities (e.g., the judiciary, non-profit groups, industry, etc.).
Thus, although Congress delegates implementation responsibility to the states, it rarely
does so by crafting a law where the states act alone.
Figure 3-1: Overall Delegation Choices 1973-2008
In Figure 3-2, variation across the years in these design choices is evident. For
instance, 1996 is the year with the largest total number of summarized provisions in
significant legislation with 1,489 national, state, or joint summarized provisions in that
year (1,845 provisions including ―other‖). Of these provisions 1,159 were delegated to
national-level actors, 305 to joint partnerships, and 25 directly to the states for
implementation. That year also has the greatest number of national delegation provisions
and the greatest number of state delegation. The maximum number of joint delegations,
though, occurred in 1998, when 436 provisions out of 1,678 total (including ―other‖)
53
This number is less than in Table 3-2 because it incorporates the ―other‖ category.
65%
1%
20%
14%
National State Joint Other
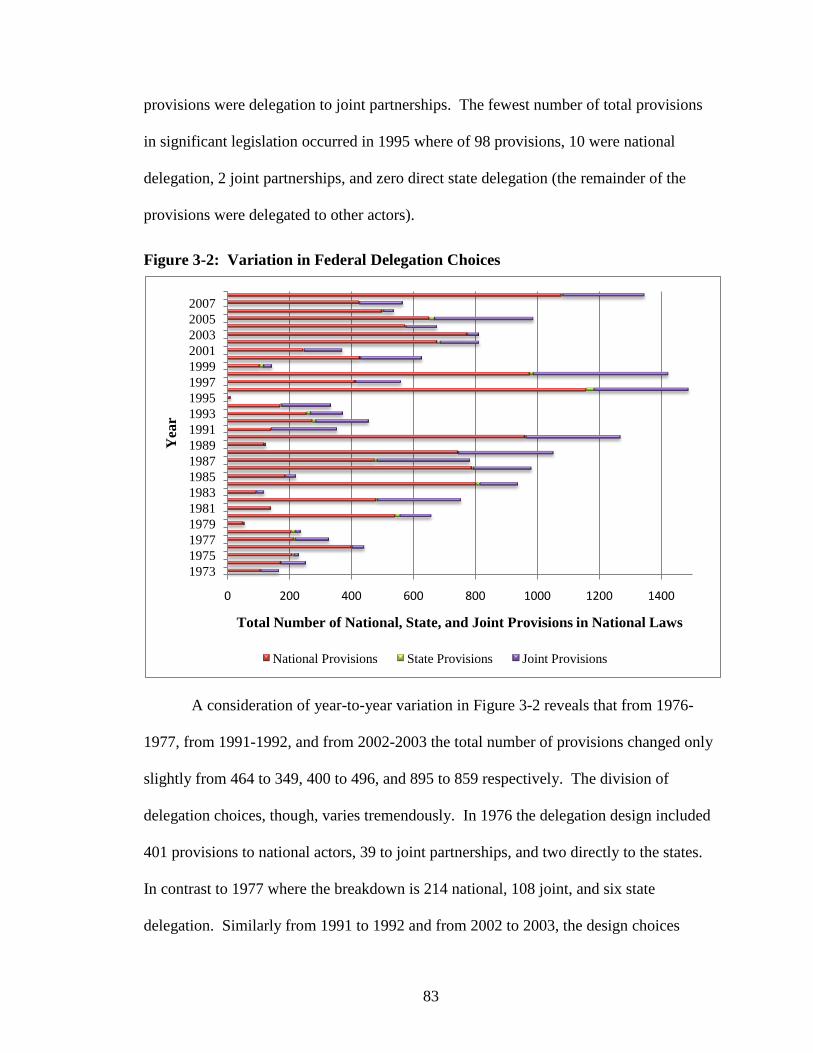
83
provisions were delegation to joint partnerships. The fewest number of total provisions
in significant legislation occurred in 1995 where of 98 provisions, 10 were national
delegation, 2 joint partnerships, and zero direct state delegation (the remainder of the
provisions were delegated to other actors).
Figure 3-2: Variation in Federal Delegation Choices
A consideration of year-to-year variation in Figure 3-2 reveals that from 1976-
1977, from 1991-1992, and from 2002-2003 the total number of provisions changed only
slightly from 464 to 349, 400 to 496, and 895 to 859 respectively. The division of
delegation choices, though, varies tremendously. In 1976 the delegation design included
401 provisions to national actors, 39 to joint partnerships, and two directly to the states.
In contrast to 1977 where the breakdown is 214 national, 108 joint, and six state
delegation. Similarly from 1991 to 1992 and from 2002 to 2003, the design choices
0 200 400 600 800 1000 1200 1400
1973
1975
1977
1979
1981
1983
1985
1987
1989
1991
1993
1995
1997
1999
2001
2003
2005
2007
Total Number of National, State, and Joint Provisions in National Laws
Yea
r
National Provisions State Provisions Joint Provisions
84
differ. Specifically, 141 of the provisions were delegated to national actors and 213 to
joint partnerships (zero to the states alone) in 1991, but in 1992 national, joint, and state
delegation occurred in 275, 169, and 11 provisions. And, from 2002 to 2003 the
delegation choices changed from 676 national, 126 joint, and 11 state to 777 national, 36
joint, and one state.
Another way to look at the data is that a law can be characterized by all three
values: proportion national delegation, proportion joint partnership delegation, and
proportion state delegation. These three proportions are the federal authority composition
of each law in the dataset and are more easily visualized in a ternary diagram as shown in
Figure 3-3. Each of the 179 laws is represented by one dot in the diagram (dots are
colored by the 4-year time period in which the law was made), where the left lower
corner represents laws mainly delegated to national executive branch agents, the right
lower corner delegation directly to the states, and the apex represents delegation via joint
partnerships. A law that delegates equally to the states, national agents, and joint
partnerships (33.3% state, 33.3% national, and 33.3% joint) would be represented by a
dot in the exact center of the triangle.
There are three petals defined by the dotted lines meeting in the center and the
three outside edges. Laws that fall within the left petal represent those laws where the
delegation of the provisions is mostly to national level agents. The farther a law is
located from the lower left corner within this petal, the more the delegation design
includes state delegation, either through joint partnerships (as the dots drift upward) or
direct state delegation (as the dots fall to the right). The right-most petal includes laws
where direct delegation to the states is the most common choice, which are only five laws
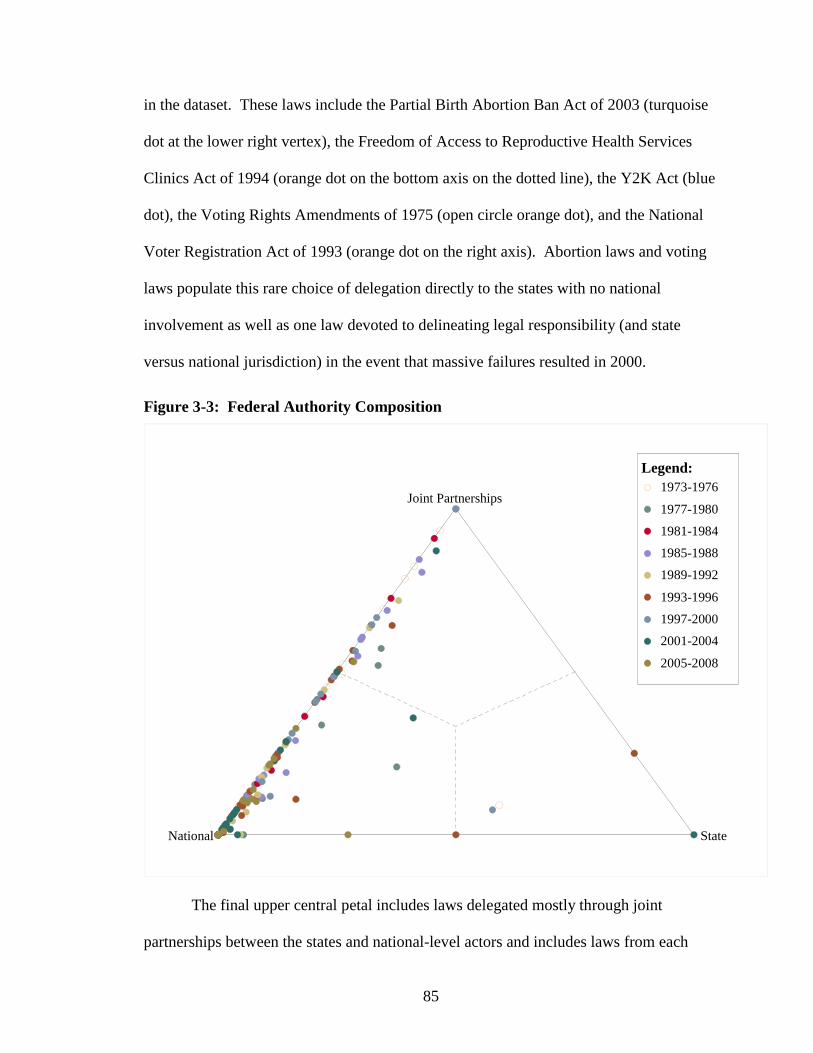
85
in the dataset. These laws include the Partial Birth Abortion Ban Act of 2003 (turquoise
dot at the lower right vertex), the Freedom of Access to Reproductive Health Services
Clinics Act of 1994 (orange dot on the bottom axis on the dotted line), the Y2K Act (blue
dot), the Voting Rights Amendments of 1975 (open circle orange dot), and the National
Voter Registration Act of 1993 (orange dot on the right axis). Abortion laws and voting
laws populate this rare choice of delegation directly to the states with no national
involvement as well as one law devoted to delineating legal responsibility (and state
versus national jurisdiction) in the event that massive failures resulted in 2000.
Figure 3-3: Federal Authority Composition
The final upper central petal includes laws delegated mostly through joint
partnerships between the states and national-level actors and includes laws from each
National
Joint Partnerships
State
Legend:
1973-1976
1977-1980
1981-1984
1985-1988
1989-1992
1993-1996
1997-2000
2001-2004
2005-2008
86
four-year increment. The variation in all petals in Figure 3-3 demonstrates that scholars
who ignore the states as a delegation choice neglect aspects of the laws that do not fall
exactly on the lower left hand point of the triangle. Furthermore, by looking at the
delegation of authority in individual laws, across all laws, and over time, it is apparent
that not only do existing bureaucratic delegation arguments overlook an important
delegation choice in the states; but also this choice exhibits variation in need of an
explanation.
Focusing on specific examples of delegation choices and the degree of
decentralization provides evidence of the variation of federal design choices and what
these aggregate numbers look like from a different angle. In an act that amends the Civil
Rights Act of 1964 (PL 102-166), Congress gave the Equal Employment Opportunity
Commission (EEOC) the authority to establish the Technical Assistance Training
Institute, which provides technical assistance and training for the laws that the EEOC
enforces. It also requires the EEOC to carry out these activities and target specific groups
of individuals (e.g., those who have not been ―equitably served by the EEOC‖). The
states are only mentioned once in this law—in title I: ―Amends Federal law to declare
that: (1) for purposes of provisions relating to equal rights under the law, the right to
make and enforce contracts includes…; and (2) the rights protected by the amended
provisions are protected against impairment by nongovernmental discrimination and
impairment under color of State law.‖ This law is 100% national and has a
decentralization score of zero. Similarly, the Family and Temporary Medical Leave Act
(PL 103-003) is also 100% national, with a decentralization of zero. In this law,
Congress delegated authority to the Secretary of Labor to prescribe regulations,
87
investigate, and enforce the provisions of the Act, but gave no authority to the states.
Interestingly, the Act also established a Commission on Leave to research (among other
things) alternative and equivalent state enforcement of the Act.
Other laws give the states either partial or complete responsibility. For example,
in contrast to the Civil Rights Act amendment and the Medical Leave Act, joint
partnership policies are dominant choices in the Brady Handgun Violence Prevention Act
(PL 103-159) and in the No Child Left Behind Act (PL 107-110). In the Brady Handgun
Act, the Attorney General is directed to determine deadlines by which states should
provide an on-line system for documents and permits grants to states for such record
systems. This law codes at 8% national, 91% joint, and 1% state yielding a
decentralization score of 0.465 (0.8*0 +0.91*0.5 + 0.01*1). In No Child Left Behind, the
majority of the provisions establishes procedures, planning, and reporting and provides
allocation requirements for the states and the Secretary of Education (10.6% national,
87.1% joint, and 2.3% state with a decentralization score of 0.459).
Direct delegation to the states is the most prevalent choice in the Partial Birth
Abortion Ban (PL 108-105), as well as the National Voter Registration Act of 1993 (PL
103-031). In the Partial Birth Abortion Ban a defendant accused under the Act could
seek a hearing before the State Medical Board on the physician‘s conduct (not a national
or joint body). This law has a decentralization score of 1 and is 100% state delegation.
The National Voter Registration Act set forth a variety of requirements and permissions
for the states but provided little national involvement in the implementation of the Act
(0% national, 25% joint, and 75% state with a decentralization score of 0.875).
88
Limitations
While this method provides an excellent measure of decentralization of authority,
one that compares with general views of these laws, it does have flaws. The
decentralization score is a blunt measure of responsibility for implementation, not a
measure of true authority over the policy. I do not measure the amount of discretion each
actor has over the provisions for which it is responsible, nor do I attempt to measure the
amount of national control versus state control in each of the joint provisions. In effect,
then, this measurement strategy provides a view of implementation responsibility—not
specific determinations of actor authority and discretion. From a theoretical perspective, I
do not consider discretion.54
Empirically I consider different versions of the measure,
including assigning joint provisions the same value as state provisions and dichotomizing
the delegation into mostly state versus mostly national laws. The results reported in
Chapter 4 are robust to these changes.
Joint Policies
To my knowledge, this is the first study to consider and separately analyze joint
partnership policies. Scholars in federalism and bureaucratic delegation hint at two
potential relationships that may be at the heart of the delegation of a federal combination
of policy authority. First, along the lines of Chubb‘s double pyramid of federal actors,
national legislators may delegate first to a national agency that is then authorized to sub-
delegate authority to state-level agencies (1985). Alternatively, national legislators may
54
With respect to discretion, it is as if I have held discretion constant across laws. In the aggregate
empirical analyses, I conducted one simple test of the effects of variation in discretion, by incorporating a
variable in the empirical analyses measuring the number of words per law as a rough proxy for discretion
(Huber and Shipan 2002, Randazzo et al., 2006). This variable was not statistically significant, did not
improve the fit of the models, and did not change the substantive findings reported.
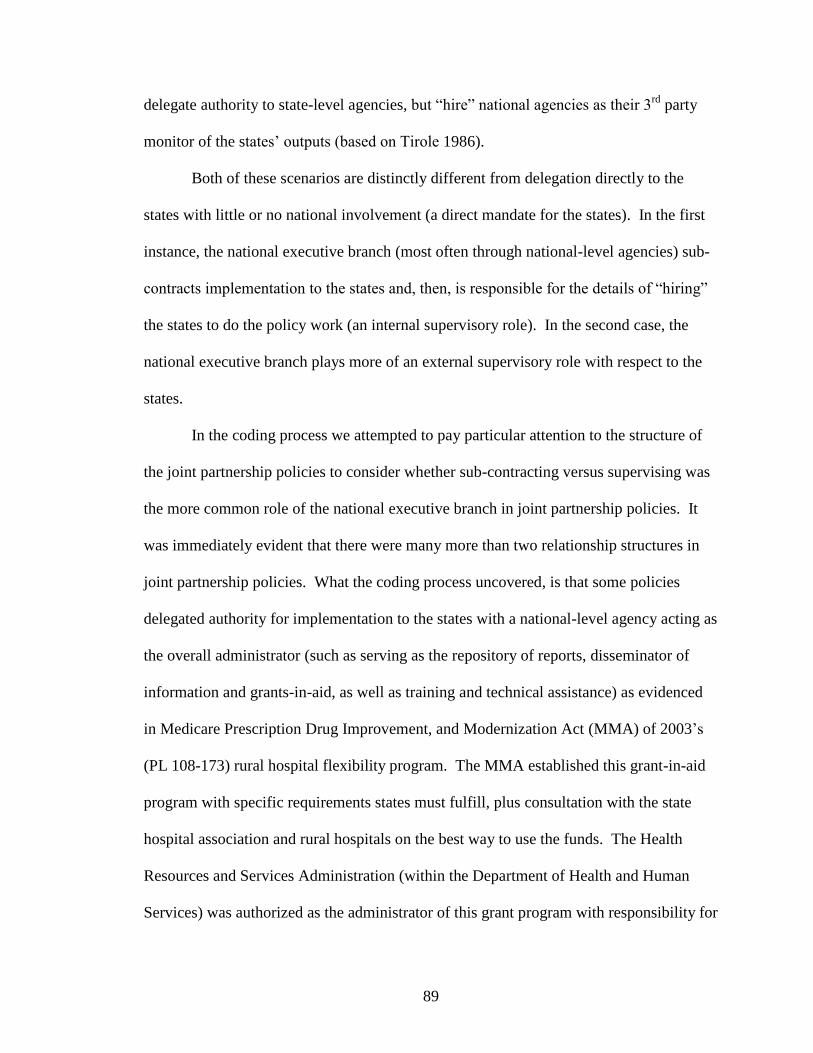
89
delegate authority to state-level agencies, but ―hire‖ national agencies as their 3rd
party
monitor of the states‘ outputs (based on Tirole 1986).
Both of these scenarios are distinctly different from delegation directly to the
states with little or no national involvement (a direct mandate for the states). In the first
instance, the national executive branch (most often through national-level agencies) sub-
contracts implementation to the states and, then, is responsible for the details of ―hiring‖
the states to do the policy work (an internal supervisory role). In the second case, the
national executive branch plays more of an external supervisory role with respect to the
states.
In the coding process we attempted to pay particular attention to the structure of
the joint partnership policies to consider whether sub-contracting versus supervising was
the more common role of the national executive branch in joint partnership policies. It
was immediately evident that there were many more than two relationship structures in
joint partnership policies. What the coding process uncovered, is that some policies
delegated authority for implementation to the states with a national-level agency acting as
the overall administrator (such as serving as the repository of reports, disseminator of
information and grants-in-aid, as well as training and technical assistance) as evidenced
in Medicare Prescription Drug Improvement, and Modernization Act (MMA) of 2003‘s
(PL 108-173) rural hospital flexibility program. The MMA established this grant-in-aid
program with specific requirements states must fulfill, plus consultation with the state
hospital association and rural hospitals on the best way to use the funds. The Health
Resources and Services Administration (within the Department of Health and Human
Services) was authorized as the administrator of this grant program with responsibility for
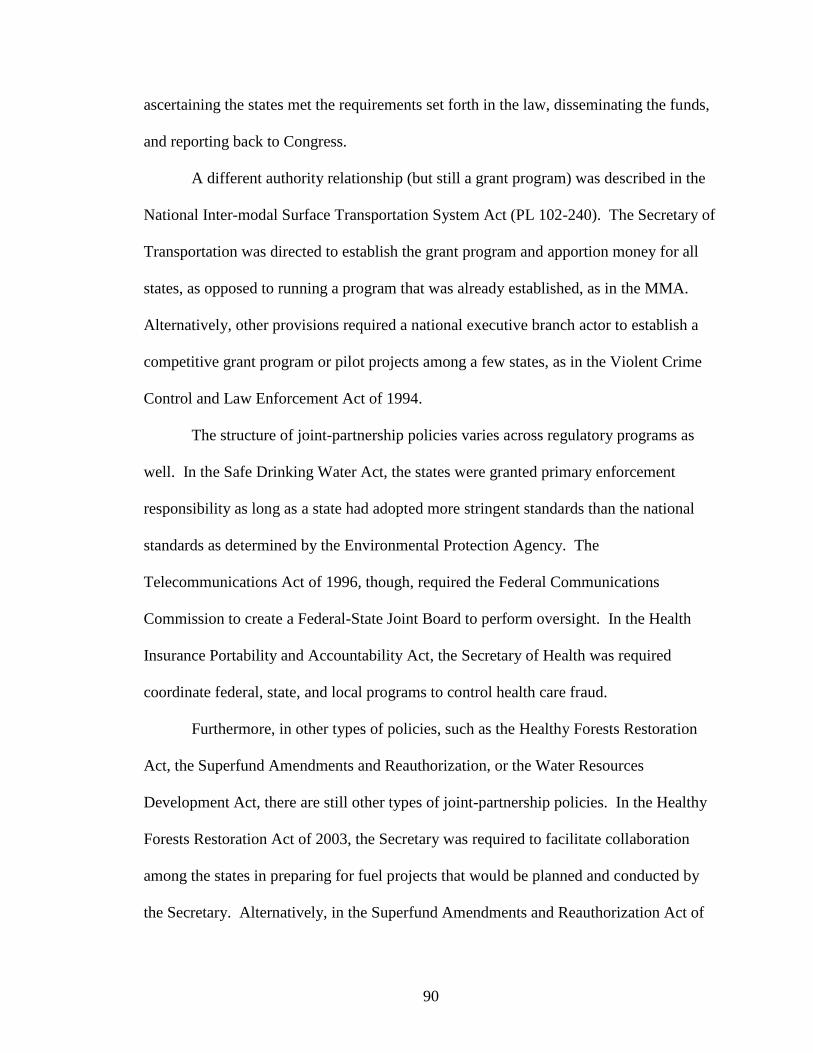
90
ascertaining the states met the requirements set forth in the law, disseminating the funds,
and reporting back to Congress.
A different authority relationship (but still a grant program) was described in the
National Inter-modal Surface Transportation System Act (PL 102-240). The Secretary of
Transportation was directed to establish the grant program and apportion money for all
states, as opposed to running a program that was already established, as in the MMA.
Alternatively, other provisions required a national executive branch actor to establish a
competitive grant program or pilot projects among a few states, as in the Violent Crime
Control and Law Enforcement Act of 1994.
The structure of joint-partnership policies varies across regulatory programs as
well. In the Safe Drinking Water Act, the states were granted primary enforcement
responsibility as long as a state had adopted more stringent standards than the national
standards as determined by the Environmental Protection Agency. The
Telecommunications Act of 1996, though, required the Federal Communications
Commission to create a Federal-State Joint Board to perform oversight. In the Health
Insurance Portability and Accountability Act, the Secretary of Health was required
coordinate federal, state, and local programs to control health care fraud.
Furthermore, in other types of policies, such as the Healthy Forests Restoration
Act, the Superfund Amendments and Reauthorization, or the Water Resources
Development Act, there are still other types of joint-partnership policies. In the Healthy
Forests Restoration Act of 2003, the Secretary was required to facilitate collaboration
among the states in preparing for fuel projects that would be planned and conducted by
the Secretary. Alternatively, in the Superfund Amendments and Reauthorization Act of
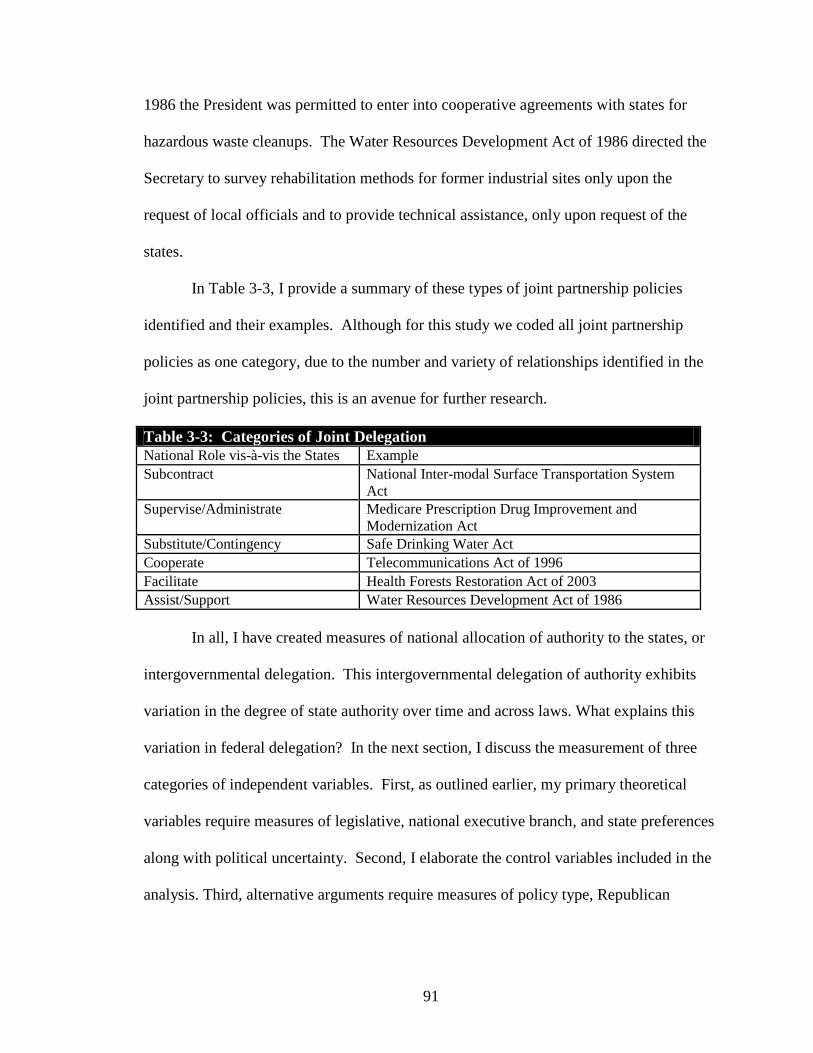
91
1986 the President was permitted to enter into cooperative agreements with states for
hazardous waste cleanups. The Water Resources Development Act of 1986 directed the
Secretary to survey rehabilitation methods for former industrial sites only upon the
request of local officials and to provide technical assistance, only upon request of the
states.
In Table 3-3, I provide a summary of these types of joint partnership policies
identified and their examples. Although for this study we coded all joint partnership
policies as one category, due to the number and variety of relationships identified in the
joint partnership policies, this is an avenue for further research.
Table 3-3: Categories of Joint Delegation
National Role vis-à-vis the States Example
Subcontract National Inter-modal Surface Transportation System
Act
Supervise/Administrate Medicare Prescription Drug Improvement and
Modernization Act
Substitute/Contingency Safe Drinking Water Act
Cooperate Telecommunications Act of 1996
Facilitate Health Forests Restoration Act of 2003
Assist/Support Water Resources Development Act of 1986
In all, I have created measures of national allocation of authority to the states, or
intergovernmental delegation. This intergovernmental delegation of authority exhibits
variation in the degree of state authority over time and across laws. What explains this
variation in federal delegation? In the next section, I discuss the measurement of three
categories of independent variables. First, as outlined earlier, my primary theoretical
variables require measures of legislative, national executive branch, and state preferences
along with political uncertainty. Second, I elaborate the control variables included in the
analysis. Third, alternative arguments require measures of policy type, Republican
92
national government, partisan congruence, and election year. I now discuss the
measurement and operationalization of these variables.
Intergovernmental Delegation Theoretical Explanators
Preferences
The preferences of Congress, the national executive branch, and the states play a
crucial role in the theoretical model. Unfortunately, one problem I face is the need to use
the same metric for the preferences of Congress, the national executive branch, and the
states—particularly because I need to calculate distances between these entities to test the
implications of the theory. No such measure exists across my entire sample. Although at
the national level I could use DW-NOMINATE scores, averaged across both chambers
and for the president, the same measure does not exist across time for the states.55
One possible operationalization of preferences is to use a blunt measure of
partisanship for the legislature, party of the president for the executive branch, and the
parties of the governors for the states. Other scholars have used partisanship as a proxy
for preferences, such as Berry et al. (2007) and Lupia et al. (2009) as well as all studies
that use divided government as a variable (e.g., Epstein and O‘Halloran 1999, Huber and
Shipan 2002, etc.). The benefit of using party is that the measure exists for all actors in
my model. The weaknesses of this approach include the following: (1) party may not
mean the same thing cross-sectionally and inter-temporally—a Democrat in Mississippi
55
Clinton and Lewis characterized national agency preferences using expert opinions and agency attributes
but the measures are not comparable to NOMINATE scores (2008). Nixon (2004) provides estimates of
the ideal points of the national legislature, agency commissioners (using service in both as the bridge) as do
Bailey and Chang (2001) but neither provides state-level ideal point estimates. Wright and Osborn (2002)
provide roll call data for state legislatures for 1999-2000 only. Shor et al. (2011) have spent many years
delineating a common space measure for presidents, Congress, and state legislatures, but this data was not
available for use at the time this study was completed.
93
may not mean the same thing as a Democrat in Massachusetts and a Republican in 1973
may not be the same as a Republican in 2003, (2) I will need to assume a dichotomous
measure of party can be meaningfully aggregated for the states, and (3) to assume this
measure can provide information about distances between actors. Each of these issues is
discussed below.
The Concept of Party
Does party actually measure the same phenomenon across the units (e.g., states,
executive branch, and Congress) and over the time period of my study? The answer is
that it does not—the Democratic and Republican parties have changed over time and
never truly represent the same thing from state to state. Does this issue create a major
problem for the empirical analysis of a formal model based on distances between the
preferences of the actors involved? My model does not include temporal considerations
of preferences—so movement of the parties across time does not impede my cross-
sectional empirical analysis. Also, due to the theoretical framework I compare distances
between actors in the same state, not Democrats in Massachusetts to Democrats (or
Republicans) in Mississippi. In short, no it does not create a major problem for the
empirical analyses.
Thus, the party of the current president is used as a proxy for national executive
branch preferences. Although this measure misses nuances of agency preferences (that
can vary across agencies), it incorporates presidential power over agency leadership and
agency outputs (via review of rules and regulations, for instance). In addition, the
national executive branch includes not just delegation of authority to national agencies
but also to the president or independent commissions appointed by either the president or
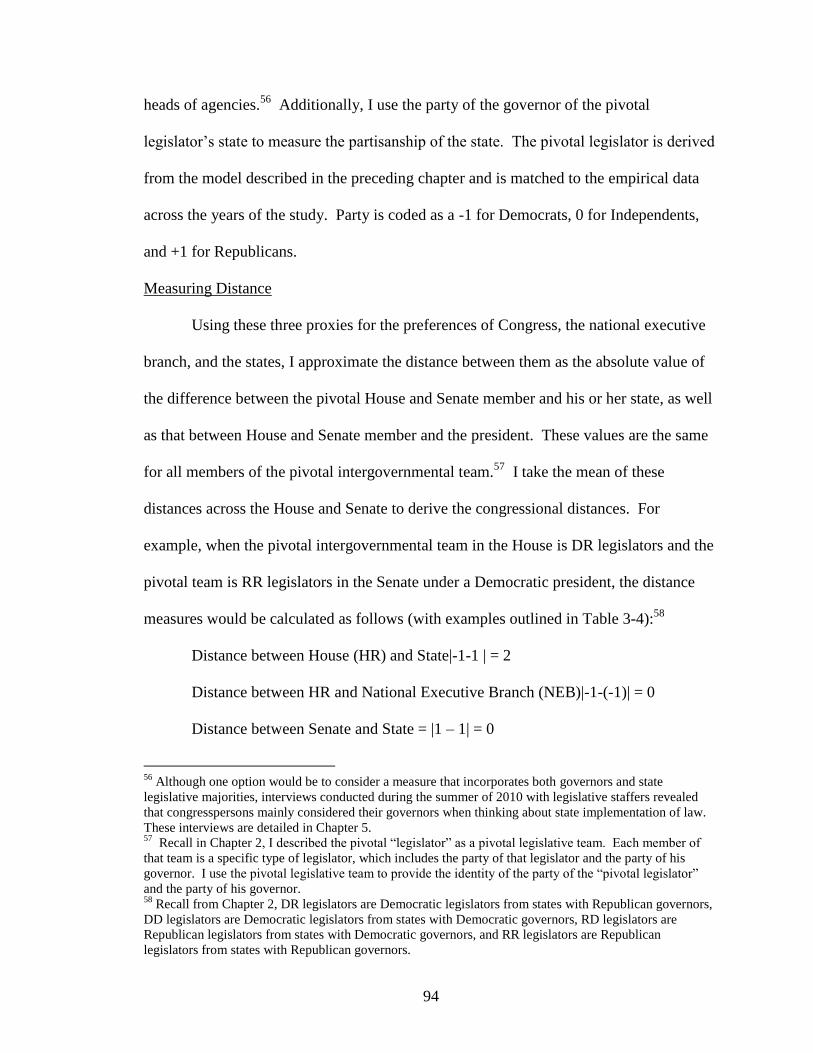
94
heads of agencies.56
Additionally, I use the party of the governor of the pivotal
legislator‘s state to measure the partisanship of the state. The pivotal legislator is derived
from the model described in the preceding chapter and is matched to the empirical data
across the years of the study. Party is coded as a -1 for Democrats, 0 for Independents,
and +1 for Republicans.
Measuring Distance
Using these three proxies for the preferences of Congress, the national executive
branch, and the states, I approximate the distance between them as the absolute value of
the difference between the pivotal House and Senate member and his or her state, as well
as that between House and Senate member and the president. These values are the same
for all members of the pivotal intergovernmental team.57
I take the mean of these
distances across the House and Senate to derive the congressional distances. For
example, when the pivotal intergovernmental team in the House is DR legislators and the
pivotal team is RR legislators in the Senate under a Democratic president, the distance
measures would be calculated as follows (with examples outlined in Table 3-4):58
Distance between House (HR) and State|-1-1 | = 2
Distance between HR and National Executive Branch (NEB)|-1-(-1)| = 0
Distance between Senate and State = |1 – 1| = 0
56
Although one option would be to consider a measure that incorporates both governors and state
legislative majorities, interviews conducted during the summer of 2010 with legislative staffers revealed
that congresspersons mainly considered their governors when thinking about state implementation of law.
These interviews are detailed in Chapter 5. 57
Recall in Chapter 2, I described the pivotal ―legislator‖ as a pivotal legislative team. Each member of
that team is a specific type of legislator, which includes the party of that legislator and the party of his
governor. I use the pivotal legislative team to provide the identity of the party of the ―pivotal legislator‖
and the party of his governor. 58
Recall from Chapter 2, DR legislators are Democratic legislators from states with Republican governors,
DD legislators are Democratic legislators from states with Democratic governors, RD legislators are
Republican legislators from states with Democratic governors, and RR legislators are Republican
legislators from states with Republican governors.
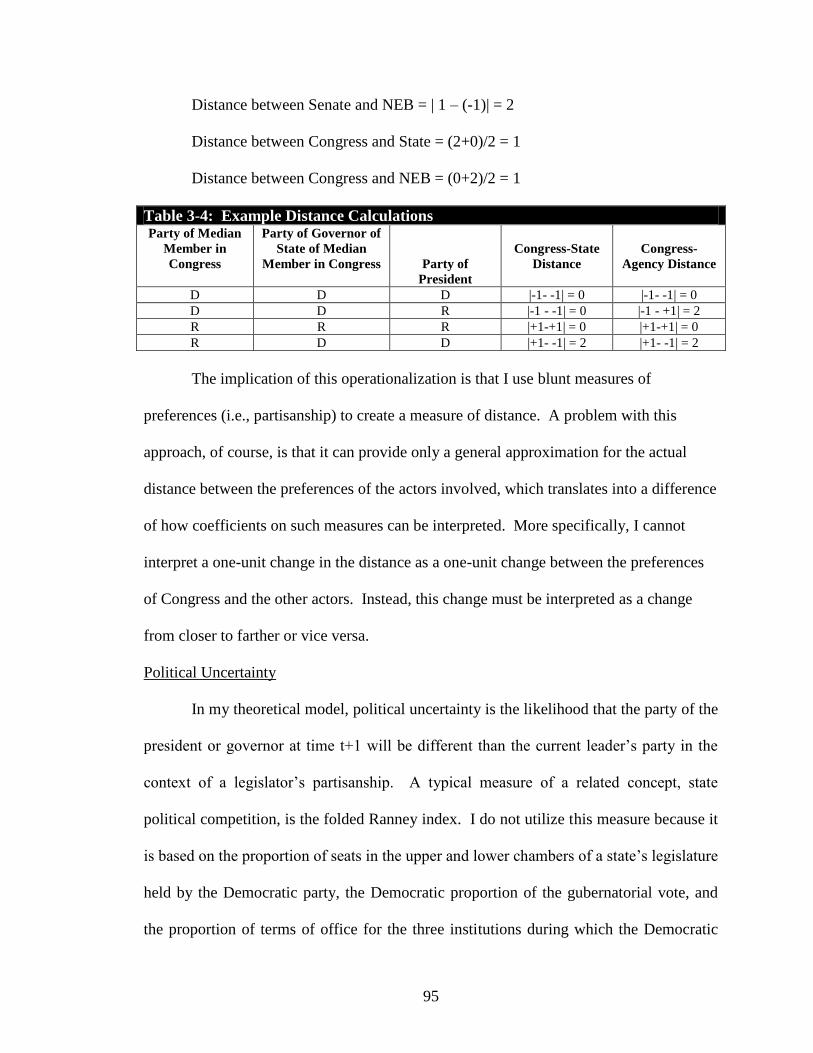
95
Distance between Senate and NEB = | 1 – (-1)| = 2
Distance between Congress and State = (2+0)/2 = 1
Distance between Congress and NEB = (0+2)/2 = 1
Table 3-4: Example Distance Calculations Party of Median
Member in
Congress
Party of Governor of
State of Median
Member in Congress
Party of
President
Congress-State
Distance
Congress-
Agency Distance
D D D |-1- -1| = 0 |-1- -1| = 0
D D R |-1 - -1| = 0 |-1 - +1| = 2
R R R |+1-+1| = 0 |+1-+1| = 0
R D D |+1- -1| = 2 |+1- -1| = 2
The implication of this operationalization is that I use blunt measures of
preferences (i.e., partisanship) to create a measure of distance. A problem with this
approach, of course, is that it can provide only a general approximation for the actual
distance between the preferences of the actors involved, which translates into a difference
of how coefficients on such measures can be interpreted. More specifically, I cannot
interpret a one-unit change in the distance as a one-unit change between the preferences
of Congress and the other actors. Instead, this change must be interpreted as a change
from closer to farther or vice versa.
Political Uncertainty
In my theoretical model, political uncertainty is the likelihood that the party of the
president or governor at time t+1 will be different than the current leader‘s party in the
context of a legislator‘s partisanship. A typical measure of a related concept, state
political competition, is the folded Ranney index. I do not utilize this measure because it
is based on the proportion of seats in the upper and lower chambers of a state‘s legislature
held by the Democratic party, the Democratic proportion of the gubernatorial vote, and
the proportion of terms of office for the three institutions during which the Democratic
96
party was in control. Instead, I need a measure of uncertainty over the partisanship of the
governor and the president.
To operationalize political uncertainty at the national and state level, therefore, I
begin by collecting the margin of electoral victory for each governor‘s race and each
presidential race from 1968 through 2008.59
The margin of victory is measured as the
absolute difference between the votes obtained by the top two opposing party candidates
for the governor. Specifically, I take the number of votes for the winning candidate,
subtract those for the second place candidate (as long as that candidate is from a different
party) and then divide by the total number of votes placed in that race to yield an
electoral margin score. Next, I create a rolling average of the past three elections‘
electoral margin for each year in the dataset.
Finally, I produce a separate column that includes the electoral margin in
executive election years and a 1 in the off election years (a dummy variable). To
measure state political uncertainty, I take the average of the rolling average column and
the electoral margin with dummy variables for the off election years‘ column. Recall,
though, that the theoretical model is based on a pivotal intergovernmental team of
legislators. Thus, I take the mean of the individual legislators‘ governors‘ political
uncertainty for each pivotal intergovernmental team of legislators across the years in the
dataset. As an example, if there are three legislators in the pivotal intergovernmental
team, I take the average of the political uncertainty of all three states during those years.
59
As an alternative, I measure the duration of a governor/President‘s political party in the executive branch.
For each year in the dataset, this measure is calculated as the pivotal legislator‘s governor‘s party duration
in years (the same is done for the president‘s party).
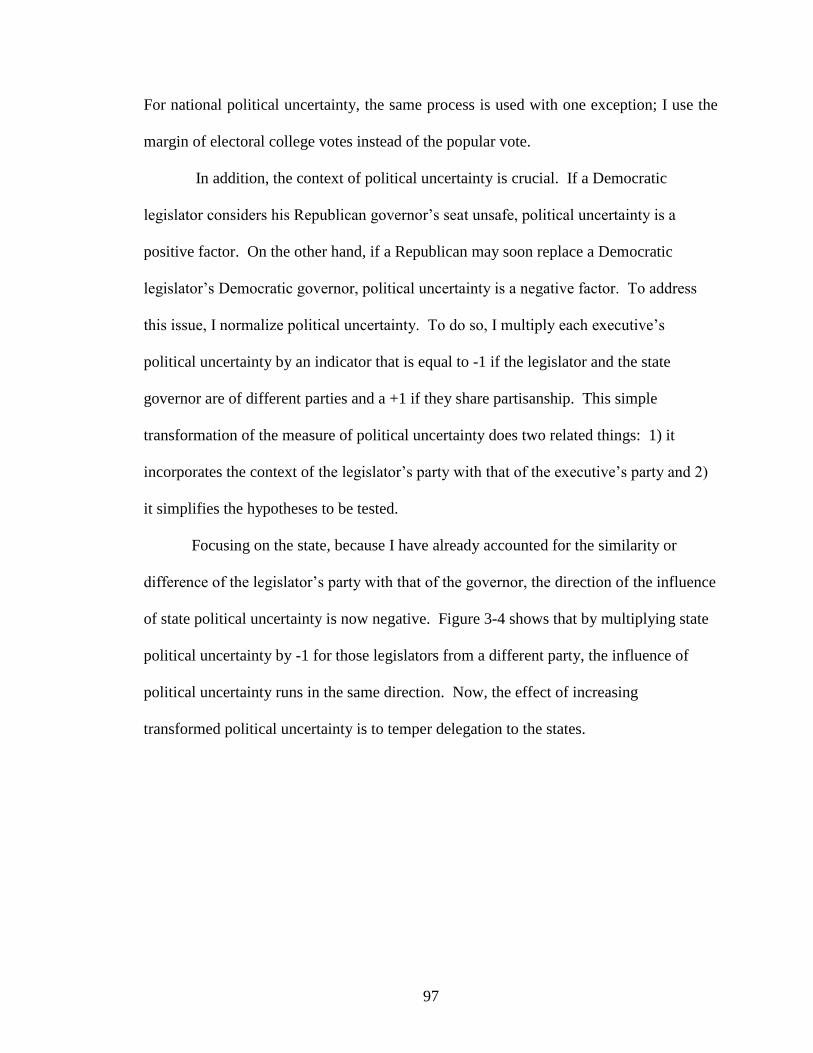
97
For national political uncertainty, the same process is used with one exception; I use the
margin of electoral college votes instead of the popular vote.
In addition, the context of political uncertainty is crucial. If a Democratic
legislator considers his Republican governor‘s seat unsafe, political uncertainty is a
positive factor. On the other hand, if a Republican may soon replace a Democratic
legislator‘s Democratic governor, political uncertainty is a negative factor. To address
this issue, I normalize political uncertainty. To do so, I multiply each executive‘s
political uncertainty by an indicator that is equal to -1 if the legislator and the state
governor are of different parties and a +1 if they share partisanship. This simple
transformation of the measure of political uncertainty does two related things: 1) it
incorporates the context of the legislator‘s party with that of the executive‘s party and 2)
it simplifies the hypotheses to be tested.
Focusing on the state, because I have already accounted for the similarity or
difference of the legislator‘s party with that of the governor, the direction of the influence
of state political uncertainty is now negative. Figure 3-4 shows that by multiplying state
political uncertainty by -1 for those legislators from a different party, the influence of
political uncertainty runs in the same direction. Now, the effect of increasing
transformed political uncertainty is to temper delegation to the states.
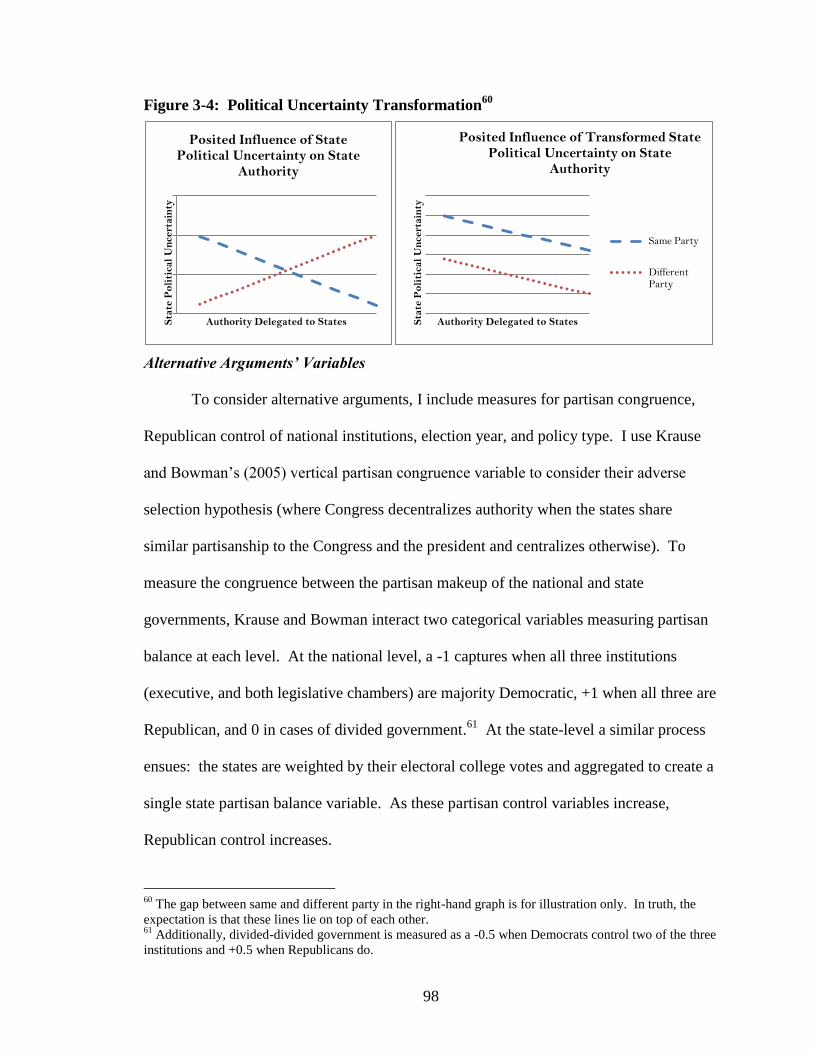
98
Figure 3-4: Political Uncertainty Transformation60
Alternative Arguments’ Variables
To consider alternative arguments, I include measures for partisan congruence,
Republican control of national institutions, election year, and policy type. I use Krause
and Bowman‘s (2005) vertical partisan congruence variable to consider their adverse
selection hypothesis (where Congress decentralizes authority when the states share
similar partisanship to the Congress and the president and centralizes otherwise). To
measure the congruence between the partisan makeup of the national and state
governments, Krause and Bowman interact two categorical variables measuring partisan
balance at each level. At the national level, a -1 captures when all three institutions
(executive, and both legislative chambers) are majority Democratic, +1 when all three are
Republican, and 0 in cases of divided government.61
At the state-level a similar process
ensues: the states are weighted by their electoral college votes and aggregated to create a
single state partisan balance variable. As these partisan control variables increase,
Republican control increases.
60
The gap between same and different party in the right-hand graph is for illustration only. In truth, the
expectation is that these lines lie on top of each other. 61
Additionally, divided-divided government is measured as a -0.5 when Democrats control two of the three
institutions and +0.5 when Republicans do.
Sta
te P
oli
tica
l U
nce
rtain
ty
Authority Delegated to States
Posited Influence of State Political Uncertainty on State
Authority
Sta
te P
oli
tica
l U
nce
rtain
ty
Authority Delegated to States
Posited Influence of Transformed State Political Uncertainty on State
Authority
Same Party
Different Party
99
In addition, I interact these national and state partisan balance variables following
Krause and Bowman to ―create a comprehensive national-state partisan interaction term
[that] taps into the degree of vertical partisan congruence between national and state level
political institutions‖ (372, Krause and Bowman 2005). Conventional wisdom suggests
that as Republican control increases (or as the national partisan balance measure
increases), state authority delegation will also increase.62
The interactive argument
forwarded by Krause and Bowman conjectures that as partisan congruence increases,
decentralization of authority to the states also increases.
To consider Nicholson-Crotty‘s (2008) contention that Congress refrains from
state mandates during election years, I create a variable coded as one during election
years (every two years) and zero otherwise. Finally, for Peterson‘s (1995) argument that
federal delegation is based on the type of policy considered, I create a variable using the
Policy Agenda‘s project topic and subtopic codes and Peterson‘s policy coding scheme
(198-201, 1995).63
Redistributive policies, according to Peterson, are those that
―reallocate societal resources from the haves to the have-nots,‖ in comparison to
developmental policies that ―provide the physical and social infrastructure necessary to
facilitate a country‘s economic growth‖ (17, 1995).64
He argues that redistributive
policies are more efficient if centralized and developmental policies are more efficient if
62
I also utilize simple dummy variables of party for the majority in the House, majority in the Senate, and
party of the president as well as categorical measures for when Republicans control these three institutions
at the national level. The results do not differ dramatically from using national partisan balance. 63
The Policy Agenda‘s Project Topic Codebook was accessed from the Fall, 2008 through the Fall, 2009 at
http://www.policyagendas.org/codebooks/topicindex.html. 64
Peterson includes transportation, natural resources, safety, education, and utilities as developmental
policies and redistributive policies as pensions/medical insurance, welfare, health and hospitals and
housing. I checked the robustness of the findings with respect to including education as a developmental
policy and then as a redistributive policy and found no significant difference in the results. I include
education as a redistributive policy in the reported analysis. Policy areas are obtained from the Policy
Agendas Project (Jones, Wilkerson, and Baumgartner 2008).
100
decentralized. For efficiency reasons, then, legislators will opt to centralize redistributive
policies and decentralize developmental policies (Peterson 1995). For this variable,
developmental policy is coded as 0 and a redistributive policy as 1. The descriptive
statistics for each of these variables are summarized in the appendix.
Control Variables
There are a variety of other variables that are expected to influence the delegation
of authority to the states. Scholars commonly control for the federal deficit, state fiscal
health, traditional state policies, an activist national government, and unified government
(Krause and Bowman 2005, Nicholson-Crotty 2008).65
The federal deficit or surplus
measure was obtained from the Budget of the United States Government, Fiscal Year
2008 Historical Tables. I utilize the previous year‘s surplus or deficit as a percentage of
the gross domestic product measured in constant fiscal year 2000 dollars. As the federal
deficit increases, if national legislators are off-loading some costs to the states, state
responsibility will increase. State fiscal status is measured as the previous year‘s percent
change in revenues as obtained from the U.S. Census Bureau State Government Finances
website (in addition to archived historical data provided via email from the Census
Bureau). I use state own-source revenues at time t and derive the percent change in these
revenues (100*[revenue at time t – revenue at time t-1]/revenue at t-1). As state revenues
increase, state responsibility is expected to increase.
65
Although not commonly included in studies of decentralization, I also incorporated controls for
heterogeneity of state governors, heterogeneity of the majority party in each chamber, percent majority in
each chamber, a blunt dichotomous measure of the technical uncertainty of the policy, and various time
trends as these factors could potentially account for differences in delegation strategies. These variables
were statistically insignificant (with the exception of percent majority in the Senate) and did not alter the
empirical results reported in Chapter 4. Moreover, I included a temporal variable that measures years from
1973 that ranges from zero (at 1973) to 34 (at 2007) (as well as nonlinear versions of a time trend) but
dropped this variable from the analysis due to lack of improvement in the models and high correlation with
many of the other variables such as federal deficit.
101
As for traditional state policies, an activist public, and unified government, I
include a rough proxy for the status quo level of state authority by including a dummy for
policies that are considered to be traditional state policies (Gostin, 2002). These policies
include education, health, and social welfare, which are coded as 1, while other policy
areas are coded as 0. During the time span of my study, the federal government had
already entered these traditional realms of state policy. I expect, though, that state
authority delegation will be positively associated with traditional state policy areas in
comparison to other types of policies.
I use Krehbiel‘s (1998) version of a public mood variable to control for more
activist years in the study. This variable is coded as a 4 in 1973 and decrements one step
each year until reaching a 1 in 1976 and a 0 for each year thereafter. I expect these years
to be associated with centralization of authority at the national level (due to an activist
public), thus the direction of the effect of this variable on state authority allocation will be
negative. Finally, I incorporate unified government by coding a dummy variable that is
one during times of unified government (when the House, Senate, and president are of the
same political party) and zero otherwise. Based on speculations that legislators may use
delegation to the states in order to move policy forward during politically contentious
times, I expect movement from a unified government to a divided government to be
associated with an increase in delegation to the states. The descriptive statistics for all
right-hand side variables are shown in Tables 3-5 through 3-7.
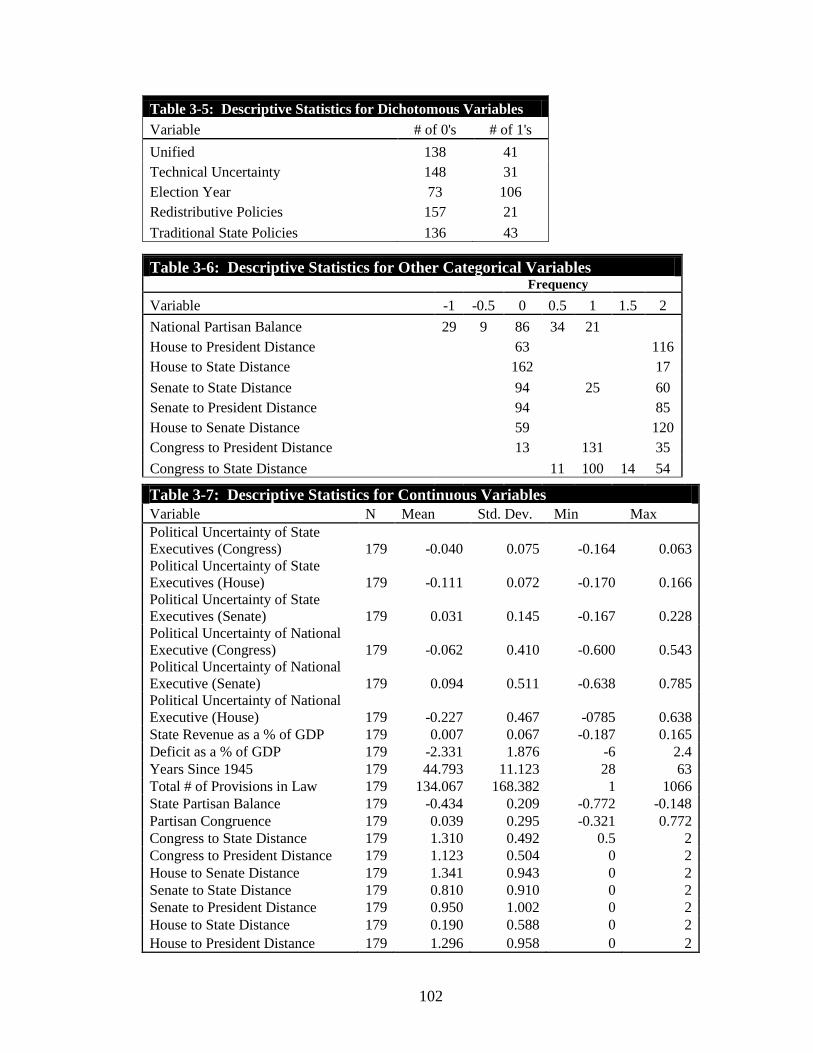
102
Table 3-5: Descriptive Statistics for Dichotomous Variables
Variable # of 0's # of 1's
Unified 138 41
Technical Uncertainty 148 31
Election Year 73 106
Redistributive Policies 157 21
Traditional State Policies 136 43
Table 3-6: Descriptive Statistics for Other Categorical Variables Frequency
Variable -1 -0.5 0 0.5 1 1.5 2
National Partisan Balance 29 9 86 34 21
House to President Distance
63
116
House to State Distance
162
17
Senate to State Distance
94
25
60
Senate to President Distance
94
85
House to Senate Distance
59
120
Congress to President Distance
13
131
35
Congress to State Distance 11 100 14 54
Table 3-7: Descriptive Statistics for Continuous Variables
Variable N Mean Std. Dev. Min Max
Political Uncertainty of State
Executives (Congress) 179 -0.040 0.075 -0.164 0.063
Political Uncertainty of State
Executives (House) 179 -0.111 0.072 -0.170 0.166
Political Uncertainty of State
Executives (Senate) 179 0.031 0.145 -0.167 0.228
Political Uncertainty of National
Executive (Congress) 179 -0.062 0.410 -0.600 0.543
Political Uncertainty of National
Executive (Senate) 179 0.094 0.511 -0.638 0.785
Political Uncertainty of National
Executive (House) 179 -0.227 0.467 -0785 0.638
State Revenue as a % of GDP 179 0.007 0.067 -0.187 0.165
Deficit as a % of GDP 179 -2.331 1.876 -6 2.4
Years Since 1945 179 44.793 11.123 28 63
Total # of Provisions in Law 179 134.067 168.382 1 1066
State Partisan Balance 179 -0.434 0.209 -0.772 -0.148
Partisan Congruence 179 0.039 0.295 -0.321 0.772
Congress to State Distance 179 1.310 0.492 0.5 2
Congress to President Distance 179 1.123 0.504 0 2
House to Senate Distance 179 1.341 0.943 0 2
Senate to State Distance 179 0.810 0.910 0 2
Senate to President Distance 179 0.950 1.002 0 2
House to State Distance 179 0.190 0.588 0 2
House to President Distance 179 1.296 0.958 0 2
103
CONCLUSION
In summary, I have created an innovative approach to studying federal delegation
of authority or centralization and decentralization decisions empirically by coding
significant legislation from 1973 through 2009. I have utilized publicly available data to
collect the remaining parameters of interest to evaluate the factors I argue are related to
Congress‘ decision about when the states are given more or less authority in national law.
These parameters include the distance between the preferences of Congress and the
states, Congress and the national executive branch, and state and national political
uncertainty. I have also collected the variables necessary to test existing theories of
centralization as competing hypotheses. Later chapters provide large-N and small-N
analyses incorporating these measures.
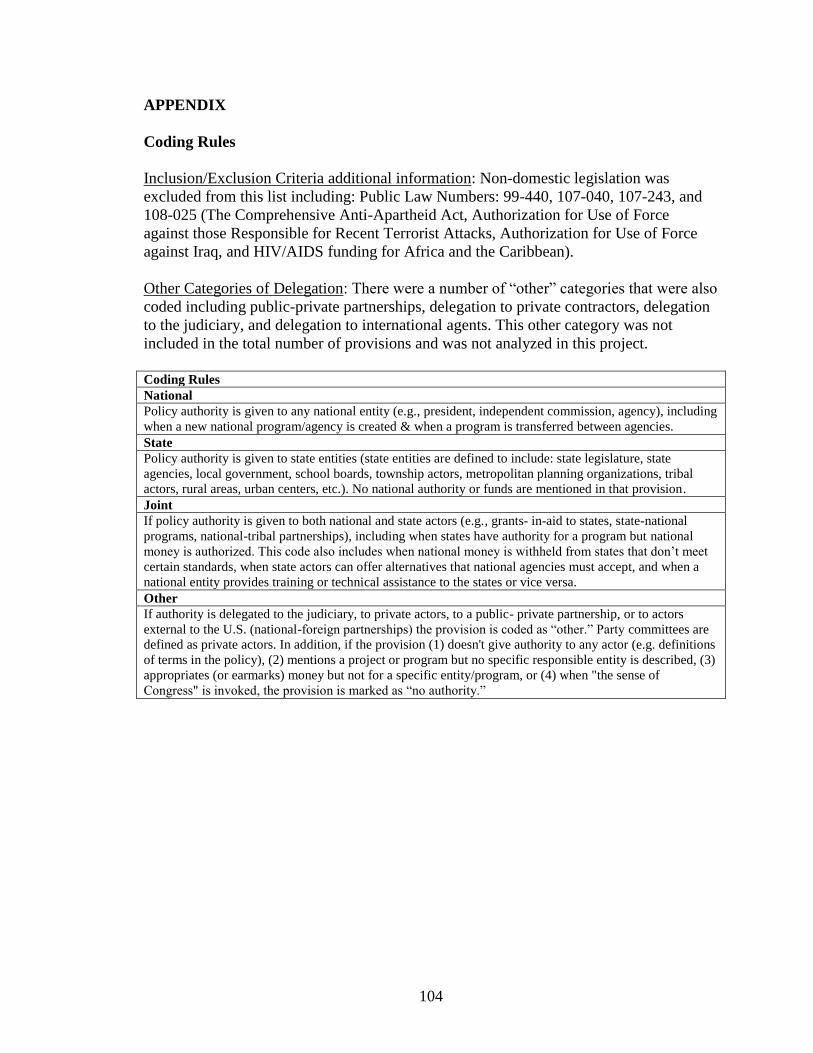
104
APPENDIX
Coding Rules
Inclusion/Exclusion Criteria additional information: Non-domestic legislation was
excluded from this list including: Public Law Numbers: 99-440, 107-040, 107-243, and
108-025 (The Comprehensive Anti-Apartheid Act, Authorization for Use of Force
against those Responsible for Recent Terrorist Attacks, Authorization for Use of Force
against Iraq, and HIV/AIDS funding for Africa and the Caribbean).
Other Categories of Delegation: There were a number of ―other‖ categories that were also
coded including public-private partnerships, delegation to private contractors, delegation
to the judiciary, and delegation to international agents. This other category was not
included in the total number of provisions and was not analyzed in this project.
Coding Rules
National
Policy authority is given to any national entity (e.g., president, independent commission, agency), including
when a new national program/agency is created & when a program is transferred between agencies.
State
Policy authority is given to state entities (state entities are defined to include: state legislature, state
agencies, local government, school boards, township actors, metropolitan planning organizations, tribal
actors, rural areas, urban centers, etc.). No national authority or funds are mentioned in that provision.
Joint
If policy authority is given to both national and state actors (e.g., grants- in-aid to states, state-national
programs, national-tribal partnerships), including when states have authority for a program but national
money is authorized. This code also includes when national money is withheld from states that don‘t meet
certain standards, when state actors can offer alternatives that national agencies must accept, and when a
national entity provides training or technical assistance to the states or vice versa.
Other
If authority is delegated to the judiciary, to private actors, to a public- private partnership, or to actors
external to the U.S. (national-foreign partnerships) the provision is coded as ―other.‖ Party committees are
defined as private actors. In addition, if the provision (1) doesn't give authority to any actor (e.g. definitions
of terms in the policy), (2) mentions a project or program but no specific responsible entity is described, (3)
appropriates (or earmarks) money but not for a specific entity/program, or (4) when "the sense of
Congress" is invoked, the provision is marked as ―no authority.‖
105
Coding Protocol for Federal Policy Delegation
Pam Clouser McCann
January 4, 2010
University of Michigan, Ann Arbor
This protocol introduces: (a) the criteria for classifying key concepts related to
delegation of authority to entities in a federation; and (b) the coding procedures that will
allow us to generate variables that operationalize these concepts.
1. Concept of Delegation
Delegation of Authority is the assignment of authority and responsibility to another
entity. This is when Congress empowers another actor/group to make choices and
complete the tasks necessary to result in an outcome from the delegated work.
Delegation is the shift of decision-making authority from Congress to some other
person/group—the assignment of power to another. Congress relies upon this other
entity (its agent, in a broad sense) to provide a set of functions or to implement the
policy. Congress can delegate to a wide variety of people, groups, and organizations in
the United States including: the national executive branch (this includes the president
and federal agencies), the states, joint partnerships between the states and the national
agents, the judiciary, private corporations or non-profit groups, to partnerships between
national agents and private/non-profit entities, or even to foreign countries or
international organizations.
Possible Agents of Congress Examples
National A national agency, the president, a
national commission
State Governors, one or more states, states in
general
Joint States and a national agency, governors
and the president
Judiciary Courts or law enforcement in general
Private/Non-Profit Industry, non-profit foundations
Private-National Partnership National agency and a non-profit
foundation
Foreign/International/-National Partnership World Health Organization, NATO, etc.
2. Concept of Authority
Authority (as defined by West‘s Encyclopedia of American Law): is the (right of) power
to enforce laws, exact obedience, command, determine, or judge. This can also be
referred to as the power or right to give orders or make decisions or the responsibility of
administrative control over others. Along with authority is accountability—those entities
that receive a delegation of authority are ultimately accountable for their actions and the
outcomes that may result. The extents to which oversight is conducted and clear
demarcations of accountability are available differ widely across policies and over time.
106
2. Concept of Policy Area
Policy Area is the categorization of policy types according to the Policy Agenda Project‘s
(PAP) definitions. These include economic, health, environment, among others. Please
refer to the PAP website for the full listing of policy areas, subtypes and definitions at:
http://www.policyagendas.org/codebooks/topicindex.html
3. Coding Delegation and Policy Area
Coders obtain evidence of delegation of authority and the policy types by reviewing
Congressional Research Service (CRS) summaries of public laws from 1973 through
2010. The laws coded include significant legislation and a random sample of non-
significant legislation over this time period.
Unit of Data Collection: The unit of observation is each provision summarized by
CRS. Consequently, each law coded will have multiple
provisions that are coded.
Date: Fill in the date you coded the law & your initials in the top
left-most cell in the Excel spreadsheet.
Authority: Designate whether no, national, state, joint, or other entity
is delegated responsibility (see details below).
Policy Type: Use Policy Agenda‘s Project‘s Master Topics Codebook to
assign policy area coding. The codebook is found at
http://www.policyagendas.org/page/topic-codebook.
Authority:
0. No Authority: Mark the provision as a 0 or ―no authority‖ if no agent/entity
received a delegation of power in that provision‘s summary.
1. National: Designate a 1 if Congress delegates authority to a national agent (the
President, national agency, commission, etc.)
includes when a national actor is responsible for listing state agencies
(but the states are not responsible for anything specific in that
provision)
includes when a new program is authorized and created but no
mention of where it is located (assume it means a national agency)
includes when agencies are transferred to a national agency
includes when national actor's authority is limited (but no other entity
is mentioned as taking more responsibility)
includes when a national actor is jointly responsible with a private
entity
2. State: If Congress delegates authority to the states (or agents of the states), mark
that provision with a 2.
107
state entities are defined to include: governors, state legislatures,
state agencies, local government, school boards, township actors,
metropolitan planning organizations, tribal actors, rural areas, urban
centers.
Includes explicit mention that states assume federal duties (as long as
no national agencies are involved in that provision and no money
from national entities)
Does not include mentions of states within joint partnership policies
(see #3)
3. Joint: When Congress creates (or continues) a partnership between national and
state-level agents, indicate that this is a ―joint‖ provision or a 3. A partnership
includes cases when both sets of entities are each given authority but no
relationship between the two is described.
includes national-tribal partnerships
includes when national actors withhold money from states that don't
do X or provisions that provide states with money that do Y.
includes when state actors can offer alternatives to those mentioned
in the provisions, but that the national agency must accept the
alternative if it determines that it would provide certain things
Includes when state actors and private actors are responsible or
eligible for grants/demo projects from national entities
4. Other: When a provision delegates authority to any other entity (law
enforcement, courts, private, non-profit corporations, groups, industry).
99. Unknown: When a provision appears to imply that an entity is responsible but a
reading of the full text of the legislation and/or the relevant year‘s U.S.C. (United
States Code) do not provide any certainty over what/who that entity is.
108
REFERENCES
Bailey M and Chang K. 2001. ―Comparing Presidents, Senators, and Justices: Inter-
institutional Preference Estimation.‖ Journal of Law, Economics and Organization 17(2):
477-506.
Berry WD, Ringquist EJ, Fording RC, and Hanson RL. 2007. ―The Measurement and
Stability of State Citizen Ideology,‖ State Politics and Policy Quarterly 7(2):111:132.
Chubb, JE. 1985. "The Political Economy of Federalism." Annual Political Science
Review 79(4):994-1015.
Clinton J and Lewis D. 2008. ―Expert Opinion, Agency Characteristics and Agency
Preferences,‖ Political Analysis. 16 (1): 3-20.
Epstein D and O‘Halloran S. 1999. Delegating Powers: a transaction cost politics
approach to policy making under separate powers, Cambridge U.K., Cambridge
University Press.
Gostin LO. 2000. Public Health Law: Power, Duty, Restraint, Berkeley, University of
California Press.
Huber J and Shipan C 2002. Deliberate Discretion? Cambridge, Cambridge University
Press.
Krause G and Bowman A O‘M. 2005. ―Adverse Selection, Political Parties, and Policy
Delegation in the American Federal System‖ Journal of Law Economics and
Organization, 21(2):359-87.
Krehbiel K. 1998. Pivotal Politics: A Theory of U.S. Lawmaking. Chicago: University of
Chicago Press.
Lupia A, Levine A, Krupnikov Y, Piston S, and Von Hagen-Jamar A. 2009. ―Why State
Constitutions Differ in their Treatment of Same-Sex Marriage.‖ Paper presented at the
annual meeting of the Midwest Political Science Association 67th Annual National
Conference, The Palmer House Hilton, Chicago, IL Online 2010-09-16 from
http://www.allacademic.com/meta/p362202_index.html
Maltzman F and Shipan C. 2008. ―Continuity, Change and the Evolution of the Law‖
American Journal of Political Science 52(2):252-267.
Mayhew, D. 2005. Divided We Govern: Party Control, Lawmaking and Investigations,
1946-2002. New Haven, Yale University Press.
Nicholson-Crotty, S. 2008. ―National Election Cycles and the Intermittent Political
Safeguards of Federalism.‖ Publius: The Journal of Federalism 38(2):295-314.
109
Nixon, David C. 2004. ―Separation of Powers and Appointee Ideology.‖ Journal of Law,
Economics, and Organization 20(2):438-57.
Peterson, PE. 1995. The Price of Federalism. Brookings Institution, Washington D.C.
Ripley RB and Franklin GA. 1982. Bureaucracy and Policy Implementation. Homewood,
Illinois, Dorsey Press.
Shor B, Berry C, and McCarty N. 2011. ―A Bridge to Somewhere: Mapping State and
Congressional Ideology on a Cross-institutional Common Space‖ Legislative Studies
Quarterly (forthcoming).
Tirole J. 1986. ―Hierarchies and Bureaucracies: On the Role of Collusion in
Organizations," Journal of Law, Economics and Organization 2(2):181-214.
Wright G and Osborn T. 2002. "Party and Roll Call Voting in the American Legislature"
presented at Midwest Political Science Association meeting, Chicago, Illinois.
110
Chapter 4
Congressional Intergovernmental Delegation of Authority from 1973-2008:
An Empirical Analysis of Federal Policy Design
INTRODUCTION
In the first three chapters I introduced the federal policy design dilemma and
provided a framework for considering intergovernmental delegation. The theoretical
argument examines how policymaker preferences and political uncertainty with respect to
implementation influence congressional intergovernmental delegation choices. In this
chapter, I analyze the main arguments of this theory at the aggregate level of Congress
using the novel dataset developed in the previous chapter. Specifically, I study how the
distance between the ideal points of a pivotal legislator in Congress and his state and that
pivotal legislator and the national executive branch, along with state and national
executive branch political uncertainty, influence the degree of decentralization in
significant national laws from 1973-2008. In addition to conducting systematic empirical
tests of my theory, I test alternative hypotheses by incorporating factors including policy
type, partisan ideology, federalism-related electoral concerns, and average partisan
congruence of the national political institutions with the state-level political institutions.
111
I begin by specifying the hypotheses to be tested in this chapter, then describe the
research design and variables used in this study. After setting up the research design, I
present the results of the analyses and conclude by discussing the implications of the
empirical results in light of my theory, rival arguments, and the limitations of the data.
TESTING THE THEORY
In Chapter 2, I begin with an aggregate model of how Congress decides the
degree of authority to allocate to the states versus the national executive branch in policy.
Congress perceives of itself as the principal and optimizes the eventual policy outcome
by choosing the degree of authority to delegate to the states and the national executive
branch. The authority ranges from zero (complete centralization with the national
executive branch) to one (complete decentralization to the states). This initial model
provides a framework for understanding the intergovernmental delegation choices made
in national laws. Specifically, I propose four inter-related hypotheses:
Hypothesis 1: As the distance between the pivotal legislator and his state
increases, state authority allocation decreases except when the distance
between that legislator and the national executive branch is greater.
Hypothesis 2: As the distance between the pivotal legislator and the
national executive branch increases, state authority allocation increases
except when the distance between that legislator and his state is greater.
Hypothesis 3: As transformed state political uncertainty increases, state
authority allocation decreases.
Hypothesis 4: As transformed national political uncertainty increases,
state authority allocation increases.
DATA AND MEASUREMENT
As described in detail in Chapter 3, to evaluate the conditions under which
national legislators delegate authority to intergovernmental actors, this study utilizes the
112
law as the unit of analysis and includes 179 significant pieces of legislation from
Mayhew‘s list of major laws from the 93rd
through the 110th
Congresses.
Dependent Variable
To measure the dependent variable of intergovernmental delegation, I utilized the
new dataset of policy authority delegation in laws delegated to national, state, and joint
actors to create a decentralization proportion that collapses these three categories, where
decentralization is the combination of the proportion of provisions delegated directly to
the states plus one-half of the proportion of provisions delegated to both the national
executive branch and the states. The degree of decentralization ranges from zero to one,
with a mean of 0.249 and a standard deviation of 0.274. Thus, on average, national laws
delegate about a quarter of their provisions to the states. Stated another way, 25 of the
179 laws delegated solely to the national executive branch and 102 delegated at least
some portion of the provisions to the states, either alone or in combination with national
executive branch actors.
Independent Variables
What explains variation in intergovernmental delegation over time? In this
section, I review the measurement of the independent variables. First as outlined earlier,
my primary theoretical variables require measures of legislative, national executive
branch and state preferences along with political uncertainty. Second, I elaborate the
control variables included in the analysis. Third, alternative arguments require measures
of policy type, Republican national government, partisan congruence, and election year. I
now discuss the measurement and operationalization of these variables.
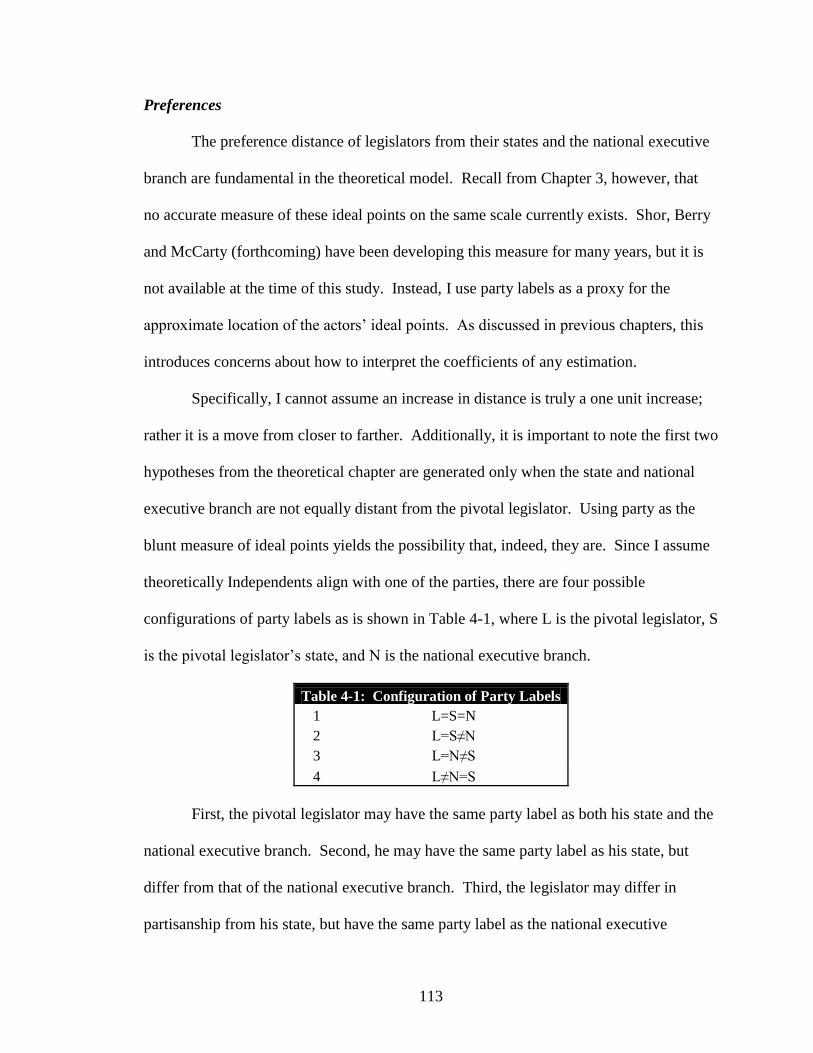
113
Preferences
The preference distance of legislators from their states and the national executive
branch are fundamental in the theoretical model. Recall from Chapter 3, however, that
no accurate measure of these ideal points on the same scale currently exists. Shor, Berry
and McCarty (forthcoming) have been developing this measure for many years, but it is
not available at the time of this study. Instead, I use party labels as a proxy for the
approximate location of the actors‘ ideal points. As discussed in previous chapters, this
introduces concerns about how to interpret the coefficients of any estimation.
Specifically, I cannot assume an increase in distance is truly a one unit increase;
rather it is a move from closer to farther. Additionally, it is important to note the first two
hypotheses from the theoretical chapter are generated only when the state and national
executive branch are not equally distant from the pivotal legislator. Using party as the
blunt measure of ideal points yields the possibility that, indeed, they are. Since I assume
theoretically Independents align with one of the parties, there are four possible
configurations of party labels as is shown in Table 4-1, where L is the pivotal legislator, S
is the pivotal legislator‘s state, and N is the national executive branch.
Table 4-1: Configuration of Party Labels
1 L=S=N
2 L=S≠N
3 L=N≠S
4 L≠N=S
First, the pivotal legislator may have the same party label as both his state and the
national executive branch. Second, he may have the same party label as his state, but
differ from that of the national executive branch. Third, the legislator may differ in
partisanship from his state, but have the same party label as the national executive
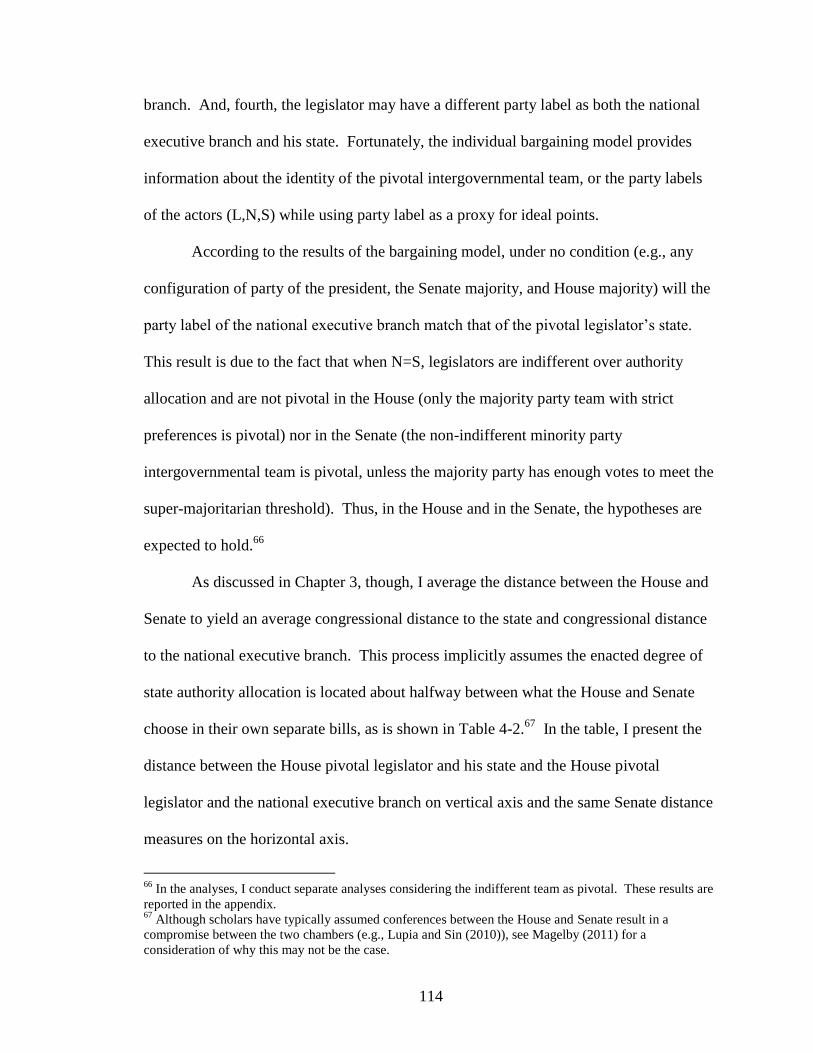
114
branch. And, fourth, the legislator may have a different party label as both the national
executive branch and his state. Fortunately, the individual bargaining model provides
information about the identity of the pivotal intergovernmental team, or the party labels
of the actors (L,N,S) while using party label as a proxy for ideal points.
According to the results of the bargaining model, under no condition (e.g., any
configuration of party of the president, the Senate majority, and House majority) will the
party label of the national executive branch match that of the pivotal legislator‘s state.
This result is due to the fact that when N=S, legislators are indifferent over authority
allocation and are not pivotal in the House (only the majority party team with strict
preferences is pivotal) nor in the Senate (the non-indifferent minority party
intergovernmental team is pivotal, unless the majority party has enough votes to meet the
super-majoritarian threshold). Thus, in the House and in the Senate, the hypotheses are
expected to hold.66
As discussed in Chapter 3, though, I average the distance between the House and
Senate to yield an average congressional distance to the state and congressional distance
to the national executive branch. This process implicitly assumes the enacted degree of
state authority allocation is located about halfway between what the House and Senate
choose in their own separate bills, as is shown in Table 4-2.67
In the table, I present the
distance between the House pivotal legislator and his state and the House pivotal
legislator and the national executive branch on vertical axis and the same Senate distance
measures on the horizontal axis.
66
In the analyses, I conduct separate analyses considering the indifferent team as pivotal. These results are
reported in the appendix. 67
Although scholars have typically assumed conferences between the House and Senate result in a
compromise between the two chambers (e.g., Lupia and Sin (2010)), see Magelby (2011) for a
consideration of why this may not be the case.
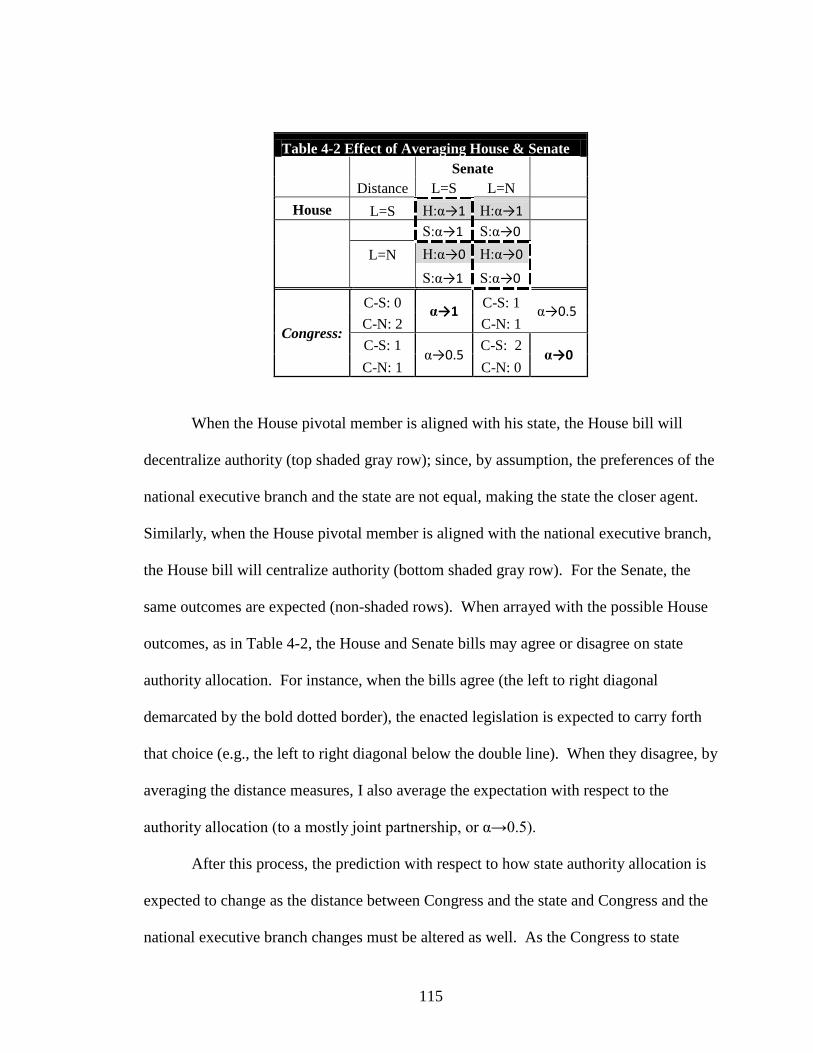
115
Table 4-2 Effect of Averaging House & Senate
Senate
Distance L=S L=N
House L=S H:α→1 H:α→1
S:α→1 S:α→0
L=N H:α→0 H:α→0
S:α→1 S:α→0
Congress:
C-S: 0 α→1
C-S: 1 α→0.5
C-N: 2 C-N: 1
C-S: 1 α→0.5
C-S: 2 α→0
C-N: 1 C-N: 0
When the House pivotal member is aligned with his state, the House bill will
decentralize authority (top shaded gray row); since, by assumption, the preferences of the
national executive branch and the state are not equal, making the state the closer agent.
Similarly, when the House pivotal member is aligned with the national executive branch,
the House bill will centralize authority (bottom shaded gray row). For the Senate, the
same outcomes are expected (non-shaded rows). When arrayed with the possible House
outcomes, as in Table 4-2, the House and Senate bills may agree or disagree on state
authority allocation. For instance, when the bills agree (the left to right diagonal
demarcated by the bold dotted border), the enacted legislation is expected to carry forth
that choice (e.g., the left to right diagonal below the double line). When they disagree, by
averaging the distance measures, I also average the expectation with respect to the
authority allocation (to a mostly joint partnership, or α→0.5).
After this process, the prediction with respect to how state authority allocation is
expected to change as the distance between Congress and the state and Congress and the
national executive branch changes must be altered as well. As the Congress to state
116
distance increases in Table 4-2, state authority allocation decreases, regardless of
movement in the legislator to national executive branch distance. This conjecture can be
seen by moving from C-S:0 (where α→1) to any other C-S distance (at 1, α→0.5 and at
2, α→0). As the Congress to national executive branch distance increases, given the
Congress to state distance, state authority allocation increases. This increase is shown by
moving from C-N: 0 to C-N:1 or 2, where α→0 becomes α→0.5 and α→1 respectively.
These expectations are in line with the previous hypotheses 1 and 2. Thus, Hypotheses 1
and 2 can be restated for Congress in the following manner:
Hypothesis 4-1: As the Congress to state distance increases, given changes in
the Congress to national executive branch distance, decentralization decreases.
Hypothesis 4-2: As the Congress to national executive branch distance
increases, given changes in the Congress to state distance, decentralization
increases.
As a reminder, the distance measures have the following properties in the dataset:
Distance between Democratic (D) House and Republican (R) State|-1-1 | = 2
Distance between R Senate and R State = |1 – 1| = 0
Distance between R Senate and D National Executive Branch = | 1 – (-1)| = 2
Distance between Congress and State = (2+0)/2 = 1
Distance between Congress and NEB = (0+2)/2 = 1
In the House, the distance measures reveal that the legislator-to-state distance is
perfectly negatively correlated with the legislator-to-national executive branch distance.
Of the 179 laws examined in this study, 63 are cases where the legislator-to-state distance
measures two and the legislator-to-national executive branch measures zero. The
remaining 116 laws are cases where the legislator-to-state distance measures zero and the
legislator-to-national executive branch measures two. In the average congressional
117
distance models reported below, the Senate variation allows both distances to be included
in the analysis. For the models including Senate and House measures, I create a dummy
variable that codes a zero for when the states are closer to the pivotal House member and
a one when the national executive branch is closer (and the states are more distant).
Political Uncertainty
Political uncertainty refers to the likelihood that the party of the president or
governor will be different during implementation than at enactment. As discussed in
detail in Chapter 3, I measure political uncertainty as the rolling average of the past three
elections‘ electoral margin for the top two opposing candidates for the governor for
election years. I use the average of the past three elections in order approximate
legislators‘ perceptions about how uncertain the party of the executive branch at the
national and state levels may be.68
For off-election years, I use the mean of this rolling
average and one (representing perfect certainty). In order to normalize the hypotheses
(e.g., the direction of the effect of the political uncertainty is the same for all legislators),
this measure is then transformed by multiplying by 1 if the pivotal legislator and his state
have the same party label and -1 if they do not.
To measure national political uncertainty, I create a variable in the exact same
manner (using electoral college vote margins) and an alternative dummy variable for
presidential election years, where election years are coded as a zero and off-election years
as a one.69
This second measure approximates the situation when national political
uncertainty is zero during off election years (or that the party of the president is known
68
The results are robust to changing this timeframe to 4, 5, and 6 years. 69
Since this measure is a proxy for legislators‘ perceptions of uncertainty over the preferences of the
implementing executive, the electoral vote margin provides a closer approximation of this concept. I also
utilize the population vote margin in the analyses and find the coefficient on the variable is near zero,
insignificant, and does not improve model fit in any of the specifications.
118
with certainty) and one during election years (or that the party of the incoming president
is completely uncertain). The national political uncertainty measures are transformed in
the same manner as the state political uncertainty measures.
Alternative Arguments’ Variables
To consider alternative arguments, I include measures for partisan congruence,
Republican control of national institutions, election year, and policy type. I use Krause
and Bowman‘s (2005) vertical partisan congruence variable to consider their adverse
selection hypothesis (where Congress decentralizes authority when the states share
similar partisanship to the Congress and the President and centralizes otherwise). To
measure the congruence between the partisan makeup of the national and state
governments, Krause and Bowman interact two categorical variables measuring partisan
balance at each level. At the national level, -1 captures when all three institutions
(executive, and both legislative chambers) are majority Democratic, +1 when all three are
Republican, and 0 for cases of divided government.70
At the state-level a similar process
ensues: the states are weighted by their electoral college votes and aggregated to create a
single state partisan balance variable. As these partisan control variables increase,
Republican control increases.
In addition, I interact these national and state partisan balance variables, following
Krause and Bowman, to ―create a comprehensive national-state partisan interaction term
[that] taps into the degree of vertical partisan congruence between national and state level
political institutions‖ (Krause and Bowman 2005, 372). Conventional wisdom suggests
that as Republican control increases (or as the national partisan balance measure
70
Additionally, divided-divided government is measured as a -0.5 when Democrats control two of the three
institutions and +0.5 when Republicans do.
119
increases), state authority delegation will also increase.71
The interactive argument
forwarded by Krause and Bowman conjectures that as partisan congruence increases,
decentralization of authority to the states also increases.
To consider Nicholson-Crotty‘s (2008) contention that Congress refrains from
state mandates during election years, I create a variable that is coded as one during
election years (every two years) and zero otherwise. Finally, for Peterson‘s (1995)
argument that federal delegation is based on the type of policy considered, I create a
variable using the Policy Agenda‘s project topic and subtopic codes and Peterson‘s policy
coding scheme (198-201, 1995).72
Redistributive policies, according to Peterson, are
those that ―reallocate societal resources from the haves to the have-nots‖ in comparison
to developmental policies that ―provide the physical and social infrastructure necessary to
facilitate a country‘s economic growth‖ (17, 1995).73
For this variable, developmental
policy is coded as 0 and a redistributive policy as 1.
Control Variables
There are a variety of other variables expected to influence the delegation of
authority to the states. Scholars commonly control for the federal deficit, state fiscal
health, traditional state policies, an activist national government, and unified government
71
I also utilize simple dummy variables of party for the majority in the House, majority in the Senate, and
party of the President as well as categorical measures for when Republicans control these three institutions
at the national level. The results do not differ dramatically from using national partisan balance, therefore, I
include that measure here. 72
The Policy Agenda‘s Project Topic Codebook was accessed from the Fall, 2008 through the Fall, 2009 at
http://www.policyagendas.org/codebooks/topicindex.html. 73
Peterson includes transportation, natural resources, safety, education, and utilities as developmental
policies and redistributive policies as pensions/medical insurance, welfare, health and hospitals and
housing. I checked the robustness of the findings with respect to including education as a developmental
policy and then as a redistributive policy and found no significant difference in the results. I include
education as a redistributive policy in the reported analysis. Policy areas are obtained from the Policy
Agendas Project (Jones, Wilkerson, and Baumgartner 2008).
120
(Krause and Bowman 2005, Nicholson-Crotty 2008).74
The federal deficit or surplus
measure was obtained from the Budget of the United States Government, Fiscal Year
2008 Historical Tables. I utilize the previous year‘s surplus or deficit as a percentage of
the gross domestic product measured in constant fiscal year 2000 dollars. As the federal
deficit increases, previous scholars argue that state responsibility will increase. State
fiscal status is measured as the previous year‘s percent change in revenues as obtained
from the U.S. Census Bureau State Government Finances website (in addition to archived
historical data provided via email from the Census Bureau). I use state own-source
revenues at time t and derive the percent change in these revenues (100*[revenue at time
t – revenue at time t-1]/revenue at t-1). As state revenues increase, state responsibility is
expected to increase.
As for traditional state policies, an activist public, and unified government, I
include a rough proxy for the status quo level of state authority by including a dummy for
policies that are considered to be traditional state policies (Gostin, 2002). These policies
include education, health, and social welfare (and are coded as a 1) and other policy areas
as a 0. During the time span of my study, the federal government had already entered
these traditional realms of state policy. I expect, though, that state authority delegation
will be positively associated with traditional state policy areas in comparison to other
types of policies.
74
Although not commonly included in studies of decentralization, I also incorporated controls for
heterogeneity of state governors, heterogeneity of the majority party in each chamber, percent majority in
each chamber, a blunt dichotomous measure of the technical uncertainty of the policy, and various time
trends as these factors could potentially account for differences in delegation strategies. These variables
were statistically insignificant (with the exception of percent majority in the Senate) and did not alter the
empirical results. Moreover, I included a temporal variable that measures years from 1973 that ranges from
zero (at 1973) to 34 (at 2007) (as well as nonlinear versions of a time trend) but dropped this variable from
the analysis due to lack of improvement in the models and high correlation with many of the other variables
such as federal deficit.
121
I use Mayhew‘s (1992) activist public mood variable to control for more activist
years in the study. This variable is coded as 1 in 1973-1976, and 0 thereafter.75
I expect
these years to be associated with centralization of authority at the national level (due to
an activist public), thus the direction of the effect of this variable on state authority
allocation will be negative. Finally, I incorporate unified government by coding a dummy
variable that is one during times of unified government (when the House, Senate, and
president are of the same political party) and zero otherwise. It is possible that legislators
may use delegation to the states in order to move policy forward during politically
contentious times. I expect movement from a unified government to a divided
government to be associated with an increase in delegation to the states.
EMPIRICAL ANALYSES
Given the structure of the dependent variable as a proportion that ranges from
zero to one, estimation can be challenging, particularly since my variable includes values
that are zero or one. I approach this problem from two different angles. First, I proceed
with OLS using the continuous variable (proportion of delegation to the states) as the
dependent variable and cluster by year, to address the potential that errors may be
correlated within years. Second, I estimate the model using a fractional logit (Papke and
Woolridge 1996, Ye and Pendyala 2004). By using a fractional logit, the predictions lie
in the range of the dependent variable and the model specification takes into account the
heteroskedastic errors. The statistical and substantive conclusions are consistent across
both estimation strategies. I report OLS results in the next section, followed by the
fractional logit results.
75
Krehbiel (1998) also uses a version of a public mood variable that is coded as a 4 in 1973 and decrements
one step each year until reaching a 1 in 1976 and a 0 for each year thereafter. I examine the models using
this alternative measure and find no substantive or statistically significant difference in the results.
122
RESULTS
In Table 4-3, I present three models using the average distance between the House
and Senate (i.e., Congress) and their intergovernmental agents. The first model includes
only the key variables from the theoretical argument, the second adds controls, and in the
third model, I assess alternative arguments. In Model 1, as the theory predicts, I find as
the distance between the pivotal members in Congress and their states increases,
delegation to the states decreases. Additionally, as state political uncertainty increases,
delegation to the states also decreases, all else constant. The addition of the control
variables in Model 2 does not alter the direction of the effect of these theoretical
variables, although they both increase in magnitude.
In Model 1, the magnitude of the coefficient on the distance between Congress
and the states is such that given a bill with 100 provisions, a regime with similar
Congress and state partisanship would centralize authority with the national executive
branch for more than 16.4 of those provisions (as opposed to delegate them to the states),
when the distance between the national executive branch and the pivotal legislator is
zero, but would centralize authority in 12.5 provisions when the national executive
branch to Congress move farther apart (-16.4+3.9). This result is statistically significant
at the p<0.001 level. Also in line with expectations, as state political uncertainty
increases, delegation to the states decreases in a statistically significant manner (by about
13.4 provisions in a 100 provision bill). What this means is that for a Democratic
legislator with a Democratic state governor, as state political uncertainty increases by one
unit, authority will be delegated to the national executive branch alone (instead of to the
states or via joint partnership policies) for more than 13 provisions in a 100 provision
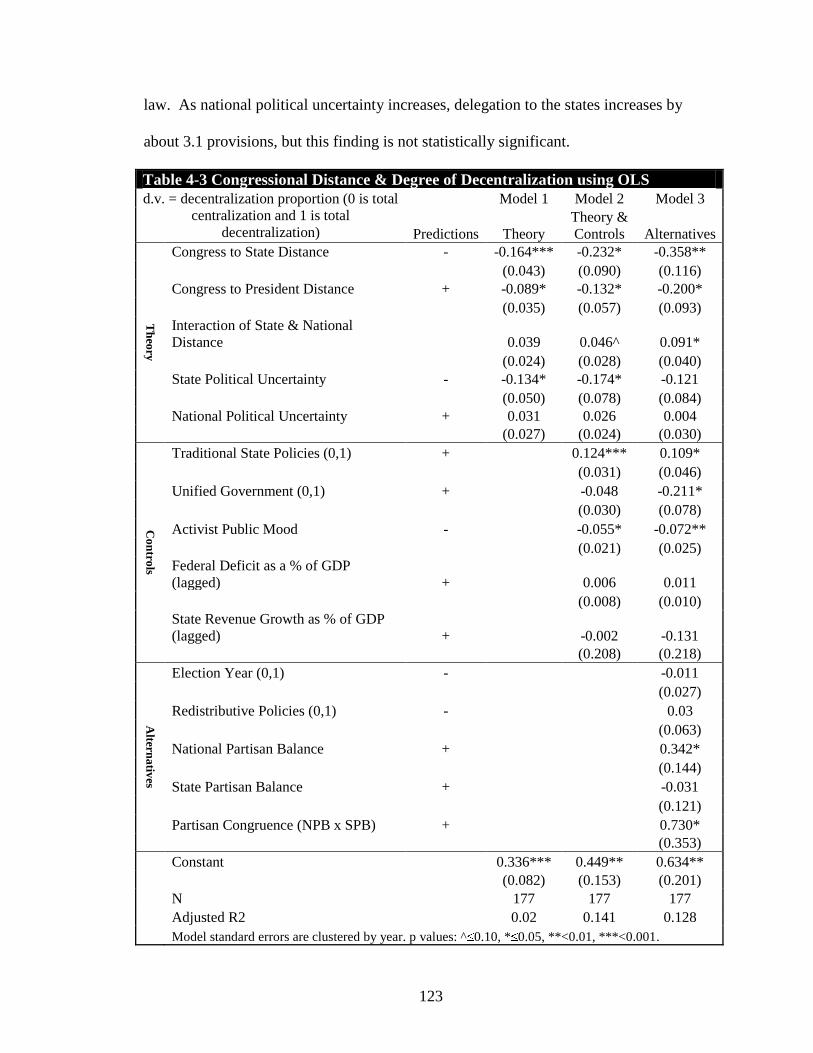
123
law. As national political uncertainty increases, delegation to the states increases by
about 3.1 provisions, but this finding is not statistically significant.
Table 4-3 Congressional Distance & Degree of Decentralization using OLS
d.v. = decentralization proportion (0 is total
centralization and 1 is total
decentralization)
Model 1 Model 2 Model 3
Predictions Theory Theory &
Controls Alternatives
Th
eory
Congress to State Distance - -0.164*** -0.232* -0.358**
(0.043) (0.090) (0.116) Congress to President Distance + -0.089* -0.132* -0.200*
(0.035) (0.057) (0.093) Interaction of State & National
Distance 0.039 0.046^ 0.091*
(0.024) (0.028) (0.040) State Political Uncertainty - -0.134* -0.174* -0.121
(0.050) (0.078) (0.084) National Political Uncertainty + 0.031 0.026 0.004 (0.027) (0.024) (0.030)
Co
ntro
ls
Traditional State Policies (0,1) + 0.124*** 0.109*
(0.031) (0.046)
Unified Government (0,1) + -0.048 -0.211*
(0.030) (0.078)
Activist Public Mood - -0.055* -0.072**
(0.021) (0.025) Federal Deficit as a % of GDP
(lagged) + 0.006 0.011
(0.008) (0.010) State Revenue Growth as % of GDP
(lagged) + -0.002 -0.131 (0.208) (0.218)
Altern
ativ
es Election Year (0,1) - -0.011
(0.027)
Redistributive Policies (0,1) - 0.03
(0.063)
National Partisan Balance + 0.342*
(0.144)
State Partisan Balance + -0.031
(0.121)
Partisan Congruence (NPB x SPB) + 0.730* (0.353)
Constant 0.336*** 0.449** 0.634**
(0.082) (0.153) (0.201)
N 177 177 177
Adjusted R2 0.02 0.141 0.128
Model standard errors are clustered by year. p values: ^ 0.10, * 0.05, **<0.01, ***<0.001.
124
In contrast to expectations, when the distance between the state and the pivotal
legislator is zero, as the distance between the national executive branch and the pivotal
legislator increases, decentralization also decreases (by about 8.9 provisions for a 100
provision bill). And when the distance between the state and pivotal legislator is moves
farther apart, as the distance between the national executive branch and Congress
increases, decentralization decreases (by about 3.9 provisions).
With the addition of control variables in Model 2, the size of the coefficients on
the distance variables increases (from 16.4 to 23.2 provisions for the Congress-to-State
distance, 8.9 to 13.2 provisions for the Congress-to-National distance, and 3.9 to 4.6
provisions for the coefficient on the interaction between the two distance measures), as it
does for the state political uncertainty variable (from 13.4 to 17.4 provisions). The
precision of these estimates decreases, although the results still reach traditional levels of
significance.
Of the control variables, traditional state policies are more likely to be delegated
to the states. Moving from policy areas that are not traditionally delegated to the states to
those that are (e.g., education, health) is associated with an increase of about 12.4
provisions in a 100 provision bill that would be decentralized to the states. In addition,
less authority was delegated to the states during more activist years (1973-1976) than
post-1976 years (approximately 5.5 provisions). The coefficients on movement from
unified to divided government at the national level, the federal deficit, and states‘ fiscal
health are not statistically different from zero, indicating, at least in these specifications,
the possibility they are unrelated to federal delegation design cannot be rejected.
125
What Model 3 reveals is slightly different. First, the theoretic variables still
perform as they did in Models 1 and 2, with the exception of an increase in the standard
error of state political uncertainty. Second, the rival arguments‘ variables perform as
expected by their authors‘ and are statistically significant with the exception of election
year and policy type, which are both not statistically different from zero in the model. As
the national political institutions become more Republican, more provisions are delegated
to the states (34 more provisions in a 100 provision law when State Partisan Balance is 0)
and when the national and state political institutions are more similar in average
partisanship, more provisions are delegated to the states.
Due to the high degree of multicollinearity, however, there is a problem with
estimating Model 3 and including my theoretical variables and the alternative arguments.
The variance inflation factor after the analysis reveals that the Congress to state and
Congress to national distance measures along with the partisan congruence and state and
national partisan balance measures have a VIF greater than 100, indicating a high degree
of multicollinearity. A model including only the rival arguments and controls find that the
coefficients for the alternative arguments have the same sign, but the magnitude is
reduced and they are no longer statistically significant. Furthermore, the adjusted R2
indicates that Model 2 (my theory with controls) accounts for more of the variation in the
dependent variable than this larger model (alternatives with controls)—14.1% versus
12.8%. Thus, the more parsimonious and theoretically driven model provides a better fit
with the data.
In summary, the aggregate analysis of the determinants of congressional
intergovernmental authority provides a degree of support for the theory of federal policy
126
design. In particular, as the distance between Congress and the state increases, state
delegation of authority decreases and as state political uncertainty increases, state
delegation of authority also decreases. Not as consistent with the theoretical expectations
is the finding that as the Congress to national executive branch distance increases,
delegation to the states decreases. One potential reason for this finding may be
measurement error in the preference distance.
Another potential issue is the need to account for the proportional nature of the
dependent variable in the estimation. The results reported above are based on OLS
estimation. Yet, with a dependent variable that is a proportion that ranges from zero to
one, there are flaws in using OLS, such as heteroskedastic errors and results that lie
outside of the range of the dependent variable.76
Fractional logit modeling techniques
provide a framework for considering the unique issues of an outcome variable that
represents fractions of a quantity of interest (Papke and Wooldridge 1996, Ye and
Pendyala 2004). In my model, the dependent variable represents the fraction of the
proportions in a law delegated to the states (either directly or via joint partnerships). I
provide the results from using fractional logit estimation in Table 4-4. Overall, the
fractional logit reveals the same findings with respect to my theory of intergovernmental
delegation as did the OLS regression.
76
Tobit analyses of the same model as OLS with 0 and 1 boundaries have results consistent with those
reported for OLS.
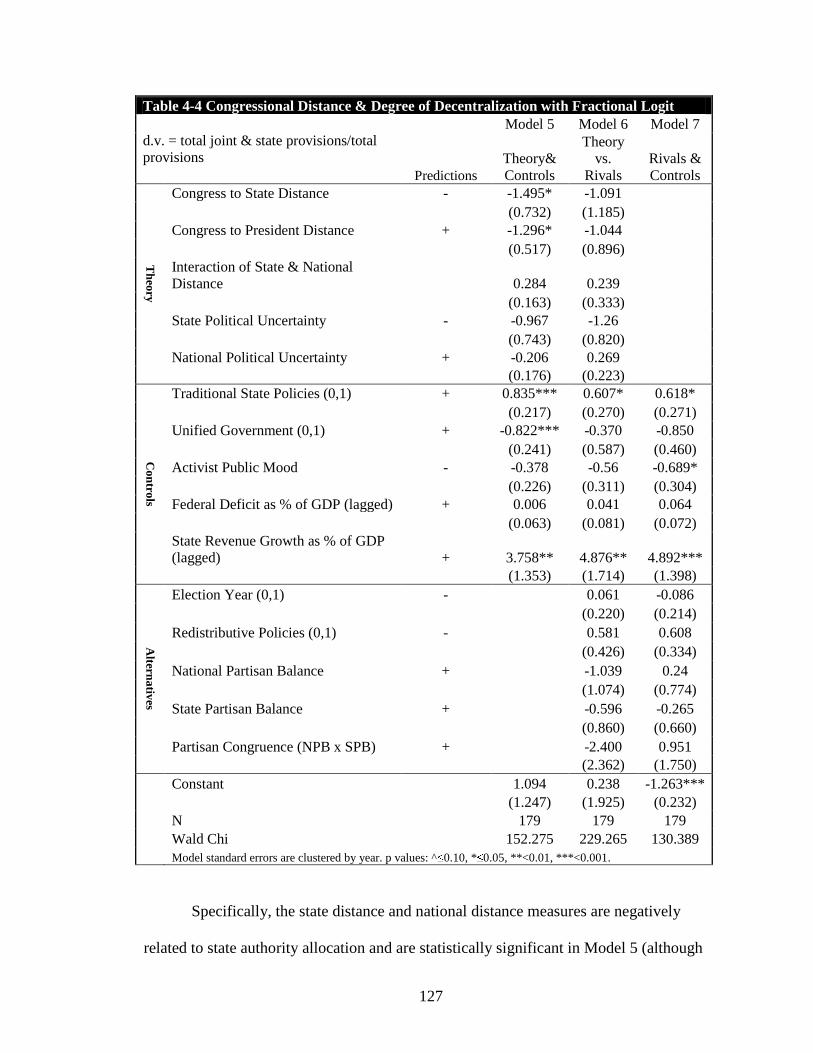
127
Table 4-4 Congressional Distance & Degree of Decentralization with Fractional Logit
d.v. = total joint & state provisions/total
provisions
Model 5 Model 6 Model 7
Predictions
Theory&
Controls
Theory
vs.
Rivals Rivals &
Controls
Th
eory
Congress to State Distance - -1.495* -1.091
(0.732) (1.185)
Congress to President Distance + -1.296* -1.044
(0.517) (0.896)
Interaction of State & National
Distance 0.284 0.239
(0.163) (0.333)
State Political Uncertainty - -0.967 -1.26
(0.743) (0.820)
National Political Uncertainty + -0.206 0.269
(0.176) (0.223)
Co
ntro
ls
Traditional State Policies (0,1) + 0.835*** 0.607* 0.618*
(0.217) (0.270) (0.271) Unified Government (0,1) + -0.822*** -0.370 -0.850
(0.241) (0.587) (0.460) Activist Public Mood - -0.378 -0.56 -0.689*
(0.226) (0.311) (0.304) Federal Deficit as % of GDP (lagged) + 0.006 0.041 0.064
(0.063) (0.081) (0.072) State Revenue Growth as % of GDP
(lagged) + 3.758** 4.876** 4.892*** (1.353) (1.714) (1.398)
Altern
ativ
es
Election Year (0,1) - 0.061 -0.086
(0.220) (0.214)
Redistributive Policies (0,1) - 0.581 0.608
(0.426) (0.334)
National Partisan Balance + -1.039 0.24
(1.074) (0.774)
State Partisan Balance + -0.596 -0.265
(0.860) (0.660)
Partisan Congruence (NPB x SPB) + -2.400 0.951 (2.362) (1.750)
Constant 1.094 0.238 -1.263***
(1.247) (1.925) (0.232)
N 179 179 179
Wald Chi 152.275 229.265 130.389 Model standard errors are clustered by year. p values: ^ 0.10, * 0.05, **<0.01, ***<0.001.
Specifically, the state distance and national distance measures are negatively
related to state authority allocation and are statistically significant in Model 5 (although
128
not in Model 6, again likely due to the severe multicollinearity). Unexpectedly and in
view of the coefficients on the national-to-Congress distance and the interaction between
national and state distance, as the distance between the pivotal legislator and the national
executive branch increases, delegation to the states decreases in a statistically significant
manner and regardless of the value of the distance between the states and the pivotal
legislator.
In other words, across all specifications, even when the distance between
Congress and the states is zero, as the distance between Congress and the national
executive branch increases, delegation to the states decreases. This finding holds across
specifications and indicates that contrary to my positive prediction for this coefficient,
Congress delegates fewer provisions to the states as the distance between Congress and
the National Executive Branch increases. This finding may point to the limitations in
using a blunt joint partnership measure in the data coding process for the dependent
variable (see Chapter 3) or it may indicate the complexity of the relationships between
Congress, the national executive branch and the states inherent in these joint partnerships.
Specifically, perhaps it is more difficult for Congress to monitor and control national
executive branch agencies if the states are also included as an agent. This result indicates
that further research in this area is needed.
A closer look at the interactive effects of these distance measures through a graph
reiterates the finding that as the distance measures between the pivotal legislator in
Congress and his state increases that the predicted proportion of decentralization
decreases. This decrease is evident across all levels of distance between that pivotal
legislator and the national executive branch (see Figure 4-1). At each national distance
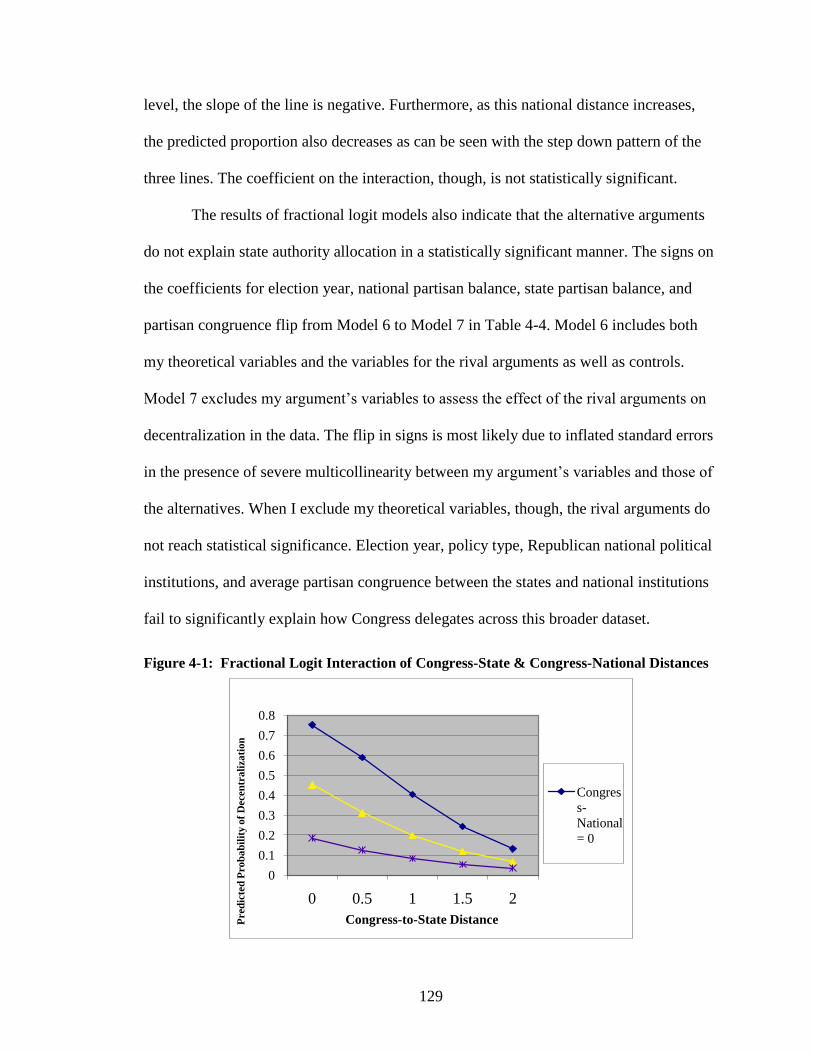
129
level, the slope of the line is negative. Furthermore, as this national distance increases,
the predicted proportion also decreases as can be seen with the step down pattern of the
three lines. The coefficient on the interaction, though, is not statistically significant.
The results of fractional logit models also indicate that the alternative arguments
do not explain state authority allocation in a statistically significant manner. The signs on
the coefficients for election year, national partisan balance, state partisan balance, and
partisan congruence flip from Model 6 to Model 7 in Table 4-4. Model 6 includes both
my theoretical variables and the variables for the rival arguments as well as controls.
Model 7 excludes my argument‘s variables to assess the effect of the rival arguments on
decentralization in the data. The flip in signs is most likely due to inflated standard errors
in the presence of severe multicollinearity between my argument‘s variables and those of
the alternatives. When I exclude my theoretical variables, though, the rival arguments do
not reach statistical significance. Election year, policy type, Republican national political
institutions, and average partisan congruence between the states and national institutions
fail to significantly explain how Congress delegates across this broader dataset.
Figure 4-1: Fractional Logit Interaction of Congress-State & Congress-National Distances
0
0.1
0.2
0.3
0.4
0.5
0.6
0.7
0.8
0 0.5 1 1.5 2
Pred
icte
d P
ro
ba
bil
ity
of
Decen
tra
liza
tion
Congress-to-State Distance
Congres
s-
National
= 0
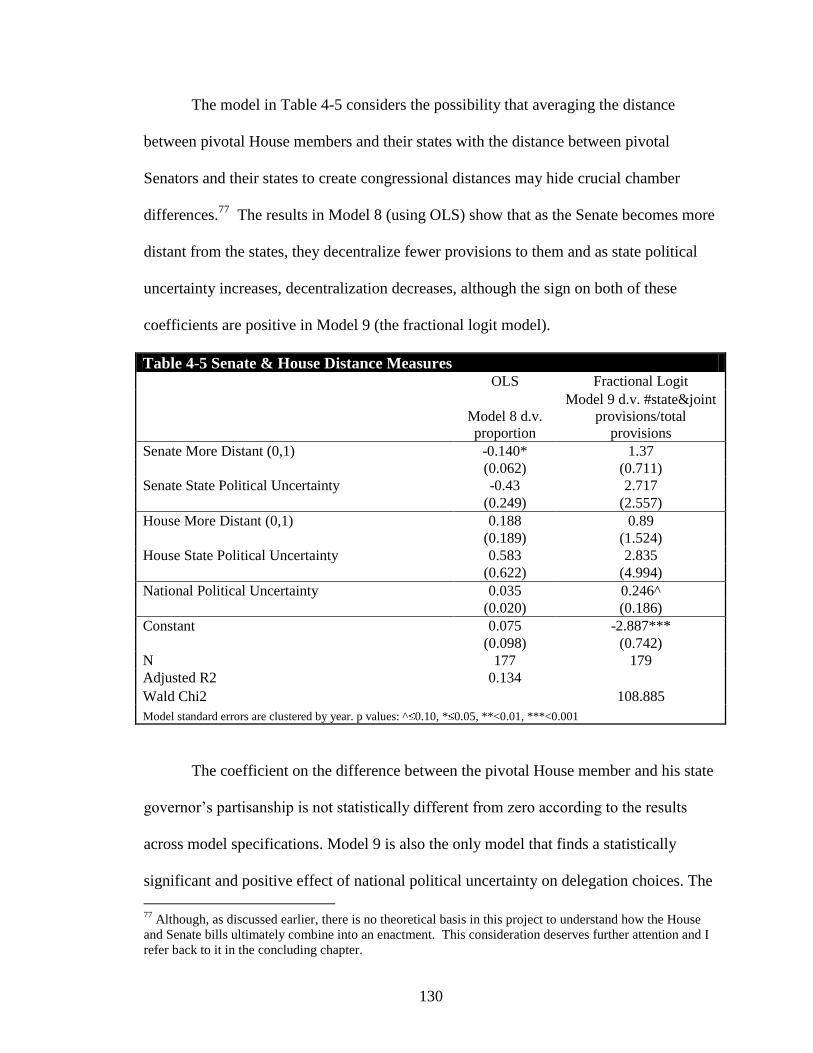
130
The model in Table 4-5 considers the possibility that averaging the distance
between pivotal House members and their states with the distance between pivotal
Senators and their states to create congressional distances may hide crucial chamber
differences.77
The results in Model 8 (using OLS) show that as the Senate becomes more
distant from the states, they decentralize fewer provisions to them and as state political
uncertainty increases, decentralization decreases, although the sign on both of these
coefficients are positive in Model 9 (the fractional logit model).
Table 4-5 Senate & House Distance Measures OLS Fractional Logit
Model 8 d.v.
proportion
Model 9 d.v. #state&joint
provisions/total
provisions Senate More Distant (0,1) -0.140* 1.37 (0.062) (0.711) Senate State Political Uncertainty -0.43 2.717 (0.249) (2.557) House More Distant (0,1) 0.188 0.89 (0.189) (1.524) House State Political Uncertainty 0.583 2.835 (0.622) (4.994) National Political Uncertainty 0.035 0.246^ (0.020) (0.186) Constant 0.075 -2.887*** (0.098) (0.742) N 177 179 Adjusted R2 0.134
Wald Chi2 108.885
Model standard errors are clustered by year. p values: ^ 0.10, * 0.05, **<0.01, ***<0.001
The coefficient on the difference between the pivotal House member and his state
governor‘s partisanship is not statistically different from zero according to the results
across model specifications. Model 9 is also the only model that finds a statistically
significant and positive effect of national political uncertainty on delegation choices. The
77
Although, as discussed earlier, there is no theoretical basis in this project to understand how the House
and Senate bills ultimately combine into an enactment. This consideration deserves further attention and I
refer back to it in the concluding chapter.
131
concern in Models 7 and 8 is multicollinearity between the Senate and House distance
measures, to which the fractional logit is more sensitive. Therefore, I rely on the average
distance measures for Congress.
Additionally, I model the House and Senate separately in Table 4-6. The findings
for the Senate and House independently are consistent with those reported in the previous
tables. In the OLS model of the Senate, as the distance between the pivotal senator and
his state increases, delegation to the states decreases and as state political uncertainty
increases, state delegation also decreases. The coefficients in the House are not
statistically different from zero. Whether these findings can lead to the conclusion that
the Senate holds more sway over federal policy design, though, remains to be seen. A
better measurement of ideal points will offer more variety in the House distance
measures, thereby providing more leverage for the analyses. In addition, there may be
certain circumstances when one or the other chamber is more crucial, such as whether the
policy area is more local than state-based (e.g., education), where the House may be more
important. Furthermore, models utilizing an alternative indifference assumption as
discussed in Chapter 2 (i.e., the indifferent majority party team in the House and the
indifferent minority party team in the Senate are the pivotal teams) reveal that House-to-
State and –National distances perform as expected in those models (see Appendix).
There are two possible reasons for this result: 1) the additional variation gained by using
the indifferent pivot aids in the estimation or 2) the House forms coalitions differently
than the Senate. Either way, House and Senate interactions deserve additional attention
in the future and the conclusions of this study still stand.
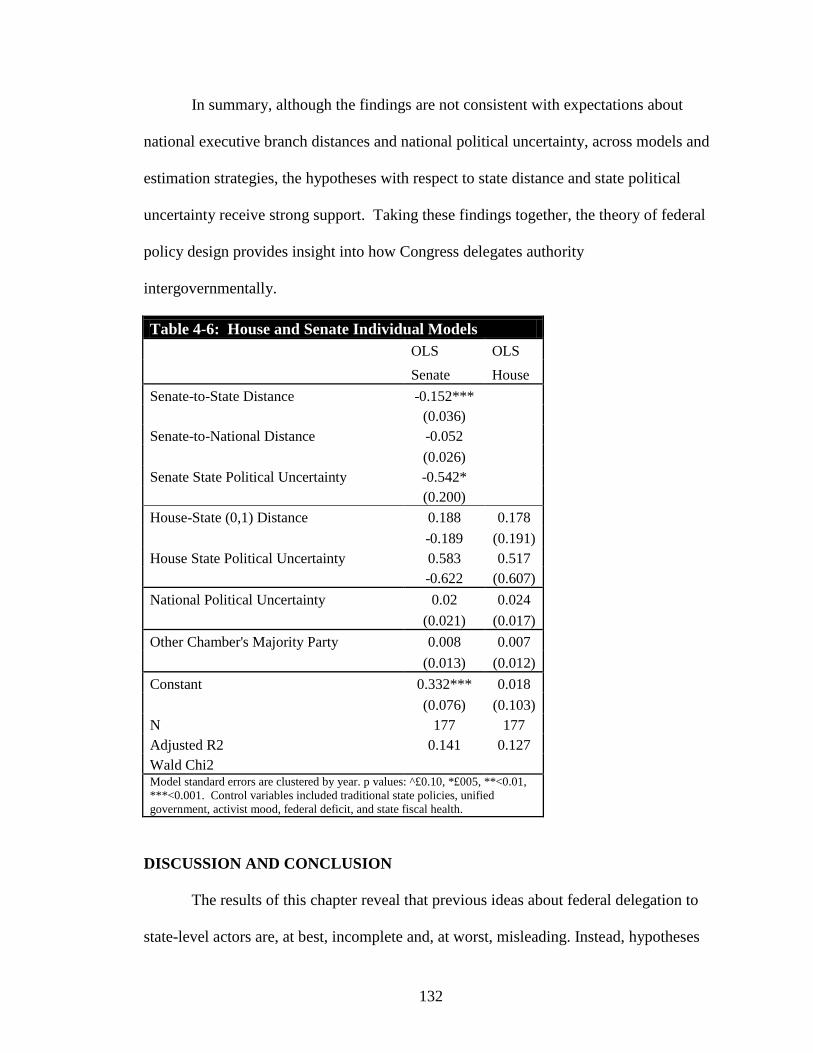
132
In summary, although the findings are not consistent with expectations about
national executive branch distances and national political uncertainty, across models and
estimation strategies, the hypotheses with respect to state distance and state political
uncertainty receive strong support. Taking these findings together, the theory of federal
policy design provides insight into how Congress delegates authority
intergovernmentally.
Table 4-6: House and Senate Individual Models
OLS OLS
Senate House
Senate-to-State Distance -0.152***
(0.036)
Senate-to-National Distance -0.052
(0.026)
Senate State Political Uncertainty -0.542*
(0.200)
House-State (0,1) Distance 0.188 0.178
-0.189 (0.191)
House State Political Uncertainty 0.583 0.517
-0.622 (0.607)
National Political Uncertainty 0.02 0.024
(0.021) (0.017)
Other Chamber's Majority Party 0.008 0.007
(0.013) (0.012)
Constant 0.332*** 0.018
(0.076) (0.103)
N 177 177
Adjusted R2 0.141 0.127
Wald Chi2 Model standard errors are clustered by year. p values: ^£0.10, *£005, **<0.01,
***<0.001. Control variables included traditional state policies, unified
government, activist mood, federal deficit, and state fiscal health.
DISCUSSION AND CONCLUSION
The results of this chapter reveal that previous ideas about federal delegation to
state-level actors are, at best, incomplete and, at worst, misleading. Instead, hypotheses
133
based on the logic of federal delegation with intergovernmental teams find support across
a variety of models, specifications, and estimation techniques. The laws included in the
current analysis span three decades and indicate that a consideration of individual
legislators in Congress and their relationships with their individual states and that of the
national executive branch is informative for how Congress delegates authority. This
novel dataset reveals that although delegation from Congress to national entities is the
most frequent strategy, delegation to state-level agents occurs commonly and in concert
with national delegation. A focus on horizontal delegation misses these frequent state-
level agents and the importance of intergovernmental delegation options.
What the empirical results in this chapter indicate is the importance of a
consideration of both the national and state political context of national policy. More
specifically, a consideration of national legislators‘ choices over intergovernmental
delegation of authority must consider 1) the relationship between individual legislators
and their individual states, 2) the relationship between legislators and the national
executive branch, and 3) political uncertainty at both levels.
When the proportional nature of the dependent variable is taken into account, in
contrast to commonly held beliefs, Republican administrations don‘t devolve authority
more than Democrats. Moreover, partisan congruence between the states and the national
institutions is not found to be a statistically significant factor. In addition, the size of the
federal deficit and timing of elections do not explain the choice of Congress to create
provisions that delegate power away from Washington. As expected, as the states do
better financially, the national government relies more on them to implement national
laws.
134
There are some limitations to the state authority allocation with intergovernmental
teams model and the empirical analyses. First, the intergovernmental delegation argument
and preference distance empirics rely on the assumption that partisanship provides cues
as to the preferences of the actors in the model. As more refined measures of preferences
at the different levels (national and state) become available later this year, this stylization
can be relaxed. Second, I collapse measures of federal delegation into a proportion that
varies from 0 to 1. Altering the degree of state authority captured in joint delegations
does not change the findings reported here. Future work should take a closer look at how
joint partnerships are structured and how Congress may use these joint structures under
different conditions. Third, I have not included interactions with the judiciary, an
important agent in concerns over federalism. Future work should consider the influence
of court preferences and/or decisions on state authority allocation as well.
Overall, this chapter tests a theory of intergovernmental delegation against rival
arguments using a novel dataset of delegation of authority across 35 years. I show that
many of the components in the theory of intergovernmental delegation are supported in
the analyses whereas other arguments fail to explain the variation in authority
centralization in this broader dataset. The theory of intergovernmental delegation with
state authority allocation incorporates state implementers and explicitly considers
legislators‘ incentives given they are elected from state-level constituencies and better
explains delegation choices than previous arguments.
A fascinating divergence from my hypotheses about intergovernmental delegation
is that as the distance between Congress and the national executive branch increases,
even contingent on the state distance, Congress delegates fewer provisions to the states.
135
This finding indicates the need to consider more specifically the structure of joint
partnership policies and how these structures may be used differently when the
preferences of Congress are less in line with that of the national executive branch.
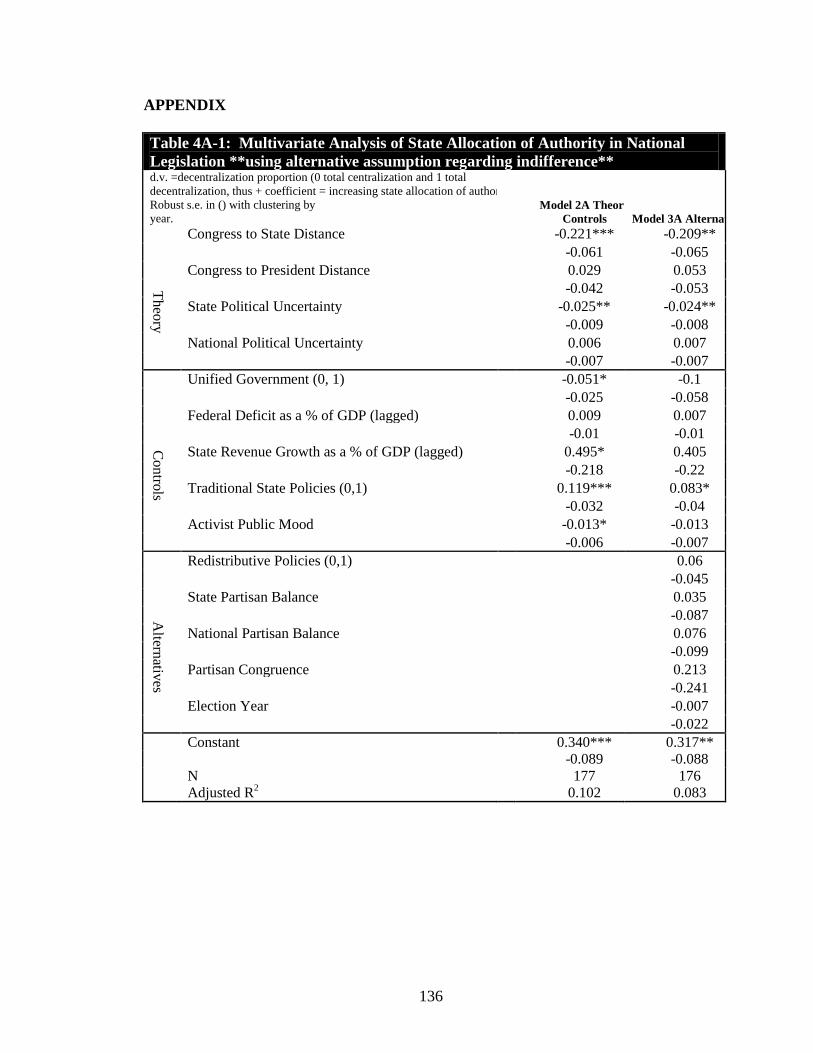
136
APPENDIX
Table 4A-1: Multivariate Analysis of State Allocation of Authority in National
Legislation **using alternative assumption regarding indifference** d.v. =decentralization proportion (0 total centralization and 1 total
decentralization, thus + coefficient = increasing state allocation of authority).
Robust s.e. in () with clustering by
year.
Model 2A Theory
Controls Model 3A Alternatives
Th
eory
Congress to State Distance - -0.221*** -0.209**
-0.061 -0.065
Congress to President Distance + 0.029 0.053
-0.042 -0.053
State Political Uncertainty - -0.025** -0.024**
-0.009 -0.008
National Political Uncertainty + 0.006 0.007
-0.007 -0.007
Contro
ls
Unified Government (0, 1) + -0.051* -0.1
-0.025 -0.058
Federal Deficit as a % of GDP (lagged) + 0.009 0.007
-0.01 -0.01
State Revenue Growth as a % of GDP (lagged) + 0.495* 0.405
-0.218 -0.22
Traditional State Policies (0,1) + 0.119*** 0.083*
-0.032 -0.04
Activist Public Mood - -0.013* -0.013
-0.006 -0.007
Altern
atives
Redistributive Policies (0,1) -
0.06
-0.045
State Partisan Balance +
0.035
-0.087
National Partisan Balance +
0.076
-0.099
Partisan Congruence +
0.213
-0.241
Election Year -
-0.007
-0.022
Constant
0.340*** 0.317**
-0.089 -0.088
N
177 176
Adjusted R2 0.102 0.083
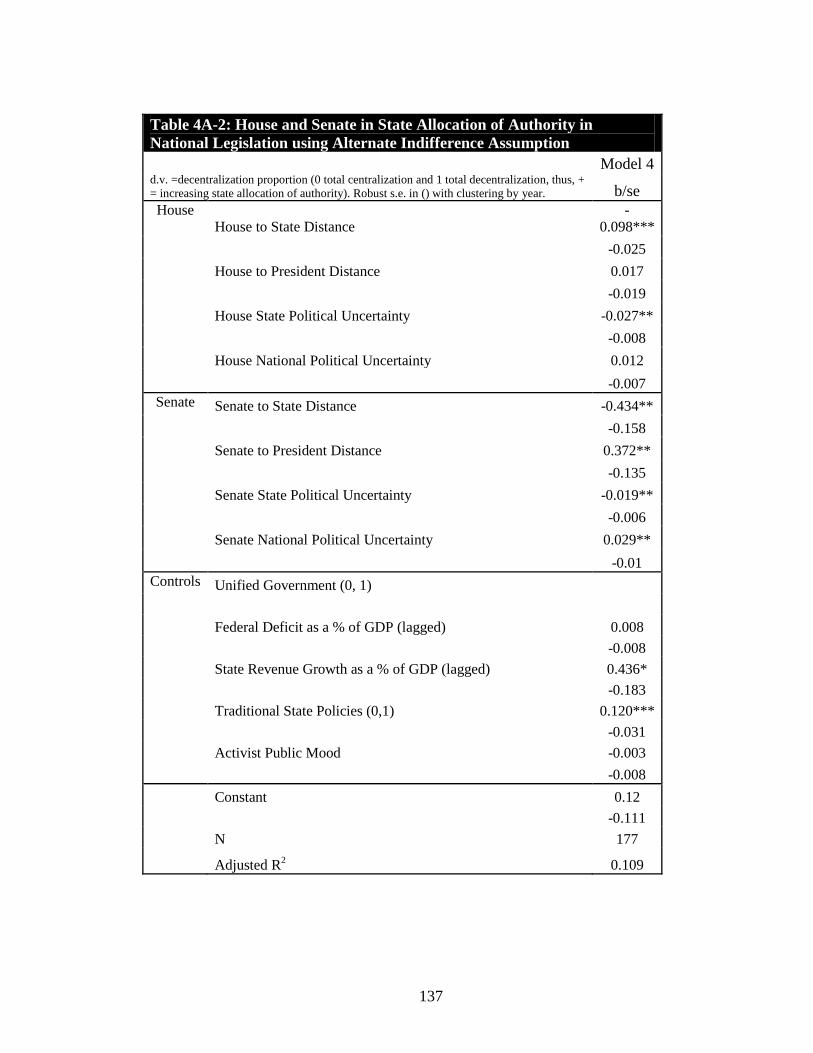
137
Table 4A-2: House and Senate in State Allocation of Authority in
National Legislation using Alternate Indifference Assumption
d.v. =decentralization proportion (0 total centralization and 1 total decentralization, thus, +
= increasing state allocation of authority). Robust s.e. in () with clustering by year.
Model 4
b/se
House
House to State Distance
-
0.098***
-0.025
House to President Distance 0.017
-0.019
House State Political Uncertainty -0.027**
-0.008
House National Political Uncertainty 0.012
-0.007
Senate Senate to State Distance -0.434**
-0.158
Senate to President Distance 0.372**
-0.135
Senate State Political Uncertainty -0.019**
-0.006
Senate National Political Uncertainty 0.029**
-0.01
Controls Unified Government (0, 1)
Federal Deficit as a % of GDP (lagged) 0.008
-0.008
State Revenue Growth as a % of GDP (lagged) 0.436*
-0.183
Traditional State Policies (0,1) 0.120***
-0.031
Activist Public Mood -0.003
-0.008
Constant 0.12
-0.111
N 177
Adjusted R2 0.109
138
REFERENCES
Anton, TJ. 1997. ―New Federalism and Intergovernmental Fiscal Relationships:
Implications for Health Policy,‖ Journal of Health Politics, Policy, and Law 22(3):691-
720.
Arnold, RD. 1990. The Logic of Congressional Action. New Haven, Yale University
Press.
Baumgartner FR and Jones BD. 1993. Agendas and Instability in American Politics.
Chicago, Chicago University Press.
Bednar J. 2010. The Robust Federation: principles of design. Cambridge U.K.,
Cambridge University Press.
Berry WD, Ringquist EJ, Fording RC, and Hanson RL. 2007. ―The Measurement and
Stability of State Citizen Ideology,‖ State Politics and Policy Quarterly 7(2):111:132.
Bowman A O‘M. and Krause GA. 2003. ‗‗Power Shift: Measuring Policy Centralization
in U.S. Intergovernmental Relations, 1947–1998,‘‘ American Politics Research 31:301–
25.
Elazar DJ. 1962. The American Partnership: intergovernmental cooperation in the
United States, Chicago, Illinois, Chicago University Press.
Epstein D and O‘Halloran S. 1999. Delegating Powers: a transaction cost politics
approach to policy making under separate powers, Cambridge U.K., Cambridge
University Press.
Huber JD and Shipan CR. 2002. Deliberate Discretion? Cambridge, U.K., Cambridge
University Press.
Jones B, Wilkerson J, and Baumgartner F. 2008. Policy Agendas Website at
http://www.policyagendas.org/. Data from the website were originally collected by Frank
R. Baumgartner and Bryan D. Jones, with the support of National Science Foundation
grant number SBR 9320922, and were distributed through the Department of
Government at the University of Texas at Austin and/or the Department of Political
Science at Penn State University. Neither NSF nor the original collectors of the data bear
any responsibility for the analysis reported here.
Krause G and Bowman A O‘M. 2005. ―Adverse Selection, Political Parties, and Policy
Delegation in the American Federal System‖ Journal of Law Economics and
Organization, 21(2):359-87.
Krehbiel K. 1998. Pivotal Politics: A Theory of U.S. Lawmaking, Chicago, Illinois,
University of Chicago Press.
139
Lupia A and McCubbins M. 1994. "Learning from Oversight: Fire Alarms and Police
Patrols Reconstructed. Journal of Law Economics and Organization, 10(1):96-125.
Lupia A, Levine A, Krupnikov Y, Piston S, and Von Hagen-Jamar A. 2009. ―Why State
Constitutions Differ in their Treatment of Same-Sex Marriage.‖ Paper presented at the
annual meeting of the Midwest Political Science Association 67th Annual National
Conference, The Palmer House Hilton, Chicago, IL Online 2010-09-16 from
http://www.allacademic.com/meta/p362202_index.html
Maltzman F and Shipan C. 2008. ―Continuity, Change and the Evolution of the Law‖
American Journal of Political Science 52(2):252-267.
Mayhew, D. 2005. Divided We Govern: Party Control, Lawmaking and Investigations,
1946-2002. New Haven, Yale University Press.
McCarty N and Meirowitz A. 2004. Political Game Theory: An Introduction. Cambridge,
U.K, Cambridge University Press.
Mikos R and Kam C. 2005. ―The Impact of Federalism on Citizen Support for Legislative
Action.‖ American Law and Economics Association Annual Meetings Paper5. Available
at http://law.bepress.com/alea/15th/art5.
Moe T. 1989. "The Politics of Bureaucratic Structure." In John E. Chubb and Paul E.
Peterson, eds., Can the Government Govern? Washington, D.C., The Brookings
Institution: 267-329.
Nice DC. 1987. Federalism: the Politics of Intergovernmental Relations. New York, St.
Martin Press.
Nicholson-Crotty S. 2008. ―National Election Cycles and the Intermittent Political
Safeguards of Federalism.‖ Publius: The Journal of Federalism 38(2):295-314.
Oates WE. 2005. ―Toward and Second Generation Theory of Fiscal Federalism.‖
International Tax and Public Finance 12:349-73.
Papke LE and Woolridge JM. 1996. ―Econometric Methods for Fractional Response
Variables With an Application of 401(K) Plan Participation Rates.‖ Journal of Applied
Econometrics 11(6):619-632.
Peterson PE. 1995. The Price of Federalism. Washington D.C., Brookings Institution.
Peterson PE, Rabe B, Wong K. 1986. When Federalism Works. Washington, D.C.,
Brookings Institution.
140
Poole KT and Rosenthal H. 1997. Congress: A Political-Economic History of Roll Call
Voting, New York, Oxford University Press.
Posner PE. 2005. The Politics of Unfunded Mandates: Whither Federalism?
Washington D.C., Georgetown University Press.
Randazzo KA, Waterman RW, and Fine JA. 2006. ―Checking the Federal Courts: The
Impact of Congressional Statutes on Judicial Behavior.‖ Journal of Politics 68
(November): 1003-1014.
Ripley RB and Franklin GA. 1982. Bureaucracy and Policy Implementation. Homewood,
Illinois, Dorsey Press.
Schattschneider EE. 1975. Semi-sovereign People: A Realist’s View of Democracy in
America. Fort Worth, Texas, Harcourt Brace Jovanovich College Publishers.
Scheiber HN. ―Redesigning the Architecture of Federalism—An American Tradition:
Modern Devolution Policies in Perspective,‖ Yale Law and Policy Review 14:227-280.
Teske P. 2005. ―Checks, Balances, and Thresholds: State Regulatory Re-enforcement and
Federal Preemption,‖ PS: Political Science & Politics 38(3):367-370.
United States 2007. ―Budget of the United States Government, Fiscal Year 2008,
Historical Tables,‖ U.S. Government Printing Office, Washington.
van Horn CE. 1979. Policy Implementation in the Federal System: National Goals and
Local Implementers. Lexington, Massachusetts, Lexington Books.
Volden C. 2005. ―Intergovernmental Political Competition in American Federalism.‖
American Journal of Political Science 49(2): 327-342.
Wawro G. 2000. Legislative Entrepreneurship in the House of Representatives. Ann
Arbor, University of Michigan Press.
Weissert, CA. 2007. ―Dividing the Job Revisited: The United States Case 1789-2003,‖ in
Leonardi R and Pagano MA The Dynamics of Federalism in National and Supranational
Political Systems. Houndmills, UK, Palgrave Macmillan.
Wright, D. 1988. Understanding Intergovernmental Relations. 3rd edition, Boston,
Massachusetts, Houghton Mifflin Harcourt P.
Ye X and Pendyala RM. 2004. ―A Model of Daily Time Use Allocation Using the
Fractional Logit Methodology.‖ Paper presented at the 84th
Annual Meeting of the
Transportation Research Board, January 2005, Washington, D.C.
141
Chapter 5
Health Insurance Reform and Intergovernmental Delegation
INTRODUCTION
Most national laws include delegation of authority to the states, either alone or in
partnership with national-level actors. The amount of state-level responsibility in
national laws varies over time and in ways that current arguments about Republican
devolution, aggregate partisanship, the timing of elections, and the type of policies fail to
explain. I contend that previous arguments miss a crucial feature of American politics,
namely the intergovernmental context of national legislators, and that intergovernmental
policy design is based upon this context, in combination with the rules governing each
legislative chamber. By intergovernmental context I mean that state-level constituents
elect legislators and the partisanship of a state‘s leadership is paramount to how the
policy will be implemented when the states receive authority in national law. Thus,
individual legislators are concerned about what their state will do with the policy when
considering various national proposals with intergovernmental delegation.
After developing a theory of intergovernmental delegation based on this
intergovernmental context and creating a database of intergovernmental delegation, I
conducted a large-N aggregate analysis, which reveals support for my argument.
Specifically, I find that as a pivotal intergovernmental group of legislators becomes more
distant from their states, delegation to the states decreases and that as uncertainty over
142
the partisanship of the next term‘s state leadership increases, state delegation decreases.
In this chapter, I use a case study to extend this analysis by providing an in-depth
consideration of the national politics of the 2009-2010 health insurance reform, which
eventually yielded the 2010 Patient Protection and Affordable Care Act (ACA). The
intergovernmental delegation within the ACA and the voting rules and processes of the
House and Senate ultimately resulted in health insurance reform that involves both
national and state policy implementers on a massive scale and in uncharted territory.
By focusing on the nuances of the politics surrounding one policy, I gain a closer
look of how and why Congress created the intergovernmental structural choices it did.
Underlying the wheeling, dealing, and partisan bickering was the strategic and careful use
of state and national delegations of authority in House and Senate proposals.
Policymakers mindfully created the architecture of responsibility within the myriad
policies debated where states or national-level bureaucrats had authority within the
policy. A close consideration of these bills reveals that they differed significantly in the
degree of authority delegated to the states. The central question of this chapter is a
consideration of why policymakers crafted proposals with such variation in the extent to
which authority was delegated to the states. Specifically, I consider three crucial
components of the theory of intergovernmental design from Chapter 2, the states as a
viable agent for Congress, legislators‘ intergovernmental context, and the importance of
the institutional rules of each chamber in determining the bills each produced.
The case study method allows me to consider if real-world legislators behave in
the way I hypothesize they do and if the posited mechanism is at work in national
policymaking. The benefits of focusing on health insurance reform are twofold: the
143
recent process was fresh in the minds of staffers and numerous different reform proposals
were voted on, each varying in the extent of intergovernmental delegation. The
limitations, of course, include the focus on one policy area and one time period, limiting
my ability to consider whether policy type or the passage of time influence
intergovernmental delegation. Further, there is the problem of the relative constant
partisanship of the national and state-level executive branches (only two states changed
governors during the voting on health insurance reform measures), a key element in my
argument. Thus, the counterfactuals of how legislators would behave if a Republican
was in the White House and/or their state governor was of a different party are
unavailable. Due to the lack of counterfactuals, this case study does not fully test my
theory.
In sum, this case study of health insurance reform allows me to examine three
aspects of my theory: intergovernmental delegation strategies used by legislators, how
legislators‘ intergovernmental context contributes to state authority allocation, and the
effect of institutional differences between the House and Senate on proposals and
legislative behavior (e.g., statements or voting). I am unable, however, to check whether
legislators would have chosen different delegation options under a Republican president
or alternative governor. I can, though, examine the machinations of policy actors with
respect to the mechanisms underlying my theory and compare the theoretical
expectations with those of rival arguments to see which hypotheses provide a better fit
with the data.78
78
One of the rival explanations is that policy type determines delegation choices, since I only consider one
policy type in this chapter, I cannot examine this particular argument.
144
I analyze, using the coding processes elaborated in Chapter 3, the structure of
delegation in the bills voted on in the House and the Senate including the Health,
Education, Labor and Pensions (or HELP) and Finance committee bills from the Senate,
the Patient Protection and Affordable Care Act (or ACA), the Tri-Committee House bill,
and the Health Education and Reconciliation Act (or HERCA), as well as the patterns of
voting and signs of support on measures by legislators in both chambers. I utilize
archival resources including votes cast, transcripts of committee hearings and floor
debates, news media, memos, blogs, and reports issued by key players such as
congressional elite, the Congressional Budget Office, the Governmental Accountability
Office, the Joint Committee on Taxation, and the Office of Management and Budget. In
addition, I code the results of anonymous interviews conducted from July through
September 2010 with current and former Democratic and Republican congressional
staffers.
This chapter proceeds first by briefly setting the context for health insurance
reform in the United States. Second, I consider my theory of federal policy design in the
context of health insurance reform. Third, I elaborate the methods and analyses
employed in this case study. Fourth, I analyze crucial aspects of my theory regarding
how legislators delegate authority across federal levels. Finally, I consider alternative
arguments about centralization and decentralization of policy authority in comparison to
intergovernmental delegation hypotheses.
CONTEXT OF HEALTH INSURANCE REFORM
Reforming the health care system played a large role during the 2008 presidential
campaigns and particularly in the Democratic primaries (Reichard 2008, Cooley 2008).
145
Data on the vast amounts of money sunk into health care in the United States compared
to other developed nations, yielding shockingly poorer health outcomes, the lack of any
or adequate insurance for millions of Americans, and the rapid increase in health care
costs were emphasized repeatedly (see Murray and Frenk 2010 for an overview of the
data and trends from the World Health Organization data). A Commonwealth Fund
(2010) report on the congressional bills as of December 2009 summarizes the prevailing
conditions on the minds of policymakers:
In September, the Census Bureau reported that 46.3 million
people lacked health insurance in 2008, up from 45.7 million in
2007. The Commonwealth Fund estimates that in 2007 an
additional 25 million insured adults under age 65 had such high
out-of pocket costs relative to their income that they were
effectively underinsured, an increase from 16 million people in
2003… An estimated 79 million adults, both with and without
health insurance, reported problems paying their medical bills in
2007 and 80 million reported a time that they did not get needed
health care because of cost… At current cost trends, average
family premiums in employer plans are expected to nearly
double by 2020.
Coupled with the ever-increasing out-of-pocket expenses insured workers were being
asked to pay, increasing 8.5% between 2004-2006, the Democratic base (and the majority
of all Americans) expressed dissatisfaction with the current system and the need to
change the status quo (Fuchs and Emanuel 2005, Farley 2009, Cunningham 2010).
With big wins at the polls in November 2008, it was possible that Democrats
would take on the challenge of reforming the ―broken‖ health care system. Yet, the cry
for change had been present for decades, and policymakers had repeatedly failed to
deliver (Gray et al. 2009, Light 2011, Skocpol and Williamson 2010). The collapse of
the Clinton administration‘s massive effort and eventual health proposal in 1993-1994
and the difficulties encountered in passing and sustaining other health-related legislation
146
(for instance the Medicare Catastrophic Care Act in 1988 and subsequent repeal) led
many in the health policy community to take the ―believe it when I see it‖ perspective.79
In addition, those knowledgeable about the system of health care and public
health in this country expressed the dire need to overhaul the organization, financing and
delivery of health and public health services (Chassin et al 1998), including the
employer-based health insurance system, the fractured public and private health care
funding, and the organization of local health departments, to name a few (Jacobson and
Gostin 2010, Fuchs and Emanuel 2005). Such a large upheaval seemed politically
impossible in a society with strong, organized, and vested interests in the current system
and with the enormous price tag and uncertainty accompanying such an effort.
Jacobs and Skocpol (2010) discuss the expert advice given to Obama that he
should only work for incremental changes in health care and health insurance, if any at
all. Yet, Ted Kennedy‘s plea that Obama make health reform an agenda priority, along
with the Democratic majorities in the House and Senate seemed to work together to make
the initial presidential push for health insurance reform along with the extended sideline
cheering from the White House to Congress (Jacobs and Skocpol 2010).80
Instead of
pursuing the Clinton strategy of assembling experts knowledgeable about the nuances of
the public health and health care system, writing a detailed bill, and then giving it to
Congress for debate and hopeful passage, Obama outlined broad principles of reform and
left Congress with the work of crafting and deliberating the specific contours of health
insurance reform (Oberlander 2009). Jacobs and Skocpol (2010) add that ―it was not that
79
See Light(2011) for a brief review of the organization and financing of health care along with reform
efforts over the decades and Gray et al. (2009) regarding state policy advances and failures. 80
The authors, based on interviews with staffers, cite Kennedy‘s losing battle with brain cancer as a key
motivating factor.
147
different from what always happens when [fashioning] major legislation… [following]
the paths and practices used for years [by Republicans and Democrats alike]…building
the necessary coalitions to enact it through five committees and the entire House and
Senate in less than a year.‖
The ACA, as modified by HERCA, is a law with hundreds of provisions touching
on various aspects of health care, health insurance, and public health in the United States
(Kaiser Family Foundation 2010).81
The law requires U.S. citizens and legal residents to
have health insurance (the individual mandate) or pay a monetary penalty, and requires
employers to offer their employees coverage, both with certain exceptions and
specifications. ACA also creates state-based health insurance exchanges (or organized
marketplaces for private insurance) and small business health options program (SHOP)
exchanges with specifications regarding benefits, options, and rating rules and increases
the rules and regulations over the health insurance industry with greater national-level
involvement.
The law expands Medicaid to all under the age of 65 with incomes up to 133% of
the federal poverty level with additional funds to aid states in the expansion. The ACA
supports comparative effectiveness research, provides demonstration grants to states
regarding medical malpractice alternatives to current tort litigations, and improves
preventative services and long-term care coverage. Additionally, it provides limitations
to ensure that federal funds are not used for abortions. The ACA is expected to cost
approximately one trillion dollars and is projected to reduce the federal deficit by $143
billion over the next ten years‖ (Hacker 2010, Cutler, Davis, and Stremikis 2010).
81
The Kaiser Family Foundation provides a summary of the ACA as modified by HERCA (as well as the
Senate and House bills and ACA alone) at http://www.kff.org/healthreform/upload/8061.pdf.
148
During the debate and since the passage of the health insurance reform law, policy
elites and public health scholars have remarked on the potential and magnitude of the
reform calling it ―the most important piece of health care legislation since the creation of
Medicare and Medicaid‖ (Cutler 2010), ―the most sweeping reform in health insurance
since the creation of Medicare…and Medicaid‖ (Light 2011), ―a remarkable policy
breakthrough‖ (Hacker 2010), and ―a historic health care reform law that will help
ensure that all families are able to get the care they need, as well as financial security and
relief from rising premiums…the first step toward bending the health care cost curve for
the federal government and families‖ (Cutler, Davis and Stremikis 2010).
The recent health insurance reform legislation does not lack for its critics, though.
Jacobson and Lawrence (2011), for instance, say that ―[d]espite its innovation in health
care access, prevention and wellness, the [the health insurance reform law] takes the
existing system as a given and does little to change the fundamental dynamic on how
public health is organized, financed, and delivered‖ and Ruger (2010) states that ―the Act
is primarily about health insurance, not health care delivery.‖82
Light (2011) also
discusses the failure of policymakers to deal with ―the increasingly unreliable foundation
of employer-based health insurance.‖ In the end, the success of health insurance reform
depends upon three things: the ability of Congress to fund the existing pieces of the
legislation, the capability of current and future politicians to fine-tune the policy, and the
commitment of implementers, including the Department of Health and Human Services,
the America‘s Health Insurance Plans, health care practitioners, and state policymakers
and bureaucrats, to name a few.
82
See also Jacobson and Lauer (2010) for an interesting assessment of Skocpol and Williamson (2010) and
potential pitfalls related to whether ACA ―will be a transformational event.‖
149
What is interesting, from the perspective of this chapter, about the context of
health insurance reform legislation in 2009 and 2010, is the fact that although federalism
and intergovernmental issues were foundational in how the various pieces of legislation
were crafted, few scholars and pundits have remarked on their significance during the
debates and passage. In fact, federalism has only taken on importance as states have filed
suit against the federal government for encroaching on state sovereignty with respect to
Medicaid expansion and as states began working with the Department of Health and
Human Services (or HHS) to implement various provisions (Chollet 2010, Nichols 2010,
Jennings and Hayes 2010, Iglehart 2011, Hodge et al. 2010, yet see Jost 2010 or
Rosenbaum 2010 for an earlier consideration). And yet, this study‘s closer look reveals
that crafting the intergovernmental nature of health insurance reform played a key role in
this policymaking venture.
THEORETICAL FRAMEWORK
Intergovernmental Policy Design
Recall the answer as to why Congress varies the intergovernmental structure of
policies, according to my theory, is that legislators prefer to delegate to the closest agent,
either the states or the national executive branch. This consideration of the leadership in
the states from which legislators hail creates four types of legislators in Congress:
Democratic legislators from states with Democratic governors (DD legislators),
Democratic legislators from states with Republican governors (DR legislators),
Republican legislators from states with Democratic governors (RD legislators), and
Republican legislators from states with Republican governors (RR legislators). The
majoritarian rules of each chamber, the frequency of the intergovernmental teams, and
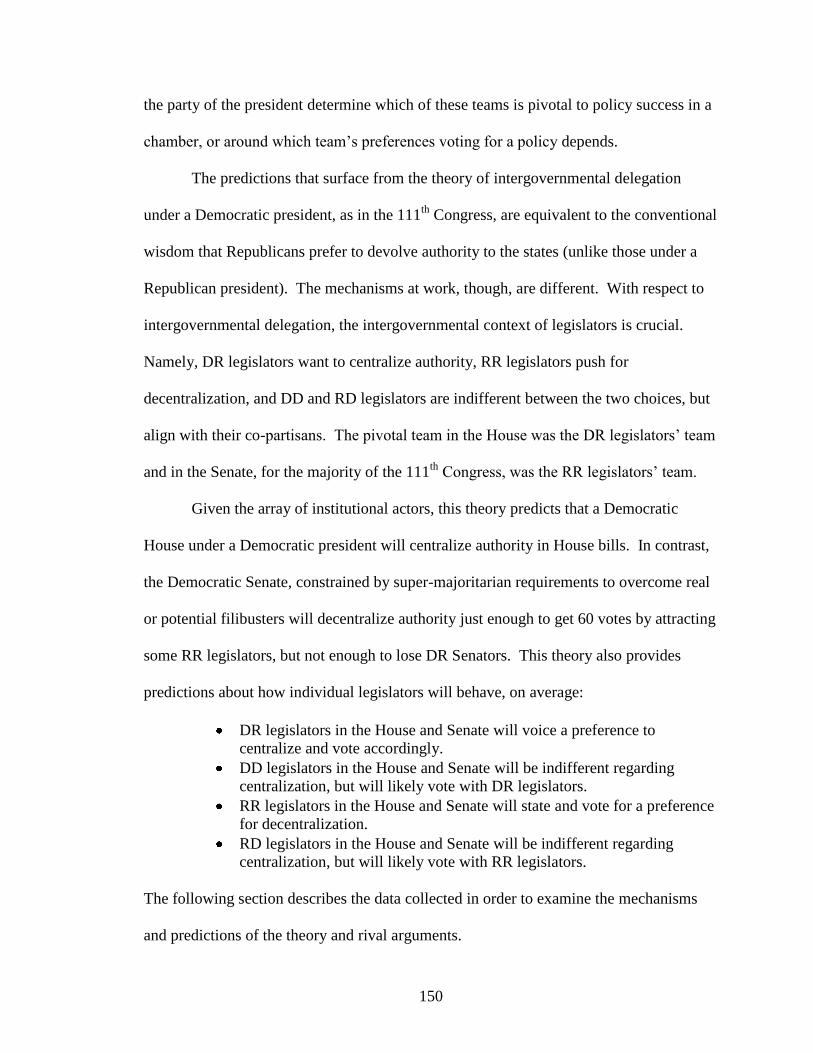
150
the party of the president determine which of these teams is pivotal to policy success in a
chamber, or around which team‘s preferences voting for a policy depends.
The predictions that surface from the theory of intergovernmental delegation
under a Democratic president, as in the 111th
Congress, are equivalent to the conventional
wisdom that Republicans prefer to devolve authority to the states (unlike those under a
Republican president). The mechanisms at work, though, are different. With respect to
intergovernmental delegation, the intergovernmental context of legislators is crucial.
Namely, DR legislators want to centralize authority, RR legislators push for
decentralization, and DD and RD legislators are indifferent between the two choices, but
align with their co-partisans. The pivotal team in the House was the DR legislators‘ team
and in the Senate, for the majority of the 111th
Congress, was the RR legislators‘ team.
Given the array of institutional actors, this theory predicts that a Democratic
House under a Democratic president will centralize authority in House bills. In contrast,
the Democratic Senate, constrained by super-majoritarian requirements to overcome real
or potential filibusters will decentralize authority just enough to get 60 votes by attracting
some RR legislators, but not enough to lose DR Senators. This theory also provides
predictions about how individual legislators will behave, on average:
DR legislators in the House and Senate will voice a preference to
centralize and vote accordingly.
DD legislators in the House and Senate will be indifferent regarding
centralization, but will likely vote with DR legislators.
RR legislators in the House and Senate will state and vote for a preference
for decentralization.
RD legislators in the House and Senate will be indifferent regarding
centralization, but will likely vote with RR legislators.
The following section describes the data collected in order to examine the mechanisms
and predictions of the theory and rival arguments.
151
RESEARCH DESIGN AND METHODS
For this in-depth qualitative project, I utilize an explanatory case study design and
consider the mechanisms underlying the theory of federal policy design versus rival
explanations of policy decentralization for explaining the state allocation of authority in
the various health insurance reform policy proposals. Within the single case of the 2009-
2010 health insurance reform policy, there are multiple subunits for analysis.
Specifically, I define my case to be the congressional health insurance reform process
from November, 2008 through March, 2010 and a subunit to be a national legislative
package debated and voted on in at least one venue. This definition yields five separate
subunits within the health insurance reform case: the Health Care and Education
Reconciliation Act (HERCA), the Patient Protection and Affordable Care Act (ACA), the
House Tri-Committee bill, the Senate HELP Committee bill, and the initial Senate
Finance bill.
I utilize multiple sources of evidence including documents, archival records, and
semi-structured interviews with policy elites. By triangulating these data sources, I
attempt to uncover the preferences of legislators with respect to intergovernmental
delegation of authority. Legislators may use rhetoric (to the media, during committee
hearings, or on the floor) to discuss how they feel about a measure, they may use actions
(committee or floor voting, in addition to the rhetoric), and they may privately discuss
strategies with their policy staffers. Triangulation of the data over time is crucial, since
members of Congress may also use rhetoric to hide their preferences or their voting
behavior from their constituents (or others) or they may feel forced to vote in particular
ways due to partisan pressures.
152
I analyze the resulting data for overarching themes, the calculus of individual
legislators, and important features of the negotiation and crafting of the legislative
packages in the House, in the Senate, and between national-level institutions. Next, I
delineate the process used to access archives, obtain documents, and conduct the
interviews.
Archival records include votes cast, party identification, dates of election, and
data on state governors and elections (see appendix for details on collection).83
For each
national legislator the following archival data was utilized: name, chamber, district, state,
election year, party, governor‘s name, governor‘s election date, governor‘s party, votes
cast on the floor, and votes cast in committee. Committee votes were captured from the
transcripts of committee markups and voting sessions. The documents examined for this
project included media outlets such as blogs, newsprint (online and hard copy sources),
television and radio transcripts, as well as transcripts of committee meetings, roundtables,
hearings, and floor debates. These data sources were searched for the terms ―congress,‖
―legislat,‖ ―house,‖ ―senat,‖ ―member,‖ and ―rep‖ and reviewed for content related to
legislative decision-making. In addition, I searched for ―state,‖ ―federal,‖ ―intergov,‖
―preempt,‖ and ―mandate‖ in order to examine intergovernmental and federalism
considerations. Please refer to Appendix A-1 for additional details on the collection
process.
In June of 2010, three months following the passage of the ACA and HERCA, I
emailed key committee staff in the House and Senate with a one page description of my
83
The United States Senate and House of Representatives online current legislator listings were used to
capture each legislator‘s date of election. The National Conference of State Legislators election data
(gubernatorial results and election dates) were collected from their website and matched to each national
legislator using Excel.
153
research and a request for an interview (see Appendix A-2). In addition, due to concerns
about a possible lack of response and the likely research and health policy fatigue of
staffers, I individually emailed identifiable staff of all 535 members of Congress (using
members‘ website information) instead of a sampling. In all, over 650 emails were sent
in the final two weeks of the month.84
Once in Washington, I used a snowball sampling
technique whereby I asked each participant to provide a list of names of additional
staffers I should contact. I chose to interview staff and not legislators for two reasons: I
assumed that staffers would have more available time in Washington during the summer
months than would legislators and, more importantly, I thought I would be able to get to
the heart of the mechanisms of why legislators made the decisions they did about what to
support, not what rhetoric they used, by speaking with key members of their staff. In the
end, I was able to interview via phone, email or in-person, twelve policy staffers.
In order to gauge the way in which members of Congress thought about
intergovernmental delegation, I created a list of open-ended questions and prompts to use
in conversational interviews with the participants. This list was short (see Table 5-1) and,
due to the massive nature of the policy, focused on two aspects of health insurance
reform: health insurance exchanges and Medicaid. The degree of state authority in both
policy instruments was contentious and the narrowing of the interview allowed us to
delve into specifics of delegation to the states, ideology, and federalism concerns.
The conversational nature of the interviews allowed staffers to tell the story
behind the scenes. Interviews lasted between 45-90 minutes and every staffer had
84
The overwhelming response from emails was ―no response,‖ an out of the office reply, or an error
message (those staffers no longer worked for those offices). Approximately 50 staffers emailed back that
they had nothing to do with the process and I should contact the relevant committee staff instead. Four
replies from these emails were affirmative and I began the interviews in early July with the hope that I
could increase the number of participants while on site.
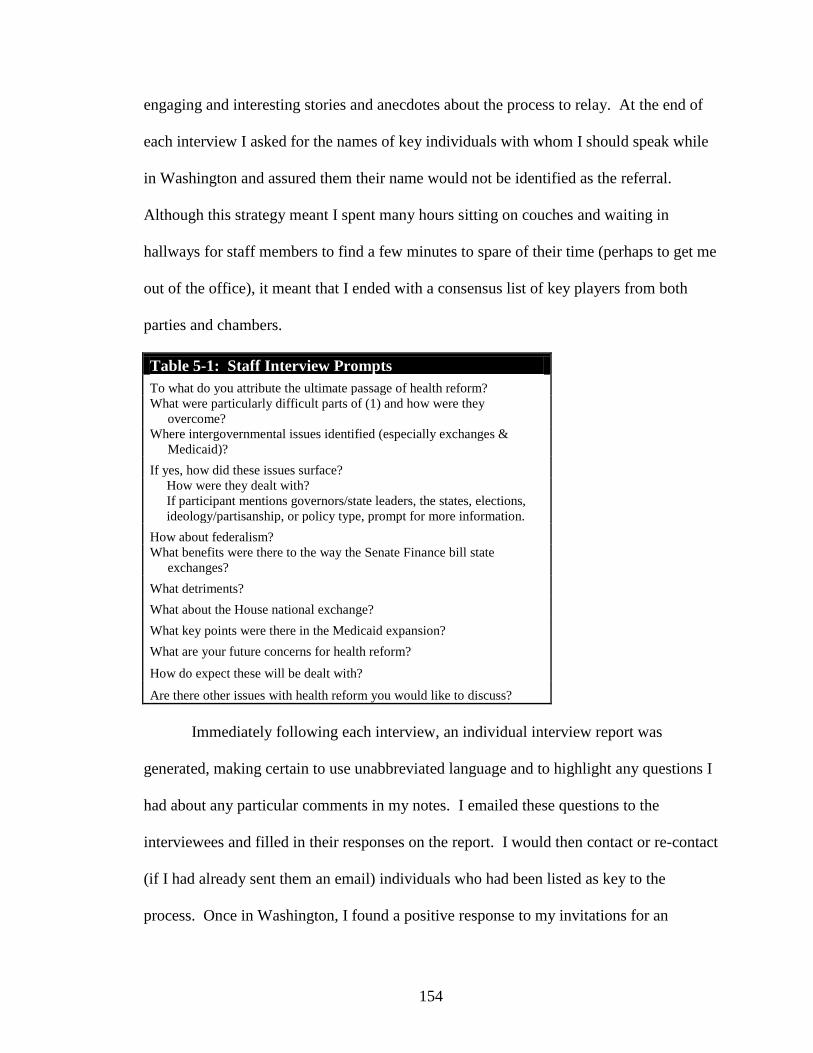
154
engaging and interesting stories and anecdotes about the process to relay. At the end of
each interview I asked for the names of key individuals with whom I should speak while
in Washington and assured them their name would not be identified as the referral.
Although this strategy meant I spent many hours sitting on couches and waiting in
hallways for staff members to find a few minutes to spare of their time (perhaps to get me
out of the office), it meant that I ended with a consensus list of key players from both
parties and chambers.
Table 5-1: Staff Interview Prompts
To what do you attribute the ultimate passage of health reform?
What were particularly difficult parts of (1) and how were they
overcome?
Where intergovernmental issues identified (especially exchanges &
Medicaid)?
If yes, how did these issues surface?
How were they dealt with?
If participant mentions governors/state leaders, the states, elections,
ideology/partisanship, or policy type, prompt for more information.
How about federalism?
What benefits were there to the way the Senate Finance bill state
exchanges?
What detriments?
What about the House national exchange?
What key points were there in the Medicaid expansion?
What are your future concerns for health reform?
How do expect these will be dealt with?
Are there other issues with health reform you would like to discuss?
Immediately following each interview, an individual interview report was
generated, making certain to use unabbreviated language and to highlight any questions I
had about any particular comments in my notes. I emailed these questions to the
interviewees and filled in their responses on the report. I would then contact or re-contact
(if I had already sent them an email) individuals who had been listed as key to the
process. Once in Washington, I found a positive response to my invitations for an
155
interview from all but one member‘s office. The staffer from that office responded that
he or she ―was not comfortable talking about [health insurance reform] and federalism.‖
Another key office was positive in their response but could not find time in their calendar
to meet with me during my time in town.
Staffers who opted to participate in the study were highly involved in the process
of health insurance reform either in one of the relevant House or Senate committees or in
their individual member‘s offices. Only one staffer had not been either at the table while
the bills were crafted in the committees or in numerous meetings with their boss
discussing plans of action.85
At the time of the interviews (July and September 2010),
these staffers were carefully watching implementation and some were in the midst of re-
election campaigns. Participants included Republicans and Democrats from both the
House and the Senate.
Following my week of interviews, I assessed the interview documents for
overarching themes derived from the theoretical argument, rival explanations, as well as
any additional crucial issues that had emerged in conversations with the staffers. The
results of these interviews, the coding of the bills and laws, and archival review are
described in detail in the Data Analysis section. In particular, the critical aspects of the
theory of intergovernmental delegation I examine include:
Legislators‘ perceptions regarding delegation of authority to the states
The influence of chamber rules for who is pivotal in voting, and
The nature and influence of legislators‘ intergovernmental context on state
authority allocation.
85
That staffer had recently joined the member‘s office, but had discussions with the previous occupant of
that position and felt comfortable answering the questions provided. The responses of that staffer align
with those of the other participants and remain in the results reported here.
156
The intergovernmental context of legislators refers to the fact that when national policy is
delegated to state implementers, individual legislators in Congress must consider how the
leadership in their own state will implement the policy. This implementation is vital
because the way the language of statutes maps into policy actions determines the ultimate
policy outcomes. Prior to analyzing the data from the various sources, I discuss the
operationalization and measurement techniques used for state authority allocation and
intergovernmental delegation.
Federal Authority Allocation
To measure intergovernmental delegation I followed the procedures outlined in
Chapter 3 and obtained a summary of the major provisions of each law and bill from the
Congressional Research Service (CRS) through the Library of Congress THOMAS on-
line service.86
I used the CRS summary for the enacted legislation and for each bill that
received action and coded each summarized provision for delegation of responsibility
according to the set procedures of Chapter 3. These procedures included assigning a
provision as ―national‖ when a new national agency was created or an existing national
agency or group was required to perform a duty or implement the provision, ―state‖ when
provisions required state or local-level action with no national involvement, and ―joint‖
when both state- and national-level entities were assigned responsibility or required to
establish or maintain a state-national partnership. After each law or bill was coded,
summary measures for that law were calculated including: the total number of
86 Accessed July 2010-February 2011 from http://thomas.loc.gov/home/bills_res.html. Previous studies
often utilize Congressional Quarterly (CQ) Almanac summaries of laws (e.g. Epstein and O‘Halloran 1999
and Maltzman and Shipan 2008). A comparison coding of CQ summaries and CRS summaries revealed
that CQ summaries often provided ambiguous information on the specific federal entity that received
authority in each provision. CRS summaries, alternatively, provided details about which entities were
responsible for each provision included in the summary.
157
summarized provisions in the law or bill, the number of national provisions, the number
of joint provisions, the number of state provisions and the number of other provisions.
To operationalize federal delegation, I first created three continuous measures of
the proportion of federal delegation in the provisions within each law or bill. The
proportion of national provisions is the number of national provisions within a law or bill
divided by the total number of provisions (excluding those that do not delegate authority
and that delegate to the ―other‖ category) within the measure. Similarly, the proportion
of joint-partnership provisions and proportion of state provisions are the number of joint
(or state) provisions divided by the total number of provisions (excluding as above) in a
law or bill. For instance, a law that has a total of 100 provisions with 50 that delegate
authority to national-level actors, 40 provisions that utilize joint partnerships, and 10 that
are coded as direct state delegation would be 0.5 national, 0.4 joint-partnership, and 0.1
state delegation.
The overall federal delegation measure, or degree of decentralization, takes into
account both joint and state delegation choices by collapsing the categories of delegation
into a continuous measure within the bounds zero to one. The degree of decentralization
is calculated by adding the proportion of state provisions in a law (provisions that
delegate entirely to the states) to one-half the proportion of joint provisions (provisions
that delegate partially to the states and partially to the national executive branch). For
example, a law with 100 provisions: 50 national, 40 joint, and 10 state would receive a
decentralization score of .30 (50 * 0 + 40 * ½ + 10 *1).
Table 5-2 lists the descriptive statistics for all four measures for federal authority
allocation for each health insurance reform bill and law. Two prominent features of this
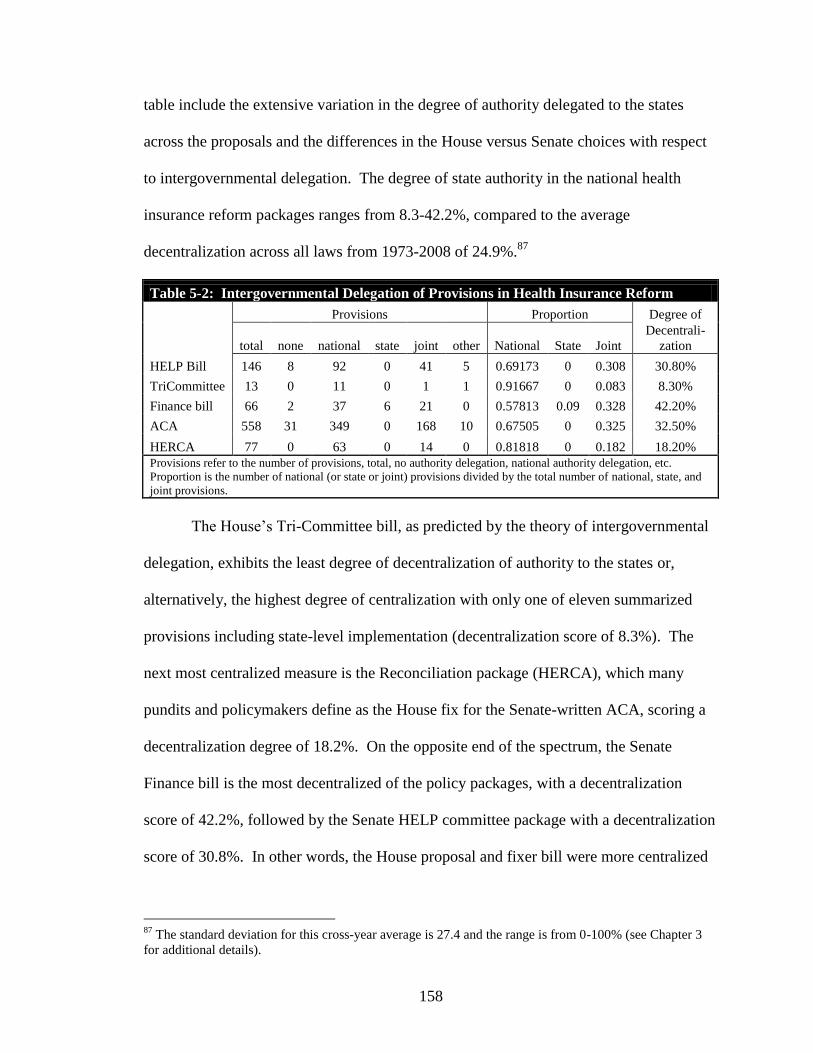
158
table include the extensive variation in the degree of authority delegated to the states
across the proposals and the differences in the House versus Senate choices with respect
to intergovernmental delegation. The degree of state authority in the national health
insurance reform packages ranges from 8.3-42.2%, compared to the average
decentralization across all laws from 1973-2008 of 24.9%.87
Table 5-2: Intergovernmental Delegation of Provisions in Health Insurance Reform
Provisions Proportion Degree of
total none national state joint other National State Joint
Decentrali-
zation
HELP Bill 146 8 92 0 41 5 0.69173 0 0.308 30.80%
TriCommittee 13 0 11 0 1 1 0.91667 0 0.083 8.30%
Finance bill 66 2 37 6 21 0 0.57813 0.09 0.328 42.20%
ACA 558 31 349 0 168 10 0.67505 0 0.325 32.50%
HERCA 77 0 63 0 14 0 0.81818 0 0.182 18.20%
Provisions refer to the number of provisions, total, no authority delegation, national authority delegation, etc.
Proportion is the number of national (or state or joint) provisions divided by the total number of national, state, and
joint provisions.
The House‘s Tri-Committee bill, as predicted by the theory of intergovernmental
delegation, exhibits the least degree of decentralization of authority to the states or,
alternatively, the highest degree of centralization with only one of eleven summarized
provisions including state-level implementation (decentralization score of 8.3%). The
next most centralized measure is the Reconciliation package (HERCA), which many
pundits and policymakers define as the House fix for the Senate-written ACA, scoring a
decentralization degree of 18.2%. On the opposite end of the spectrum, the Senate
Finance bill is the most decentralized of the policy packages, with a decentralization
score of 42.2%, followed by the Senate HELP committee package with a decentralization
score of 30.8%. In other words, the House proposal and fixer bill were more centralized
87
The standard deviation for this cross-year average is 27.4 and the range is from 0-100% (see Chapter 3
for additional details).
159
than the Senate options, which fits with the expectations of the theory of
intergovernmental policy design.
This coding provides a skeleton or a summary measure for bills and laws that took
thousands of hours of work to pass (just including the time during the 111th
Congress).
The remaining sections consider this effort and how these measures and their diverse
delegation choices came into being.
DATA ANALYSIS
In this section I describe the findings from the various data sources described
above with respect to three components of the theory including, state delegation,
intergovernmental context, and chamber rules. Prior to discussing these concepts, I
provide details about the makeup of the national legislative chambers during the 111th
Congress.
Institutions and Actors in the 111th
Congress
In the first session of the 111th
Congress, DD legislators were in the majority.
Specifically, 157 House members and 38 Senators hailed from states with Democratic
governors and were also themselves Democrats. The remainder of the Democratic party
caucus in Congress included twenty Senators (including Lieberman, D-CT) and 93 House
members who were DR legislators, ten Representatives from states with Independent
governors, and one Independent Senator from a state with a Republican governor
(Sanders, I-VT).88
These numbers indicate that in the House there were 250 members of
the Democratic caucus, a comfortable majority given the rules of that institution. What
they also reveal is that DD legislators could not pass a bill alone; they needed to gain the
support of at least one other intergovernmental team in each chamber. In the House, the
88
Lieberman can also be coded as an Independent legislator.
160
157 DD legislators needed 61 additional DR legislators (or DI or IR legislators) in order
to pass a bill on the floor.89
The Senate, given its rules and the potential need for 60 votes to invoke cloture
and overcome a filibuster by any one senator, faced more of a challenge, in that at least
three intergovernmental teams were often needed to successfully pass a Senate bill on the
floor. From January through April, 28 2009, Senate Democrats comprised only 58 of the
100 legislators (including Sanders, who caucused with the Democrats). There were 38
DD Senators and 20 DR or DI Senators. With Arlen Specter‘s switch to the Democratic
party on that date, the Senate reached 59 votes and with the seating of Al Franken of
Minnesota in July the threshold of 60 votes (Specter became a DD Senator, with the
Pennsylvania Democratic governor, Ed Rendell and Franken was a DR Senator, with a
Republican governor, Tim Pawlenty). Edward Kennedy‘s death in August of that year,
followed by the election of Scott Brown on January 19, 2010 lowered the Democratic
majority to 59 votes once again.90
In terms of my theory of intergovernmental design, the
pivotal federal team in the Senate was the team of DR legislators for a scant few months
in 2009.91
For the rest of the 111th
Congress, the pivotal team in the Senate was the team
comprised of RR legislators.
89
In the 111th
Congress, there are two (if Lieberman is counted) Independent legislators. The theory of
intergovernmental delegation assumes these legislators fit with one of the majority or minority
intergovernmental teams and does not provide specific predictions for them. In this chapter, I consider
Independents separately to assess whether these legislators act differently than my model suggests. 90
Paul Kirk was appointed to fill Senator Kennedy‘s position and was in office from Sept 24, 2009 through
Senator Brown‘s seating on February 4, 2010. After the special election, though, Senate leaders agreed to
delay a vote on health care reform until after Brown was seated. 91
The time specifically included: July 7 2009 – August 25, 2009, which I do not count since Kennedy‘s
last floor vote was on April 27, 2009 (60 votes were needed), and September 24, 2009-February 4, 2010
(when Paul Kirk filled Kennedy‘s seat). I only count the time period up through the Massachusetts election
on January 19, 2010, since Senators expressed the commitment (in the Congressional Record) to not pass
significant legislation until Brown could be seated in February. Thus, only for the months of October,
November, and December did the Senate truly have 60 Democratic Senators, and that was only if the ailing
Senator Byrd was in attendance. Byrd‘s health declined through the 111th
Congress.
161
In the House, the changes between the first and second session of the 111th
Congress included 24 members with new governors in 2010. New Jersey and Virginia
elected Republican governors in 2009 where Democrats had previously been in power.
These changes yielded no differences in the pivotal federal team in the House, though
there were slight changes in the sizes of the teams. For both sessions, the pivotal team
was made of Democratic members from states with Republican governors. According to
the theory, these differences in the pivotal teams in the Senate and the House resulted in
different preferences over whether the states would be given more authority in policy or
not. The House‘s pivotal team of Democrats from states with Republican governors
preferred to centralize power with the national bureaucracy under a Democratic president.
The Senate, on the other hand, preferred to decentralize authority to the states due to the
pivotal team of Republicans from states with Republican governors.
Just prior to the first meeting of the 111th
Congress and immediately following the
2008 elections, media sources began to discuss the potential difficulties Obama would
have negotiating differences between two powerful committee chairmen in the Senate,
Baucus (D-MT) and Kennedy (D-MA), and how these same challenges were a problem
for Clinton‘s health plan (Frates 2008a, 2008b). These concerns were soon put aside for
more interesting stories as Obama provided the major principles to be addressed in health
insurance reform, but left the details up to Congress. These scintillating issues included
closed-door health insurance reform proposal negotiations in the Senate with Senator
Baucus and his ―Gang of Six,‖ Blue Dog Democrats concerns with liberal Democrats in
the House, and the role of abortion policy in health insurance reform. The next section
provides an analysis of the data from archives, documents, and interviews with respect to
162
state delegation, intergovernmental context, and chamber rules as the national health
insurance reform political process unfolded.
In the House, three committees—Education and Labor, Energy and Commerce,
and Ways and Means—worked together to craft a single proposal that would eventually
reach the House floor for a vote. Other committees and subcommittees also held
hearings and roundtables on various aspects of health insurance reform during the 111th
Congress, including the Committee on Small Business, the Committee on the Judiciary,
the Committee on the Budget, and the Committee on Financial Services, to name a few.
The House debated and passed their version of health insurance reform (Tri-Committee
bill, HR 3962) on November 7, 2009.
Although similar to the House, in that a number of committees held roundtables
and hearings on health care reform topics including the Committees on the Judiciary,
Commerce, Science and Transportation, and a Special Committee on Aging, the process
in the Senate was quite different. Specifically, in the Senate, two committees marked up
two different bills—the HELP and Finance committees—instead of the three House
committees working together on one proposal. The Senate debated the revised version of
the Finance committee bill (what would eventually become ACA, HR 3590) for 21 days
in November and December, 2009. The successful final passage vote took place late on
December 24, 2009.
On March 21, 2010, after the special election of Scott Brown (R-MA) to fill the
vacancy left by the death of Senator Kennedy, the House considered and approved the
Senate passed ACA bill, immediately followed by a reconciliation package (HERCA, HR
4872). President Obama signed the ACA (HR 3590; PL 111-148) on March 23, 2010.
163
The Senate raised procedural concerns with HERCA and sent it back to the House with
amendments on March 25, 2010, where it passed and was sent to the President to be
signed (on March 30, 2010), thus ending this episode in modern health insurance reform.
Although the saga of health insurance reform continues as political actors mount
challenges to the ACA as modified by HERCA and the states and national executive
branch are fully engaged in implementation of many of its provisions, this chapter only
considers the strategic crafting of the health insurance reform proposals in order to
successfully enact a national law.
In all, in the House, given the closed rule consideration of health insurance
reform, thirteen votes in 2009-2010 were on health insurance reform specifically (or less
than 0.8% of all votes). Of those votes, Republicans maintained a united front, voting
together against the House bill, the ACA, and HERCA, with one exception. Louisiana‘s
Joseph Cao voted in favor of the House bill on the final passage of the Affordable Health
Choices Act. Cao told a Louisiana paper that "[m]y commitment is to support the
President in his reform bill" (Tidmore 2009). The Representative, though, voted against
the health insurance reform measures throughout the rest of the 111th
Congress. In
comparison, there was variety in the voting behavior of House Democrats. Forty-six
House members voted against one or more of the health insurance reform proposals.92
On the Senate floor, there were thirty-four votes cast with respect to the ACA
during the debate that lasted from November 21 through December 24, 2009 and forty-
four votes on HERCA from March 23-25, 2010. These votes included motions to invoke
92
For instance, Mitchell of Arizona‘s 5th
district voted against the reconciliation measure that returned
amended from the Senate, but voted in favor of all other measures and Teague of New Mexico‘s 2nd
district
is one of four members who voted for the Senate amended HERCA, but against all other health care reform
measures. Kucinich of Ohio is one of eight Representatives who voted against the House bill, but in
support of the ACA and HERCA.
164
cloture (except on HERCA, since it was time-limited to begin with) and various
amendments. This number means that out of the entire 696 votes cast on the floor during
the 111th
Senate, 11.2% were on the ACA or HERCA. All Democrats and Independents
voted in favor of ACA on final passage. For HERCA, since it was a reconciliation
measure, which sidestepped the filibuster, a simple majority was all that was needed for
passage. Even so, only three Democratic Senators changed their votes from aye to nay:
Lincoln and Pryor of Arkansas and Nelson of Nebraska (who no longer received the
Cornhusker kickback in HERCA).
The preceding committee votes had also been straight party-line votes with
Democrats voting to report the bill and Republicans voting against doing so, with the
exception of Olympia Snowe (RD, Maine) on the Finance committee. Snowe voted in
favor of reporting the bill, though she voted against the technical corrections and
modifications the chair had made and stated that her vote in committee was only that and
her vote on the floor would not necessarily be the same.
These votes provide a glimpse at the behavior of legislators during the process of
crafting health insurance reform. In the following sections, I rely on the actions of
legislators, their statements, and the strategies discussed by their staffers and examine the
extent to which I find support for assumptions underlying and hypotheses derived from
the theory of intergovernmental delegation. In particular, I assess whether delegation to
the states is used as a strategy to craft successful policies, whether legislators
intergovernmental context, or more specifically their partisan relationship with their
governors, influences the optimality of delegation to the states, and whether the
165
institutional rules of each chamber influenced which legislators were pivotal during
proposal passage.
State Delegation
One staffer remarked that a crucial question was, ―are we going to let the states
have any power‖ as various proposals were vetted among committee leadership and staff.
According to the theory, under a Democratic president, Republican legislators prefer
delegation to the states and Democratic legislators prefer centralization to a national
executive branch. One Republican staffer went on to say that legislators ―gave up long
ago respecting the whole concept of the states.‖ Delegation to the states, according to
staffers, was more of a political strategy than based on any specific beliefs about
federalism and the appropriate division of authority. ―The Gang of Six crafted the role of
the states‖ commented one staffer, a second participant added that ―to get Snowe‘s vote,
[the Finance Committee] made [health insurance exchanges] state based,‖ and ―Nelson
gave states more control to soften bill and make it more conservative,‖ said another. On
the House side, staffers commented that the centralization of authority to the national
executive branch was because legislators were concerned about what the states would do
with the policy. Thus, delegation to the states versus to the national executive branch
was a strategic feature of both House and Senate proposals. The next question, is why
legislators used intergovernmental delegation as a strategy.
Although staffers remarked that legislators crafted the House and Senate
proposals based on ―a function of what you can do politically,‖ legislators‘ rhetoric on
the floor and in committees suggest a variety of possible reasons why the House bill was
centralized and the Senate bill decentralized. An examination of the transcripts from
166
House hearings reveals that Democratic House members were dubious of the capability,
potential for success, and usefulness of delegating authority to the states for health
insurance exchanges. ―Given that consolidation [of insurance companies] threatens to
eliminate competition in the State insurance markets, why would the State-based
connector be better?‖ (Velazquez, D-NY).93
Concerns about state-based exchanges
included that some states weren‘t performing well currently, that disparities in health and
services would continue to exist, and that continuing the patchwork health policies in
existence would lead to worsening health outcomes.
Moreover, House Democrats extolled the virtues of one national exchange,
including the benefit of transparency and the ability for genuine reform. A handful of
Democrats also discussed the importance of allowing states the flexibility of further
reform and innovation above the floor set by the national policy: ―… I do celebrate the
fact that our colleague from Ohio, Dennis Kucinich, was able to get through an
amendment that allows states to use single-payer, to experiment with it, which they
cannot do now without this amendment. And I am fighting to keep that in the bill‖
(Conyers, D-MI). Conyers and Kucininch were both DD legislators and, according to my
theory, would be indifferent between centralization and decentralization.
Health policy staffers provided additional details into what was progressing
behind the scenes of House deliberations. One participant stated that Democrats did not
want to decentralize authority to the states because the states had ―not done well‖ with
other health policies in the past. Specifically, the concern was that some states
implement national laws poorly, such as ―by not drawing down all their Medicaid funds‖
93
Health insurance exchanges were also called connectors and organized insurance markets, among other
things.
167
(meaning that a state did not invest enough state resources to be able to receive all of the
federal money available to that state for the Medicaid program). House Democrats,
according to all Democratic House staffers, were worried about inequities across the
states and exacerbating health disparities if the states were given authority over the health
insurance reform implementation. Republican House staffers, during the interviews,
decried the lack of ability of the states in the Tri-Committee bill to tailor the health
insurance reform to their population.
Republicans in the House also revealed frustration and a powerlessness against
the Democratic majority. Representative Kline (R-MN), for instance, stated, ―What we
do know about the Democrats‘ plan, [is] it is the Democrats‘ plan. We haven‘t seen it
until we got a glimpse of the 852-page monster on Friday. The Democrats‘ plan is it
increases the role of the Federal Government through a new government-run plan and an
expansion of Medicaid.‖ Republicans overwhelmingly agreed that health reform was
needed, but voiced concern about the choices of House Democrats. Specifically, their
comments repeatedly denounced the centralization of the House plan and the failure of
House Democrats to include their perspective in the proposal. According to my theory,
though, due to the simple majority needed to pass a House bill, there was no need for
House Democrats to engage with Republicans in order to pass their health insurance
reform bill.
The Senate bill, on the other hand, did include a degree of Republican input
through the select group of legislators in the ―gang of six‖ on the Finance committee and
a number of Republican amendments. The specific reason for the difference between the
House and Senate perspectives regarding including Republican preferences in their
168
proposals is discussed in a later section. One reason for Senate decentralization, though,
provided by staffers, and backed by the language used by legislators in debates was a
―benefits of federalism‖ argument where the ―states are better informed about their own
particular population and needs,‖ ―more in tune and locally accountable,‖ said another,
and ―technically better‖ said a third. These three respondents were all Republican
staffers. Orrin Hatch (R-UT) backs up these staffers‘ statements as he describes his
version of a better health reform proposal in a 12/2/2009 floor speech:
We could give States flexibility to design their own unique
approaches to health care reform. Utah is not New York,
Colorado is not New Jersey, New York is not Utah, and
New Jersey is not Colorado. Each State has its own
demographics and its own needs and its own problems.
Why don't we get the people who know those States best to
make health care work? I know the legislators closer to the
people are going to be very responsive to the people in their
respective States. I admit some States might not do very
well, but most of them would do much better than what we
will do here with some big albatross of a bill that really
does not have bipartisan support. There is an enormous
reservoir of expertise, experience, and field-tested reform.
We should take advantage of that by placing States at the
center of health care reform efforts so they can use
approaches that best reflect their needs and their
challenges.
Democratic staffers, though, point to either a ―blame avoidance‖ reasoning or,
alternatively, a ―build on the status quo‖ argument instead. In particular, legislators
―wanted states to have skin in the game. [Democrats] don‘t want the government to be
held responsible for everything,‖ said one staffer and legislators ―don‘t want all their eggs
in one basket,‖ remarked another. In other words, Democratic legislators hoped that by
incorporating delegation to the states in the Senate plan, they would be able to deflect
blame for any problems down the road and possibly be able to avoid the ―too big
169
government‖ claims of Republicans. In hindsight, Democratic staffers found it notable
that decentralization was under the radar of the public and that the common perception of
the law was of a national government in charge of everything.
One committee staffer remarked that ―building on state-based policies and
regulations in existence made more sense.‖ This participant illuminates yet another
reason for decentralization, using the status quo policies to craft reform proposals.
Specifically, health care and health insurance policies have traditionally been in the
purview of the states. For instance, since the time Congress delegated regulation of the
insurance industry to the states in the McCarran Ferguson Act of 1945, states have been
in charge of overseeing the health insurance industry.94
To keep such regulation at the
state-level in national reform made sense to legislators according to this staffer.
Although staffers offered many different reasons for delegation to the states, using
federalism as a guiding principle was not one of them. Senator Snowe (R-ME) remarks
in a transcript of a Finance hearing on October 13, 2009, ―We have heard legitimate
proposals from both sides about the proper role of Government in providing the answers.
I think it is clear we all struggle with the appropriate equilibrium.‖ Snowe appears to be
referring to legislators‘ struggles over when to centralize versus decentralize authority.
One Senate staffer said once legislators chose the delegation strategies to be used, they
―worked with constitutional scholars and the parliamentarian such that the language [of
the policies and delegation options chosen by legislators] did not overstep the federal
government‘s role.‖ In other words, that legislators first chose the decentralization
94
In brief, following a Supreme Court ruling (United States versus South-Eastern Underwriters
Association) that Congress (based on the Commerce clause) could regulate insurance, Congress passed the
McCarran Ferguson Act of 1945, which gives states authority to do so. This law does not mandate the
states regulate insurance, instead, it expressly does not preempt relevant states laws that do such regulation.
170
strategy and then made sure it was worded appropriately. Thus, it was not a question of
what is the appropriate balance of state versus federal control or what are national versus
state boundaries of action, it was about political strategy.95
―At the end of the day a lot of [who gets authority] depends on how you get votes
[in Congress],‖ remarked one staffer. In other words, although there were many reasons
for and against the different delegation options proposed in the health insurance reform
bills, the underlying motivation for the delegation choices was how to form successful
policy coalitions, or coalitions of legislators that could move a policy through a chamber
to the end result of enacted legislation. The theory of intergovernmental delegation offers
a perspective on how this coalition formation occurs. In particular, legislators‘
preferences in favor of centralization versus decentralization in national law depend on
their intergovernmental context.
A legislator‘s intergovernmental context refers to the fact that when considering
the outcomes that will result from delegation to national actors versus state actors, a
legislator must consider the distance between his own ideal point with that of the national
executive branch and his state‘s executive branch. Thus, a legislator‘s partisan agreement
or disagreement with their governor is a critical aspect of the theory. In the next section,
data on the importance of intergovernmental context is discussed. An added benefit of
this examination is that it suggests a few distinguishing points between the conventional
wisdom that Republicans devolve and the intergovernmental theory.
95
One staffer digressed to talk about how different the practice of policymaking is from the way it is taught
in political science classes. ―In school you learn about the principles of federalism and when centralization
versus decentralization is better. But, that‘s not at all how it works here.‖
171
Intergovernmental Context
In the previous section, I examined the centralization and decentralization
strategies and choices of legislators. Legislator actions with respect to delegation to the
states, according to the intergovernmental theory, are contingent upon the party of the
president and the party of their state governor. Since health insurance reform proposals
were debated under a Democratic president, Democrats, both DD and DR legislators, in
the 111th
Congress were in favor of centralization and Republicans, RD and RR
legislators, preferred decentralization. On the surface, then, delegation to the states
appears to fit with the conventional wisdom that Republicans prefer to devolve authority
and Democrats are more comfortable with a large centralized government. In this
section, I assess whether these partisan issues were just about the partisan ideology of
legislators or if, as my theory predicts, it was more about their intergovernmental context,
namely taking into consideration the partisan relationship between legislators and their
governors.
Media reporting of the hearings provided little discussion of the
intergovernmental possibilities for health insurance reform, instead, focusing on whether
the process was bipartisan or purely partisan, open and transparent or behind closed-
doors, how Obama‘s performance rated with respect to health reform, and whether
special deals were wrought and with whom. From my interviews, one staffer remarked
that the media ―had it all wrong,‖ in terms of the negotiations and focused ―way too much
on partisan issues.‖ The participant elaborated by stating that although there were
definite and challenging partisan differences, it was not the horse race as depicted in the
media. Instead, the process was a grueling foray into a complicated and fractured health
172
care system that relied on a number of substantive experts on Medicaid, health insurance,
public health, health law, and constitutional law, to name a few. One staffer described
the process as involving ―silos of people working on different issues‖ and another further
emphasized that although ―policy was important, the politics were important, too.‖ Thus,
political maneuvering existed that was not highlighted by the media.96
All twelve staffers declared that dealing with Democrat versus Republican issues
was ―challenging‖ during negotiations and that Democrats have more faith in a central
government and Republicans ―are generally more for state based‖ approaches. Every
Senate and House staffer mentioned this partisan difference as important with respect to
intergovernmental delegation, seemingly in support of the Republican devolution
argument. But, when I would question them as to what would happen if there were a
Republican president and Democratic leadership in the states, most staffers agreed that it
was more nuanced than Republicans prefer to devolve.97
One staffer even mentioned that
they have an example of this in ―No Child Left Behind, where Republicans under a
Republican president took authority away from the states.‖
―Republicans are generally more for state based policies. Republicans, though,
will nationalize if they feel like states are not doing what they want,‖ stated one staffer.
―It is a political calculus vis-à-vis the position [of the states] to the federal government,‖
said a second. In other words, whether or not a legislator prefers to centralize authority
96
Throughout the fall of 2009, media reports on House negotiations focused on Blue Dog Democrats who
―remained on the fence‖ regarding health care reform (Bettelheim and Hunter 2009) and discussed Pelosi‘s
strategy with respect to the ―end game of the conference‖ and staking out a bargaining position with the
Senate (Pelosi quoted in Norman 2009). Reports on the Senate focused on Kennedy‘s health, Byrd‘s
health, 60 votes, and, later, on Brown‘s win in a liberal state, which was described by one reported as ―a
bolt of lightning [that] has struck the entire American political system‖ (Maddow 2010) and by another as a
race that ―could literally decide the fate of the Democrats' health care reform legislation‖ (Baier 2010). 97
One staffer refused to consider the implications of the counterfactual of a Republican president during
health insurance reform. That staffer said that it was not a useful way to spend time, since so many factors
go into what happens politically.
173
with the national executive branch or decentralize policy to the states actually depends
upon whether the states will provide outcomes the legislators favor. ―If the governor is of
a different party, there is concern when doling out authority to the states….What the
governor will do with the policy matters,‖ commented one participant, which was
supported by another remarking that ―the relationship between governor and legislator is
critical.‖ Both Democratic and Republican staffers expressed these sentiments. One
Republican staffer elaborated, ―partisanship is an issue, if your governor is a D and you
are an R, it‘s very different than if your governor is an R.‖
These staffer statements provide strong support for the idea that
intergovernmental context matters, using a similar language as the intergovernmental
theory to describe the partisan relationship. Specifically, DD, DR, RD, and RR
legislators face different strategic calculations as they consider whether to support
national policies that centralize versus decentralize authority. The differences in these
strategies can be further viewed by considering committee actions and votes.
The three committees‘ markups of the single House bill, for instance, present one
perspective on some of this maneuvering. In particular, a number of amendments
provide insight into possible differences in how Democrats felt about yielding authority
to the states in national health insurance reform. The votes on amendments in the
committees are compiled in Table 5-3. For all three committees, the pattern of choices
generally matches with that of my argument, with a few exceptions as noted below.
In the Energy and Commerce Committee, there were 35 Democratic members, 16
of which represented states with Republican governors (DR legislators, or mismatches).
As shown in the table, all Democrats voted against the amendment that decreased the
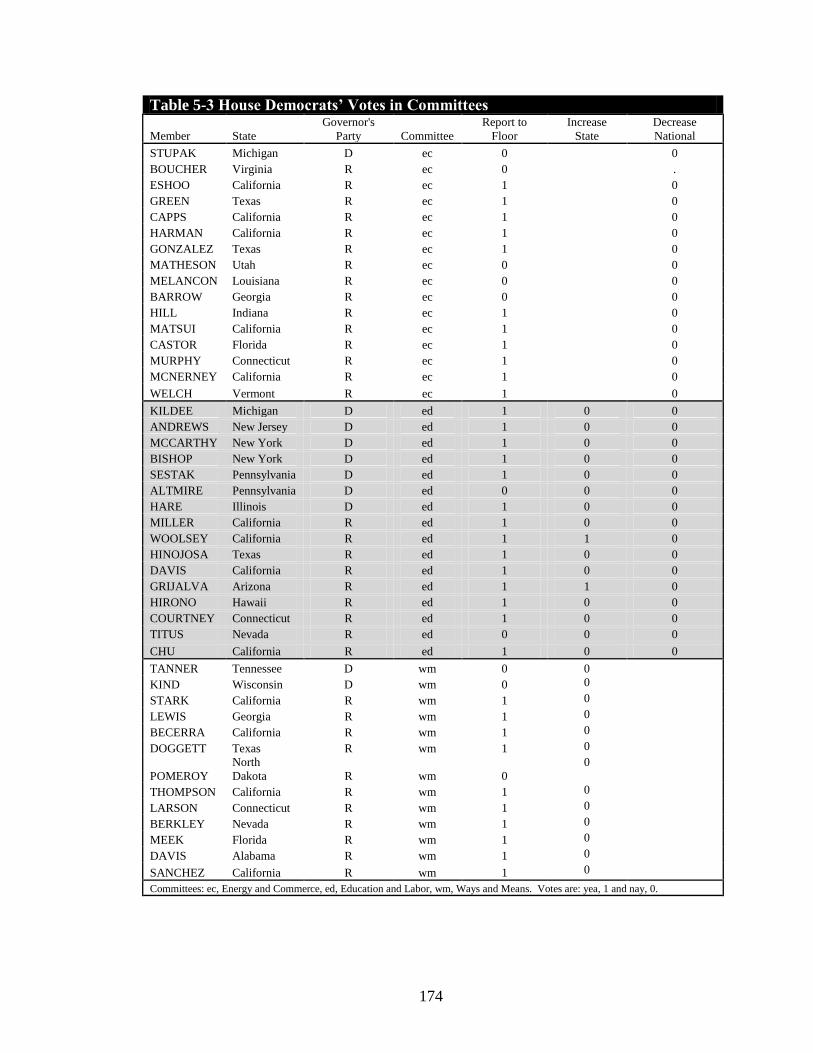
174
Table 5-3 House Democrats’ Votes in Committees
Member State
Governor's
Party Committee
Report to
Floor
Increase
State
Decrease
National
STUPAK Michigan D ec 0 0
BOUCHER Virginia R ec 0
.
ESHOO California R ec 1
0
GREEN Texas R ec 1
0
CAPPS California R ec 1
0
HARMAN California R ec 1
0
GONZALEZ Texas R ec 1
0
MATHESON Utah R ec 0
0
MELANCON Louisiana R ec 0
0
BARROW Georgia R ec 0
0
HILL Indiana R ec 1
0
MATSUI California R ec 1
0
CASTOR Florida R ec 1
0
MURPHY Connecticut R ec 1
0
MCNERNEY California R ec 1
0
WELCH Vermont R ec 1 0
KILDEE Michigan D ed 1 0 0
ANDREWS New Jersey D ed 1 0 0
MCCARTHY New York D ed 1 0 0
BISHOP New York D ed 1 0 0
SESTAK Pennsylvania D ed 1 0 0
ALTMIRE Pennsylvania D ed 0 0 0
HARE Illinois D ed 1 0 0
MILLER California R ed 1 0 0
WOOLSEY California R ed 1 1 0
HINOJOSA Texas R ed 1 0 0
DAVIS California R ed 1 0 0
GRIJALVA Arizona R ed 1 1 0
HIRONO Hawaii R ed 1 0 0
COURTNEY Connecticut R ed 1 0 0
TITUS Nevada R ed 0 0 0
CHU California R ed 1 0 0
TANNER Tennessee D wm 0 0
KIND Wisconsin D wm 0 0
STARK California R wm 1 0
LEWIS Georgia R wm 1 0
BECERRA California R wm 1 0
DOGGETT Texas R wm 1 0
POMEROY
North
Dakota R wm 0
0
THOMPSON California R wm 1 0
LARSON Connecticut R wm 1 0
BERKLEY Nevada R wm 1 0
MEEK Florida R wm 1 0
DAVIS Alabama R wm 1 0
SANCHEZ California R wm 1 0
Committees: ec, Energy and Commerce, ed, Education and Labor, wm, Ways and Means. Votes are: yea, 1 and nay, 0.
175
authority of HHS (Barton Amendment on Day 5), as would be expected by the theory.
And, of the five Democrats who voted nay to report the amended bill to the floor, all but
one were DR legislators, or partisan mismatches with their state governors. This last
point is in contrast to that expected by the theory of intergovernmental design if I assume
voting against the bill reveals that it is distant from their preferred choice (those
legislators should prefer centralization); however, the other 12 DR legislators and 18 DD
legislators voted in accordance with the intergovernmental theory.98
Moreover, no
Republicans voted to report the bill and all voted in favor of decreasing the authority of
HHS. Thus, votes in the Energy and Commerce committee suggest support of the
hypotheses regarding DD, DR, RD, and RR legislators‘ choices.
In Education and Labor, one amendment increased state flexibility (Kucinich
amendment for state waivers) and one amendment decreased the authority of Health and
Human Services (Thompson amendment to strike the national health insurance
exchange). Of the 14 Democrats who voted in favor of increasing state-level authority,
only two were DR legislators (Woolsey, D-CA and Grijalva, D-AZ). In addition, all
Democrats voted against decreasing the authority of the Secretary of Health and Human
Services. In Ways and Means, 11 of 26 members were DR legislators. Three Democrats
voted against reporting the bill to the floor (see Table 5-3): Tanner (D-TN, a DD
legislator), Kind (D-WI, a DD legislator), and Pomeroy (D-ND, DR legislator).99
Thus,
98
A simple logistic regression with committee member‘s votes as the dependent variable and the
intergovernmental team as the categorical independent variable reveals that DR legislators are significantly
less likely (at the p≤.05 level) to vote in favor of amendments that increase the authority of the states in
comparison to DD legislators. The odds ratio is 0.204 (with a standard error of 0.169) for DR legislators
compared to DD legislators as the base category. 99
If I assume once again that a vote against reporting the bill to the floor is an action suggesting these
legislators felt the bill was too distant from their ideal point, the intergovernmental design theory would
predict that legislators voting against the bill would more likely be DD legislators. There is, of course, a
176
although not true for every single legislator, on average the hypotheses regarding how
legislators would vote regarding centralization and decentralization hold across all three
House committees: Democrats voted in favor of and Republicans against centralization.
An examination of Senate committee votes in the HELP and Finance committees
presents more of a challenge. Unfortunately, the text of the HELP amendments could not
be located via electronic searches and the language and delegation choices specifically
examined. Over 788 amendments were filed for the HELP bill markup, 721 of which
were offered by Republicans. Of the Republican amendments, 161 were accepted (36 of
the 67 Democratic-authored amendments were also accepted), although see Enzi‘s (R-
WY) statement regarding the lack of Republican involvement in proposal formation in
his Finance committee statements. On July 15, 2009 the HELP committee voted to report
their version of the health insurance reform package to the floor on a straight party line
vote (13 to 10). Although the HELP proposal includes state-based health exchanges (in
contrast to the House nationalized health insurance exchange), it appears that it did not
decentralize authority enough to attract any Republican votes.
The Finance committee bill also created state-based health insurance exchanges
and, according to the decentralization measure described above, is more decentralized
than the HELP plan. The Republican-filed amendments in the Finance bill during
committee negotiations included many that provided expansions in the authority of the
states in the overall bill. There were over 564 amendments filed for the Finance bill
markup, of which 302 included at least one Republican author.100
The Finance
difficulty in ascertaining whether a vote against reporting a bill to the floor is actually a vote against
centralization. 100
These amendments were obtained from Slate.com‘s website.
177
committee voted to report their proposal to the floor of the Senate on October 13, 2009
with a 14-9 vote. The only Republican voting with the Democrats on the committee was
Olympia Snowe (R-ME), an RD legislator. Snowe‘s support of the Finance bill is in
contrast to the intergovernmental theory, where RR legislators are pivotal with respect to
decentralization and RD legislators are indifferent (but prefer to vote with their co-
partisans). Overall, Senators‘ actions in committees are not consistent with the
theoretical hypotheses—RR legislators were not included in the Senate coalition. Only
staffer comments about the deliberations behind those actions suggest support for the
intergovernmental theory.
Recall also, the coalition bargaining theory expressly points to the process of
invoking cloture where Republicans would be necessary in the Senate—not where a
simple majority is needed, such as to either pass a proposal out of committee or votes on
final passage on the floor. Furthermore, the theory is even more specific with respect to
the fact that those Republican votes would only be needed if DD and DR legislators in
the Senate together do not equal 60 votes. In the next section, I examine the extent to
which the differences in chamber rules and majoritarian thresholds influenced the
proposals that emerged from the House and Senate, as well as the final enacted health
insurance reform package.
Chamber Rules
In the last few months of 2009 when committee deliberations and floor votes took
place, DD and DR legislators did have the 60 votes needed to close debate on the floor,
although, earlier in the process this fact was not clear. For the first four months of 2009,
Democrats had only 58 votes, which increased to 59 when Specter (R D-PA) switched
178
from the Republican to the Democratic party, and finally 60 when Franken (D-MN) was
seated. To invoke cloture, the 60 votes derives from the rule that three-fifths of the
Senators duly chosen and sworn must vote in favor of a motion to close debate. Byrd (D-
WV) and Kennedy (D-MA), due to ill health, were often not present in 2009. Only after
Kennedy‘s death in August and the appointment of Paul Kirk (D-MA) to fill the vacancy,
were Democratic senators able to reach the ―razor edge of 60 votes‖ on days when Byrd
was strong enough to be present for a vote. The ―razor edge‖ quote is taken from a
staffer who remarked that the opportunity of any one senator to obstruct policy on the
floor by filibustering created challenges for the health insurance reform process in the
Senate. In this section, I examine the extent to which inter-chamber differences in the
majority thresholds required to make progress on reform influenced the packages they
developed.
Health policy staffers emphasized differences in the House and Senate voting
processes. Senate ―structure‖ and ―the 60 votes needed‖ gave Republicans more leverage
during proposal negotiations in the Senate than in the House, according to staffers. This
influence led to the crafting of proposals in both the HELP and Finance committees that
were much more decentralized than the House package. The Finance committee
chairman, Baucus (D-MT), for instance, included three Republicans in the group of six
Senators who hashed out the Finance package over months of negotiation through
2009.101
It is only in hindsight that Democrats, in the brief time span in which the Senate
bill (consisting mainly of the Baucus Finance proposal) was debated and passed on the
101
The group of six senators (―Gang of 6‖) included Democratic Max Baucus (Montana), Jeff Bingaman
(New Mexico) and Kent Conrad (North Dakota); and Republicans Charles Grassley (Iowa), Mike Enzi
(Wyoming) and Olympia Snowe (Maine). Senator Hatch dropped out in July, 2009, later stating that he
had left the group because he knew it would not be a true bipartisan effort (see Hatch‘s comments in
Finance Committee markup).
179
floor, did not need to rely on Republicans to move the policy out of the chamber. While
various packages were considered and amended, Democrats would need at least one or
two Republicans to join them or the policy could have been obstructed by one Senator
with a filibuster. In other words, finding less support for the theoretical hypotheses about
how legislators should vote in the Senate, given the frequency of the DD and DR teams
across the 111th
Congress is expected.
Staffers perspectives on the differences between the House and Senate and the
strategies senators used to craft their proposals provide support for an assumption upon
which the individual-level coalition bargaining model is built, that the majoritarian
threshold in a chamber is critical for passing policy. For instance, one House Democratic
staffer remarked that the House ―can be more aggressive [than the Senate] because of
rules and procedure.‖ All staffers from the House and Senate also commented on the
―challenge of 60‖ in the Senate versus the simpler majority rules process in the House.
[Senators] ―got things through [via] the power of delegation—because you can‘t get
things through the Senate without it. In the House it‘s different, since majority rules.
One member doesn‘t have the power [like in the Senate], it‘s more of a ‗go along to get
along‘ place.‖
In other words, the higher majoritarian threshold in the Senate has consequences
for the delegation strategies employed in Senate packages in comparison to the House. In
the House, the pivotal legislator in the intergovernmental theory under a Democratic
majority party and Democratic president are DR legislators, who strictly prefer
centralization. In the Senate, when Democrats have the 60 votes to invoke cloture, the
DR legislators are also pivotal, but when they do not, the pivotal legislator, or legislator
180
who must be enticed to vote to invoke cloture, is an RR legislator. To appeal to RR
legislators, the Senate must craft a policy that is decentralized enough to get the needed
votes, but not decentralized as much as to lose critical DR legislator votes. Thus, the
differences in House and Senate proposals and a potential reason why Baucus courted
Republican legislators as his committee crafted a proposal can be explained by the
intergovernmental theory.
Of course, however, there were many other features of the process that emerged
in discussions with staffers. Next, I discuss the interesting attributes of the process that
were not included in the intergovernmental theory of federal delegation design, including
pre-emptive strategies regarding House-Senate compromises, differences in House versus
Senate electoral concerns, and the trouble with governors.
Other Concerns
―The Senate bill was a bitter pill to swallow, but the best [the House] could get.‖
This quote from one staffer highlights the interesting inter-chamber dynamics that were
in play throughout the 111th
Congress. For example, early in 2009 the House included
reconciliation instructions in their budget bill, specifically mentioning health policy. This
strategic step by House Democrats offered an alternative for the Democratic majorities in
both chambers. By using the reconciliation process, which is subject to time limits (i.e.,
cannot be filibustered), only a simple majority is needed to pass such a package in both
the House and the Senate.
For most of the health insurance reform process, however, reconciliation was not
considered to be a serious alternative for two major reasons. First, Democrats expressed
the desire for bipartisanship. Relying on reconciliation would eliminate bipartisanship
181
and possibly give Republicans ammunition to alienate voters from Democrats. And,
second, is the fact that reconciliation is not an easy process. Reconciliation bills cannot
be used to build new policies or programs, only to ―reconcile‖ existing programs with the
budget. Specifically, each provision in a reconciliation package must have a current
budgetary effect (the Byrd Rule). I return to how reconciliation offered opportunities for
Democrats in 2010 below, but first discuss other inter-chamber dynamics.
Health policy staffers, for example, highlighted a difference in how Senators
versus House members feel about the states. ―There is a comfort in the Senate regarding
the states that‘s not there for the House,‖ said one staffer. ―Senators are just more
inclined [than House members] to give discretion to the states,‖ said one participant. ―In
the Senate there‘s more of a desire to isolate states…[you] can rummage through [any
number] of laws and find the formulas that do so….‖ This special deals for special states
difference in the Senate may be due to the fact that ―governors and Senators share the
same constituents‖ or because ―what works in New York or Florida, won‘t work in [that
staffer‘s member‘s dissimilar state].‖ Although it is possible that there is a difference in
the ―comfort-level‖ of the Senate with delegation to the states, this explanation does not
hold up to a brief comparison with the No Child Left Behind Act of 2002, where Senate
debate highlighted concerns over delegating expansive authority to the states (in
comparison to the House which included unprecedented state flexibility in its bill).
Instead, I argue that decentralization of policy in the Democratic Senate, given the
Democratic president, sets the stage for policy coalition formation in that chamber where
Republican senators are needed to pass policy; coalitions that can be formed by
decentralizing certain aspects of the policy to states, or even ―isolating‖ certain states. In
182
addition, though, a staffer mentioned that Senators and governors have ―the same
issues,…but [House members] are much more concentrated [in one area of a state] and
face different concerns.‖ In a similar vein, a Senate staffer added that ―getting re-elected
is different for House members.‖ These remarks bring up a potentially key facet of
national legislators‘ constituencies, namely, that Senators represent an entire state and
House members (with the exception of At-Large members) only a portion of the state.
It is possible that House members view state delegation differently, and with more
alarm about the potential outcomes, than do Senators. Governors will lead a state-level
executive branch in implementing a policy with an eye toward the entire population of
their state. House members, though, may prefer an even more localized approach, since
their district may differ substantially from the rest of the state.102
This difference may,
for instance, be due to crucial rural-urban differences between districts in certain states.
Staffers mentioned, for instance, that Senators with urban-rural splits, for the most part,
stayed out of the health insurance reform debate.103
This aspect of intergovernmental
delegation is not considered in this study but deserves additional scholarly attention in the
future.
Finally, many health policy staffers brought up the idea that House members, in
particular, were concerned about compromise legislation that would emerge from a
House-Senate conference even before either chamber had successfully voted for a bill. In
particular, House members were worried that the Senate would decentralize authority to
the states too much for their tastes. In order to combat this potential Senate bill, House
102
This could even explain why the House decentralized No Child Left Behind, since many provisions
were delegated to local education agencies. 103
Interestingly, the one member‘s staffer who refused to discuss federalism issues and health insurance
reform is from a state with an urban/rural split.
183
members preemptively structured their bill with strong centralization provisions in the
hope that the compromise between the two chambers in a conference would result in
legislation they would prefer. In the end, given the structure of the Senate in the 111th
Congress and the contentiousness of the policy debate, the House became concerned
instead with the ability to get a compromise conference report back through the Senate.
If the approved House bill and approved Senate bill went to a conference, the resulting
committee report aligning the two into one piece of legislation would need to go up for
another vote in both chambers. Given the lack of the 60 votes needed by the Democrats
in the Senate after January 19th
(and the fact that the Senate bill had only been approved
December 24th
), the House needed to consider a new strategy.
Since the House had included reconciliation instructions in the enacted budget bill
from the early days of the 111th
Congress, one option remained. House members could
―swallow‖ the ―bitter pill‖ that was the approved Senate bill, pass a careful reconciliation
bill that modified the new legislation, and hope that the Republicans in the Senate could
not find procedural concerns with the reconciliation package, allowing for a simple
majority in the Senate to pass the reconciliation measure.104
What these interesting
dynamics between the House and Senate suggest, though, is that future work should take
into account bicameral differences in the pivotal actors and how such differences may
influence strategic policymaking choices.
Theory of Federal Policy Design versus Rival Arguments
In summary, a review of information accessed in congressional archives, obtained
through document review, and garnered through elite interviews is, for the most part,
consistent with the theory of federal policy design and intergovernmental delegation.
104
In fact, the Senate did find procedural concerns necessitating a return to the House with another vote.
184
The House produced a centralized policy, the Senate a more decentralized proposal,
legislators were concerned about the partisan relationship between themselves and their
governors and the policy outcomes that governors would yield, in addition to the
criticality majoritarian thresholds in the House and Senate.
There are also alternative arguments for why Congress centralizes and
decentralizes authority. These include the following:
Policy type determines delegation options, where redistributive policies
are centralized and developmental policies are decentralized (Peterson
1995).
Republicans prefer to devolve and Democrats to centralize (empirical
studies reviewed in Peterson 1995, also see Krause and Bowman 2005)
Republicans (Democrats) prefer to devolve only when the states are
mostly Republican (Democrat), otherwise they centralize, also known as
partisan congruence (Krause and Bowman 2005).
Congress will refrain from state mandates during election years, what I
refer to as electoral trepidation (Nicholson-Crotty 2008).
In Table 5-4, the predictions from the various arguments with respect to 111th
Congress and health insurance reform are detailed. As discussed earlier, the House,
based on the DR pivotal legislative team, is expected to choose to delegate authority to
the national executive branch and the Senate, with the possible RR pivot, to allocate more
authority to the states. In addition, these chamber-level predictions are based on
individual-level behavior of legislators as delineated in Chapter 2. Specifically, and in
the context of the 111th
Congress, DR legislators prefer to centralize authority, or
delegate to the national executive branch, DD legislators are indifferent, but prefer to side
with their co-partisans, RR legislators prefer to decentralize or delegate authority to the
states, and RD legislators vote with their co-partisans.
Since my case involves only one policy type, I cannot examine the extent to
which policy type determined delegation strategies in health insurance reform, but the
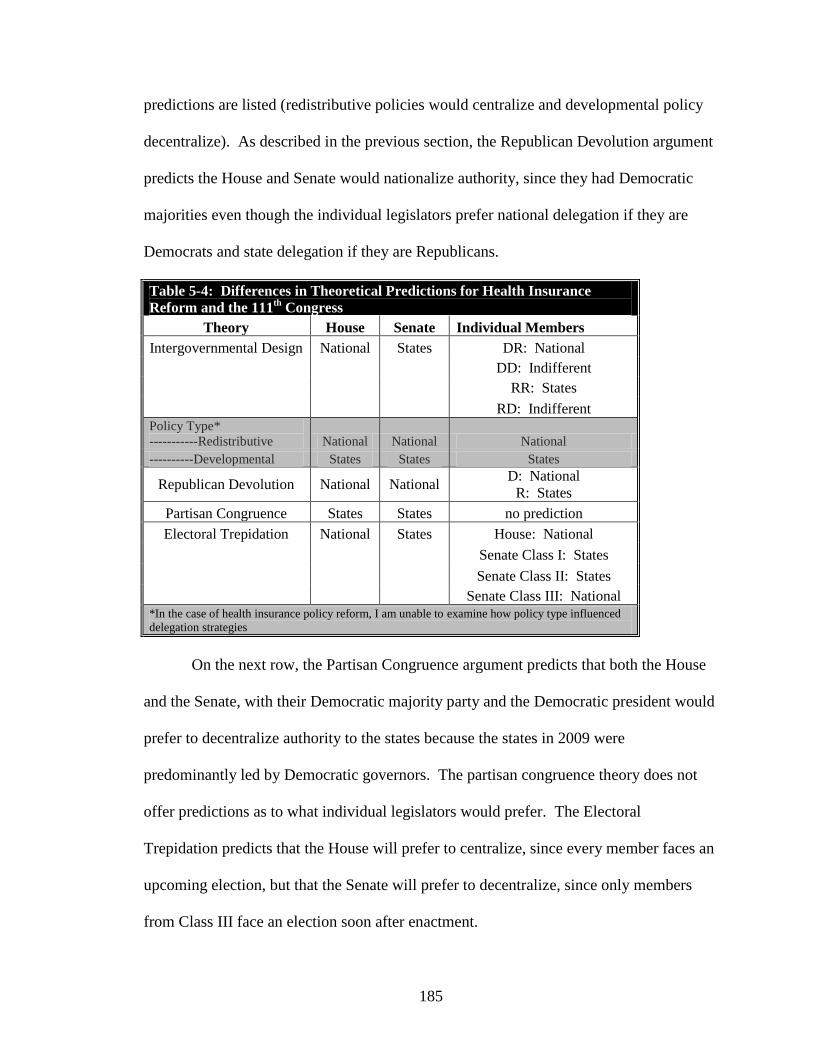
185
predictions are listed (redistributive policies would centralize and developmental policy
decentralize). As described in the previous section, the Republican Devolution argument
predicts the House and Senate would nationalize authority, since they had Democratic
majorities even though the individual legislators prefer national delegation if they are
Democrats and state delegation if they are Republicans.
Table 5-4: Differences in Theoretical Predictions for Health Insurance
Reform and the 111th
Congress
Theory House Senate Individual Members
Intergovernmental Design National States DR: National
DD: Indifferent
RR: States
RD: Indifferent
Policy Type*
-----------Redistributive National National National
----------Developmental States States States
Republican Devolution National National D: National
R: States
Partisan Congruence States States no prediction
Electoral Trepidation National States House: National
Senate Class I: States
Senate Class II: States
Senate Class III: National
*In the case of health insurance policy reform, I am unable to examine how policy type influenced
delegation strategies
On the next row, the Partisan Congruence argument predicts that both the House
and the Senate, with their Democratic majority party and the Democratic president would
prefer to decentralize authority to the states because the states in 2009 were
predominantly led by Democratic governors. The partisan congruence theory does not
offer predictions as to what individual legislators would prefer. The Electoral
Trepidation predicts that the House will prefer to centralize, since every member faces an
upcoming election, but that the Senate will prefer to decentralize, since only members
from Class III face an election soon after enactment.
186
Of note, is that these theories differ in three ways. First, only the theories of
intergovernmental design and electoral trepidation expect there to be differences in
delegation choices between the Senate and the House. Second, under electoral
trepidation, but not the other three arguments, there should be differences in delegation
preferences between the House and the Senate (specifically those Senators not facing an
election in November 2011). Last, the delegation choices do differ between the theories.
Specifically, decentralization to the states is the choice of the Senate as predicted by
intergovernmental design, partisan congruence (due to the preponderance of Democratic
states), and electoral trepidation, but not Republican devolution. Centralization of the
policy by the House with implementation to the national executive branch is the
prediction of intergovernmental design, Republican devolution, and electoral trepidation.
Overall, the partisan congruence theory does not fit well with the finding that the
House and Senate bills differed in the degree of decentralization, in particular that the
House would choose to centralize authority. The choices of individual legislators do
align with the Republican devolution argument, though. As previously noted, under a
Democratic president the predictions of the theory of intergovernmental delegation and
Republican devolution are observationally equivalent. Republicans will prefer to
delegate to the states and Democrats will prefer to centralize. Where these two theories
differ, is in the expectation for the Senate and House bills. Since Democrats prefer to
centralize, according to the Republican devolution hypothesis, then the Democratic
Senate bill should centralize authority, which it does not.
In fact, the only other theory that would predict chamber bills that differ in
authority allocation is the electoral trepidation argument. I turn to additional data from
187
staffer interviews to examine whether there was a difference in how Senators delegated
contingent upon when they would be elected.
Electoral Concerns
According to staffers, election and electoral concerns played a lesser role in the
process of crafting the health insurance reform bills and laws. Only three respondents
made mention of the importance of elections and none of them were with respect to
worrying about the repercussions from having overstepped the role of the national
government. One respondent discussed the results of the next election as a crucial issue
for implementation of health insurance reform, but no staffers mentioned any differences
between Senators who were facing an election in 2010 and those who were not.
This data could be viewed as unsupportive of the electoral uncertainty hypothesis.
It is also possible; however, that with elections looming for House members and some
Senators, staffers chose not to discuss these issues, or felt they were moot so close to an
election. In the transcript of the March 2010 floor debate, one House member remarked
on electoral concerns. Scott (D-VA) said ―[t]here are many people out here who have
been warning and threatening us as to, if we vote on this bill, what will happen to us in
the November elections. Well, that is not the question…the question is, what will happen
to the American people if we do not vote on this bill?‖
This is not to say that electoral concerns did not figure into the calculus of
legislators. Instead, legislators did not voice a concern that stepping on states toes with
an unfunded mandate would have electoral repercussions; or that even if it did, they
would have done things differently. Moreover, stepping out of the health insurance
reform debate, electoral trepidation cannot explain why the House decentralizes and the
188
Senate centralizes under other majorities and presidents. Overall, the theory of
intergovernmental delegation most consistently fits with the stories told indirectly by
legislators through their actions and rhetoric and directly by the health policy staffers.
Data Analysis Summary
Overall, archives, documents and interviews provide support for the theory of
intergovernmental policy design and strong evidence for crucial pieces of my theory—the
perceptions of legislators regarding delegation to the states, the importance of voting
rules in determining who is pivotal, and the necessity of considering how state leaders (in
particular, governors) will implement national policies delegated to them. First, Congress
considers the states as one delegation option, and crafts policies involving delegation to
both the national executive branch and the states as joint partnership policies. Second,
the relationship between legislators and their governors is a key aspect to federal
policymaking. And, third, the majoritarian requirements in the House and the Senate are
crucial to negotiations. Strong support for electoral trepidation was not found in the data.
On the surface, there was support for Republican devolution, but additional questioning
of staffers calls that into question. Finally the partisan congruence argument does not
provide specific hypotheses about Senate choices, and yet those choices were crucial for
health insurance reform.
DISCUSSION AND CONCLUSION
The majority of scholarly work following the recent health insurance reform
process has focused on the role of Obama and his decisions with respect to setting the
agenda and then handing the reins to Congress to fill in the details of the policy (e.g.,
Jacobs and Skocpol 2010 or Oberlander 2010). Yet, few have studied how Congress
189
worked out these details. This study focuses on a crucial aspect of this process—the
congressional intergovernmental design of health insurance reform. The media portrayal
of health insurance reform negotiations and actions was one of partisan bickering,
Democratic infighting, and strict vote counting, with arm-twisting, when needed. An
analysis of the final floor votes and committee reports to the floor validate these claims.
Democrats and Republicans in the House and the Senate were almost completely unified
in committee and final floor votes.
A more thorough inspection of voting on amendments and what legislators said in
committees in the House and the Senate, however, reveals that although electioneering
and partisan issues likely played a role in health insurance reform votes, there were
intergovernmental nuances at work also. Specifically, the states heavily influenced the
crafting of the health insurance reform, even though, as one staffer remarked, there was a
relative dearth of lobbying efforts on the part of the states.105
Individual legislators
considered the impact of policies on their own states during committee meetings where
various solutions and options were hashed out with experts. And, based on interview
data, the ideological match between a state‘s leadership and the legislator was important
for legislators as they considered what would happen if states implemented various
features of health insurance reform.
Interestingly, these interviews also touched on a rival explanation—partisan
ideologies. In the opinion of the staffers, across time Republicans prefer to devolve
authority to the states and Democrats are more comfortable with centralizing authority.
When further questioned about what differences there may be if a Republican resided in
105
Jacobs and Skocpol (2010) posit that the Obama administration effectively neutralized lobbying efforts,
including engaging directly with governors. One Republican staffer backed up this claim and stated that
because the governors could never form one collective voice, the cacophony resulted in no action at all.
190
the White House, such as during No Child Left Behind, staffers responded that of course
things would be different and this comfort level would disappear for Democrats.
So, although ideology is important, it is the congruence (borrowing Krause and
Bowman‘s term) that matters. My argument differs from Krause and Bowman, though,
by saying that individuals within Congress and their states matter (not the aggregate
partisanship of Congress and the states)—and that pivotal members in House and Senate
are crucial for intergovernmental delegation choices. The differences in the House and
Senate state versus national delegation choices in this respect provide support for my
intergovernmental delegation theory compared to Krause and Bowman‘s partisan
congruence argument.
Specifically, Krause and Bowman‘s theory conjectures that when the average
aggregate partisanship of national political institutions is more in line with the average
partisanship of all states, we will see decentralization. If this is taken to mean that
Democrats prefer to decentralize during the 111th
Congress with the mostly Democratic
states in 2009-2010, the differences in the House and Senate choices remain unexplained.
My argument about intergovernmental context begins from the foundation provided by
Krause and Bowman—a preference for closer agents—but adds institutional complexity
and considers individual legislators in the House and the Senate and the implications of
their constraints and choices.
The lack of differences in the preferences of the various classes of senators does
not support the electoral trepidation hypothesis either. Finally, a limitation of studying
one policy is that I cannot consider whether policy type matters for delegation to the
states versus national actors. Interview responses point to the possibility that it is not the
191
type of policy, per se, but the historical context or status quo of the policy. The fact that
the states had been regulating insurance markets for many years meant that the states
would likely be chosen to regulate them in the 2009-2010 health insurance reform policy.
The influence of the status quo delegation choice is not evaluated in this project and
deserves additional attention in the future.
There are two issues not highlighted in this chapter, but that deserve mention—
the role of the executive branch in crafting legislation and the individual mandate. First,
although Obama‘s team may have lent a helping hand as various proposals were
considered, the proposals considered here are those that received a vote in either a
committee or on the floor, thus needing to pass muster with legislators. In other words,
whether from the White House or other policy consultants, a proposal would still need to
be considered by legislators and either supported or rejected. My theory hinges on this
consideration and decision process, not on how legislators got ideas for the structuring
and language of the policies in the first place.
Second, I do not delve into the crafting of the individual mandate, which is the
key that holds the entire health insurance reform package together. Without the
individual mandate, the necessary spreading of risks across the population will not occur,
only those who need insurance will buy it, insurance companies will need to increase
costs to consumers, and the downward spiral of insurance and health care commences
(when the people who need insurance the most cannot afford it). There are two reasons
why there was no need to investigate the role of the individual mandate for
intergovernmental delegation: 1) both centralized proposals and decentralized proposals
192
included some type of mandate for the population and 2) the authority overseeing the
implementing of each mandate was included in the coding of the bills and laws.
In addition, this chapter sidesteps whether liberals wanted a public option and
conservatives wanted a lower price tag. Instead, I focus on the intergovernmental
architecture of the overarching policy solutions—a state-based versus national-level
health insurance exchange (perhaps states could obtain a waiver to include a public
option in their exchange) or the Medicaid expansion (increasing the national
government‘s role in state Medicaid programs), for instance.
Finally, what does it mean that I interpret legislators‘ voting behavior and
committee actions as preferences over the delegation of authority? In short, a policy
problem often has multiple specific solutions. Some of those solutions may be favored
by liberals, others by centrists, and still some by conservatives. The set of actors placed
in charge of implementing those solutions play a distinct role in the way, shape, and form
of the policies as they play out in the real world. Congress can create a health insurance
exchange program that is run by the states, resulting in fifty different varieties of health
insurance exchanges as they did or choose to create one national health insurance
exchange run solely by the national executive branch, resulting in a different outcome.
Those states with preferences for a significant role of the health insurance exchange will
likely implement their policy differently than will states that prefer a minimal exchange.
By focusing on national versus state delegation choices, I consider the extent to which
whether legislators‘ preferences align with those of their state‘s matters and find here
that, indeed, it does.
193
APPENDIX
Case Study Data Collection Methods
Archival records include resources from the Congressional Research Service,
Voteview.com, the National Conference of State Legislators, and United States Senate
and House of Representatives online data. For the purpose of this analysis, legislators‘
floor votes on the Tri-Committee bill (House votes on H Res 903 and HR 3962 on
11/7/2009), ACA (Senate votes on HR 3590 on 12/23-24/2009), ACA (House votes on
HR 3590 3/21/2010), HERCA (House votes on HR 4872 on 3/25/2010), and HERCA
(Senate votes on HR 4872 on 3/23-3/25/2010), including the various procedural votes on
these measures were collected from all floor votes cast in the 111th
Congress from
Voteview.com.
From November 1, 2008 through April 1, 2010 Robert Wood Johnson Foundation (RWJ)
Daily News Digests and the Commonwealth Fund Washington Health Policy Week in
Review were archived. The RWJ daily digest provides summaries and links to selected
articles from major journals and news publications and the Commonwealth Fund‘s
weekly review provides stories from the Congressional Quarterly‘s CQ Health Beat. The
full texts of the stories within both digests were saved and all were reviewed for content
related to how a legislative package was written and amended, as well as how individual
legislators described their support or rejection of the provisions therein. To examine
these same features within news and related documents, a LexisNexis search of major
news sources was employed using the search terms: ―health care reform‖, ―health
insurance reform‖, or ―health overhaul‖ and ―congress‖ or ―legislat.‖ Major news
sources included the New York Times, the Washington Post, Fox News Network,
National Public Radio, MSNBC, and CNN. In addition the Office of Management and
Budget and the Congressional Budget Office Director blogs during the time span were
examined and saved if found to be relevant to the health care reform and the legislative
processes. Finally, the same search procedure was used with Google‘s search engine and
restricting results to the time period of January 1, 2009 through April 1, 2010.
The LexisNexis search resulted in the following sample from the: New York Times 641
pages, Washington Post 863 pages, Fox News Network 127 pages, National Public Radio
552 pages, MSNBC 267 pages, and CNN 393 pages. The Google search resulted in 422
non-similar pages that included results from Huffington Post, the National Review, and
various advocacy groups, among others. These pages were then searched for the terms
―congress,‖ ―legislat,‖ ―house,‖ ―senat,‖ ―member,‖ and ―rep‖ and reviewed for content
related to legislative decision-making.
To collect the transcripts of the relevant floor debates and hearings, I began with the
Congressional Research Service summaries of each measure. Within these summaries,
the debates and hearings are listed. In addition, I used LexisNexis to search for
legislative action in the 111th
Congress and searched the websites of the committees with
jurisdiction for relevant hearings. The transcripts were searched for the terms ―congress,‖
194
―legislat,‖ ―house,‖ ―senat,‖ ―member,‖ and ―rep‖ and reviewed for content related to
legislative decision-making. Unfortunately, as of March 1, 2011, some congressional
hearing transcripts remain unavailable. These include a handful of Ways and Means
committee meetings, though not markups, and HELP markups. Video archives of the
HELP panels are available, but were not reviewed for this project. After deleting action
less relevant for overall health care reform (e.g. teen pregnancy, veteran health), this
resulted in a collection of seventy five hearing documents and twenty days of floor
debate. Hearing documents included multiple and single sessions, depending upon how
they were archived. Floor debates were read in their entirety from the Congressional
Record obtained through HeinOnline for the same features as described above.
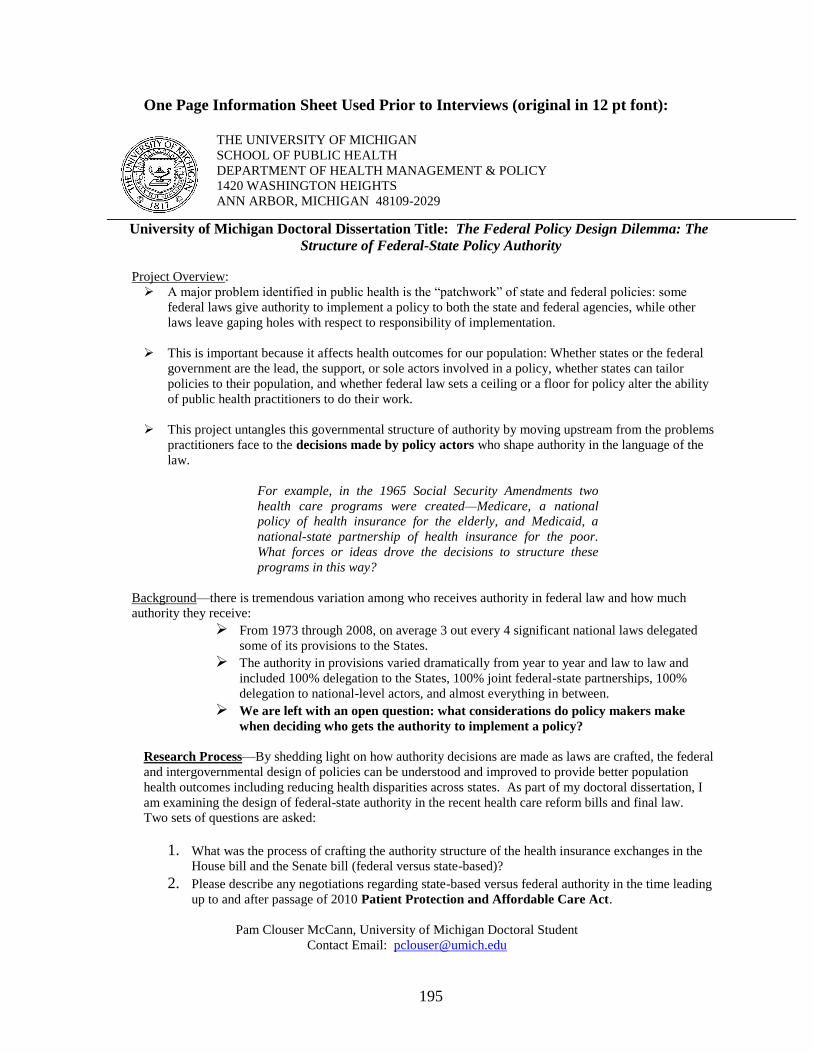
195
One Page Information Sheet Used Prior to Interviews (original in 12 pt font):
THE UNIVERSITY OF MICHIGAN
SCHOOL OF PUBLIC HEALTH
DEPARTMENT OF HEALTH MANAGEMENT & POLICY
1420 WASHINGTON HEIGHTS
ANN ARBOR, MICHIGAN 48109-2029
University of Michigan Doctoral Dissertation Title: The Federal Policy Design Dilemma: The
Structure of Federal-State Policy Authority
Project Overview:
A major problem identified in public health is the ―patchwork‖ of state and federal policies: some
federal laws give authority to implement a policy to both the state and federal agencies, while other
laws leave gaping holes with respect to responsibility of implementation.
This is important because it affects health outcomes for our population: Whether states or the federal
government are the lead, the support, or sole actors involved in a policy, whether states can tailor
policies to their population, and whether federal law sets a ceiling or a floor for policy alter the ability
of public health practitioners to do their work.
This project untangles this governmental structure of authority by moving upstream from the problems
practitioners face to the decisions made by policy actors who shape authority in the language of the
law.
For example, in the 1965 Social Security Amendments two
health care programs were created—Medicare, a national
policy of health insurance for the elderly, and Medicaid, a
national-state partnership of health insurance for the poor.
What forces or ideas drove the decisions to structure these
programs in this way?
Background—there is tremendous variation among who receives authority in federal law and how much
authority they receive:
From 1973 through 2008, on average 3 out every 4 significant national laws delegated
some of its provisions to the States.
The authority in provisions varied dramatically from year to year and law to law and
included 100% delegation to the States, 100% joint federal-state partnerships, 100%
delegation to national-level actors, and almost everything in between.
We are left with an open question: what considerations do policy makers make
when deciding who gets the authority to implement a policy?
Research Process—By shedding light on how authority decisions are made as laws are crafted, the federal
and intergovernmental design of policies can be understood and improved to provide better population
health outcomes including reducing health disparities across states. As part of my doctoral dissertation, I
am examining the design of federal-state authority in the recent health care reform bills and final law.
Two sets of questions are asked:
1. What was the process of crafting the authority structure of the health insurance exchanges in the
House bill and the Senate bill (federal versus state-based)?
2. Please describe any negotiations regarding state-based versus federal authority in the time leading
up to and after passage of 2010 Patient Protection and Affordable Care Act.
Pam Clouser McCann, University of Michigan Doctoral Student
Contact Email: [email protected]
196
REFERENCES
Anton TJ. 1997. ―New federalism and intergovernmental fiscal relationships: the
implications for health policy‖ Journal of Health Politics, Policy, and Law, 22(3):691-
720.
Chassin MR, Galvin RW, and the National Roundtable on Health Care Quality. 1998.
―The Urgent Need to Improve Health Care Quality,‖ The Journal of the American
Medical Association 280(11):1000-1005.
Chollet DJ. ―How Temporary Insurance For High-Risk Individuals May Play Out Under
Health Reform,‖ Health Affairs 29(6):1164-67.
Clouser McCann P. 2009. ―Tightening the Reins: Federal Delegation of Authority,‖ a
paper presented at the Midwest Political Science Association Meeting, March 2009.
Clouser McCann P. 2011. ―A Federal Design Dilemma: The Intergovernmental Context
of Congressional Delegation,‖ a paper presented at the Midwest Political Science
Association Meeting, April, 2011.
Collins SR, Davis K, Nicholson JL, Rustgi SD, and Nuzum R. 2010. ―The Health
Insurance Provisions of the 2009 Congressional Health Reform Bills: Implications for
Coverage, Affordability, and Costs,‖ Commonwealth Fund, January.
Congressional Quarterly Almanac 1971. Washington, D.C.: Congressional Quarterly,
Inc.
Congressional Quarterly Almanac 2001. Washington, D.C.: Congressional Quarterly,
Inc.
Conlan T and Dinan J. 2007. "Federalism, the Bush Administration, and the
Transformation of American Conservatism" Paper presented at the annual meeting of the
American Political Science Association, Aug 30, 2007.
Conlan T and Posner P. 2010. ―Inflection Point? Federalism and the Obama
Administration,‖ paper presenting at the American Political Science Association
meeting, Washington D.C., September 2.
Cooley R. 2008. ―Presidential Candidates‘ Health Care Advisors Face Off on Plans‘
Cost, Coverage, CQ Health Beat, April 25.
Cunningham PJ. 2010. ―The Growing Financial Burden of Health Care: National and
State Trends, 2001-2006.‖ Health Affairs 29(5):1037-1044.
Cutler DM. 2010. ―The Simple Economics of Health Reform,‖ The Economists’ Voice,
7(5), December, Article 2.
197
Cutler DM, Davis K, Stremikis K. 2010. ―The Impact of Health Reform on Health
System Spending,‖ Center for American Progress and The Commonwealth Fund, Issue
Brief, Vol. 88, May, 21.
Epstein D and O‘Halloran S. 1999. Delegating Powers: a transaction cost politics
approach to policy making under separate powers, Cambridge U.K., Cambridge
University Press.
Farley TA. 2009. ―Reforming Health Care or Reforming Health?‖ American Journal of
Public Health 99(4):588.
Fuchs VR and Emanuel EJ. 2005. ―Health Care Reform: Why? What? When?‖ Health
Affairs 24(6):1399-1414.
Gray V, Lowery D, Monogan J, and Godwin EK. 2009. ―Incrementing Toward
Nowhere: Universal Health Care Coverage in the States,‖ Publius: The Journal of
Federalism 40(1):82-113.
Greer SL and Jacobson PD. 2010. ―Health Care Reform and Federalism,‖ Journal of
Health Politics, Policy and Law 35(2):203-226.
Hacker JS. 2010. ―The Road to Somewhere: Why Health Reform Happened, or Why
Political Scientists Who Write about Public Policy Shouldn‘t Assume They Know How
to Shape It,‖ Perspectives on Politics 8(3): 861-76.
Hodge JG, Arias J, and Ordell R. 2010. ―Nationalizing Health Care Reform in a
Federalist System,‖ Arizona State Law Journal, 42:1245-1281.
Iglehart JK. 2011. ―Implementing Health Care Reform—An Interview with HHS
Secretary Kathleen Sebelius,‖ New England Journal of Medicine 364(4):297-9.
Jacobs LR and Skocpol T. 2010. Health Care Reform and American Politics: What
Everyone Needs to Know, New York, Oxford University Press.
Jacobson PD and Gostin LO. 2011. ―Restoring Health to Health Reform,‖ Journal of
the American Medical Association, 304(1):85-86.
Jacobson PD and Lauer JR. 2010. ―Health Reform 2010: Incremental Advance or
Radical Transformation?‖ Arizona State Law Journal, 42:1277, 19 pages.
Jennings CC and Hayes KJ. 2010. ―Health Insurance Reform and the Tensions of
Federalism,‖ New England Journal of Medicine 362(24):2244—2246.
Jost TS. 2010. ―Implementation and Enforcement of Health Care Reform —Federal
versus State Government,‖ New England Journal of Medicine 362(2): 7-22.
198
Light DW. 2011. ―Historical and comparative reflections on the U.S. national health
insurance reform,‖ Social Science and Medicine 72:129-132.
Maltzman F and Shipan C. 2008. ―Continuity, Change and the Evolution of the Law‖
American Journal of Political Science 52(2):252-267.
Murray CJL and Frenk J. 2010. ―Ranking 37th
—Measuring the Performance of the U.S.
Health Care System,‖ New England Journal of Medicine 362(2): 98-99.
Nice DC. 1987. Federalism : the Politics of Intergovernmental Relations. New York, St.
Martin Press.
Nichols LM. 2010. ―Implementing Insurance Market Reforms Under The Federal Health
Reform Health Affairs 29(6):1152-1157.
Nicholson-Crotty S. 2008. ―National Election Cycles and the Intermittent Political
Safeguards of Federalism.‖ Publius: The Journal of Federalism 38(2):295-314.
Oberlander J. 2010. ―Long Time Coming: Why Health Reform Finally Passed.‖ Health
Affairs 29(6): 1112-1116.
Peterson PE. 1995. The Price of Federalism. Washington D.C., Brookings Institution.
Peterson PE, Rabe B, Wong K. 1986. When Federalism Works. Washington, D.C.,
Brookings Institution.
Reichard J. 2008. ―Reading the Health Care Tea Leaves for 2009,‖ CQ HealthBeat May
13.
Rosenbaum S. 2010. ―Can States Pick Up the Health Reform Torch?‖ New England
Journal of Medicine 362(10):e29(1)-(4).
Ruger T. 2010. ―A New Deal in a World of Old Ones,‖ Arizona State Law Journal,
42:1297-1306.
Scheiber HN. 1996. ―Redesigning the Architecture of Federalism: An American
Tradition: Modern Devolution Policies in Perspective, ― Yale Law & Policy Review
14(2):227-296.
Skocpol T and Williamson V. 2010. ―Obama and the Transformation of U.S. Public
Policy: The Struggle to Reform Health Care,‖ Arizona State Law Journal, 42:1203-1232.
Stewart DO. 2011. ―Bankers Dance the Federalism Tango,‖ Huffington Post, posted
April 29, 2009 at http://www.huffingtonpost.com/david-o-stewart/bankers-dance-the-
federal_b_192665.html.

199
Tidmore C. 2009. ―Rep. Cao votes for healthcare reform,‖ The Louisiana Weekly
posted Monday, November 16, 2009 12:08pm. Accessed on February 14, 2011 at
http://www.louisianaweekly.com/news.php ?viewStory=2036.

200
Chapter 6
Individual Legislators and Intergovernmental Delegation
INTRODUCTION
In Chapter 2, I developed a theory of how Congress delegates policy
responsibility across federal levels. There are three components to the theoretical
argument—an aggregate-level model of Congress making decisions, an individual-level
model of how legislators bargain over the decentralization of authority to form successful
policy coalitions, and an informal consideration of the influence of uncertainty over the
partisanship of national and state implementers during implementation. Earlier chapters
examine the aggregate-level model and national and state political uncertainty through a
large-N analysis, as well as the underlying mechanisms in both models via an in-depth
case study of health insurance reform. A closer analysis of the individual-level model
and theoretical implications remains. By studying legislators‘ voting behavior, I assess
whether policy coalitions in the House and Senate include the participants the
intergovernmental theory of federal policy design predicts.
In particular, the individual-level theory is based on how legislators compare their
most preferred policy outcome to that of their state leadership and the national executive
branch to determine how much authority is delegated to the states. As legislators attempt
to successfully pass a policy in their chamber, they bargain over how much authority the
states receive in national law. This process of legislative coalition formation reveals a
201
pivotal intergovernmental team in the House and the Senate. In the House, the pivotal
team is the non-indifferent majority intergovernmental team. In the Senate, the pivotal
team, due to the threat or presence of a filibuster, is the non-indifferent minority party
intergovernmental team.
By non-indifference, I refer to the fact that in the model an intergovernmental
team may strictly prefer centralization, decentralization, or they may be indifferent.106
The indifferent teams are those where the location of the ideal point for the national and
state implementers is the same. Since I use party labels as the legislators‘ proxy for the
ideal points of these actors, this means that when there is a Republican president, those
intergovernmental teams that also have Republican governors (Republican legislators
from states with Republican governors, RR legislators, and Democratic legislators from
states with Republican governors, DR legislators) are indifferent over state authority
allocation. The teams that are not indifferent, though, are those teams with the opposite
party label as that of the president. Thus, when there is a Republican president, the non-
indifferent teams are DD and RD legislators and when there is a Democratic president,
the non-indifferent teams are DR and RR legislators.
In Chapter 2, by relying on these preference alignments, majority party agenda
setting, and the assumption that intergovernmental teams receive a utility boost when
they form coalitions with their co-partisans (e.g., RR with RD or DD with DR), the
individual-level model provides information about the makeup of policy coalitions in the
House and the Senate under different conditions. For example, under a unified
106
Recall from Chapter 2, the optimal state authority allocation ( *) = (N-L)/(N-S), where N represents the
location of the national executive branch‘s ideal point, L, the legislator‘s ideal point, and S, the legislator‘s
state governor‘s ideal point. In this equation, when the legislator is of the same party as the national
executive branch, *=0 (centralization), when the legislator is of the same party as his state, *=1
(decentralization), and when N=S, the legislator is indifferent over .
202
Democratic government, successful House coalitions will include DD and DR legislators
and will centralize authority with the national executive branch. Success, in this case, is
defined as the ability to garner enough votes on the floor to pass the policy. A successful
Senate bill, on the other hand, will have the support of DD and DR legislators plus some
RR legislators in order to reach 60 votes and invoke cloture, if needed. Even when
filibusters are not realized, Senators must concern themselves with the possibility that
any one legislator can block legislation on the floor. By having at least 60 votes available
in a policy coalition, Senators are prepared to face this threat of obstruction.
TESTING THE THEORY
In this chapter, I conduct systematic empirical tests of the arguments in the
individual-level model across two separate novel data sets spanning congressional
policymaking from 1973-2008. The first dataset is an extension of the data developed in
Chapter 3. I collect data on individual legislators‘ party, vote choice, and state
governor‘s party and analyze the vote on final passage for each of the laws coded from
1973 through 2008 in both the House and the Senate. This dataset provides information
about which legislators voted for and against final passage. The set of legislators voting
for passage indicates the composition of successful policy coalitions in the House and
Senate across the laws included. By analyzing vote choice, in the context of the
intergovernmental party teams of the legislators, I can assess the individual-level
hypotheses from Chapter 2. These hypotheses include:
Hypothesis 6-1 (from Hypotheses 5-8 in Chapter 2): When the House majority party is
Republican; both Republican intergovernmental teams (RD and RR) will be more likely
to vote for a measure on the floor, regardless of the party of the president.
203
Hypothesis 6-2 (from Hypotheses 5-8 in Chapter 2): When the House majority party is
Democratic; both Democratic intergovernmental teams (DD and DR) will be more likely
to vote in favor of measures on the floor, regardless of the party of the president.
Hypothesis 6-3 (from Hypothesis 10 in Chapter 2): In the Senate, under a Democratic
president and a Republican majority party, DR legislators will more likely vote with
Republicans than will DD legislators.
Hypothesis 6-4 (from Hypothesis 9 in Chapter 2): In the Senate, under a Democratic
president and a Democratic majority party, Republican legislators from states with
Republican governors (RR legislators) will more likely to vote with the majority party
than will RD legislators (Republican legislators from states with Democratic governors).
Hypothesis 6-5 (from Hypothesis 9 in Chapter 2): In the Senate, under a Republican
president and a Republican majority party, Democratic legislators from states with
Democratic governors (DD legislators) will more likely vote with the Republican party
than will DR legislators (Democratic legislators from states with Republican governors).
Hypothesis 6-6 (from Hypothesis 10 in Chapter 2): In the Senate, under a Republican
president and a Democratic majority party, RD legislators will more likely vote with
Democrats than will RR legislators.
In the Senate, the theoretical model is based specifically on the ability to invoke
cloture. Previous studies have shown that a substantial percentage of legislators switch
their votes between cloture and final passage (Butler and Sempolinski 2010).107
Since
my theory specifically deals with cloture coalitions in the Senate, I narrow the focus of
the tests of the Senate hypotheses by just considering voting behavior on the motion to
invoke cloture from the 93rd
-110th
Congresses.108
In this second dataset, I consider
Senator voting behavior across all cloture votes from 1973-2008, given their
intergovernmental team, the majority party in the Senate, and the party of the President.
By studying cloture votes, I more closely examine hypotheses 6-3 through 6-6.
107
Butler and Sempolinksi (2010) find that 11.5% of votes on successful cloture motions are switched to
―nay‖ at final passage. 108
Although cloture procedures were changed in 1975 (the 94th Congress), the conclusions of my theory do
not change based on whether a 2/3 or a 3/5 majority is needed due to the frequency of the
intergovernmental teams in the 93rd
Congress, so I include all Congresses. Analyses excluding the 93rd
Congress do not noticeably alter the findings or conclusions drawn.
204
Although the theoretical model in Chapter 2 assumes 4 unitary actors representing
the 4 intergovernmental teams (DD, DR, RD, and RR legislators), the likelihood that all
DD legislators or all RD legislators act en bloc is low. Rather, myriad pressures buffet
legislators as they determine how to vote on a particular motion or measure. What I do in
the analyses below is to assume the formal individual-level model provides a foundation
for how legislators vote. Thus, the hypotheses listed above assume a higher probability,
instead of a deterministic prediction, that particular legislators act in the predicted ways
given the intergovernmental teams of which they are a part.
A second assumption is needed to move from the theoretical model to an
empirical analysis. Specifically, I assume that the majority party in a chamber controls
the agenda and is more likely to bring motions and measures to the floor that are in the
party‘s interest (Cox and McCubbins 2007). This does not assume that all Democrats
under a Democratic majority vote for a measure. Instead, I assume that if a bill is
brought up for a vote under a Democratic majority, Democrats, on average, are more
likely to vote in favor of the measure than against it. This assumption, though, creates a
problem for assessing my theoretical argument in the House, which I discuss in detail
below. In the following section, I describe the research design and data used to test the
hypotheses above.
DATA AND MEASUREMENT
By looking at the voting behavior of legislators, given their intergovernmental
team, this chapter examines whether the pivotal team identified by the theory is actually
more likely to vote with the enacting coalition than a comparison team. To evaluate
which intergovernmental teams populate successful policy coalitions, this study utilizes a
205
recorded vote as the unit of analysis. The votes on final passage include 75,958 votes on
172 separate measures from 1973-2008 for the significant legislation described in
Chapters 3 and 4.109
The votes on motions to invoke cloture include 65,724 votes on 686
motions across the time period. For each of the analyses, the dependent variable is a
dichotomous ―yea‖ or ―nay‖ vote choice by each legislator voting on that measure or
motion. 110
The analyses begin with an examination of votes on final passage (Final
Passage) and conclude with cloture vote choices in the Senate (Cloture Vote).
Conditional Analyses
To examine the theoretical predictions above, it is necessary to collect the
partisanship of the president and Senate and House majority party for each year in the
dataset for both types of analyses. I collect this information from the House and Senate
Archives and Woolley and Peters (2009-2011).111
Republicans are coded as a 1,
Democrats as a -1 and Independents as a 0. These party labels provide the conditions
under which the various hypotheses are expected to hold, which I discuss in detail below.
Dependent Variable
For both analyses, the dependent variable is the vote choice of each voting
legislator. In the Final Passage analysis, the choice is either a ―yea‖ or a ―nay‖ on the
final floor vote for the significant legislation across the time period (coded 1 and 0,
109
Seven measures from Chapters 3 and 4 did not receive a recorded vote in either the Senate or the House
and passed each chamber with a voice vote. These measures include the Omnibus Reconciliation Act of
1982 (P.L. 97253), the Nuclear Waste Policy Act of 1982 (P.L. 97425), the Government Securities Act of
1986 (P.L. 99570), the Hurricane Katrina Emergency Relief Act (P.L. 109061), the Tax Relief and Health
Care Act of 2006 (P.L. 109432), and the Postal Accountability and Enhancement Act (P.L. 109435) and are
not included in the analyses in this chapter. 110
If a legislator did not vote ―yea‖ or ―nay‖ on the measure, for whatever reason, I coded the vote as
missing. 111
The House historical party divisions were found at
http://artandhistory.house.gov/house_history/partyDiv.aspx and the Senate at
http://www.senate.gov/pagelayout/history/one_item_and_teasers/partydiv.htm. Both websites were last
accessed on May 17, 2011. The party of the president was collected from The American Presidency
Project‘s website at http://www.presidency.ucsb.edu/data/presparty.php last accessed on May 17, 2011.
206
respectively). Using THOMAS, I created a list of major actions of each law in the
dataset. From this list, I collected the date of votes on final passage (and the specific
measure voted on) in the House and the Senate. These votes on final passage were then
matched to the appropriate vote in Voteview.com, yielding a collection of legislator‘s
votes on final passage for each law in the dataset. In total, of the 75,958 votes cast,
62,870 were in the House and 13,088 in the Senate. In sum in this dataset, I have a
collection of vote choices for legislators, the intergovernmental team for each legislator,
and the majority party in the House and Senate, as well as the party of the President.
In the Cloture Vote analysis, I collected information on all cloture votes taken in
the 93rd
through the 110th
Congresses from the Senate Virtual Reference Desk Cloture
List Tables.112
These cloture votes were matched with the Voteview.com roll call votes
by name of the motion or measure, motion or measure number, vote tally, and date. The
information provided by these two resources includes how each Senator voted on all
cloture votes across the period. These Senators were then matched by year to their state
governor using Klarner‘s (2007) data on state political institution‘s partisanship for 1973-
2007 and the National Governors Association lists of governors for 2008.
Thus, for each cloture vote taken in the time period of the study, I have an
individual legislator‘s vote choice coded as 0 or 1 for ―nay‖ and ―yea,‖ the legislator‘s
party, his or her governor‘s party, and the party of the president and Senate majority for
the year the vote was recorded. In the Cloture Vote analysis data, 27,878 of the total
65,724 votes to invoke cloture were successful.113
As can be seen in Figure 6-1, of the
112
Accessed at http://www.senate.gov/pagelayout/reference/cloture_motions/clotureCounts.htm from April
15-May 15, 2011. 113
Across this time period there were an additional 6,619 votes on nominations, which I excluded from my
analyses.
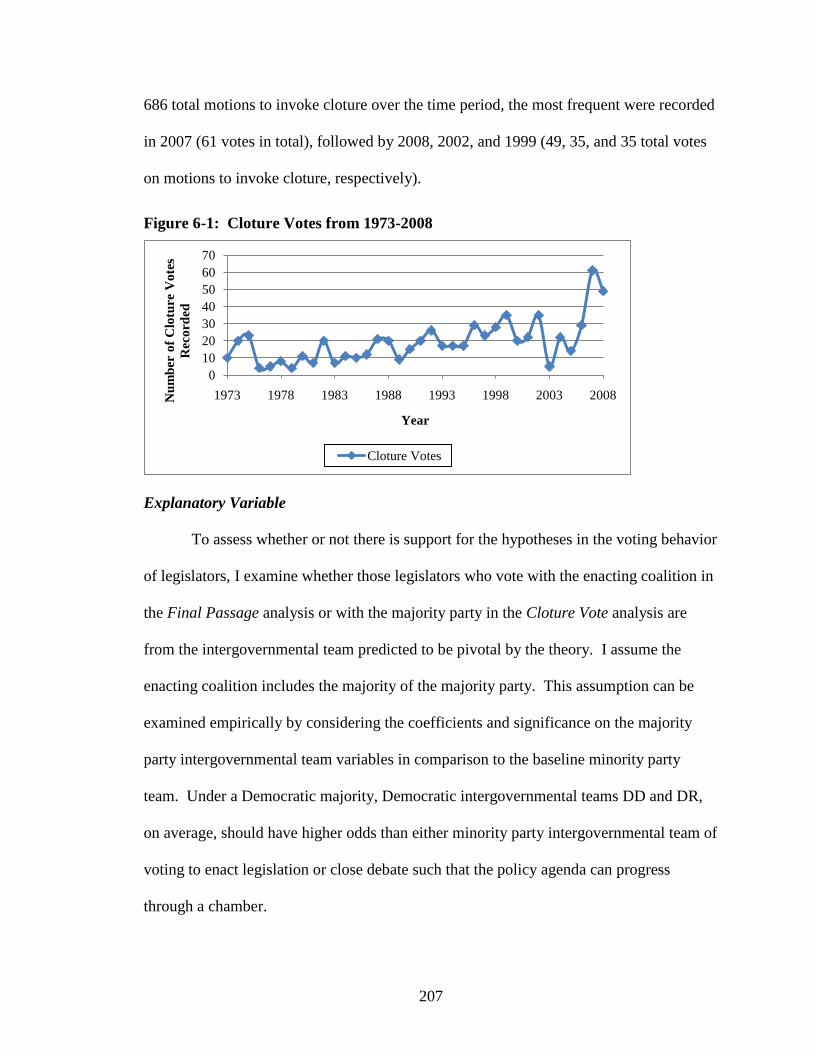
207
686 total motions to invoke cloture over the time period, the most frequent were recorded
in 2007 (61 votes in total), followed by 2008, 2002, and 1999 (49, 35, and 35 total votes
on motions to invoke cloture, respectively).
Figure 6-1: Cloture Votes from 1973-2008
Explanatory Variable
To assess whether or not there is support for the hypotheses in the voting behavior
of legislators, I examine whether those legislators who vote with the enacting coalition in
the Final Passage analysis or with the majority party in the Cloture Vote analysis are
from the intergovernmental team predicted to be pivotal by the theory. I assume the
enacting coalition includes the majority of the majority party. This assumption can be
examined empirically by considering the coefficients and significance on the majority
party intergovernmental team variables in comparison to the baseline minority party
team. Under a Democratic majority, Democratic intergovernmental teams DD and DR,
on average, should have higher odds than either minority party intergovernmental team of
voting to enact legislation or close debate such that the policy agenda can progress
through a chamber.
0
10
20
30
40
50
60
70
1973 1978 1983 1988 1993 1998 2003 2008Nu
mb
er o
f C
lotu
re V
ote
s
Reco
rd
ed
Year
Cloture Votes
208
To analyze how each intergovernmental team votes, on average, the main
explanatory variable is a categorical measure of intergovernmental teams. I construct this
intergovernmental team variable by matching each legislator to his or her governor for
every year in the dataset and create a categorical coding for legislators, where DD, DR,
RD, and RR legislators are coded as 1, 2, 3, and 4 respectively. In addition, I code
independent legislators and governors as a 5.114
By constructing the explanatory variable in this manner, I can assess the extent to
which a pivotal team is more likely to vote ―yea‖ than another comparison team.
Although the comparison in the House is whether Democrats from either
intergovernmental team (DD and DR) are more likely to vote for enactment than their
Republican counterparts when in the majority (and vice versa), in the Senate one
particular minority party intergovernmental team is theoretically considered to be pivotal
and the other minority party intergovernmental team is not. By separating the
intergovernmental teams in this categorical fashion, I can assess the extent to which
legislators in the pivotal minority intergovernmental teams are more likely to vote for
enactment or to invoke cloture than the other minority intergovernmental team. Which
team is considered to be pivotal in the Senate is dependent on the conditions noted in
Hypotheses 6-3 through 6-6. Pivotal members, therefore, are defined by the fact that
without those particular members, a motion or measure will not secure the needed votes
for passage.
114
In addition, I create a second coding where these independent legislators are folded into the 4-
categorical variable depending on the party with which the legislators caucused. Thus, an IR legislator (an
independent legislator from a state with a Republican governor) is coded as RR if the legislator caucused
with the Republicans and a DR if he caucused with the Democrats. If an actor could not be assigned as
more left leaning versus right leaning, they were dropped from the analysis. Analyzing the data in this way
does not change the substantive findings. It does, however, prohibit an opportunity to consider how
independents vote; therefore, I use the 5-category variable in the results section.
209
For example, when there is a Republican president and a Democratic majority in
the Senate, the pivotal minority team is that of RD legislators and not RR legislators.
This means that without RD legislators, the motion or measure in the Senate will not
pass. Hypothesis 6-6 predicts that RD legislators, then, are more likely to vote with
Democrats instead of with their co-partisans. To examine whether this prediction is
supported in the data, I analyze whether the likelihood that RD legislators vote for
enactment or to invoke cloture is greater than that of the appropriate comparison group.
The appropriate comparison group is that of RR legislators, since they are co-partisans, or
from the same party. If intergovernmental teams do not influence voting, the coefficient
on the RD team variable would not be significantly different from zero.
The expectations for the intergovernmental team categorical variable under the
various conditions detailed in the hypotheses are summarized in Table 6-1. The
theoretical argument posits that the party of the president does not matter for how the
majority party forms successful policy coalitions in the House, but does matter for the
Senate (first row of the table). For Hypothesis 6-1, in the House under a Democratic
majority party, the prediction is that Democrats vote more often with each other, or for
enactment, than with the Republican intergovernmental teams (first column in Table 6-1).
In other words, I expect that when Republicans are in power in the House, a
comparison of the likelihood of voting for final passage on a bill is higher for
Republicans (both RD and RR intergovernmental teams) than for Democrats (both DD
and DR teams). For Hypothesis 6-2 (second column, Table 6-1), under a Democratic
majority, the expectation is that Democratic House members vote more often for
enactment than do the Republican teams (the baseline category). For the House analysis,
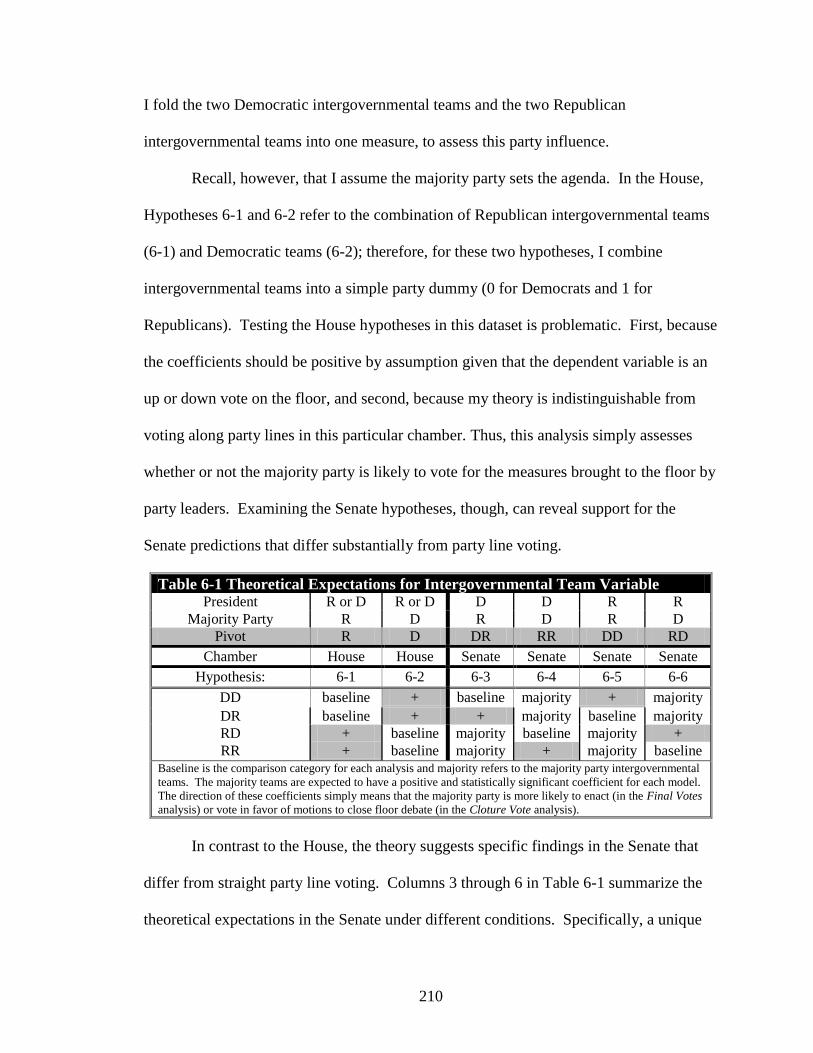
210
I fold the two Democratic intergovernmental teams and the two Republican
intergovernmental teams into one measure, to assess this party influence.
Recall, however, that I assume the majority party sets the agenda. In the House,
Hypotheses 6-1 and 6-2 refer to the combination of Republican intergovernmental teams
(6-1) and Democratic teams (6-2); therefore, for these two hypotheses, I combine
intergovernmental teams into a simple party dummy (0 for Democrats and 1 for
Republicans). Testing the House hypotheses in this dataset is problematic. First, because
the coefficients should be positive by assumption given that the dependent variable is an
up or down vote on the floor, and second, because my theory is indistinguishable from
voting along party lines in this particular chamber. Thus, this analysis simply assesses
whether or not the majority party is likely to vote for the measures brought to the floor by
party leaders. Examining the Senate hypotheses, though, can reveal support for the
Senate predictions that differ substantially from party line voting.
Table 6-1 Theoretical Expectations for Intergovernmental Team Variable President R or D R or D D D R R
Majority Party R D R D R D
Pivot R D DR RR DD RD
Chamber House House Senate Senate Senate Senate
Hypothesis: 6-1 6-2 6-3 6-4 6-5 6-6
DD baseline + baseline majority + majority
DR baseline + + majority baseline majority
RD + baseline majority baseline majority +
RR + baseline majority + majority baseline
Baseline is the comparison category for each analysis and majority refers to the majority party intergovernmental
teams. The majority teams are expected to have a positive and statistically significant coefficient for each model.
The direction of these coefficients simply means that the majority party is more likely to enact (in the Final Votes
analysis) or vote in favor of motions to close floor debate (in the Cloture Vote analysis).
In contrast to the House, the theory suggests specific findings in the Senate that
differ from straight party line voting. Columns 3 through 6 in Table 6-1 summarize the
theoretical expectations in the Senate under different conditions. Specifically, a unique
211
intergovernmental team is posited as pivotal under each set of conditions. A pivotal
team, from the theory, is that team necessary to form a successful policy coalition and is
shown in the table as a gray shaded cell.
Beginning with Column 3, under a Democratic president and a Republican
majority party, DR legislators are pivotal and, in Column 4, under a Democratic president
and Democratic majority, RR legislators are pivotal. This means that under a Democratic
president and Republican majority DR legislators would be expected to have higher odds
of voting for the measure or motion than DD legislators. With a Democratic president
and Senate majority, RR legislators would have higher odds of voting for the measure or
motion than RD legislators. Switching to the expected pivots under Republican
presidents, in Column 5 with a Republican majority, DD legislators are pivotal (positive
coefficient in comparison to DR legislators) and in Column 6 with a Democratic Senate
majority, RD legislators are pivotal (positive coefficient in comparison to RR legislators).
What voting behavior is expected of the pivotal intergovernmental teams? As
discussed above, outside of the formal model not every legislator within a team is
expected to vote in the same fashion. Instead, legislators within a team are predicted to
be more likely to vote in a particular way. Moreover, to reach 60 votes and maintain the
supermajority needed to invoke cloture if one Senator mounts a filibuster, the majority
party (comprised of both majority intergovernmental teams) need only entice enough
legislators from the pivotal minority intergovernmental team to join the policy coalition
to reach that threshold (given, of course, the possibility that some majority party
members may not vote along with the party). The expectation, then, is that legislators
from the pivotal minority party intergovernmental team, under each condition, will be
212
more likely to vote with the majority party than the other minority intergovernmental
team (the non-pivotal minority team).
These expectations are included in the table as a positive sign, or that a positive
and statistically significant coefficient is expected, in comparison to the baseline group:
Column 3: DR legislators will vote with the Republican majority more often than
DD legislators under a Democratic president (Hypothesis 6-3).
Column 4: RR legislators will vote with the Democrat majority more often than
RD legislators when there is a Democratic president (Hypothesis 6-4).
Column 5: DD legislators will vote with the Republican majority more often than
DR legislators when there is a Republican president (Hypothesis 6-5).
Column 6: RD legislators are more likely to vote with the Democratic majority
than RR legislators when there is a Republican president (Hypothesis 6-6).
This chapter analyzes two separate datasets of vote choices in the Senate. One
dataset is on the final passage of significant legislation and the other is on motions to
invoke cloture. Given the theoretical focus on coalitions able to invoke cloture, I expect
to find stronger results in the Cloture Vote analysis than in the Final Passage analysis.
Specifically, in votes on final passage in the Senate, a simple majority is all that is
required, thus, at this stage of voting the pivotal minority intergovernmental teams in the
Senate are less informative. This is not to say that legislators from the pivotal team are
not considered to be important at the earlier stages of congressional action for these
measures. On the contrary, if a legislator mounted a (or threatened to) filibuster earlier in
the process, the pivotal minority intergovernmental team is crucial to a successful policy
coalition. Since these votes are on final passage, which assume or select away the earlier
stages of legislative action, and because legislators can switch their votes at any time, I
expect the influence of the pivotal minority intergovernmental team to be diluted in the
Final Passage analysis.
213
These theoretical predictions also require partisan labels of the president and
Senate and House majority party for each year in the dataset. With these partisan labels, I
run each analysis given the various conditions of government (see Table 6-1). In the
House, these conditions include a model under Republican majority and another under
Democratic majority. In the Senate, there are four conditions to assess: Democratic
president with Republican Senate majority, Democratic president with Democratic Senate
majority, Republican president with Republican Senate majority, and Republican
president with Democratic Senate majority.
Control Variables
I do not include control variables in the Final Passage and Cloture Vote analyses
reported in the tables.115
Given the variety of underlying policy areas and different
annual environmental conditions, those factors expected to explain legislative voting
behavior, such as constituency pressures or personal preferences are expected to wash out
and not influence the substantive conclusions of the analyses.116
EMPIRICAL ANALYSES
I estimate three overarching models, two for the Final Passage analysis (one in
the House and one in the Senate) and one model for the Cloture Vote analysis.
Final Passage Analysis: Logit (pi) = log [p(vote ―yea‖)/1-p(vote ―nay‖)]i,t = β0 +
β1INTERGOVERNMENTAL TEAMi,t + ε, if majority party is
115
In the Final Passage analysis, I also run a set of models that include various controls from Chapter 4.
These variables include the explanatory variables from that chapter‘s empirical analyses: preference
distance from pivotal legislative team to the state and the president, as well as state and national political
uncertainty. In addition, I include the same control variables as in Chapter 4: lagged federal deficit as a
percent of GDP, lagged state fiscal health (operationalized as state revenue growth as a percent of GDP),
traditional state policies (0,1), and activist public mood (0,1). I omit unified government, since this
variable is collinear with the conditions of national government needed to assess the hypotheses. The
results of these models are not significantly different from those discussed in this chapter, thus, I report the
parsimonious theoretic model instead. 116
Environmental conditions can include diverse factors such as fads that increase the consumption of
certain goods or products, climate, monetary concerns, or even a variety of disasters, among other things.
214
Republican/Democrat for the House and if majority party is Republican/Democrat
& if party of President is Republican/Democrat in the Senate.
Cloture Vote Analysis: Logit (pi) = log [p(vote ―yea‖)/1-p(vote ―nay‖)]i,t = β0 +
β1INTERGOVERNMENTAL TEAMi,t + ε, if majority party is
Republican/Democrat & if party of President is Republican/Democrat.117
Given the various conditions to be assessed, these models result in two equations in the
House:
1. Final Passage logit under Republican majority and
2. Final Passage logit under a Democratic majority.
And eight equations in the Senate:
1. Final Passage logit under a Democratic president with a Republican majority,
2. Final Passage logit under a Democratic president with a Democratic majority,
3. Final Passage logit under a Republican president with a Republican majority,
4. Final Passage logit under a Republican president with a Democratic majority,
5. Cloture Vote logit under a Democratic president with a Republican majority,
6. Cloture Vote logit under a Democratic president with a Democratic majority,
7. Cloture Vote logit under a Republican president with a Republican majority, and
8. Cloture Vote logit under a Republican president with a Democratic majority.
Each equation estimated in this chapter serves a particular purpose, to assess one of
the theoretical hypotheses. The number of equations derives from the variety of
conditions to be assessed and the different baseline comparison groups needed in the
Senate. It is possible to analyze these different conditions and groups with one
interactive model, where the intergovernmental team variable is interacted with the
majority party (for the House model) or the majority party and the party of the President
(for the Senate model). Interpreting the three (and four)-way interactions, given the
categorical nature of the intergovernmental team variable, though, seems both more
cumbersome and less useful.
117
The final set of models also includes the condition: if the majority party of the House is
Republican/Democrat.
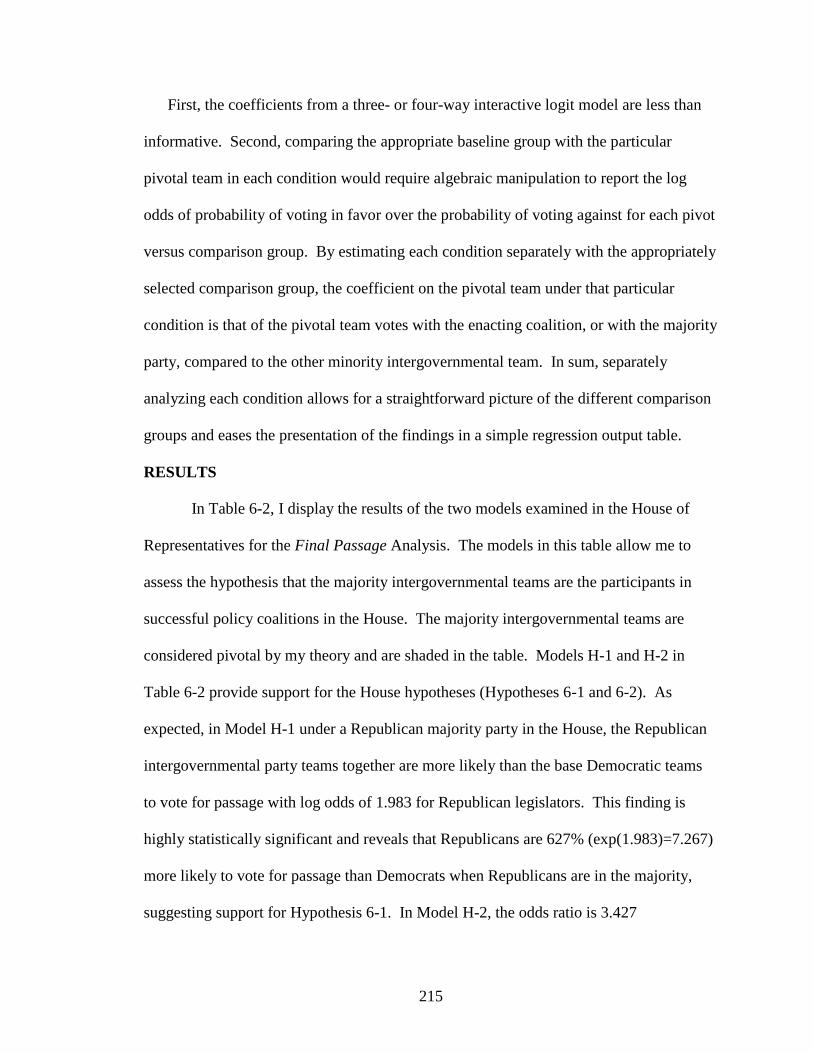
215
First, the coefficients from a three- or four-way interactive logit model are less than
informative. Second, comparing the appropriate baseline group with the particular
pivotal team in each condition would require algebraic manipulation to report the log
odds of probability of voting in favor over the probability of voting against for each pivot
versus comparison group. By estimating each condition separately with the appropriately
selected comparison group, the coefficient on the pivotal team under that particular
condition is that of the pivotal team votes with the enacting coalition, or with the majority
party, compared to the other minority intergovernmental team. In sum, separately
analyzing each condition allows for a straightforward picture of the different comparison
groups and eases the presentation of the findings in a simple regression output table.
RESULTS
In Table 6-2, I display the results of the two models examined in the House of
Representatives for the Final Passage Analysis. The models in this table allow me to
assess the hypothesis that the majority intergovernmental teams are the participants in
successful policy coalitions in the House. The majority intergovernmental teams are
considered pivotal by my theory and are shaded in the table. Models H-1 and H-2 in
Table 6-2 provide support for the House hypotheses (Hypotheses 6-1 and 6-2). As
expected, in Model H-1 under a Republican majority party in the House, the Republican
intergovernmental party teams together are more likely than the base Democratic teams
to vote for passage with log odds of 1.983 for Republican legislators. This finding is
highly statistically significant and reveals that Republicans are 627% (exp(1.983)=7.267)
more likely to vote for passage than Democrats when Republicans are in the majority,
suggesting support for Hypothesis 6-1. In Model H-2, the odds ratio is 3.427
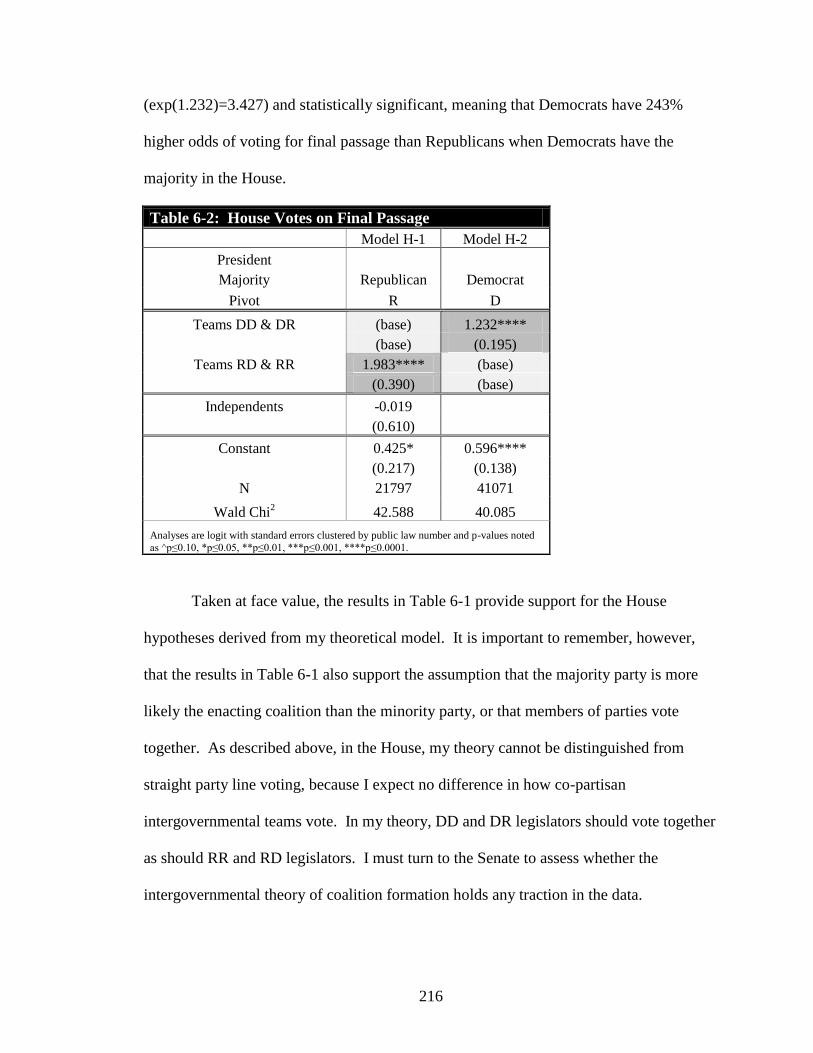
216
(exp(1.232)=3.427) and statistically significant, meaning that Democrats have 243%
higher odds of voting for final passage than Republicans when Democrats have the
majority in the House.
Table 6-2: House Votes on Final Passage
Model H-1 Model H-2
President
Majority Republican Democrat
Pivot R D
Teams DD & DR (base) 1.232****
(base) (0.195)
Teams RD & RR 1.983**** (base)
(0.390) (base)
Independents -0.019
(0.610)
Constant 0.425* 0.596****
(0.217) (0.138)
N 21797 41071
Wald Chi2 42.588 40.085
Analyses are logit with standard errors clustered by public law number and p-values noted
as ^p≤0.10, *p≤0.05, **p≤0.01, ***p≤0.001, ****p≤0.0001.
Taken at face value, the results in Table 6-1 provide support for the House
hypotheses derived from my theoretical model. It is important to remember, however,
that the results in Table 6-1 also support the assumption that the majority party is more
likely the enacting coalition than the minority party, or that members of parties vote
together. As described above, in the House, my theory cannot be distinguished from
straight party line voting, because I expect no difference in how co-partisan
intergovernmental teams vote. In my theory, DD and DR legislators should vote together
as should RR and RD legislators. I must turn to the Senate to assess whether the
intergovernmental theory of coalition formation holds any traction in the data.
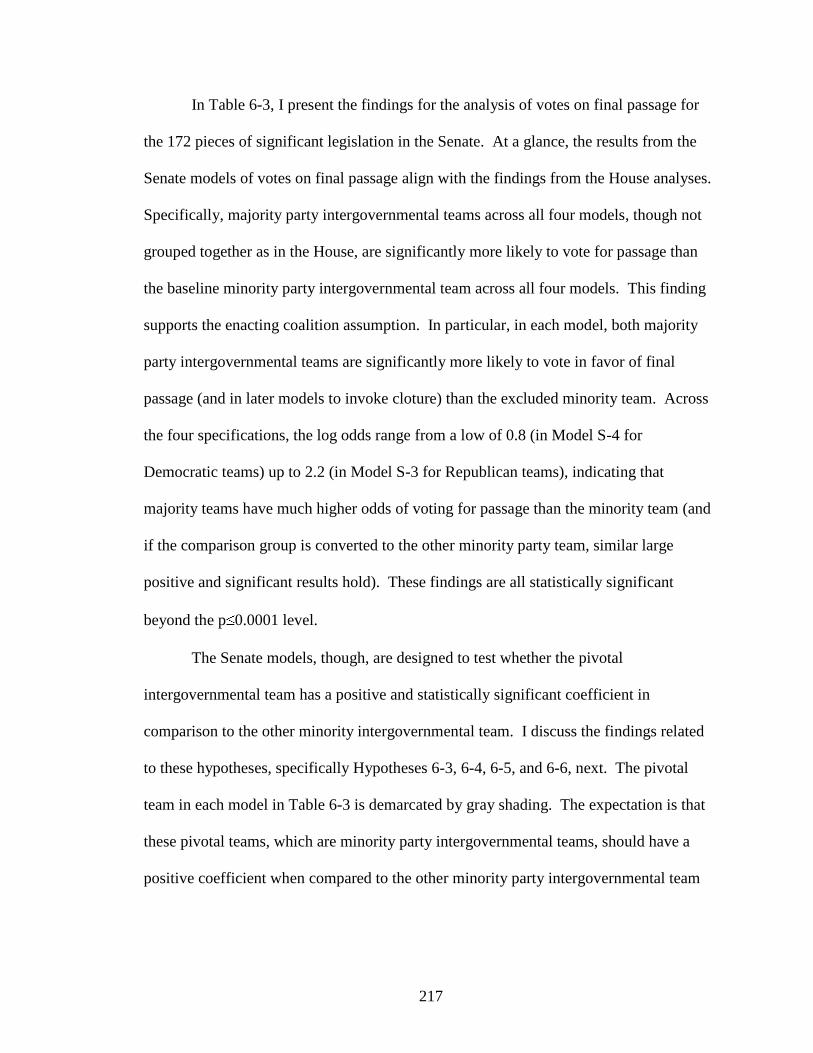
217
In Table 6-3, I present the findings for the analysis of votes on final passage for
the 172 pieces of significant legislation in the Senate. At a glance, the results from the
Senate models of votes on final passage align with the findings from the House analyses.
Specifically, majority party intergovernmental teams across all four models, though not
grouped together as in the House, are significantly more likely to vote for passage than
the baseline minority party intergovernmental team across all four models. This finding
supports the enacting coalition assumption. In particular, in each model, both majority
party intergovernmental teams are significantly more likely to vote in favor of final
passage (and in later models to invoke cloture) than the excluded minority team. Across
the four specifications, the log odds range from a low of 0.8 (in Model S-4 for
Democratic teams) up to 2.2 (in Model S-3 for Republican teams), indicating that
majority teams have much higher odds of voting for passage than the minority team (and
if the comparison group is converted to the other minority party team, similar large
positive and significant results hold). These findings are all statistically significant
beyond the p 0.0001 level.
The Senate models, though, are designed to test whether the pivotal
intergovernmental team has a positive and statistically significant coefficient in
comparison to the other minority intergovernmental team. I discuss the findings related
to these hypotheses, specifically Hypotheses 6-3, 6-4, 6-5, and 6-6, next. The pivotal
team in each model in Table 6-3 is demarcated by gray shading. The expectation is that
these pivotal teams, which are minority party intergovernmental teams, should have a
positive coefficient when compared to the other minority party intergovernmental team
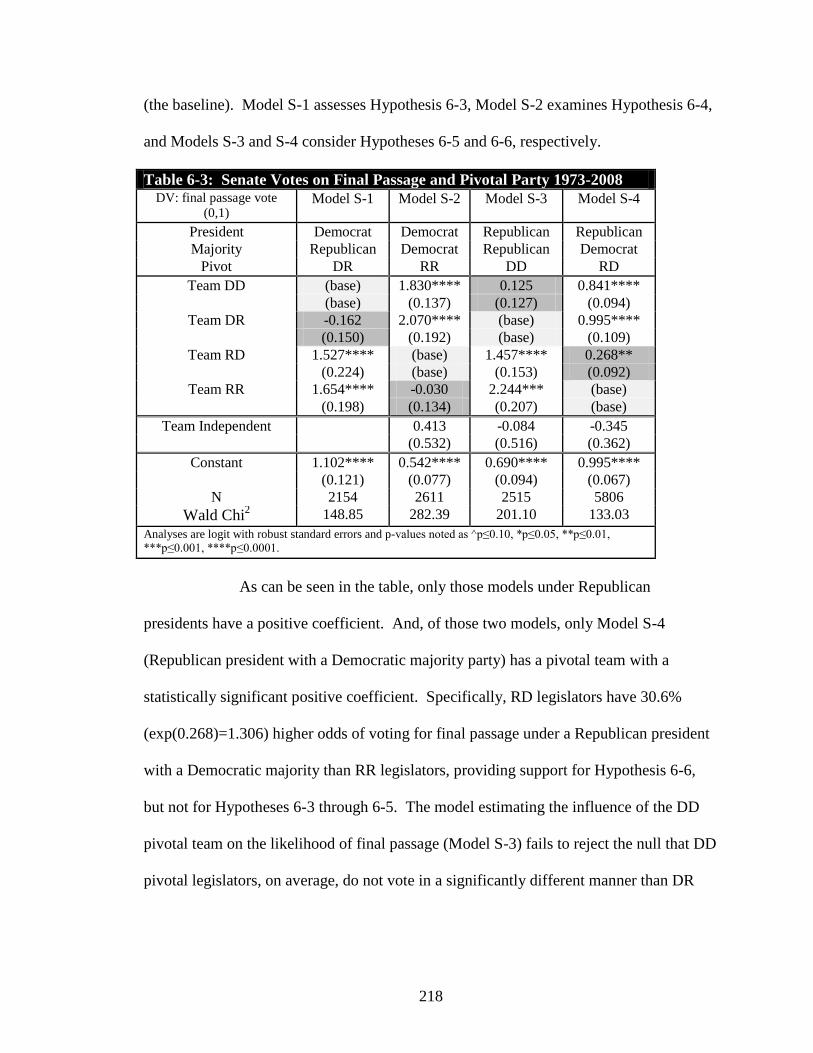
218
(the baseline). Model S-1 assesses Hypothesis 6-3, Model S-2 examines Hypothesis 6-4,
and Models S-3 and S-4 consider Hypotheses 6-5 and 6-6, respectively.
Table 6-3: Senate Votes on Final Passage and Pivotal Party 1973-2008 DV: final passage vote
(0,1) Model S-1 Model S-2 Model S-3 Model S-4
President Democrat Democrat Republican Republican
Majority Republican Democrat Republican Democrat
Pivot DR RR DD RD
Team DD (base) 1.830**** 0.125 0.841****
(base) (0.137) (0.127) (0.094)
Team DR -0.162 2.070**** (base) 0.995****
(0.150) (0.192) (base) (0.109)
Team RD 1.527**** (base) 1.457**** 0.268**
(0.224) (base) (0.153) (0.092)
Team RR 1.654**** -0.030 2.244*** (base)
(0.198) (0.134) (0.207) (base)
Team Independent 0.413 -0.084 -0.345
(0.532) (0.516) (0.362)
Constant 1.102**** 0.542**** 0.690**** 0.995****
(0.121) (0.077) (0.094) (0.067)
N 2154 2611 2515 5806
Wald Chi2 148.85 282.39 201.10 133.03
Analyses are logit with robust standard errors and p-values noted as ^p≤0.10, *p≤0.05, **p≤0.01,
***p≤0.001, ****p≤0.0001.
As can be seen in the table, only those models under Republican
presidents have a positive coefficient. And, of those two models, only Model S-4
(Republican president with a Democratic majority party) has a pivotal team with a
statistically significant positive coefficient. Specifically, RD legislators have 30.6%
(exp(0.268)=1.306) higher odds of voting for final passage under a Republican president
with a Democratic majority than RR legislators, providing support for Hypothesis 6-6,
but not for Hypotheses 6-3 through 6-5. The model estimating the influence of the DD
pivotal team on the likelihood of final passage (Model S-3) fails to reject the null that DD
pivotal legislators, on average, do not vote in a significantly different manner than DR
219
legislators. Models S-1 and S-2 similarly fail to reject the null hypothesis for the pivotal
team variables.
Although the findings in Table 6-3 provide no support for Hypotheses 6-3 through
6-5, since those particular analyses focus on votes on final passage, they are not
particularly surprising. As explained earlier, the influence of the pivotal minority
intergovernmental team on votes over final passage are expected to be more dilute than in
votes on motions to invoke cloture. Table 6-4 presents the empirical results to
specifically explore whether the pivotal minority party team votes in a significantly
different manner than the other minority intergovernmental team on cloture votes.
Column 1 presents the results for the model estimated under a Democratic
president and Republican Senate majority, with the left-hand side of the column
including all cloture votes and the right-hand side only successful cloture votes. As
before, the pivotal intergovernmental team is shaded dark gray, with the baseline
comparison group a lighter gray. The results in this analysis of cloture votes are highly
consistent with the theoretical expectations. As predicted by the theory, the pivotal DR
team, the pivotal RR team, and the pivotal RD team have statistically significant higher
odds of voting to close debate than their co-partisan baseline group in each specific
model. In model S-1, the model of all cloture votes under Democratic presidents when
there is a Republican Senate majority, there is a 9.2% (exp(0.088)=1.092) higher odds
that pivotal DR legislators will vote with Republicans on motions to invoke cloture than
do DD legislators (with a p-value = 0.094). The sign on the coefficient for this variable is
still positive in model S-2 of only successful cloture votes, but is not statistically
significant.
220
Under a Democratic president and Democratic Senate majority (model S-3), the
odds are 16.6% (exp(0.154)=1.166) higher that pivotal RR legislators will vote with
Democrats to close debate than RD legislators. This finding increases in size and
precision in the model of only successful cloture votes (Model S-4), where the higher
odds increase to 35.4% (exp(0.303)=1.354). Similarly, in Model S-7, the pivotal RD
legislator variable under Republican presidents and Democratic Senate majorities has a
positive coefficient and is statistically significant, yielding 16.6%
(exp(0.154)=1.166)higher odds that RD legislators vote to close debate than do RR
legislators. Again, restricting the analysis to successful cloture votes results in a positive,
but not statistically significant, coefficient (Model S-8).
In other words, for the most part, as Senators attempt to create a policy coalition
which would allow them to close debate on the floor, the majority party more often
entices the intergovernmental pivot to join their coalition than the other minority
intergovernmental team. This finding is in accordance with the conclusions of the formal
coalition bargaining model in Chapter 2. The results from one condition, Republican
Presidents with Republican Senate majorities; however, does not support this claim and
specifically fails to demonstrate support for Hypothesis 6-5. In the model assessing all
cloture votes, the coefficient is close to zero (Model S-5) and in the estimation including
only successful cloture votes, the coefficient is in the opposite direction than expected
(negative) and is statistically significant. This finding indicates that, contrary to
Hypothesis 6-5 where pivotal DD legislators are expected to vote more often with
Republican legislators than do DR legislators, DD legislators vote less often to close
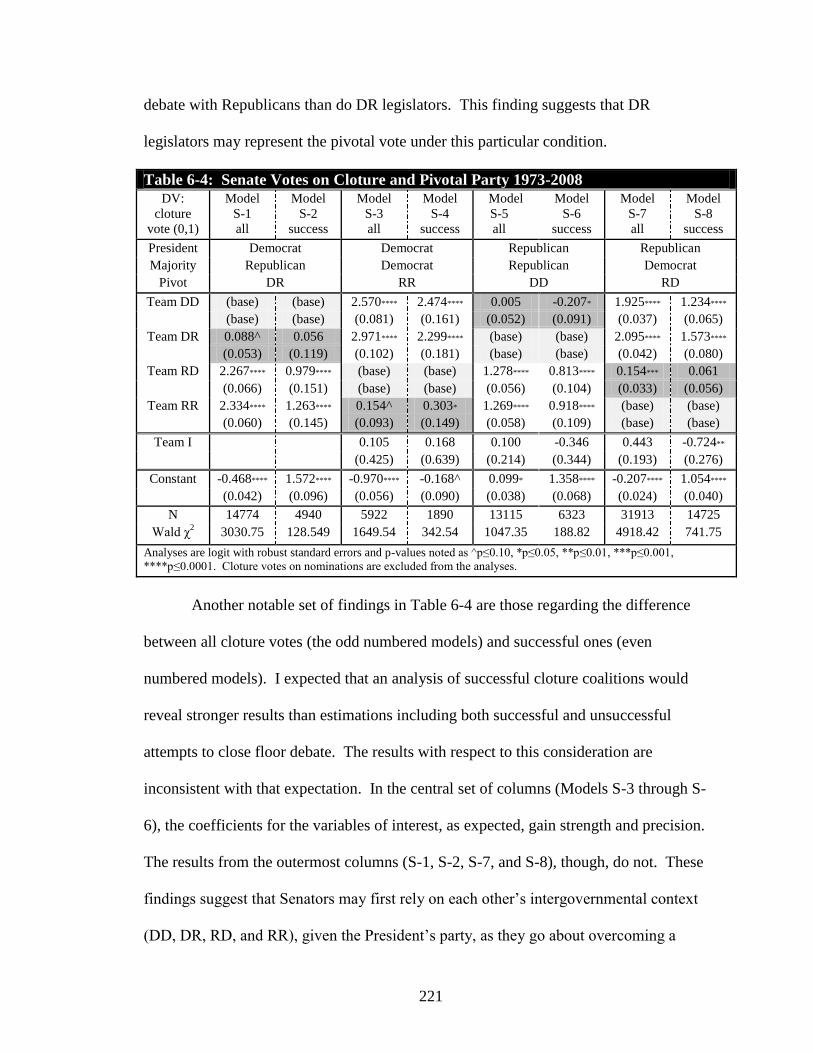
221
debate with Republicans than do DR legislators. This finding suggests that DR
legislators may represent the pivotal vote under this particular condition.
Table 6-4: Senate Votes on Cloture and Pivotal Party 1973-2008 DV:
cloture
vote (0,1)
Model
S-1
all
Model
S-2
success
Model
S-3
all
Model
S-4
success
Model
S-5
all
Model
S-6
success
Model
S-7
all
Model
S-8
success
President Democrat Democrat Republican Republican
Majority Republican Democrat Republican Democrat
Pivot DR RR DD RD
Team DD (base) (base) 2.570**** 2.474**** 0.005 -0.207* 1.925**** 1.234****
(base) (base) (0.081) (0.161) (0.052) (0.091) (0.037) (0.065)
Team DR 0.088^ 0.056 2.971**** 2.299**** (base) (base) 2.095**** 1.573****
(0.053) (0.119) (0.102) (0.181) (base) (base) (0.042) (0.080)
Team RD 2.267**** 0.979**** (base) (base) 1.278**** 0.813**** 0.154*** 0.061
(0.066) (0.151) (base) (base) (0.056) (0.104) (0.033) (0.056)
Team RR 2.334**** 1.263**** 0.154^ 0.303* 1.269**** 0.918**** (base) (base)
(0.060) (0.145) (0.093) (0.149) (0.058) (0.109) (base) (base)
Team I 0.105 0.168 0.100 -0.346 0.443 -0.724**
(0.425) (0.639) (0.214) (0.344) (0.193) (0.276)
Constant -0.468**** 1.572**** -0.970**** -0.168^ 0.099* 1.358**** -0.207**** 1.054****
(0.042) (0.096) (0.056) (0.090) (0.038) (0.068) (0.024) (0.040)
N 14774 4940 5922 1890 13115 6323 31913 14725
Wald χ2 3030.75 128.549 1649.54 342.54 1047.35 188.82 4918.42 741.75
Analyses are logit with robust standard errors and p-values noted as ^p≤0.10, *p≤0.05, **p≤0.01, ***p≤0.001,
****p≤0.0001. Cloture votes on nominations are excluded from the analyses.
Another notable set of findings in Table 6-4 are those regarding the difference
between all cloture votes (the odd numbered models) and successful ones (even
numbered models). I expected that an analysis of successful cloture coalitions would
reveal stronger results than estimations including both successful and unsuccessful
attempts to close floor debate. The results with respect to this consideration are
inconsistent with that expectation. In the central set of columns (Models S-3 through S-
6), the coefficients for the variables of interest, as expected, gain strength and precision.
The results from the outermost columns (S-1, S-2, S-7, and S-8), though, do not. These
findings suggest that Senators may first rely on each other‘s intergovernmental context
(DD, DR, RD, and RR), given the President‘s party, as they go about overcoming a
222
filibuster. Perhaps in the end, though, other factors come into play, such as buying off
certain senators with distributive goods in their district or deleting provisions of interest
to a particular legislator.
In summary, the results reported in Table 6-4 indicate three overall conclusions.
First, in general, the hypotheses derived from the intergovernmental bargaining coalition
model are supported. Specifically, across all but one condition I find support for the
hypotheses. Only Hypothesis 6-5 is contradicted by the estimation results. Second, and
unexpectedly, there may be variation in the formation of cloture coalitions that are
successful versus all attempts to invoke cloture. This potential difference is suggested by
the loss of significance in the pivotal team variable‘s coefficient under both sets of
―divided‖ government, or Democratic presidents with a Republican Senate majority and
Republican presidents with a Democratic Senate majority (Models S-1 to S-2 and S-7 to
S-8) and gain in precision under both sets of ―unified‖ government, or Democratic
presidents with a Democratic Senate majority and Republican presidents with a
Republican Senate majority (Models S-3 to S-4 and S-5 to S-6).
Third, when the Senate majority and president are both Republican, the cloture
coalition appears to include the indifferent minority party intergovernmental team, DR
legislators instead of members from the predicted pivotal team of DD legislators. To
investigate this finding further, I consider the other national institution heretofore ignored
in these analyses—the House. In the case study from Chapter 5, elite interviews indicate
the importance of designing policy in one chamber in anticipation of a conference and the
need to compromise with the other chamber.
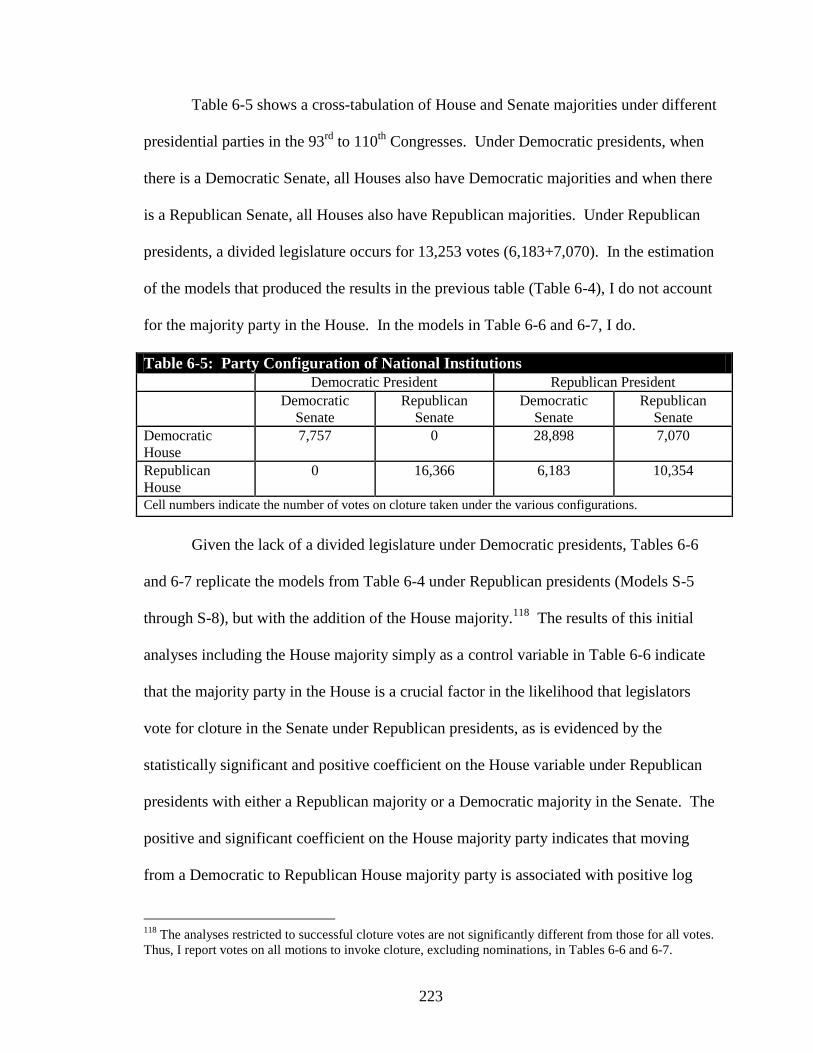
223
Table 6-5 shows a cross-tabulation of House and Senate majorities under different
presidential parties in the 93rd
to 110th
Congresses. Under Democratic presidents, when
there is a Democratic Senate, all Houses also have Democratic majorities and when there
is a Republican Senate, all Houses also have Republican majorities. Under Republican
presidents, a divided legislature occurs for 13,253 votes (6,183+7,070). In the estimation
of the models that produced the results in the previous table (Table 6-4), I do not account
for the majority party in the House. In the models in Table 6-6 and 6-7, I do.
Table 6-5: Party Configuration of National Institutions
Democratic President Republican President
Democratic
Senate
Republican
Senate
Democratic
Senate
Republican
Senate
Democratic
House
7,757 0 28,898 7,070
Republican
House
0 16,366 6,183 10,354
Cell numbers indicate the number of votes on cloture taken under the various configurations.
Given the lack of a divided legislature under Democratic presidents, Tables 6-6
and 6-7 replicate the models from Table 6-4 under Republican presidents (Models S-5
through S-8), but with the addition of the House majority.118
The results of this initial
analyses including the House majority simply as a control variable in Table 6-6 indicate
that the majority party in the House is a crucial factor in the likelihood that legislators
vote for cloture in the Senate under Republican presidents, as is evidenced by the
statistically significant and positive coefficient on the House variable under Republican
presidents with either a Republican majority or a Democratic majority in the Senate. The
positive and significant coefficient on the House majority party indicates that moving
from a Democratic to Republican House majority party is associated with positive log
118
The analyses restricted to successful cloture votes are not significantly different from those for all votes.
Thus, I report votes on all motions to invoke cloture, excluding nominations, in Tables 6-6 and 6-7.
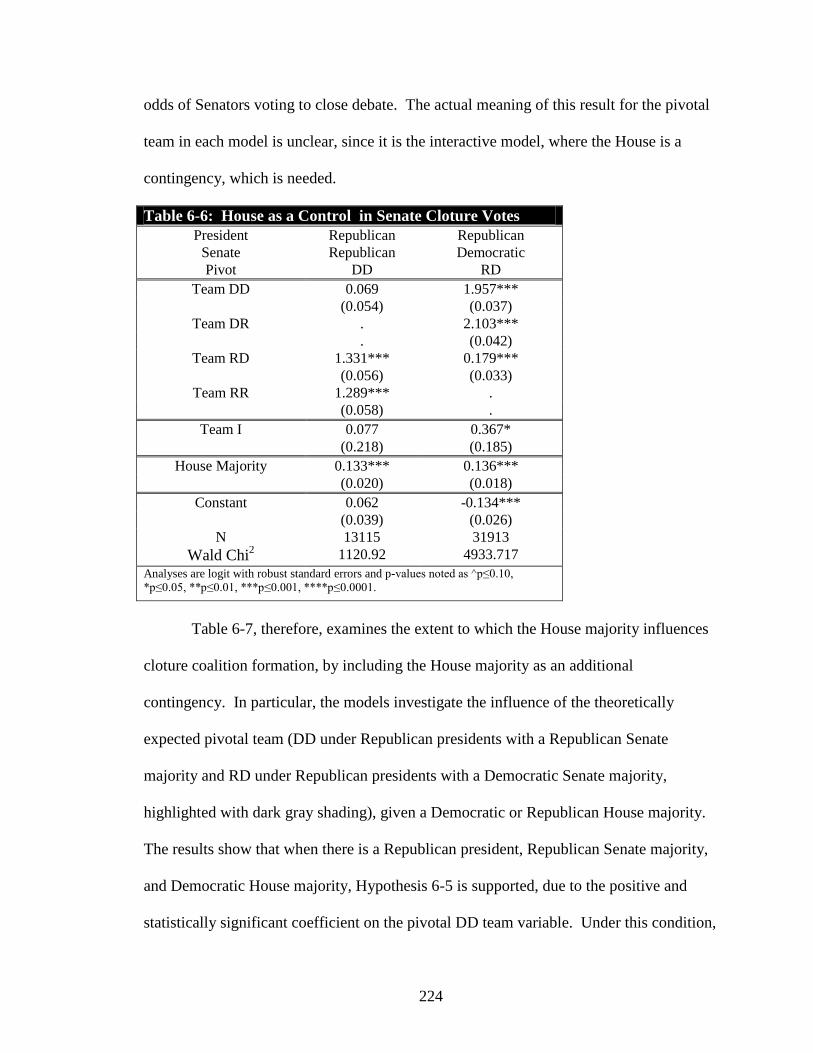
224
odds of Senators voting to close debate. The actual meaning of this result for the pivotal
team in each model is unclear, since it is the interactive model, where the House is a
contingency, which is needed.
Table 6-6: House as a Control in Senate Cloture Votes
President Republican Republican
Senate Republican Democratic
Pivot DD RD
Team DD 0.069 1.957***
(0.054) (0.037)
Team DR . 2.103***
. (0.042)
Team RD 1.331*** 0.179***
(0.056) (0.033)
Team RR 1.289*** .
(0.058) .
Team I 0.077 0.367*
(0.218) (0.185)
House Majority 0.133*** 0.136***
(0.020) (0.018)
Constant 0.062 -0.134***
(0.039) (0.026)
N 13115 31913
Wald Chi2 1120.92 4933.717
Analyses are logit with robust standard errors and p-values noted as ^p≤0.10,
*p≤0.05, **p≤0.01, ***p≤0.001, ****p≤0.0001.
Table 6-7, therefore, examines the extent to which the House majority influences
cloture coalition formation, by including the House majority as an additional
contingency. In particular, the models investigate the influence of the theoretically
expected pivotal team (DD under Republican presidents with a Republican Senate
majority and RD under Republican presidents with a Democratic Senate majority,
highlighted with dark gray shading), given a Democratic or Republican House majority.
The results show that when there is a Republican president, Republican Senate majority,
and Democratic House majority, Hypothesis 6-5 is supported, due to the positive and
statistically significant coefficient on the pivotal DD team variable. Under this condition,
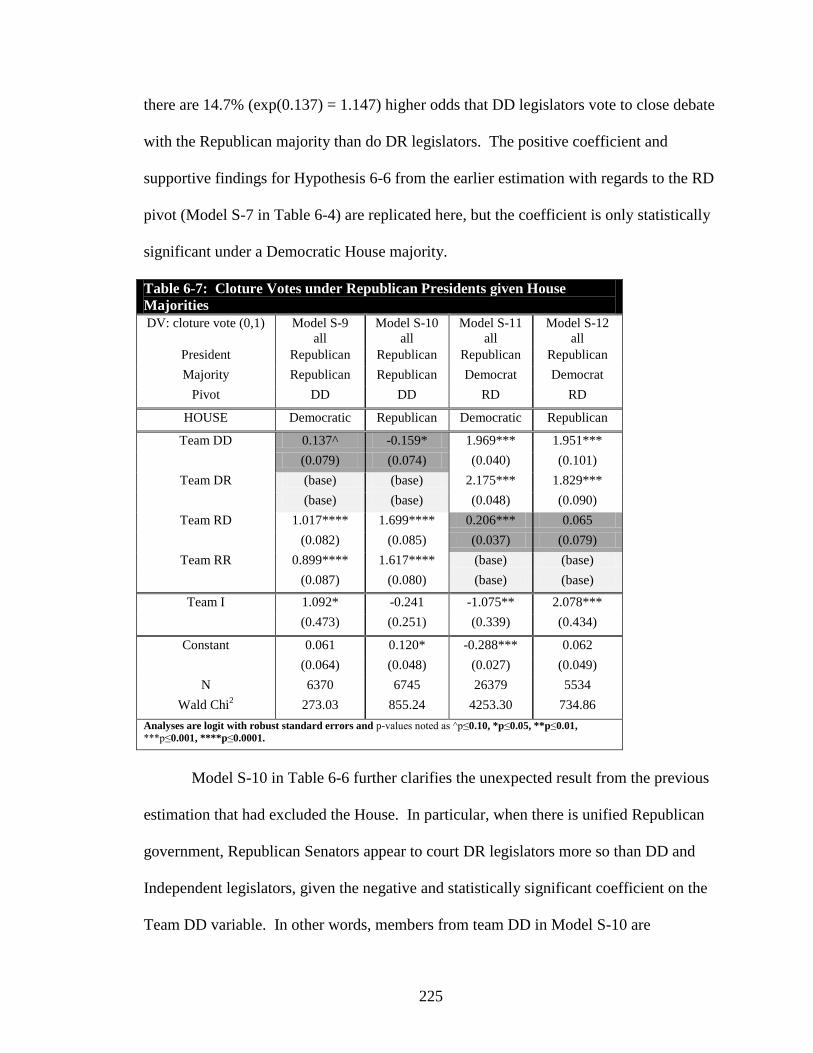
225
there are 14.7% (exp(0.137) = 1.147) higher odds that DD legislators vote to close debate
with the Republican majority than do DR legislators. The positive coefficient and
supportive findings for Hypothesis 6-6 from the earlier estimation with regards to the RD
pivot (Model S-7 in Table 6-4) are replicated here, but the coefficient is only statistically
significant under a Democratic House majority.
Table 6-7: Cloture Votes under Republican Presidents given House
Majorities
DV: cloture vote (0,1) Model S-9
all
Model S-10
all
Model S-11
all
Model S-12
all
President Republican Republican Republican Republican
Majority Republican Republican Democrat Democrat
Pivot DD DD RD RD
HOUSE Democratic Republican Democratic Republican
Team DD 0.137^ -0.159* 1.969*** 1.951***
(0.079) (0.074) (0.040) (0.101)
Team DR (base) (base) 2.175*** 1.829***
(base) (base) (0.048) (0.090)
Team RD 1.017**** 1.699**** 0.206*** 0.065
(0.082) (0.085) (0.037) (0.079)
Team RR 0.899**** 1.617**** (base) (base)
(0.087) (0.080) (base) (base)
Team I 1.092* -0.241 -1.075** 2.078***
(0.473) (0.251) (0.339) (0.434)
Constant 0.061 0.120* -0.288*** 0.062
(0.064) (0.048) (0.027) (0.049)
N 6370 6745 26379 5534
Wald Chi2 273.03 855.24 4253.30 734.86
Analyses are logit with robust standard errors and p-values noted as ^p≤0.10, *p≤0.05, **p≤0.01,
***p≤0.001, ****p≤0.0001.
Model S-10 in Table 6-6 further clarifies the unexpected result from the previous
estimation that had excluded the House. In particular, when there is unified Republican
government, Republican Senators appear to court DR legislators more so than DD and
Independent legislators, given the negative and statistically significant coefficient on the
Team DD variable. In other words, members from team DD in Model S-10 are
226
significantly less likely to vote for cloture than members from the pivotal team DR (odds
ratio = 0.853, exp(-0.159)=0.853).
One additional finding remains to be discussed—the voting behavior of
Independents across the estimation results. In all but a handful of the models estimated
across Tables 6-2 (House, Final Passage), 6-3 (Senate, Final Passage), 6-4 (Senate,
Cloture Votes), and 6-7 (Senate, Cloture Votes with House contingency), I cannot reject
the null hypothesis that the coefficient on the odds that Independents vote differently than
the baseline group is zero (even if I widen the confidence intervals to 90%). Those few
models where the coefficient is statistically significant, though, deserve to be highlighted
and their implications considered. In the Model S-8 from Table 6-4 on Senate cloture
votes, the results indicate that under a Republican president and Democratic Senate
majority that Independent legislators are less likely to vote for cloture than the baseline
RR team (log odds =-0.724). A negative and statistically significant coefficient on
Independents is evident in Model S-11 from Table 6-7 as well. In this model of cloture
voting given a Republican president, Democratic Senate, and Democratic House reveals
log odds of -1.075 for Independents in comparison to RR legislators. These results imply
that under these particular conditions Independent legislators are not part of the cloture
coalition.
Alternatively, two models from Table 6-7 demonstrate positive and statistically
significant coefficients on the Independent legislators‘ variable (Models S-9 and S-12).
In other words, under a Republican president and Senate with a Democratic House
(Model S-9) or a Republican president with a Democratic Senate and Republican House
(Model S-12), the odds ratio that Independents vote with the majority party in the Senate
227
to close debate on the floor are higher than the pivotal legislators (DR legislators in the
first model and RR legislators in the second). In both models, the coefficient on
Independent legislators is larger and more precise than for the theoretically expected
pivotal team (DD for Model S-9 and RD for Model S-12). In other words, it appears that
the majority party in the Senate under these particular conditions may entice Independent
legislators to aid them on motions to invoke cloture instead of the predicted minority
party intergovernmental team. These findings are only suggestive, though, since the
number of senators who identify as Independents and place votes under these conditions
across the time span of the study is low (27 votes for Model S-9 and 144 votes for Model
S-12, in comparison to >1,000-2,000 votes for the four intergovernmental teams for both
models).
In this results section, I have estimated a number of different models assessing the
various configurations of national institutions and theoretical pivotal intergovernmental
teams. Overall, I find support for five of my six hypotheses across the House and the
Senate for how individual legislators cast their votes and the resulting policy and
procedural coalitions. In addition, I find the strongest evidence for the Senate in the
examination of cloture votes, which is the basis of the theoretical argument. The results
are not completely supportive of the theoretical argument, however. In particular,
Independent legislators and unified Republican government appear to defy the theory.
The two likely reasons for these challenges are that the individual-level theory assumes
away Independent legislators and ignores the influence of bicameralism on policy
coalition formation in each chamber—two potential areas of future research.
228
DISCUSSION AND CONCLUSION
In this chapter I undertake an analysis of two separate datasets to test the
individual-level hypotheses that emerge from the theory of intergovernmental delegation
in Chapter 2. Overall, I find support for the hypotheses, with one exception: when there
is a Republican president, a Republican Senate majority, and a Republican House
majority. In this circumstance, DR legislators help Republicans close floor debate more
so than do DD legislators, which were the expected pivotal legislators.
The results from this chapter are a useful addition to the literature on
centralization and decentralization by providing an examination of the extent to which
state authority allocation in national law influences policy and procedural coalition
formation. Specifically, hypotheses generated from a formal model focused exclusively
on state authority allocation and intergovernmental delegation by House and Senate
members are supported. The consistent findings suggest the need for work on the extent
to which this type of coalition formation and the resulting pivots influences the degree of
decentralization in national law. In fact, Chapter 4 does just this by examining the impact
of these pivotal legislators on decentralization over time and across policies. Taken
together, then, these empirical analyses point to the likelihood that if intergovernmental
context is overlooked in policymaking, that pivotal legislators and federal delegation
design will be misidentified.
This chapter also contributes to a growing body of literature on cloture voting in
the Senate. Early scholars focused on why legislators would choose to incorporate
cloture into the procedures of the chamber, the history of filibustering and invoking
cloture, and the benefits of changing the size of policy coalitions for individual legislators
229
and minority parties (e.g., see Oppenheimer 1995, Binder 1998, Groseclose and Snyder
2000, Wawro and Schickler 2006, and Koger 2010). Scholars who assess, either
theoretically, empirically, or both, which legislators vote to close debate have included
Cox and Poole (2002) with party effects, Lee (2006) with regional coalitions, and Butler
and Sempolinski (2010) based on non-policy determinants. In addition, and often less
directly, many spatial voting models such as Krehbeil (1997) or Enelow and Henich
(1984) consider the identification of the pivotal legislator, including the filibuster pivot.
By including a consideration of legislator‘s intergovernmental context, the filibuster pivot
is not the legislator just beyond some median when the legislator‘s ideal points are
aligned from left to right. Instead, the filibuster pivot depends on which legislators are on
the pivotal intergovernmental team.
The limitations of this chapter are related to the fact that I use party labels as a
proxy for the location of the ideal points of the legislators, the state leadership, and the
national executive branch and that the previously constructed theory ignores
bicameralism. A more refined measure, if incorporated into the theory, may be able to
more specifically determine the pivotal legislators, instead of a team of potentially pivotal
legislators, as is done here. To be able to assess the predictive power of my theory in
comparison to Krehbiel‘s (1998) pivotal politics theory with respect to the filibuster
pivot, though, requires more precise estimations of ideal points across all three sets of
actors. Shor, Berry, and McCarty (forthcoming) may provide just such data.
Regardless, in most of the analyses, I find the Senate majority party gains the
additional votes needed to invoke cloture from the pivotal teams predicted by my theory
of intergovernmental delegation. In only one model—that of a unified Republican
230
government—is there little support in the data for the theory. Perhaps under unified
government, Republican senators can more easily compel DR legislators to vote
alongside them on motions to invoke cloture when a Republican is in the White House
and the House majority is also Republican than DD legislators. This pressure may be
more credible because a Republican House is less likely to balk at the provisions in a
Republican Senate bill. Alternatively, perhaps DR legislators, during periods of unified
Republican national government, must strive to look more conservative, or more
Republican-like, to retain elected office. Underlying this alternative coalition formation
process is the opportunity for the Republican majority to centralize authority with the
national executive branch without having to decentralize some portions of the policy to
appease the pivotal DD legislators (who strictly prefer to decentralize in this condition).
There are two problems with the aforementioned possibilities. First, why is
majority pressure on mismatched (DR legislators, or alternatively, RD legislators) more
credible under unified Republican government and not under unified Democratic
government? Models S-3 and S-4 in Table 6-4 indicate that the Democratic majority
under unified Democratic national government gains the support of the predicted RR
legislators more often than RD legislators. And, second, if Republicans are somehow
better at pressuring these mismatched DR legislators, since in Models S-1 and S-2 from
Table 6-4 reveal a positive coefficient on the pivotal DR legislators under a Democratic
president with a Republican Senate majority, why do Republican majorities with a
Democratic House (Model S-9, Table 6-7) not work in the same fashion? In sum, this
chapter produces almost as many questions as it addresses, particularly with respect to
coalition formation in the Senate and bicameralism, that deserve further study.
231
Finally, the tests included in this chapter span, not only three decades, but also
many different policies with a broad range of degrees of decentralization of authority to
the states. What this study fails to do is to assess whether particular legislators vote for
centralization versus decentralization. There is one major reason for this omission. In
the intergovernmental theory in Chapter 2, coalition formation depends on the difference
in state authority allocation between a status quo and the policy reform offered in a bill.
Since I do not have the change in decentralization, I cannot analyze the extent to which
different types of legislators vote for or against a bill. This type of study deserves further
attention.119
In conclusion, the findings in this chapter suggest that previous studies ignoring
the intergovernmental context of coalition bargaining in Congress may overlook a
significant determinant of policy and cloture coalition formation—bargaining over the
degree of authority allocated to the states. This conclusion has significant implications
for specific policy areas, such as public health policy, including that a health policy,
while possibly expertly crafted with respect to techniques to improve health care, public
health outcomes, or specific prevention goals, may also need to be designed (with respect
to the intergovernmental nature of the authority relationships in it) to deal with how the
House majority party faces only a simple majority vote for final passage, but that the
Senate majority party must bargain with a pivotal minority party intergovernmental team
to successfully pass a policy.
119
In the empirical analyses of votes on final passage in the House and Senate, I include a control variable
of the degree of decentralization in the law and find that the coefficient on the variable is positive but not
statistically significant across any of the models. This finding suggests that it is the change in state
authority allocation that influences how individual legislators vote.
232
REFERENCES
Binder SA and Smith SS. 1998. ―Political Goals and Procedural Choice in the Senate.‖
Journal of Politics, 60 (May): 398-416.
Butler DM and Sempolinksi J. 2010. ―Non-policy Determinants of Legislators‘
Procedural Votes: Evidence from Vote Switching between Cloture and the Underlying
Motion,‖ Paper presented at the American Political Science Association meeting,
Washington D.C.
Cox GW and McCubbins MD. 2007. Legislative Leviathan, 2nd ed. New York:
Cambridge University Press.
Cox GW and Poole KT. 2002. ―On Measuring Partisanship in Roll-Call Voting: The U.S.
House of Representatives, 1877–1999.‖ American Journal of Political Science 46: 477–
89.
Enelow JM and Henich MJ. 1984. The Spatial Theory of Voting: An Introduction.
Cambridge: Cambridge University Press.
Groseclose T and Snyder J. 1996. ―Buying Supermajorities.‖ American Political Science
Review 90(2):303–15.
Klarner CE. 2003. ―Measurement of the Partisan Balance of State Government.‖ State
Politics and Policy Quarterly 3 (Fall): 309-19 with updated data at
http://academic.udayton.edu/sppq-TPR/klarner_datapage.html.
Koger G. 2010. Filibustering: A Political History of Obstruction in the House and
Senate. Chicago: University of Chicago Press.
Krehbiel K. 1998. Pivotal Politics: A Theory of U.S. Lawmaking. Chicago: University of
Chicago Press.
Lee FE. 2000. ―Senate Representation and Coalition Building in Distributive Politics,‖
American Political Science Review 94(1):59-72.
Oppenheimer, Bruce I. 1985. ―Changing Time Constraints on Congress: Historical
Perspectives on the Use of Cloture.‖ 3rd ed. in Congress Reconsidered, ed. LC Dodd and
BI Oppenheimer. Washington: Congressional Quarterly, pp. 393–413.
Shor B, Berry C, McCarty N. (forthcoming). ―A Bridge to Somewhere: Mapping State
and Congressional Ideology on a Cross-institutional Common Space‖ Legislative Studies
Quarterly (forthcoming as of May 2011).
Wawro GJ and Schickler E. 2006. Filibuster: Obstruction and Lawmaking in the U.S.
Senate. Princeton: Princeton University Press.

233
Woolley J and Peters G. 2009-2011. The American Presidency Project. Data retrieved
April 15-May 15, 2011 from http://www.presidency.ucsb.edu/index.php.
234
Chapter 7
Conclusion
SUMMARY
In my dissertation, I study the conditions under which Congress allocates more or
less policy authority to the states. The flexibility of the Constitution along with
expansive judicial interpretations allow Congress to act as the principal, where the states
along with the national executive branch act as potential agents, as they craft policy. This
creates a federal design dilemma. How much authority should Congress keep at the
national level versus delegate to the states? Although many scholars study how Congress
delegates authority, no previous work considers how this delegation changes when the
fifty states are also considered as agents of Congress. Scholars in federalism and public
policy, who provide explanations for decentralization of authority, fail to consider what I
call the intergovernmental context—namely legislators come from specific states and
consider how their state will implement policy if authority is delegated to the states.
Legislation and delegation of authority provide the context for the operation of the
public health system (Wing 2003, Turnock 2004), but the specific ways in which this
legal framework shapes public health practice remain understudied. Which level of
government has policy authority is central to public health practice and the structure of
public health systems. Whether states or the federal government are the lead, the support,
or sole actors involved in a policy alters the ability of public health practitioners to do
235
their work. Varying the amount of authority of federal and state bureaucracies changes
the intent, the services, and the outputs of the underlying program. For instance, when the
states have more authority in a program, the average number of eligible individuals tends
to be smaller (with variance across states) than when the federal government has more
authority (Rom, 2004).
In this study, I carefully considered how Congress makes decisions about whether
to give the states more or less authority in public health, health, and other national
policies. In Chapter 2 of my dissertation, I developed two formal models of how
Congress (aggregate-level model) and how individual legislators in Congress (individual-
level model) intergovernmentally delegate authority to the states and the national
executive branch. I argued that the location of the ideal points of the actors involved and
uncertainty over these ideal points during implementation were crucial to how legislators
formed successful policy coalitions in the House and the Senate, and how Congress
allocated authority to the states in national law.
To be able to test this theory across a sample of laws that delegate authority to
state and national actors, I developed a novel dataset in Chapter 3. This dataset included
179 pieces of significant legislation from 1973 through 2009 containing over 24,000
coded provisions. My data indicate that delegation to state level implementers occurs in
almost every significant piece of domestic legislation passed in the time period of the
study.
After constructing this dataset, I tested the hypotheses that result from the
aggregate Congressional delegation model and found that, as expected, as the distance
between a pivotal legislator in Congress and his state increases, less authority is delegated
236
to the states. The results in Chapter 4 also indicate support for hypotheses about state and
national political uncertainty. Specifically, as uncertainty over the party that will be in
power in the pivotal state during implementation of the law increases (state political
uncertainty), significantly less authority is delegated to the states. There was also
minimal support for the fact that as national political uncertainty increases, more
authority is delegated to the states. I also found, unexpectedly, that as the distance
between Congress and the national executive branch increases that delegation to the
states also decreases. This result, which is contrary to my theoretical argument may be
the result of the blunt measure of either ideal points (party label) or joint partnerships
(one category)—both of which I discuss in detail below.
Although the aggregate analyses exhibited support for the theory, I also relied on
an in-depth examination of one case in order to gain insight into whether the mechanisms
in the theory are at work in an actual case and to more fully appreciate what the large-N
results mean in the complex world of politics and health policy. By looking at the
process of how legislators crafted and debated health insurance reform in 2009-2010, I
discovered that the relationship between individual legislators and their governors was
paramount, as was the difference in ideal outcomes of legislators and the national
executive branch. Congress did think of the states as potential implementers of national
law and considered them an alternative to national executive branch agencies. Moreover,
changing the structure of intergovernmental delegation options offered legislators in the
House and the Senate opportunities to coalesce around policy choices.
In addition to support for the underlying mechanisms of my theory, the case study
highlighted the importance of intergovernmental context, delegation to the states, and
237
differences in the institutional rules between the House and the Senate for policy
outcomes. The differences in the House and Senate health insurance reform proposals
and ultimate degree of state authority allocation in the law are consistent with the
intergovernmental theory of federal policy design. Namely, because of the ―razor edge‖
60 votes in the Senate and unified Democratic government, the Senate bill decentralized
authority and due to the simple majority procedures in the House, the House bill
centralized authority for the provisions in health insurance reform. One component of the
health insurance reform debate—the dynamics of the interaction between the House and
Senate emerged from the interviews with key policy elites as crucial to the resulting
policy. I returned to these House-Senate differences at the end of the second empirical
chapter (see below).
What remained in this project was to test the individual-level implications of the
theoretical argument, given the insights afforded by the aggregate analyses and the case
study. In particular, the hypotheses that emerged from the theory included the
intergovernmental team makeup of successful policy coalitions in the House and the
Senate under different conditions. In Chapter 6, I collect additional data on how
individual legislators vote across the significant laws from Chapter 3, as well as how
Senators vote on cloture across the same time frame. I find strong support for the
individual-level hypotheses in this final chapter. In the House, majority party
intergovernmental teams form successful policy coalitions more often than other groups
of teams.
In the Senate, across all but one condition, majority party intergovernmental
teams gain the votes needed from specific minority party legislators to reach 60 votes and
238
successfully invoke cloture—those from the pivotal minority intergovernmental team
identified in my theory. Only when there is a unified Republican government, does my
argument fail to find support in this diverse data, leaving an interesting puzzle. In
particular, when there is a Republican in the White House and Republican majorities in
the House and the Senate, Senators work to gain votes from Democrats from states with
Republican governors (DR legislators), instead of the predicted Democrats from states
with Democratic governors (DD legislators). Under this particular condition, DD
legislators prefer to decentralize authority and DR legislators are indifferent because,
when using party label as a shortcut for preferences, the national executive branch and
the state are located in the same place. Why is it that Senators in a unified Republican
government bargain or entice other legislators differently than Senators within a unified
Democratic government? And, why is it that when there is a Republican in the White
House, a Republican majority in the Senate, and a Democratic majority in the House—
for which my theory predicts the same outcome as under unified Republican
government—do I find support for my theory, since it is, in this instance, DD legislators
whom I find vote more often for cloture with the Republicans?
Although this puzzle remains, overall, I find that my theory of intergovernmental
delegation better explains how Congress chooses to delegate authority in national law
than previous explanations, including that Republicans devolve, that partisan congruence
between national institutions and the average partisanship of the states matters for
decentralization of authority, that policy type determines delegation choices, and that
election years matter. Instead, it is a simple comparison (in the context of political
uncertainty) by a pivotal legislator as to whether his state, the national executive branch,
239
or a combination of the two will provide an outcome closer to his ideal point that
provides the best explanation in this new dataset.
CONTRIBUTION
My contribution to the political science literature, therefore, is to incorporate a
consideration of the intergovernmental context—namely that legislators come from
specific states and consider how their state will implement policy if authority is delegated
to the state level. Legislators compare potential policy outcomes at the state and national
level to their own preferences over outcomes. These preferences along with uncertainty
(as described below) determine their actions with respect to the federal design dilemma.
My results demonstrate the importance of recognizing the impact of national and state
political contexts in delegation decisions and explicitly modeling state and national
agents theoretically and empirically. This contribution informs scholarship in
congressional delegation, federalism, and public policy.
In addition to the contribution to the political science literature, the theory, data,
and results provide a foundation upon which additional scholarship in public health
politics and policy can be built. Intergovernmental partnerships are increasingly common
in public health policies. Since policy design affects implementation, it is crucial that
public health scholars and practitioners understand the politics that create these federal
partnerships. This project systematically investigated how Congress makes legislative
decisions in establishing federal-state partnerships. I delineated the conditions under
which Congress provides the states with more authority than the national executive
branch in federal-state partnerships. This project provides a first step to understanding
congressional intergovernmental strategies—informing research about how changes in
240
policy design influence population health outcomes over time. Without the conclusions
of this study, public health policy scholars overlook the importance of the
intergovernmental context of legislators in Congress in determining the national side of
the patchwork of public health policies.
In both sets of literatures, political science and public health, I also contribute to a
growing mixed methods approach to research. In this study I rely on an intensive coding
process of national laws, formal theoretic models, large-N aggregate and individual-level
analyses, and in-depth qualitative work to structure an examination of how Congress
deals with their federal design dilemma, using the strengths of each approach to address
the others weaknesses.
NEXT STEPS
This project leaves as many, if not more, questions than it answers. In particular,
there are three main areas of research I would like to explore in the future. First, I would
like to incorporate more complexity with respect to state responses to congressional
delegation. Second, it is important to gain a more nuanced understanding of the design of
joint partnership policies. And third, intra- and inter-chamber bargaining process with
respect to invoking cloture and designing policies should be explored further. I discuss
each of these next steps in more detail below.
Passive States
To the extent that this project assumes the states are passive recipients of national
dictates, I ignore the complexity and potential influence of state responsiveness to
Congress. Evidence from my case study provides support for my theoretical assumption
that Congress perceives of itself as the principal and the states as one potential
241
implementation agent, but I assume away any influence the states may have on this
process. In addition, if the states really are only passive actors in this process, why do
they—collectively through the National Governors Association, the National Conference
of State Legislatures, or individually—lobby Congress (e.g. see Haider 1974)? In
addition, why do the states actively lobby national executive branch agencies? The
obvious answer is that they either want to be winners or they are afraid of losing in policy
contests.
This intergovernmental lobbying activity has been described as a bargaining
process (Elazar 1972, Ingram 1977, Chubb 1985, Agranoff 2001, Woods and Bowman
2011). But, bargaining between which actors and at what time—the states and Congress,
the states and national executive branch agencies within previously formed joint
partnership policies, or bargaining between all three?
Moreover, the states have more than one tool at their disposal for pressuring or
bargaining with national institutions of government, including, federal lawsuits, ignoring
federal-grants-in-aid, and ignoring (or attempting to redefine) national regulations. Each
of these instruments of state rejection of national law has been demonstrated in the
aftermath of the national health insurance reform of 2009-2010. The states filed federal
lawsuits regarding the constitutionality of the individual mandate for health insurance
coverage and burden on the states for the Medicaid expansion, many state legislatures
and public ballot measures attempted to change the individual mandate implementation in
their state, and many states refused to implement other portions of the law, such as the
high-risk pool.
242
Overall, is this bargaining done ex ante, such as lobbying or filing lawsuits before
a policy is passed, ex post, such as lobbying during implementation, filing lawsuits after
enactment, refusing to act as implementers, or both? And, to what extent does bargaining
influence how Congress delegates authority across governmental levels and how much
discretion agents are given? In future work, I would like to delve into this interaction
between the states and national institutions by first conducting case studies comparing
how the health reform implementation unfolds with other policies, such as No Child Left
Behind or the American Recovery and Reinvestment Act, which also incurred state-level
resistance. In this project, I would like to use insights gained from the case studies to
develop a formal theoretic model of the three sets of actors bargaining over state-level
authority, and finally test the hypotheses that emerge on data that build on my dataset in
Chapter 3.
Joint Policies
The process of constructing the dataset in Chapter 3 revealed the variety of joint
partnerships that Congress has crafted over the years. As described in that chapter,
Congress can delegate implementation to the states and use national executive branch
agencies simply to dole out federal money, or it can delegate implementation to national-
level actors and require sub-delegation to the states, or even delegate to both sets of
actors different aspects of a policy, among other options. The ways in which Congress
structures these joint policies is likely to be crucial for the ultimate policy outcomes, and,
therefore, is an additional avenue of for future research. In fact, initial work on
Congress-National-State bargaining described in the previous section indicates the
possibility that understanding these joint policies is crucial for modeling the interactions
243
between these actors (and the resulting policy outcomes). For instance, if Congress fails
to delineate the boundaries and timing of each agent‘s actions, there can be an unending
cycle of strategic choices on the part of the states and the national agents resulting in no
implementation.
Building on the data in Chapter 3, I plan to incorporate more information about
the structure of joint partnership provisions. This coding process will need to include
how much discretion the states and the national actors have in these provisions and which
agent acts first as defined by law. The coding must rely on improved definitions of
discretion and delegation from previous studies and has not yet been undertaken.
Cloture, Bargaining, and the House
Although seemingly unrelated to the previous sections, Chapter 6 left us with a
puzzle—why is it that a Republican House can change cloture bargaining in only one
circumstance, unified Republican government, but not in others. The two previous
avenues for research emerge from the aggregate-level model, which in turn, relies on a
pivotal legislator. To identify this pivotal legislator, I utilize an individual-level model of
legislators bargaining in the House and the Senate in Chapter 2. I assume these chambers
operate in a vacuum, when in fact they often interact with each other. The results from
Chapter 6 point to the importance of considering how the House and Senate interact may
influence Senate bargaining and coalition formation with respect to attaining 60 votes to
invoke cloture. The final plan for next research steps includes a more thorough
consideration of super-majoritarian coalition formation in the Senate, given future
interactions with the House over the policy.
244
CONCLUSION
In this project, I examine what determines whether Congress keeps authority at
the national level or sends it out to the states? The degree of state authority in a policy is
an issue that touches on many topics of interest; yet political science, public policy, and
public health scholars have failed to give it serious consideration both theoretically and
empirically. By using multiple methodological approaches, I find that Congress allocates
authority to the states based on their intergovernmental context—including the
relationship between individual legislators and their states, legislators and the national
executive branch, and uncertainty over the party that will be in power at each level during
implementation of a policy.
245
REFERENCES
Agranoff R. 2001. ―Managing within the Matrix: Do Collaborative Intergovernmental
Relations Exist?‖ Publius 31:31-56.
Chubb, JE. 1985. "The Political Economy of Federalism." APSR 79(4):994-1015.
Elazar DJ. 1972. American Federalism: A View from the States. New York: Crowell.
Haider D. 1974. When Governments Come to Washington: Governors, Mayors, and
Intergovernmental Lobbying. New York, Free Press.
Ingram H. 1977. ―Policy Implementation through Bargaining: the Case of Federal
Grants-in-Aid.‖ Public Policy 25(4):499-526.
Rom MC. 2004. ―Transforming State Health and Welfare Programs,‖ in Virginia Gray
and Russell L. Hanson (eds) Politics in the American States: A Comparative Analysis 8th
ed. Washington DC, CQ Press.
Turnock, B. J. 2004. Public Health: What It Is and How It Works. 3rd Edition. Boston:
Jones and Bartlett Publishers.
Wing, K. R. 2003. The Law and The Public’s Health. 6th Edition. Chicago: Health
Administration Press.
Woods ND and Bowman A O‘M. 2011. ―Blurring Borders: The Effect of Federal
Activism on Interstate Cooperation,‖ Am Pol Res XX(X):1-26.