Embed Size (px)
Citation preview
1 March 24, 2015
The Federal Reserve in the 21st Century
Models for Forecasting and Policy Analysis
Marc Giannoni, Assistant Vice President
Research and Statistics Group
The views expressed in this presentation are those of the
presenter and not necessarily those of the Federal Reserve
Bank of New York or The Federal Reserve System
2
Fed’s organization and mandate
Survey of Economic Projections (SEP)
How does monetary policy affect the economy?
Economic forecasts
Essential role of forecasts
Judgmental forecasts
Model-based forecasts
Monetary policy strategy
Optimal policy using models
Conclusion
Outline
3
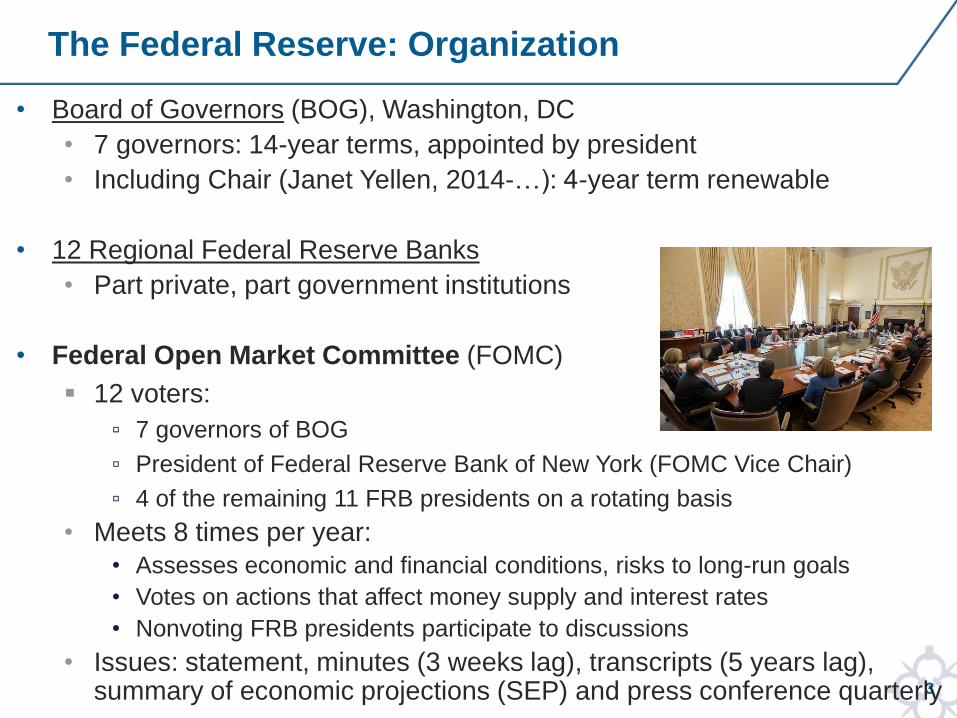
The Federal Reserve: Organization
• Board of Governors (BOG), Washington, DC
• 7 governors: 14-year terms, appointed by president
• Including Chair (Janet Yellen, 2014-…): 4-year term renewable
• 12 Regional Federal Reserve Banks
• Part private, part government institutions
• Federal Open Market Committee (FOMC)
12 voters:
▫ 7 governors of BOG
▫ President of Federal Reserve Bank of New York (FOMC Vice Chair)
▫ 4 of the remaining 11 FRB presidents on a rotating basis
• Meets 8 times per year:
• Assesses economic and financial conditions, risks to long-run goals
• Votes on actions that affect money supply and interest rates
• Nonvoting FRB presidents participate to discussions
• Issues: statement, minutes (3 weeks lag), transcripts (5 years lag), summary of economic projections (SEP) and press conference quarterly
4
General goals: foster economic prosperity and promote social welfare
More specific objectives are established by the government
Federal Reserve Act: provides statutory basis for monetary policy
Goals of monetary policy: Original language from 1913
“. . . to furnish an elastic currency, to afford means of rediscounting commercial paper, to establish more effective supervision of banking in the United States, and for other purposes.”
Goals of monetary policy: Amendment in 1977
“The Board of Governors of the Federal Reserve System and the Federal Open Market Committee shall maintain long run growth of the monetary and credit aggregates commensurate with the economy's long run potential to increase production, so as to promote effectively the goals of maximum employment, stable prices, and moderate long-term interest rates”
“maximum employment and stable prices” = Fed’s dual mandate
The Fed’s Mandate
5
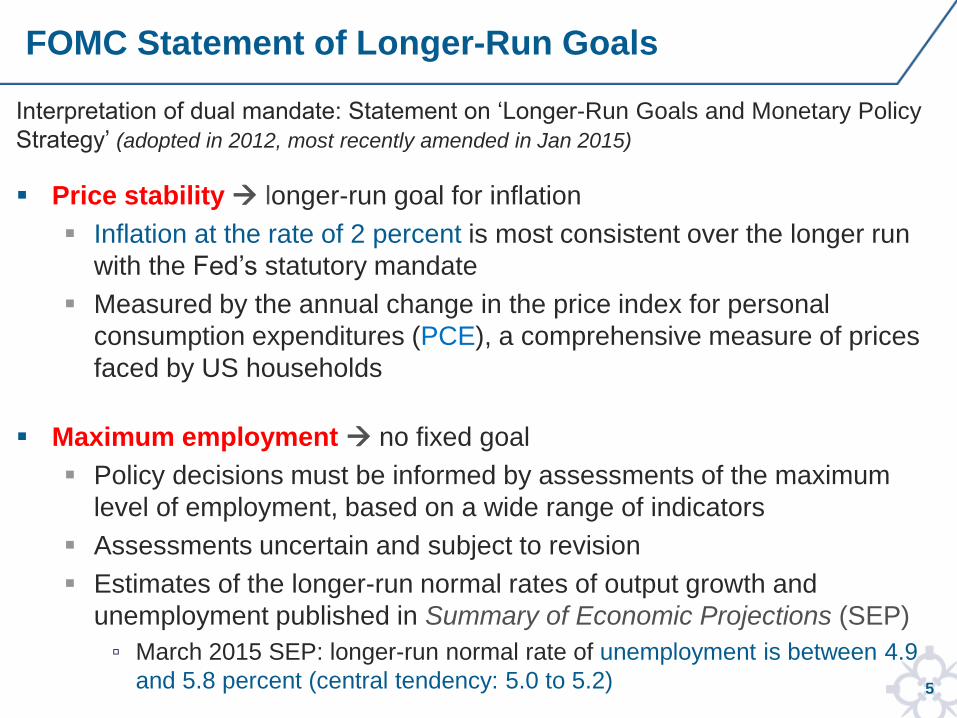
Interpretation of dual mandate: Statement on ‘Longer-Run Goals and Monetary Policy
Strategy’ (adopted in 2012, most recently amended in Jan 2015)
Price stability longer-run goal for inflation
Inflation at the rate of 2 percent is most consistent over the longer run
with the Fed’s statutory mandate
Measured by the annual change in the price index for personal
consumption expenditures (PCE), a comprehensive measure of prices
faced by US households
Maximum employment no fixed goal
Policy decisions must be informed by assessments of the maximum
level of employment, based on a wide range of indicators
Assessments uncertain and subject to revision
Estimates of the longer-run normal rates of output growth and
unemployment published in Summary of Economic Projections (SEP)
▫ March 2015 SEP: longer-run normal rate of unemployment is between 4.9
and 5.8 percent (central tendency: 5.0 to 5.2)
FOMC Statement of Longer-Run Goals
6
Prices act as the key mechanism for allocating resources
efficiently throughout the economy
If inflation is high, lenders are harmed because they can buy fewer
goods and services with their payments than they expected. If
inflation is low, borrowers are harmed
If inflation is high, demand for goods and services is pushing hard
on available resources. If inflation is low there is not enough
demand to fully use the available resources in society
When inflation is stable and neither too high nor too low over
time, it does not materially enter into the decisions of households
and firms
The central bank has primary influence over the long-run
behavior of the general price level
Importance of “well-anchored” inflation expectations around levels
consistent with objectives of price stability
Why Price Stability and What Can the Fed Do?
7
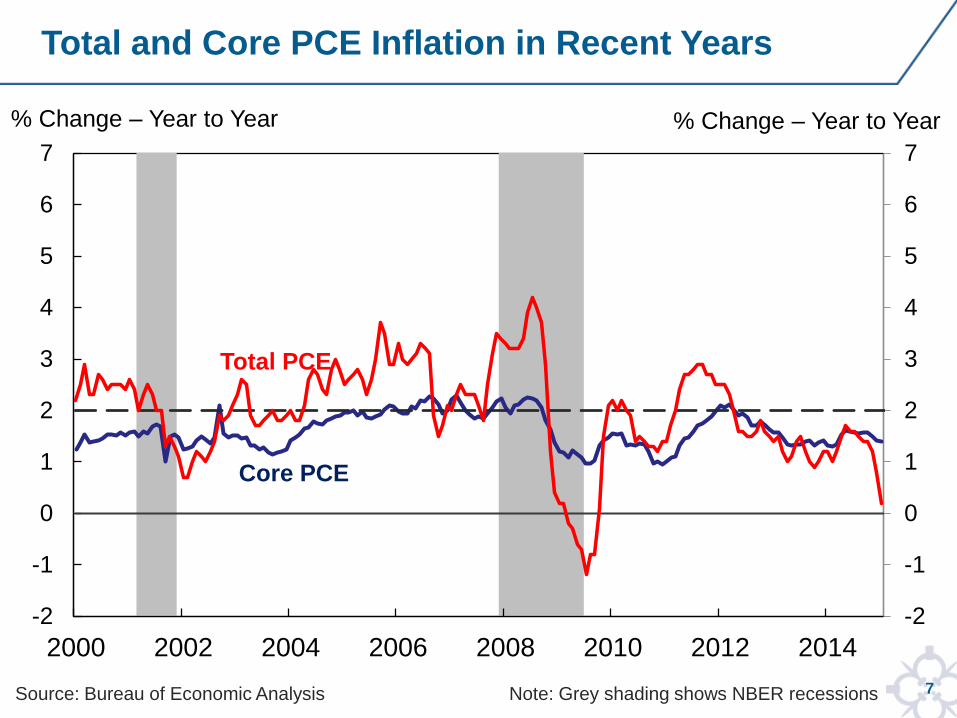
Total and Core PCE Inflation in Recent Years
-2
-1
0
1
2
3
4
5
6
7
-2
-1
0
1
2
3
4
5
6
7
2000 2002 2004 2006 2008 2010 2012 2014
% Change – Year to Year
Total PCE
Core PCE
% Change – Year to Year
Source: Bureau of Economic Analysis Note: Grey shading shows NBER recessions
8
Social welfare improves as human resources are utilized more
fully and efficiently
Long-run employment and output are determined by:
Population growth, technological progress, preferences for saving,
risk and work effort
Not by monetary policy
In the short-run, the economy goes through business cycles
Output and employment fluctuate above or below long-run levels
(changes in demand relative to supply)
Monetary policy can help ‘smooth’ these fluctuations, and thus
stabilize employment and incomes
Why Maximum Employment and What Can the Fed Do?
9
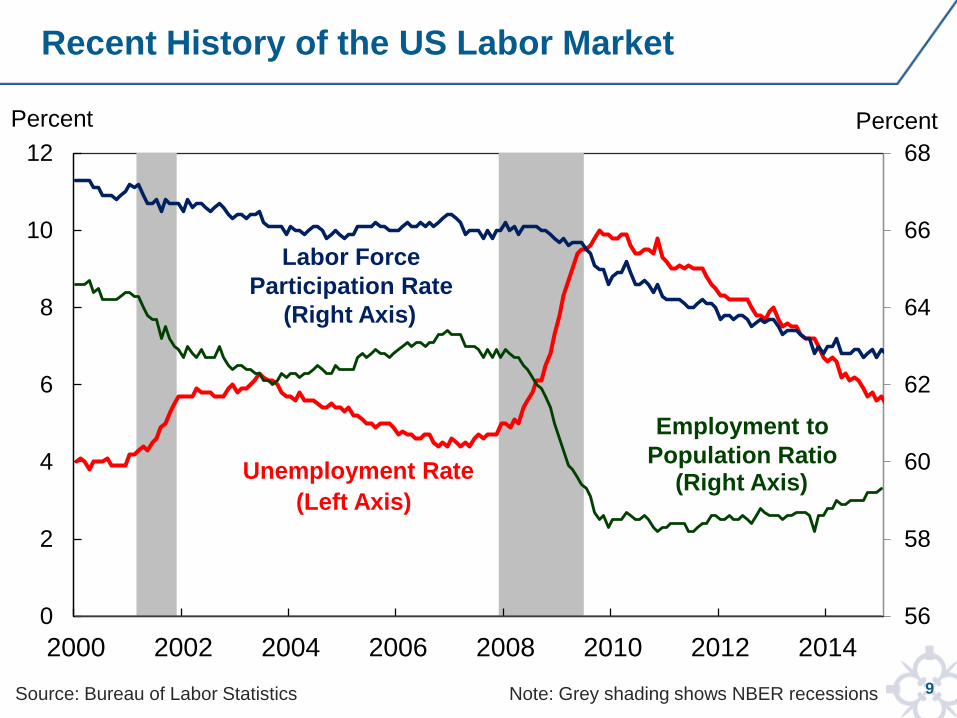
Recent History of the US Labor Market
56
58
60
62
64
66
68
0
2
4
6
8
10
12
2000 2002 2004 2006 2008 2010 2012 2014
Percent
Unemployment Rate
Labor Force
Participation Rate
Percent
Source: Bureau of Labor Statistics Note: Grey shading shows NBER recessions
(Left Axis)
(Right Axis)
Employment to
Population Ratio (Right Axis)
10
The FOMC has fallen short on both objectives since the Great
Recession
Inflation has been running below the 2% longer-run objective of
the Committee
Unemployment remains above estimates of its longer-run normal
level, although the gap is currently narrow
FOMC participants’ forecasts for unemployment and inflation
indicate that both objectives are expected to be met over the
medium term
Is the FOMC Achieving its Objectives?
11
Every other FOMC meeting (March / June / September / December)
Each FOMC participant submits economic projections:
Based on each FOMC participant’s assessment of appropriate
monetary policy
For each FOMC participant, projections combine both forecast of
evolution in economic conditions and preferred policy path (which
may differ from policy path chosen by the committee as a whole)
Longer-run projections represent each participant’s assessment of
the rate to which each variable would be expected to converge
under appropriate monetary policy and in the absence of further
shocks to the economy
Survey of Economic Projections (SEP)
12
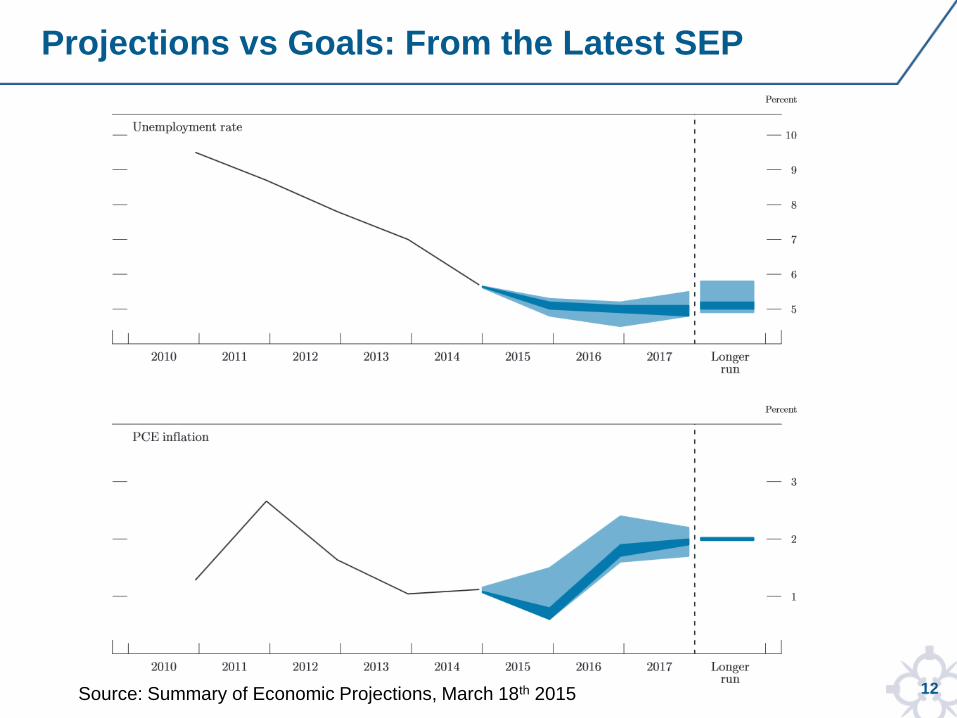
Projections vs Goals: From the Latest SEP
Source: Summary of Economic Projections, March 18th 2015
13
What’s in FOMC’s Crystal Ball?
From the March 2015 FOMC statement :
The Committee expects that, with appropriate policy
accommodation, economic activity will expand at a
moderate pace, with labor market indicators continuing to
move toward levels the Committee judges consistent with its
dual mandate.
Inflation is anticipated to remain near its recent low level in
the near term, but the Committee expects inflation to rise
gradually toward 2 percent over the medium term as the
labor market improves further and the transitory effects of
energy price declines and other factors dissipate.
Note: FOMC expectations are based on the presumption that
there will be appropriate policy accommodation.
14
Fed sets the Federal funds rate (FFR)
Current and expectations of future FFR affect financial conditions:
Other interest rates and borrowing costs: short-term interest rates (e.g.,
Treasury bills), longer-term interest rates (e.g., Treasury bonds,
mortgages, corporate bonds)
Foreign exchange value of the dollar
Asset prices (e.g., stocks, …)
Amount of lending
Financial conditions influence households’ and businesses’ spending
decisions, and hence aggregate demand, production, employment,
and ultimately inflation
But policy affects the economy with “long and variable lags” (M. Friedman)
How Does Monetary Policy Affect the Economy?
15
Federal funds rate (FFR)
Rate at which banks borrow and lend reserves overnight in federal
funds market
Reserves = deposits that banks hold in their account at Federal
Reserve
FOMC sets target for FFR
Chooses target rate that it believes is most consistent with its
monetary policy objectives
FRBNY increases (decreases) the level of reserves in order for
actual rate to be close to target
Buys (sells) securities from (to) banks in exchange for reserves
Policy Instruments – Conventional Policy
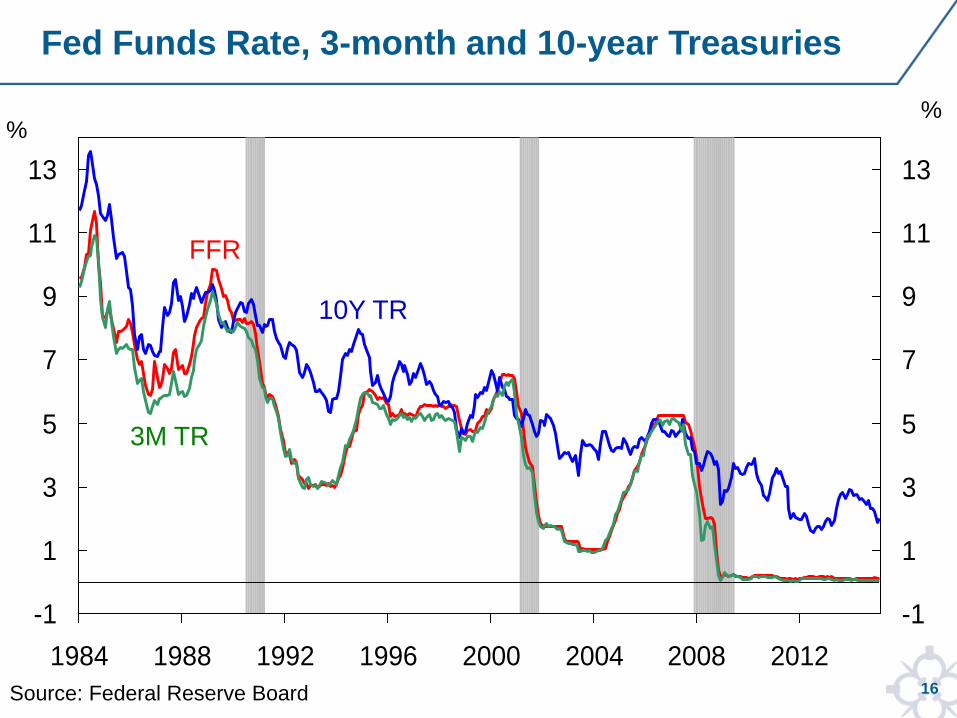
16
-1
1
3
5
7
9
11
13
1984 1988 1992 1996 2000 2004 2008 2012
-1
1
3
5
7
9
11
13
% %
Source: Federal Reserve Board
FFR
10Y TR
3M TR
Fed Funds Rate, 3-month and 10-year Treasuries
17
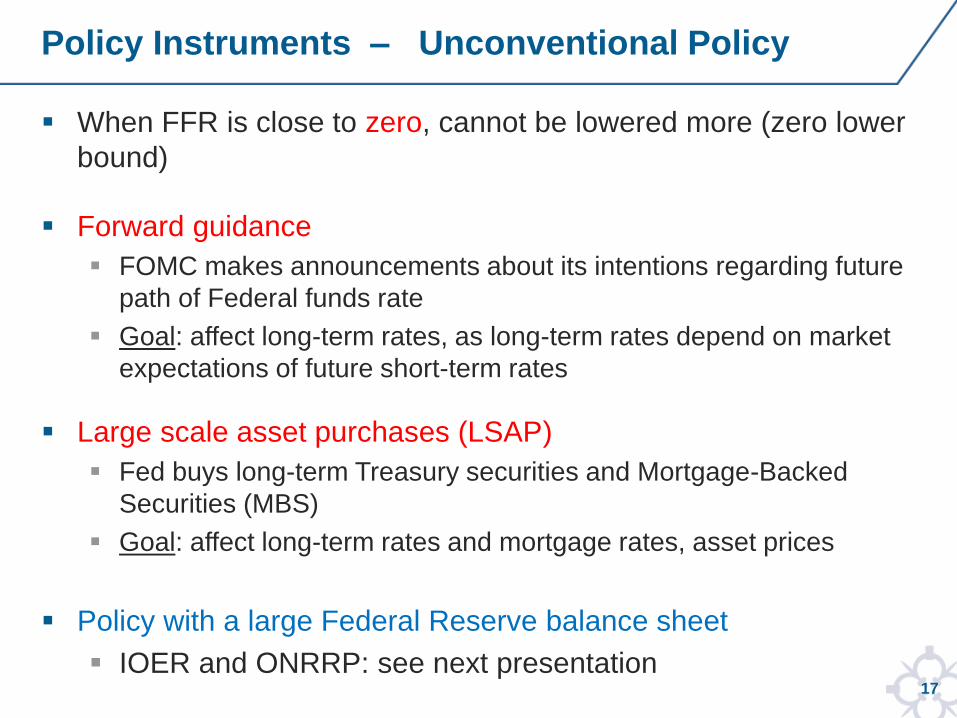
When FFR is close to zero, cannot be lowered more (zero lower
bound)
Forward guidance
FOMC makes announcements about its intentions regarding future
path of Federal funds rate
Goal: affect long-term rates, as long-term rates depend on market
expectations of future short-term rates
Large scale asset purchases (LSAP)
Fed buys long-term Treasury securities and Mortgage-Backed
Securities (MBS)
Goal: affect long-term rates and mortgage rates, asset prices
Policy with a large Federal Reserve balance sheet
IOER and ONRRP: see next presentation
Policy Instruments – Unconventional Policy
for internal use only
Economic Forecasts
19
Because policy has persistent and lagged effects, the FOMC
needs to assess:
The current state of the economy
How it is likely to evolve, conditional on a particular policy path
Economic forecasts are essential for conduct of policy
A forecast = set of numbers + narrative
What assumptions are behind the forecast?
What are the risks to the central forecast?
▫ alternative “scenarios”
Essential Role of Forecasts
20
Judgmental forecasts
Bottom-up
Model-based forecasts
Empirical models (VAR, Factor models)
Structural models (DSGE)
Large-scale semi-structural: e.g., FRB/US
Analysis of ‘risks’ around modal scenario
Types of Forecasts
21
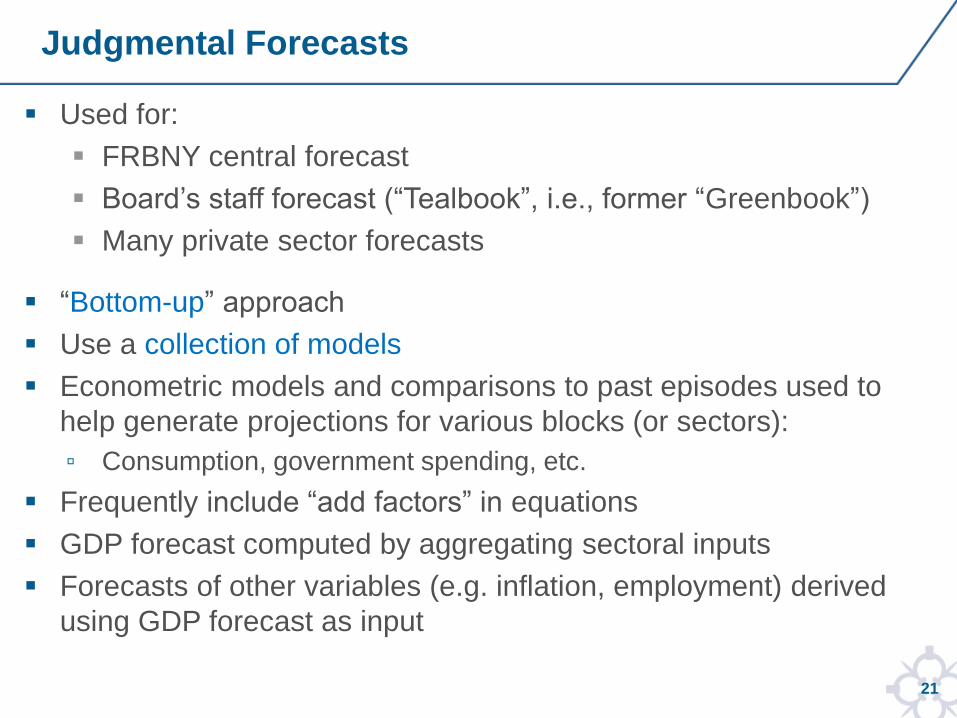
Used for:
FRBNY central forecast
Board’s staff forecast (“Tealbook”, i.e., former “Greenbook”)
Many private sector forecasts
“Bottom-up” approach
Use a collection of models
Econometric models and comparisons to past episodes used to
help generate projections for various blocks (or sectors):
▫ Consumption, government spending, etc.
Frequently include “add factors” in equations
GDP forecast computed by aggregating sectoral inputs
Forecasts of other variables (e.g. inflation, employment) derived
using GDP forecast as input
Judgmental Forecasts
22
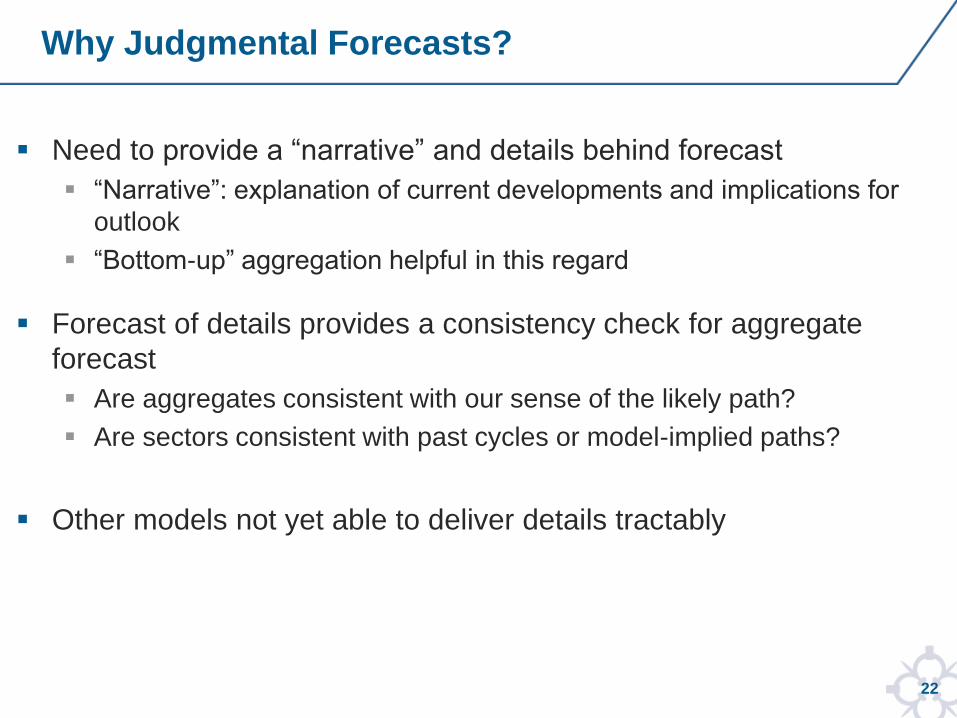
Need to provide a “narrative” and details behind forecast
“Narrative”: explanation of current developments and implications for
outlook
“Bottom-up” aggregation helpful in this regard
Forecast of details provides a consistency check for aggregate
forecast
Are aggregates consistent with our sense of the likely path?
Are sectors consistent with past cycles or model-implied paths?
Other models not yet able to deliver details tractably
Why Judgmental Forecasts?
23
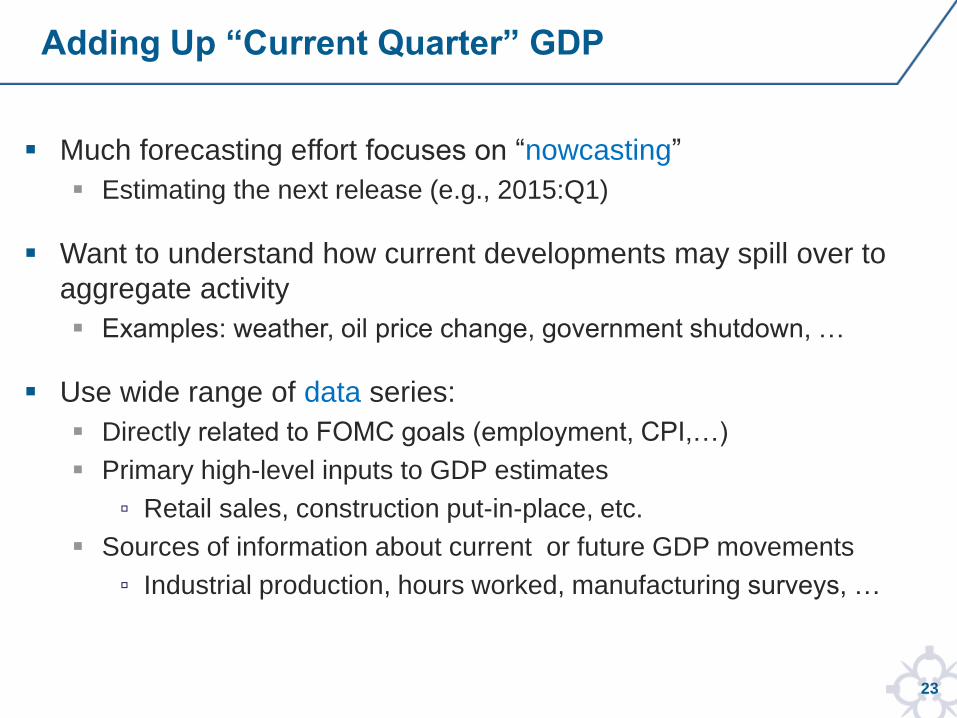
Much forecasting effort focuses on “nowcasting”
Estimating the next release (e.g., 2015:Q1)
Want to understand how current developments may spill over to
aggregate activity
Examples: weather, oil price change, government shutdown, …
Use wide range of data series:
Directly related to FOMC goals (employment, CPI,…)
Primary high-level inputs to GDP estimates
▫ Retail sales, construction put-in-place, etc.
Sources of information about current or future GDP movements
▫ Industrial production, hours worked, manufacturing surveys, …
Adding Up “Current Quarter” GDP
24
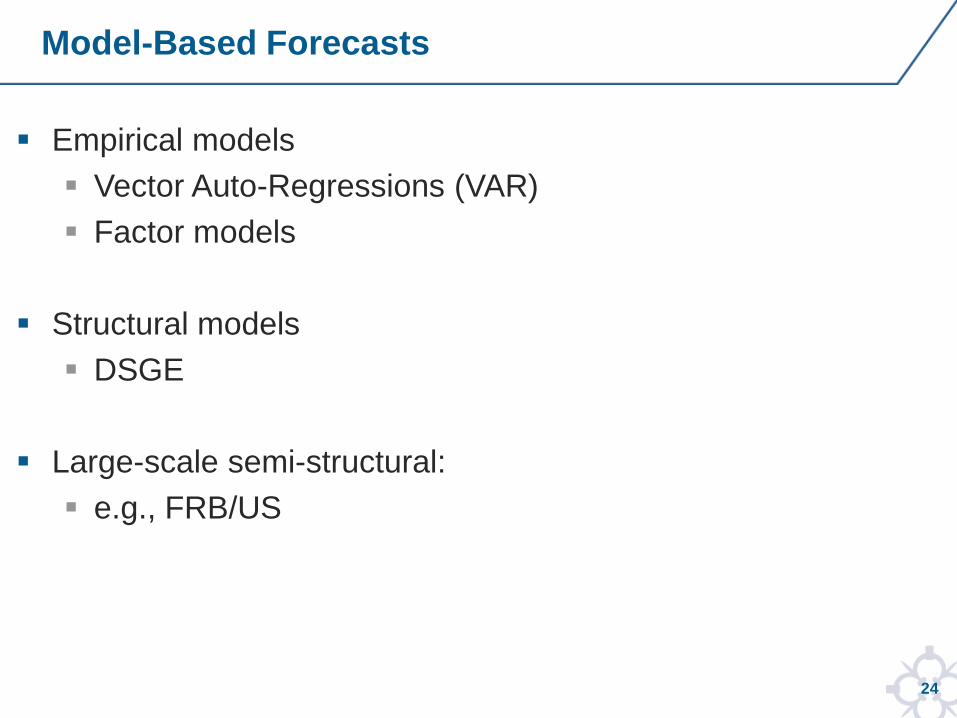
Empirical models
Vector Auto-Regressions (VAR)
Factor models
Structural models
DSGE
Large-scale semi-structural:
e.g., FRB/US
Model-Based Forecasts
25
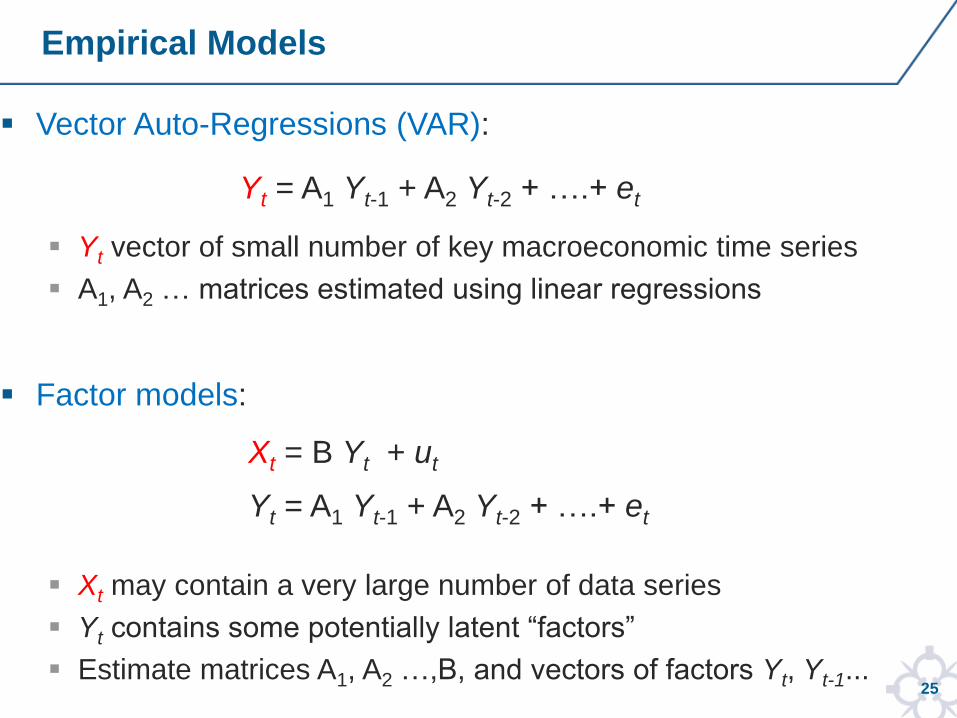
Vector Auto-Regressions (VAR):
Yt = A1 Yt-1 + A2 Yt-2 + ….+ et
Yt vector of small number of key macroeconomic time series
A1, A2 … matrices estimated using linear regressions
Factor models:
Xt = B Yt + ut
Yt = A1 Yt-1 + A2 Yt-2 + ….+ et
Xt may contain a very large number of data series
Yt contains some potentially latent “factors”
Estimate matrices A1, A2 …,B, and vectors of factors Yt, Yt-1...
Empirical Models
26
Exploit historical relationships between various data series
Impose few restrictions
Good to explain dynamic effects of shocks (e.g., FFR increase,
oil-price shock, …) on key variables
Factor models can trace impact of shocks on broad set of
variables
Provide relatively good forecasts
Downsides:
Black box: Don’t provide a “narrative”
Assume that historical relationship will continue to hold
May be inappropriate for alternative policy simulations
Why VARs or Factor Models?
27
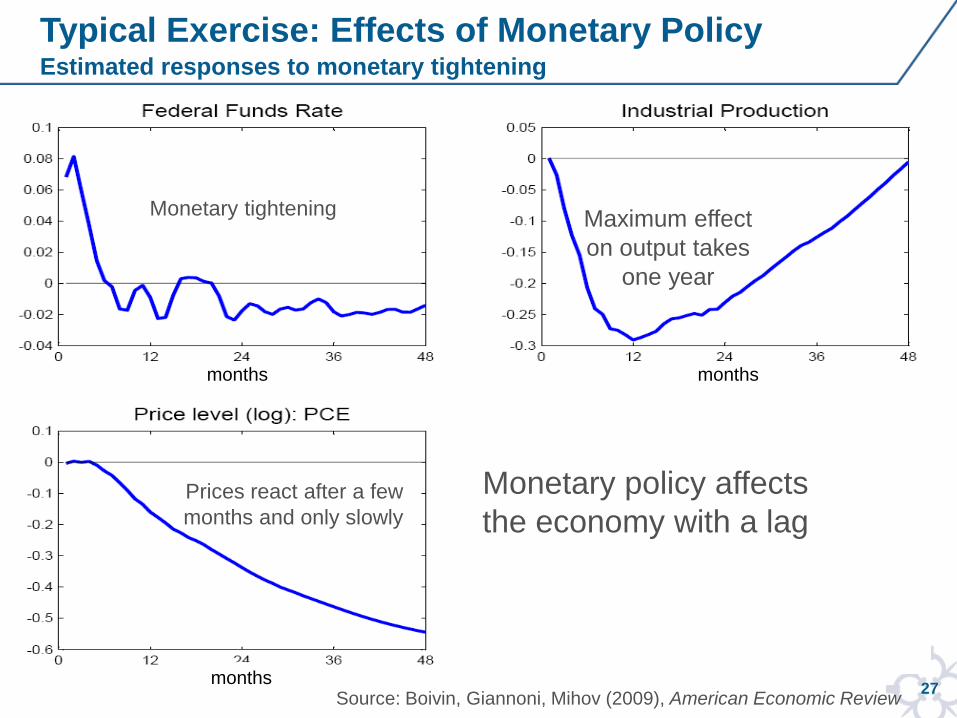
Typical Exercise: Effects of Monetary Policy Estimated responses to monetary tightening
Source: Boivin, Giannoni, Mihov (2009), American Economic Review
months months
months
Monetary tightening Maximum effect
on output takes
one year
Prices react after a few
months and only slowly
Monetary policy affects
the economy with a lag
28
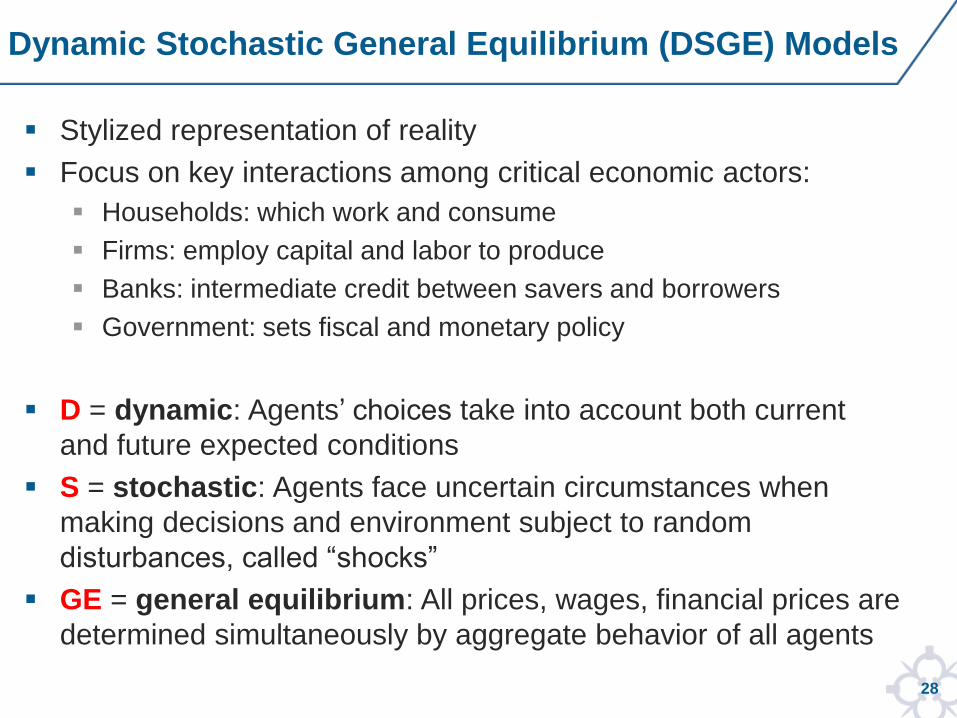
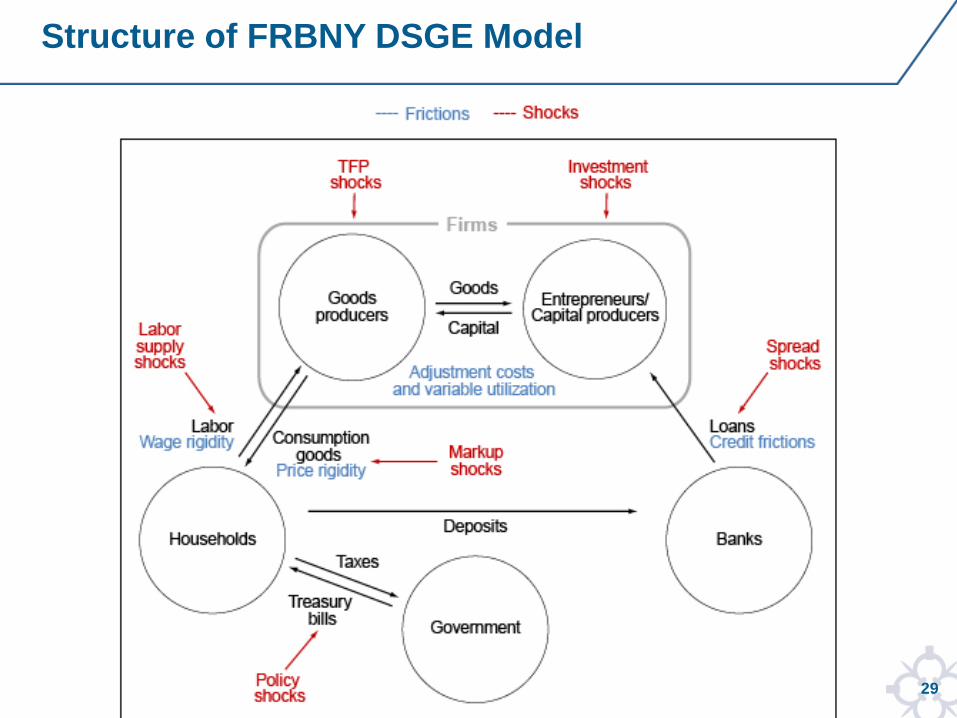
Stylized representation of reality
Focus on key interactions among critical economic actors:
Households: which work and consume
Firms: employ capital and labor to produce
Banks: intermediate credit between savers and borrowers
Government: sets fiscal and monetary policy
D = dynamic: Agents’ choices take into account both current
and future expected conditions
S = stochastic: Agents face uncertain circumstances when
making decisions and environment subject to random
disturbances, called “shocks”
GE = general equilibrium: All prices, wages, financial prices are
determined simultaneously by aggregate behavior of all agents
Dynamic Stochastic General Equilibrium (DSGE) Models
29
Structure of FRBNY DSGE Model
30
DSGE Model Estimation
Model parameters and underlying shocks estimated via Bayesian
methods
Combine prior information on the parameters with information about
key data series
Data series used in current FRBNY-DSGE model:
Real GDP, Consumption, Investment
GDP deflator, PCE core deflator
Wages, hours worked, total factor productivity
Federal funds rate (FFR), 10-year yield, spread (Baa-10y yield)
FFR expectations, inflation expectations
31
Coherent story for understanding macroeconomic outcomes
Optimally combines theoretical knowledge with data
Laboratory for policy experiments
Economic relationships expected to remain invariant to experiments
▫ In contrast, (non-structural) empirical relationships are likely to change
with alternative policies
With monetary policy operating in uncharted waters (e.g. forward
guidance, …) theory has become more essential than ever to guide
policy analysis
▫ No historical precedent to measure effects of recent policy
Recent DSGE models tend to perform relatively well for forecasting
Especially at the horizon of several quarters out
Why a DSGE Model?
32
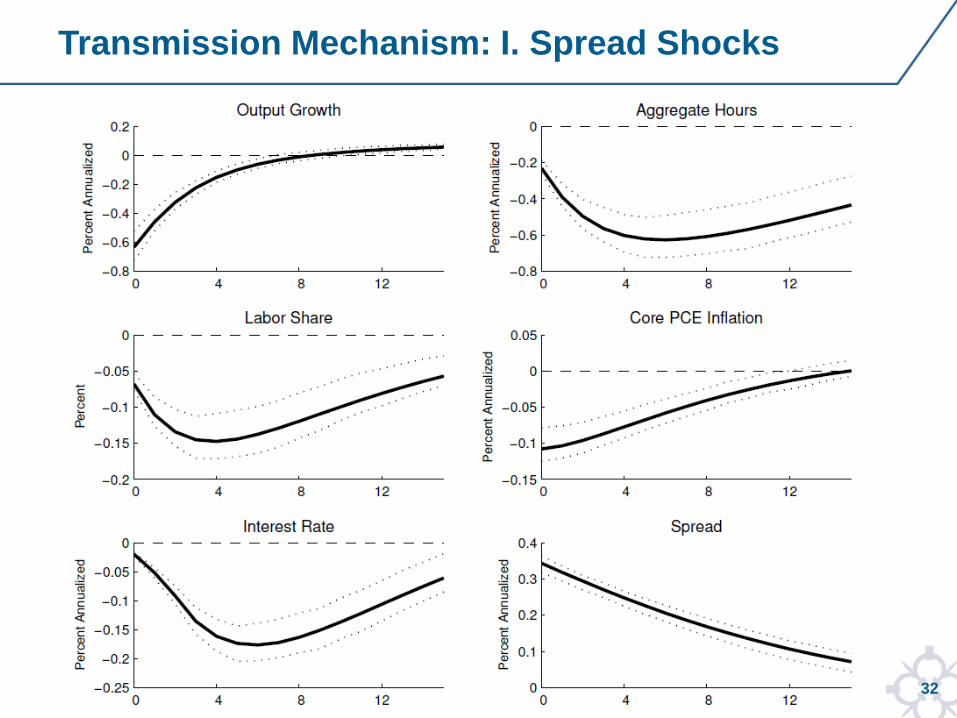
Transmission Mechanism: I. Spread Shocks
33
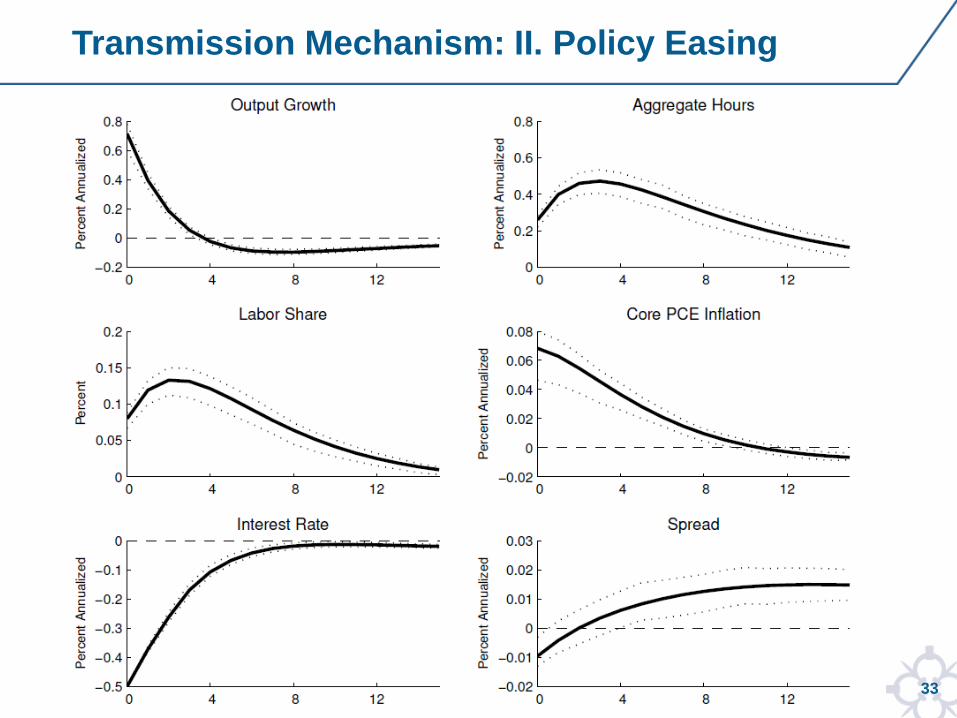
Transmission Mechanism: II. Policy Easing
34
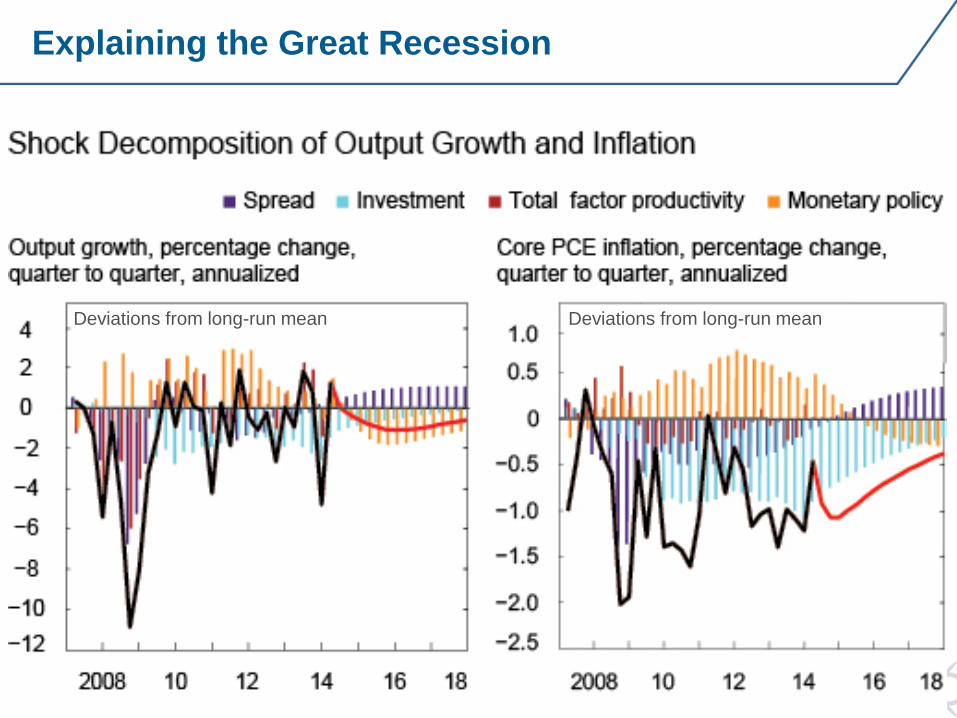
Explaining the Great Recession
Deviations from long-run mean Deviations from long-run mean
35
Take-Away from the Great Recession
Great Recession: large collapse in economic activity
Caused mainly by financial shock
Total factor productivity (hence potential output) fell sharply but has
largely recovered
Shock to investment demand has resulted in protracted low output
growth
Monetary policy has provided considerable stimulus (largely via
forward-guidance)
Sharp drop in output during Great Recession is consistent with mild
decrease in inflation
Policy accommodation has maintained inflation expectations anchored
36
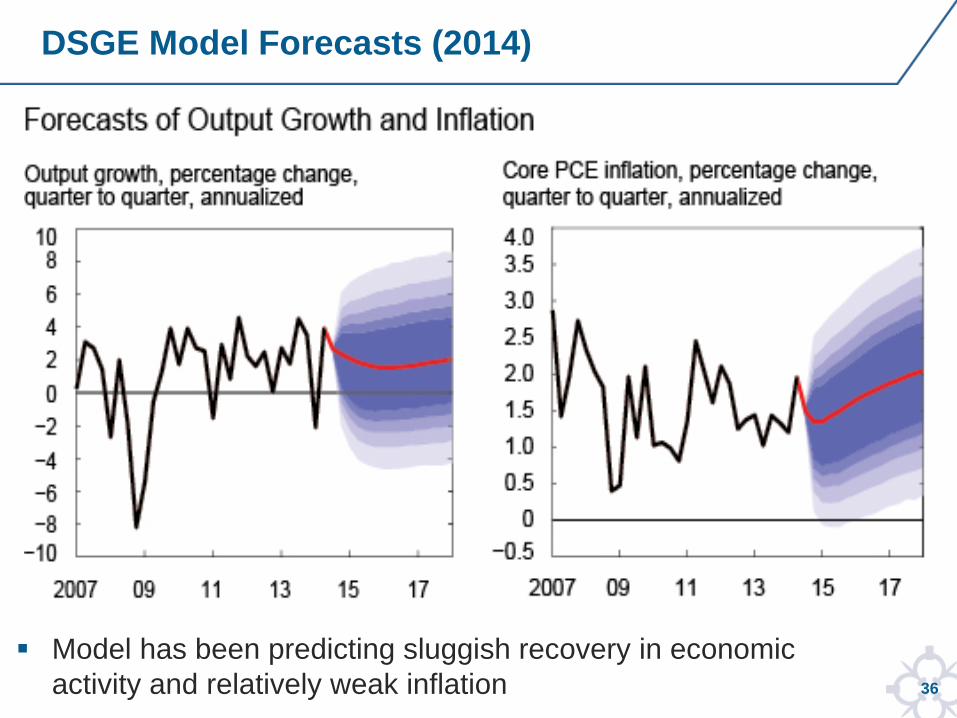
DSGE Model Forecasts (2014)
Model has been predicting sluggish recovery in economic
activity and relatively weak inflation
for internal use only
Monetary Policy Strategy
38
Again, see Statement on ‘Longer-Run Goals and Monetary Policy Strategy’:
In setting monetary policy, the Committee seeks to mitigate deviations
(or gaps) of inflation from its longer-run goal and deviations of
employment from the Committee’s assessments of its maximum level.
These objectives are generally complementary.
Means that generally a policy that helps closing the inflation gap also helps closing the
employment gap
But sometimes there may be policy trade-offs: a policy that helps closing the inflation
gap may worsen the employment gap, and vice versa
Under circumstances in which the Committee judges that the objectives
are not complementary, it follows a balanced approach in promoting
them, taking into account the magnitude of the deviations and the
potentially different time horizons over which employment and inflation
are projected to return to levels judged consistent with its mandate
Monetary Policy Strategy
39
Policy affects the economy with “long and variable lags” (M. Friedman)
Essential to forecast evolution of economy
and to set policy accordingly
Key steps:
Assess current state of economy
Forecast economy’s evolution, conditional on a particular policy path
Choose most desirable policy path
i.e., path of policy instruments that results in most desirable forecast of target variables relative to their long-run goals
Forecast-Targeting as a Monetary Policy Strategy
40
Role of Communication and Transparency
Statement on ‘Longer-Run Goals and Monetary Policy Strategy’ provides important information about Fed’s “reaction function”:
I.e., specifies how policy will likely respond to shocks and unexpected contingencies
Crucial for FOMC to be transparent about its “reaction function”:
Helps anchor market participants expectations (about inflation, etc.)
Facilitates decision making for firms, households, financial markets
Beneficial for FOMC to act in a systematic fashion
“Data-dependent” policy: E.g. loosen monetary policy when economy slows down and inflation falls below target, and tighten when economy overheats, inflation is above target
Extensive communication is key to effective monetary policymaking
41
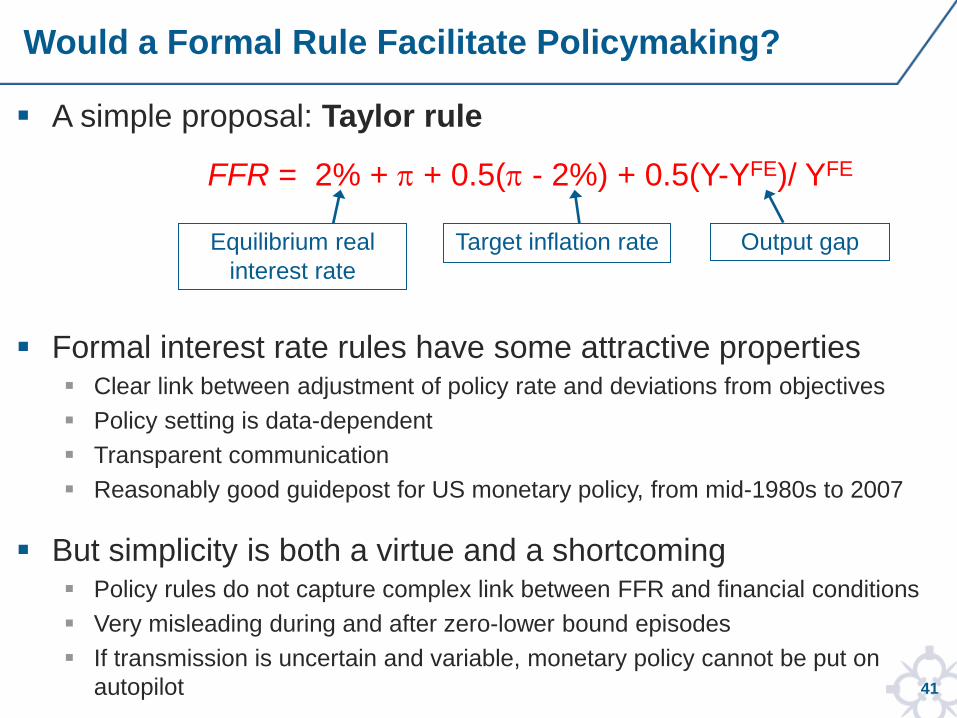
A simple proposal: Taylor rule
FFR = 2% + + 0.5( - 2%) + 0.5(Y-YFE)/ YFE
Formal interest rate rules have some attractive properties Clear link between adjustment of policy rate and deviations from objectives
Policy setting is data-dependent
Transparent communication
Reasonably good guidepost for US monetary policy, from mid-1980s to 2007
But simplicity is both a virtue and a shortcoming Policy rules do not capture complex link between FFR and financial conditions
Very misleading during and after zero-lower bound episodes
If transmission is uncertain and variable, monetary policy cannot be put on
autopilot
Would a Formal Rule Facilitate Policymaking?
Target inflation rate Equilibrium real
interest rate
Output gap
42
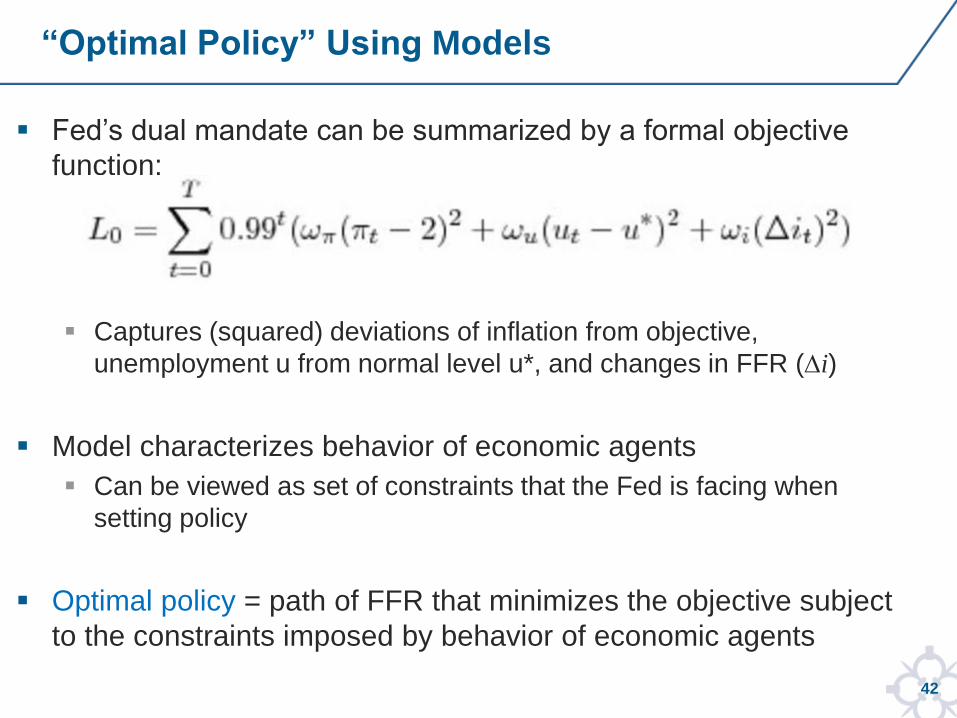
Fed’s dual mandate can be summarized by a formal objective
function:
Captures (squared) deviations of inflation from objective,
unemployment u from normal level u*, and changes in FFR (Di)
Model characterizes behavior of economic agents
Can be viewed as set of constraints that the Fed is facing when
setting policy
Optimal policy = path of FFR that minimizes the objective subject
to the constraints imposed by behavior of economic agents
“Optimal Policy” Using Models
43
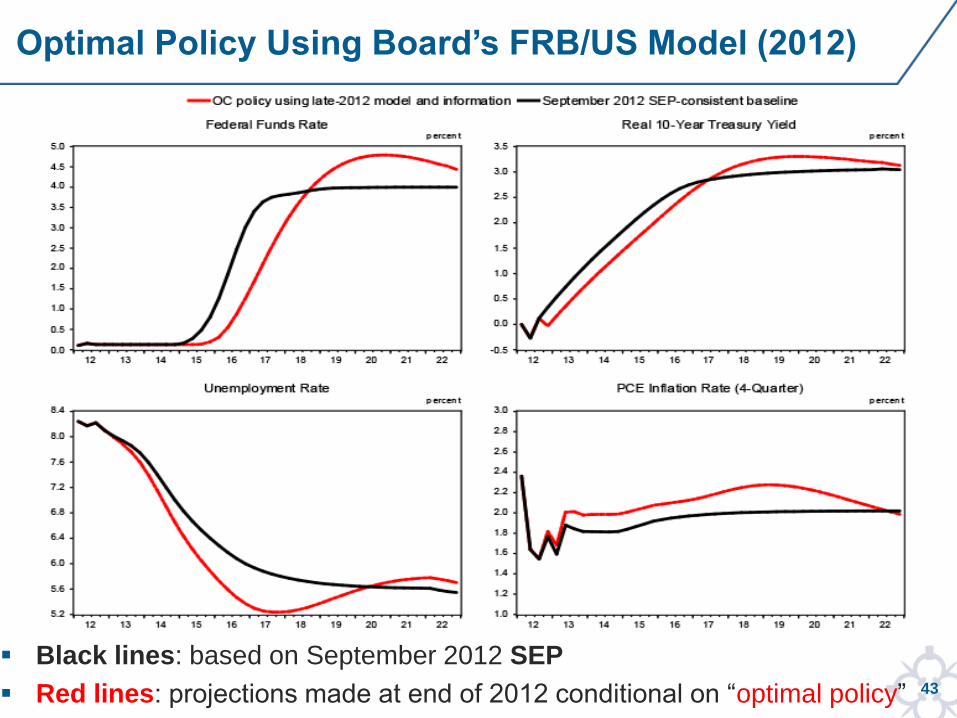
Optimal Policy Using Board’s FRB/US Model (2012)
Black lines: based on September 2012 SEP
Red lines: projections made at end of 2012 conditional on “optimal policy”
44
Optimal FFR path implies more accommodation than SEP
Delayed FFR lift-off
Lower real 10-year Treasury yield for several years
Faster decline in unemployment rate
Faster return of inflation to 2%
Implies temporary overshooting of inflation objective and
undershooting of normal value of the unemployment rate
Such a path generates the financial conditions needed to make
more-rapid progress towards goals
FRBUS model available online:
http://www.federalreserve.gov/econresdata/frbus/us-models-about.htm
http://www.federalreserve.gov/econresdata/notes/feds-notes/2014/optimal-
control-monetary-policy-in-frbus-20141121.html
Optimal Policy Using Board’s FRB/US Model (2012)
45
A wide range of models is used for forecasting and policy
analysis
These models help policymakers understand current state of the
economy, its likely evolution, potential risks, and effects of policy
actions
Judgment remains central
Federal Reserve has become a lot more transparent in
recent years
Statement about “Longer-Run Goals and Monetary Policy
Strategy” codifies FOMC’s “reaction function”
SEP and extensive communication provide insights about Fed’s
view on the economy and policy actions
Should help promote the attainment of its objectives of maximum
employment and price stability
Conclusion