Embed Size (px)
Citation preview
Title
Subtitle
Month Year
Notice
This document is disseminated under the sponsorship of the U.S. Department of Transportation in the interest of information exchange. The U.S. Government assumes no liability for the use of the information contained in this document.
The U.S. Government does not endorse products or manufacturers. Trademarks or manufacturers’ names appear in this report only because they are considered essential to the objective of the document.
Quality Assurance Statement
The Federal Highway Administration (FHWA) provides high-quality information to serve Government, industry, and the public in a manner that promotes public understanding. Standards and policies are used to ensure and maximize the quality, objectivity, utility, and integrity of its information. FHWA periodically reviews quality issues and adjusts its programs and processes to ensure continuous quality improvement.
Cover image source: www.gettyimages.com.
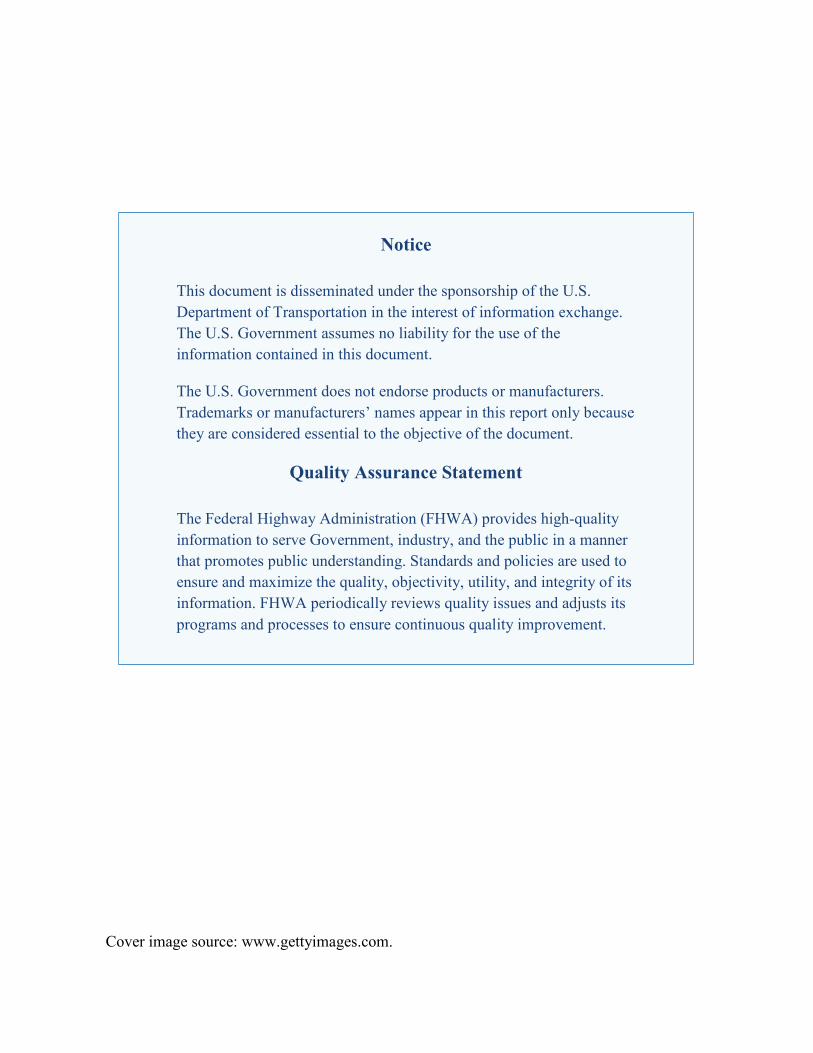
Technical Report Documentation Page
1. Report No.
FHWA-HOP-18-013 2. Government Accession No.
3. Recipient’s Catalog No.
4. Title and Subtitle
Recurring Traffic Bottlenecks: A Primer, Focus on Low-Cost Operational Improvements, Fourth Edition
5. Report Date
November 2017
6. Performing Organization Code
7. Author(s)
Neil Spiller, Katherine Blizzard, Rich Margiotta, Ph.D. 8. Performing Organization Report No.
9. Performing Organization Name And Address
Cambridge Systematics, Inc. 3 Bethesda Metro Center, Suite 1200 Bethesda, MD 20814
10. Work Unit No. (TRAIS)
11. Contract or Grant No.
DTFH61-12-D-00048
12. Sponsoring Agency Name and Address
U.S. Department of Transportation Federal Highway Administration 1200 New Jersey Avenue, SE Washington, DC 20590
13. Type of Report and Period Covered
Final research report
14. Sponsoring Agency Code
FHWA HOP
15. Supplementary Notes
Government Task Manager: Neil Spiller
16. Abstract
While many of the nation’s bottlenecks are addressed through costly major construction projects (i.e., “megaprojects”) or costly transportation alternative solutions (e.g., high occupancy vehicle (HOV) or high occupancy toll (HOT) lanes, dynamic pricing, investments in transit alternatives, parking and commuter incentive programs, etc.) there is a significant opportunity for the greater application of operational and low-cost “fixes” at spot-specific locations. This primer is the signature product of the Localized Bottleneck Reduction (LBR) Program, which is administered out of the Office of Operations at the Federal Highway Administration (FHWA) headquarters in Washington, D.C. The LBR program is focused on relieving recurring congestion chokepoints (as opposed to nonrecurring congestion causes) and the operational influences that cause them with lower cost, less intensive means. This is the updated, fourth edition of this primer. The first version is FHWA-HOP-07-130, the second version is FHWA- HOP-09-037, and the third version is FHWA-HOP-12-012. The first and second editions of this primer introduced, and then raised awareness about, how LBR strategies could deal with congestion, respectively. The third edition focused on providing highly specific guidance for agencies to follow in developing and advancing LBR programs. This fourth edition builds upon and updates the previous editions with recent advances in innovative research and additional case studies of implementing LBR strategies.
17. Key Words
bottleneck, localized bottleneck reduction, chokepoint, recurring congestion, low cost improvements, operational deficiencies, lane drops, weaves, merges, metering
18. Distribution Statement
No restrictions
19. Security Classif. (of this report)
Unclassified
20. Security Classif. (of this page)
Unclassified
21. No. of Pages
88
22. Price
N/A
Form DOT F 1700.7 (8-72) Reproduction of completed page authorized

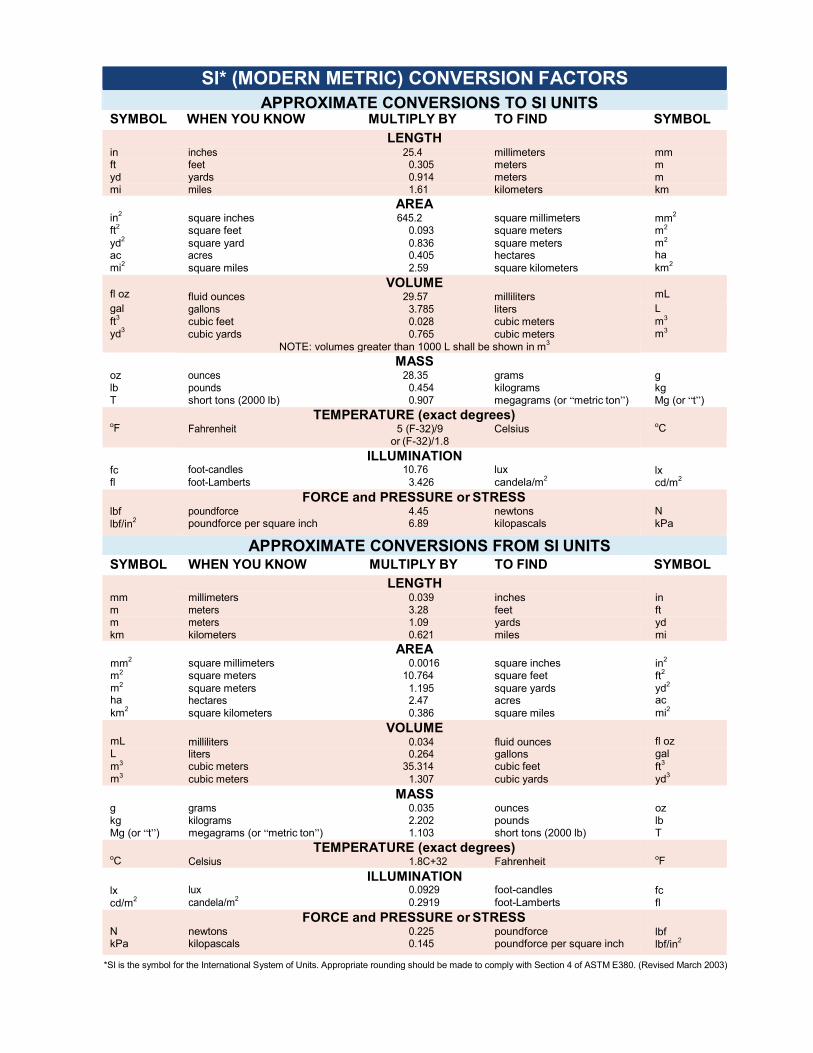
SI* (MODERN METRIC) CONVERSION FACTORS APPROXIMATE CONVERSIONS TO SI UNITS
SYMBOL WHEN YOU KNOW MULTIPLY BY TO FIND SYMBOL LENGTH
in inches 25.4 millimeters mm ft feet 0.305 meters m yd yards 0.914 meters m mi miles 1.61 kilometers km
AREA in2
square inches 645.2 square millimeters mm2
ft2 square feet 0.093 square meters m2
yd2 square yard 0.836 square meters m2
ac acres 0.405 hectares ha mi2 square miles 2.59 square kilometers km2
fl oz
VOLUME fluid ounces 29.57 milliliters gallons 3.785 liters cubic feet 0.028 cubic meters cubic yards 0.765 cubic meters
NOTE: volumes greater than 1000 L shall be shown in m3
mL
gal L ft3 m3
yd3 m3
MASS oz ounces 28.35 grams g lb pounds 0.454 kilograms kg T short tons (2000 lb) 0.907 megagrams (or “metric ton”) Mg (or “t”)
oF
TEMPERATURE (exact degrees) Fahrenheit 5 (F-32)/9 Celsius
or (F-32)/1.8
oC
fc fl
ILLUMINATION foot-candles 10.76 lux foot-Lamberts 3.426 candela/m2
lx cd/m2
lbf lbf/in2
FORCE and PRESSURE or STRESS poundforce 4.45 newtons poundforce per square inch 6.89 kilopascals
N kPa
APPROXIMATE CONVERSIONS FROM SI UNITS SYMBOL WHEN YOU KNOW MULTIPLY BY TO FIND SYMBOL
LENGTH mm millimeters 0.039 inches in m meters 3.28 feet ft m meters 1.09 yards yd km kilometers 0.621 miles mi
AREA mm2
square millimeters 0.0016 square inches in2
m2 square meters 10.764 square feet ft2
m2 square meters 1.195 square yards yd2
ha hectares 2.47 acres ac km2
square kilometers 0.386 square miles mi2
VOLUME mL milliliters 0.034 fluid ounces fl oz L liters 0.264 gallons gal m3 cubic meters 35.314 cubic feet ft3
m3 cubic meters 1.307 cubic yards yd3
MASS g grams 0.035 ounces oz kg kilograms 2.202 pounds lb Mg (or “t”) megagrams (or “metric ton”) 1.103 short tons (2000 lb) T
oC
TEMPERATURE (exact degrees) Celsius 1.8C+32 Fahrenheit
oF
lx cd/m2
ILLUMINATION lux 0.0929 foot-candles candela/m2 0.2919 foot-Lamberts
fc fl
N kPa
FORCE and PRESSURE or STRESS newtons 0.225 poundforce kilopascals 0.145 poundforce per square inch
lbf lbf/in2
*SI is the symbol for the International System of Units. Appropriate rounding should be made to comply with Section 4 of ASTM E380. (Revised March 2003)

Recurring Traffic Bottlenecks | A Primer
Table of Contents v
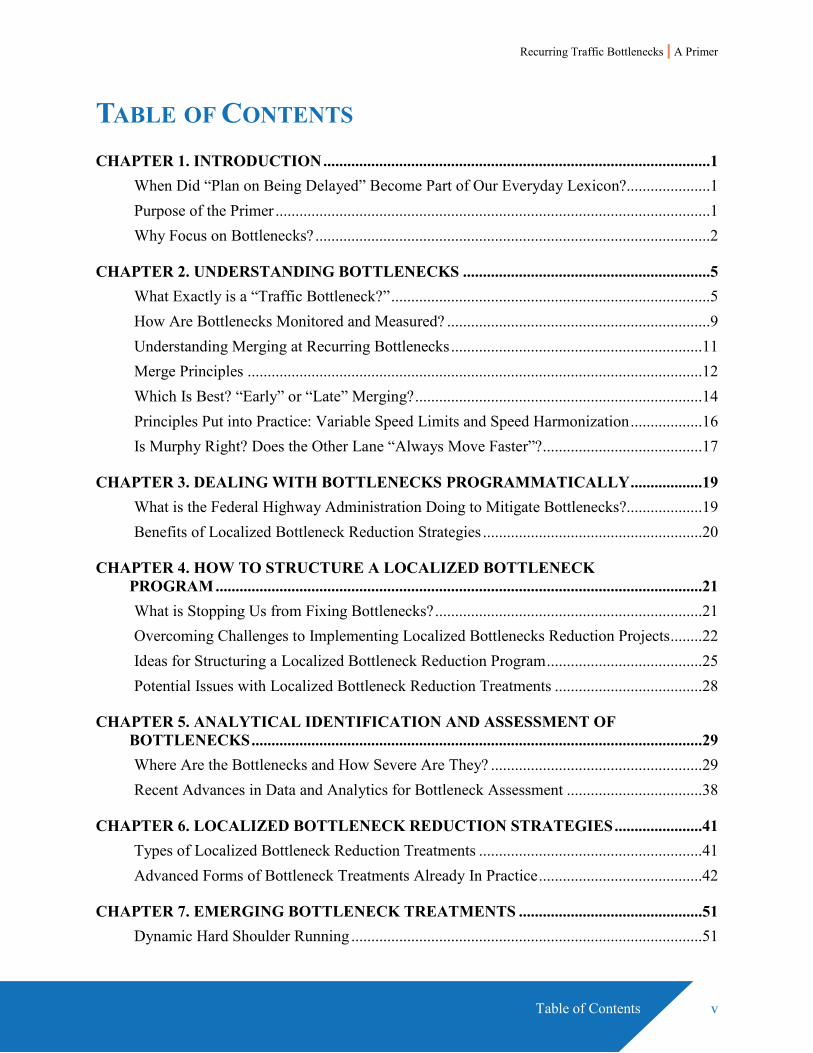
TABLE OF CONTENTS CHAPTER 1. INTRODUCTION .................................................................................................1
When Did “Plan on Being Delayed” Become Part of Our Everyday Lexicon?.....................1
Purpose of the Primer .............................................................................................................1
Why Focus on Bottlenecks? ...................................................................................................2
CHAPTER 2. UNDERSTANDING BOTTLENECKS ..............................................................5
What Exactly is a “Traffic Bottleneck?” ................................................................................5
How Are Bottlenecks Monitored and Measured? ..................................................................9
Understanding Merging at Recurring Bottlenecks ...............................................................11
Merge Principles ..................................................................................................................12
Which Is Best? “Early” or “Late” Merging? ........................................................................14
Principles Put into Practice: Variable Speed Limits and Speed Harmonization ..................16
Is Murphy Right? Does the Other Lane “Always Move Faster”? ........................................17
CHAPTER 3. DEALING WITH BOTTLENECKS PROGRAMMATICALLY ..................19
What is the Federal Highway Administration Doing to Mitigate Bottlenecks?...................19
Benefits of Localized Bottleneck Reduction Strategies .......................................................20
CHAPTER 4. HOW TO STRUCTURE A LOCALIZED BOTTLENECK PROGRAM ..........................................................................................................................21
What is Stopping Us from Fixing Bottlenecks? ...................................................................21
Overcoming Challenges to Implementing Localized Bottlenecks Reduction Projects ........22
Ideas for Structuring a Localized Bottleneck Reduction Program .......................................25
Potential Issues with Localized Bottleneck Reduction Treatments .....................................28
CHAPTER 5. ANALYTICAL IDENTIFICATION AND ASSESSMENT OF BOTTLENECKS .................................................................................................................29
Where Are the Bottlenecks and How Severe Are They? .....................................................29
Recent Advances in Data and Analytics for Bottleneck Assessment ..................................38
CHAPTER 6. LOCALIZED BOTTLENECK REDUCTION STRATEGIES ......................41
Types of Localized Bottleneck Reduction Treatments ........................................................41
Advanced Forms of Bottleneck Treatments Already In Practice .........................................42
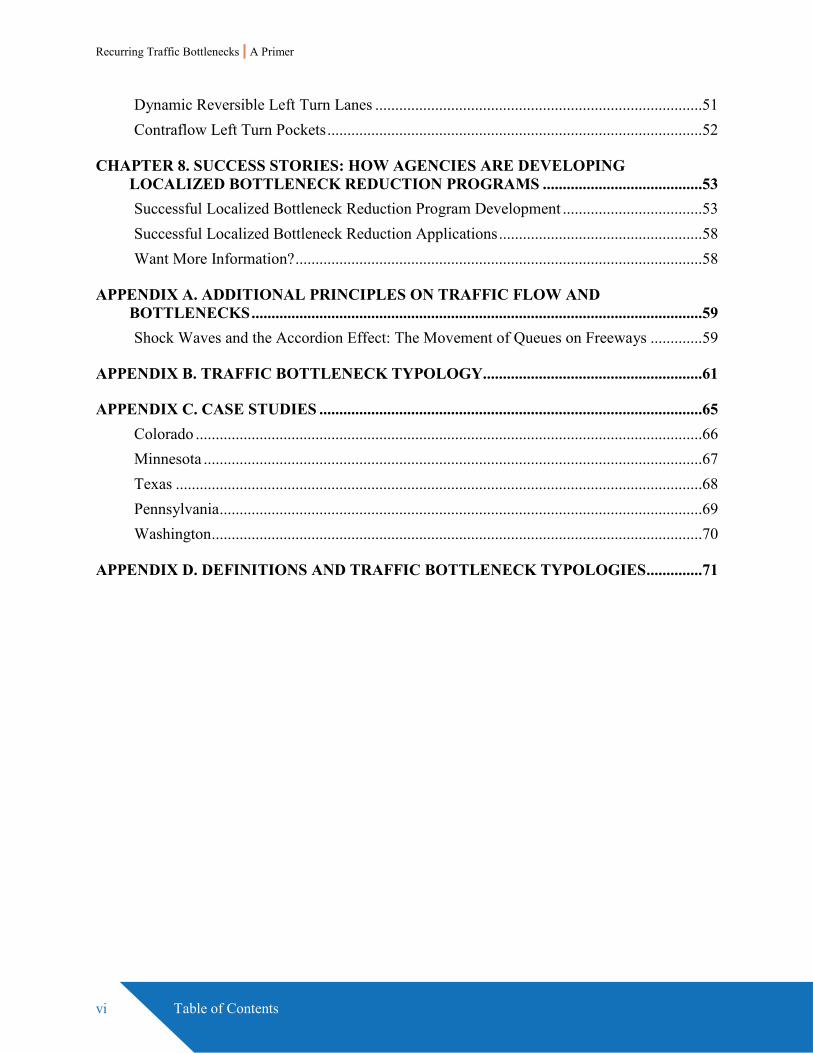
CHAPTER 7. EMERGING BOTTLENECK TREATMENTS ..............................................51
Dynamic Hard Shoulder Running ........................................................................................51
Recurring Traffic Bottlenecks | A Primer
vi Table of Contents
Dynamic Reversible Left Turn Lanes ..................................................................................51
Contraflow Left Turn Pockets ..............................................................................................52
CHAPTER 8. SUCCESS STORIES: HOW AGENCIES ARE DEVELOPING LOCALIZED BOTTLENECK REDUCTION PROGRAMS ........................................53
Successful Localized Bottleneck Reduction Program Development ...................................53
Successful Localized Bottleneck Reduction Applications ...................................................58
Want More Information? ......................................................................................................58
APPENDIX A. ADDITIONAL PRINCIPLES ON TRAFFIC FLOW AND BOTTLENECKS .................................................................................................................59
Shock Waves and the Accordion Effect: The Movement of Queues on Freeways .............59
APPENDIX B. TRAFFIC BOTTLENECK TYPOLOGY.......................................................61
APPENDIX C. CASE STUDIES ................................................................................................65
Colorado ...............................................................................................................................66
Minnesota .............................................................................................................................67
Texas ....................................................................................................................................68
Pennsylvania .........................................................................................................................69
Washington ...........................................................................................................................70
APPENDIX D. DEFINITIONS AND TRAFFIC BOTTLENECK TYPOLOGIES ..............71
Recurring Traffic Bottlenecks | A Primer
List of Figures vii
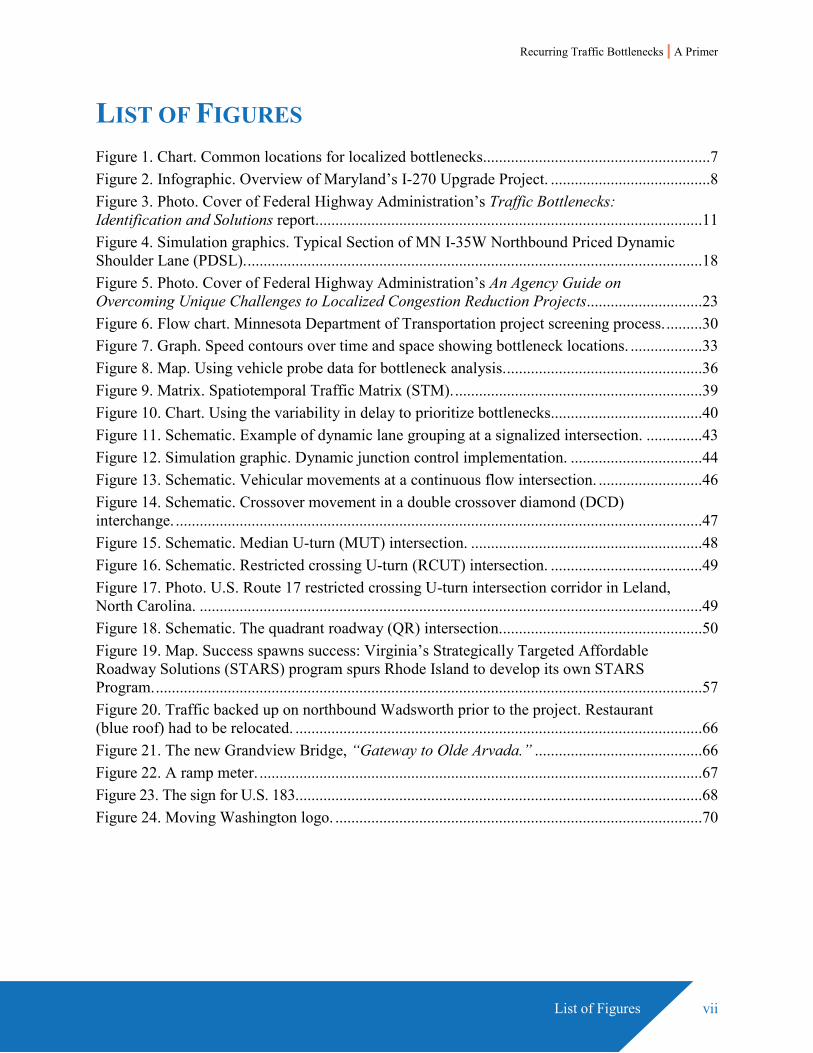
LIST OF FIGURES Figure 1. Chart. Common locations for localized bottlenecks.........................................................7 Figure 2. Infographic. Overview of Maryland’s I-270 Upgrade Project. ........................................8 Figure 3. Photo. Cover of Federal Highway Administration’s Traffic Bottlenecks: Identification and Solutions report.................................................................................................11 Figure 4. Simulation graphics. Typical Section of MN I-35W Northbound Priced Dynamic Shoulder Lane (PDSL). ..................................................................................................................18 Figure 5. Photo. Cover of Federal Highway Administration’s An Agency Guide on Overcoming Unique Challenges to Localized Congestion Reduction Projects.............................23 Figure 6. Flow chart. Minnesota Department of Transportation project screening process. .........30 Figure 7. Graph. Speed contours over time and space showing bottleneck locations. ..................33 Figure 8. Map. Using vehicle probe data for bottleneck analysis. .................................................36 Figure 9. Matrix. Spatiotemporal Traffic Matrix (STM). ..............................................................39 Figure 10. Chart. Using the variability in delay to prioritize bottlenecks......................................40 Figure 11. Schematic. Example of dynamic lane grouping at a signalized intersection. ..............43 Figure 12. Simulation graphic. Dynamic junction control implementation. .................................44 Figure 13. Schematic. Vehicular movements at a continuous flow intersection. ..........................46 Figure 14. Schematic. Crossover movement in a double crossover diamond (DCD) interchange. ....................................................................................................................................47 Figure 15. Schematic. Median U-turn (MUT) intersection. ..........................................................48 Figure 16. Schematic. Restricted crossing U-turn (RCUT) intersection. ......................................49 Figure 17. Photo. U.S. Route 17 restricted crossing U-turn intersection corridor in Leland, North Carolina. ..............................................................................................................................49 Figure 18. Schematic. The quadrant roadway (QR) intersection...................................................50 Figure 19. Map. Success spawns success: Virginia’s Strategically Targeted Affordable Roadway Solutions (STARS) program spurs Rhode Island to develop its own STARS Program. .........................................................................................................................................57 Figure 20. Traffic backed up on northbound Wadsworth prior to the project. Restaurant (blue roof) had to be relocated. ......................................................................................................66 Figure 21. The new Grandview Bridge, “Gateway to Olde Arvada.” ..........................................66 Figure 22. A ramp meter. ...............................................................................................................67 Figure 23. The sign for U.S. 183. .....................................................................................................68 Figure 24. Moving Washington logo. ............................................................................................70

Recurring Traffic Bottlenecks | A Primer
List of Tables ix
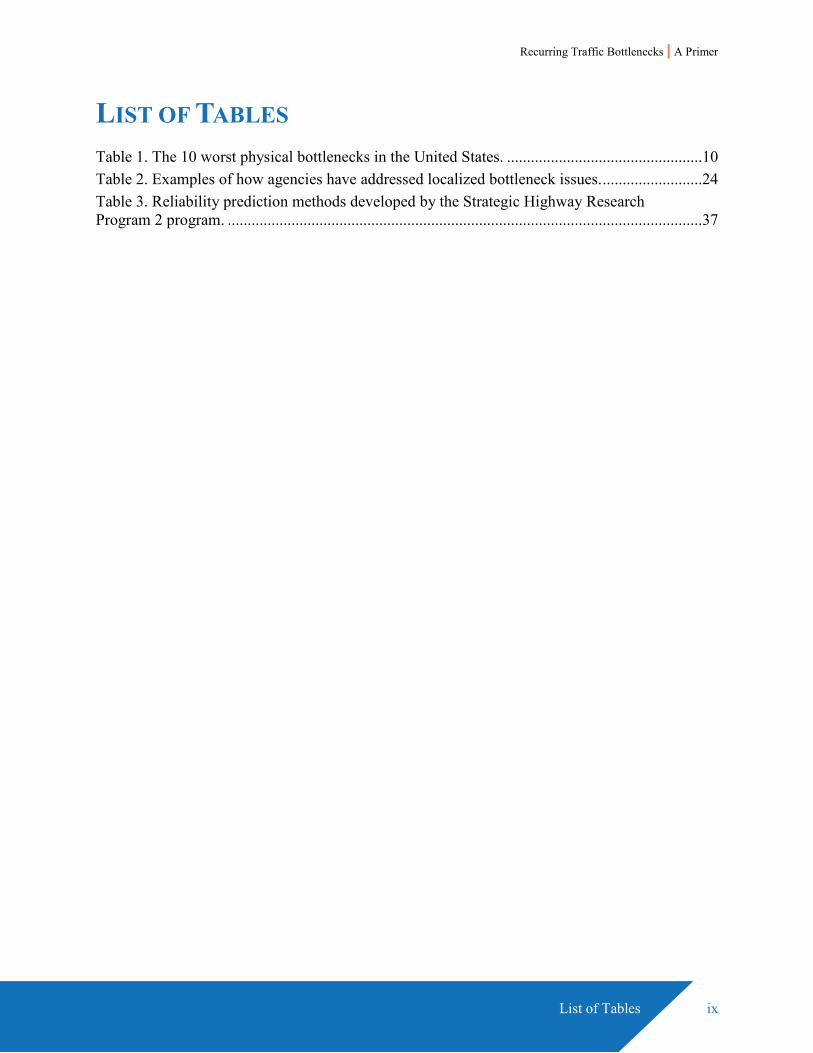
LIST OF TABLES Table 1. The 10 worst physical bottlenecks in the United States. .................................................10 Table 2. Examples of how agencies have addressed localized bottleneck issues. .........................24 Table 3. Reliability prediction methods developed by the Strategic Highway Research Program 2 program. .......................................................................................................................37

Recurring Traffic Bottlenecks | A Primer
List of Abbreviations xi
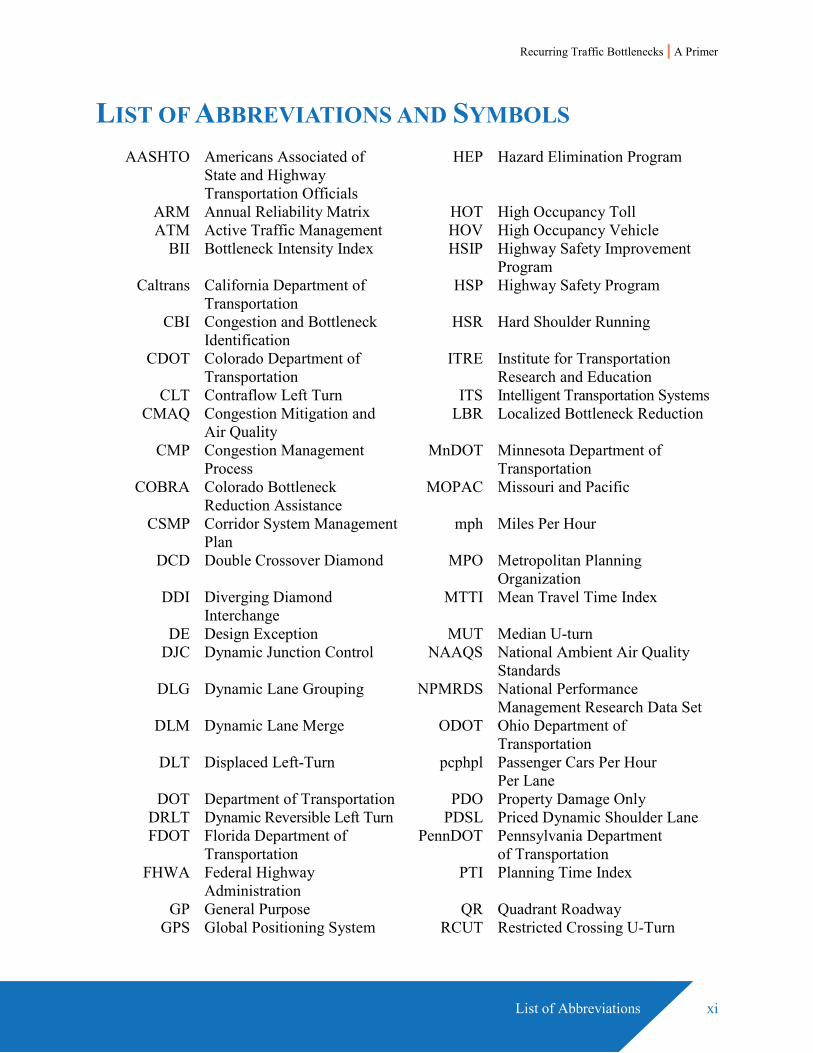
LIST OF ABBREVIATIONS AND SYMBOLS AASHTO Americans Associated of
State and Highway Transportation Officials
HEP Hazard Elimination Program
ARM Annual Reliability Matrix HOT High Occupancy Toll ATM Active Traffic Management HOV High Occupancy Vehicle
BII Bottleneck Intensity Index HSIP Highway Safety Improvement Program
Caltrans California Department of Transportation
HSP Highway Safety Program
CBI Congestion and Bottleneck Identification
HSR Hard Shoulder Running
CDOT Colorado Department of Transportation
ITRE Institute for Transportation Research and Education
CLT Contraflow Left Turn ITS Intelligent Transportation Systems CMAQ Congestion Mitigation and
Air Quality LBR Localized Bottleneck Reduction
CMP Congestion Management Process
MnDOT Minnesota Department of Transportation
COBRA Colorado Bottleneck Reduction Assistance
MOPAC Missouri and Pacific
CSMP Corridor System Management Plan
mph Miles Per Hour
DCD Double Crossover Diamond MPO Metropolitan Planning Organization
DDI Diverging Diamond Interchange
MTTI Mean Travel Time Index
DE Design Exception MUT Median U-turn DJC Dynamic Junction Control NAAQS National Ambient Air Quality
Standards DLG Dynamic Lane Grouping NPMRDS National Performance
Management Research Data Set DLM Dynamic Lane Merge ODOT Ohio Department of
Transportation DLT Displaced Left-Turn pcphpl Passenger Cars Per Hour
Per Lane DOT Department of Transportation PDO Property Damage Only
DRLT Dynamic Reversible Left Turn PDSL Priced Dynamic Shoulder Lane FDOT Florida Department of
Transportation PennDOT Pennsylvania Department
of Transportation FHWA Federal Highway
Administration PTI Planning Time Index
GP General Purpose QR Quadrant Roadway GPS Global Positioning System RCUT Restricted Crossing U-Turn
Recurring Traffic Bottlenecks | A Primer
xii List of Abbreviations
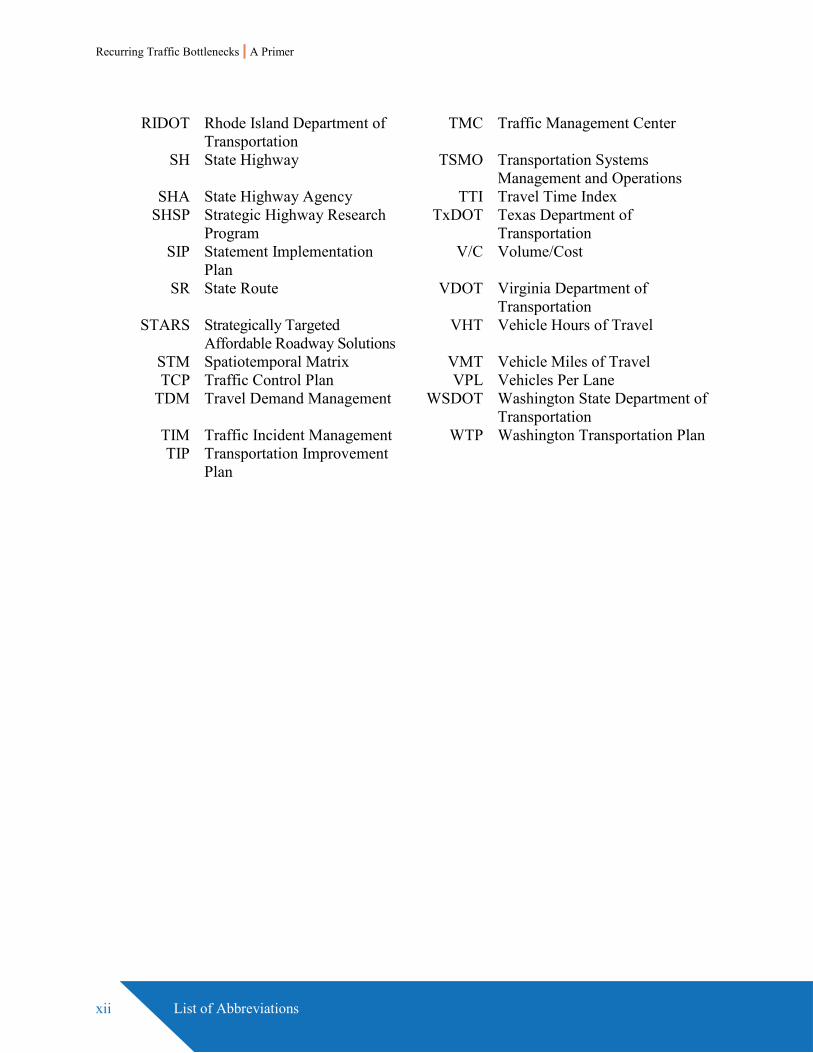
RIDOT Rhode Island Department of
Transportation TMC Traffic Management Center
SH State Highway TSMO Transportation Systems Management and Operations
SHA State Highway Agency TTI Travel Time Index SHSP Strategic Highway Research
Program TxDOT Texas Department of
Transportation SIP Statement Implementation
Plan V/C Volume/Cost
SR State Route VDOT Virginia Department of Transportation
STARS Strategically Targeted Affordable Roadway Solutions
VHT Vehicle Hours of Travel
STM Spatiotemporal Matrix VMT Vehicle Miles of Travel TCP Traffic Control Plan VPL Vehicles Per Lane
TDM Travel Demand Management WSDOT Washington State Department of Transportation
TIM Traffic Incident Management WTP Washington Transportation Plan TIP Transportation Improvement
Plan
Recurring Traffic Bottlenecks | A Primer
Introduction 1
CHAPTER 1. INTRODUCTION
When Did “Plan on Being Delayed” Become Part of Our Everyday Lexicon?
Delays due to traffic congestion seem like an unavoidable, frustrating fact of life. Or are they—unavoidable, that is? Why must we accept to allow 30 minutes for what should be a 15 minute drive? In today’s world, drivers increasingly factor in time just to sit in traffic—which is caused not by us, mind you, but by “others” who, if they would only get out of our way, would free up that trip to its rightful duration.
This document focuses on traffic congestion caused by bottlenecks—which are specific locations on the highway system where the physical layout of the roadway routinely cannot process the traffic that wants to use it and results in localized, recurring congestion. While some of the nation’s congestion can only be addressed through costly major construction projects, there is a significant opportunity to apply more operational and low-cost infrastructure solutions to provide relief for localized, recurring congestion at bottlenecks. This document, Recurring Traffic Bottlenecks: A Primer—Focus on Low-Cost Operational Improvements, describes such bottlenecks and explores opportunities for near-term, operational, and low-cost methods to correct them.
Purpose of the Primer
This primer’s focus on alleviating localized, recurring congestion at bottlenecks distinguishes it from other resources addressing other types of congestion. In general, congestion can be either localized (occurring at distinct segments of roadway) or systemic (occurring throughout the roadway system due to widespread excess demand), and either recurring (occurring routinely at the same place and/or time) or nonrecurring (occurring non-routinely due to unplanned, unforeseen, or special events such as weather events, crashes, football games, etc.). Congestion can even occur when there is no apparent reason, witness that on a seemingly clear highway a “phantom” traffic jam may occur. (This is discussed later in the document.) Different types of congestion have different causes and, therefore, different remedies. By focusing solely on relieving localized, recurring congestion at bottlenecks, this primer can help agencies identify the right fix for a particular bottleneck. What’s more, the right fix for a localized, recurring bottleneck is usually spot-specific, more effective, less expensive, and faster to implement than building a new facility.

Recurring Traffic Bottlenecks | A Primer
2 Introduction
The Localized Bottleneck Reduction Program
This document is a fourth-generation primer that is a key resource within the Federal Highway Administration’s (FHWA) Localized Bottleneck Reduction (LBR) program. The LBR program provides a virtual forum for peer exchange between members of the transportation community interested in alleviating bottleneck congestion. Initiated in 2006, the program is designed to expand the portfolio of bottleneck reduction tools available to transportation agencies to encompass innovative, readily adoptable strategies for reducing congestion at bottlenecks. The first and second editions of this primer introduced, and then raised awareness about, how LBR strategies could deal with congestion, respectively. The third edition focused on providing highly specific guidance for agencies to follow in developing and advancing LBR programs. This fourth edition builds upon and updates the previous editions with recent advances in innovative research and additional case studies of implementing LBR strategies.
Why Focus on Bottlenecks?
In the past, recurring congestion was felt to be a systemic problem (either “not enough lanes” or “too many cars”). It is true that additional lanes are often needed as part of bottleneck improvements to handle the additional recurring traffic buildup, but those additional lanes are typically short subordinate segments, and not longer, uniform highway segments. Traditional capital solutions grew from a “build our way out” mindset, resulting in extensive corridor-wide “mega” improvements that could be accused of overbuilding the solution sometimes (e.g., widening a 12-mile long facility when only interchanges 3, 10 and 12 were the problem). The problem is that funding for these large scale projects is limited and they take a long time (many years) to complete, so addressing recurring congestion takes a backseat to either safety-related concerns, or out-year projects meant to enable entire regions.
However, like weather, traffic is an ever-evolving “front.” And, like weather forecasting, traffic management is a dynamic moving target that makes it an ever-evolving profession. So, as with weather forecasting, we are getting better and better at it, but remain at the whim of these unrelenting fronts. Along these lines, transportation professionals have come to realize, with increasing attention, that highway bottlenecks—for example, points where traffic flow is restricted due to geometry, lane-drops, weaving, or interchange-related merging maneuvers—demand special attention.
The percentage of congestion attributable to bottlenecks varies by location and context. FHWA has estimated that 40 to 80 percent of congestion can be attributed to limited physical capacity, depending on the density of the area (i.e., urban vs. suburban vs. rural areas). In many of these situations, capacity can be greatly improved by treating localized recurring bottlenecks rather than implementing large scale corridor-wide improvements. Especially given that LBR strategies are relatively inexpensive and quick to implement, bottlenecks and LBR strategies warrant more

Recurring Traffic Bottlenecks | A Primer
Introduction 3
attention than they have traditionally been given. After all, what do most Americans want, more than anything, from their government? At least according to one Northern Virginia study, the top request of residents is relief from traffic congestion by a nearly 2:1 margin over the next issue (housing affordability) and other issues like crime, education, and jobs.1
When agencies shift their focus from recurring congestion being primarily systemic (and thus treatable with only large projects or time-shifting strategies such as telecommuting, mode-shift to transit, etc.) to also being caused by specific chokepoints, a wider range of improvement strategies become possible, especially in the short term. While these will never entirely replace the need for corridor-wide fixes—especially at the “mega bottlenecks” such as freeway-to-freeway interchanges—localized bottleneck reduction strategies can provide a significant amount of faster and more cost effective congestion relief.
Finally, the 2008 economic downturn caused a major shortfall in revenues to transportation agencies that still persists today. In this climate, the low-cost nature, and quick turn-around timeframe, of LBR strategies has made them highly attractive alternatives to traditional large-scale capacity expansion projects for agencies seeking “to do more with less.” Especially when combined with other low-cost operations and demand management strategies, LBR strategies are a major tool for addressing congestion cost effectively.
1 https://www.washingtonpost.com/news/dr-gridlock/wp/2017/02/15/what-do-northern-virginians-want-
most-from-government-relief-from-traffic-congestion/?hpid=hp_local-news_gridlock-nova-205pm%3Ahomepage%2Fstory&utm_term=.677f12eb10f2.
Unclog That Bottleneck!
Recurring congestion accounts for an estimated 40 to 80 percent of congestion nationwide, depending on whether it is
rural, suburban, or densely urban. Localized bottlenecks are often the main
source of the recurring congestion problem, and they are easy and
inexpensive to treat, especially compared to “megaprojects”.
We need to fix the “bends, kinks, and cavitations” in the traffic “plumbing” before building more expensive and time-consuming highway expansion
projects.

Recurring Traffic Bottlenecks | A Primer
Understanding Bottlenecks 5
CHAPTER 2. UNDERSTANDING BOTTLENECKS
What Exactly is a “Traffic Bottleneck?”
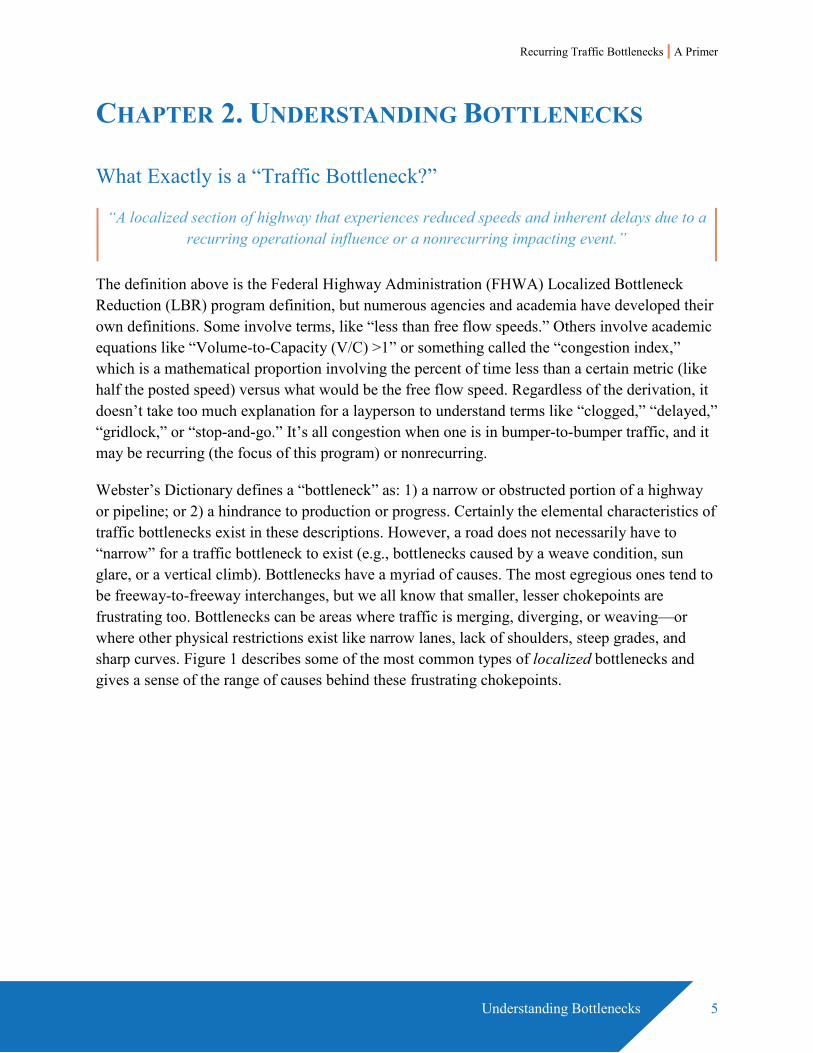
The definition above is the Federal Highway Administration (FHWA) Localized Bottleneck Reduction (LBR) program definition, but numerous agencies and academia have developed their own definitions. Some involve terms, like “less than free flow speeds.” Others involve academic equations like “Volume-to-Capacity (V/C) >1” or something called the “congestion index,” which is a mathematical proportion involving the percent of time less than a certain metric (like half the posted speed) versus what would be the free flow speed. Regardless of the derivation, it doesn’t take too much explanation for a layperson to understand terms like “clogged,” “delayed,” “gridlock,” or “stop-and-go.” It’s all congestion when one is in bumper-to-bumper traffic, and it may be recurring (the focus of this program) or nonrecurring.
Webster’s Dictionary defines a “bottleneck” as: 1) a narrow or obstructed portion of a highway or pipeline; or 2) a hindrance to production or progress. Certainly the elemental characteristics of traffic bottlenecks exist in these descriptions. However, a road does not necessarily have to “narrow” for a traffic bottleneck to exist (e.g., bottlenecks caused by a weave condition, sun glare, or a vertical climb). Bottlenecks have a myriad of causes. The most egregious ones tend to be freeway-to-freeway interchanges, but we all know that smaller, lesser chokepoints are frustrating too. Bottlenecks can be areas where traffic is merging, diverging, or weaving—or where other physical restrictions exist like narrow lanes, lack of shoulders, steep grades, and sharp curves. Figure 1 describes some of the most common types of localized bottlenecks and gives a sense of the range of causes behind these frustrating chokepoints.
“A localized section of highway that experiences reduced speeds and inherent delays due to a recurring operational influence or a nonrecurring impacting event.”
Recurring Traffic Bottlenecks | A Primer
6 Understanding Bottlenecks
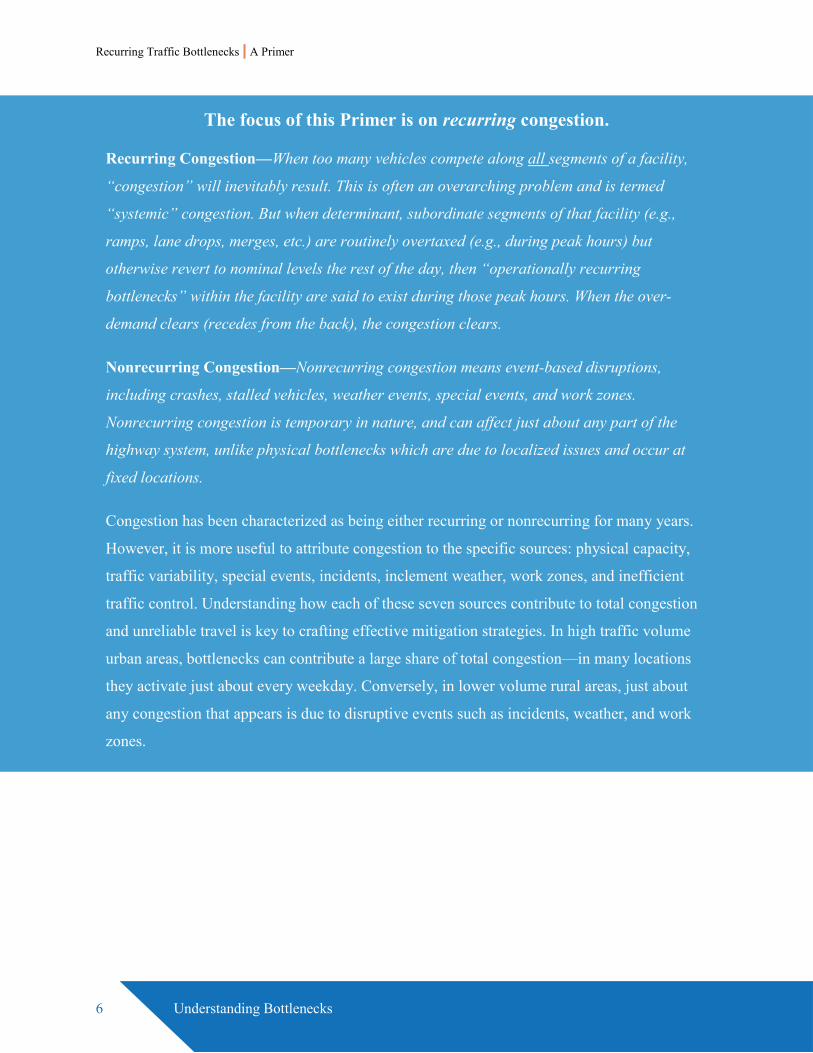
The focus of this Primer is on recurring congestion.
Recurring Congestion—When too many vehicles compete along all segments of a facility,
“congestion” will inevitably result. This is often an overarching problem and is termed
“systemic” congestion. But when determinant, subordinate segments of that facility (e.g.,
ramps, lane drops, merges, etc.) are routinely overtaxed (e.g., during peak hours) but
otherwise revert to nominal levels the rest of the day, then “operationally recurring
bottlenecks” within the facility are said to exist during those peak hours. When the over-
demand clears (recedes from the back), the congestion clears.
Nonrecurring Congestion—Nonrecurring congestion means event-based disruptions,
including crashes, stalled vehicles, weather events, special events, and work zones.
Nonrecurring congestion is temporary in nature, and can affect just about any part of the
highway system, unlike physical bottlenecks which are due to localized issues and occur at
fixed locations.
Congestion has been characterized as being either recurring or nonrecurring for many years.
However, it is more useful to attribute congestion to the specific sources: physical capacity,
traffic variability, special events, incidents, inclement weather, work zones, and inefficient
traffic control. Understanding how each of these seven sources contribute to total congestion
and unreliable travel is key to crafting effective mitigation strategies. In high traffic volume
urban areas, bottlenecks can contribute a large share of total congestion—in many locations
they activate just about every weekday. Conversely, in lower volume rural areas, just about
any congestion that appears is due to disruptive events such as incidents, weather, and work
zones.
Recurring Traffic Bottlenecks | A Primer
Understanding Bottlenecks 7
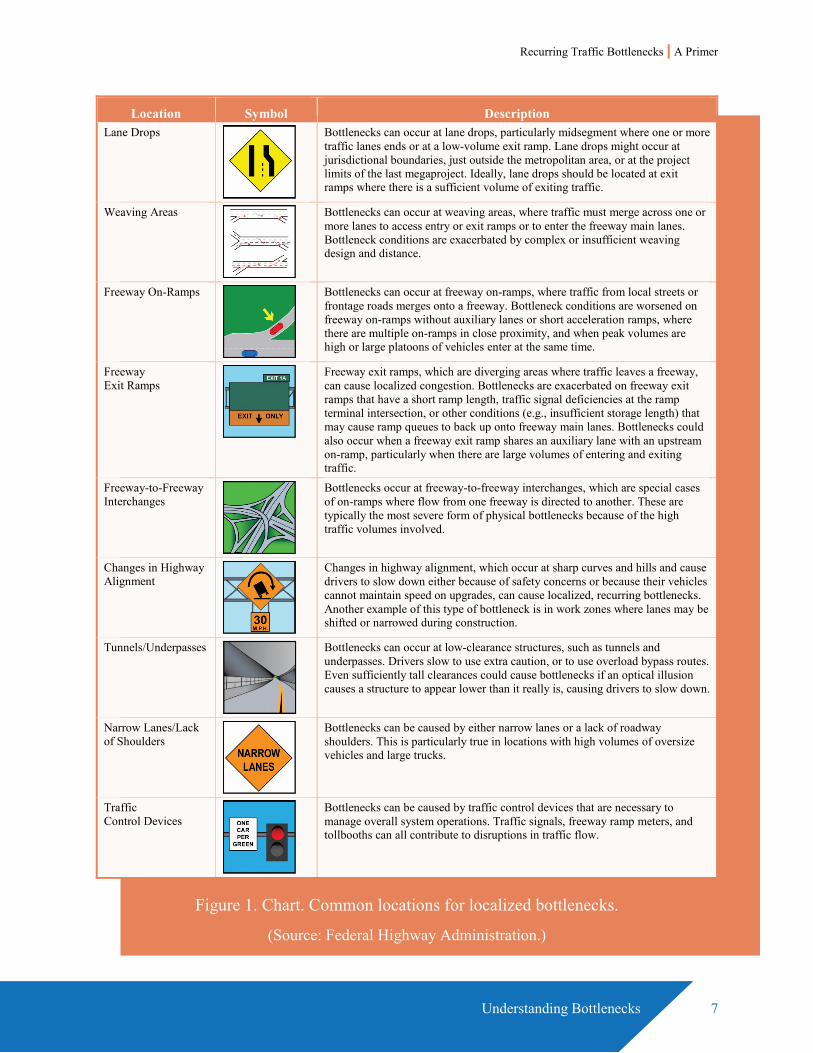
Location Symbol Description Lane Drops
Bottlenecks can occur at lane drops, particularly midsegment where one or more traffic lanes ends or at a low-volume exit ramp. Lane drops might occur at jurisdictional boundaries, just outside the metropolitan area, or at the project limits of the last megaproject. Ideally, lane drops should be located at exit ramps where there is a sufficient volume of exiting traffic.
Weaving Areas
Bottlenecks can occur at weaving areas, where traffic must merge across one or more lanes to access entry or exit ramps or to enter the freeway main lanes. Bottleneck conditions are exacerbated by complex or insufficient weaving design and distance.
Freeway On-Ramps
Bottlenecks can occur at freeway on-ramps, where traffic from local streets or frontage roads merges onto a freeway. Bottleneck conditions are worsened on freeway on-ramps without auxiliary lanes or short acceleration ramps, where there are multiple on-ramps in close proximity, and when peak volumes are high or large platoons of vehicles enter at the same time.
Freeway Exit Ramps
Freeway exit ramps, which are diverging areas where traffic leaves a freeway, can cause localized congestion. Bottlenecks are exacerbated on freeway exit ramps that have a short ramp length, traffic signal deficiencies at the ramp terminal intersection, or other conditions (e.g., insufficient storage length) that may cause ramp queues to back up onto freeway main lanes. Bottlenecks could also occur when a freeway exit ramp shares an auxiliary lane with an upstream on-ramp, particularly when there are large volumes of entering and exiting traffic.
Freeway-to-Freeway Interchanges
Bottlenecks occur at freeway-to-freeway interchanges, which are special cases of on-ramps where flow from one freeway is directed to another. These are typically the most severe form of physical bottlenecks because of the high traffic volumes involved.
Changes in Highway Alignment
Changes in highway alignment, which occur at sharp curves and hills and cause drivers to slow down either because of safety concerns or because their vehicles cannot maintain speed on upgrades, can cause localized, recurring bottlenecks. Another example of this type of bottleneck is in work zones where lanes may be shifted or narrowed during construction.
Tunnels/Underpasses
Bottlenecks can occur at low-clearance structures, such as tunnels and underpasses. Drivers slow to use extra caution, or to use overload bypass routes. Even sufficiently tall clearances could cause bottlenecks if an optical illusion causes a structure to appear lower than it really is, causing drivers to slow down.
Narrow Lanes/Lack of Shoulders
Bottlenecks can be caused by either narrow lanes or a lack of roadway shoulders. This is particularly true in locations with high volumes of oversize vehicles and large trucks.
Traffic Control Devices
Bottlenecks can be caused by traffic control devices that are necessary to manage overall system operations. Traffic signals, freeway ramp meters, and tollbooths can all contribute to disruptions in traffic flow.
Figure 1. Chart. Common locations for localized bottlenecks.
(Source: Federal Highway Administration.)
Recurring Traffic Bottlenecks | A Primer
8 Understanding Bottlenecks
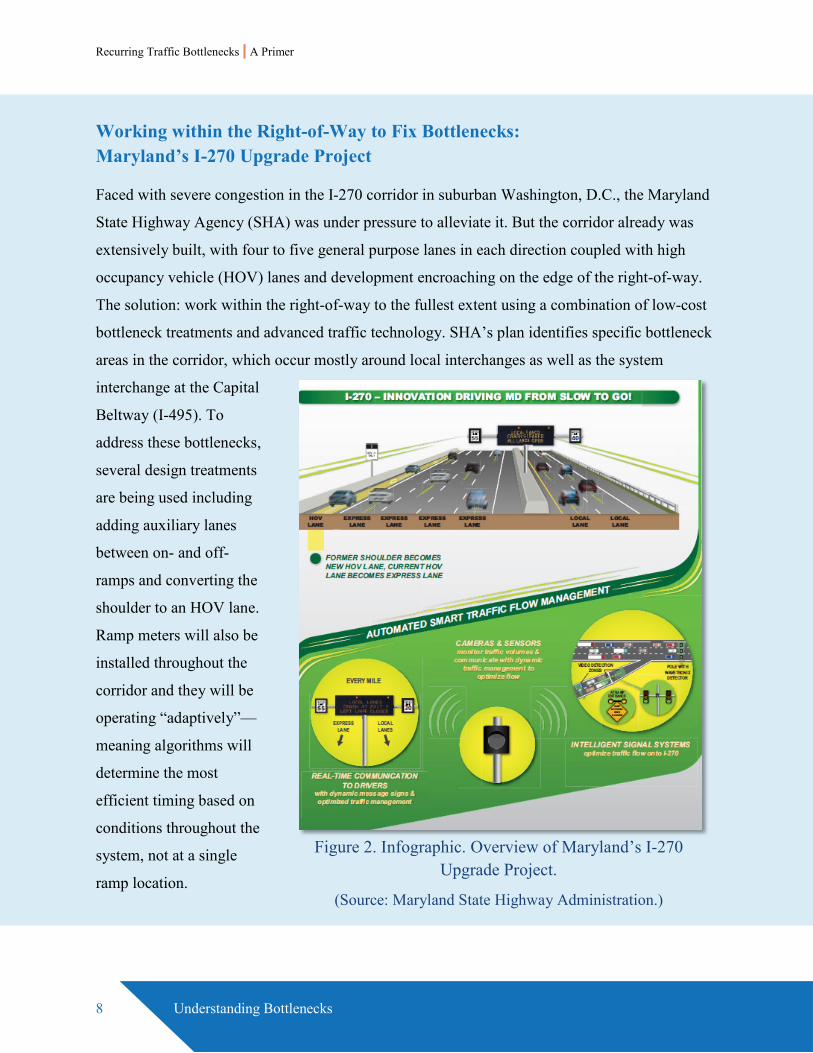
Working within the Right-of-Way to Fix Bottlenecks: Maryland’s I-270 Upgrade Project
Faced with severe congestion in the I-270 corridor in suburban Washington, D.C., the Maryland
State Highway Agency (SHA) was under pressure to alleviate it. But the corridor already was
extensively built, with four to five general purpose lanes in each direction coupled with high
occupancy vehicle (HOV) lanes and development encroaching on the edge of the right-of-way.
The solution: work within the right-of-way to the fullest extent using a combination of low-cost
bottleneck treatments and advanced traffic technology. SHA’s plan identifies specific bottleneck
areas in the corridor, which occur mostly around local interchanges as well as the system
interchange at the Capital
Beltway (I-495). To
address these bottlenecks,
several design treatments
are being used including
adding auxiliary lanes
between on- and off-
ramps and converting the
shoulder to an HOV lane.
Ramp meters will also be
installed throughout the
corridor and they will be
operating “adaptively”—
meaning algorithms will
determine the most
efficient timing based on
conditions throughout the
system, not at a single
ramp location.
Figure 2. Infographic. Overview of Maryland’s I-270 Upgrade Project.
(Source: Maryland State Highway Administration.)

Recurring Traffic Bottlenecks | A Primer
Understanding Bottlenecks 9
How Are Bottlenecks Monitored and Measured?
Two academic measures of congestion provide an important way to monitor and measure bottlenecks—“Travel Time Index” (TTI) and “Planning Time Index” (PTI). TTI is a measure of the buffer time (i.e., the additional time) that one should plan for a trip taken during peak periods.
Technically speaking, TTI is the ratio of the actual travel time divided by the travel time under free flow conditions. A TTI of 1.2 means that motorists, on average, are taking 20 percent longer for “that” trip than they would under free flow conditions.
PTI is measure travel time reliability. It is the total time one should plan for a trip taken during peak periods to ensure on-time arrival 95 percent of the time. PTI tells us how travel times for the same trip vary from day to day (i.e., against the worst day) because of disruptions like recurring congestion, incidents, bad weather, and work zones. A PTI of 2.20 means that for a 30 minute trip with “no” traffic, one should plan on 66 minutes during one’s commute in order to arrive on time or better 95 percent of the time. If today it only takes you 59 minutes, you’ve come out ahead!
The quarterly FHWA Urban Congestion Reports employ these measures to gauge drivers’ on-road experience across the country.2 The fact that a trip takes longer under congested conditions is not a startling concept, but the purpose of these reports are to present an objective, data-driven comparison of how congestion is increasing, or in some cases receding, due to a constantly changing menu of causes and/or mitigation techniques. Performance and trend data like those presented in the Urban Congestion Reports will be a prerequisite as the highway transportation community moves towards adopting a performance management approach to selecting and funding projects. What is performance management? In a nutshell, it is monitoring the performance of the highway system in a variety of “goal areas,” evaluating projects to see what has been successful—or not—and using that knowledge to plan for future improvements.
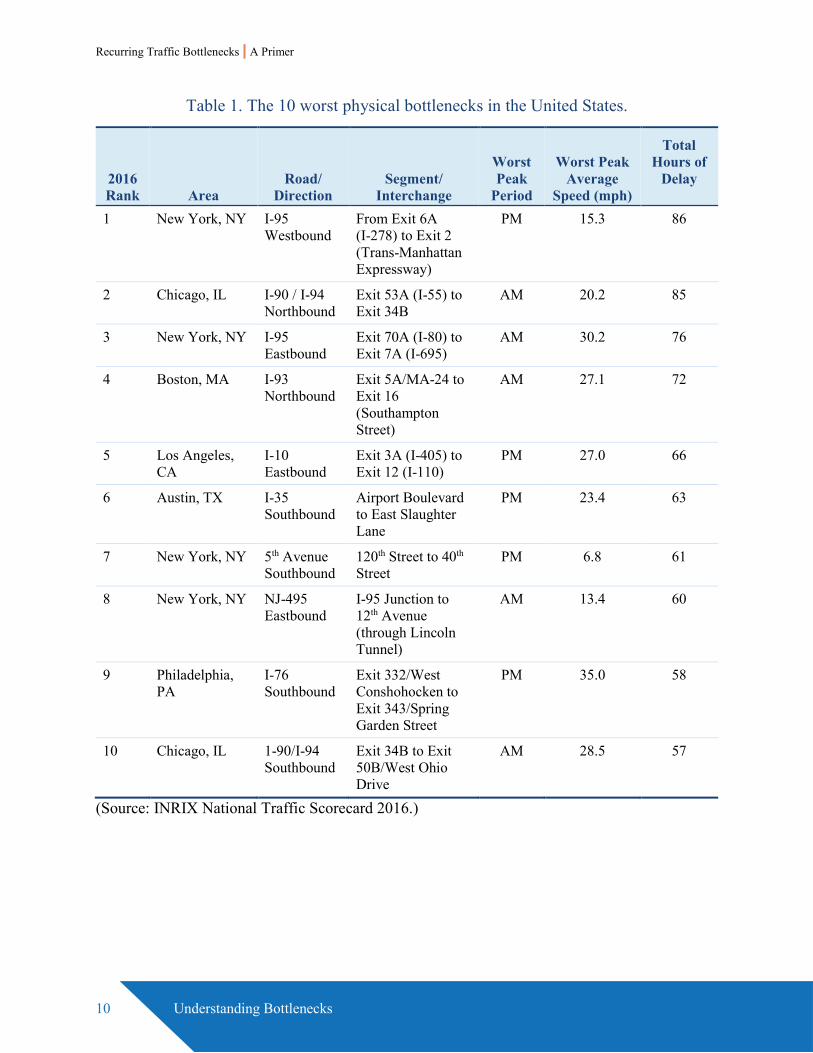
Methods for measuring bottlenecks, in turn, allows for the identification of priority bottlenecks to address with LBR strategies. A tabulation of the top 10 bottlenecks, compiled by INRIX in the National Traffic Scorecard 2016 Annual Report, is shown in Table 1. Their analysis uses raw data which comes from their historical traffic data warehouse along with discrete Global Positioning System (GPS) enabled probe vehicle reports from vehicles traveling the nation’s roads—including taxis, airport shuttles, service delivery vans, long-haul trucks, and consumer vehicles. FHWA’s publication, Traffic Bottlenecks: Identification and Solutions, explored both advanced methods for analyzing bottlenecks and innovative bottleneck treatments (see Figure 3). Many sections of this primer refer to this study.
2 https://ops.fhwa.dot.gov/perf_measurement/ucr/index.htm.
Recurring Traffic Bottlenecks | A Primer
10 Understanding Bottlenecks
Table 1. The 10 worst physical bottlenecks in the United States.
2016 Rank Area
Road/Direction
Segment/Interchange
Worst Peak
Period
Worst Peak Average
Speed (mph)
Total Hours of
Delay
1 New York, NY I-95 Westbound
From Exit 6A (I-278) to Exit 2 (Trans-Manhattan Expressway)
PM 15.3 86
2 Chicago, IL I-90 / I-94 Northbound
Exit 53A (I-55) to Exit 34B
AM 20.2 85
3 New York, NY I-95 Eastbound
Exit 70A (I-80) to Exit 7A (I-695)
AM 30.2 76
4 Boston, MA I-93 Northbound
Exit 5A/MA-24 to Exit 16 (Southampton Street)
AM 27.1 72
5 Los Angeles, CA
I-10 Eastbound
Exit 3A (I-405) to Exit 12 (I-110)
PM 27.0 66
6 Austin, TX I-35 Southbound
Airport Boulevard to East Slaughter Lane
PM 23.4 63
7 New York, NY 5th Avenue Southbound
120th Street to 40th Street
PM 6.8 61
8 New York, NY NJ-495 Eastbound
I-95 Junction to 12th Avenue (through Lincoln Tunnel)
AM 13.4 60
9 Philadelphia, PA
I-76 Southbound
Exit 332/West Conshohocken to Exit 343/Spring Garden Street
PM 35.0 58
10 Chicago, IL 1-90/I-94 Southbound
Exit 34B to Exit 50B/West Ohio Drive
AM 28.5 57
(Source: INRIX National Traffic Scorecard 2016.)
Recurring Traffic Bottlenecks | A Primer
Understanding Bottlenecks 11
Understanding Merging at Recurring Bottlenecks
Since this primer focuses on localized, recurring bottlenecks (i.e., distinct areas of recurring congestion due to decision points such as on- and off-ramps, merge areas, weave areas, lane drops, tollbooth areas, and traffic areas; or design constraints such as curves, climbs, underpasses, and narrow or nonexistent shoulders), it is important to discuss the number one driving behavior that causes congestion to build at these areas—namely, merging and weaving. Are you a “profiteering” lane merger, who seeks only your own personal gain, or are you an “altruistic” driver who yields to others for the benefit of all? Are you an “early merger” (who merges upstream of the point of confluence) or “late merger” (who merges at the last possible moment)? Are you “left-brain” or “right-brain”; Republican or Democrat; paper or plastic? In the end, there is no right or wrong, legally speaking. When and how one merges is more a study in human behavior, and less a study in efficiency. While you can rest assured that much research has focused on merging and weaving, the problem remains, as you will see in the next section, that humans cannot deduce instruction to merge as well as computer traffic models would purport to smooth it for us!
The Difference in Merging for Recurring and Nonrecurring Conditions
Merging maneuvers at recurring bottlenecks are essentially “cat herding” with implicit rules (often local in culture or habit) at best. Typically, not much guidance is given—everyone is on their own. In recurring situations, there is often only static signing (lane merge symbol, lane drop symbol, exit ahead sign, etc.) to inform the motorist that a situation is forthcoming. However, in
Figure 3. Photo. Cover of Federal Highway Administration’s Traffic Bottlenecks: Identification and Solutions report.
(Source: Federal Highway Administration.)
Recurring Traffic Bottlenecks | A Primer
12 Understanding Bottlenecks
a nonrecurring event like a crash or road construction, there is more likely to be advance warning and instruction in the form of orange cones, signs, flagmen, or police. One might argue “What’s the difference? I’m in bumper-to-bumper traffic regardless!” The key difference is the greater potential in nonrecurring conditions for herding those cats.
Controlling the chaos of lane merging is fundamental to advanced traffic operations strategies, be it by signing, metering, or facility design. In nonrecurring situations the “dynamic lane merge” (DLM) is increasingly used where a crash or work zone has “stolen” a lane. The DLM essentially is a proactive assembly of variable message signs that turn on when traffic sensors upstream detect a sufficiently slow-speed “trigger” and then turn off when free flow speeds return. It works best in side-by-side merging at slow speeds but it can also benefit the slightly higher-speed approaches to backups. The signs operate in a proactive manner to alert and encourage motorists to “Merge Here” or “Begin to Merge” to minimize motorists coming to a full stop, thereby bringing all traffic behind them to stop as well, and it encourages motorists to keep moving through, and past, the “nozzle” that releases the merge. The DLM system is a step up from static signs that tend to lack relevance over time. Elsewise, at highway on-ramps, ramp metering has long been used to control the rate of merges and, ideally, prevent the breakdown of traffic flow on the mainline. Regardless, it remains difficult to control lane merging at bottlenecks. Ultimately, the most successful merges (in terms of least delay and/or moving the most vehicles through the nozzle) involve cooperation from all motorists (i.e., take your turn) and not the inefficient hunt-and-peck of human nature trying to game the system to one’s own benefit. The following sections in this chapter give an overview of the evolving principles and approaches that agencies use to help herd those cats.
Merge Principles
How can we increase the efficiency of merging prior to the discharge point? In two words—be orderly. Not surprisingly, safety improves too. It is repeatedly shown that traffic is inherently safer when all vehicles are traveling at or near the same speed. Think of an orderly progression on a crowded escalator. Everyone is safely cocooned because they are going the same speed. Now imagine the bumping and chaos that would occur if/when impatient folks push past others. To help facilitate orderly merging, traffic experts have espoused two key merge principles, detailed below: 1) “go slow to go fast”; and 2) keep sufficient gaps.
Principle #1: “Go Slow to Go Fast”
“Go slow to go fast” is a seemingly paradoxical idea that, if we slow down the rate of our “mixing,” we can get past a constriction faster. A well-known example (actually the winning entry in a 2006 contest to demonstrate the meaning of “throughput maximization”) is the “rice experiment.” In the first case, dry rice is poured all at once into a funnel. In the second case, the same amount is poured slowly. Repeated trials generally conclude about a one-third time savings
Recurring Traffic Bottlenecks | A Primer
Understanding Bottlenecks 13
to empty the funnel via the second method. And, it should be noted, there is a tipping point as one graduates from a v-e-r-y slow pour, to a medium pace, and so on. What lesson does the rice experiment teach us about traffic? The densely packed rice (or traffic) in the first trial creates friction in the literal sense and the practical sense, respectively. The denser the traffic, the smaller the safety cushion around each driver, and the more cautious (i.e., slower) each driver becomes. In the real world there exist some examples of validation of this principle. At intersections the slowing or stopping of some traffic (e.g., traffic signals, roundabouts, yields, and vehicle detection) benefits the aggregate flow, and is far better than the free-for-all converse. In the bottleneck and corridor genres, we have ramp metering and speed harmonization, respectively, providing examples on freeways.
Principle #2: Keep Sufficient Gaps, or, Defeating the “Phantom” Traffic Jam
Keeping sufficient (or ideally, the largest possible) gaps leads to uniform and free(er) traffic flow. Sufficient gaps (or “buffers” as they are also known) allow drivers to make small adjustments (e.g., braking, accelerating, or drifting) without creating a “ripple” effect where adjacent and following vehicles react by slowing. We don’t have to tell you that the worst condition is the slow, bumper-to-bumper crawl wherein the smallest buffers are self-defeating. With only feet between cars, drivers are hesitant to (and effectively can’t) get up to running speed until the car in front has moved a sufficient distance away. The same concept occurs when one is waiting at a traffic signal; the entire line doesn’t surge ahead as one, rather, you must wait until the car in front of you (and the car in front of him) has moved sufficiently far away.
“Phantom” traffic jams on highways can occur seemingly out of nowhere. Why is it that even with moderate traffic, the speed ahead suddenly drops, with no apparent cause? A famous study asked drivers on a closed circular track to maintain an equal speed and two-car length spacing. This would seem to be an easy test for speed-regulated trams or even today’s autonomous, driverless cars. Heck, we’ve even seen motorcycle daredevils in the circus spin inside closed domes without hitting each other, so how hard can it be? Turns out, very hard! Successive trials repeatedly failed as one-by-one, drivers would either intentionally or inadvertently speed up due to impatience, or slow down due to perceived biases on how fast the car in front of them was going. It only takes one driver breaking the chain to cause the car-following to brake, and that in turn causes the inevitable reverberation and rippling down the line, eventually leading to full stop-and-go. Then, because humans’ reaction times vary, occasional larger gaps appear, only to have cars “chase” but then slow again so as not to overtake (i.e., hit) the car in front. This sinusoidal self-perpetuating “wave” pulses up and down a crowded traffic stream, eventually clearing only when gaps become so great again (or the volume thins) for everyone to mute the forward and rear buffers.
Gap maintenance (and thus, lane reliability) is achieved on-purpose in high occupancy vehicle (HOV) lanes or high occupancy toll (HOT) lanes—by selective admittance in the former, and by
Recurring Traffic Bottlenecks | A Primer
14 Understanding Bottlenecks
dynamically shifting the price every few minutes in the latter. The target benefit is to allow qualifying vehicles the guarantee of a free flow trip, versus the hit-or-miss prospect in the adjacent general purpose (GP) lanes. Both cases have the added (and intended) benefit of removing vehicles and or person-trips from the GP lanes too; so all traffic streams win when these practices are employed. Absent out-and-out violators who can muck up the system, agencies can tweak the lane mandates to keep the systems running at optimum levels. How does this apply to localized bottlenecks? Theoretically, the same “gapping” principles would hold true in backups; to wit, leaving progressively larger gaps would allow for progressively better progression. The point is that in congested situations the constant brake-tapping in bumper-to-bumper traffic works to self-perpetuate the problem. The ripple effects are short, abrupt, and inefficient. The obvious problem with the “keep sufficient gaps” principle, however, is that human nature simply won’t allow for the patience and orderliness to make this work. The second that I create a sufficient gap between me and the car ahead, some “profiteering” lane jumper will fill it. Which is a nice segue into the next sections—the debate over early versus late merging and the growing popularity of the “zipper merge.”
Which Is Best? “Early” or “Late” Merging?
Can a better recurring merge be developed? Merging takes place at-speed or “at-crawl.” The former is most often associated with free flow on-ramp maneuvers, while the latter is most often associated with bumper-to-bumper congestion. In either condition the motorist has the additional choice to merge “early” (upstream) or “late” (at point of confluence). This creates a matrix of four possible merge conditions; 1) at-speed “early”; 2) at-speed “late”; 3) at-crawl “early”; and 4) at- crawl “late.” To further complicate things, guidance concerning where, when, and how best to merge can vary from modest-to-no forewarnings in recurring conditions to fully deployed Traffic Control Plans (TCP) in nonrecurring conditions. Given that this primer is focused on the recurring bottleneck genre, the purpose of this section was to research if early or late merging was best for these non-controlled situations; i.e., when no active TCP exists.
Anecdotal evidence from many local traffic blogs and Internet searches finds strong sentiment from both camps as to why they think their method of merging is best. In the minds of many, early merging is the status quo, as merging early, well in advance of a lane closure, is seen as more courteous than zooming past a line of cars in order to merge late, immediately before a lane ends. However, proponents of late merging—now commonly called the “zipper merge”—have recently grown in number, with several State Departments of Transportation (DOT) endorsing the zipper merge at bottlenecks or work zones via videos, web pages, and roadside signs. The basic argument in favor of the zipper merge is that this maneuver allows drivers to occupy the full capacity of all available lanes, rather than forcing all drivers to queue up while the lane that is ending sits empty and unused beside them. In this way, the zipper merge both creates more capacity at the bottleneck and enforces order since drivers know exactly where to merge—immediately before the lane ends. It also sets up as a fairer method (e.g., “take turns”), but as we
Recurring Traffic Bottlenecks | A Primer
Understanding Bottlenecks 15
all have witnessed, not everyone plays by the ‘rules!’ On the other hand, opponents of the zipper merge highlight that the zipper merge is not suitable or safe in all situations—specifically, in “early merge” higher-speed conditions, where the later zipper merge leaves less room for error.
Since speed differential in adjacent lanes is a recognized safety threat in nominal roadway operation, it follows that it is a danger in merging circumstances too. A car in the dropped lane suddenly slowing to a crawl or fully stopping next to a free-flowing lane is every bit as dangerous as that same car speeding up to force-fit into a lane of stop-and-go traffic. “Early merge” seems favored by the traffic engineering community when mainline speeds are nearest to free-flow. The car in the dropped lane should keep up speed and safely blend into generally larger gaps of the moving lane. “Late merge,” (e.g., zippering) is generally seen as preferred when both lanes (mainline and dropped lane) are at stop-and-go and gaps are practically non-existent. Proponents opine that all available capacity of the closed lane can be filled up to the point of merge; it also seems to offer an “every other car” alternate fairness at the nozzle point. But these are not hard and fast guidelines or rules. Many States’ drivers’ manuals simply say “merge when it is safe” and leave it at that. Per our research, zippering, specifically, was not found to be a legislated precept on par with, say, seat belt laws or distracted driving laws. However, the fact that some State DOTs favor zippering to the point of promoting it (but only in stop-and-go work zones or similar) would seem reason enough to at least recognize it as a “practice” if not a mandate. Further detail on zipper merge research and applications is provided below.
The Zipper Merge—Research and Applications
Recently several State DOTs have begun promoting and enacting the zipper merge in specific circumstances—in particular, highway work zones. Often, these States have produced informational web pages or videos as part of their public outreach and education efforts for zipper merge applications. For instance, the Minnesota DOT, the Kansas DOT, and the Nebraska DOT all have zipper merge web pages with informational videos. 3,4,5
Other State DOTs have partnered with universities to conduct studies on the potential benefits of the zipper merge. Specifically, the North Carolina DOT has partnered with the North Carolina State Institute for Transportation Research and Education (ITRE) to study whether zippering can ease congestion, and has explored the implementation of a zipper merge sign. 6,7 Likewise, the Virginia Transportation Research Council (the Virginia DOT and the University of Virginia, in cooperation with the FHWA) conducted a similar study in 2004 and the University of Nebraska 3 http://www.dot.state.mn.us/zippermerge/. 4 http://www.ksdot.org/bureaus/kcmetro/zipper-merge.asp. 5 http://dot.nebraska.gov/news-media/transportation-tidbits/zipper-merge/. 6 https://apps.ncdot.gov/newsreleases/details.aspx?r=12682. 7 http://abc11.com/traffic/new-zipper-merge-sign-what-does-that-even-mean/1456186/.
Recurring Traffic Bottlenecks | A Primer
16 Understanding Bottlenecks
published a 1999 study that is often cited which compares the Nebraska DOTs’ traditional approach to merging to the zipper/late merge.8,9
While there is no definitive guidance for applying the zipper merge, these studies do offer insights into the potential benefits and applications of the zipper merge. The authors of the Virginia Transportation Research Council study concluded that the late/zipper merge should be considered for “3-to-1 lane closure configurations”—although not until a sound methodology for deployment has been tested in the field. The North Carolina DOT/ITRE study is not yet finalized, but researchers there have highlighted anecdotal findings such as a zipper merge site in Michigan where the congestion area was reduced from six miles to three miles.
Principles Put into Practice: Variable Speed Limits and Speed Harmonization
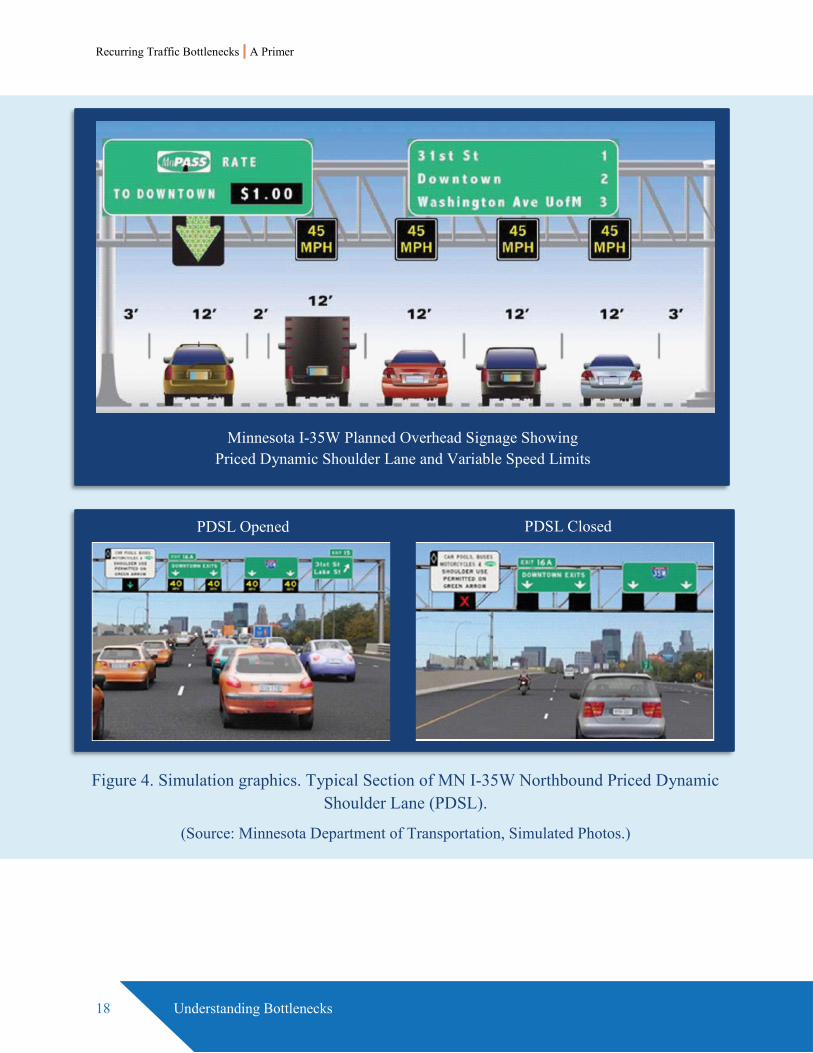
Variable speed limits (mostly applied in work zones; i.e., nonrecurring conditions) and the European concept of “speed harmonization” both intend to “harmonize” traffic by regulating speeds. In the latter case, a series of overhead gantries gradually adjust speeds through congested highway segments in order to flatten the sinusoidal effect of traffic speeds bouncing between open sections and interchanges. Speed harmonization is typically applied as the open highway approaches the denser central business district. A great expense is incurred by the cost of the overhead—spanned gantries, the necessary detectors, the interconnectivity, the operational overhead, and the sheer number of gantries required along the multi-kilometer corridor. Speed harmonization, however shows that “go slow” as a merging principle can be translated into an operational strategy to move more traffic through a congested highway segment. Several applications of speed harmonization exist throughout the United States. For example, the Minnesota DOT has deployed a variable speed limit system on I-35W in Minneapolis in conjunction with a “priced dynamic shoulder lane” (PDSL).
Figure 4 shows a schematic of how the Minnesota DOT system operates. The features of this comprehensive system include:
• During off-peak hours the lanes are not tolled and are open to general traffic with the exception of northbound lanes from 42nd Street to downtown.
• Two-plus carpools, transit, and motorcycles travel toll free.
• The lanes are dynamically priced based on demand.
8 http://www.virginiadot.org/vtrc/main/online_reports/pdf/05-r6.pdf. 9 Pesti et al., Traffic Flow Characteristics of the Late Merge Work Zone Control Strategy,
Transportation Research Record 1657, Paper No. 99-0925, 1999.
Recurring Traffic Bottlenecks | A Primer
Understanding Bottlenecks 17
• PDSL operates as a priced lane during peak periods to maximize capacity on existing roadways.
• Electronic signs alert drivers whether the PDSL is open or closed.
• Variable speed limits are set in the adjacent non-tolled lanes.
Is Murphy Right? Does the Other Lane “Always Move Faster”?
How many times have you observed that “the other lane is moving faster” only to get into that lane and then watch your original lane move past you? Actually, you are at the whim of “observation selection bias” which essentially opines that one will selectively conclude a result on the basis of a distortion of data; in this case, your distorted sampling of only the cars that are moving, and less so the ones that aren’t. So, does cutting in line help you?
Imagine two lanes of cars. The left lane (L) is the continuous lane and the right lane (R) is dropping. You are 6th in line in R lane. If everyone stays put and “zippers” then the zipper order is L, R, L, R, etc. Your neighbor to your left is 11th and you will be 12th to merge. If, however, you “early merge” and cut in front of him into the L line, then you will now be 11th to merge, the person behind you (formerly 14th) moves up to 12th, and your neighbor drops to 13th. You win. Your neighbor loses. But the guy behind you benefits most.
Now consider the same scenario except the zipper order is R, L, R, L, etc. In the orderly scenario you would be 11th and your neighbor is 12th. If you cut in front of him, the guy behind you moves up to 11, you are now 12th, and your neighbor is now 14th. Your neighbor really loses (drops two slots) and the guy behind you (formerly 13) really wins; he gains two spots—again.
Congratulations! In both scenarios you have definitely improved the slot for the guy behind you! You may or may not have improved your slot. And in either case, you made your neighbor mad! And in the end, all the jockeying you have done may have been canceled by someone ahead of you. So maybe it’s better to leave Murphy’s Law to “anything that can go wrong will” and let zippering be the fair and simple solution to traffic backups.
Recurring Traffic Bottlenecks | A Primer
18 Understanding Bottlenecks
Figure 4. Simulation graphics. Typical Section of MN I-35W Northbound Priced Dynamic Shoulder Lane (PDSL).
(Source: Minnesota Department of Transportation, Simulated Photos.)
Minnesota I-35W Planned Overhead Signage Showing Priced Dynamic Shoulder Lane and Variable Speed Limits
PDSL Opened PDSL Closed
Recurring Traffic Bottlenecks | A Primer
Dealing With Bottlenecks Programmatically 19
CHAPTER 3. DEALING WITH BOTTLENECKS PROGRAMMATICALLY
What is the Federal Highway Administration Doing to Mitigate Bottlenecks?
The Federal Highway Administration’s (FHWA) Localized Bottleneck Reduction (LBR) program is entirely aimed at reducing localized, recurring congestion caused by bottlenecks. The LBR program promotes operational and low-cost bottleneck mitigation strategies to improve mobility at specific locations. Managed by the FHWA Office of Operations, the program serves to bring attention to the root causes, impacts, and potential solutions to traffic chokepoints that cause recurring congestion; ones that are wholly the result of operational influences. The goal of the program is to raise awareness of bottlenecks at the State level and promote low-cost, quick-to-implement geometric and operational improvements to address recurring chokepoints. The LBR program has pursued this goal through several activities, including:
• This primer, which is in its fourth iteration and provides an overview of the wide range of operational and low-cost strategies available to reduce congestion at bottlenecks as well as guidance for agencies implementing LBR programs.
• A compendium of State best practices in bottleneck identification, assessment, countermeasures, and evaluation—including how bottlenecks are treated in the annual planning and programming processes.
• Version X of the Traffic Analysis Toolbox which focuses on what analysis tools are available, necessary, and productive for localized congestion remediation.
• State-specific workshops for State and local agencies to learn and share information on localized bottleneck reduction strategies and how they can be incorporated into their respective planning processes. (Contact the Office of Operations if your agency is interested in hosting a no-cost to you workshop that looks into congestion and treatments.)
In concert with the LBR program, the FHWA promotes the mitigation of other types of congestion, in particular systemic, recurring congestion as well as nonrecurring congestion. Key strategies to reduce systemic, recurring congestion include tolling and pricing; public-private partnerships; real-time traveler information; corridor traffic management; arterial management and traffic signal timing; and active traffic management. Key strategies to reduce nonrecurring congestion include transportation systems management and operations (TSMO); traffic incident management (TIM); work zone management; road weather management; and the Highways for LIFE program. Strategies to manage all types of congestion are critical to enhancing the mobility and reliability of the nation’s highway system—as is knowing when and where to apply each strategy.

Recurring Traffic Bottlenecks | A Primer
20 Dealing With Bottlenecks Programmatically
Benefits of Localized Bottleneck Reduction Strategies
The LBR program focuses on operationally influenced bottlenecks—small, localized “hot spots” where the design of the roadway itself becomes the constricting factor in processing traffic demand, resulting in recurring delays of generally predictable times and durations. Megaprojects required to resolve major bottleneck problems and systemic congestion (e.g., entire corridor rebuilds, multi-mile lane additions, and systemwide improvements) are far and above the focus of this program area. Unfortunately, when weighed against these larger, more visible projects, localized bottleneck problems often receive lower priority for funding or are put off entirely until they can be implemented as part of the larger, all-encompassing project. However, in this day and age of fiscal constraints, with agencies facing over-escalating costs and increasingly limited right-of-way, it is evident that “business as usual” in resolving congestion problems no longer applies. Low-cost bottleneck mitigations have several advantages that can help agencies deal with these developments:
• They address current problems and therefore have high visibility. Agencies are under increasing pressure to do something immediately about congestion problems. Because low-cost bottleneck treatments are small in scale, they can be implemented quickly, so benefits start accruing immediately.
• They are highly cost-effective and usually have positive safety impacts. Low-cost bottleneck treatments could mitigate or reduce crashes within weaving and merging areas, thereby increasing the cost-effectiveness relative to safety merits.
• They will be required as transportation funding for megaprojects becomes more constrained. Major reconstruction projects are often justified as the only valid solutions to relieve congestion at the worst bottleneck locations. However, the cost of executing such projects is usually enormous. Low-cost bottleneck improvements provide an effective way to stretch scarce resources.
• Lower cost means more locations can be addressed. More spot solutions can be implemented throughout a region, addressing more corridors than just a few large projects.
• They are less invasive on the physical and human environments. The environmental footprint of low-cost bottleneck projects is very low, both in terms of disruptions during construction and final design.
• They are not necessarily just short-term fixes. For some low-cost treatments, congestion benefits will play out over many years, not just a few. In fact, when combined with other forms of treatment (e.g., demand management and operations), they may be part of a long-term solution for a problem location or corridor.
• They may be considered part of major reconstruction projects to address current problems. Some State DOTs have successfully incorporated low-cost bottleneck treatments within the context of larger, multiyear reconstruction projects.
Recurring Traffic Bottlenecks | A Primer
How to Structure a Localized Bottleneck Program 21
CHAPTER 4. HOW TO STRUCTURE A LOCALIZED BOTTLENECK PROGRAM
What is Stopping Us from Fixing Bottlenecks?
States have cited a number of barriers to establishing bottleneck-specific or similar programs that target chokepoint congestion:
• Predisposition for large scale, long-term congestion mitigation projects. Traditional transportation planning and programming efforts are often predisposed toward major capital improvement projects to relieve congestion such as corridor-widening or massive reconstruction of an interchange. There is also no shortage of demand management strategies designed to fight the congestion battle, such as high occupancy vehicles (HOV), tolling and pricing, transit alternatives, and ridesharing programs. But the onerous processes involved in many of these initiatives can squeeze out smaller programs.
• Lack of program identity. Unless there is a formal program identity, bottleneck remediation is usually relegated to a few projects completed as part of an annualized safety program, or as a subordinate part of larger, other purposed projects.
• Lack of a champion. Many successful State or metropolitan planning organization programs are the result of one or more persons taking charge to either mandate or adopt a program. High-level administrators often set the policy direction and strategic initiatives for their agencies, while midlevel managers’ production reflects their priorities and skills in executing those initiatives.
• Lack of resources. Many State agencies are finding themselves overworked and understaffed. Although the return on investment for Localized Bottleneck Reduction (LBR) projects are high, agencies often do not have the in-house resources necessary to conduct detailed analyses required to evaluate and prioritize the large number of potentially competing projects. With limited resources, agencies are relegated to hiring consultants and/or universities to conduct detailed project analysis.
• Lack of funding. With many State agencies experiencing major budget shortfalls, lack of funding continues to be an often cited barrier to implementing new programs.
• Responsibility has not been assigned. Not part of ongoing planning and programming processes. Localized bottleneck mitigation projects are not often included in the ongoing planning and programming processes for most agencies. Others struggle with how best to identify problem locations, assess existing conditions, and quantify the impacts of proposed remedies, as there is no structured process in place. For example, in developing their structured LBR program, the Michigan Department of Transportation (DOT) cited challenges
Recurring Traffic Bottlenecks | A Primer
22 How to Structure a Localized Bottleneck Program
regarding how best to justify and evaluate project impacts while creating a level playing field for application of LBR funding across each of their seven regions.
• A culture of legacy practices. Many agencies face institutional challenges in changing their current business practices. For example, one agency dutifully executed an annualized “safety” program and looked only at crash rates in determining their annual top 10 list of projects. After instituting a congestion mapping process, they identified several significant stand-alone chokepoints that did not correlate with their high-crash mapping. Thereafter, high-congestion hot spots competed with high-accident hot spots on their unified top 10 list of projects. In addition, even if there is agreement that an LBR should exist, barriers often exist for implementing specific projects, including:
• Design challenges. LBR treatments may sometimes require “nonstandard” designs. Seeking exceptions to design standards is often tedious with no guarantee that they will be approved.
• Safety challenges. Even if design issues are resolved, safety issues may still be present. For example, eliminating a shoulder to obtain an extra through lane may have safety implications.
By proactively addressing as many of the above barriers as possible, State and regional transportation agencies can work to establish an annualized LBR program identity that gives congestion hot spots the appropriate level of consideration and attention relative to other transportation improvement programs.
Overcoming Challenges to Implementing Localized Bottlenecks Reduction Projects
The Federal Highway Administration (FHWA) publication, An Agency Guide on Overcoming Unique Challenges to Localized Congestion Reduction Projects, provides more guidance for agencies wishing to implement an LBR program (Figure 5).10 This report presents and describes examples of institutional, design, funding, and safety challenges that agencies face when trying to develop unique solutions to localized congestion problems. The main questions that this guidance helps an agency address are below.
1. What are the most common barriers and challenges with addressing localized congestion problems?
2. What are some case study examples that highlight how barriers and challenges have been overcome?
3. What are some of the key factors in successful implementation of localized bottleneck projects?
10 https://ops.fhwa.dot.gov/publications/fhwahop11034/index.htm.
Recurring Traffic Bottlenecks | A Primer
How to Structure a Localized Bottleneck Program 23
Through a series of case studies, documented in An Agency Guide on Overcoming Unique Challenges to Localized Congestion Reduction Projects, States and metropolitan planning organizations (MPO) have developed innovative ways to overcome the common barriers to LBR projects. The case studies identified the most common barriers and challenges associated with addressing localized congestion problems and the key factors in successful implementation of localized bottleneck projects.
Figure 5. Photo. Cover of Federal Highway Administration’s An Agency Guide on Overcoming Unique Challenges to Localized Congestion Reduction Projects.
(Source: Federal Highway Administration.)

Recurring Traffic Bottlenecks | A Primer
24 How to Structure a Localized Bottleneck Program
Table 2. Examples of how agencies have addressed localized bottleneck issues.
Challenge Description Case Studies Outcome Institutional
Having a project champion. Dallas, TX Kansas City, KN
+: 20+ projects due to agency champions. +: Governor passes bill allowing buses on shoulders.
Disposition towards megaprojects. Minneapolis, MN Manchester, NH
+: Similar benefit for $7 million versus $138 million projects. +: Expedited work at Exit 5 as part of megaproject.
Project planning and programming requirements.
Danbury, CT Austin, TX
+: Restriping at Exit 7 improved flow significantly. +: Multidisciplinary group mitigating congestion.
Lack of training/understanding on how to develop a successful project.
Dallas, TX LBR workshops
+: Freeway Bottleneck Workshop. +: Federal outreach workshops building consensus.
Knowledge of problem locations that can be fixed with low-cost solutions.
Phoenix, AZ Dallas, TX Littlerock, AR
+: Regional bottleneck study. +: Aerial freeway congestion mapping. +: Operation Bottleneck program by MPO.
A culture of historical practices. Saginaw, MI +: Successful roundabout at I-75/Michigan 81 interchange.
Deficiency with internal and external coordination (design/operations).
New York, NY +: Functional groups.
Can’t implement projects without being in approved regional/State plans.
Rhode Island DOT
+: Creation of the Strategically Targeted Affordable Roadway Solutions (STARS) program.
No incentive or recognition for successful low-cost bottleneck reductions.
Dallas, TX +: Engineers performance evaluation includes bottlenecks.
Will the proposed solution work?—Lack of confidence.
Florida DOT +: Trial fix with cones made permanent with striping.
Design
Design exception (DE) process is difficult.
Pittsburgh, PA +: New shoulder to avoid DE, Academy I-279.
“Nonstandard” design is considered a deal-breaker.
Minnesota DOT +: Creation of “flexible design” concept.

Recurring Traffic Bottlenecks | A Primer
How to Structure a Localized Bottleneck Program 25
Table 2. Examples of how agencies have addressed localized bottleneck issues (continuation).
Challenge Description Case Studies Outcome Design
Problem is too big and nothing short of a rebuild will fix it.
Plano, TX +: Implement auxiliary lane on U.S. 75 at SH 190.
Spot treatment will move problem downstream and not improve mobility.
Renton, WA +: SR 167 spot fix near Boeing reduces congestion.
Standard design practices contribute to bottleneck formation.
Fort Worth, TX +: I-20/SH 360 fix defies Americans Associated of State and Highway Transportation Officials (AASHTO) basic lanes policy.
Funding
There is no dedicated funding category for this type of project.
Mississippi DOT Nebraska DOT
+: I-10 shoulder use after Katrina improves flow. +: ITS funds for ramp gates to fix U.S. 75 bottleneck.
Low-cost solution may blur or preclude need for bigger project.
Dallas, TX +: I-635 early action doesn’t stop $3 billion megaproject.
Don’t understand if alternate funding categories can be used.
Virginia DOT Ohio DOT
+: STARS program uses safety funds to target congestion. +: Safety funds include congestion index.
Lack of available resources (e.g., DOT striping crews) for implementation.
Dallas, TX +: District striping contract implements small fixes.
Safety
Hesitancy to implement solution that does not follow standard design.
Minnesota DOT +: Mobility crisis from I-35 bridge collapse.
Perception that safety compromised with low-cost, nonstandard fixes.
Texas DOT +: Average 35 percent crash reduction for 13 projects in Texas.
Lack of shoulders takes away necessary refuge areas.
Arlington, TX +: Crash reduction at SH 360/Division.
Lanes that are not full width create safety issues for large trucks.
Dallas, TX +: I-30 Canyon truck rollovers basically eliminated.
(Source: Federal Highway Administration.)
Ideas for Structuring a Localized Bottleneck Reduction Program
There are no set guidelines for establishing an LBR program and no two programs will look the same. State DOTs, MPOs, or local transportation agencies are the traditional organizations who
Recurring Traffic Bottlenecks | A Primer
26 How to Structure a Localized Bottleneck Program
lead LBR efforts as part of larger missions of the organization. Many times, the State may identify bottlenecks and work closely with MPOs to integrate these projects into the Transportation Improvement Plan (TIP) and other targeted funding sources such as Congestion Mitigation and Air Quality (CMAQ) and safety. Other times, low-cost bottlenecks can be addressed programmatically at the State DOT level by reviewing existing plans and programs and looking for opportunities to include LBR improvements and strategies. Examples of how transportation agencies have structured LBR programs include the following:
Periodic Special Program or Initiative
In 2007, the Minnesota DOT was asked by the State legislature to develop a rapid turnaround plan to identify low-cost, quickly implementable projects that were not already identified by the traditional planning and programming processes. In a matter of months, this unique approach led by the traffic management center engineers basically “brainstormed” low-cost, candidate projects that were nagging problems, but for whatever reasons, had never landed on traditional capital improvement programs. Starting with over 150 ideas, the panel met monthly on a fast track. Each time they met they would reduce by half the list of candidate projects until they finally reached consensus on a few projects that were deemed to have the highest benefit returns and also fit within the given budget. One of the final projects was picked by the local newspaper as the “public works project of the year” since it concurrently solved a years-old problem with a relatively low-cost and quick turnaround solution—as in, “why didn’t anyone think of this before?” Similarly, in 2008, the Central Arkansas MPO undertook “Operation Bottleneck,” a campaign to openly solicit public input of candidate locations, although the program had a finite life span to implement. Both of these examples show how a little ingenuity and maybe some out-of-the-box brainstorming can overcome traditional stovepipe thinking.
Incorporating Bottlenecks into Other Programs
At the State DOT level, low-cost bottlenecks can be addressed programmatically even without a special program or initiative. One approach is to conduct a review of existing plans and look for opportunities to include LBR improvements in them. For example:
• The California DOT (Caltrans), Corridor Management Process. Caltrans, as part of their Corridor Management Process, includes the identification of bottlenecks and potential short-term fixes as part of an overall and long-term strategy for making corridor improvements.
• The Ohio DOT, Federal Hazard Elimination Program. The Ohio DOT added a congestion-based index ranking to their annual identification of spot safety problems for the Federal Hazard Elimination Program (HEP).
• The Washington State DOT, Moving Washington Initiative. The Washington State DOT recognizes bottlenecks and chokepoints as an integral part of their project planning and development process. The recent Moving Washington initiative incorporates LBR concepts
Recurring Traffic Bottlenecks | A Primer
How to Structure a Localized Bottleneck Program 27
into a coordinated program to address congestion. At the planning stage in their Highway System Plan, the WSDOT considers bottlenecks together with traditional corridor improvements under the “Congestion Relief” category. Congestion relief projects are ranked using the benefit/cost ratio, contribution to performance goals, and other qualitative factors, and compete on these bases with projects in other categories in the Highway System Plan: Preservation, Safety, Environmental Retrofit, Economic Vitality, and Stewardship.
• Metropolitan Planning Organization Congestion Management Process. At the MPO level, the short-term nature of LBR projects meshes well with the Congestion Management Process (CMP). As planners’ perspectives broaden to include this shorter-term view of the system (in addition to the traditional long-range view), an LBR program makes perfect sense from a planner’s viewpoint, LBR improvements would be another aspect of the CMP process. Because an LBR program should be data- and performance- driven, it is a logical complement to a CMP; the same data should be used for both purposes. In fact, within the context of the CMP, it may useful to make the two processes seamless, at least at the MPO level.
Formal Low-Cost Bottleneck Improvement Programs
Another option is to establish a defined bottleneck program within the agency, as illustrated by the following examples:
• The Colorado DOT “Colorado Bottleneck Reduction Assistance” (COBRA). In 2014 the Colorado DOT (CDOT) established the Corridor Operations and Bottleneck Reduction Assistance (COBRA) program, which identifies and implements operations improvements for State corridors to address localized bottlenecks and other operational improvement opportunities. The COBRA program is formalized, with a dedicated director as well as documented goals, objectives, and a weighting system for prioritizing projects based on these goals and objectives. The COBRA program also has a formally scheduled cycle for submitting, funding, and delivering projects. Since 2014, the COBRA program has identified well over 100 projects and prioritized them based on the weighting system—and this number continues to grow as the COBRA program works towards cost-effective solutions to operational bottlenecks.
• Virginia’s and Rhode Island’s Programs. Other examples include the Virginia DOT (VDOT) Strategically Targeted Affordable Roadway Solutions (STARS) Program, which is a safety and congestion program that partners State, planning district and local transportation planners, traffic engineers, safety engineers, and operations staff to identify “hot spots” along roadways where safety and congestion problems overlap and are suitable for short-term operational improvements. As new construction or growth occurs in a corridor, the STARS plan for that corridor is infused into the overall public improvements. Also, as periodic funding is released, the STARS projects stand as “shovel ready” projects. Following the
Recurring Traffic Bottlenecks | A Primer
28 How to Structure a Localized Bottleneck Program
VDOT’s success, the Rhode Island DOT (RIDOT) modeled its own version of the VDOT’s STARS program to meet its own low-cost bottleneck program needs.
Potential Issues with Localized Bottleneck Reduction Treatments
In addition to barriers that inhibit the creation of a LBR program, issues related to implanting LBR strategies also exist. Agencies have cited the following barriers associated with LBR strategies:
• Compliance with State Implementation Plans for Air Quality Conformity. State Implementation Plans (SIP) set forth the State’s strategy for getting its air quality within National Ambient Air Quality Standards (NAAQS) and keeping it there. They include a large variety of project types, including transportation projects, and extensive emissions modeling is undertaken to estimate their impact. There is a great deal of uncertainty as to how an LBR project might affect the SIP: does the entire SIP have to be redone, does emissions modeling just for the LBR project have to be performed, or can the emissions impacts be assumed to be small enough that they can be ignored? Such occurrences must be dealt with on a case-by-case basis by agencies wishing to undertake bottleneck projects. One point worth noting: if air quality conformity in a location precludes or discourages major capital expansion (e.g., additional lane-miles), the type of improvements in a localized bottleneck program clearly do not fall in this category.
• Compliance with Long-Range “Design Concepts.” In some cases, a design concept or goal has been formally established for a roadway or corridor, with the idea that any improvements should be part of that concept. When the design concept is institutionalized, it may be difficult to deviate from it with an LBR treatment that does not match. Agencies must decide and weigh the benefits/costs of doing smaller bottleneck solutions in the short term against the benefits/costs of waiting for a more complete solution. This decision can be difficult, especially for agencies without a good appreciation for the typical benefits and costs of smaller bottleneck solutions and how long those benefits might last.
• Compliance with Design and Safety Standards. LBR treatments tend to be of a smaller scale than typical capital improvement projects. This means that the redesign is usually not made to existing design standards, which depending on the funding source, may require a formal design exception. Further, even if a design exception is not needed, safety problems may be introduced by the LBR treatment, especially if the identified problem is congestion-oriented. To address this issue, LBR treatments need to be assessed for potential safety impacts prior to implementation. Also, a Roadway Safety Audit of the design would be beneficial. Based on the review, additional mitigation of safety impacts may be warranted, or a close monitoring of crash experience at the site may be used. Finally, agencies should be in contact with the FHWA division offices throughout the process as design review may be required, depending on circumstances.
Recurring Traffic Bottlenecks | A Primer
Analytical Identification and Assessment of Bottlenecks 29
CHAPTER 5. ANALYTICAL IDENTIFICATION AND ASSESSMENT OF BOTTLENECKS
Where Are the Bottlenecks and How Severe Are They?
Every highway facility has decision points such as on- and off-ramps, merge areas, weave areas, lane drops, tollbooth areas, and traffic signals; or design constraints such as curves, climbs, underpasses, and narrow or nonexistent shoulders. In many thousands of cases, these operational junctions and characteristics operate sufficiently and anonymously. However, when the design itself becomes the constricting factor in processing traffic demand, then an operationally influenced bottleneck can result.
The degree of congestion at a bottleneck location is related to its physical design and the volume overburden. Some operational junctions were constructed years ago using design standards now considered to be antiquated, while others were built to sufficiently high design standards but are simply overwhelmed by traffic demand. Bottlenecks, then, develop when both of these conditions exist; that is, an operational constraint that is acted upon by a traffic overburden. This is commonly “rush hour.” Absent one or the other, the condition won’t exist. The following sections provide some guidance on how to identify bottleneck locations.
Direct Observation
At the local level, engineers and planners are often aware of bottleneck locations because they can directly observe the congestion they cause. Soliciting the input of local transportation personnel has been used successfully by many States in identifying bottleneck locations. Once the locations are identified, the nature of the problem can be assessed. In concert with this, the characteristics of common bottlenecks (i.e., the characteristics presented previously in Figure 1); can be used as a screen to identify the specific problem that causes the bottleneck.
The Minnesota Department of Transportation (DOT) successfully combined expert judgment, data analysis, and modeling to develop a list of bottleneck projects to be undertaken as part of their congestion management activities. This process was accomplished in a span of three months from late January 2007 through mid-April 2007 (see Figure 5). The overriding strategy for this process was to identify smaller-scope, lower-cost projects that could be delivered within two years and would significantly relieve congestion without pushing it further downstream.
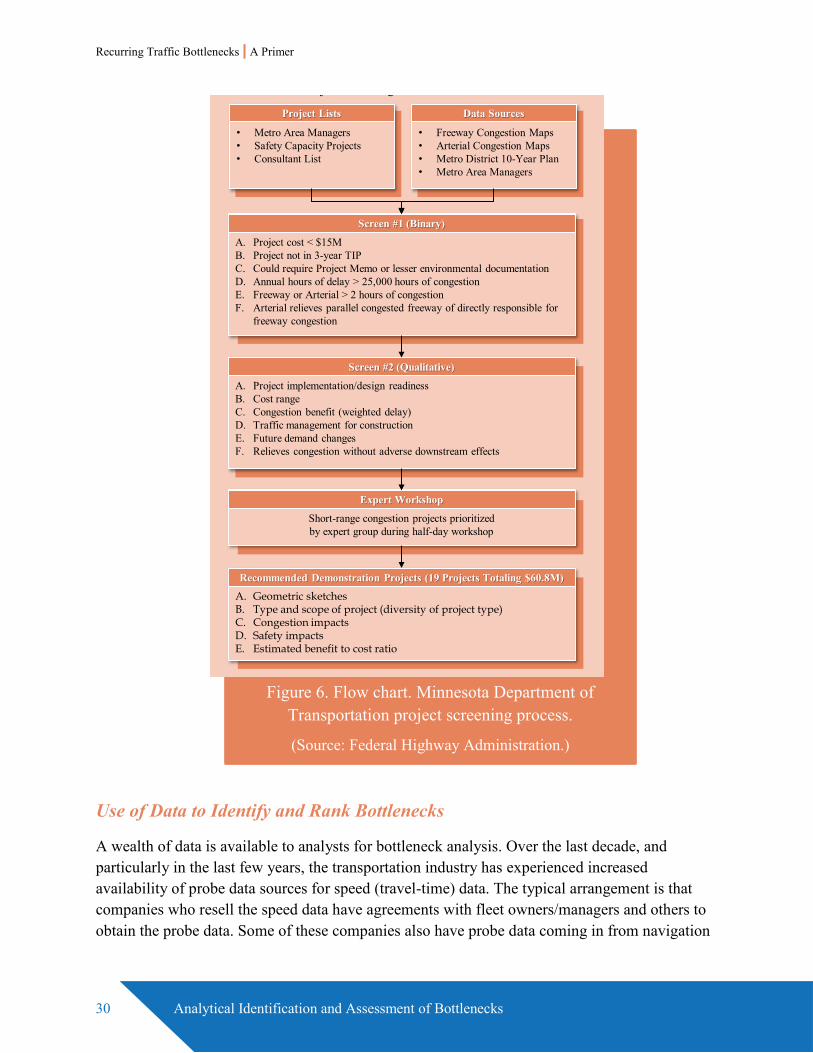
Recurring Traffic Bottlenecks | A Primer
30 Analytical Identification and Assessment of Bottlenecks
j g
A. Project implementation/design readinessB. Cost rangeC. Congestion benefit (weighted delay)D. Traffic management for constructionE. Future demand changesF. Relieves congestion without adverse downstream effects
Screen #2 (Qualitative)
Short-range congestion projects prioritized by expert group during half-day workshop
Expert Workshop
A. Geometric sketchesB. Type and scope of project (diversity of project type)C. Congestion impactsD. Safety impactsE. Estimated benefit to cost ratio
Recommended Demonstration Projects (19 Projects Totaling $60.8M)
A. Project cost < $15MB. Project not in 3-year TIPC. Could require Project Memo or lesser environmental documentationD. Annual hours of delay > 25,000 hours of congestionE. Freeway or Arterial > 2 hours of congestionF. Arterial relieves parallel congested freeway of directly responsible for
freeway congestion
Screen #1 (Binary)
• Metro Area Managers• Safety Capacity Projects• Consultant List
Project Lists
• Freeway Congestion Maps• Arterial Congestion Maps• Metro District 10-Year Plan• Metro Area Managers
Data Sources
Use of Data to Identify and Rank Bottlenecks
A wealth of data is available to analysts for bottleneck analysis. Over the last decade, and particularly in the last few years, the transportation industry has experienced increased availability of probe data sources for speed (travel-time) data. The typical arrangement is that companies who resell the speed data have agreements with fleet owners/managers and others to obtain the probe data. Some of these companies also have probe data coming in from navigation
Figure 6. Flow chart. Minnesota Department of Transportation project screening process.
(Source: Federal Highway Administration.)
Recurring Traffic Bottlenecks | A Primer
Analytical Identification and Assessment of Bottlenecks 31
devices or smartphone apps—all sources of travel-time information. The “value-add” of these commercial companies is that they aggregate and summarize the speed data based upon their multiple-source probes. Coverage is often comprehensive on higher functional classification roadways (freeways, highway, and major arterials). Typically, vehicle probe data are obtainable in annual summaries for a 15-minute or hourly time period, or more detailed data are available for every predefined time intervals (“epochs”) over a long time span (e.g., continuously collected over a year). These data are commonly available at 5 minute or even 1-minute epochs. Some vendors of vehicle probe data can provide truck-specific speed data in a similar format.
An example of a probe data source is the Federal Highway Administration (FHWA) National Performance Management Research Data Set (NPMRDS), which provides travel-time data in 5-minute time aggregations (throughout the year) for both trucks and passenger cars on the traffic message channel roadway network. TMC is the traveler information industry standard roadway network geography used for reporting traveler information.
Intelligent transportation systems (ITS) roadway detectors are another method of speed data collection. These detector technologies represent traditional monitoring equipment used by public agencies to monitor traffic conditions. Typical ITS detector types include:
• Inductive loops.
• Magnetometer.
• Piezoelectric or bending plates (weigh-in-motion).
• Radar.
These technologies all can provide speed, classification and speed data. Piezoelectric or bending plates also can provide weight information. Speeds can be grouped by classification with these detectors (i.e., speeds for a few length-based truck classes are available). Unlike the methods for speed data collection mentioned up to now, ITS roadway detectors may allow for the measurement of speed information by lane.
A key distinction with these technologies is that speeds are obtained “at a point” rather than direct measurement of travel time along the roadway link of interest. To obtain travel time from these speeds, the analyst must convert these speeds to a travel time along the link of interest. One typical way to do this is to assume the point speed is representative across the entire link and to divide the link length by the (point) link speed to obtain a travel time along the link of interest.
Empirical data is highly useful for both identifying a “candidate pool” of potential bottleneck locations as well as for ranking bottlenecks by the severity of the problems. Often this is a two-step process:
Recurring Traffic Bottlenecks | A Primer
32 Analytical Identification and Assessment of Bottlenecks
1. Scan for potential bottlenecks using relatively straightforward methods. Most States have data systems capable of matching traffic volumes with roadway capacity and these can be used to perform the initial scan.
2. Perform more detailed analysis using travel time data or more sophisticated modeling methods. Here one wants to produce objective estimates of congestion levels at each of the potential bottlenecks as well as to identify the root cause of the problems. Travel time data from detectors on urban freeways is now widely available through the activities of traffic management centers. Figure 7 is known as a “heat map” of time, duration, and extent of congestion, and shows how these data may be used to identify bottlenecks. Special travel time runs, aerial photography, or video of suspected bottleneck areas can also be used to pinpoint sources of operational deficiencies. Finally, private vendors are constantly improving their probe-derived travel time data that can be used for congestion analysis and bottleneck identification on virtually all highways. “Big data” has had a tremendous impact on the ability to analyze past, present, and even future (predictability) conditions.
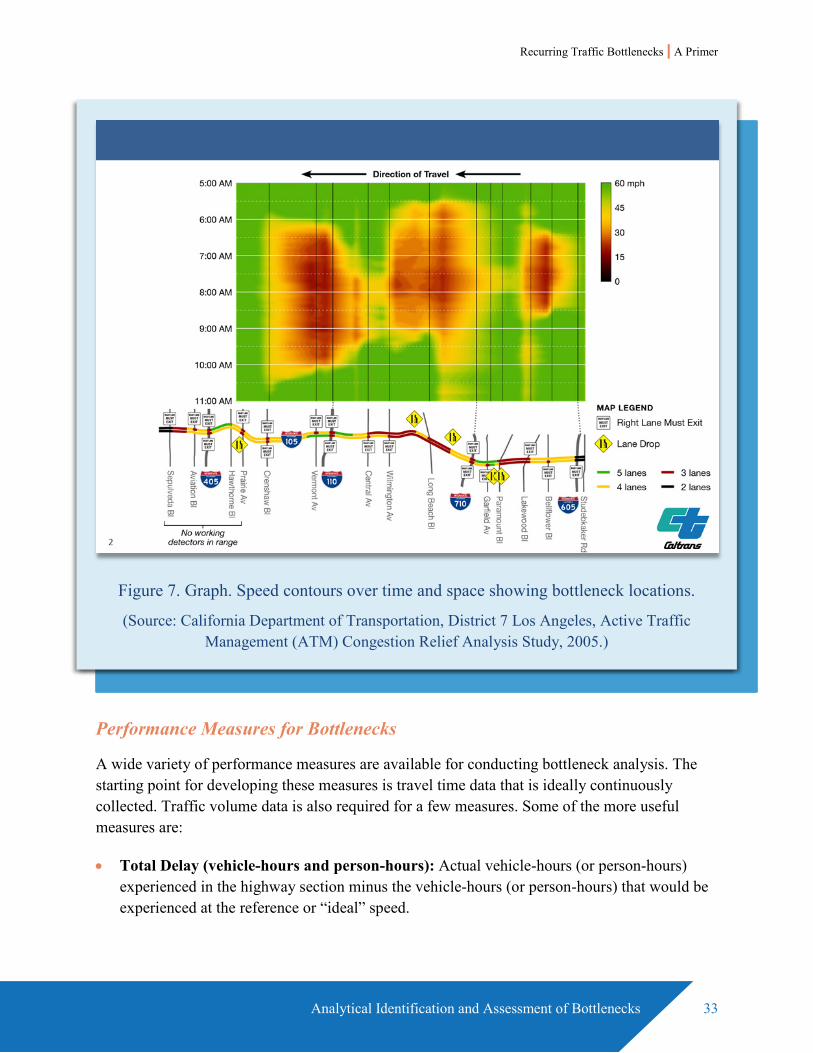
Recurring Traffic Bottlenecks | A Primer
Analytical Identification and Assessment of Bottlenecks 33
Performance Measures for Bottlenecks
A wide variety of performance measures are available for conducting bottleneck analysis. The starting point for developing these measures is travel time data that is ideally continuously collected. Traffic volume data is also required for a few measures. Some of the more useful measures are:
• Total Delay (vehicle-hours and person-hours): Actual vehicle-hours (or person-hours) experienced in the highway section minus the vehicle-hours (or person-hours) that would be experienced at the reference or “ideal” speed.
Figure 7. Graph. Speed contours over time and space showing bottleneck locations.
(Source: California Department of Transportation, District 7 Los Angeles, Active Traffic Management (ATM) Congestion Relief Analysis Study, 2005.)
Recurring Traffic Bottlenecks | A Primer
34 Analytical Identification and Assessment of Bottlenecks
• Mean Travel-Time Index (MTTI): The mean travel time over the highway section divided by the travel time that would occur at the reference or “ideal” speed.
• Planning Time Index (PTI): The 95th percentile Travel-Time Index computed as the 95th percentile travel time divided by the travel time that would occur at the reference or “ideal” speed.
• 80th Percentile Travel-Time Index (P80TTI): The 80th percentile Travel-Time Index computed as the 80th percentile travel time divided by the travel time that would occur at the reference or “ideal” speed.
• Hours of Congestion per Year: Number of hours where vehicle speeds are below a pre-set thresholds.
• 95th Percentile Queue Length (uninterrupted facilities): Developed from a distribution of queue lengths, the highway distance where the speeds of contiguous segments upstream of an identified bottleneck location are less than a pre-set threshold.
• Average Queue Length (uninterrupted facilities): Average highway distance where the speeds of contiguous segments upstream of an identified bottleneck location are less a pre-set threshold.
• Amount of delay on the 85th percentile “worst delay day” of the year.
When constructing bottleneck measures, analysts should define segments upstream of the actual bottleneck location for compiling them. Analysts should also be aware that the effects of a bottleneck (queuing) may affect intersecting highways upstream of the bottleneck location.
Analyzing Bottlenecks
Bottleneck analysis is necessary to study not only the subject location, but also the impacts of potential bottleneck remediation on upstream and downstream conditions. The analysis will justify action to correct bottlenecks, confirm the benefits of bottleneck remediation, or check for hidden bottlenecks along a corridor. When conducting bottleneck analysis, care should be taken to ensure that:
• Improving traffic flow at the bottleneck location doesn’t just transfer the problem downstream. The existing bottleneck may be “metering” flow so that a downstream section currently functions acceptably, but the increased flow will cause it to become a new bottleneck.
• Future traffic projections and planned system improvements are inclusive in the analysis. Safety merits also should be strongly considered.
• “Hidden bottlenecks” are considered. Sometimes, the queue formed by a dominant bottleneck masks other problems upstream of it. Improving the dominant bottleneck may
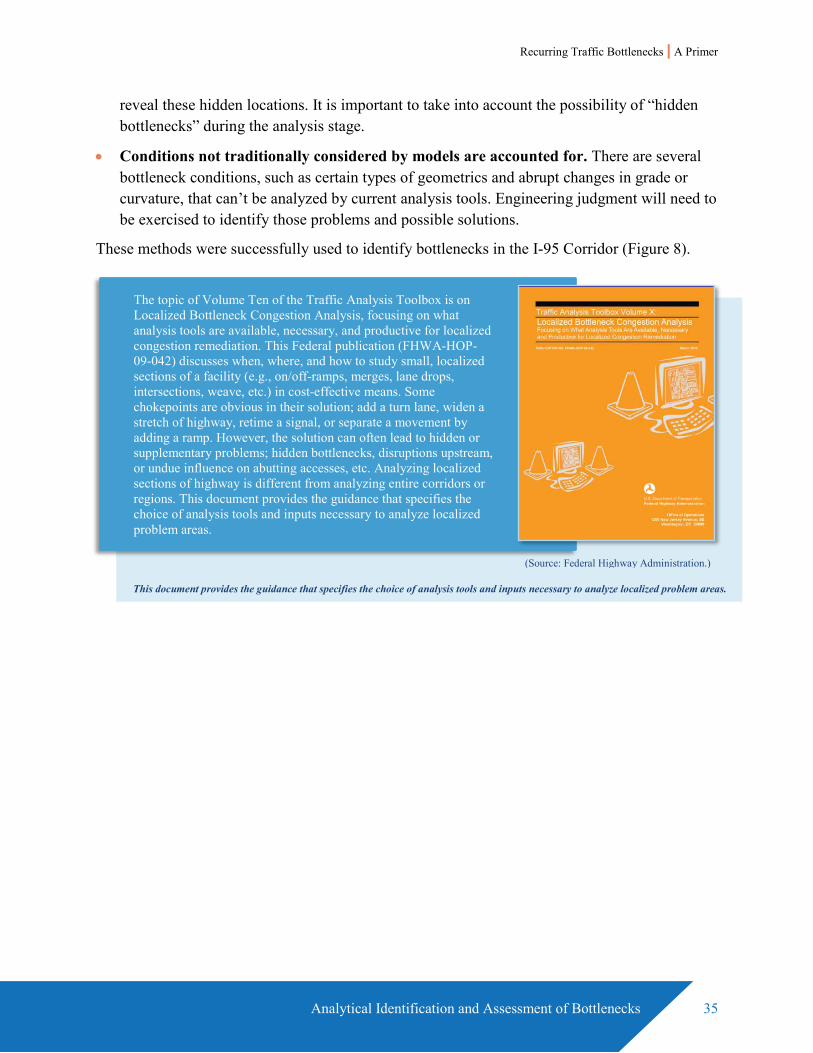
Recurring Traffic Bottlenecks | A Primer
Analytical Identification and Assessment of Bottlenecks 35
reveal these hidden locations. It is important to take into account the possibility of “hidden bottlenecks” during the analysis stage.
• Conditions not traditionally considered by models are accounted for. There are several bottleneck conditions, such as certain types of geometrics and abrupt changes in grade or curvature, that can’t be analyzed by current analysis tools. Engineering judgment will need to be exercised to identify those problems and possible solutions.
These methods were successfully used to identify bottlenecks in the I-95 Corridor (Figure 8).
The topic of Volume Ten of the Traffic Analysis Toolbox is on Localized Bottleneck Congestion Analysis, focusing on what analysis tools are available, necessary, and productive for localized congestion remediation. This Federal publication (FHWA-HOP-09-042) discusses when, where, and how to study small, localized sections of a facility (e.g., on/off-ramps, merges, lane drops, intersections, weave, etc.) in cost-effective means. Some chokepoints are obvious in their solution; add a turn lane, widen a stretch of highway, retime a signal, or separate a movement by adding a ramp. However, the solution can often lead to hidden or supplementary problems; hidden bottlenecks, disruptions upstream, or undue influence on abutting accesses, etc. Analyzing localized sections of highway is different from analyzing entire corridors or regions. This document provides the guidance that specifies the choice of analysis tools and inputs necessary to analyze localized problem areas.
This document provides the guidance that specifies the choice of analysis tools and inputs necessary to analyze localized problem areas.
(Source: Federal Highway Administration.)
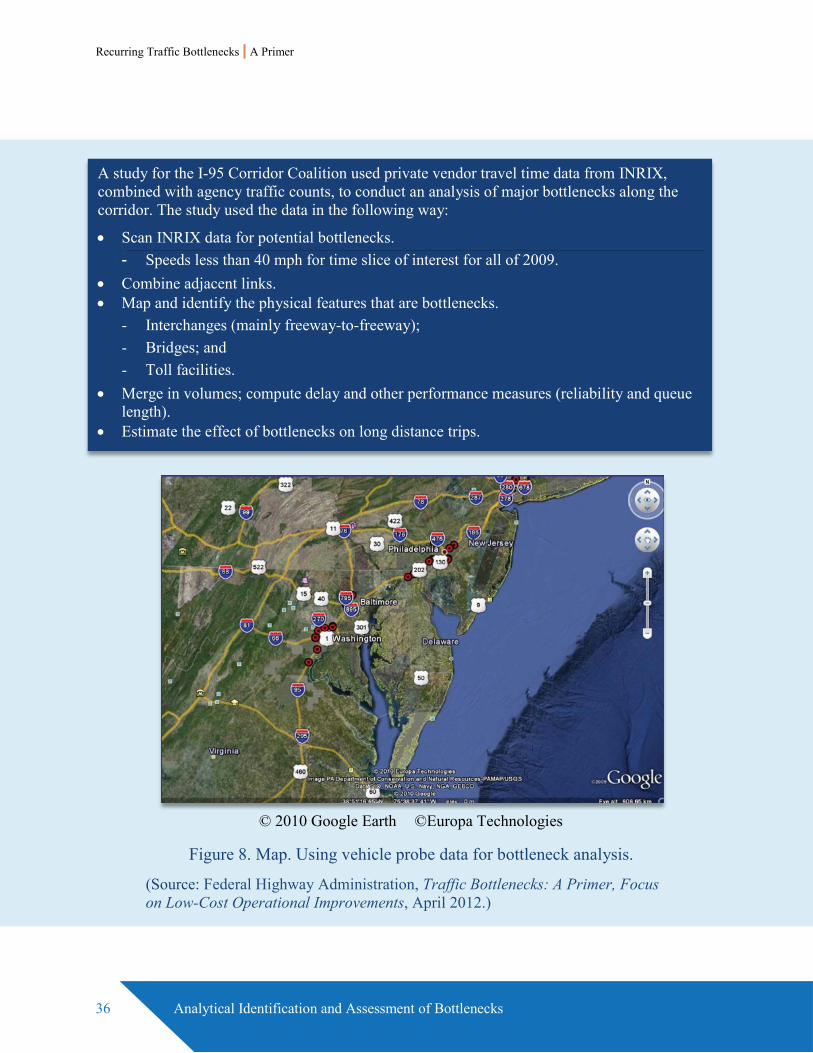
Recurring Traffic Bottlenecks | A Primer
36 Analytical Identification and Assessment of Bottlenecks
A study for the I-95 Corridor Coalition used private vendor travel time data from INRIX, combined with agency traffic counts, to conduct an analysis of major bottlenecks along the corridor. The study used the data in the following way:
• Scan INRIX data for potential bottlenecks. - Speeds less than 40 mph for time slice of interest for all of 2009.
• Combine adjacent links. • Map and identify the physical features that are bottlenecks.
- Interchanges (mainly freeway-to-freeway); - Bridges; and - Toll facilities.
• Merge in volumes; compute delay and other performance measures (reliability and queue length).
• Estimate the effect of bottlenecks on long distance trips.
© 2010 Google Earth ©Europa Technologies
Figure 8. Map. Using vehicle probe data for bottleneck analysis.
(Source: Federal Highway Administration, Traffic Bottlenecks: A Primer, Focus on Low-Cost Operational Improvements, April 2012.)
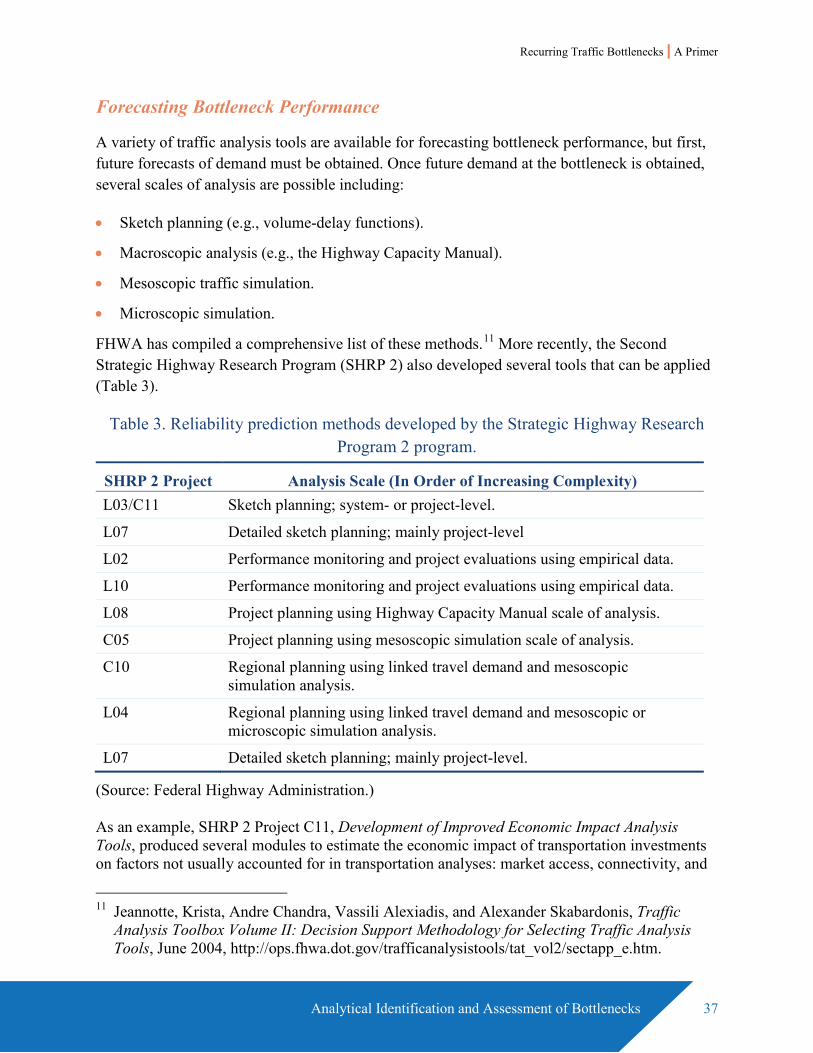
Recurring Traffic Bottlenecks | A Primer
Analytical Identification and Assessment of Bottlenecks 37
Forecasting Bottleneck Performance
A variety of traffic analysis tools are available for forecasting bottleneck performance, but first, future forecasts of demand must be obtained. Once future demand at the bottleneck is obtained, several scales of analysis are possible including:
• Sketch planning (e.g., volume-delay functions).
• Macroscopic analysis (e.g., the Highway Capacity Manual).
• Mesoscopic traffic simulation.
• Microscopic simulation.
FHWA has compiled a comprehensive list of these methods.11 More recently, the Second Strategic Highway Research Program (SHRP 2) also developed several tools that can be applied (Table 3).
Table 3. Reliability prediction methods developed by the Strategic Highway Research Program 2 program.
(Source: Federal Highway Administration.)
As an example, SHRP 2 Project C11, Development of Improved Economic Impact Analysis Tools, produced several modules to estimate the economic impact of transportation investments on factors not usually accounted for in transportation analyses: market access, connectivity, and
11 Jeannotte, Krista, Andre Chandra, Vassili Alexiadis, and Alexander Skabardonis, Traffic
Analysis Toolbox Volume II: Decision Support Methodology for Selecting Traffic Analysis Tools, June 2004, http://ops.fhwa.dot.gov/trafficanalysistools/tat_vol2/sectapp_e.htm.
SHRP 2 Project Analysis Scale (In Order of Increasing Complexity) L03/C11 Sketch planning; system- or project-level.
L07 Detailed sketch planning; mainly project-level
L02 Performance monitoring and project evaluations using empirical data.
L10 Performance monitoring and project evaluations using empirical data.
L08 Project planning using Highway Capacity Manual scale of analysis.
C05 Project planning using mesoscopic simulation scale of analysis.
C10 Regional planning using linked travel demand and mesoscopic simulation analysis.
L04 Regional planning using linked travel demand and mesoscopic or microscopic simulation analysis.
L07 Detailed sketch planning; mainly project-level.
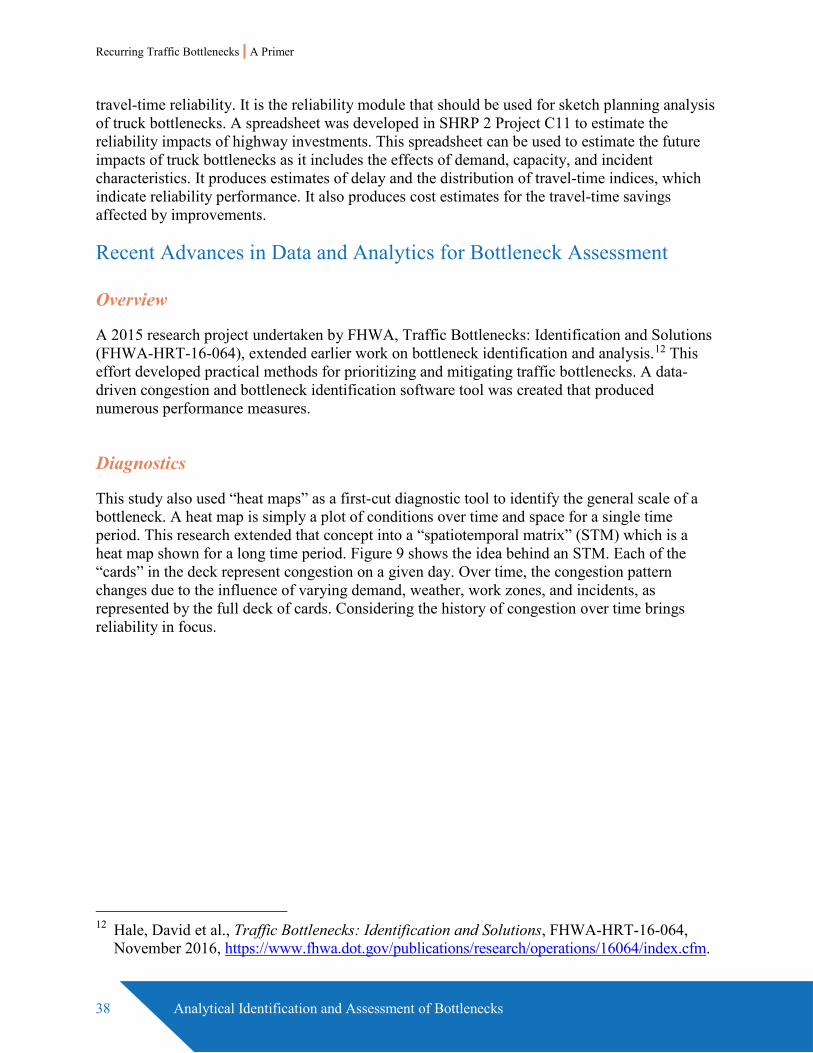
Recurring Traffic Bottlenecks | A Primer
38 Analytical Identification and Assessment of Bottlenecks
travel-time reliability. It is the reliability module that should be used for sketch planning analysis of truck bottlenecks. A spreadsheet was developed in SHRP 2 Project C11 to estimate the reliability impacts of highway investments. This spreadsheet can be used to estimate the future impacts of truck bottlenecks as it includes the effects of demand, capacity, and incident characteristics. It produces estimates of delay and the distribution of travel-time indices, which indicate reliability performance. It also produces cost estimates for the travel-time savings affected by improvements.
Recent Advances in Data and Analytics for Bottleneck Assessment
Overview
A 2015 research project undertaken by FHWA, Traffic Bottlenecks: Identification and Solutions (FHWA-HRT-16-064), extended earlier work on bottleneck identification and analysis.12 This effort developed practical methods for prioritizing and mitigating traffic bottlenecks. A data-driven congestion and bottleneck identification software tool was created that produced numerous performance measures.
Diagnostics
This study also used “heat maps” as a first-cut diagnostic tool to identify the general scale of a bottleneck. A heat map is simply a plot of conditions over time and space for a single time period. This research extended that concept into a “spatiotemporal matrix” (STM) which is a heat map shown for a long time period. Figure 9 shows the idea behind an STM. Each of the “cards” in the deck represent congestion on a given day. Over time, the congestion pattern changes due to the influence of varying demand, weather, work zones, and incidents, as represented by the full deck of cards. Considering the history of congestion over time brings reliability in focus.
12 Hale, David et al., Traffic Bottlenecks: Identification and Solutions, FHWA-HRT-16-064,
November 2016, https://www.fhwa.dot.gov/publications/research/operations/16064/index.cfm.
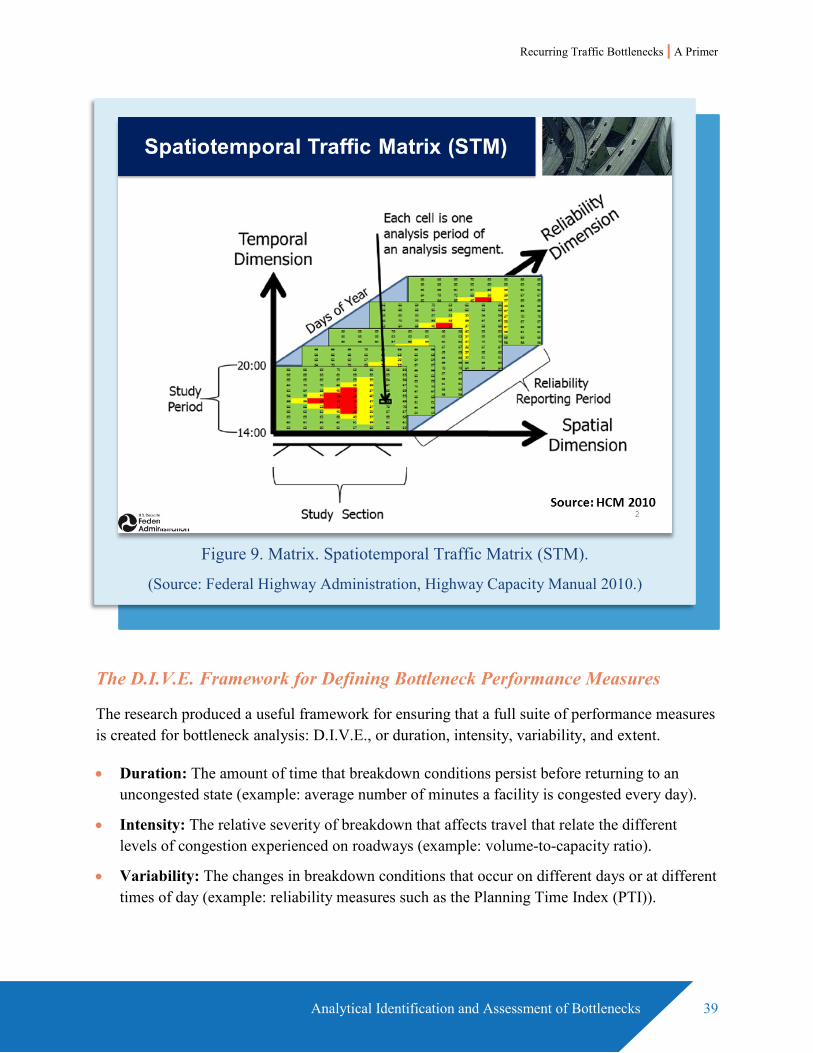
Recurring Traffic Bottlenecks | A Primer
Analytical Identification and Assessment of Bottlenecks 39
The D.I.V.E. Framework for Defining Bottleneck Performance Measures
The research produced a useful framework for ensuring that a full suite of performance measures is created for bottleneck analysis: D.I.V.E., or duration, intensity, variability, and extent.
• Duration: The amount of time that breakdown conditions persist before returning to an uncongested state (example: average number of minutes a facility is congested every day).
• Intensity: The relative severity of breakdown that affects travel that relate the different levels of congestion experienced on roadways (example: volume-to-capacity ratio).
• Variability: The changes in breakdown conditions that occur on different days or at different times of day (example: reliability measures such as the Planning Time Index (PTI)).
Figure 9. Matrix. Spatiotemporal Traffic Matrix (STM).
(Source: Federal Highway Administration, Highway Capacity Manual 2010.)
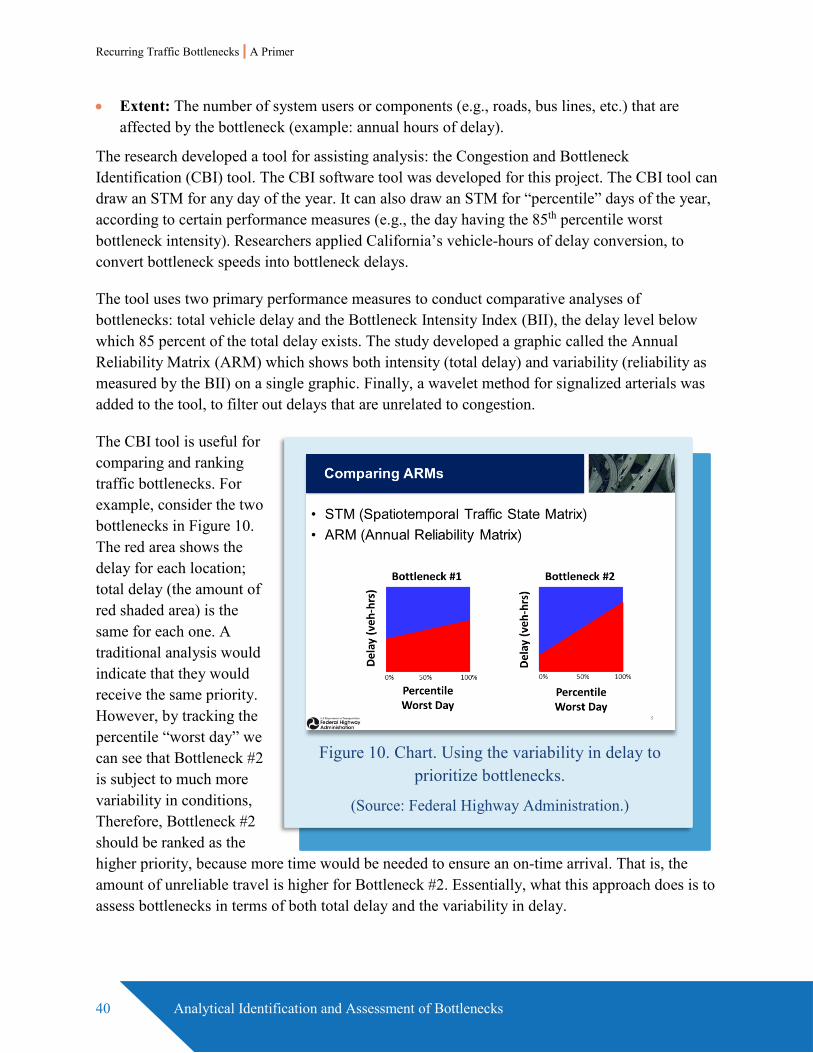
Recurring Traffic Bottlenecks | A Primer
40 Analytical Identification and Assessment of Bottlenecks
• Extent: The number of system users or components (e.g., roads, bus lines, etc.) that are affected by the bottleneck (example: annual hours of delay).
The research developed a tool for assisting analysis: the Congestion and Bottleneck Identification (CBI) tool. The CBI software tool was developed for this project. The CBI tool can draw an STM for any day of the year. It can also draw an STM for “percentile” days of the year, according to certain performance measures (e.g., the day having the 85th percentile worst bottleneck intensity). Researchers applied California’s vehicle-hours of delay conversion, to convert bottleneck speeds into bottleneck delays.
The tool uses two primary performance measures to conduct comparative analyses of bottlenecks: total vehicle delay and the Bottleneck Intensity Index (BII), the delay level below which 85 percent of the total delay exists. The study developed a graphic called the Annual Reliability Matrix (ARM) which shows both intensity (total delay) and variability (reliability as measured by the BII) on a single graphic. Finally, a wavelet method for signalized arterials was added to the tool, to filter out delays that are unrelated to congestion.
The CBI tool is useful for comparing and ranking traffic bottlenecks. For example, consider the two bottlenecks in Figure 10. The red area shows the delay for each location; total delay (the amount of red shaded area) is the same for each one. A traditional analysis would indicate that they would receive the same priority. However, by tracking the percentile “worst day” we can see that Bottleneck #2 is subject to much more variability in conditions, Therefore, Bottleneck #2 should be ranked as the higher priority, because more time would be needed to ensure an on-time arrival. That is, the amount of unreliable travel is higher for Bottleneck #2. Essentially, what this approach does is to assess bottlenecks in terms of both total delay and the variability in delay.
Figure 10. Chart. Using the variability in delay to prioritize bottlenecks.
(Source: Federal Highway Administration.)
Recurring Traffic Bottlenecks | A Primer
Localized Bottleneck Reduction Strategies 41
CHAPTER 6. LOCALIZED BOTTLENECK REDUCTION STRATEGIES
Types of Localized Bottleneck Reduction Treatments
The following is a sampling of short-term, low-cost operational and geometric improvements. All of these remedies address operational deficiencies, as opposed to other congestion mitigation efforts that address driver choice, travel demand, corridor-wide upgrades, or simply (but expensively) building our way out of congestion.
• Shoulder conversions. The Federal Highway Administration (FHWA) is currently studying the efficacy and prudence of using improved roadway shoulders to address congestion in particularly challenging situations. The safety implications of using shoulders, versus the congestion relief tradeoff of the same, is first-and-foremost at the discussion of this strategy. This involves using a short section of traffic-bearing shoulder as an additional travel lane, but only for peak hours. Shoulder conversions are most appropriate between interchanges or to provide lane congruency with adjacent sections. The improved shoulder should be rated for use as a travel lane. Practical challenges exist as to designing controls for part-time use versus 24/7 use.
• Restriping. Restriping improvements include: restriping existing pavement in merge or diverge areas to provide additional lanes or to improve lane balance, providing an acceleration/deceleration lane, extending the merge/diverge area, and improving geometrics to better serve demand.
• Minor interchange modifications. New auxiliary lanes can be added to connect closely spaced interchanges, extending the length of an exit lane to store queues from a ramp terminus and providing exit-only or “slip ramps” in advance of a major interchange are three examples. It is important to note that major interchange modifications (e.g., an entire interchange rebuild) would tend to be outside the purview of the “localized” solutions found in this primer.
• Lane width reductions. Such improvements involve reducing lane widths and restriping to add an additional travel and/or auxiliary lane.
• Modified weaving areas. Weaving areas can be modified by adding collector, distributor, or through lanes.
For more information, please consult the FHWA publication “Use of Freeway Shoulders
for Travel,” February 2016, FHWA-HOP-15-023.
Recurring Traffic Bottlenecks | A Primer
42 Localized Bottleneck Reduction Strategies
• Ramp modifications. Ramp modifications could include ramp metering; widening, extending, closing, or consolidating ramps; or reversing entrance and exit ramps to improve operations.
• Speed harmonization (variable speed limits). This is the practice of adjusting speed limits when congestion thresholds have been exceeded and congestion and queue forming is imminent. Speed harmonization can also be used to promote safer driving during inclement weather conditions. This mostly European practice reduces the traffic “shock wave” that results through congested corridors, thereby delaying the onset of a breakdown in traffic conditions. The result is decreased headways and more uniform driver behavior, which indirectly benefit bottlenecks and chokepoints.
• Zippering or self-metering that promotes fair and smooth merges. A motorist who is 10th in line knows that he will be 20th to merge into the single lane ahead. This helps to eliminate line jumpers that bull ahead, disrupt the queues, and often block adjacent lanes until they force their way in line. Usually this method of merging requires on-site enforcement, but often is exhibited by regulars who know the process and are conditioned to practice it.
• Improved traffic signal timing on arterials. Traffic signal timing improvements on arterials, as well as at ramp terminal intersections, will prevent ramp queues from backing up onto freeway main lanes.
• Access management principles to reduce vehicular conflicts (hence, delays) on arterial corridors. Access management addresses turn lanes, driveways, medians, permitting, site review, and lot access—to name but a few elements—and is its own field of study.
• Roundabouts. Roundabouts may be used in place of stop sign or signal controlled intersections, including replacing signalized intersections at ramp termini.
• Innovative intersection and intersection designs. A variety of new designs are being implemented around the country (see below).
• High occupancy vehicle (HOV) or reversible lanes.
• Traveler information on traffic diversions.
• Congestion pricing. Congestion pricing entails charging fees or tolls for road use that varies by level of vehicle demand on the facility. The objective is to bring supply and demand into alignment.
Advanced Forms of Bottleneck Treatments Already In Practice
Dynamic Lane Grouping
Conventional traffic signal control assumes the intersection’s lane assignment configuration is fixed. Dynamic lane grouping (DLG) aims to adjust lane assignment based on fluctuating travel
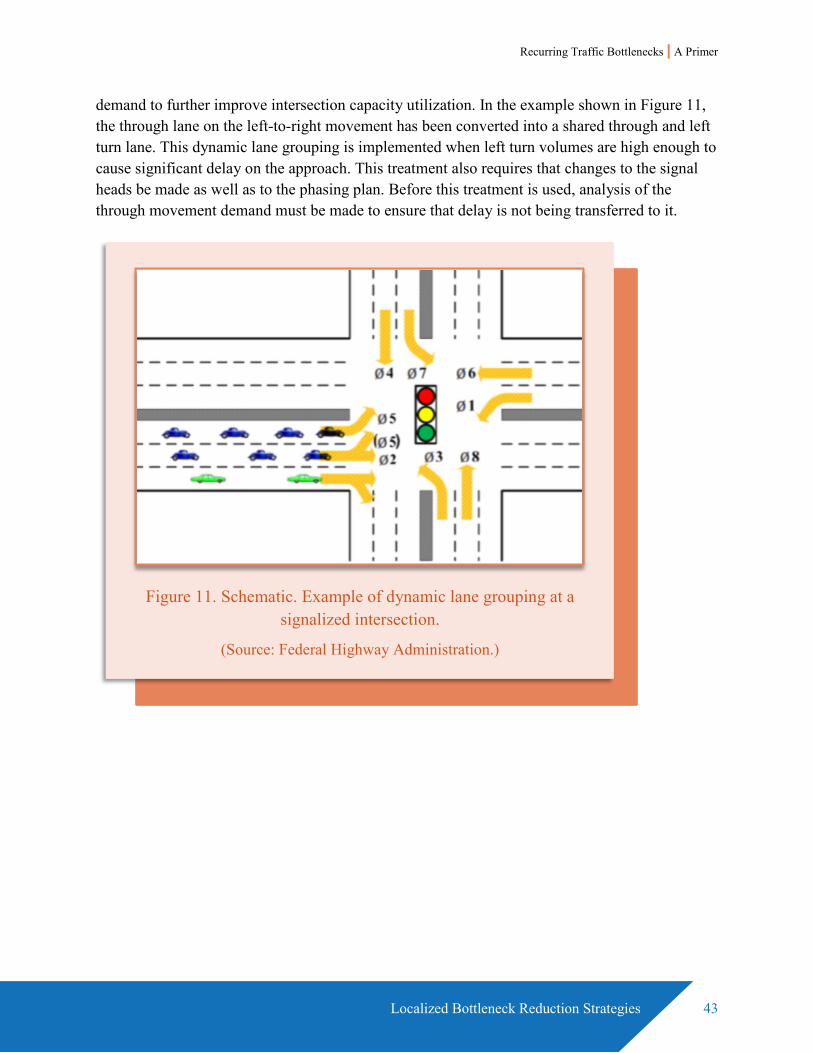
Recurring Traffic Bottlenecks | A Primer
Localized Bottleneck Reduction Strategies 43
demand to further improve intersection capacity utilization. In the example shown in Figure 11, the through lane on the left-to-right movement has been converted into a shared through and left turn lane. This dynamic lane grouping is implemented when left turn volumes are high enough to cause significant delay on the approach. This treatment also requires that changes to the signal heads be made as well as to the phasing plan. Before this treatment is used, analysis of the through movement demand must be made to ensure that delay is not being transferred to it.
Figure 11. Schematic. Example of dynamic lane grouping at a signalized intersection.
(Source: Federal Highway Administration.)
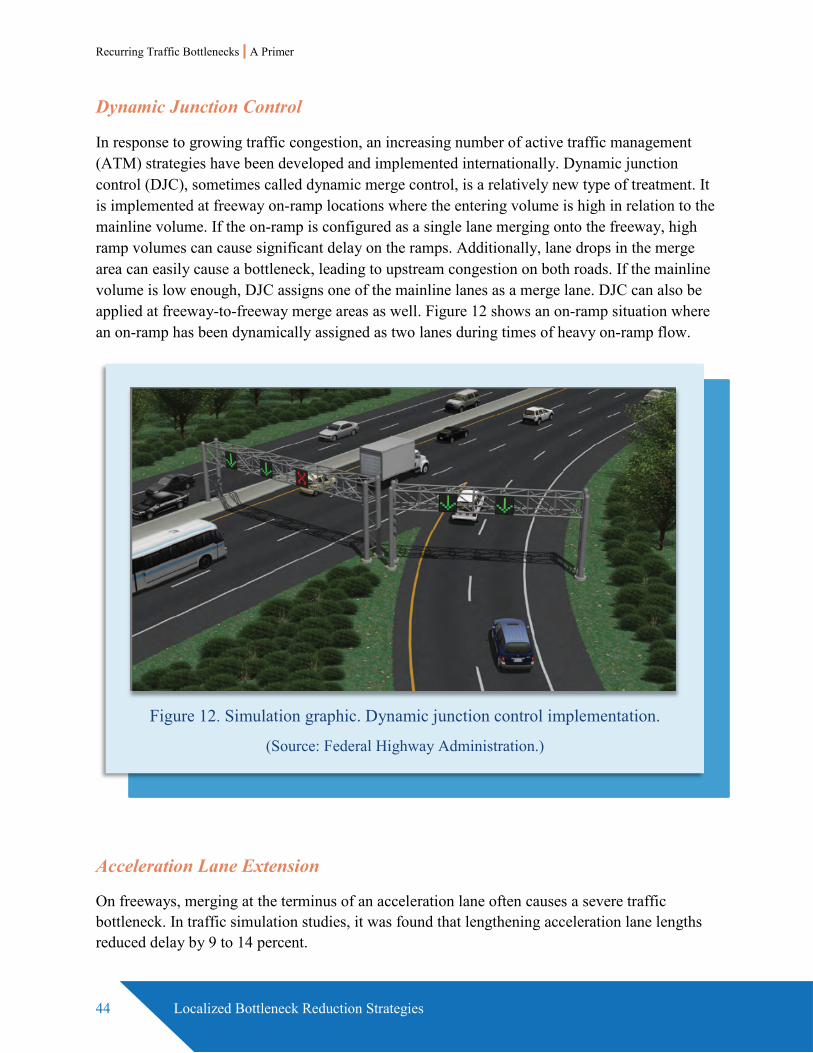
Recurring Traffic Bottlenecks | A Primer
44 Localized Bottleneck Reduction Strategies
Dynamic Junction Control
In response to growing traffic congestion, an increasing number of active traffic management (ATM) strategies have been developed and implemented internationally. Dynamic junction control (DJC), sometimes called dynamic merge control, is a relatively new type of treatment. It is implemented at freeway on-ramp locations where the entering volume is high in relation to the mainline volume. If the on-ramp is configured as a single lane merging onto the freeway, high ramp volumes can cause significant delay on the ramps. Additionally, lane drops in the merge area can easily cause a bottleneck, leading to upstream congestion on both roads. If the mainline volume is low enough, DJC assigns one of the mainline lanes as a merge lane. DJC can also be applied at freeway-to-freeway merge areas as well. Figure 12 shows an on-ramp situation where an on-ramp has been dynamically assigned as two lanes during times of heavy on-ramp flow.
Acceleration Lane Extension
On freeways, merging at the terminus of an acceleration lane often causes a severe traffic bottleneck. In traffic simulation studies, it was found that lengthening acceleration lane lengths reduced delay by 9 to 14 percent.
Figure 12. Simulation graphic. Dynamic junction control implementation.
(Source: Federal Highway Administration.)
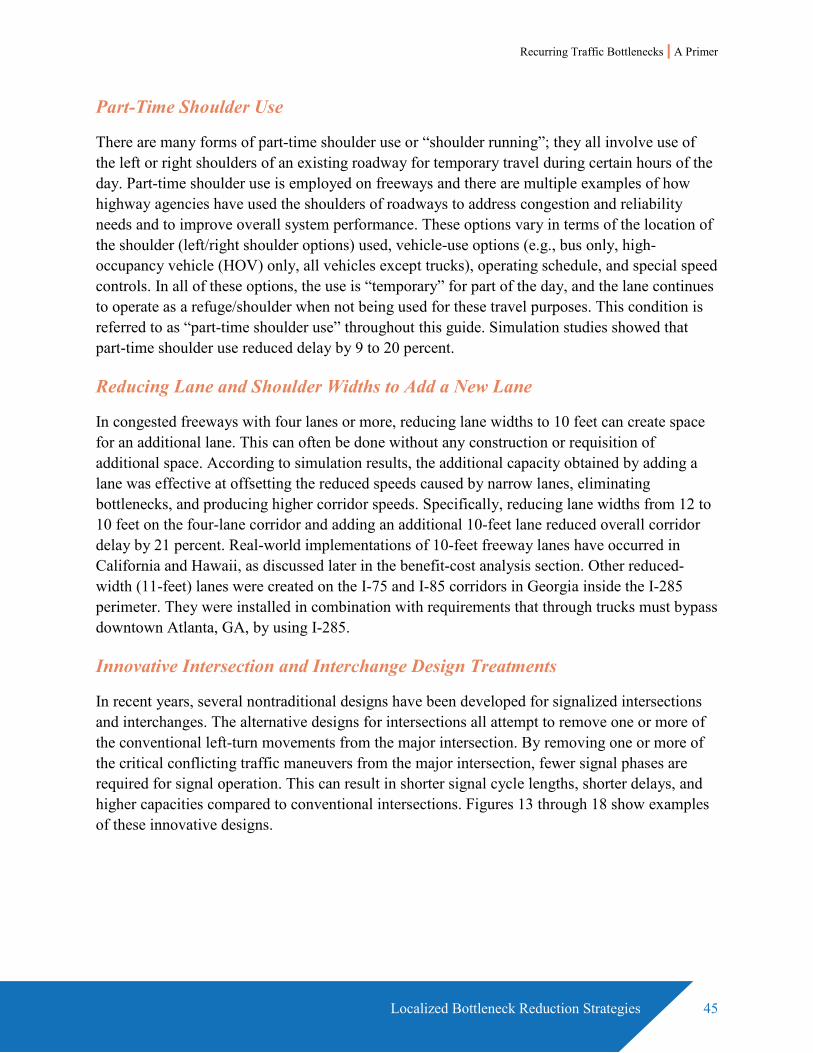
Recurring Traffic Bottlenecks | A Primer
Localized Bottleneck Reduction Strategies 45
Part-Time Shoulder Use
There are many forms of part-time shoulder use or “shoulder running”; they all involve use of the left or right shoulders of an existing roadway for temporary travel during certain hours of the day. Part-time shoulder use is employed on freeways and there are multiple examples of how highway agencies have used the shoulders of roadways to address congestion and reliability needs and to improve overall system performance. These options vary in terms of the location of the shoulder (left/right shoulder options) used, vehicle-use options (e.g., bus only, high-occupancy vehicle (HOV) only, all vehicles except trucks), operating schedule, and special speed controls. In all of these options, the use is “temporary” for part of the day, and the lane continues to operate as a refuge/shoulder when not being used for these travel purposes. This condition is referred to as “part-time shoulder use” throughout this guide. Simulation studies showed that part-time shoulder use reduced delay by 9 to 20 percent.
Reducing Lane and Shoulder Widths to Add a New Lane
In congested freeways with four lanes or more, reducing lane widths to 10 feet can create space for an additional lane. This can often be done without any construction or requisition of additional space. According to simulation results, the additional capacity obtained by adding a lane was effective at offsetting the reduced speeds caused by narrow lanes, eliminating bottlenecks, and producing higher corridor speeds. Specifically, reducing lane widths from 12 to 10 feet on the four-lane corridor and adding an additional 10-feet lane reduced overall corridor delay by 21 percent. Real-world implementations of 10-feet freeway lanes have occurred in California and Hawaii, as discussed later in the benefit-cost analysis section. Other reduced-width (11-feet) lanes were created on the I-75 and I-85 corridors in Georgia inside the I-285 perimeter. They were installed in combination with requirements that through trucks must bypass downtown Atlanta, GA, by using I-285.
Innovative Intersection and Interchange Design Treatments
In recent years, several nontraditional designs have been developed for signalized intersections and interchanges. The alternative designs for intersections all attempt to remove one or more of the conventional left-turn movements from the major intersection. By removing one or more of the critical conflicting traffic maneuvers from the major intersection, fewer signal phases are required for signal operation. This can result in shorter signal cycle lengths, shorter delays, and higher capacities compared to conventional intersections. Figures 13 through 18 show examples of these innovative designs.
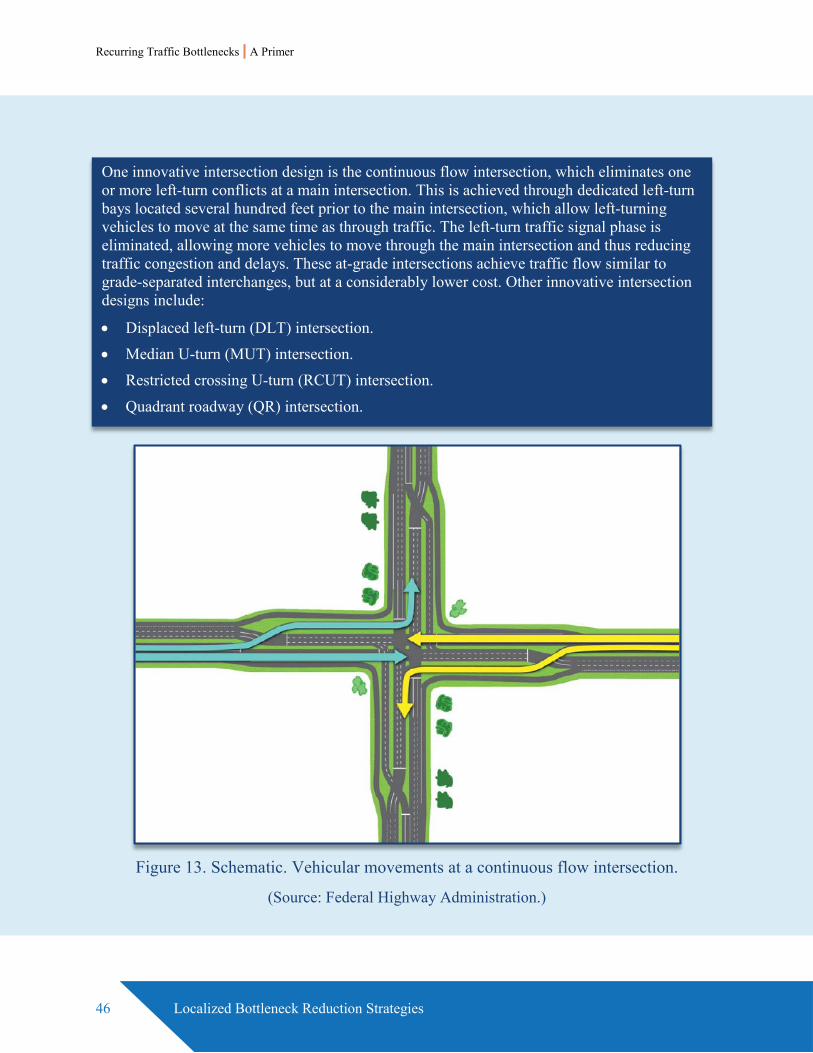
Recurring Traffic Bottlenecks | A Primer
46 Localized Bottleneck Reduction Strategies
One innovative intersection design is the continuous flow intersection, which eliminates one or more left-turn conflicts at a main intersection. This is achieved through dedicated left-turn bays located several hundred feet prior to the main intersection, which allow left-turning vehicles to move at the same time as through traffic. The left-turn traffic signal phase is eliminated, allowing more vehicles to move through the main intersection and thus reducing traffic congestion and delays. These at-grade intersections achieve traffic flow similar to grade-separated interchanges, but at a considerably lower cost. Other innovative intersection designs include:
• Displaced left-turn (DLT) intersection. • Median U-turn (MUT) intersection. • Restricted crossing U-turn (RCUT) intersection.
• Quadrant roadway (QR) intersection.
Figure 13. Schematic. Vehicular movements at a continuous flow intersection.
(Source: Federal Highway Administration.)
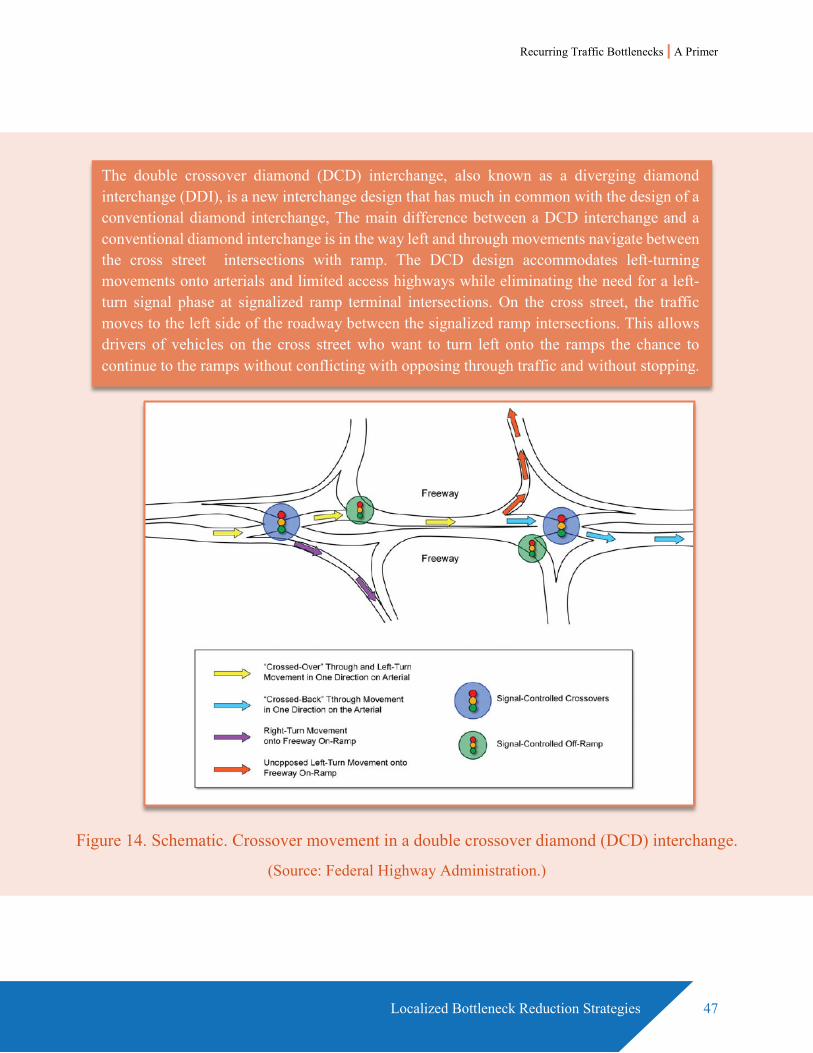
Recurring Traffic Bottlenecks | A Primer
Localized Bottleneck Reduction Strategies 47
The double crossover diamond (DCD) interchange, also known as a diverging diamond interchange (DDI), is a new interchange design that has much in common with the design of a conventional diamond interchange, The main difference between a DCD interchange and a conventional diamond interchange is in the way left and through movements navigate between the cross street intersections with ramp. The DCD design accommodates left-turning movements onto arterials and limited access highways while eliminating the need for a left-turn signal phase at signalized ramp terminal intersections. On the cross street, the traffic moves to the left side of the roadway between the signalized ramp intersections. This allows drivers of vehicles on the cross street who want to turn left onto the ramps the chance to continue to the ramps without conflicting with opposing through traffic and without stopping.
Figure 14. Schematic. Crossover movement in a double crossover diamond (DCD) interchange.
(Source: Federal Highway Administration.)
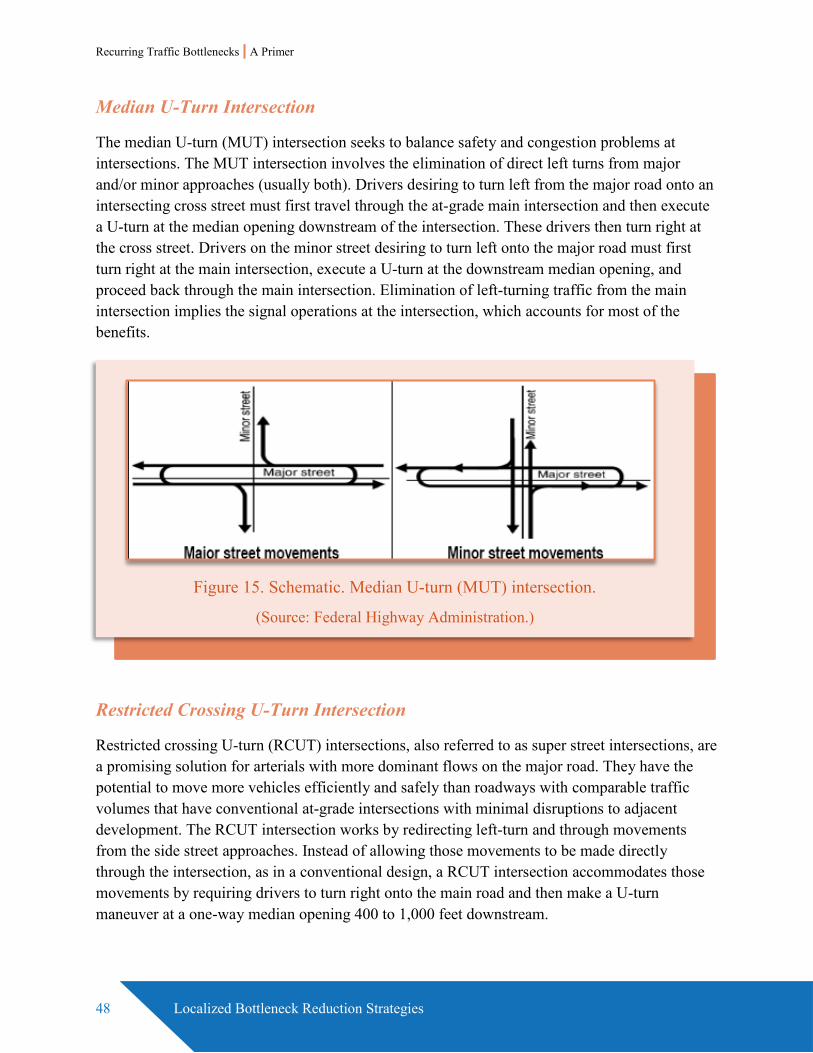
Recurring Traffic Bottlenecks | A Primer
48 Localized Bottleneck Reduction Strategies
Median U-Turn Intersection
The median U-turn (MUT) intersection seeks to balance safety and congestion problems at intersections. The MUT intersection involves the elimination of direct left turns from major and/or minor approaches (usually both). Drivers desiring to turn left from the major road onto an intersecting cross street must first travel through the at-grade main intersection and then execute a U-turn at the median opening downstream of the intersection. These drivers then turn right at the cross street. Drivers on the minor street desiring to turn left onto the major road must first turn right at the main intersection, execute a U-turn at the downstream median opening, and proceed back through the main intersection. Elimination of left-turning traffic from the main intersection implies the signal operations at the intersection, which accounts for most of the benefits.
Restricted Crossing U-Turn Intersection
Restricted crossing U-turn (RCUT) intersections, also referred to as super street intersections, are a promising solution for arterials with more dominant flows on the major road. They have the potential to move more vehicles efficiently and safely than roadways with comparable traffic volumes that have conventional at-grade intersections with minimal disruptions to adjacent development. The RCUT intersection works by redirecting left-turn and through movements from the side street approaches. Instead of allowing those movements to be made directly through the intersection, as in a conventional design, a RCUT intersection accommodates those movements by requiring drivers to turn right onto the main road and then make a U-turn maneuver at a one-way median opening 400 to 1,000 feet downstream.
Figure 15. Schematic. Median U-turn (MUT) intersection.
(Source: Federal Highway Administration.)
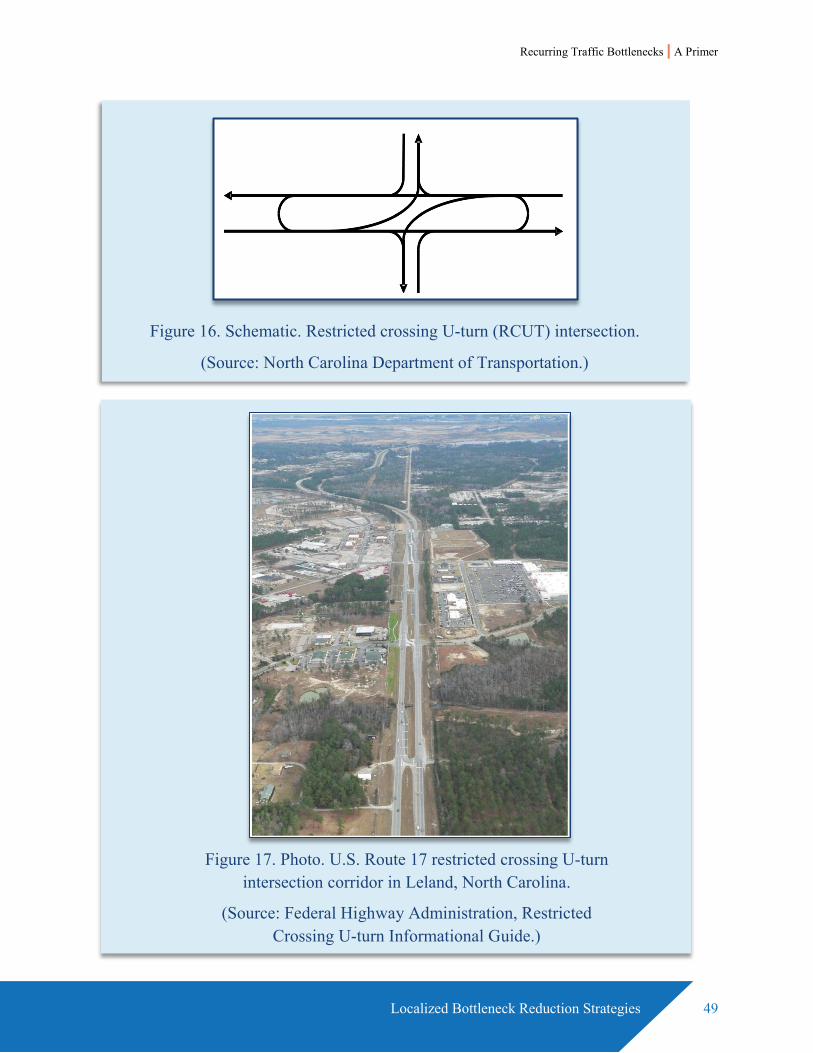
Recurring Traffic Bottlenecks | A Primer
Localized Bottleneck Reduction Strategies 49
Figure 16. Schematic. Restricted crossing U-turn (RCUT) intersection.
(Source: North Carolina Department of Transportation.)
Figure 17. Photo. U.S. Route 17 restricted crossing U-turn intersection corridor in Leland, North Carolina.
(Source: Federal Highway Administration, Restricted Crossing U-turn Informational Guide.)
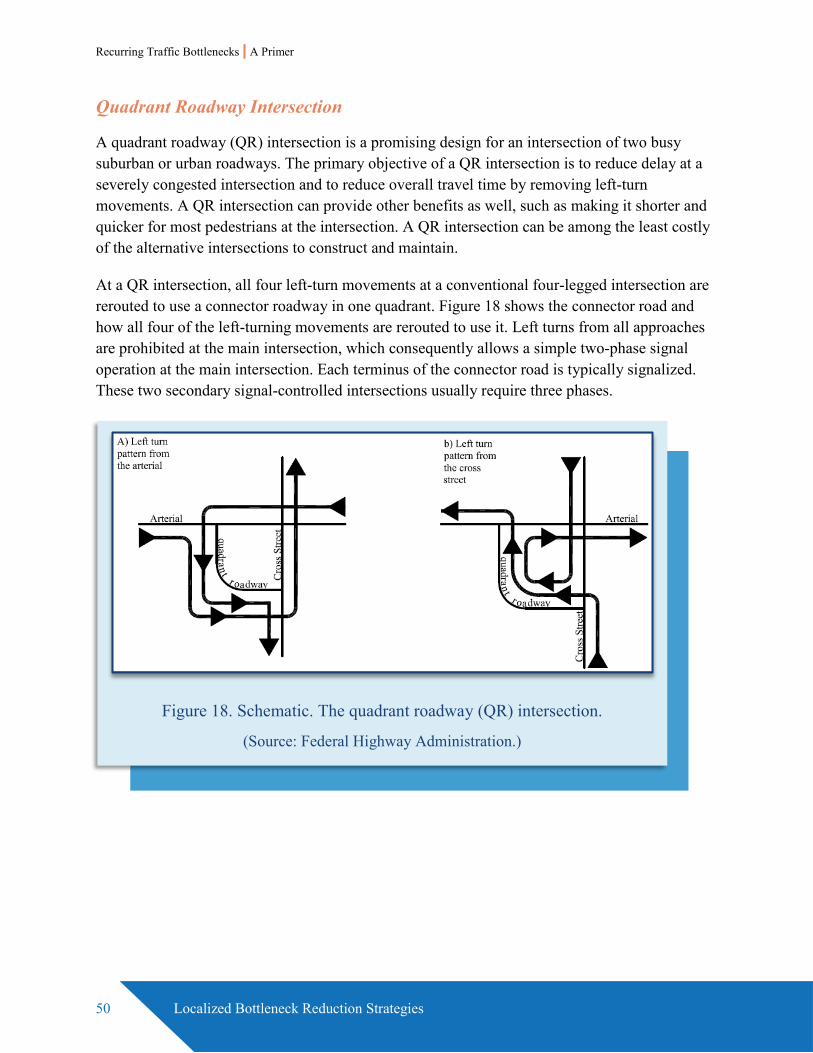
Recurring Traffic Bottlenecks | A Primer
50 Localized Bottleneck Reduction Strategies
Quadrant Roadway Intersection
A quadrant roadway (QR) intersection is a promising design for an intersection of two busy suburban or urban roadways. The primary objective of a QR intersection is to reduce delay at a severely congested intersection and to reduce overall travel time by removing left-turn movements. A QR intersection can provide other benefits as well, such as making it shorter and quicker for most pedestrians at the intersection. A QR intersection can be among the least costly of the alternative intersections to construct and maintain.
At a QR intersection, all four left-turn movements at a conventional four-legged intersection are rerouted to use a connector roadway in one quadrant. Figure 18 shows the connector road and how all four of the left-turning movements are rerouted to use it. Left turns from all approaches are prohibited at the main intersection, which consequently allows a simple two-phase signal operation at the main intersection. Each terminus of the connector road is typically signalized. These two secondary signal-controlled intersections usually require three phases.
Figure 18. Schematic. The quadrant roadway (QR) intersection.
(Source: Federal Highway Administration.)

Recurring Traffic Bottlenecks | A Primer
Emerging Bottleneck Treatments 51
CHAPTER 7. EMERGING BOTTLENECK TREATMENTS
In addition to the innovative treatments discussed in Chapter 6 that have been used in practice, the recently completed Traffic Bottlenecks: Identification and Solutions study (Reference 13) developed three types of treatments that have not yet been implemented but that the authors found compelling in terms of benefits. These treatments are discussed below.
Dynamic Hard Shoulder Running
Dynamic Hard Shoulder Running (HSR) is an extension of typical HSR, but instead of the shoulder being open to traffic on a fixed schedule, it is only opened when congestion is present at a pre-defined level. The authors discuss dynamic HSR in the context of nonrecurring congestion (e.g., incidents) but in fact it could apply to congestion caused by a fixed bottleneck as well. The advantage of dynamic HSR is that the shoulder remains open for safety reasons when it is not needed for dealing with congestion.
Simulation analysis of dynamic HSR revealed the following findings:
• Dynamic HSR strategies are more suitable for property damage only (PDO) incidents where traffic management centers have more flexibility in managing traffic.
• Only the part of the shoulder that is 0.5 mi upstream and downstream of an incident location needs to be opened to fully use the potential of shoulders for incident management.
• The opened shoulder section can be closed as soon as possible after the incident is cleared. Opening the shoulder for a longer time will not improve traffic flow conditions.
• The effectiveness of dynamic HSR is rather significant across different roadway geometry, traffic, and incident scenarios. Depending on the traffic condition and number of lane blockage, the average delay can improve by 30 to 80 percent and total traffic throughput by 15 to 40 percent, which are very significant considering only opening a certain section of the one-lane shoulder within a limited amount of time.
Dynamic Reversible Left Turn Lanes
The diamond interchange with its signal control has been successfully used in numerous freeway-to-arterial connections. However, the operation of a conventional signalized diamond interchange design is now becoming a challenging issue, particularly in an urban or suburban environment where heavy traffic volumes must be served and right-of-way is restrictive. By removing the internal center back-to-back left turn lanes and creating reversible lanes, the signal

Recurring Traffic Bottlenecks | A Primer
52 Emerging Bottleneck Treatments
timings can be set to give each left turn movement use of the full-length lane during each of the opposing left turn movement.
Operational benefits of the dynamic reversible left turn (DRLT) lane design, as analyzed with simulation and relative to the conventional diamond design, were as follows:
• The simulations showed increased left turn on-ramp movement throughput, reduced network travel time, and reduced delay for various DRLT lane designs. The effects were most prominent when the number of through lanes was proportionally higher than the number of left turn lanes.
• DRLT design is not applicable for all diamond interchange scenarios, but for those with high volumes and a low number of left turn lanes. The best implementation of the new interchange design may be during certain times of day where the left turn on-ramp volumes are high. Throughout the day when the turning movements are balanced, the intersection can remain a conventional three-phase design. However, when the movements change (possibly during afternoon peak) the DRLT design can be beneficial and implementable.
Contraflow Left Turn Pockets
During the peak hours of traffic congestion, some signalized intersections suffer from excessive queue spillover of left-turning vehicles into adjacent through lanes. The innovative contraflow left turn (CLT) pocket treatment aims to mitigate the problem by dynamically allocating lanes in the opposing direction to create an additional left turn pocket lane. By adding additional capacity to the left turn movement, delays for the entire intersection can be reduced, but note that the intersection exit at the bottom is reduced to a single lane. This feature may add additional delay to the downward through movement as shown in the figure if demand for the through movement is high enough. In some cases, the additional left turn capacity could allow left turn green times to be reduced such that green time could be reallocated towards other turning movements at the signal.
Although this design treatment requires pre-signals to control entrances to the contraflow turn pockets, it would not require advanced vehicles or infrastructure. As a result, it has the potential of being a cost-effective bottleneck mitigation strategy.
Simulation results showed that the CLT treatment produced the most delay savings under high travel demands. Another finding was that the highest percentage delay reductions occurred when northbound and southbound turning movement demands were balanced (i.e., almost equal). Total intersection delay was reduced between 7 and 22 percent under various scenarios studied. Therefore, the case study simulations indicated that CLT pockets are capable of significant overall delay reduction if the right demand and signal geometry conditions exist.
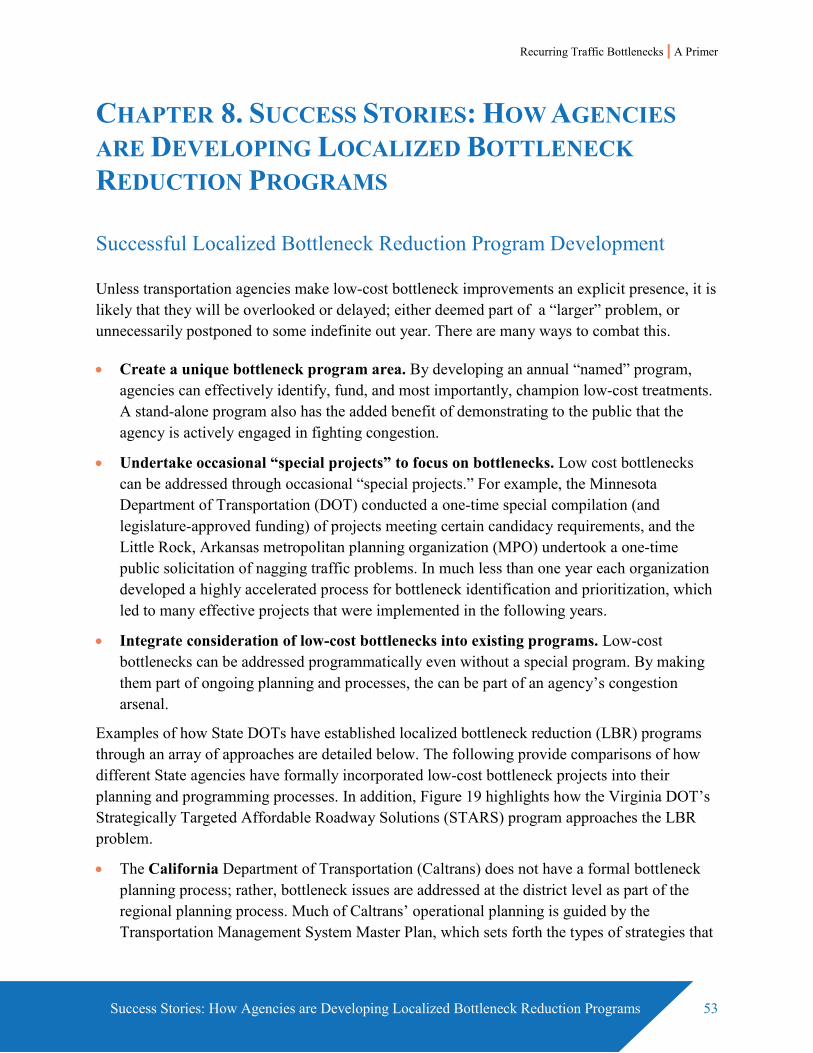
Recurring Traffic Bottlenecks | A Primer
Success Stories: How Agencies are Developing Localized Bottleneck Reduction Programs 53
CHAPTER 8. SUCCESS STORIES: HOW AGENCIES ARE DEVELOPING LOCALIZED BOTTLENECK REDUCTION PROGRAMS
Successful Localized Bottleneck Reduction Program Development
Unless transportation agencies make low-cost bottleneck improvements an explicit presence, it is likely that they will be overlooked or delayed; either deemed part of a “larger” problem, or unnecessarily postponed to some indefinite out year. There are many ways to combat this.
• Create a unique bottleneck program area. By developing an annual “named” program, agencies can effectively identify, fund, and most importantly, champion low-cost treatments. A stand-alone program also has the added benefit of demonstrating to the public that the agency is actively engaged in fighting congestion.
• Undertake occasional “special projects” to focus on bottlenecks. Low cost bottlenecks can be addressed through occasional “special projects.” For example, the Minnesota Department of Transportation (DOT) conducted a one-time special compilation (and legislature-approved funding) of projects meeting certain candidacy requirements, and the Little Rock, Arkansas metropolitan planning organization (MPO) undertook a one-time public solicitation of nagging traffic problems. In much less than one year each organization developed a highly accelerated process for bottleneck identification and prioritization, which led to many effective projects that were implemented in the following years.
• Integrate consideration of low-cost bottlenecks into existing programs. Low-cost bottlenecks can be addressed programmatically even without a special program. By making them part of ongoing planning and processes, the can be part of an agency’s congestion arsenal.
Examples of how State DOTs have established localized bottleneck reduction (LBR) programs through an array of approaches are detailed below. The following provide comparisons of how different State agencies have formally incorporated low-cost bottleneck projects into their planning and programming processes. In addition, Figure 19 highlights how the Virginia DOT’s Strategically Targeted Affordable Roadway Solutions (STARS) program approaches the LBR problem.
• The California Department of Transportation (Caltrans) does not have a formal bottleneck planning process; rather, bottleneck issues are addressed at the district level as part of the regional planning process. Much of Caltrans’ operational planning is guided by the Transportation Management System Master Plan, which sets forth the types of strategies that
Recurring Traffic Bottlenecks | A Primer
54 Success Stories: How Agencies are Developing Localized Redneck Reduction Programs
should be pursued in improving congestion. In much of California’s metropolitan areas, traffic congestion is a 24/7 occurrence, and traffic management is a 24/7 job. Bottlenecks are tweaked “in real-time” as part of their Corridor System Management Plans (CSMP), which are developed for some of California’s most congested transportation corridors. System monitoring and evaluation is seen as the foundation for the entire process because it cannot only identify congestion problems, but also be used to evaluate and prioritize competing investments. Caltrans does not have a direct funding for bottlenecks, although bottleneck projects are routinely programmed through the CSMP process.
• In Ohio, bottlenecks are part and parcel of the overarching Ohio DOT (ODOT) Highway Safety Program (HSP), which ranks all candidate projects and drives the statewide highway project selection and scheduling process. Beginning in 2002, the ODOT developed a “congestion mapping” division that uses volume/cost (V/C) ratios developed from traffic data recorders and roadway inventory. About the same time, the ODOT administration pushed for an annual process of overlaying congestion index and safety index “hot spots.” As a result, congestion hot spots now have a “voice” in the process regardless of crash indices, and congestion-related problems now compete for attention in the HSP listing. Specifically, highway sections with V/C ratios greater than 1.0 are considered “congested” and are added to the listing. Sections with V/C between 0.9 and 1.0, but outside the cities of Columbus, Cincinnati, and Cleveland, are also added. After the ODOT headquarters completes their statewide effort of congestion mapping and safety indexing, the respective District engineers are responsible for developing countermeasures for their top-listed candidate projects. District Safety Review Teams sort projects into three scales—low (less than $100K and quickly implementable), medium ($100K to $5M and one to two years), and high (greater than $5M and necessitating more than two years to implement)—and then compete with other projects having the same scale but in other districts.
• The Minnesota DOT (MnDOT) was originally driven to explore low-cost congestion relief projects because of budgetary restrictions, but soon realized that these projects could be implemented very quickly and, as a bonus, were highly visible and popular with the public. In much less than one year, the MnDOT developed a highly accelerated process for bottleneck identification and prioritization, which led to many effective projects in the following two years. The MnDOT also found that because of lower costs, it could identify multiple locations throughout the region and “spread around” bottleneck reduction projects in a fair and equitable manner. This process consisted of completing a study, which included a five-step process to narrow potential projects into a recommendation list to the State legislature. Evaluation of completed projects produced high benefit/cost ratios, usually greater than 8:1.
• The Maryland State Highway Administration (SHA) has a dedicated program of about $5 million per year for the identification and implementation of low-cost traffic congestion improvements at intersections. The program’s genesis tracks to when SHA asked “what can
Recurring Traffic Bottlenecks | A Primer
Success Stories: How Agencies are Developing Localized Bottleneck Reduction Programs 55
be done if and when a megaproject’s ‘no-build’ alternative is chosen?” The program has been well received by the public and local governments. Projects typically include low-cost projects that can be implemented quickly, such as signal timing upgrades and adding turn lanes and through lanes at intersections. The Maryland SHA has also has had considerable success with projects to improve freeway ramps and merge areas that have reduced congestion bottlenecks at a low cost. Specifically, the Maryland State Highway Administration (SHA) introduced in 2017 the “I-270 Innovative Congestion Management Plan” for I-270 between I-70 (Frederick) and I-495 (Washington). North of its pass-through of the Washington, D.C. suburb of Montgomery County (out to new town Clarksburg) I-270 has experienced tremendous growth in the past 15 years where it abuts southern Frederick County in the vicinity of Urbana, Comus, and southern Frederick City. The $105 million plan is the result of a public solicitation for ideas in 2016. The plan encompasses 14 unique roadway improvements ranging from re-configuring on- and off-ramps to correcting existing lane incongruences (using median widening in some cases) and generally tweaking, extending, or creating auxiliary lanes where possible. The plan boasts not to have to increase the current footprint of the facility—or in other words, no widening! It should be noted that I-270 already has high occupancy vehicle (HOV) lanes and a robust local-express lane configuration that is up to 12 lanes wide through its central portion through north Rockville, Gaithersburg, and Germantown. In addition to the physical corrections, SHA will introduce active traffic management (ATM) strategies in the form of variable speed limits, queue warnings, and adaptive ramp metering. While $105 million may not be everyone’s idea of a “low-cost” solution, keep in mind that it is the cumulative cost of 14 fixes, plus the construction and operation of ATM strategies along a 34-mile long corridor. Work is scheduled to be completed prior to 2020.
• In Florida, there is not a “bottleneck” planning process, per se; rather, bottleneck-related issues are addressed as part of the Florida Department of Transportation’s (FDOT) standard planning process. The planning process, which is managed by the FDOT Systems Planning Office, begins with needs identification conducted at the district level, then projects are developed and proposed for the Cost Feasible Plan. The Cost Feasible Plan is adopted and projects are ranked for inclusion into the 5-year or 10-year programs. Traffic data and the statewide model are used to identify deficiencies, but it is the responsibility of the districts to identify and resolve hot spots.
• The Washington State DOT (WSDOT) has no direct funding for bottlenecks, but formally recognizes “bottlenecks and chokepoints” in their project planning and development process and devotes a portion of the Washington Transportation Plan (WTP) to them. At the planning stage, the WSDOT considers bottlenecks together with traditional corridor improvements in a category called “Congestion Relief”—bottlenecks do not have their own category for assessment or funding. The Congestion Relief projects are ranked (prioritized) using the benefit/cost ratio and other qualitative factors.
Recurring Traffic Bottlenecks | A Primer
56 Success Stories: How Agencies are Developing Localized Redneck Reduction Programs
• Additionally, the “Moving Washington” initiative, a special 10-year program, specifically targeted the importance of the short-term low-cost improvements that are the hallmark of LBR projects. In “Moving Washington,” Tier 1 projects are “immediate, low-cost, operational fixes.” Another aspect of “Moving Washington” relevant for LBR programs is its reliance on performance measurement—not just to identify problems but to assess to the impacts of completed projects. More information on the use of performance measurement by the WSDOT may be found in their “Gray Notebook”: http://www.wsdot.wa.gov/accountability/.
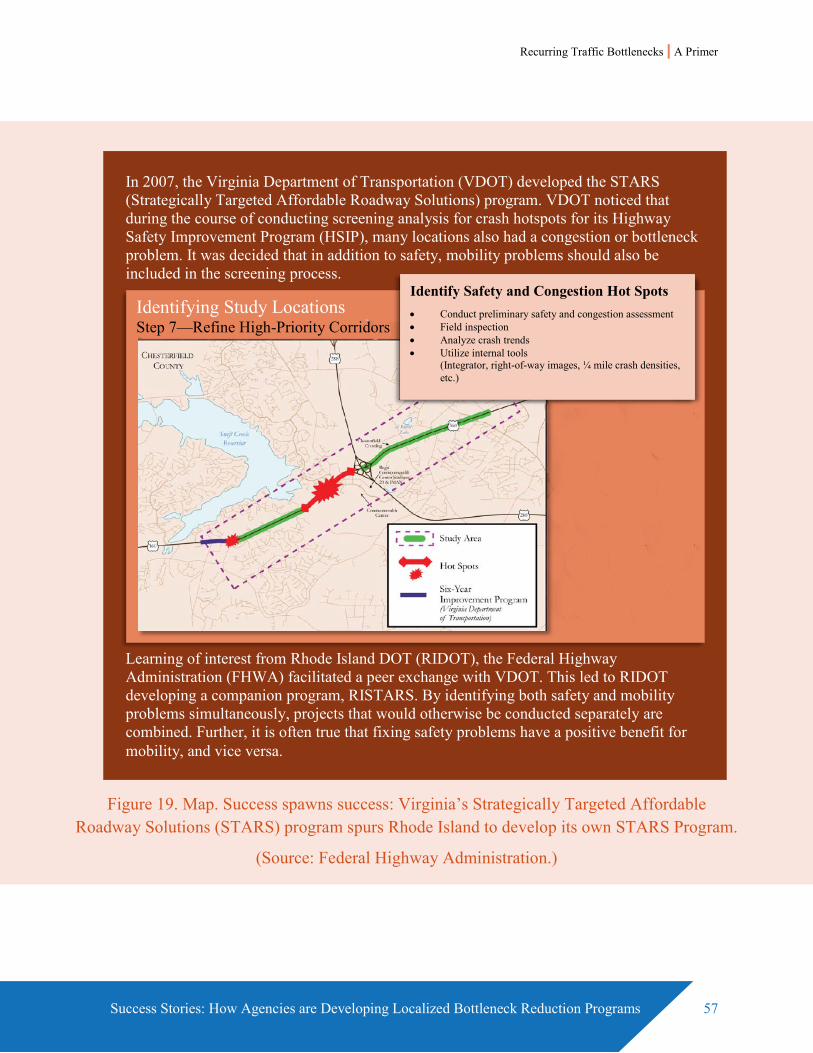
Recurring Traffic Bottlenecks | A Primer
Success Stories: How Agencies are Developing Localized Bottleneck Reduction Programs 57
In 2007, the Virginia Department of Transportation (VDOT) developed the STARS (Strategically Targeted Affordable Roadway Solutions) program. VDOT noticed that during the course of conducting screening analysis for crash hotspots for its Highway Safety Improvement Program (HSIP), many locations also had a congestion or bottleneck problem. It was decided that in addition to safety, mobility problems should also be included in the screening process.
Learning of interest from Rhode Island DOT (RIDOT), the Federal Highway Administration (FHWA) facilitated a peer exchange with VDOT. This led to RIDOT developing a companion program, RISTARS. By identifying both safety and mobility problems simultaneously, projects that would otherwise be conducted separately are combined. Further, it is often true that fixing safety problems have a positive benefit for mobility, and vice versa.
Identifying Study Locations Step 7—Refine High-Priority Corridors
Identify Safety and Congestion Hot Spots • Conduct preliminary safety and congestion assessment • Field inspection • Analyze crash trends • Utilize internal tools
(Integrator, right-of-way images, ¼ mile crash densities, etc.)
Figure 19. Map. Success spawns success: Virginia’s Strategically Targeted Affordable Roadway Solutions (STARS) program spurs Rhode Island to develop its own STARS Program.
(Source: Federal Highway Administration.)
Recurring Traffic Bottlenecks | A Primer
58 Success Stories: How Agencies are Developing Localized Redneck Reduction Programs
Successful Localized Bottleneck Reduction Applications
Many transportation agencies have recognized that low-cost treatments can provide effective congestion relief at bottlenecks. A wide variety of improvements have been implemented and many innovative improvements are emerging. Appendix C presents a range of case studies with expanded explanations of how these transportation agencies have used LBR used strategies to improve congestion at bottlenecks.
Want More Information?
The LBR Program has a comprehensive web site with additional information (http://www.ops.fhwa.dot.gov/bn/lbr.htm) and resources (http://www.ops.fhwa.dot.gov/bn/index.htm).
Recurring Traffic Bottlenecks | A Primer
Appendix A. Additional Principles on Traffic Flow and Bottlenecks 59
APPENDIX A. ADDITIONAL PRINCIPLES ON TRAFFIC FLOW AND BOTTLENECKS
Shock Waves and the Accordion Effect: The Movement of Queues on Freeways
Queues are formed when the volume of traffic trying to use a highway section exceeds the section’s capacity to carry it. This situation is familiar to all drivers—“stop-and-go traffic,” characterized by very low speeds. Shock waves are byproducts of traffic congestion and queueing. They are transition zones between two traffic states that move through a traffic environment like, as their name states, a propagating wave. That is, they form both when a queue is forming and when it is dissipating. When a queue is forming, the shock wave is said to be “backward forming”—the cascading sequence of brake lights on a freeway gives a good indication of the spread of a backward forming shockwave.
Shock waves are abrupt transitions in traffic flow characteristics—speed, density, and volume past a point change quickly as the shock wave moves. In other words, they are boundary conditions in time and space that demark a discontinuity in traffic flow conditions. A rapidly growing backward forming shockwave presents a dangerous situation for drivers, as the unexpected queue can appear very quickly.
On the flip side, a “recovery” shock waves occur as queues begins to dissipate. There are two types of recovery shock waves. A forward recovery shock wave forms at physical bottleneck areas such as congested on-ramp areas and lane-drops, i.e., areas where capacity is constant. As demand at the bottleneck drops below its capacity, the queue will start to dissipate from the rear toward the front, and the shock wave—the boundary condition—will move forwards. A backward recovery shock wave forms when capacity has been lost but is then restored, such as when a lane-blocking incident is cleared. The queue will start to dissipate from the front, so the shock wave will be backwards.
The nature of shock waves and queuing often gives drivers the impression that the congestion they just experienced had no cause. In the incident example, by the time a vehicle gets from the back of the queue to the point of the original blockage, the incident may have been totally removed. Rest assured, a bottleneck of some type was the reason for the congestion—something caused volumes to exceed capacity (our own ramp example) or something lowered capacity to the point where volumes now exceeded it (our incident example).


Recurring Traffic Bottlenecks | A Primer
Appendix B. Traffic Bottleneck Typology 61
APPENDIX B. TRAFFIC BOTTLENECK TYPOLOGY
Traffic Bottlenecks Typology: Localized sections of highway where traffic experiences reduced speeds and delays due to
recurring operational conditions or nonrecurring traffic-influencing events.
Occurrences Recurring: “Predictable” in cause, location, time of day, and approximate duration. Nonrecurring: “Random” (in the colloquial sense) as to location and severity. Even if planned in some cases, like work zones or special events, these occurrences are irregular and are not predictably habitual or recurring in location.
Causes Recurring: Operational Causes: A “facility determinate” condition wherein a fixed condition (the design or function of the facility at that point) allows surging traffic confluence to periodically overwhelm the roadway’s physical ability (i.e., capacity) to handle the traffic, resulting in predictable periods of delay.
Examples Recurring: Ramps, lane drops, weaves, merges, grades, underpasses, tunnels, narrow lanes, lack of shoulders, bridge lane reduction, curves, poorly operating traffic signals.
Supplementary Terms (applies to either type)
“Active” bottlenecks—When traffic “released” past the bottleneck is not affected by a downstream restriction (i.e., queue spillback) from another bottleneck. “Hidden” bottlenecks—When traffic demand is metered by another upstream bottleneck(s); i.e., either a lesser or nonexistent bottleneck that would increase or appear, respectively, if only unfettered.
Identification of (applies to either type)
Motorists typically refer to bottlenecks in terms of added time delay when compared to the same nondelayed trip, but engineers and agencies also measure performance data: average speed (travel time), lane densities, queue lengths, queue discharge rates, vehicle miles of travel (VMT), and vehicle hours of travel (VHT).
Measurement of (applies to either type)
Data is collected using manual techniques (e.g., floating cars, aerial photography, or manual counts from video recordings) or from dynamic surveillance (e.g., detectors, radar, video, etc.) collected in real time. Modeling, especially microsimulation, can be used to study the impacts of bottleneck remediation on upstream and downstream conditions.
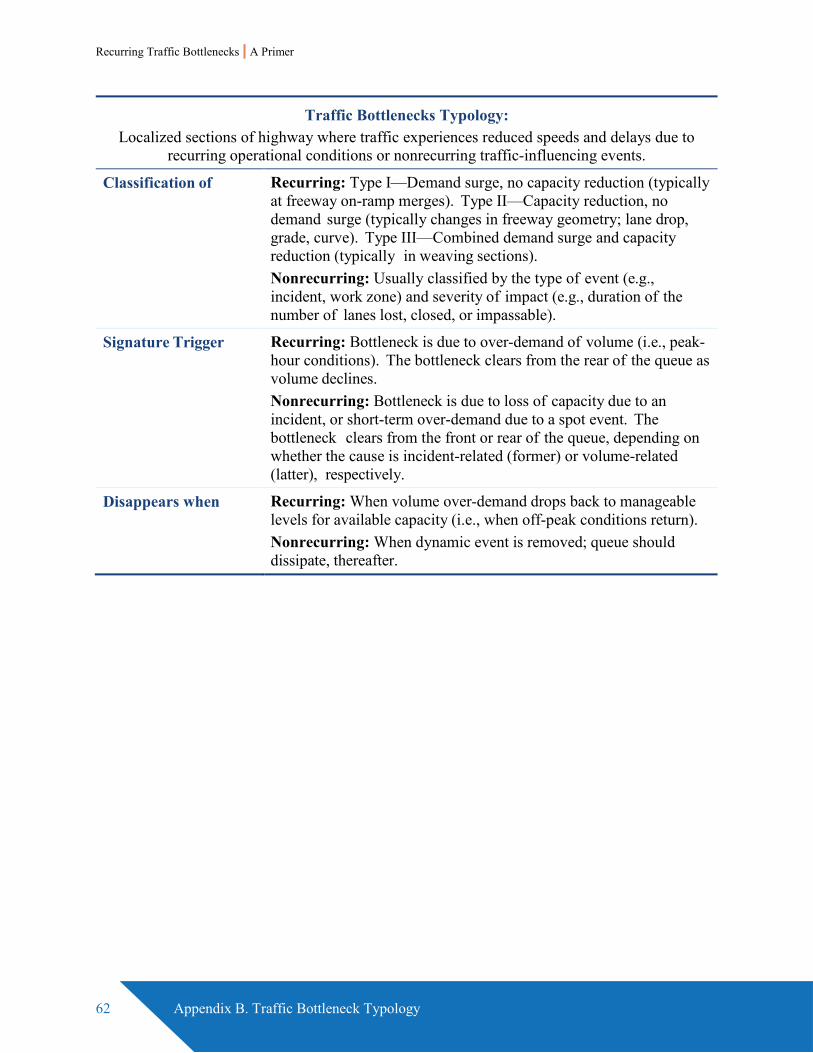
Recurring Traffic Bottlenecks | A Primer
62 Appendix B. Traffic Bottleneck Typology
Traffic Bottlenecks Typology: Localized sections of highway where traffic experiences reduced speeds and delays due to
recurring operational conditions or nonrecurring traffic-influencing events.
Classification of Recurring: Type I—Demand surge, no capacity reduction (typically at freeway on-ramp merges). Type II—Capacity reduction, no demand surge (typically changes in freeway geometry; lane drop, grade, curve). Type III—Combined demand surge and capacity reduction (typically in weaving sections). Nonrecurring: Usually classified by the type of event (e.g., incident, work zone) and severity of impact (e.g., duration of the number of lanes lost, closed, or impassable).
Signature Trigger Recurring: Bottleneck is due to over-demand of volume (i.e., peak-hour conditions). The bottleneck clears from the rear of the queue as volume declines. Nonrecurring: Bottleneck is due to loss of capacity due to an incident, or short-term over-demand due to a spot event. The bottleneck clears from the front or rear of the queue, depending on whether the cause is incident-related (former) or volume-related (latter), respectively.
Disappears when Recurring: When volume over-demand drops back to manageable levels for available capacity (i.e., when off-peak conditions return). Nonrecurring: When dynamic event is removed; queue should dissipate, thereafter.
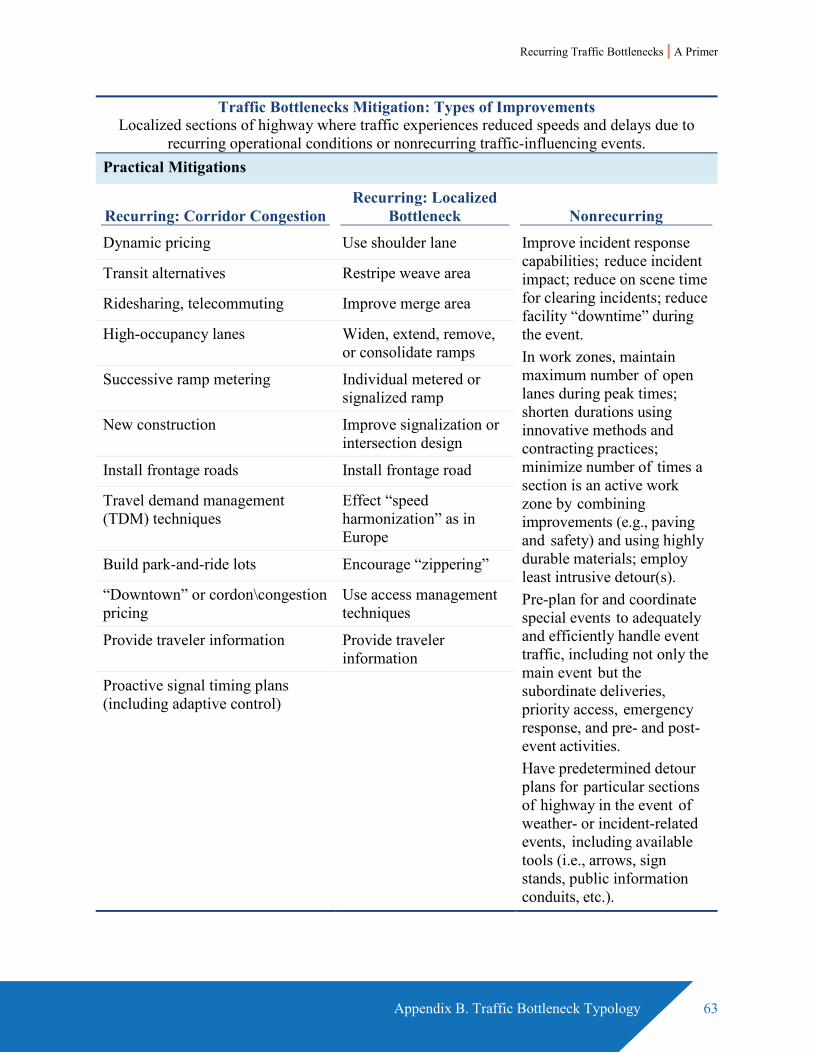
Recurring Traffic Bottlenecks | A Primer
Appendix B. Traffic Bottleneck Typology 63
Traffic Bottlenecks Mitigation: Types of Improvements Localized sections of highway where traffic experiences reduced speeds and delays due to
recurring operational conditions or nonrecurring traffic-influencing events. Practical Mitigations
Recurring: Corridor Congestion Recurring: Localized
Bottleneck Nonrecurring
Dynamic pricing Use shoulder lane Improve incident response capabilities; reduce incident impact; reduce on scene time for clearing incidents; reduce facility “downtime” during the event. In work zones, maintain maximum number of open lanes during peak times; shorten durations using innovative methods and contracting practices; minimize number of times a section is an active work zone by combining improvements (e.g., paving and safety) and using highly durable materials; employ least intrusive detour(s). Pre-plan for and coordinate special events to adequately and efficiently handle event traffic, including not only the main event but the subordinate deliveries, priority access, emergency response, and pre- and post- event activities. Have predetermined detour plans for particular sections of highway in the event of weather- or incident-related events, including available tools (i.e., arrows, sign stands, public information conduits, etc.).
Transit alternatives Restripe weave area
Ridesharing, telecommuting Improve merge area
High-occupancy lanes Widen, extend, remove, or consolidate ramps
Successive ramp metering Individual metered or signalized ramp
New construction Improve signalization or intersection design
Install frontage roads Install frontage road
Travel demand management (TDM) techniques
Effect “speed harmonization” as in Europe
Build park-and-ride lots Encourage “zippering”
“Downtown” or cordon\congestion pricing
Use access management techniques
Provide traveler information Provide traveler information
Proactive signal timing plans (including adaptive control)

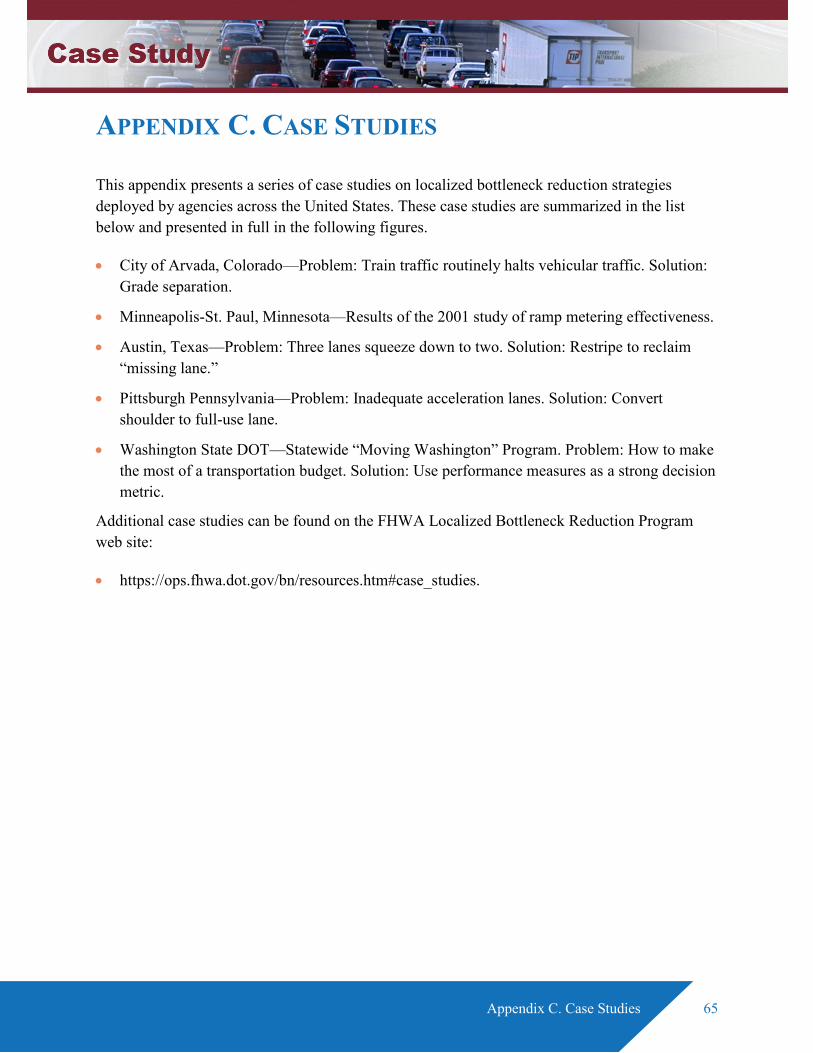
Appendix C. Case Studies 65
APPENDIX C. CASE STUDIES
This appendix presents a series of case studies on localized bottleneck reduction strategies deployed by agencies across the United States. These case studies are summarized in the list below and presented in full in the following figures.
• City of Arvada, Colorado—Problem: Train traffic routinely halts vehicular traffic. Solution: Grade separation.
• Minneapolis-St. Paul, Minnesota—Results of the 2001 study of ramp metering effectiveness.
• Austin, Texas—Problem: Three lanes squeeze down to two. Solution: Restripe to reclaim “missing lane.”
• Pittsburgh Pennsylvania—Problem: Inadequate acceleration lanes. Solution: Convert shoulder to full-use lane.
• Washington State DOT—Statewide “Moving Washington” Program. Problem: How to make the most of a transportation budget. Solution: Use performance measures as a strong decision metric.
Additional case studies can be found on the FHWA Localized Bottleneck Reduction Program web site:
• https://ops.fhwa.dot.gov/bn/resources.htm#case_studies.

66 Appendix C. Case Studies
Colorado
Location—City of Arvada, Colorado Grandview Avenue, and railroad, at Wadsworth Boulevard.
Problem—Train traffic routinely halts vehicular traffic and poses safety problems for emergency responses Train traffic (especially) and vehicles on Grandview Avenue would routinely block traffic on Wadsworth Boulevard. Emergency response in the vicinity was complicated and expensive, requiring two calls at all times—one for each side of the tracks—in the event that a train would come through.
Solution—Grade Separation Wadsworth Boulevard was lowered 25 feet and now passes under Grandview Avenue and the Northern Railroad. A wide median “gap” on Grandview Avenue will accommodate the future “Gold Line” (planned) commuter rail line. A pedestrian plaza (above, on Grandview) was also accommodated. The $32 million project ran from October 2006 to December 2008. Ironically, an early 1900s trolley originally ran on Wadsworth underneath Grandview, but was removed in the 1950s, and Wadsworth Boulevard was raised, creating the precursor to the subject problem; so the re-lowering of Wadsworth Boulevard was merely a full-circle remediation of this intersection. Much of the cost was given to easing the impact of the project. A local restaurant next to Grandview Avenue was relocated from the footprint of the project. The driving public felt minimum inconvenience during the project; roadway traffic on Wadsworth Boulevard was detoured to a temporary alignment which allowed three lanes in each direction to pass the project. Railroad traffic was detoured to a “shoofly” (i.e., temporary railroad bridge). The underpass now serves as a “Gateway to Olde Arvada” (i.e., downtown) and a shining success story for the Colorado Department of Transportation (CDOT).
Lesson Learned While $32 million and two years of construction may not seem the conventional definition of a “low cost, low impact” remediation, don’t tell that to the City of Arvada and CDOT. The highly visible, publicly praised project was an unequivocal success in terms of solving a long-standing bottleneck problem ($19 million in Federal and State formula funds, $6 million from Arvada, and most of the remainder from Federal earmarks)!
Figure 20. Traffic backed up on northbound Wadsworth prior to the project. Restaurant
(blue roof) had to be relocated. (Source: Federal Highway Administration.)
Figure 21. The new Grandview Bridge, “Gateway to Olde Arvada.”
(Source: Federal Highway Administration.)
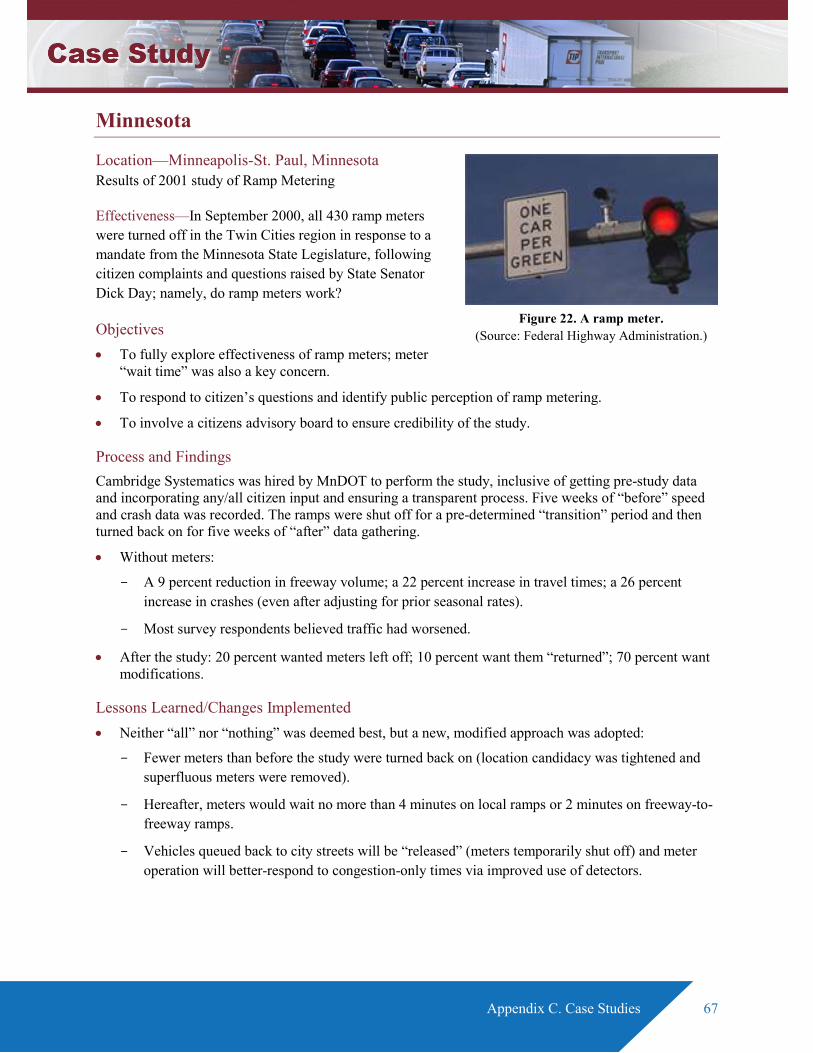
Appendix C. Case Studies 67
Minnesota
Location—Minneapolis-St. Paul, Minnesota Results of 2001 study of Ramp Metering
Effectiveness—In September 2000, all 430 ramp meters were turned off in the Twin Cities region in response to a mandate from the Minnesota State Legislature, following citizen complaints and questions raised by State Senator Dick Day; namely, do ramp meters work?
Objectives • To fully explore effectiveness of ramp meters; meter
“wait time” was also a key concern.
• To respond to citizen’s questions and identify public perception of ramp metering.
• To involve a citizens advisory board to ensure credibility of the study.
Process and Findings Cambridge Systematics was hired by MnDOT to perform the study, inclusive of getting pre-study data and incorporating any/all citizen input and ensuring a transparent process. Five weeks of “before” speed and crash data was recorded. The ramps were shut off for a pre-determined “transition” period and then turned back on for five weeks of “after” data gathering.
• Without meters:
- A 9 percent reduction in freeway volume; a 22 percent increase in travel times; a 26 percent increase in crashes (even after adjusting for prior seasonal rates).
- Most survey respondents believed traffic had worsened.
• After the study: 20 percent wanted meters left off; 10 percent want them “returned”; 70 percent want modifications.
Lessons Learned/Changes Implemented • Neither “all” nor “nothing” was deemed best, but a new, modified approach was adopted:
- Fewer meters than before the study were turned back on (location candidacy was tightened and superfluous meters were removed).
- Hereafter, meters would wait no more than 4 minutes on local ramps or 2 minutes on freeway-to-freeway ramps.
- Vehicles queued back to city streets will be “released” (meters temporarily shut off) and meter operation will better-respond to congestion-only times via improved use of detectors.
Figure 22. A ramp meter. (Source: Federal Highway Administration.)

68 Appendix C. Case Studies
Texas
Location—Austin, Texas Northbound U.S. 183 from the Missouri and Pacific (MOPAC) Freeway to Great Hills Trail
Problem—Three lanes squeeze down to two
Solution—Restripe to claim “missing lane” In November 2009, The Texas Department of Transportation (TxDOT) restriped the outside lane of northbound U.S. 183 and extended it beyond the Braker Lane exit.
The restriping did not affect the direct-connect ramp from the Missouri and Pacific freeway (MOPAC) to U.S. 183. "The footprint of U.S. 183 (remains) the same, but the new striping allows more cars to flow through, and eases evening congestion.”
Cost—$55,000 and “a few nights’ work”
Lessons Learned The project was generally so well received that one citizen commented: "If it was this easy and this cheap, what took you so long?" And since the project was completed in November 2009, the tone of comments received by TxDOT have generally remained along those lines.
Figure 23. The sign for U.S. 183. (Source: Federal Highway
Administration.)
Appendix C. Case Studies 69
Pennsylvania
Location—Pittsburgh, Pennsylvania I-279 at the Carnegie Interchange in Pittsburgh, Pennsylvania.
Problem—Inadequate acceleration lane The existing slip on-ramp from Academy Street onto southbound I-279 has been a major traffic bottleneck and high accident location for many years. The on-ramp did not have an acceleration lane to allow for the smooth merging of traffic entering the freeway. Thus, vehicles often came to a complete stop to wait for an acceptable gap in traffic. With high Interstate traffic volumes and typically high travel speeds, the existing configuration created an unsafe and inefficient merge condition. Accident rates at this location were high and traffic queues would regularly back-up on the ramp. Mainline traffic would also be slowed by driver uncertainty and friction created by the interchange. To further compound the problem, the freeway has two lanes in the southbound direction at the ramp location but widens to three lanes further downstream, making the ramp location even more evident as a bottleneck.
Solution—Convert shoulder to full-use lane Traditional improvements such as widening the freeway were infeasible economically because they would require widening the bridge piers for the overhead road. Therefore, the Pennsylvania Department of Transportation (PennDOT) and the Federal Highway Administration (FHWA) devised a low-cost solution which involves converting the existing right shoulder into a third freeway lane and re-striping the existing ramp to allow oncoming traffic to continue onto the freeway without stopping. The added third lane will be extended to tie in with the existing third lane of mainline traffic 800 feet downstream. The work will entail milling and resurfacing the shoulder to accommodate traffic, re-striping the ramp and mainline, and making minor changes to the ramp taper, with an estimated cost of $250,000. The project will completely remove the merge condition and bottleneck at the freeway entrance and eliminate ramp and mainline queues. Although the conversion of the shoulder will result in no shoulder presence for the length of the new lane segment, it was determined that a design exception was appropriate given the significant operational and safety benefits to result from the change. The work was scheduled to be completed in October 2007.
Lessons Learned This project demonstrates that low-cost, low-impact bottleneck improvements can make significant improvements in traffic flow.
70 Appendix C. Case Studies
Washington
Statewide Moving Washington Program Moving Washington (initiated in 2008) is the Governor’s 10-year, three-pronged strategy to combat congestion. It aims to 1) operate efficiently that which exists; 2) manage travel demand; and 3) add capacity, which itself is a three-tiered program:
1. Tier 1 jobs are immediate, low-cost, operational fixes. 2. Tier 2 jobs are medium-cost design-builds. 3. Tier 3 jobs are major future-planned system upgrades.
Problem—How to make the most of a transportation budget Using a combination of annual and “earmarked” State gas taxes, plus the normal Federal allocations, Washington uses a system of performance goals and measures to justify, warrant, and select candidate projects. Elected officials are educated to “buy in” to use metrics—and less so political means—to determine projects. Achieving “maximum throughput” is the defining target for the basis for congestion relief decisions. “The annual percent of system that is congested” is defined as the percent of lane miles that are routinely less than 70 percent of posted speeds.13
Solution—Use Performance measures as a strong decision metric Travel times and reliability are important measures to commuters and also to the Washington State Department of Transportation (WSDOT) in determining candidate projects. “WSDOT aims to provide and maintain a system that yields the most productivity or efficiency, rather than focus on providing a system that is free flowing, but in which fewer vehicles can pass through a segment during peaks.” Maximum throughput is achieved when vehicles travel at speeds between 42 and 51 miles per hour (mph) (roughly 70 percent to 85 percent of 60 mph) because more vehicles can pass a segment than would be at posted speeds. This happens because at the lesser speeds, vehicle headways can condense more safely. WSDOT measures “highway segments” (e.g., similar lane congruencies, geometrics and adjacent land use) and targets the inefficient ones. Stand-alone segments are candidates for Tier 1 and Tier 2 projects (see above) and “linked” segments become candidates for Tier 3, all things considered.
Lessons Learned In the 2000s, several “capacity expansion projects” (a WSDOT catch-all term for bottlenecks, etc.) provide examples of WSDOT’s process.
• I-405—Adding either one or two lanes where necessary to reduce local congestion.
• I-405 ‘South Bellevue’—Adding general purpose northbound and southbound lanes, and a southbound high occupancy vehicle (HOV) lane.
• SR 518—Adding a third eastbound lane between I-5 and SeaTac Airport to relieve a long-suffering recurrent problem.
• I-205 at Mill Plain exit and 112th connector—Creating a direct connection to NE 112th Avenue from the northbound I-205 off-ramp to Mill Plain Boulevard, which addressed safety problems too.
13 For more information see: http://www.wsdot.wa.gov/MovingWashington/.
Figure 24. Moving Washington logo.
(Source: Washington State Department of
Transportation.)
Recurring Traffic Bottlenecks | A Primer
Appendix D. Definitions and Traffic Bottleneck Typologies 71
APPENDIX D. DEFINITIONS AND TRAFFIC BOTTLENECK TYPOLOGIES
Auxiliary lanes—Typically, any lane whose primary function is not simply to carry through traffic. This can range from turn lanes, ramps, and other single purpose lanes, or it can be broadened to imply that a traffic bearing shoulder can be opened in peak periods to help alleviate a bottleneck, and then “shut back off” when the peak is over.
Bottleneck—There can be many definitions. Here are a few that are typically used.
1) A critical point of traffic congestion evidenced by queues upstream and free flowing traffic downstream; 2) A location on a highway where there is loss of physical capacity, surges in demand (traffic volumes), or both; 3) A point where traffic demand exceeds the normal capacity; and 4) A location where demand for usage of a highway section periodically exceeds the section’s physical ability to handle it, and is independent of traffic-disrupting events that can occur on the roadway.
Capacity—The maximum amount of traffic capable of being handled by a given highway section in a given time. It is usually recorded in terms of vehicles per lane (VPL) or vehicles per hour (VPH) or passenger cars per hour per lane (pcphpl). Traffic engineers usually speak in terms of “free flow” capacity as the maximum which can occur under unimpeded conditions.
Congestion (specifically, traffic congestion)—The FHWA’s Traffic Congestion and Reliability Report defines congestion as “an excess of vehicles on a portion of roadway at a particular time resulting in speeds that are slower—sometimes much slower—than normal or free flow speeds; (congestion is) stop-and-go traffic. Previous work has shown that congestion is the result of seven root causes often interacting with one another.”14 Since a bottleneck is a cause of congestion, congestion cannot be solely analogous to a bottleneck. Congestion is more. For example, a “congested” corridor may harbor multiple bottlenecks or any combination of the seven root causes of congestion.
Downstream traffic—Traffic that is beyond (past) the subject point on a highway.
14 The seven root causes are physical bottlenecks (a.k.a. “capacity constraints”), traffic incidents,
work zones, weather, poorly timed signals et al., special events, and over-capacity demand (i.e., daily and seasonal peaks superimposed on a system with a fixed capacity). Some sources cite only six root causes because they see over-demand as an inherent sub-element necessary for any of the other causes to exist in the first place. Put another way, absent over-demand, there would just be “volume,” but not necessarily “congested” volume.
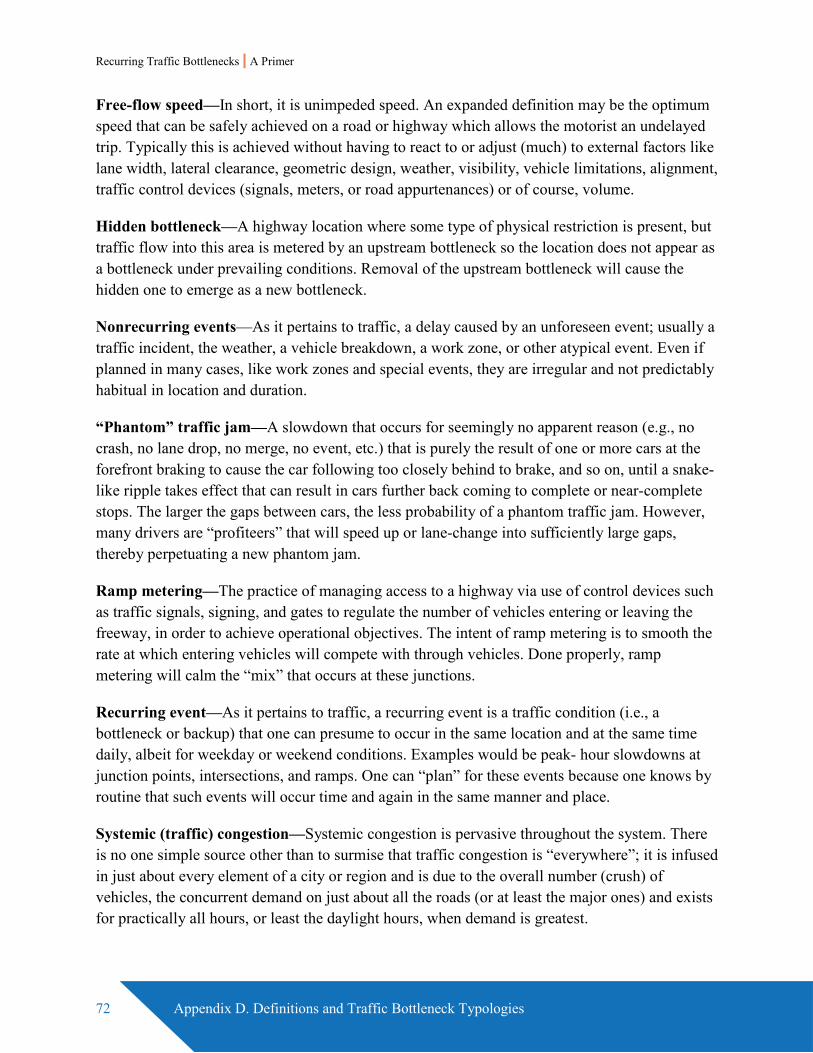
Recurring Traffic Bottlenecks | A Primer
72 Appendix D. Definitions and Traffic Bottleneck Typologies
Free-flow speed—In short, it is unimpeded speed. An expanded definition may be the optimum speed that can be safely achieved on a road or highway which allows the motorist an undelayed trip. Typically this is achieved without having to react to or adjust (much) to external factors like lane width, lateral clearance, geometric design, weather, visibility, vehicle limitations, alignment, traffic control devices (signals, meters, or road appurtenances) or of course, volume.
Hidden bottleneck—A highway location where some type of physical restriction is present, but traffic flow into this area is metered by an upstream bottleneck so the location does not appear as a bottleneck under prevailing conditions. Removal of the upstream bottleneck will cause the hidden one to emerge as a new bottleneck.
Nonrecurring events—As it pertains to traffic, a delay caused by an unforeseen event; usually a traffic incident, the weather, a vehicle breakdown, a work zone, or other atypical event. Even if planned in many cases, like work zones and special events, they are irregular and not predictably habitual in location and duration.
“Phantom” traffic jam—A slowdown that occurs for seemingly no apparent reason (e.g., no crash, no lane drop, no merge, no event, etc.) that is purely the result of one or more cars at the forefront braking to cause the car following too closely behind to brake, and so on, until a snake-like ripple takes effect that can result in cars further back coming to complete or near-complete stops. The larger the gaps between cars, the less probability of a phantom traffic jam. However, many drivers are “profiteers” that will speed up or lane-change into sufficiently large gaps, thereby perpetuating a new phantom jam.
Ramp metering—The practice of managing access to a highway via use of control devices such as traffic signals, signing, and gates to regulate the number of vehicles entering or leaving the freeway, in order to achieve operational objectives. The intent of ramp metering is to smooth the rate at which entering vehicles will compete with through vehicles. Done properly, ramp metering will calm the “mix” that occurs at these junctions.
Recurring event—As it pertains to traffic, a recurring event is a traffic condition (i.e., a bottleneck or backup) that one can presume to occur in the same location and at the same time daily, albeit for weekday or weekend conditions. Examples would be peak- hour slowdowns at junction points, intersections, and ramps. One can “plan” for these events because one knows by routine that such events will occur time and again in the same manner and place.
Systemic (traffic) congestion—Systemic congestion is pervasive throughout the system. There is no one simple source other than to surmise that traffic congestion is “everywhere”; it is infused in just about every element of a city or region and is due to the overall number (crush) of vehicles, the concurrent demand on just about all the roads (or at least the major ones) and exists for practically all hours, or least the daylight hours, when demand is greatest.
Recurring Traffic Bottlenecks | A Primer
Appendix D. Definitions and Traffic Bottleneck Typologies 73
Traffic microsimulation tools—Complex microsimulation tools that rely on input of traffic data, intersection “nodes,” facility “links,” and the associated parameters of each input, in order to output simulated conditions. By changing the inputs, engineers can test different sizes, characteristics, and out-year scenarios of traffic demand.
Upstream traffic—Traffic that has not yet arrived at the subject point on a highway.
Zippering—also known as the late merge or zipper merge is a convention for merging traffic into a reduced number of lanes. Drivers in merging lanes are expected to use both lanes to advance to the lane reduction point and merge at that location, alternating turns.
U.S. Department of Transportation Federal Highway Administration
Office of Operations 1200 New Jersey Avenue, SE
Washington, DC 20590
http://www.ops.fhwa.dot.gov
November 2017 FHWA-HOP-18-013
This material is based upon work supported by the FHWA under contract number DTFH61-12-D-00048.
Any opinions, findings and conclusions or recommendations expressed in this publication are those of the author(s) and do not necessarily reflect the views of the FHWA.


![[We Scented Candles]vitus.by/upload/iblock/e98/e986b9cc9e3f972d777d0b94aac7cb94.pdf · [We ♥ Scented Candles] - Lovely Fragrances for Candles 2 Precious scented candles, delicate](https://img.pdfslide.net/doc/110x75/5fdad192a722af2a9253f76f/we-scented-candlesvitusbyuploadiblocke98e986b9cc9e3f-we-a-scented-candles.jpg)