Embed Size (px)
Citation preview

The Final Report of the Evaluation of the Court Support Services
Division’s Probation Transition Program
Stephen M. Cox, Ph.D.
Professor, Department of Criminology and Criminal Justice
Kathleen Bantley, J.D.
Associate Professor, Department of Criminology and Criminal Justice
Sarah Newton
Graduate Assistant, Department of Criminology and Criminal Justice
Central Connecticut State University
June 2010
This project was funded in part through a contract from the Connecticut Judicial Branch, Court Support
Services Division. The Connecticut Judicial Branch nor any of its components are responsible for, or
necessarily endorse, the views expressed in this report.

Evaluation of the Probation Transition Program Central Connecticut State University
1
EXECUTIVE SUMMARY
The Judicial Branch’s Court Support Services Division (CSSD) began accepting
probationers into the Probation Transition Program (PTP) on October 1, 2004 in five probation
offices. The PTP targeted inmates who had probation sentences that followed their prison
sentence and subsequent release from the Department of Correction (DOC). The overarching
goal was to reduce the technical violation rate of split sentence probationers by helping them re-
enter their community following prison release. In theory, the lower caseloads would allow PTP
officers to spend more time assessing probationers, helping them find appropriate services, and
monitoring their behavior. Legislative funding to the Judicial Branch to hire more probation
officers led to the statewide expansion of the PTP in February of 2007. Faculty from the
Department of Criminology and Criminal Justice from Central Connecticut State University
were contracted to evaluate the PTP expansion. The following report summarizes the findings
and conclusions of this evaluation.
Areas of Research
The evaluation focused on three primary areas. First, we met with and interviewed PTP
officers regarding their attitudes about PTP, their perception of its success, and barriers that
hindered its ability to be successful. Second, as part of assessing the implementation of the PTP,
we examined the intake process in terms of looking at the number of probationers who entered
the program and the general profile of PTP clients. Third, data were collected for every client in
the PTP and a comparable group of probation officers on regular caseloads to assess program
outcomes in terms of probation violation rates and reincarceration rates. We looked at the nature
of the violations (new arrest vs. technical violation) and attempted to determine what client
factors were associated with being violated (e.g., LSI-R risk level, criminal history, gender, age,
marital status, education, and employment).
Summary of Findings
The process and outcome components of the PTP evaluation produced four distinct
conclusions. First, PTP was widely implemented in a manner consistent with the program
model. We found few differences in the demographics and risk scores of PTP clients across the
three study groups in the pilot offices and across the statewide expansion offices. These findings
suggest the selection criteria were being applied consistently across offices. There was also a
high amount of consistency in the program completion rate (over 70% of clients were
successfully transitioned into a regular caseload) across the expansion offices. The consistent
program implementation resulted in similar outcomes across PTP offices. With the exception of
a few of offices, the percentages of PTP clients technically violated were similar across the pilot
and expansion offices.
Second, the PTP appeared to be targeting the highest risk offenders. CSSD policy
dictated that PTP officers give priority to split-sentenced probationers with (1) insufficient
familial and/or peer support; (2) lack of housing; (3) extensive criminal history; (4) extensive
drug abuse; (5) history of mental health problems; (6) lack of employment; and, (7) a high total
risk score on the LSI-R. The majority of PTP participants were single/never married and

Evaluation of the Probation Transition Program Central Connecticut State University
2
unemployed with high LSI-R total risk scores. In fact, PTP participants in the expansion groups
had much higher LSI-R total risk and subscale scores than PTP participants in the pilot study.
Third, split-sentenced probationers in the PTP had statistically lower technical violation
rates and were statistically less likely to be sentenced to prison for technical violations than
similar groups of probationers. Specifically, comparison group probations were much more
likely to be technically violated than PTP clients in the pilot offices (more than twice as likely)
and the statewide expansion offices (almost twice as likely). Our first evaluation of the pilot
PTP program concluded that PTP reduced the technical violation rates of split-sentenced
probationers and also reduced the number of split-sentenced probationers who were resentenced
to prison for technical violations. The evaluation of the statewide expansion found that PTP still
produced lower technical violation rates in the five pilot offices and also in the statewide
expansion probation offices.
The final conclusion of this evaluation concerns the exploration of factors associated with
arrests and technical violations. There were differences in those PTP clients arrested versus
those who were technically violated. PTP clients who were arrested resembled the demographic
most likely to be arrested in general: young males with prior criminal records who were
unemployed, used drugs and/or alcohol, and had a peer group who likely encouraged their
criminal behavior. In contrast, PTP clients most likely to receive technical violations had several
risk factors associated with instability. They were unemployed, had unstable housing, used
alcohol or drugs, and had a negative peer group (they were also younger probationers with
criminal histories).
Overall Conclusion and Recommendations
Our overall conclusion was the PTP was effective in reducing technical violations and
new prison sentences from technical violations. The PTP was implemented consistently in the
pilot offices and the statewide expansion offices while targeting high risk probationers. We do,
however, offer the following recommendations to improve the delivery of the PTP:
More PTP specific training for PTP officers that includes a detailed presentation of
the PTP purpose and model.
Develop better and more consistent communication methods with the Department of
Correction.
Identify and develop more skills-based and employment services for PTP clients.
Unemployment was a major factor for PTP participants who were arrested and
technically violated.
While it was not part of our evaluation, it is important to acknowledge the progress CSSD
has made in automating its case management system (CMIS) and also enhancing its internal
ability to conduct research. One aspect of CSSD’s 2004 report to the General Assembly
included the creation of a component involving research and evaluation. CSSD did establish the
Center for Research, Program Analysis and Quality Improvement. Since its inception, this unit
has greatly furthered CSSD’s ability to implement and sustain evidence-based practices by
disseminating probationer information and assessments to probation supervisors and program
staff, conducting internal research and evaluation of its programs, and supporting external
research and evaluation initiatives.

Evaluation of the Probation Transition Program Central Connecticut State University
3
TABLE OF CONTENTS
EXECUTIVE SUMMARY ............................................................................................................ 1
INTRODUCTION AND BACKGROUND OF THE PROGRAM ................................................ 4
IMPLEMENTATION OF THE PROBATION TRANSITION PROGRAM ................................ 6
Screening and Selection Process ............................................................................................. 6
Program Operation .................................................................................................................. 7
PTP Officer Selection ............................................................................................................. 7
Training ................................................................................................................................... 8
EVALUATION METHODOLOGY .............................................................................................. 9
Areas of Research ....................................................................................................................... 9
Research Design and Data .......................................................................................................... 9
Definition and Measurement of Recidivism ............................................................................. 11
Creation of the PTP Comparison Groups ................................................................................. 11
EVALUATION FINDINGS ......................................................................................................... 13
PTP Probation Officer Interviews ............................................................................................. 13
Background and Training ..................................................................................................... 13
Caseload Management .......................................................................................................... 14
Technical Resources ............................................................................................................. 15
Client Referrals to the PTP ................................................................................................... 17
Outcome Analysis ..................................................................................................................... 18
PTP Completion Rates .......................................................................................................... 21
Program Outcomes: New Arrests and Technical Violations ................................................ 24
Factors Influencing One Year PTP Outcomes ...................................................................... 27
Table 24. Multinomial Regression For New Arrests and Technical Violations .................. 30
Comparison Group Analysis ................................................................................................. 30
Summary of the Outcome Analysis ...................................................................................... 34
EVALUATION CONCLUSIONS AND RECOMMENDATIONS ............................................ 37
Conclusions ............................................................................................................................... 37
Overall Conclusion and Recommendations .......................................................................... 39
APPENDIX A – CSSD’S PTP POLICY ...................................................................................... 40
APPENDIX B – PROBATION OFFICER INTERVIEW INSTRUMENT ................................. 52
APPENDIX C – PTP AND COMPARISON GROUP DEMOGRAPHICS AND LSI-R SCORES
....................................................................................................................................................... 55

Evaluation of the Probation Transition Program Central Connecticut State University
4
INTRODUCTION AND BACKGROUND OF THE PROGRAM
Prison and jail overcrowding has been a concern in Connecticut since the early 1990s.
The prison population increased 82% (10,573 to 19,216) between 1992 and 2003 with the largest
increase taking place with accused offenders awaiting trial or sentencing (145% during this time
period) (see the 2003 State of Connecticut Prison and Jail Overcrowding Commission’s report).
One commonly held belief was that probation violators comprised a high percentage of the
prison population (some estimates reported that over 25% of Connecticut inmates were probation
violators) with a significant number of probationers being sentenced to prison for technical
violations.
As a response to concerns over the prison population, the Connecticut General Assembly
passed Public Act 04-234, An Act Concerning Prison Overcrowding, on May 19, 2004.
Governor Rowland signed this act into law on June 8, 2004 and it went into effect on July 1,
2004. The Act introduced several ways to reduce the number of people being incarcerated. One
aspect of this legislation specifically pertained to the Judicial Branch. Sec. 26 (a) required the
Judicial Branch to submit a plan, no later than October 15, 2004, to the joint standing committees
of the General Assembly, “to reduce by at least twenty percent the number of incarcerations
resulting from technical violations of conditions”.
In accordance with the time frames indicated above, the Judicial Branch’s Court Support
Services Division (CSSD) submitted “A Report on Strategies to Reduce Technical Violations of
Probation” on October 15, 2004. This report outlined a four-point program to reduce violations
of probation. The proposed program consisted of a case management plan, a response to non-
compliance policy change, the introduction of two special probation projects, and lastly, a
component involving research and evaluation.
The two special probation projects were the Probation Transition Program (PTP) and the
Technical Violations Units (TVU). These projects were aimed at reducing the number of
technical violations for two different groups of probationers. The PTP targeted inmates who had
terms of probation upon their discharge from the Department of Correction (i.e., split sentenced
probationers). The targeted PTP pool included all inmates, excluding sex offenders, who served
a sentence of 90 days or more, and who would be discharged from DOC custody with a period of
probation to follow. The goal of this program was to reduce technical violations for split
sentenced probationers by better helping them re-enter their communities following prison
release.
The TVU targeted probationers not complying with their court or probation officer-
ordered terms of probation and were about to receive a technical violation (e.g., deliberate or
repeated non-compliance with court ordered conditions, reporting requirements, and service
treatment requirements). The Technical Violations Unit program was designed to reduce the
number of probationers sentenced to incarceration as a result of technical violations of probation.
TVU officers had lower caseloads so they could attempt to stabilize clients to avoid having to
technically violate them.

Evaluation of the Probation Transition Program Central Connecticut State University
5
The PTP was initially piloted in five probation offices across Connecticut. Two
probation officers staffed the PTP at each of the five probation office locations: Bridgeport,
Hartford, New Haven, New London, and Waterbury. While each probation officer ideally had a
maximum caseload no higher than 25 probationers, the actual caseload size varied by location.
PTP officers were given access to motor vehicles, cell phones, and laptop computers. Also,
services were available to probationers 24 hours a day and seven days a week.
Faculty from Central Connecticut State University’s Department of Criminology and
Criminal Justice were contracted to evaluate the pilot PTP. A report was released in January of
2005 finding that the PTP met the legislative mandate by reducing the number of probation
technical violators being resentenced to prison by 20%. A subsequent report released in August
of 2006 had two major findings. First, PTP participants had significantly lower probation
violation rates than the PTP comparison group (36% to 52%) one year after their release from
prison. This difference was directly attributed to a lower technical violation rate (14% for the
PTP and 26% for the PTP comparison group). Second, the Level of Service Inventory–Revised
(LSI-R) overall risk level was a significant predictor of PTP success, in that, the higher the risk
level the more likely PTP clients would be violated (although the PTP violation rate was lower
than the PTP comparison group at every risk level). This finding was supported by the
comparison of violators to non-violators. PTP violators had significantly higher risk scores
across most of the LSI-R subscales. Third, the reincarceration rate for PTP (17%) was
significantly lower than the PTP comparison group (41%). While some of these differences
were explained by the lower probation violation rates, judges were also less likely to sentence
PTP technical violators to prison than technical violators in the PTP comparison group.
As a result of the success of the pilot program, the General Assembly provided additional
funding to the Judicial Branch for the expansion of the PTP. The goal was to have PTP officers
in probation offices throughout Connecticut and incorporate those practices leading to the
success of the pilots. These were lower specialized caseloads (which allowed probation officers
to be more accessible to clients), availability of services, and initial and ongoing training from
CSSD staff and outside experts. Another key component of the PTP pilot was the 24 hour a
day/seven day a week availability of probation officers by providing them with laptop
computers, cellular telephones, and automobiles. Expansion of PTP began on February 1, 2007.
This document presents the overall process and outcome findings of the Probation
Transition Program evaluation. It begins with a description of the Probation Transition Program
and is followed by a summary of the evaluation methodology. The evaluation findings are
presented in the next section that discusses the results of the probation officer interviews and is
followed by the analysis of probation and court data. The final section of the report presents the
overall conclusions and recommendations for future programming and practice.

Evaluation of the Probation Transition Program Central Connecticut State University
6
IMPLEMENTATION OF THE PROBATION TRANSITION PROGRAM
The Probation Transition Program (PTP) targeted inmates who had probation sentences
following their prison sentence and subsequent release from the Department of Correction
(DOC). This group included those discharging at the end of sentence from a correctional
facility, halfway house, parole, transitional supervision or a re-entry furlough. The overarching
goal was to reduce the technical violation rate of split sentence probationers by helping them re-
enter their community following prison release. In theory, the lower caseloads would allow PTP
officers to spend more time assessing probationers, helping them find appropriate services, and
monitoring their behavior.
Screening and Selection Process
PTP officers received periodic reports from the Department of Correction identifying
inmates with split sentences who were serving 30 or more days of a prison sentence. PTP
officers received these reports and conducted preliminary reviews of inmates’ court and
probation records. PTP officers were required to meet with all split sentence probationers prior
to their prison release (with the exception of sex offenders who were not eligible for the PTP).
After this initial determination, PTP officers met with inmates in correctional institutions to
review conditions of probation and probationers’ obligation to report to their probation offices on
a specific dates. PTP officers also conducted in-depth assessments through an LSI-R (Level of
Service Inventory-Revised) and ASUS-R (Adult Substance Use Survey-Revised). The LSI-R is
a 54 item assessment instrument that identified risks and needs. It was composed of ten
subscales that have been found to be predictive of recidivism (criminal history,
education/employment, financial, family/marital, accommodation, leisure/recreation,
companions, alcohol/drug problems, emotional/personal, and attitude/orientation). The ASUS-R
is a 96 item survey that screens and assesses individuals’ alcohol and drug use involvement.
PTP officers used this information to create case plans and begin arranging for
appropriate services when inmates left prison and started their probation sentence. The more
commonly identified areas of need were housing, employment, substance abuse, and mental
health treatment. These services were provided in a variety of ways and varied by location since
available resources varied by location throughout the state. If there were situations where PTP
officers were at caseload capacity, priority was given to inmates with (1) insufficient familial
and/or peer support; (2) lack of housing; (3) extensive criminal history; (4) extensive drug abuse;
(5) history of mental health problems; (6) lack of employment; and, (7) a high total risk score on
the LSI-R.
Within the first 5 business days of release from a DOC facility, PTP officers met with
probationers in the office or in the community. Given the extent of the pre-release planning, PTP
officers attempted to secure needed services before probationers left prison. In general, four
face-to-face and two collateral contacts per month were made during the first four months of
supervision with additional contacts made as needs arose. The goal was to stabilize probationers
during this time and transition them to regular probation caseloads (see Appendix A for CSSD’s
PTP policies).

Evaluation of the Probation Transition Program Central Connecticut State University
7
Program Operation
For the piloting of the PTP, each probation office had its own method of operating. For
example, some locations used the same PTP officer to do both the intake in the correctional
facility and the supervision of the inmate upon release. In those cases, officers had a maximum
of 25 probationers. Other locations divided the workload by having only one of the PTP officers
do the initial screening and assessment and the other do the supervision. These officers typically
had a caseload that was larger than 25 probationers.
Following the statewide expansion of PTP, CSSD made two specific changes to the daily
operation of it. First, caseload sizes were increased to 35 probationers per officer. CSSD
determined that this increase from 25 to 35 would not significantly decrease the effectiveness of
the PTP. Second, CSSD adapted a regional PTP approach. That is, each region was allowed to
develop its own PTP model as long as the PTP policies were followed. The reason for the
regional approach was that it was more efficient to have PTP offices share resources than have
each office operate on its own. For example, it was inefficient for two PTP officers from two
different offices in the same region to go to the same prison each day to interview and assess
PTP-eligible inmates. Under the regional model, one PTP officer would go to the prison to
interview and assess all PTP-eligible inmates in that region and simply forward the assessments
to other PTP officers.
In the piloting of the PTP, all PTP officers were given access to automobiles, cell phones,
and laptop computers. However, additional expansion funding was not provided for automobiles
or laptop computers. PTP officers had to share motor vehicles with other probation officers in
their offices or had to use their personal vehicles. Decreases in the overall operating budget
caused CSSD to stop issuing laptop computers altogether for PTP officers.
PTP supervision was designed to last 30 to 120 days from a clients’ release from prison
but probationers could remain in PTP after this time period with approval from the PTP officers’
supervisors. PTP participants were transitioned from PTP to a regular probation caseload after
the PTP officer believed that a probationer was successfully re-integrated back into the
community. Clients had to remain in PTP for a minimum of 30 days and could be transitioned
after they were responding well to being back in the community.
PTP Officer Selection
Probation officers were asked to volunteer to be PTP officers. In offices where multiple
probation officers volunteered, probation supervisors decided who would participate. Selection
of the officers varied based on location. The more common reasons for selection were the
number of years he/she had been working in probation, attitude, communication skills,
management skills, ability to work with a challenging population, ability to motivate a client
towards positive change, and willingness to be available to clients 24 hours a day seven days a
week. In some instances with the statewide expansion, new probation officers were assigned to
the PTP.

Evaluation of the Probation Transition Program Central Connecticut State University
8
Training
During the pilot of PTP, all PTP officers, along with the treatment providers assigned to
the PTP, were required to participate in intensive training centered on the importance of using
the principles of cognitive behavioral change to their daily casework. Coursework consisted of
Motivational Interviewing and Criminal Thinking. The initial training was completed from
January through April of 2004. Some coursework and refresher programs were ongoing.
Trained facilitators from the CSSD Center for Best Practices and experts in the field of
cognitive-behavioral change delivered the training.
However, probation officers participating in PTP during the second year of the pilot and
the statewide expansion were not offered specialized training. New PTP officers received LSI-R
and Motivational Interviewing training during their initial training academy but were not
provided training specific to the PTP. If a probation supervisor thought a PTP officer was not
effectively working with clients or unable to properly assess them, that PTP officer could be
required to attend booster training sessions.
Evaluation of the Probation Transition Program Central Connecticut State University
9
EVALUATION METHODOLOGY
The evaluation employed both qualitative and quantitative research methods in assessing
the overall effectiveness of the Probation Transition Program (PTP). These methods centered on
two aspects of this program. First, we examined the implementation of the program within and
across the individual probation offices in order to better understand the daily activities of
probation officers assigned to these units. Without knowing how well the program was
implemented, we would have been unable to draw firm conclusions regarding any results they
produced (positive or negative). Second, we collected and analyzed data on a sample of program
participants and a comparison group of probationers on regular caseloads to determine the effects
of the PTP on recidivism both during and following their involvement in the program. This
analysis included a detailed comparison of probationers violated during the program and
probationers who successfully completed the PTP.
Areas of Research
The evaluation focused on three primary areas. First, we met with and interviewed PTP
officers regarding their attitudes about PTP, their perception of its success, and barriers that
hindered its ability to be successful. Second, as part of assessing the implementation of the PTP,
we examined the intake process in terms of looking at the number of probationers who entered
the program and the general profiles of PTP clients. This step was necessary to determine the
levels of program utilization and to better understand what types of probationers were being
selected to participate in the PTP. Third, data were collected for every client in the PTP and a
comparable group of probation officers on regular caseloads to assess program outcomes in
terms of probation violation rates and reincarceration rates. We looked at the nature of the
violations (new arrest vs. technical violation) and attempted to determine what client factors
were associated with being violated (e.g., LSI-R risk levels, criminal history, gender, age, marital
status, education, and employment).
Research Design and Data
The evaluation incorporated both qualitative and quantitative methods within the research
design. The qualitative methods consisted of face-to-face and telephone interviews with PTP
officers conducted during the Fall of 2008 and the Winter of 2010. All PTP officers were
contacted by evaluation staff and were invited to participate in the interviews. The interviews
lasted approximately 45 minutes to one hour and consisted of a series of open and closed-ended
questions pertaining to the various aspects of the PTP. The interview questions were based on
observations and evaluation findings from our earlier evaluation of the PTP pilot. These
questions focused on probation officer selection and training, case management, technical
resources available to PTP officers, and client referrals to the PTP (see Appendix B for the
interview instrument).
The quantitative aspect of the evaluation utilized a secondary analysis of existing data.
Specifically, data from the Court Support Services Division’s case management information
system (CMIS) were collected for all clients entering the PTP between October 1, 2004 and

Evaluation of the Probation Transition Program Central Connecticut State University
10
August 31, 2008. We limited our sample to clients entering PTP prior to September 1, 2008 so
that we would be able to have a follow-up period of one year for all PTP clients. The CMIS data
contained the following information:
PTP start and end dates
Type of PTP discharge (successful vs. unsuccessful)
Demographic information (age, gender, race/ethnicity, marital status, education
level obtained, employment)
Date of probation violation (if one occurred)
Nature and disposition of probation violation
Criminal history (bail charges, prior arrests and convictions, age at first arrest)
Current offense (offense type, number and types of charges, number and types of
convictions)
Level of Service Inventory Revised scores (LSI-R)
In the pilot evaluation and subsequent reports we also included the Adult Substance
Abuse Survey (ASUS). However, ASUS scores were collected but were not used in this report
because CSSD switched from the ASUS to the ASUS-R midway through the evaluation. We
were concerned that the change in instruments midway through the evaluation could have
decreased the validity of our results and conclusions.
These data were collected for 2,286 PTP clients. Three study group cohorts were created
for the PTP evaluation so that we could assess differences occurring at different stages of PTP
implementation. The first cohort (Pilot Year One) consisted of clients who participated in the
PTP from October 1, 2004 to October 1, 2005. The second cohort (Pilot Year Two) was
comprised of clients who entered the PTP in the second year of the pilot program but before the
expansion (October 2, 2005 to January 31, 2007). The third cohort (Expansion) consisted of
clients entering the PTP after the expansion of these programs from the pilot offices to the entire
state (February 1, 2007 to August 31, 2008).
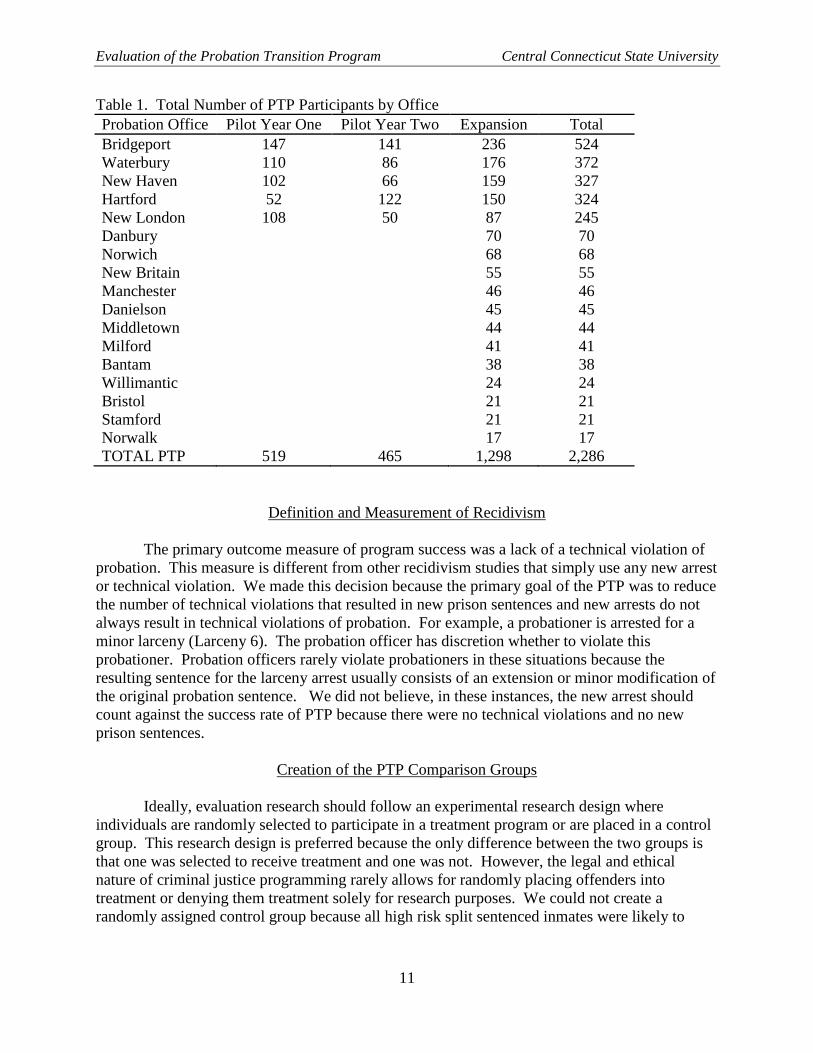
The pilot program of PTP consisted of five offices with a total of 519 PTP participants in
the first year of the pilot and 465 in the second year (Table 1). The expansion included adding
more PTP officers to the five pilot offices as well as putting PTP officers in probation offices
across Connecticut. There were 1,298 PTP participants in the first year of the expansion. Some
offices had low numbers of PTP participants (namely Norwalk, Stamford, and Bristol) during the
first year of the pilot due to a delayed start up of the program.
Evaluation of the Probation Transition Program Central Connecticut State University
11
Table 1. Total Number of PTP Participants by Office
Probation Office Pilot Year One Pilot Year Two Expansion Total
Bridgeport 147 141 236 524
Waterbury 110 86 176 372
New Haven 102 66 159 327
Hartford 52 122 150 324
New London 108 50 87 245
Danbury 70 70
Norwich 68 68
New Britain 55 55
Manchester 46 46
Danielson 45 45
Middletown 44 44
Milford 41 41
Bantam 38 38
Willimantic 24 24
Bristol 21 21
Stamford 21 21
Norwalk 17 17
TOTAL PTP 519 465 1,298 2,286
Definition and Measurement of Recidivism
The primary outcome measure of program success was a lack of a technical violation of
probation. This measure is different from other recidivism studies that simply use any new arrest
or technical violation. We made this decision because the primary goal of the PTP was to reduce
the number of technical violations that resulted in new prison sentences and new arrests do not
always result in technical violations of probation. For example, a probationer is arrested for a
minor larceny (Larceny 6). The probation officer has discretion whether to violate this
probationer. Probation officers rarely violate probationers in these situations because the
resulting sentence for the larceny arrest usually consists of an extension or minor modification of
the original probation sentence. We did not believe, in these instances, the new arrest should
count against the success rate of PTP because there were no technical violations and no new
prison sentences.
Creation of the PTP Comparison Groups
Ideally, evaluation research should follow an experimental research design where
individuals are randomly selected to participate in a treatment program or are placed in a control
group. This research design is preferred because the only difference between the two groups is
that one was selected to receive treatment and one was not. However, the legal and ethical
nature of criminal justice programming rarely allows for randomly placing offenders into
treatment or denying them treatment solely for research purposes. We could not create a
randomly assigned control group because all high risk split sentenced inmates were likely to

Evaluation of the Probation Transition Program Central Connecticut State University
12
participate in the PTP. Additionally, in cases where there were more inmates than PTP
availability, PTP officers selected the most risky offenders.
We used two methods for creating comparison groups that were as similar to PTP
participants as possible. Both methods used what is known as a historical comparison group.
The historical comparison groups were comprised of probationers who were on probation prior
to the implementation of the PTP and would have been eligible to participate if it had existed.
For the five PTP pilot sites in our initial evaluation of PTP, the historical comparison group was
created by collecting data on closed split sentenced probation cases from the same five courts
where the PTP was piloted. To minimize the historical affects of supervision trends and policy,
we selected high risk cases that were closed in the three-month period prior to inception of the
PTP. These cases were closed because the probationer either had completed his/her probation
sentence or had his/her probation terminated or revoked due to a new arrest or technical
violation. The cases were high risk based on their LSI-R total risk score and assigned
supervision level. After collecting CMIS data on this group, we conducted a number of
statistical tests on the two groups and found that the PTP pilot group was very similar to the pilot
historical comparison group.
For the twelve expansion sites, we collected CMIS data for all probationers in the
expansion offices who started probation one year prior to the implementation of the PTP
expansion. After these data were collected, we selected probationers having high LSI-R total
risk scores or were assigned to a supervision level of high or surveillance. We then conducted
several statistical tests on the two groups and found little significant differences between the PTP
expansion group and the expansion historical comparison group.

Evaluation of the Probation Transition Program Central Connecticut State University
13
EVALUATION FINDINGS
The following section presents the results of the quantitative and qualitative aspects of
the evaluation. We begin by summarizing the results of the PTP probation officer interviews.
This presentation is followed by the outcome analysis of CMIS data.
PTP Probation Officer Interviews
All PTP officers were asked to participate in 45 minute telephone interviews. They were
asked about their role and attitudes regarding the PTP. Specifically, questions fell into four
general categories: Background and Training; Caseload Management; Technical Resources; and,
Client Referrals to PTP. A total of 23 PTP officers participated in these interviews.
Background and Training
The questions asked in this category related to when the officer actually was hired, when
he/she started the PTP, meeting and trainings officers attended or received, whether the officer
had a mentor or person he or she could seek out for advice, and if there was any type of
assistance or training that was needed for the program.
PTP officers were first asked how long they had been probation officers prior to PTP and
the answers ranged from 2 to 14 years (Table 2). Most of the PTP officers (61%) had been
probation officers from 1 to 4 years. Two of the interviewed officers started their probation
careers as PTP officers.
Table 2. Probation Officer Experience Prior to the PTP
Category Frequency Percentage
New Probation Officer 2 9%
Less than One Year 1 4%
One to Four Years 14 61%
More than Four Years 6 26%
Table 3 presents how officers became involved in the PTP. The majority of the
interviewed officers (74%) volunteered for the PTP (Table 3). Three (13%) PTP officers were
assigned to the unit and three others were hired to be PTP officers.
Table 3. How Did You Become Involved with this Program?
Amount Category Frequency Percentage
Volunteered 17 74%
Assigned to Position 3 13%
Hired for Position 3 13%
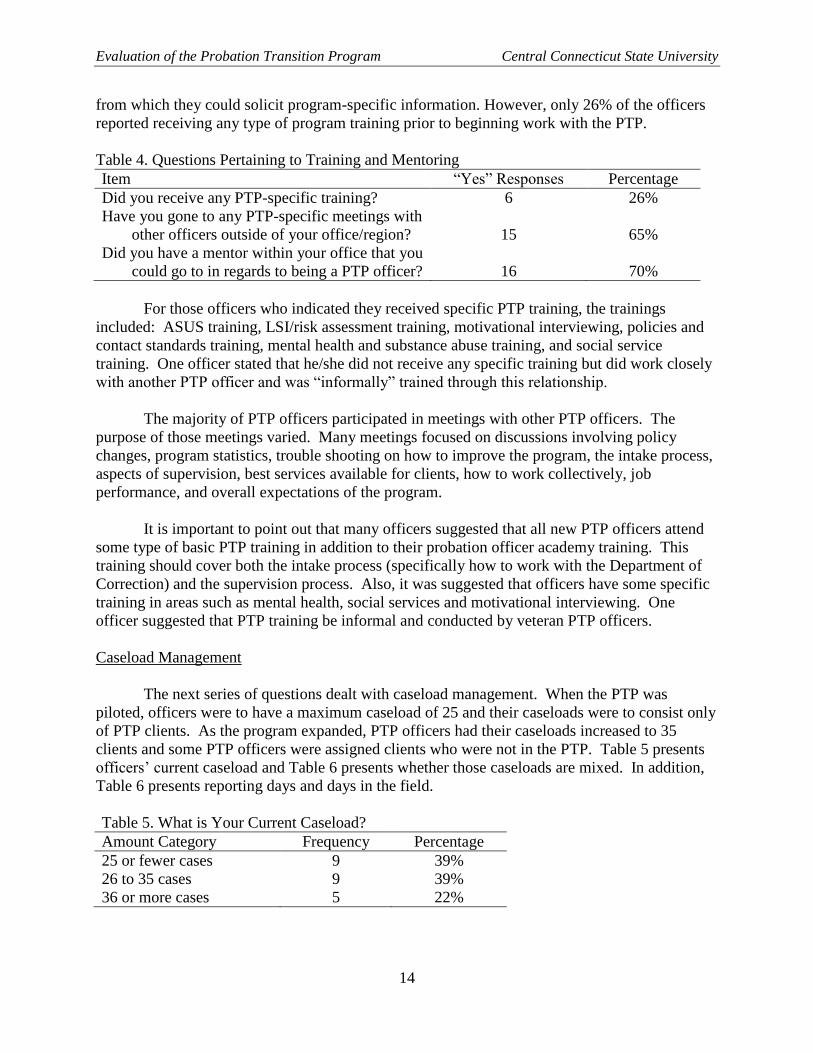
Next, the officers were asked if they received any training or mentoring once they joined
the PTP. In regards to their training and mentoring (Table 4), 65% of the interviewed officers
reported attending inter-office/region meetings regarding PTP and 70% reported having mentors
Evaluation of the Probation Transition Program Central Connecticut State University
14
from which they could solicit program-specific information. However, only 26% of the officers
reported receiving any type of program training prior to beginning work with the PTP.
Table 4. Questions Pertaining to Training and Mentoring
Item “Yes” Responses Percentage
Did you receive any PTP-specific training? 6 26%
Have you gone to any PTP-specific meetings with
other officers outside of your office/region? 15 65%
Did you have a mentor within your office that you
could go to in regards to being a PTP officer? 16 70%
For those officers who indicated they received specific PTP training, the trainings
included: ASUS training, LSI/risk assessment training, motivational interviewing, policies and
contact standards training, mental health and substance abuse training, and social service
training. One officer stated that he/she did not receive any specific training but did work closely
with another PTP officer and was “informally” trained through this relationship.
The majority of PTP officers participated in meetings with other PTP officers. The
purpose of those meetings varied. Many meetings focused on discussions involving policy
changes, program statistics, trouble shooting on how to improve the program, the intake process,
aspects of supervision, best services available for clients, how to work collectively, job
performance, and overall expectations of the program.
It is important to point out that many officers suggested that all new PTP officers attend
some type of basic PTP training in addition to their probation officer academy training. This
training should cover both the intake process (specifically how to work with the Department of
Correction) and the supervision process. Also, it was suggested that officers have some specific
training in areas such as mental health, social services and motivational interviewing. One
officer suggested that PTP training be informal and conducted by veteran PTP officers.
Caseload Management
The next series of questions dealt with caseload management. When the PTP was
piloted, officers were to have a maximum caseload of 25 and their caseloads were to consist only
of PTP clients. As the program expanded, PTP officers had their caseloads increased to 35
clients and some PTP officers were assigned clients who were not in the PTP. Table 5 presents
officers’ current caseload and Table 6 presents whether those caseloads are mixed. In addition,
Table 6 presents reporting days and days in the field.
Table 5. What is Your Current Caseload?
Amount Category Frequency Percentage
25 or fewer cases 9 39%
26 to 35 cases 9 39%
36 or more cases 5 22%

Evaluation of the Probation Transition Program Central Connecticut State University
15
The majority of interviewed PTP officers had caseloads under 35 (78%). Nine of the
officers reported having caseloads between 26 and 35 clients and nine had caseloads under 25
cases (Table 5). Five PTP officers (22%) had caseloads over 35 cases.
Table 6. Questions Pertaining to PTP Supervision
Item “Yes” Responses Percentage
Is your caseload strictly PTP? 19 83%
Do you have specific reporting days each week? 12 52%
Do you have specific days you are in the field? 9 39%
Also in regards to their caseloads, 19 of the 23 interviewed officers (83%) reported
serving only PTP clients (Table 6). Of these interviewed individuals, 52% stated that they
offered specific reporting days for those clients and 39% indicated that they set aside certain
days for fieldwork.
Of those officers reporting a mixed caseload, the mixture of clients was varied. Two
officers had PTP clients along with high risk clients. One of these officers indicated that the
addition of high risk clients was rare. Another officer indicated that his/her caseload was mixed
with minimum clients. The remaining officer indicated that 70% of his/her caseload contained
active PTP clients while the remaining 30% consisted of former PTP clients that had been
retained by the officer instead of being sent to a regular caseload. Most of the officers did not
think other clients could be assigned to them due to having full caseloads. One officer did
indicate that he/she could be assigned more of the split sentence offenders. None of the officers
reported having difficulty balancing the mixed caseload and most of them believed that they
treated all of their clients the same. Those clients with “immediate needs” were given priority,
regardless of their caseload type.
Technical Resources
The next series of questions centered on technical resources provided to PTP officers
such as state-issued vehicles and cell phones. When the program was originally piloted, these
resources were provided but were decreased due to budgetary issues. Table 7 presents the
responses to the questions pertaining to these resources. Although 96% of the interviewed
officers reported having state-issued cell phones and every officer had access to a state car, only
five individuals (25%) reported that the vehicles they had access to were specifically designated
for the PTP. Furthermore, 15 of the officers (65%) reported instances in which they required
motor vehicle access, but no cars were available.
Tables 8 and 9 present the responses regarding motor vehicles. Table 8 refers to the
number of vehicles available to an officer and Table 9 refers to the number of officers actually
vying for use of a vehicle. The lack of access mentioned in Table 7 may have been due to the
fact that 14 of interviewed individuals (61%) reported sharing one car with multiple probation
officers, while only two PTP officers (9%) reported having their own state vehicles (Table 8).

Evaluation of the Probation Transition Program Central Connecticut State University
16
Table 7. Questions Pertaining to TVU Resources
Item “Yes” Responses Percentage
Do you have to sign up for its use ahead of time? 18 78%
Was available car specifically designated for PTP? 5 25%
Have there been times when the vehicle has not been
available when you needed it? 15 65%
If vehicle not available, did you use your own vehicle
as an alternative? 9 53%
If vehicle not available, did you reschedule your plans? 10 59%
Do you have a state-issued cell phone? 22 96%
Do you provide your cell phone number to your
clients? 19 91%
Table 8. How Many Officers Share a Vehicle?
Amount Category Frequency Percentage
This officer has own car 2 9%
One car for multiple officers 14 61%
Multiple cars for multiple officers 7 30%
When having to share a vehicle, 8 of the interviewed PTP officers (35%) shared a car
with five or fewer probation officers (Table 9). However, 11 (48%) had to share vehicles with
over 10 other probation officers.
Table 9. Number of Officers Vehicle(s) Shared With
Amount Category Frequency Percentage
5 or fewer POs 8 35%
6 to 10 POs 4 17%
11 to 25 POs 6 26%
25 or more POs 5 22%
*Table percentages do not sum to 100% due to rounding.
Table 10 follows up with information provided in Table 7 regarding PTP cell phone
usage. Almost all of the PTP officers gave out their cell phone numbers (96%) with the majority
of officers (59%) saying they received phone calls from clients either frequently or on a daily
basis. Only 5 PTP officers (23% of those interviewed) said that they never or rarely were called
by clients.
Table 10. If You do Provide Clients with the Cell Phone Number, How Often Do They Call?
Amount Category Frequency Percentage
Never 2 9%
Rarely 3 14%
Occasionally 4 18%
Frequently 5 23%
Daily or more often 8 36%

Evaluation of the Probation Transition Program Central Connecticut State University
17
Another follow-up question asked PTP officers the reasons for clients calling them. The
more common responses were to notify the officer of not being able to make appointments, to
reschedule appointments, requests for a curfew extension, changing of residence, issues with
treatment, expressing needs for services, contacts with the police, clients having
difficult/stressful times, and clients having crisis situations.
The last question asked of PTP officers in this series was if they had unlimited resources,
what technical support did they believe would help with their jobs. The responses to this
question varied and fell into three general categories: technical support, client specific support,
and DOC/Parole communication. In terms of technical support, several officers suggested they
be provided with a GPS (Global Positioning System). Along this same line, others suggested
having wireless laptops to conduct video conferences. Several officers requested more ready
access to vehicles. The request for client specific support revolved around residential beds,
housing, tokens, bus passes, and essential programs for drug abuse. In regard to DOC/Parole
communication, the specific resource that was mentioned was voicemail accessibility for
DOC/parole staff. Some officers were concerned that they were to leave messages for DOC or
parole staff.
Client Referrals to the PTP
The last series of questions dealt with client referrals to the PTP. Most officers stated
that clients’ files were simply transferred to them from DOC. Once this happened, PTP officers
reviewed casenotes to determine if clients were appropriate for the PTP. In addition, officers
tended to note clients’ areas of concern, potential triggers, and specific issues that needed to be
addressed upon release from DOC.
Once clients were deemed appropriate for the PTP, meetings were scheduled to visit
clients at correctional facilities. During these initial meetings, risk assessments were completed
and PTP officers discussed clients’ immediate needs. Many officers also met with clients
approximately three days prior to their prison release to review clients’ plans and activities upon
their prison release. In some cases, clients were supervised by someone other than the intake
PTP officer. The supervising officers’ contact information was provided to the client.
Table 11 presents the responses to the questions regarding concerns about the process and
potential stumbling blocks. In regards to the PTP referral process, 39% of the interviewed
officers cited concerns about the current process and 57% reported that stumbling blocks existed
within it.
Table 11. Questions Pertaining to PTP Referrals
Item “Yes” Responses Percentage
Do you have concerns about the current process? 9 39%
Are there any stumbling blocks/hurdles in the referral
process? 13 57%
PTP officers mentioned several concerns with the referral process. Some of these were
time management issues, DOC communication, locating clients upon discharge, and the need for

Evaluation of the Probation Transition Program Central Connecticut State University
18
better screening to assure clients were appropriate for the PTP. With time management, some
officers indicated it was hard to balance the need to do intakes at the correctional facilities and be
able to properly supervise existing PTP clients. One officer thought that splitting the intake and
supervision of clients was a bad idea and a concern for the program.
As has been discussed earlier, communication with the DOC was a concern. Several
officers thought this needed to be improved. In doing so, it would be easier to work with the
DOC and gain access to clients.
Locating clients upon discharge was also a concern that was expressed because some
clients gave false addresses. Once they were released and did not show up to meet their
supervising officer, they were difficult to find.
Lastly, there was a concern regarding about the appropriateness of some clients in the
program. The DOC often recommended all split sentence offenders with no consideration of
their needs. PTP officers believed that many inmates recommended to the PTP should actually
be on regular probation caseloads. Many officers were concerned with the lack of
communication with DOC. These officers believed that better lines of communication needed to
be established with each of the correctional facilities. In addition, it was suggested that regular
meetings should occur with DOC to keep these channels open. Some officers also expressed a
desire to have a more “professional” location to meet with clients at the correctional facility.
One further suggestion involved the possibility of having video conferences with clients at the
correctional facilities when face-to-face meetings were not possible.
Outcome Analysis
The outcome analysis primarily used CMIS data collected for all PTP clients entering the
program between October 1, 2004 and August 31, 2008. These data were used to describe the
clients participating in the PTP, determine the outcomes of these clients, and explore those
factors related to program success. PTP clients were organized into three study groups,
depending on when they entered the program. The first study group was comprised of clients
entering PTP between October 1, 2004 and October 1, 2005 (Pilot Year One). The second study
group entered PTP between October 2, 2005 and January 31, 2007 (Pilot Year Two). Finally, the
third study group began PTP between February 1, 2007 and August 31, 2008 (Expansion). The
purpose of the three study groups was to assess the different phases of the implementation of the
PTP. If CSSD was successful in expanding the PTP model statewide, there would be few
differences in outcomes across the three study groups.
Furthermore, two PTP comparison groups were created to determine the overall effects of
the PTP compared to a similar group of probationers who were on probation prior to the
implementation of the PTP. The first comparison group was comprised of high risk probationers
from the five pilot PTP offices (Bridgeport, Hartford, New Haven, New London, and Waterbury)
while the second comparison group was made up of probationers from the expansion probation
offices. The final part of the outcome analysis provides an assessment of probation outcomes for
the PTP participants and the historical comparison groups.

Evaluation of the Probation Transition Program Central Connecticut State University
19
Study Group Description
Table 12 presents a summary of the three study groups. The vast majority of PTP clients
were males in each of the three study groups (over 90%). There were differences in the
race/ethnicity of clients in the Expansion study group compared to the two pilot groups. For
instance, there were fewer African-Americans, fewer Hispanics, and more Caucasian clients in
the Expansion study group. These differences were expected given that the pilot sites were
located in urban areas with a higher population of minorities than the expansion sites. There
were few differences across the study groups for age, marital status, and education. The only
other difference between the groups was for employment. The Pilot Year One group had a lower
percentage of unemployed clients (63%) than the other two groups (77% for Pilot Year Two and
the Expansion).
Table 13 shows the LSI-R risk levels for the study groups. The LSI-R risk levels were
relatively the same across the three groups. The average LSI-R overall risk score was 29.31 for
the first pilot group, 30.42 for the second year pilot group, and 30.34 for the Expansion group.
The Pilot Year Two study group had the highest percentage of clients at high or surveillance
(93%), followed by the Expansion group (90%) and the Pilot Year One group (87%).
The average LSI-R total risk scores by PTP office are presented in Table 14. There were
few differences across the three study groups for the initial pilot sites. That is, the risk levels of
PTP clients did not appear to significantly change from the first year to the second year of the
pilot, nor from the second year of the pilot to the expansion. For the expansion sites, Bantam
had the highest average LSI-R risk score (33) and Norwalk and Danielson had the lowest
average risk scores (28).

Evaluation of the Probation Transition Program Central Connecticut State University
20
Table 12. Demographic Summary of the Three Study Groups
Pilot Year One
(n=519)
Pilot Year Two
(n=465)
Expansion
(n=1,298)
Males 89% 93%
91%
Race/Ethnicity
African-American 44% 47% 37%
Caucasian 29% 21% 36%
Hispanic 27% 31% 26%
Other .2% 1%
1%
Age
16-20 12% 11% 13%
21-30 41% 40% 39%
31-40 27% 31% 24%
Over 40 20% 18% 24%
Average Age 32 yrs. old 31 yrs. old
32 yrs. old
Marital Status
Married 5% 6% 7%
Single 81% 79% 77%
Divorced/Sep/Widowed 14% 15%
16%
Education
No High School diploma 65% 71% 65%
High School Graduate 24% 20% 24%
More than High School 11% 9%
11%
Employment
Unemployed 63% 77% 77%
Other Income 6% 5% 4%
Employed 31% 18% 19%
Table 13. LSI Risk Level by Study Group
LSI Risk Level Pilot Year One
(n=514)
Pilot Year 2
(n=464)
Expansion
(n=1,297)
Administrative 12 (3%) 11 (3%) 16 (1%)
Medium 50 (10%) 20 (4%) 108 (8%)
High 374 (72%) 373 (80%) 1,133 (87%)
Surveillance 78 (15%) 60 (13%) 40 (3%)
Average LSI Risk Score 29.31 30.42 30.34
Evaluation of the Probation Transition Program Central Connecticut State University
21
Table 14. Average LSI Score by Study Group and Office
Probation Office Pilot Year One Pilot Year
Two
Expansion
Hartford 31 32 32
Waterbury 29 30 31
New Haven 30 31 30
Bridgeport 28 28 30
New London 29 30 29
Bantam 33
Bristol 31
Manchester 31
Middletown 31
Milford 31
New Britain 30
Norwich 30
Stamford 30
Danbury 29
Willimantic 29
Danielson 28
Norwalk 28
TOTAL PTP 29 30 30
PTP Completion Rates
Clients were referred and accepted into the PTP prior to their release from prison. The
purpose of the PTP was to provide a smooth transition from prison release to probation
supervision with PTP clients spending up to 120 days on a PTP caseload before being transferred
to a general probation caseload. Table 15 presents the percentage of clients successfully
discharged from the PTP and transitioned to regular probation. There were different trends in the
pilot sites across the three study groups. First, three offices (New London, Waterbury, and
Bridgeport had higher completion rates during the first year of the program, followed by a
decrease during the second year, and then an increase during the expansion. Second, one office
(New Haven) had a higher completion rate from the first to the second year, followed by a
decrease during the expansion. Third, the Hartford PTP had the same completion rate for the
two pilot years and a decrease during the expansion.
There was some variation in completion rates across the expansion offices. Most of the
offices had a completion rate over 70% (13 of the 17 offices). The other four offices had
completion rates over 50%.

Evaluation of the Probation Transition Program Central Connecticut State University
22
Table 15. PTP Completion Rate by Study Group and Office
Probation Office Pilot Year One Pilot Year
Two
Expansion
New London 75% 72% 79%
Waterbury 79% 57% 75%
Bridgeport 82% 71% 72%
New Haven 75% 77% 71%
Hartford 75% 75% 59%
Norwalk 88%
Stamford 86%
Milford 85%
Danielson 84%
Danbury 83%
Norwich 77%
Bantam 76%
Middletown 75%
Bristol 71%
Manchester 63%
Willimantic 63%
New Britain 56%
TOTAL PTP 78% 71% 72%
Tables 16 and 17 show the average days clients were in the PTP and the average number
of client contacts for PTP offices. Even though the prescribed time in the PTP was 120 days,
only two offices averaged 120 days or less (Danbury and Manchester) while several offices had
averages over 180 days (Hartford, New London, Bridgeport, Bantam, Danielson, Willimantic,
and Norwich). The average number of days in the PTP was well over 120 days for all three
study groups (156 days for Pilot Year One, 172 for Pilot Year Two, and 160 for the Expansion).
There were some differences for the three study groups. The average days in the PTP was
similar for Pilot Year One (156 days) and the Expansion (160 days) but was higher for Pilot Year
Two (172 days).
Table 17 presents the average number of client contacts. Client contacts consisted of
face-to-face meetings between PTP officers and clients, telephone contacts, and contacts with
peripherals (e.g., service providers, family members, employment supervisors, etc.). The
findings of Table 17 were consistent with Table 16, in that, the longer clients were in the PTP the
more contacts they had. Danbury had the lowest average days in the PTP (100 days) and also
had the lowest average number of client contacts (11) while Bantam had the most days in PTP
(269) and the most contacts (46).

Evaluation of the Probation Transition Program Central Connecticut State University
23
Table 16. Average Days in Program by Study Group and Office
Probation Office Pilot Year One Pilot Year
Two
Expansion
Hartford 170 160 187
New London 185 178 184
Bridgeport 160 197 169
New Haven 130 147 140
Waterbury 139 164 129
Bantam 269
Danielson 238
Willimantic 213
Norwich 180
New Britain 174
Bristol 158
Stamford 153
Milford 138
Norwalk 135
Middletown 128
Manchester 104
Danbury 100
TOTAL PTP 156 172 160
Table 17. Average Number of Client Contacts by Study Group and Office
Probation Office Pilot Year One Pilot Year Two Expansion
New London 25 26 32
Bridgeport 17 25 23
New Haven 13 18 20
Waterbury 30 23 20
New Britain 16 18 20
Hartford 5 12 15
Bantam 46
Stamford 32
Norwich 26
Milford 25
Manchester 23
Danielson 20
Willimantic 19
Norwalk 18
Bristol 18
Middletown 17
Danbury 11
TOTAL PTP 16 20 22

Evaluation of the Probation Transition Program Central Connecticut State University
24
Program Outcomes: New Arrests and Technical Violations
The primary outcome of the study was violations of probation that resulted in technical
violations up to one year following PTP clients’ prison release. Table 18 shows that the
percentage of technical violations was almost the same for the Pilot Year One (13%) and the
Expansion (12%) study groups but was higher for Pilot Year Two (19%). In contrast, the
percentage of new arrests and percentage of new arrests and technical violations were relatively
the same for all three study groups.
Table 18. New Arrests and Probation Violations Across Study Groups
Pilot Year One
(n=519)
Pilot Year Two
(n=465)
Expansion
(n=1,298)
VOPs and New Arrests within One Year
New Arrests 76 (15%) 76 (16%) 207 (16%)
Technical Violations 68 (13%) 86 (19%) 150 (12%)
New Arrests and Tech. Violation 46 (9%) 40 (9%) 131 (10%)
Totals 190 (37%) 202 (44%) 488 (38%)
PTP clients were transitioned onto regular probation caseloads if PTP officers believed
they had been successfully re-integrated into their communities. Table 19 presents the one year
outcomes of PTP completers. A small percentage of PTP completers were arrested or
technically violated after being successfully transitioned from PTP. For instance, only 8% of
PTP completers in the Expansion study group were technically violated and 11% were arrested.
These outcomes were similar across the three study groups.
Table 19. New Arrests and Technical Violations for PTP Completers
Pilot Year One Pilot Year Two Expansion
(n=412) (n=329) (n=930)
New Arrests 44 (11%) 39 (12%) 98 (11%)
Technical Violations 18 (4%) 24 (7%) 33 (4%)
New Arrests and Tech. Violation 21 (5%) 11 (3%) 40 (4%)
Totals 83 (20%) 74 (22%) 171 (19%)
Figure 1 shows the time frame for technical violations for each study group. The trends
were similar for the Pilot Year One and the Expansion study groups. For instance, very few (less
than 2%) of these two groups were technically violated in the first month following prison
release and close to 8% were violated after six months. The Pilot Year Two study group had a
much different pattern. A higher percentage of PTP clients were violated after six months
(nearly 14%). After six months, the percentage of technical violations for the Pilot Year Two
study group followed a similar pattern as the other two study groups (about a 5% increase).

Evaluation of the Probation Transition Program Central Connecticut State University
25
Figure 1. Cumulative Monthly Percentage of Technical Violations by Study Group
There was a wide variation in the percentage of the PTP clients who were technically
violated across the Expansion group sites (Table 20). Overall, 12% of PTP clients received
technical violations within one year of prison release. New Britain had the highest technical
violation rate (20%) and three offices had zero technical violations (Bristol, Bantam, and
Stamford). These differences can also be observed by looking at the total percentage of the PTP
clients technically violated or arrested. Approximately 50% of New Britain (51%) and Hartford
(50%) PTP clients were arrested or violated while Danielson (20%) and Milford (27%) had the
lowest.
0%
2%
4%
6%
8%
10%
12%
14%
16%
18%
20%
1 2 3 4 5 6 7 8 9 10 11 12
Pilot Year One Pilot Year Two Expansion

Evaluation of the Probation Transition Program Central Connecticut State University
26
Table 20. One Year Probation Violation Types by Office (Expansion Study Group Only)
Probation Office New
Arrest
Technical
Violation
New Arrest and
Technical Violation
Total
New Britain 15% 20% 16% 51%
Hartford 23% 19% 8% 50%
Norwalk 4% 17% 26% 47%
Manchester 13% 15% 15% 43%
Bristol 24% 0% 19% 43%
Norwich 16% 13% 13% 42%
New Haven 21% 13% 6% 40%
Waterbury 10% 11% 18% 39%
Bridgeport 19% 11% 4% 34%
Middletown 16% 11% 7% 34%
Danbury 16% 9% 7% 32%
New London 10% 9% 13% 32%
Willimantic 17% 13% 0% 30%
Bantam 8% 0% 21% 29%
Stamford 10% 0% 19% 29%
Milford 15% 5% 7% 27%
Danielson 7% 4% 9% 20%
TOTAL PTP 16% 12% 10% 38%
Table 21 presents the number and percentage of the PTP clients receiving new prison
sentences as a result of being arrested and/or technically violated. The overall percentages of
new prison sentences were relatively the same for the Pilot Year One and the Expansion study
groups (around 22%) while the Pilot Year Two study group was much higher (32%). The
difference for the Pilot Year Two study group was attributed to a higher percentage of new
arrests and technical violations that resulted in prison sentences.
Table 21. New Prison Sentences of Study Groups by Type of Probation Violation*
Pilot Year One Pilot Year Two Expansion
New Arrest 47 (9%) 54 (12%) 103 (9%)
Technical Violation 44 (9%) 58 (13%) 64 (6%)
New Arrest and Tech. Viol. 33 (6%) 31 (7%) 73 (6%)
Totals 124 (24% of 508) 156 (32% of 447) 240 (21% of 1,142)
*Total does not include violations that are pending court action
The percentages of PTP clients sentenced to prison as a result of new arrest or technical
violation are presented in Table 22. For all five pilot offices, the percentages of clients receiving
new prison sentences increased from Pilot Year One to Pilot Year Two and then decreased for
the Expansion. Similar to technical violation rates, there were differences across the Expansion
sites in percentages of PTP clients sentenced to prison. Manchester had the highest arrest and
technical violation rate and the highest percentage of PTP clients sentenced to prison (33%)
while Milford (6%) and Danielson (10%) had the lowest percentages.

Evaluation of the Probation Transition Program Central Connecticut State University
27
Table 22. New Prison Sentences Due to One Year Probation Violations by Office
Probation Office Pilot Year One Pilot Year
Two
Expansion
Waterbury 21% 41% 29%
Hartford 31% 35% 27%
New Haven 26% 27% 21%
Bridgeport 24% 27% 19%
New London 25% 31% 19%
Manchester 33%
New Britain 29%
Norwalk 24%
Norwich 22%
Middletown 21%
Willimantic 18%
Stamford 17%
Danbury 16%
Bristol 11%
Bantam 11%
Danielson 10%
Milford 6%
TOTAL PTP 25% 32% 22%
Factors Influencing One Year PTP Outcomes
The next part of the outcome analysis was comprised of identifying differences between
PTP participants who were arrested or technically violated one year after starting the PTP. Table
23 shows these rates for gender, race/ethnicity, age, marital status, employment, and education.
There were statistically significant differences in the arrest rates for all of the demographic
factors. Males were much more likely to be arrested than females (26% to 15%) and African-
Americans were the most likely racial/ethnic group to be arrested (33%). The younger the PTP
client, the higher likelihood of an arrest (44% of probationers under 21 were arrested compared
to 14% of those over 40 years old). Single probationers also had a higher arrest rate than those
who were married or had been married. Also, PTP clients who were unemployed and did not
have a high school diploma also had a higher likelihood of being arrested one year following
their PTP entry.

Evaluation of the Probation Transition Program Central Connecticut State University
28
Table 23. Demographic Factors with New Arrests and Technical Violations
New Arrest Technical Violation
Gender*
Males (n=2,077) 26% 14%
Females (n=205) 15% 12%
Race/Ethnicity*
Caucasian (n=714) 17% 12%
African-American (n=928) 33% 13%
Hispanic (n=619) 24% 16%
Other (n=15) 20% 0%
Age at PTP Start*
Under 21 Years Old (n=277) 44% 11%
21 thru 30 Years Old (n=909) 29% 13%
31 thru 40 Years Old (n=599) 21% 16%
Over 40 Years Old (n=497) 14% 12%
Marital Status**
Single, never married (n=1,778) 29% 14%
Divorced/Widowed/Separated (n=350) 11% 9%
Married (n=147) 18% 18%
Employment**
Full-Time (n=363) 13% 6%
Part-Time (n=126) 23% 6%
Other Income (n=106) 19% 10%
Unemployed (n=1,680) 29% 16%
Education**
No H.S. Diploma (n=1,501) 28% 15%
High School Diploma (n=533) 23% 11%
More than H.S. Diploma (n=241) 16% 8%
*Differences in arrest categories were statistically significant at p.<.05
**Differences in arrest and technical violation categories were statistically significant at p.<.05
Only marital status, employment, and education produced differences in technical
violation rates (Table 23). Clients with the lowest likelihood of being violated were
divorced/widowed/separated (9%) compared to single (14%) or married (18%) clients. Similar
to arrests, unemployed clients and clients without high school diplomas were the most likely to
be technically violated.
While Table 23 points out individual differences in arrest and technical violation rates
across for a variety of demographic factors, it is not possible to determine which factors had the
most effect. To compare the effects across all of the variables, we used multinomial logistic
regression analysis. This statistical technique looks at the relative contribution of many variables

Evaluation of the Probation Transition Program Central Connecticut State University
29
in explaining arrests and technical violations. For this analysis, we used age, prior arrests,
gender, marital status, employment, and the LSI-R subscales (criminal history,
education/employment, financial, family, accommodations, leisure, companions, alcohol/drug,
emotional, and attitude/orientation).
The multinomial regression tells us which factors significantly affect whether PTP clients
were arrested or technically violated and the importance of each (Table 24). PTP participants
arrested one year after their PTP start were younger, unemployed had prior arrests, a high LSI-R
companions score, males, and had high LSI-R risk scores for criminal history, orientation
(attitude), leisure, and alcohol/drugs. Taken together, these results show that PTP clients more
likely to be arrested were young males with a deviant peer group who had already been arrested
multiple times. These clients also were unemployed, had poor attitudes along with alcohol
and/or drug use, and had a significant amount of unoccupied leisure time.
PTP clients most likely to be technically violated one year after entering the PTP were
slightly different (Table 24). These clients were unemployed, had prior arrests, high LSI-R
drug/alcohol risk scores, were younger, and had higher LSI-R accommodations and companions
risk scores. While unemployment and prior arrests were the most influential factors for technical
violations, these clients appeared different than those that were arrested because their
drug/alcohol problems were more prevalent along with unstable housing and a deviant peer
group.

Evaluation of the Probation Transition Program Central Connecticut State University
30
Table 24. Multinomial Regression For New Arrests and Technical Violations
Beta Stand.
Error Wald Sign. Odds
Ratio New Arrest Intercept -1.192 .683 3.047 .081
Age -.064 .008 71.382 .000 .938 Employment -.325 .057 32.275 .000 .723 Prior Arrests .040 .009 20.750 .000 1.040 LSI Companions .196 .059 11.225 .001 1.217 Males .557 .225 6.162 .013 1.746 LSI Criminal History .081 .035 5.321 .021 1.084 LSI Orientation .095 .046 4.312 .038 1.100 LSI Leisure .175 .086 4.167 .041 1.192 LSI Alcohol/Drug .048 .024 4.028 .045 1.049 Married -.194 .112 3.018 .082 .823 LSI Accommodations .076 .059 1.687 .194 1.079 Education -.094 .094 1.000 .317 .910 LSI Emotional -.030 .039 .575 .448 .971 LSI Financial -.048 .083 .334 .563 .953 LSI Employment/Education -.019 .035 .300 .584 .981 LSI Family -.022 .051 .186 .666 .978
Technical
Violation Intercept -3.078 .839 13.459 .000
Employment -.365 .079 21.346 .000 .694 Prior Arrests .044 .010 20.637 .000 1.046 LSI Alcohol/Drug .137 .030 20.384 .000 1.147 Age -.029 .009 11.692 .001 .971 LSI Accommodations .152 .073 4.349 .037 1.164 LSI Companions .155 .074 4.338 .037 1.167 Education -.238 .123 3.770 .052 .788 LSI Leisure .168 .110 2.362 .124 1.183 LSI Employment/Education .062 .047 1.743 .187 1.064 LSI Criminal History .058 .045 1.643 .200 1.060 Males .291 .250 1.358 .244 1.338 LSI Family -.036 .063 .323 .570 .965 LSI Emotional .022 .047 .222 .637 1.022 LSI Financial -.014 .107 .016 .898 .986 LSI Orientation -.004 .058 .005 .944 .996 Married -.008 .123 .005 .945 .992
Model Chi-Square = 361.10, p.<.05.
Cox and Snell R2=.15, Nagelkerke R
2=.18
Comparison Group Analysis
The final set of analyses compared the one year probation outcomes of PTP clients to
similar groups of probationers who did not participate in the PTP. This analysis used two
separate comparison groups of probations; one for the pilot PTP offices (Bridgeport, Hartford,
New Haven, New London, and Waterbury) and one for the statewide expansion offices. These
groups were referred to as historical comparison groups because both groups consisted of
individuals on probation prior to the implementation of the PTP.

Evaluation of the Probation Transition Program Central Connecticut State University
31
Creation of historical comparison groups. The Pilot Comparison Group was created by
taking all probation cases that were closed during the months of June, July, and August of 2004
for courts that had the PTP. These cases had been closed because clients successfully completed
their probation sentence or had their probation terminated or revoked due to new arrests or
technical violations. This type of group was utilized because it created a random selection of
split sentenced offenders from the five PTP offices and provided complete outcome data for split
sentenced probationers prior to the implementation of the PTP. To create this group, a list of
probation cases that were closed during June, July, and August of 2004 was obtained from the
CSSD’s CMIS database. Next, client demographic data, risk scores (LSI-R and ASUS), charge
data (charges and severity), and criminal history data were collected from CMIS. Rearrest data
were also collected on this group from the Judicial Branches’ CRMVS database. Finally, we
reviewed hard copy files for those probationers who were violated in order to obtain the specific
reason for the probation violation. This group consisted of 134 high risk probationers across the
five PTP pilot offices and closely resembled PTP clients from the Pilot Year One study group.
The biggest difference between these two groups was unemployment, with the PTP Pilot Year
One group having a higher percentage of probationers unemployed (see our August 2006 report
titled “Addendum to the Final Report of the Court Support Services Division’s Probation
Transition Program and Technical Violations Unit” for a complete description of the Pilot
Comparison Group). While the average total LSI risk scores indicated that both groups were
high risk, the Pilot Year One study group had a higher risk score (29.25) than the Pilot
Comparison Group (25.53).
Although the Pilot Comparison Group closely resembled the Pilot Year One study group
it was significantly different than the Pilot Year Two and pilot offices’ expansion study groups
(See Appendix C summary tables). The Pilot Comparison Group had a higher percentage of
married clients than the PTP Pilot Sample (11% to 6%) and a lower percentage of unemployed
clients (67% to 77%). The primary differences between these groups were in LSI-R risk scores.
The Pilot Comparison Group was had lower risk scores for all of the LSI-R risk scores except
Alcohol/Drug Leisure. The average total LSI-R score was much higher for the PTP Pilot Sample
(30.14) than the Pilot Comparison Group (25.54).
While the Pilot Comparison Group provided a source to compare to the PTP pilot offices,
we also needed a group to compare with the statewide expansion offices. Substantial
developments in CMIS since 2004 allowed us to select a similar group of probationers who
began their probation sentence prior to the statewide implementation of the PTP. In addition,
CSSD’s Center for Research, Program Analysis and Quality Improvement had been conducting
an in-house recidivism study of all probationers and created a data file consisting of all offenders
who began their probation sentences between 2004 and 2005. This dataset contained almost all
of the information we had collected for the PTP pilot study groups and the Pilot Comparison
Group. We were given data for all probationers starting probation in the 2005 calendar year.
From this group, we selected split sentenced probationers from the expansion offices
(probationers from the five pilot offices were not included). We intended to use propensity score
matching to create a one-to-one comparison group match for each PTP participant, however,
CSSD made a major change in how LSI-R total risk scores that defined probation officer
supervision levels in the middle of the evaluation. This change did not allow us to use
propensity score matching techniques. As an alternative, we had to select a sample of PTP

Evaluation of the Probation Transition Program Central Connecticut State University
32
expansion clients and probationers in these offices prior to the PTP that had been supervised at
the same risk level. The one similarity was that probationers with a LSI-R total risk score over
28 were classified as high risk and supervised with the same contact standards prior to and after
the PTP expansion. Therefore, we selected only those PTP and nonPTP probationers who scored
over 28 and were supervised as high risk clients. We also stratified these groups by office,
race/ethnicity, gender, and age to obtain the closest matched groups as possible.
This process resulted in a PTP Expansion Sample with 305 PTP participants and an
Expansion Comparison group with 377 nonPTP probationers. These groups were then compared
across demographic information (e.g., gender, race/ethnicity, age, marital status, education, and
employment) and LSI-R risk scores (See Appendix C for the tables containing these
comparisons). Across all of these data, there were three differences between the two groups.
The Expansion Comparison Group had a higher percentage of married clients (13%) than the
PTP Expansion Sample (8%) and also a lower percentage of clients without high school
diplomas (51% to 62%). Additionally, the PTP Expansion Sample had a higher LSI-R criminal
history risk score (6.82 to 6.41).
We would have preferred the Pilot Comparison Group to have more closely resembled
the Pilot Year Two and the Expansion Pilot office clients in order to make more direct
comparisons of program effectiveness. However, the differences between the study groups in
the pilot offices led us to believe that PTP officers in the second program year and the expansion
were selecting more serious offenders than in the initial pilot. Also, because the Pilot
Comparison was lower risk, we would expect the percentage of new arrests and technical
violations to be lower for this group than the PTP program groups.
One year probation outcomes. The primary purpose of creating comparison groups was
to use them to determine the effects of the PTP on new arrests and technical violations. Since
the PTP was implemented to decrease technical violations along with reducing the number of
technical violators being sentenced to prison, we expected the biggest differences between the
PTP and comparison groups to be for technical violations. For a period of one year after
probationers’ start of the PTP or regular probation supervision (for the comparison groups), the
percentage of PTP clients who received technical violations was statistically significantly lower
than the comparison group for both the pilot and expansion offices (Table 25). That is, 26% of
the Pilot Comparison Group compared to 14% of% the PTP Pilot Office Sample were technically
violated one year after their start of probation. The difference was smaller between the PTP
Expansion Sample (11%) and the Expansion Comparison Group (16%) but was still statistically
significant. There were no differences for new arrests for the pilot offices or the statewide
expansion offices.

Evaluation of the Probation Transition Program Central Connecticut State University
33
Table 25. New Arrests and Technical Violations Across Study Groups
Number New
Arrests
Technical
Violations*
Total
PTP Pilot Office Sample 1,792 451 (25%) 258 (14%) 709 (39%)
Pilot Comparison Group 134 35 (26%) 35 (26%) 70 (52%)
PTP Expansion Sample 305 84 (28%) 33 (11%) 117 (39%)
Expansion Comparison Group 377 113 (30%) 62 (16%) 165 (46%)
Note: Chi Square tests for the pilot and expansion were statistically significant at p. <.05
These differences were also present for new prison sentences (Table 26). A statistically
higher percentage of probationers in the Pilot Comparison Group (23%) were sentenced to prison
for technical violations than the PTP Pilot Office Sample (8%). Similarly, a higher percentage of
the Expansion Comparison Group (11%) was sentenced to prison as a result of technical
violations than the PTP Expansion Sample (5%). There were no differences in new prison
sentences resulting from arrests for the PTP Pilot Office Sample and the Pilot Comparison
Group. However, the Expansion Comparison Group also had a higher percentage of
probationers sentenced to prison for new arrests (20%) than the PTP Expansion Sample (13%).
Table 26. New Prison Sentences Across Study Groups
Number New
Arrests
Technical
Violations*
Total
PTP Pilot Office Sample 1,792 278 (16%) 147 (8%) 425 (24%)
Pilot Comparison Group 134 19 (14%) 30 (23%) 49 (37%)
PTP Expansion Sample 305 36 (13%) 16 (5%) 57 (19%)
Expansion Comparison Group 377 76 (20%) 43 (11%) 119 (32%)
* Chi Square tests for the pilot and expansion were statistically significant at p. <.05
Effects of the PTP on new arrests and technical violations. Multinomial logistic
regression was used to determine the actual effects of PTP participation (Tables 27 and 28). The
overall results mirror Table 25, in that, PTP had no effects on new arrests but did have an effect
on technical violations for the pilot offices and the statewide expansion offices. The odds ratio
was used in this analysis for determining the actual effects of the PTP. For the pilot offices, the
odds ratio of 0.436 indicates that PTP clients were 2.29 times less likely to be technically
violated than the comparison group. In the statewide expansion offices, the odds ratio of 0.572
shows that PTP clients in these offices were 1.7 times less likely to be technically violated.
Table 27. PTP Effects on New Arrests and Technical Violations for Pilot Offices
B Std. Error Sig. Odds Ratio
New Arrests Intercept -.604 .210 .004
PTP Clients -.272 .218 .210 .761
Technical Violations Intercept -.604 .210 .004
PTP Clients -.831 .221 .000 .436
Chi-Square=13.04, df=2, p.<.05

Evaluation of the Probation Transition Program Central Connecticut State University
34
Table 28. PTP Effects on New Arrests and Technical Violations for Expansion
Offices
B Std. Error Sig. Odds Ratio
New Arrests Intercept -.581 .117 .000
PTP Clients -.225 .176 .202 .799
Technical Violations Intercept -1.181 .145 .000
PTP Clients -.559 .238 .019 .572
Chi-Square=6.17, df=2, p.<.05
Summary of the Outcome Analysis
The collection of CMIS data allowed us to observe the demographics of PTP clients (e.g.,
age, gender, race/ethnicity, employment, and education), determine outcomes of PTP
participants (e.g., successful discharges from the PTP, rates of new arrests and technical
violations one year after beginning PTP supervision, and rates of new prison sentences from new
arrests and technical violations), identify factors that may have effected new arrests and technical
violations (e.g., demographics, criminal history, and LSI-R risk scores), and compare the
outcomes of PTP clients to similar groups of probationers who did not participate in the PTP.
Demographics. There were few differences in demographic information across the three
study groups. The majority of PTP clients were males (nearly 80%), were single and never
married (approximately 80%), were mostly under 30 years old (close to 52%), were largely
unemployed (around 75%), and did not have a high school diploma (approximately 65%). The
one demographic difference across the three study groups was for race/ethnicity. A higher
percentage of the first and second pilot groups were either African-American (45%) or Hispanic
(28%) than in the expansion study group (37% were African-American and 26% were Hispanic).
These differences were expected since the five probation offices in the PTP pilot were located in
urban areas with a higher percentage of African-American and Hispanic residents.
We also looked at LSI-R risk scores for each study group and across all of the statewide
expansion probation offices. There were very little differences across the three study groups in
LSI-R total risk score. The average LSI-R total risk score was close to 30.00 for all three groups,
indicating that these groups were high risk. In addition, the LSI-R total risk scores were fairly
similar across the statewide expansion offices (the range was 28 to 32).
PTP completion. The outcome analysis looked at PTP completion rates, new arrests and
technical violations one year after clients’ start of PTP, and compared these outcomes to two
groups of similar probationers who did not participate in the PTP. We found that the PTP
completion rates were very high and fairly consistent across the three study groups and across
the expansion offices. For instance, the completion rates increased in the four of the five pilot
offices from the first year to the expansion year (Hartford was the only office with a significant
decrease). We also found that most PTP expansion offices had high completion rates (between
71% and 88%) with the exceptions being New Britain (56%), Willimantic (63%), and
Manchester (63%). These results suggest that PTP implementation was mostly consistent across
study groups and expansion offices. One concern was with the days in PTP. Three offices had

Evaluation of the Probation Transition Program Central Connecticut State University
35
well over the prescribed 120 days (Bantam averaged 269 days, Danielson averaged 238 days,
and Willimantic averaged 213 days).
Technical violations and new arrests. Similar to program completion, we looked at the
percentage of PTP cases ending in technical violations and new arrests across the three study
groups for the five PTP pilot offices and also across all of the statewide expansion offices. For
the pilot offices, the percentage of clients with new arrests was almost the same for the three
study groups (24% for Pilot Year One, 25% for Pilot Year Two, and 26% for the Expansion pilot
offices) while there were variations in the percentages of technical violations. The percentage of
clients technically violated increased from the Pilot Year One group to the Pilot Year Two group
(13% to 19%) but decreased from Pilot Year Two to the Expansion (19% to 12%). We were
unable to determine exactly why Pilot Year Two was so different but we believe it had to do with
staff turnover in the pilot offices between the first two years of the PTP. CSSD also placed a
significant emphasis on PTP during the Expansion and we believe this resulted in better
implementation of the program model. Overall, four of the five pilot offices had decreases in the
percentage of PTP technical violations from the Year One Study group to the Expansion (with
the exception of Waterbury). The statewide expansion offices had wide variations in technical
violation rates (it ranged from 6% in Milford to 33% in Manchester)(The Manchester PTP office
also had one of the lowest PTP completion rates).
An analysis of those client factors related to new arrests and technical violations found
the following factors related to new arrests (in order of importance): age (the younger the
probationer the more likely of an arrest), unemployment, negative peer groups, males, criminal
history, poor attitudes about the criminal justice system, poor leisure activities, and alcohol/drug
use. In contrast, those PTP clients more likely to receive technical violations: were unemployed,
had prior arrests, alcohol/drug use, were younger, had unstable housing, and a negative peer
group. While unemployment and prior arrests were the most influential factors for technical
violations, these clients appeared different than those that were arrested because their
drug/alcohol problems were more prevalent along with unstable housing and a deviant peer
group.
Comparison group analysis. The final aspect of the outcome analysis compared the
results of the PTP to two historical comparison groups made up of similar probationers to PTP
clients. Probationers in the historical comparison groups were on probation prior to the
implementation of the PTP and would likely have been selected to participate. One historical
comparison group was created for the five pilot offices and the second was created with
probationers from the statewide expansion offices. The statewide expansion comparison group
was very similar to the expansion office PTP clients across demographic information and LSI-R
risk scores. However, the pilot comparison group was created to match the Year One Study
group and was a lower risk group than the Year Two and Pilot Expansion study groups.
The analysis of new arrests and technical violations found that both historical comparison
groups had statistically higher technical violation rates than PTP clients. This technical violation
rate was much higher for the Pilot Comparison group (26%) than the pilot PTP offices (14%)
even though this group had much lower risk scores. The differences between PTP clients in the
statewide expansion offices and the Expansion Comparison group were smaller (11% to 16%)

Evaluation of the Probation Transition Program Central Connecticut State University
36
but were still statistically significant. There were no differences in the percentage of clients who
were arrested across the four study groups.
We had similar findings when looking at new prison sentences. Both historical
comparison groups had higher percentages of probationers sentenced to prison for technical
violations than PTP participants. While the pilot comparison group had the highest percentage
(23% to 8% for the PTP Pilot Sample), the Expansion Comparison group was also statistically
higher than the Expansion Sample (11% to 5%). The Expansion Comparison group also had a
higher percentage of probationers sentenced to prison for new arrests (20%) than the PTP
Expansion Sample (13%).
The use of odds ratios allowed us to calculate the likelihood of PTP and comparison
clients to get arrested or technically violated. This analysis found no differences in the
likelihood of being arrested between PTP and comparison group clients. However, for technical
violations, comparison group clients in the PTP pilot offices were more than twice as likely to be
technically violated than PTP clients. In the statewide expansion offices, comparison group
clients were almost twice as likely to be violated as PTP clients.

Evaluation of the Probation Transition Program Central Connecticut State University
37
EVALUATION CONCLUSIONS AND RECOMMENDATIONS
CSSD began accepting probationers into the Probation Transition Program on October 1,
2004 in five probation offices (Bridgeport, Hartford, New Haven, New London, and Waterbury).
PTP was meant to help split sentenced probationers as they were leaving prison and beginning
their probation sentence. PTP officers met with probationers while they were still in prison and
conducted assessments, developed case plans, and started setting up needs-based services. PTP
officers were assigned lower caseloads (25 clients), technical resources (cell phones, laptop
computers, and motor vehicles), and preference for client services (e.g., residential substance
abuse, mental health treatment, etc.) to be able to spend more time working with troubled clients
and better address their criminogenic needs than probation officers with regular caseloads.
CCSU was contracted to evaluate the pilot PTP program. The overall conclusion of our
one year effectiveness assessment of the pilot PTP program was that PTP was successful in
contributing to the overall CSSD goal of the number of probationers who are resentenced to
prison as a result of technical violations by 20% and we recommended statewide expansion of
the PTP.
Legislative funding to the Judicial Branch to hire more probation officers led to the
statewide expansion of the PTP in February of 2007. However, funding shortages forced CSSD
to increase caseload sizes to 35 PTP clients per officer, access to technical resources was limited
(PTP officers no longer had laptop computers and did not have designated motor vehicles), and
PTP clients did not have immediate access to treatment or other services.
Conclusions
The process and outcome components of the PTP evaluation produced four distinct
conclusions. First, PTP was widely implemented in a manner consistent with the program
model. We found few differences in the demographics and risk scores of PTP clients across the
three study groups in the pilot offices and across the statewide expansion offices. These findings
suggest the selection criteria were being applied consistently across offices. There was also a
high amount of consistency in the program completion rate (over 70% of clients were
successfully transitioned into a regular caseload) across the expansion offices. The consistent
program implementation resulted in similar outcomes across PTP offices. With the exception of
a few of offices, the percentages of PTP clients technically violated were similar across the pilot
and expansion offices.
We do note two areas of concern for PTP implementation. One, several PTP officers
mentioned that they had difficulties trying to meet with PTP clients in Department of Correction
facilities and attributed this to lack of communication with DOC staff. This lack of
communication most often occurred between correctional counselors and PTP officers. It was
suggested that correctional counselors always contact PTP officers both prior to release and upon
release. Another concern expressed by PTP officers was that some DOC facilities were very
accommodating while others were not. Unnecessary hurdles existed at some DOC facilities that
made it extremely difficult for PTP officers to meet with the clients. Some PTP officers felt that

Evaluation of the Probation Transition Program Central Connecticut State University
38
the process of going into the institutions was very unorganized and caused significant delays.
Most of these comments were attributed to the lack of communication with DOC staff.
Two, PTP officers mentioned a lack of PTP-specific training. Newer PTP officers felt
they were somewhat unprepared when first starting the PTP due to a lack of formal training. We
mentioned this concern in an earlier progress report and know that each region has been trying to
address this need on an individual basis. However, it remained a problem that was mentioned
repeatedly in our interviews of PTP officers.
Our second overall conclusion was that the PTP appeared to be targeting the highest risk
offenders. CSSD policy dictated that PTP officers give priority to split-sentenced probationers
with (1) insufficient familial and/or peer support; (2) lack of housing; (3) extensive criminal
history; (4) extensive drug abuse; (5) history of mental health problems; (6) lack of employment;
and, (7) total risk score on the LSI-R. The majority of PTP participants were single/never
married and unemployed with high LSI-R total risk scores. In fact, PTP participants in the
expansion groups had much higher LSI-R total risk and subscale scores than PTP participants in
the pilot study.
Third, split-sentenced probationers in the PTP had statistically lower technical violation
rates and were statistically less likely to be sentenced to prison for technical violations than
similar groups of probationers. Specifically, comparison group probations were much more
likely to be technically violated than PTP clients in the pilot offices (more than twice as likely)
and the statewide expansion offices (almost twice as likely). Our first evaluation of the pilot
PTP program concluded that PTP reduced the technical violation rates of split-sentenced
probationers and also reduced the number of split-sentenced probationers who were resentenced
to prison for technical violations. The evaluation of the statewide expansion found that PTP still
produced lower technical violation rates in the five pilot offices and also in the statewide
expansion probation offices.
The lower technical violation rates explained why fewer PTP clients were sentenced to
prison for technical violation rates. However, we also found that nonPTP clients were more
likely to be sentenced to prison for new arrests (although the new arrest rate was similar for PTP
clients). We offer two possible explanations for these differences. One, several probation
officers mentioned they had acted as advocates for their clients during their court appearances.
That is, the probation officers believed their clients had been making significant progress before
being arrested and asked the court to take this into consideration. If this did occur, it may
explain why judges were more likely to sentence PTP clients to prison for new arrests at a lower
rate as the comparison group. Second, it is important to point out that differences in court
actions for new arrests may simply reflect changes in the sentencing philosophy of sentencing
judges. The PTP comparison group reflected court decisions regarding probation violators prior
to the implementation of the PTP. Since the implementation of the PTP, there were changes in
judges in each of the PTP courts and there was more statewide attention to decreasing the prison
population. It was highly likely these two issues had an effect on decreasing the number of
probationers being sentenced to prison for new arrests.

Evaluation of the Probation Transition Program Central Connecticut State University
39
The final conclusion of this evaluation concerns the exploration of factors associated with
arrests and technical violations. There were differences in those PTP clients arrested versus
those who were technically violated. PTP clients who were arrested resembled the demographic
most likely to be arrested in general: young males with prior criminal records who were
unemployed, used drugs and/or alcohol, and had a peer group who likely encouraged their
criminal behavior. In contrast, PTP clients most likely to receive technical violations had several
risk factors associated with instability. They were unemployed, had unstable housing, used
alcohol or drugs, and had a negative peer group (they were also younger probationers with
criminal histories).
Overall Conclusion and Recommendations
Our overall conclusion was the PTP was effective in reducing technical violations and
new prison sentences from technical violations. The PTP was implemented consistently in the
pilot offices and the statewide expansion offices while targeting high risk probationers. We do,
however, offer the following recommendations to improve the delivery of the PTP:
More PTP specific training for PTP officers that includes a detailed presentation of
the PTP purpose and model. This training should occur prior to probation officers’
entry into the PTP and follow-up training should be conducted with all PTP officers.
PTP training and discussions should include all line supervisors.
Develop better and more consistent communication methods with the Department of
Correction. Throughout the pilot and expansion evaluations we found that PTP
officers were having problems meeting clients in the prisons. We know that CSSD
has met with DOC to work through many of these issues but it appeared that not all of
the problems had been resolved. We suggest CSSD administrative staff meet with
PTP officers to discuss existing problems and concerns and then meet with DOC staff
to better address them.
Identify and develop more skills-based and employment services for PTP clients.
Unemployment was a major factor for PTP participants who were arrested and
technically violated. The first step in this process would be to identify nonprofit
agencies that offer employment services and contract or partner with them to provide
gainful employment opportunities.
While it was not part of our evaluation, it is important to acknowledge the progress CSSD
has made in automating its case management system (CMIS) and also enhancing its internal
ability to conduct research. One aspect of CSSD’s 2004 report to the General Assembly
included the creation of a component involving research and evaluation. CSSD did establish the
Center for Research, Program Analysis and Quality Improvement. Since its inception, this unit
has greatly furthered CSSD’s ability to conduct evidence-based practices by disseminating
probationer information and assessments to probation supervisors and program staff, conducting
internal research and evaluation of its programs, and supporting external research and evaluation
initiatives.

Evaluation of the Probation Transition Program Central Connecticut State University
40
APPENDIX A – CSSD’S PTP POLICY

Evaluation of the Probation Transition Program Central Connecticut State University
41

Evaluation of the Probation Transition Program Central Connecticut State University
42

Evaluation of the Probation Transition Program Central Connecticut State University
43

Evaluation of the Probation Transition Program Central Connecticut State University
44

Evaluation of the Probation Transition Program Central Connecticut State University
45

Evaluation of the Probation Transition Program Central Connecticut State University
46

Evaluation of the Probation Transition Program Central Connecticut State University
47

Evaluation of the Probation Transition Program Central Connecticut State University
48
Evaluation of the Probation Transition Program Central Connecticut State University
49

Evaluation of the Probation Transition Program Central Connecticut State University
50

Evaluation of the Probation Transition Program Central Connecticut State University
51

Evaluation of the Probation Transition Program Central Connecticut State University
52
APPENDIX B – PROBATION OFFICER INTERVIEW INSTRUMENT
PTP/TVU Probation Officer Telephone Interview Consent Statement
Directions: Read to each probation officer at the beginning of the telephone call.
My name is ___________________ and I’m calling on behalf of the Department of Criminology
and Criminal Justice at Central Connecticut State University. As you may know, we have been
contracted by CSSD to evaluate the Probation Transition Program and Technical Violations
Units. As part of this evaluation, we would like to ask you questions about your role in these
programs. The questions will fall into five (5) categories. These categories are: Background
and Training; Caseload Management; Technical Resources; Client Referrals to PTP or TVU; and
Program Referrals from PTP/TVU. CSSD is very interested in the implementation of these
programs, therefore, your responses may directly benefit you and other probation officers by
leading to changes in how PTP or TVU are operated.
This interview should take between 45 minutes and 1 hour. Your participation in this study is
entirely voluntary. Such refusal will not have any negative consequences for you. If you begin
to participate in the research, you may at any time, for any reason, discontinue your participation
without any negative consequences.
Any and all information you provide will be confidential. You will not be identified individually
in any way as a result in your participation in this research. Your responses will be summarized
along with responses from other probation officers participating in our study and you will not be
directly quoted.
Please feel free to ask any questions about anything that seems unclear to you. If you have
questions after the interview, please feel free to call me at ----------- or Dr. Stephen Cox at 860-
832-3138.
Do you wish to participate in this interview?
Directions: if yes, go ahead with the telephone interview, if no, thank the for person for
their time.

Evaluation of the Probation Transition Program Central Connecticut State University
53
Probation Transition Program and Technical Violations Unit
Telephone Interview Questions
Background Questions and Training
1) How long have you been a PO?
2) How long have you been a PTP/TVU Officer
3) Did you volunteer for PTP/ TVU, were you assigned the position, or were you hired
specifically for the position?
4) Did you receive any PTP or TVU specific training? If so, what?
5) Have you gone to any PTP/TVU specific meetings with other officers outside of your
office/region? If so, when and for what purpose.
6) Did you have a mentor within your office that you could go to in regard to being a
PTP/TVU officer? If so, who was that person and what advice were you seeking?
7) What type of training/assistance would you like to see implemented for PTP/TVU?
Caseload Management Questions
8) What is your current caseload?
9) Is your case load strictly PTP or TVU?
10) If you have a mixed caseload, how is it mixed?
11) If you have a mixed load, how are you balancing the two?
12) If you have a mixed load, are there other probationers who could possibly be on your
PTP/TVU caseload?
13) Do you have specific reporting days each week? What are they?
14) Do you have specific days you are in the field/or go to the DOC’s? What are they?
Technical Resources
15) When doing field work, do you have access to a state car?
16) Do you have to sign up for its use ahead of time?
Evaluation of the Probation Transition Program Central Connecticut State University
54
17) How many other officers are you sharing it with?
18) Have there been times when the vehicle has not been available when you needed it?
19) If your response to question 18 is in the affirmative, did you use your own vehicle as
an alternative or did you reschedule your plans?
20) Do you have a state issued cell phone?
21) When into your tenure as a PTP/TVU officer did you receive a cell phone?
22) Do you provide your cell phone number to your clients? Why/why not?
23) If you do provide your clients with the cell phone number, how often do they call
you on it?
24) What reasons are clients calling you on your cell phone?
25) In a perfect world with unlimited resources, what technical support do you believe
would help you with your job?
Client Referrals to PTP/TVU
26) When a client is referred to you, is there a face to face meeting between you and the
referring officer or is the person just transferred to you? If so, what is discussed?
27) If there is no discussion between you and the referring officer, please describe the
process of how a client is assigned to you.
28) Do you have any concerns regarding the current process?
29) How would you improve this process?
30) Are there any stumbling blocks/hurdles in the referral process? If so, what are they?

Evaluation of the Probation Transition Program Central Connecticut State University
55
APPENDIX C – PTP AND COMPARISON GROUP DEMOGRAPHICS AND LSI-R SCORES
Demographic Summary of the PTP and Comparison Groups
PTP Pilot
Office
Sample
Pilot
Comparison
Group
PTP
Expansion
Sample
Expansion
Comparison
Group
(n=1,792) (n=134) (n=305) (n=377)
Males 91% 89% 91% 88%
Race/Ethnicity
African-American 46% 45% 21% 24%
Caucasian 24% 25% 59% 58%
Hispanic 29% 30% 19% 18%
Other 0.4% 1% 1% 0.3%
Age
16-20 12% 15% 12% 9%
21-30 40% 36% 38% 37%
31-40 27% 25% 25% 28%
Over 40 21% 24% 25% 26%
Average Age 32 yrs. old 31 yrs. old 33 yrs. old 33 yrs. old
Marital Status*
Married 6% 11% 8% 13%
Single 80% 78% 72% 75%
Divorced/Sep/Widowed 14% 11% 21% 12%
Education*
No High School diploma 68% 70% 62% 51%
High School Graduate 22% 20% 27% 41%
More than High School 10% 10% 11% 8%
Employment*
Unemployed 77% 67% 70% 75%
Other Income 4% 8% 7% 5%
Part-Time 14% 23% 8% 6%
Full-Time 31% 18% 16% 14%
*The differences were statistically significant at p.<.05

Evaluation of the Probation Transition Program Central Connecticut State University
56
LSI-R Risk Scores for PTP and Comparison Groups
PTP Pilot
Office
Sample
Pilot
Comparison
Group
PTP
Expansion
Sample
Expansion
Comparison
Group
(n=1,792) (n=134) (n=305) (n=377)
Criminal History 6.57* 6.13 6.82* 6.41
Employment/Education 6.80* 5.90 6.99 7.03
Financial 1.40* 0.97 1.54 1.47
Family 1.95* 1.49 2.47 2.51
Accommodations 1.42* 0.93 1.24 1.25
Leisure 1.56 1.60 1.79 1.78
Companions 3.43* 2.84 3.46 3.40
Alcohol/Drug 3.83 3.48 5.38 5.55
Emotional 1.43* 0.99 2.21 2.29
Orientation 1.70* 1.22 1.83 1.88
Total Score 30.14* 25.54 33.73 33.57
*Averages were statistically different at p.<.05