Embed Size (px)
Citation preview

First Quarter 2014 Financial Results and Business OutlookMarch 25, 2014 First Quarter 2014 Financial Results and Business OutlookMarch 25, 2014
The following slides accompany a March 25, 2014 presentation to investment analysts. This information should be read in conjunction with the press release issued on that date.
The Flavor of TogetherThe Flavor of Together

Forward-looking information
Certain information contained in these materials and our remarks are “forward-looking statements” within the meaning of Section 21E of the
Securities Exchange Act of 1934. These statements may be identified by the use of words such as “may,” “will,” “expect,” “should,”
“anticipate,” “intend,” “believe” and “plan.” These statements may relate to: the expected results of operations of businesses acquired by us,
the expected impact of raw material costs and our pricing actions on our results of operations and gross margins, the expected productivity
and working capital improvements, expectations regarding growth potential in various geographies and markets, expected trends in net sales
and earnings performance and other financial measures, the expectations of pension and postretirement plan contributions and anticipated
charges associated with such plans, the holding period and market risks associated with financial instruments, the impact of foreign exchange
fluctuations, the adequacy of internally generated funds and existing sources of liquidity, such as the availability of bank financing, our ability to
issue additional debt or equity securities and our expectations regarding purchasing shares of our common stock under the existing
authorizations.
These and other forward-looking statements are based on management’s current views and assumptions and involve risks and uncertainties that could significantly affect expected results. Results may be materially affected by factors such as: damage to our reputation or brand name;
loss of brand relevance; increased private label use; product quality, labeling, or safety concerns; negative publicity about our products;
business interruptions due to natural disasters or unexpected events; actions by, and the financial condition of, competitors and customers; our
ability to achieve expected and/or needed cost savings or margin improvements; the successful acquisition and integration of new businesses;
issues affecting our supply chain and raw materials, including fluctuations in the cost and availability of raw and packaging materials;
government regulation, and changes in legal and regulatory requirements and enforcement practices; global economic and financial conditions
generally, including the availability of financing, and interest and inflation rates; the investment return on retirement plan assets, and the costs
associated with pension obligations; foreign currency fluctuations; the stability of credit and capital markets; risks associated with our
information technology systems, the threat of data breaches and cyber attacks; volatility in our effective tax rate; climate change; infringement
of our intellectual property rights, and those of customers; litigation, legal and administrative proceedings; and other risks described in our
filings with the Securities and Exchange Commission.
Actual results could differ materially from those projected in the forward-looking statements. We undertake no obligation to update or revise
publicly any forward-looking statements, whether as a result of new information, future events or otherwise, except as may be required by law.
2

Alan Wilson Chairman, President & CEO
Alan Wilson Chairman, President & CEO
3
First quarter 2014 results and business updateFirst quarter 2014 results and business update

4
Grew sales 8% in local currency
� WAPC accounted for ~1/2 of increase
� Innovation, distribution expansion, brand marketing and pricing drove base business
Improved gross profit margin 70 bps and increased operating income 11%
� Higher sales, favorable business mix and CCI cost savings
� 16% increase in brand marketing
Increased EPS 9%
� Higher operating income offset in part by increase in tax rate
Reaffirming 2014 outlook
� Grow sales 3% - 5%
� EPS of $3.22 to $3.29
First quarter 2014 results and fiscal year outlook

5
.
Global leader in flavor in consumer business
0%
20%
40%
60%
80%
100%
USA Canada UK France Poland China
Smaller Brands
Private Label
Next Largest Brand Competitor
McCormick
Leading share of spice and seasoning category in top markets
Source: IRI, Nielsen, National Grocery Dollars 52 wks/ended Nov 2013
.
4.8%
2.0%
4.0%
2.5%
4.2%
USA Canada U.K. France Poland ChinaSource: Latest 52 week dollar sales for spice and herb category from syndicated reports
Strong spice and seasoning category growth in major markets 9.2%

Consumer demand for flavor is growing
6
� 64% of Millenials “love to cook”; 1/3 indicate “more health-conscious”
� 54% all consumers prefer hot or spicy sauces, dips and condiments – up 8 percentage points in 2 years
� Cuisine specific or ethnic fare accounts for 44% of U.S. flavoring occasions
� Increasing middle class and working women in emerging markets transitioning bulk to packaged spices
Source: American Millenials: Deciphering the Enigma Generation”; 2011 study by Barkley Service Management Group and BCG; Technomics; “Interesting Heat:” Global Expansion in Spicy, Zesty Flavours Enters New Phase, Euromonitor, Michael Schaefer, 6.14.12; The Alcott Group: McCormick Consumer Segmentation; April 2012 / HRCP Market Map; July 2012

7
Consumer business
Grew sales 9% in local currency
� WAPC accounted for 7 percentage points of increase
� Excluding WAPC, grew sales in China by 20%
� Europe, Middle East, & Africa (EMEA) grew sales 4% in local currency
� Americas sales in local currency about even with year-ago period; 2% pricing offset by lower volume and product mix
First quarter 2014 overview
Strengthening brand equity with the consumer
� Increased investment in marketing
� Insight-based innovation
+ Drive
growth
Actions underway in U.S. consumer business
Winning at retail
� Realigned sales organization
� Investing in insights and analytics
� Category leadership program
8

9
U.K. Flavourshots
$0.99 Recipe Inspirations Extra rich
vanilla
France Vahiné dessert items
Poland Grill
Mates
Australia Marinade in a Bag
Consumer-insight based product Innovation
Americas EMEA Asia/Pacific
Australia Slow Cookers
Indian Essentials
Gluten-free recipe mixes
Lawry’s oven fry
mix
13 spice blend in China
Grill Mates burger
seasonings

10
Industrial business
Grew sales 6% in local currency
� Grew Americas sales 3% in local currency; strength with food and beverage manufacturers more than offset weak demand from quick service restaurants
� Grew EMEA sales 12% in local currency; continued success with quick service restaurants
� Recovery in China from weak 2013 demand; grew sales 20% in local currency
First quarter 2014 overview

� Leading positions in growing categories
� Breadth of products ... from value-priced to premium
� Flavors for all types of eating occasions
� Market-leading customers
� Expanding geographic presence
McCormick in advantaged position
11

PEOPLEReady talent,fully engaged
GROWTHWin share with
global focus
PERFORMANCESuperior results,
consistently delivered
Strategic imperatives driving success
STRATEGIC IMPERATIVES
12

Gordon StetzExecutive Vice President
& CFO
Gordon StetzExecutive Vice President
& CFO
13
First quarter 2014 resultsFirst quarter 2014 results

14
6.3%
1.6%
4.2%
1.7%
-1.2%Total Net
SalesVolume/
MixAcquisitions Price Currency
Total Company
3.7%4.7%
0.0%1.0%
-2.0%Total Net
SalesVolume/
MixAcquisitions Price Currency
Industrial
8.0%
-0.3%
6.8%
2.2%
-0.7%
Total NetSales
Volume/Mix
Acquisitions Price Currency
Consumer1Q 2014 Sales results

15
� Compares to 7% increase in 1Q 2013 vs 1Q 2012
� 1Q 2014 sales about even to year ago period with impact of 4Q 2013 pricing actions, offsetting lower volume and product mix
� Early indication of improvement with actions to strengthen brand equity and win at retail-1.2%
-2.1%
0.0%
1.8%
-0.9%
Total NetSales
Volume/Mix
Acquisitions Price Currency
Americas
1Q 2014 Sales results: Consumer business

16
� Growth driven by brand building and product innovation
� Increased brand marketing support 38%
� Particular strength in France and several smaller markets
6.5%
3.9%
0.0%0.3%
2.3%
Total NetSales
Volume/Mix
Acquisitions Price Currency
EMEA
1Q 2014 Sales results: Consumer business
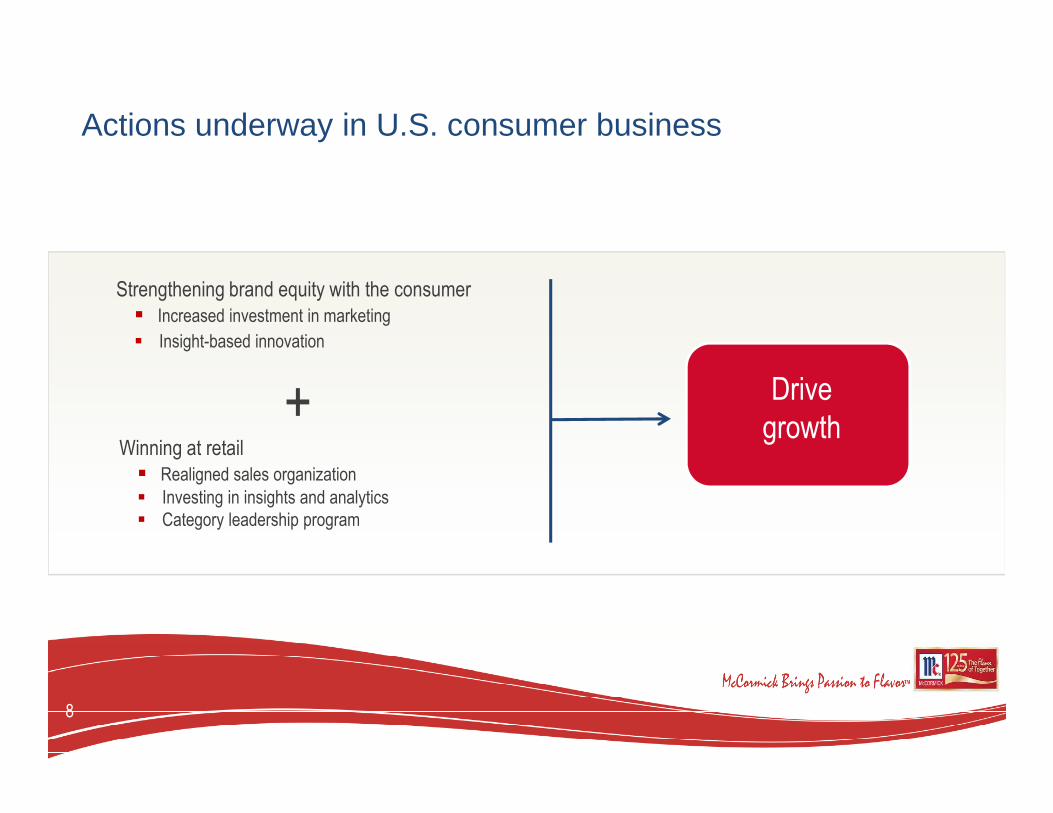
17
� WAPC impact significant in 1Q 2014 with further incremental benefit to 2Q 2014
� Grew base business sales in China 20%
� Sales in India continued to reflect higher pricing taken in response to steep cost increases
65.9%
0.1%
64.0%
9.0%
-7.2%
Total NetSales
Volume/Mix
Acquisitions Price Currency
1Q 2014 Sales results: Consumer business
Asia/Pacific

� Favorable impact from higher sales, favorable business mix and CCI cost savings
� $6 million increase in brand marketing support
18
1Q 2014 Operating income: Consumer business
1Q 2014 1Q 2013
Fav(Unfav) Change
Operating income $94.3 $87.7 7.6%

19
6.3%
1.6%
4.2%
1.7%
-1.2%Total Net
SalesVolume/
MixAcquisitions Price Currency
Total Company
3.7%4.7%
0.0%1.0%
-2.0%Total Net
SalesVolume/
MixAcquisitions Price Currency
Industrial
8.0%
-0.3%
6.8%
2.2%
-0.7%
Total NetSales
Volume/Mix
Acquisitions Price Currency
Consumer1Q 2014 Sales results

2.1%
2.7%
0.0%
0.5%
-1.1%
Total NetSales
Volume/Mix
Acquisitions Price Currency
Americas
20
� Grew sales of snack seasonings and other flavors to food manufacturers
� Solid sales of branded food service products
� Continued weak demand from quick service restaurants this period
1Q 2014 Sales results: Industrial business

21
� Another quarter of strong sales to quick service restaurants with product innovation and distribution gains
� Pricing taken in response to higher material costs
8.3% 8.4%
0.0%
3.6%
-3.7%
Total NetSales
Volume/Mix
Acquisitions Price Currency
EMEA
1Q 2014 Sales results: Industrial business

22
� Improved sales to quick service restaurants in China
� Compares to weak period in 1Q 2013 that was affected by weak demand from quick service restaurants related to consumer concerns about poultry consumption
5.4%
10.0%
0.0%
-0.3%
-4.3%Total Net
SalesVolume/
MixAcquisitions Price Currency
Asia/Pacific
1Q 2014 Sales results: Industrial business

1Q 2014 1Q 2013
Fav(Unfav) Change
Operating income $30.3 $24.3 24.3%
� Favorable impact from higher sales, favorable mix of business, and CCI cost savings
� Reversal of 22% year-ago decline in first quarter 2013 vs first quarter of 2012
23
1Q 2014 Operating income: Industrial business

24
Operating income, gross profit, SG&A
1Q 2014 1Q 2013
Fav(Unfav) Change
Operating income $124.6 $112.0 11.3%
Gross profit margin 39.4% 38.7% 70 bps
Selling, general & administrative expenses as percent of net sales
26.9% 26.7% (20 bps)
� Increase in operating income due to higher sales, more favorable business mix and CCI cost savings
� Increased brand marketing support $7 million

25
Income taxes
1Q 2014 1Q 2013
Income taxes $35.0 $28.1
Income tax rate 31.1% 28.5%
� Increase due to discontinuation of R&D tax credit, tax law change in France, and mix of income across tax jurisdictions

26
Income from unconsolidated operations
1Q 2014 1Q 2013Fav(Unfav)
ChangeIncome from unconsolidated operations
$5.1 $5.4 (6%)
� Decrease in quarter due primarily to costs associated with relocation to new manufacturing facility for joint venture in Mexico
� Unfavorable impact of relocation expected to extend into 2Q 2014, followed by strong growth in second half of 2014

27
Earnings per share of $0.62
1Q 2014 1Q 2013Fav(Unfav)
Change
Earnings per share $0.62 $0.57 8.8%
Increased operating income 0.07
Higher tax rate (0.02)
Reduction in shares outstanding 0.01
Other, net (0.01)
Increase in EPS $0.05

28
� Cash flow from operations $77 million vs $32 million in 1Q 2013
� $57 million used to repurchase shares; $303 million still available on $400 million authorization
� Balance sheet remains strong, close to target debt level and well-positioned to fund investments to drive growth
Balance sheet and cash flow

29
Sales growth in local currency* 3% to 5%
Includes 1% pricing, 1% to 2% WAPC
Operating income increase ** 6% to 8%
CCI cost savings At least $45 million
Material cost inflation Low single-digit increase
Gross profit margin increase 50 to 100 bp
Incremental brand marketing At least $25 million
Income from unconsolidated operations At least 15%
Tax rate 30% to 31%
Earnings per share $3.22 - $3.29
Capital expenditures $120-$130 million
Shares outstanding 1% to 2% reduction
* Unfavorable currency impact expected to lower sales 1%
** From adjusted operating income of $591 million in 2013; See reconciliation of GAAP to non-GAAP financial measures on slide 32..
2014 Financial outlook
29

Estimated impact of tax rate and special charges on projected rate of growth for 2014 EPS from 2013 adjusted EPS*:
Tax rate increase $0.14 to $0.18
Special charges $0.01
Impact on growth rate 5 to 6 percentage points
30
2014 Financial outlook
2014 Projection 2013
Projected EPS/ Adjusted EPS* $3.22 to $3.29 $3.13
Growth rate 3% to 5%
* See reconciliation of GAAP to non-GAAP financial measures on slide 32.


32
The table below includes financial measures of operating income, net income and diluted earnings per share excluding the impact of $25 million of charges related to reorganization activity in EMEA recorded in the fourth quarter of 2013. Also excluded is the impact of a $15 million loss on voluntary pension settlement recorded in the fourth quarter of 2013 that relates to a previously announced lump sum payout program offered to former U.S. employees with deferred vested pension benefits. These are non-GAAP financial measures which are prepared as a complement to our financial results prepared in accordance with United States generally accepted accounting principles. We believe this non-GAAP information is important for purposes of comparison to prior periods and development of future projections and earnings growth prospects. This information is also used by management to measure the profitability of our ongoing operations and analyze our business performance and trends. Management believes the non-GAAP measures provides a more consistent basis for assessing the Company’s performance than the closest GAAP equivalent.
These non-GAAP measures may be considered in addition to results prepared in accordance with GAAP, but it should not be considered a substitute for, or superior to, GAAP results. We intend to continue to provide these non-GAAP financial measures as part of our future earnings discussions and, therefore, the inclusion of these non-GAAP financial measures will provide consistency in our financial reporting. A reconciliation of these non-GAAP measures to GAAP financial results is provided below.
Non-GAAP Financial Measures
(in millions except per share data) Twelve Months Ended 11/30/13 11/30/12 Operating income $ 550.5 $ 578.3 Impact of special charges and loss on
voluntary pension settlement 40.3 — Adjusted operating income $ 590.8 $ 578.3
% increase versus prior period 2% Net income $ 389.0 $ 407.8 Impact of special charges and loss on
voluntary pension settlement 29.2 — Adjusted net income $ 418.2 $ 407.8
% increase versus prior period 3% Earnings per share $ 2.91 $ 3.04 Impact of special charges and loss on
voluntary pension settlement 0.22 — Adjusted earnings per share $ 3.13 $ 3.04
% increase versus prior period 3%