Embed Size (px)
Citation preview

The following scientific article was officially published in the journal Computers in Biology and
Medicine, published by Elsevier. This article’s citation is as follows:
Assi, Kondo Claude, Hubert Labelle, and Farida Cheriet. “Statistical model based 3D shape
prediction of postoperative trunks for non-invasive scoliosis surgery planning.” Computers
in Biology and Medicine, Vol. 48, (2014): pp. 85-93.
doi: 10.1016/j.compbiomed.2014.02.015
The manuscript, as accepted by the publisher, is reproduced here, as it appears in the first author’s
Ph.D. thesis, entitled Modélisation physique des tissus mous du tronc scoliotique pour la
simulation de l'apparence post-chirurgicale. The thesis citation is as follows:
Assi, Kondo Claude. "Modélisation physique des tissus mous du tronc scoliotique pour la
simulation de l'apparence post-chirurgicale." PhD diss., École Polytechnique de Montréal,
2014.
Kondo Claude Assi, 2014
© 2014 Kondo Claude Assi. This work is licensed under the Creative Commons Attribution-
NonCommercial-NoDerivatives 4.0 International License. To view a copy of this license,
visit:
http://creativecommons.org/licenses/by-nc-nd/4.0/

39
CHAPITRE 5
ARTICLE 2: STATISTICAL MODEL BASED 3D SHAPE PREDICTION OF
POSTOPERATIVE TRUNKS FOR NON-INVASIVE SCOLIOSIS SURGERY
PLANNING
K. C. Assia,b,∗ , H. Labelleb, F. Cherieta,b
(a) Ecole Polytechnique de Montreal, P.O. Box 6097, Succursale Centre-ville,
Montreal, Quebec, Canada H3C 3A7
(b) Sainte-Justine Hospital Research Center, 3175 Cote-Sainte-Catherine,
Montreal, Quebec, Canada H3T 1C5
5.1 Abstract
One of the major concern of scoliosis patients undergoing surgical treatment is the aesthetic
aspect of the surgery outcome. It would be useful to predict the postoperative appearance
of the patient trunk in the course of a surgery planning process in order to take into account
the expectations of the patient. In this paper, we propose to use the least squares support
vector regression for the prediction of the postoperative trunk 3D shape after spine surgery for
adolescent idiopathic scoliosis. Five dimensionality reduction techniques used in conjunction
with the support vector machine are compared. The methods are evaluated in terms of
their accuracy, based on the leave-one-out cross-validation performed on a database of 141
cases. The results indicate that the 3D shape predictions using a dimensionality reduction
obtained by simultaneous decomposition of the predictors and response variables have the
best accuracy.
5.2 Introduction
Adolescent idiopathic scoliosis (AIS) is a three-dimensional deformation of the spine and
rib cage, with a prevalence of approximately 3% in the general population. Depending on
the severity of the trunk deformity, a spine correction surgery may be required. Among
patients with AIS, 9% are treated by brace and one in a thousand needs surgery using
posterior spinal instrumentation and fusion to correct the deformity. Neglecting to proceed
for a surgical treatment may lead to functional complications such as postural, cardiac or
pulmonary problems.
One of the main concern of scoliotic patients undergoing surgery is the postoperative
external appearance of the trunk, i.e, the aesthetical aspect [17]. Assessment by surgeons

40
of scoliosis surgery outcomes are not necessarily correlated with patient satisfaction and
vary with the observer [89]. Therefore, it would be important to be able to rigorously and
quantitatively predict the outcome of the surgery in a surgery planning process. This will
allow the surgeon to take into account the expectations of the patients.
Information technology in medicine is assisting physicians and clinicians in their practice
by providing computer based data management and processing tools as an aid in medical
decision making. Recently, Devedzic et al. [90] developed a web-based information system,
ScolioMedIS, to help health professionals monitor, manage and use clinical data from scolio-
sis patients. ScolioMedIS [90] uses parameterized 3D anatomical models of the spine for the
quantitative assessment of the deformity. By reducing the number of required radiographs,
the system allows to minimize the amount of radiation exposure. One of the turning points
in scoliosis research was the emergence, in the last two decades, of new techniques for the
human trunk surface topography data acquisition and processing, mostly based on optical
range image 3D technologies. The aim was to replace radiographic evaluation of scoliosis
with systems free from ionizing radiation. Pazos et al. [91] developed a non-invasive tech-
nique with a four digital cameras using a projected structured light for the acquisition and 3D
reconstruction of the whole trunk. This optical 3D digitizing system is used for clinical assess-
ment of the trunk external asymmetry. Shannon [92] developed a system using video based
motion capture technology allowing the simultaneous acquisition of multiple samples of back
surface shape and the locations of bony landmarks. This system leads to a quantitative and
reliable analysis of the trunk aesthetics. Some researchers have proposed, in the past recent
years, various efficient 3D surface analysis combined with different trunk landmarks identi-
fication and selection techniques to detect spinal and torso deformities, leading to different
trunk surface characterization schemes for scoliosis diagnosis. For example, using structured
splines models of the trunk surface, Ajemba et al. [93] proposed a method of characterizing
the torso shape deformity associated with scoliosis by both its type and severity. Seoud et
al. [69] used some trunk surface topography analysis techniques to obtain the prediction of
scoliosis curve types. These previous works succeeded in fulfilling their purpose but did not
address the surgical treatment outcome prediction problem. The present paper contribution
builds upon the above cited works in the analysis of the trunk surface topography for the
management of scoliosis and proposes a method to predict the postoperative trunk 3D shape.
Machine learning prediction techniques, particularly support vector machines (SVM),
have been increasingly and successfully applied to a wide variety of biological and medi-
cal engineering problems such as electroencephalography (EEG) signals analysis [64, 94],
electromyography (EMG) signals analysis for neuromuscular disorder detection [95], brain
glioma [65], heart disease diagnosis [96], macroinvertebrate image classification [97], and pro-

41
tein recognition [98], to cite but a few examples. In the case of scolosis studies, one important
question that was addressed by different research groups, during the last few years, is about
relating the trunk surface with the configuration of the spine. Bergeron et al.[66] have inves-
tigated the correlation between the surface topography and the spinal curve, using support
vector regression. Jaremko et al.[67] have used neural-network approaches to study and es-
timate Cobb angle from the trunk external surface asymmetry measurements. Ramirez et
al. [68] have used support vector machine to assess the severity of the spine deformity from
surface topography data. Although these works find applications in the follow-up or diagnosis
of scoliosis patients, they were essentially limited to preoperative trunk shapes. These stud-
ies do not address the question of correlating the preoperative shape with the postoperative
shape. Finding a solution to such a question would have important applications in scoliosis
surgery planning.
Very few works have been done on the quantitative relationship between the preoperative
and the postoperative trunk surfaces. Simulation of the postoperative bone structure have
been conducted in [4]. But the study was limited only to the spine configuration. To the
best of our knowledge, the first work on the simulation of the postoperative trunk surface
in scoliosis surgery are the preliminary results reported in [29] by our research group. The
approach is based on a particle system model of the soft-tissue of the trunk. This simulator
has however some limitations. In particular, some aspect of the preprocessing requires the
output of a postoperative bone structures simulator [4] as a starting point. The approach
taken in the present work, is through shape prediction based on support vector machines, and
complements the simulator in [29]. The output of the study would provide to the simulator an
initial shape estimate to be used in the personalized trunk surface simulation. Our approach
takes into account information contained in a database of scoliotic trunk 3D shapes. To the
best of our knowledge, this is the first study of statistical based prediction of the postoperative
trunk 3D shape after spine surgery for AIS.
The main idea of statistical model-based shape prediction is to find statistically plausible
parameter values of the model, given the available patient data and some fitting criteria.
Most statistical machine learning techniques may not be effective for high-dimensional data.
Due to the curse of dimensionality, the accuracy and efficiency of most prediction algorithms
degrade rapidly as the data dimension increases. Medical images and anatomical shapes
data usually involves a large number of samples points and correlated features. Thus, it is a
prerequisite to reduce the data dimension so that the prediction methods can be applied to the
reduced data sets. For this reason, a typical prediction procedure may consist in four steps:
(i) feature extraction, (ii) feature dimensionality reduction, (iii) regression function learning,
and (iv) prediction [99]. The choice of support vector machine for regression as a learning

42
method was motivated by its strong generalizability capability. Dimensionality reduction
is the process of mapping high-dimensional feature vectors onto lower-dimensional vectors
while maintaining sufficient information to reproduce most of the variability of the original
data set. Principal components analysis (PCA) [100] is by far the most popular unsupervised
linear technique for dimension reduction. PCA constructs a low-dimensional representation
of the data that describes as much of the variance in the data as possible. However, its
effectiveness is limited by its global linearity. Kernel PCA (KPCA) [101] is the reformulation
of the traditional linear PCA in a high-dimensional space that is constructed using a kernel
function. KPCA computes the principal eigenvectors of the kernel matrix, rather than those
of the covariance matrix. However, an important weakness of KPCA is that the size of the
kernel matrix is proportional to the square of the number of instances in the data set. The
Locality preserving projections (LPP) method [102] is a technique that aims at combining
the benefits of linear techniques and local nonlinear techniques for dimensionality reduction
by finding a linear mapping that minimizes the cost function of Laplacian eigenmaps. In
contrast to PCA, LPP method is capable of successfully identifying complex data manifolds
such as the Swiss roll. Neighborhood preserving embedding (NPE) [103] is similar to LPP.
However, NPE proceeds by minimizing the cost function of a local nonlinear technique for
dimensionality reduction under the constraint that the mapping from the high dimensional
to the low-dimensional data representation is linear. Partial Least Squares (PLS) [104, 105]
is a technique that generalizes and combines features from principal component analysis and
multiple regression. It is particularly useful when one needs to predict a set of dependent
variables from a very large set of independent predictor variables. The underlying assumption
of all PLS methods is that the observed data is generated by a process which is driven by a
small number of latent variables. In its general form, PLS creates orthogonal latent vectors
by using the existing correlations between the sets of input and output variables while also
keeping most of the variance of both sets. Due to its capability of effectively decreasing
the correlation between the input influence factors, the PLS method has proven to be useful
in situations where the number of observed variables is much greater than the number of
observations and high multicollinearity among the variables exists. These methods were
mainly used in the context of classification problems.
The aim of this paper is to compare different dimensionality reduction techniques for a
statistical model based shape prediction of the trunk. We report the results obtained using
a multivariate statistical model of the trunk feature curve. Five dimensionality reduction
techniques such as principal component analysis (PCA), Kernel principal component analysis
(KPCA), partial least squares (PLS), locality preserving projection (LPP) and neighborhood
preserving embedding (NPE) are considered and compared on a database of 141 scoliosis

43
patients trunk shapes. The prediction results are evaluated using the leave-one-out cross-
validation.
5.3 Materials and Methods
The methods for the trunk 3D shape prediction are described in this section. All the eval-
uations were made on real clinical datasets obtained using a non-invasive medical imaging
system.
5.3.1 Data acquisition of the trunk surface
The data were acquired at the Sainte-Justine Hospital Research Center, and consist of 141
samples. Trunk data were acquired from patients with AIS of age between 11 and 18 years
old, who have undergone spine surgery. The acquisition protocol was described by Pazos
et al. [106, 88] and is summarized in this section. The surface geometry of the trunk is
acquired using a calibrated system composed of four 3D optical digitizers (InSpeck Inc.,
Montreal, Canada), each assembled with a CCD camera and a structured light projector,
placed around the patient (Figure 5.1). The acquisition process, identical for each scanner,
consists in projecting and capturing four fringe patterns deformed by the trunk’s external
shape. The system then computes, by triangulation, the depth of each surface point relative
to the reference plane of the digitizer. A fifth image, captured without fringes, defines the
texture data mapped on the surface. The entire trunk geometry is obtained by registering
and merging the partial surfaces obtained by each digitizer. This process takes 4-6 seconds
with the patient standing still in the upright position, arms slightly abducted to prevent oc-
cluded areas in the field of view of the lateral scanners. The resulting mesh contains 40k−70k
vertices, depending on the patient’s height and a previous study [88] of the system demon-
strated a reconstruction accuracy of 1.4mm over the whole torso of a mannequin. Before the
surface acquisition, visible landmarks are drawn on the patient’s skin. The accuracy of the
3D position of the identified landmarks was evaluated at 2.1± 1.5mm [20]. The homologous
landmarks coordinates for each geometry are latter used for the alignement of all the surfaces.
5.3.2 Feature curves representation of the trunk
The trunk surface may be viewed and represented as a finite collection of 3D curves. For
the purpose of this work, we are interested in characteristic anatomical curves on the trunk
external surface. One of the most visible features of the trunk external surface is the so-
called back valley. Figure 5.2 shows the back valley curve along the spinous processes of a
scoliotic patient in the preoperative and the postoperative status. The shape of this feature

44
Figure 5.1 Trunk topography measurement and reconstruction. (A) Experimental set-upof four optical digitizers. (B) Example of a Capturor 3D optical digitizer, consisting of aCCD camera coupled with a structured light projector. (C) Set of four fringe images, eachoffset by 1
4phase, projected by a digitizer onto the back of a mannequin. A fifth image
provided the surface texture. (D) Resulting phase image from the four fringe images; surfacereconstruction uses the interferometry principle combined with active triangulation. (E) Theprocess of registering and merging the partial surfaces from the different digitizers producesthe complete trunk surface
Figure 5.2 Feature curves (back valley) of the trunk surface. Left: preoperative surface.Right: postoperative surface. The curve top and bottom endpoints A and B correspond tothe spinous process of C7 and the spinous process of L5, respectively. C indicates the curve.
curve almost follows that of the spine. Due to the surgery procedure, the curve shape
has changed from preoperative to postoperative state. The upper and lower end points
(A and B) are anatomical landmarks corresponding to the spinous process of C7 (seventh

45
cervical vertebra) and the spinous process of L5 (the fifth lumbar vertebra), respectively.
A positioning system ensured standard posture before data acquisition. The results of the
raw feature curve extraction is a polygonal line consisting of up to 75 three-dimensional
coordinates samples from the back surface located along the back valley (Figure 5.3). An
initial processing of the data provides a similar basis for comparison among all patients. To
begin, four surface markers appearing on the trunk datasets were used to translate the point
coordinates to a common 3D Euclidean space, having as origin the spinous process of L5
vertebra. The x-axis was oriented towards the front of the patient, the y-axis towards the
Figure 5.3 Anatomical landmarks for the normalization of the dataset. Four landmarks (A1)PV , (A2) MPSIS , (A3) LASIS, and (A4) RASIS are considered to define a unified coordinatesystems. The origin is set at A2. The z-axis is perpendicaular to the (A2A3A4) plane. They-axis is parallel to ASIS and oriented to the left side of the patient. The x-axis is orientedto the front of the patient.
patient left (parallel to the ASIS axis). That space was scaled to the unit length of the
distance between the endpoints A1 and A2 (Figure 5.3), after which the curve was rotated
about the origin such that the curve upper end point A1 coincide with the point (0,0,1). The
feature curves were represented explicitly as a finite set of corresponding points uniformly
sampled from a parameterized function f = f(t), f : [0, 1]→ R3, fitting the initial points.

46
5.3.3 Statistical framework
The input and response variables xi and yi for the i-th observation (i = 1, . . . , n) are as
follow. The variables xi are obtained from the positions of N points uniformly sampled from
the feature curve of the preoperative trunk shape, while the variables yi are points sampled
from the postoperative trunk shape:
xi = [Px1 Py
1 Pz1 ... Px
N PyN Pz
N ],
yi = [Qx1 Qy
1 Qz1 ... Qx
N QyN Qz
N ].
The data are scaled and centered according to the procedure described in Section 5.3.2. The
data matrices X and Y, of size n× 3N , contain the variables corresponding to the n prepro-
cessed samples xi and yi of the dataset. The aim is to predict the shape of the postoperative
curve 3D shape from the preoperative curve shape. The prediction of the postoperative 3D
trunk shape y from the preoperative trunk shape x can be performed using the Least Square
Support Vector Machine (LS-SVM) [107], in conjunction with a dimensionality reduction of
the data prior to the LS-SVM regression. In this study, five dimensionality reduction meth-
ods are investigated, namely the Principal Component Analysis (PCA), the Kernel Principal
Component Analysis (KPCA), the Partial Least Squares (PLS), the Locality Preserving Pro-
jection (LPP) and the Neighborhood Preserving Embedding (NPE). In the remanining of
this paper, we adopt the following notations. The dot on top of a variable indicates that it
is centered: v = v − µV , µV being the sample mean.
Principal Component Analysis
The PCA approach [100] finds directions ui where the the variance of X (or similarly
uTi XXTui) is maximum. For that, PCA solves the eigenvalue problem:
XT Xu = λu.
The reduced dataset is obtained by linear projection: X = XT, where T is formed by the
eigenvectors of the centered covariance matrix.

47
Kernel Principal Component Analysis
The Kernel PCA dimensionality reduction [101] computes the reduced dataset by the pro-
jection of the (training points) {xi}ni=1 as
P = UΛ1/2,
where the columns of U are created by the eigenvectors {ui}ni=1, and Λ is a diagonal matrix
diag(λ1, ..., λn) are obtained by solving the eigenvalue problem
Ku = λu,
with K = ΦΦT the (n×n) matrix associated to the (n×n) matrix of the centered nonlinear
mappings of the input variables {xi}ni=1 ∈ Rn.
Partial Least Squares
The PLS dimensionality reduction method [104, 105] finds pairs of direction ui, vi, so that
ρi = uTi XYTvi
is maximal, with the constraint that both Ur = [u1, . . . ,ur] and Vr = [v1, . . . ,vr] form
orthonormal bases. Those directions are obtained by solving the eigenproblem:
SxySyxui = ρ2iui
SyxSxyvi = ρ2ivi
where Sxy,Syx are the sample covariance matrices of X and Y , and Y and X, respectively.
The scores Tr are given by the projection:
Tr = XTUr.
Locality Preserving Projection
The Locality Preserving Projection (LPP) method [102] is a linear approximation of the
nonlinear Laplacian EigenMap. It computes the mapped dataset X = XA, where A is
composed by the eigenvectors of the generalized eigenvector problem
XTLXv = λXTMXv,

48
in which L is the graph Laplacean and M the degree matrix of the graph whose weights are
given by wij = e−‖xi−xj‖
2
2σ2 .
Neighborhood Preserving Embedding
The NPE [103] projects the data with the projection X = XB where the linear mapping
B is formed by the eigenvectors associated to the first smallest nonzero eigenvalues of the
generalized eigenproblem
XT (I−W)T (I−W)Xv = λXT Xv,
where I represents the n×n identity matrix, and W the adjacency matrix of the neighborhood
graph.
5.3.4 Least Squares Support Vector Regression
The least squares support vector machine (LS-SVM) for regression [107] is used for the
prediction of the postoperative trunk 3D curve shapes. Given the dataset {(xi, yi)ni=1}, we
are interested in estimating a model of the form
y = wTφ(x) + b,
where x ∈ Rn, y ∈ R and φ(.) : Rn → Rnh is the mapping to a high dimensional feature
space. LS-SVM solves the optimization problem:
minw,b,e
1
2wTw + γ
1
2
N∑i=1
e2i
subject to yi = wTφ(xi) + b + ei, i = 1, ..., N,
(5.1)
where γ > 0 is a regularization parameter. The associated Lagrangian is:
Lα(w,b, e) =1
2wTw + γ
1
2
N∑i=1
e2i −
N∑i=1
αi(wTφ(xi) + b + ei − yi).
The Karush-Kuhn-Tucker (KKT) conditions for optimality lead to the linear system[0 1TN
1N ZTZ + 1γI
][b
α
]=
[0
y
],
49
where
ZT =
φ(x1)Ty1
φ(x2)Ty2
...
φ(xN)TyN
The resulting LS-SVM model is given by y(x) =
∑Ni=1 αiK(x,xi) + b, where K(xi,xj) =
φ(xi)Tφ(xj) is the kernel function.
5.4 Results
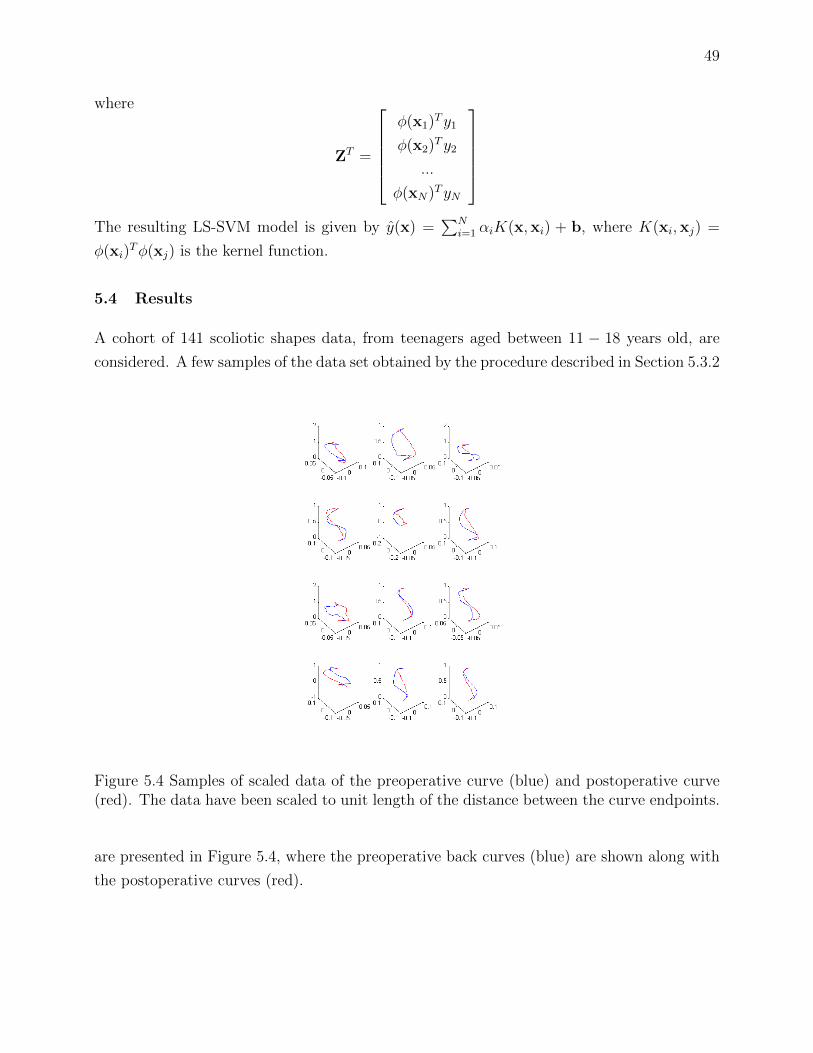
A cohort of 141 scoliotic shapes data, from teenagers aged between 11 − 18 years old, are
considered. A few samples of the data set obtained by the procedure described in Section 5.3.2
Figure 5.4 Samples of scaled data of the preoperative curve (blue) and postoperative curve(red). The data have been scaled to unit length of the distance between the curve endpoints.
are presented in Figure 5.4, where the preoperative back curves (blue) are shown along with
the postoperative curves (red).

50
5.4.1 Validation
The dimensionality reduction methods combined to the LS-SVM regression for the trunk 3D
shape prediction are evaluated using the leave-one-out cross-validation procedure. A sample
of the data is, in turn, removed from the dataset and used as a test point. The statistical
model is trained by using the remaining samples. The prediction procedure is then applied
to the test sample. Each sample point is composed of a pair (preoperative and postoperative
shapes). The predicted curve can then be compared with the actual postoperative feature
curve and a shape prediction error can be computed. Quantitative prediction errors are
obtained by computing the distances between corresponding points on the predicted back
feature curve and the measured back curve of the postoperative test case. To evaluate
our results, we compute the prediction error in terms of the normalized root mean square
prediction error, which has the advantage of allowing prediction error to be measured on the
same scale for all observations.
5.4.2 Results
The leave-one-out cross validation procedure described in Sections 5.4.1 was conducted on
a database of n = 141 cases. The prediction errors distribution for the input data, reduced
to (25) components, are presented in Figure 5.5 for the dimensionality reduction methods
presented in Section 5.3.3. The mean prediction errors are 0.0145(±0.0067) for the classical
Figure 5.5 Comparison of the effect of dimensionality reduction methods on the trunk 3Dshape prediction using LS-SVR regression. Summary of prediction errors for different di-mensionality reduction methods: Box plots of mean prediction errors. The performances arecompared in normalized root mean squared error (NRMS) terms. From left to right, PrincipalComponent Analysis, Kernel Principal Component Analysis, Partial Least Squares, LocalityPreserving Projection, and Neighborhood Preserving Embedding.
PCA method, 0.0148(±0.0086) for the KPCA, 0.0126(±0.0052) for the PLS, 0.0149(±0.0071)

51
for the LPP and 0.0146(±0.0065) for NPE. It appears that the PLS has the best results,
on average, for the prediction. From these results it can be seen that the PLS-LSSVM
regression has better performances and smaller standard deviations compared to the other
methods. An example of the prediction with the PLS-LSSVM regression of postoperative 3D
shape is presented in Figure 5.6, where the three-dimensional predicted postoperative curve
is overlayed on the postoperative trunk surface mesh, along with the preoperative curve and
the actual postoperative back valley curve. As one can notice the 3D shape predicted by the
Figure 5.6 Three-dimensional visualization of the curve shape for an example patient. Overlayof the predicted curves on the actual postoperative trunk surface. preoperative (black), actualpostoperative (green) and predicted postoperative with PLS-LSSVR (blue).
PLS-LSSVM regression is close to the actual postoperative shape.
5.5 Discussion
Since the back valley line is an open curve with well identified endpoints, the use of an
uniform sampling to define the corresponding points is reasonable. This procedure allows
to solve the point correspondence problem which is necessary for the statistical model. The
study, conducted on a database of 141 samples pairs, uses a finite set of corresponding points
on the trunk feature curves.
The different dimensionality reduction methods appears to perform in a similar way.
Unexpectedly, however, the kernel PCA appears to produce less accurate postoperative 3D

52
shape predictions compared to the classical PCA. This may be due to the difficulties related
to the tuning parameters selection in the higher dimension space.
However, the PLS method in particular manages to capture well the relations between
the preoperative shape and the postoperative shape compared to the other methods. The
PLS exploits the correlation between the input space data and the response data, which
explain the better performance obtained on the predictions. It performs a simultaneous
decomposition of the input and response with the constraint that these components explain
as much as possible of the covariance between input and response data.
The LPP and NPE methods proved to generate results very similar to the PCA and
KPCA approaches. It is not surprising to see that the LPP and NPE methods perform on
average as good as the classical PCA, since the neighborhood information is exploited in
the prediction model. These results support the idea that closer points in the input shape
space are expected to behave similarly in the response shape space. However, we believe that
a procedure for learning the appropriate distance metric in the trunk shape spaces would
improve the accuracy performance of the predictions based on LPP and NPE.
5.6 Conclusion
To date, the statistical approaches to the trunk 3D shapes analysis for the clinical manage-
ment of scoliosis were mainly aimed at the scoliosis curve types detection and classification.
To the best of our knowledge, there exists no previous research reporting on the statistical
prediction of the trunk postoperative shape based on the preoperative data for surgically
treated patients with scoliosis. In the present paper, we have contributed to the analysis
of the trunk surface topography by proposing novel approaches to predict the postoperative
trunk 3D shapes of scoliosis patients. The approaches consist in the combination of dimen-
sionality reduction techniques with machine learning based prediction methods. This is the
first work on the subject.
The prediction of the postoperative 3D shapes of scoliotic trunks, stated as a regression
problem of predicting the positions of a finite set of points of the trunk feature curves knowing
their initial positions in preoperative state, has been approached using least squares support
vector machine. Different dimensionality reduction techniques in conjunction with the sup-
port vector regression have been compared. The accuracy of the prediction errors has been
analyzed using the leave-one-out cross-validation. Although, the methods performed simi-
larly on average, the PLS dimensionality reduction appears to provide better results. This
study may however have some limitations, in that in particular, anthropometric predictor
variables (such as gender, age, body mass index) were not explicitly included.

53
As a future work, additional landmark-curves will be considered in order to predict the
whole trunk surface. Some aspects of the present work will be useful as a complementary
data supplier to the framework of the personalized physically-based trunk soft-tissue modeling
used for surgery simulation [29] by providing an initial guess of the simulated trunk.
Conflict of interest statement
The authors declare that they have no conflict of interest.
Acknowledgments
This research was funded by the Natural Sciences and Engineering Research Council of
Canada. The equipment was financed by the Canadian Foundation for Innovation. Au-
thor 1 was supported, in part, by the Fondation Sainte-Justine and Fondation des Etoiles
foundations of Sainte-Justine University Hospital Center.

80
REFERENCES
[1] S. Kadoury, F. Cheriet, C. Laporte, and H. Labelle. A versatile 3D reconstruction
system of the spine and pelvis for clinical assessment of spinal deformities. Medical and
Biological Engineering and Computing, 45(6) :591–602, 2007.
[2] W. Mollemans, F. Schutyser, N. Nadjmi, F. Maes, and P. Suetens. Predicting soft tissue
deformations for maxillofacial surgery planning system : from computational strategies
to a complete clinical validation. Medical Image Analysis, 11(3) :282–301, 2007.
[3] C.-E. Aubin, H. Labelle, and O. C. Ciolofan. Variability of spinal instrumentation
configurations in adolescent idiopathic scoliosis. European Spine Journal, 16(1) :57–64,
2007.
[4] C.-E. Aubin, H. Labelle, C. Chevrefils, G. Desroches, J. Clin, and A. B. Eng. Preo-
perative planning simulator for spinal deformity surgeries. Spine, 33(20) :2143–2152,
2008.
[5] V. J. Raso, E. Lou, D. L. Hill, J. K. Mahood, M. J. Moreau, and N. G. Durdle. Trunk
distorsion in adolescent idiopathic scoliosis. J.Pediatr. Orthop., 18 :222–226, 1998.
[6] C. Denoel, M. F. I. Aguirre, G. Bianco, P. H. Mahaudens, R. Vanwijck, S. Garson,
R. Sinna, and A. Debrun. Idiopathic scoliosis and breast asymmetry. Journal of Plastic
Reconstructive and Aesthetic Surgery, 62 :1303–1308, 2009.
[7] T. G. Lowe, M. Edgar, J. Y. Margulies, N. H. Miller, V. J. Raso, K. A. Reinker, and
C. H. Rivard. Etiology of idiopathic scoliosis : current trends in research. J Bone Joint
Surg Am, 82-A :1157–1168, 2000.
[8] E. J. Rogala, D. S. Drummond, and J. Gurr. Scoliosis : incidence and natural history.
a prospective epidemiological study. J Bone Joint Surg Am, 60 :173–176, 1978.
[9] J.R. Cobb. Outline for the study of scoliosis. Am. Acad. Orthop. Surg. Instruct. Lect.,
5 :261–275, 1948.
[10] S. Negrini. Bracing adolescent idiopathic scoliosis today. Disabil Rehabil Assist Technol,
3 :107–111, 2008.
[11] R.R. Betz and H. Shufflebarger. Anterior versus posterior instrumentation for the
correction of thoracic idiopathic scoliosis. Spine, 26(9) :1095–1100, 2001.

81
[12] P. Papin, H. Labelle, S. Delorme, C.E. Aubin, J.A. De Guise, and J. Dansereau. Long-
term three-timensional changes of the spine after posterior spinal instrumentation and
fusion in adolescent idiopathic scoliosis. European Spine Journal, 8(1) :16–21, 1999.
[13] S. Delorme, P. Violas, J. Dansereau, J. de Guise, C.-E. Aubin, and H. Labelle. Preope-
rative and early postoperative three-dimensional changes of the rib cage after posterior
instrumentation in adolescent idiopathic scoliosis. European Spine Journal, 10(2) :101–
107, 2001.
[14] M. Asher, S. M. Lai, D. Burton, and B. Manna. Maintenance of trunk deformity
correction following posterior instrumentation and arthrodesis for idiopathic scoliosis.
Spine, 29 :1782–1788, 2004.
[15] R. K. Pratt, J. K. Webb, R. G. Burwell, and A. A. Cole. Changes in surface and radio-
graphic deformity after universal spine system for right thoracic adolescent idiopathic
scoliosis : is rib-hump reassertion a mechanical problem of the thoracic cage rather than
an effect of relative anterior spinal overgrowth ? Spine, 26 :1778–1787, 2001.
[16] U. Willers, E. E. Transfeldt, and R. Hedlund. The segmental effect of cotrel-dubousset
instrumentation on vertebral rotation, rib hump and the thoracic cage in idiopathic
scoliosis. European Spine Journal, 5(6) :387–393, 1996.
[17] T. R. Haher, A. Merola, R. I. Zipnick, J. Gorup, D. Mannor, and J. Orchowski. Meta-
analysis of surgical outcome in adolescent idiopathic scoliosis. a 35-year english litera-
ture review of 11,000 patients. Spine, 20(14) :1575–1584, 1995.
[18] A. E. Geissele, J. W. Ogilvie, M. Cohen, and D. S. Bradford. Thoracoplasty for the
treatment of rib prominence in thoracic scoliosis. Spine, 19(14) :1636–1642, 1994.
[19] K.H. Bridwell. Surgical treatment of idiopathic adolescent scoliosis. Spine,
24(24) :2607–2616, 1999.
[20] C.-E. Aubin, J. Dansereau, F. Parent, H. Labelle, and J. A. de Guise. Morphometric
evaluations of personalised 3d reconstructions and geometric models of the human spine.
Medical and Biological Engineering and Computing, 35(6) :611–618, 1997.
[21] D. Perie, C. E. Aubin, M. Lacroix, Y. Lafon, and H. Labelle. Biomechanical modelling
of orthotic treatment of the scoliotic spine including a detailed representation of the
brace-torso interface. Medical and Biological Engineering and Computing, 42 :339–344,
2004.

82
[22] J. Carrier, C.-E. Aubin, I. Villemure, and H. Labelle. Biomechanical modelling of
growth modulation following rib shortening or lengthening in adolescent idiopathic
scoliosis. Medical and Biological Engineering and Computing, 42(4) :541–548, 2004.
[23] Clin J., Aubin C.-E., Parent S., Ronsky J., and Labelle H. Biomechanical modeling of
brace design. Stud. Health Technol. Inform., 123 :255–260, 2006.
[24] J. Clin, C.-E. Aubin, and H. Labelle. Virtual prototyping of a brace design for the
correction of scoliotic deformities. Medical and Biological Engineering and Computing,
45(5) :467–473, 2007.
[25] J. Clin, C.-E. Aubin, S. Parent, A. Sangole, and H. Labelle. Comparison of the bio-
mechanical 3D efficiency of different brace designs for the treatment of scoliosis using
a finite element model. Eur. Spine J., 19(7) :1169–1178, 2010.
[26] J. Clin, C.-E. Aubin, S. Parent, and H. Labelle. A biomechanical study of the charleston
brace for the treatment of scoliosis. Spine, Publish Ahead of Print, 2010.
[27] J. Clin, C.-E. Aubin, H. Labelle, and S. Parent. Immediate correction in brace treat-
ment : how much is needed to obtain a long-term effectiveness ? In 8th Meeting of the
International Research Society of Spinal Deformities (IRSSD 2010), Montreal, Quebec,
Canada, 2010.
[28] M. Beausejour, C.E. Aubin, A.G. Feldman, and H. Labelle. Simulations de tests d’in-
flexion laterale a l’aide d’un modele musculo-squelettique du tronc. Annales de chirur-
gie, 53 :742–750, 1999.
[29] O. Dionne, K. C. Assi, S. Grenier, H. Labelle, F. Guibault, and F. Cheriet. Simulation
of the postoperative trunk appearance in scoliotic surgery. In International Symposium
On Biomedical Imaging, ISBI 2012, pages 1208–1211, 2012.
[30] U. Meier, O. Lopez, C. Monserrat, M. C. Juan, and M. Alcaniz. Real-time deformable
models for surgery simulation : a survey. Computer Methods and Programs Biomedicine,
77(3) :183–197, 2005.
[31] R. M. Koch, M. H. Gross, F. R. Carls, D. F. von Buren, G. Fankhauser, and Y. I. H.
Parish. Simulating facial surgery using finite element models. In Proceedings of the
23rd annual conference on Computer graphics and interactive techniques, pages 421–
428. ACM, 1996.

83
[32] R. M. Koch, S. H. M. Roth, M. H. Gross, A. P. Zimmermann, and H. F. Sailor. A
framework for facial surgery simulation. In Proceedings of the 18th spring conference
on Computer graphics, pages 33–42, 2002.
[33] D. Terzopoulos and K. Waters. Physically-based facial modeling, analysis, and anima-
tion. Journal of Visualization and Computer Animation, 1(2) :73–80, 1990.
[34] E. Keeve, S. Girod, and B. Girod. Craniofacial surgery simulation. In Visualization in
Biomedical Computing, pages 541–546. Springer : Berlin, 1996.
[35] W. Mollemans, F. Schutyser, J.V. Cleynenbreugel, and P. Suetens. Tetrahedral mass
spring model for fast soft tissue deformation. In Surgery Simulation and Soft Tissue
Modeling IS4TM 2003, LNCS 2673, pages 145–154. Springer : Berlin, 2003.
[36] M. Bro-Nielsen. Surgery simulation using fast finite elements. In VBC ’96 : Proceedings
of the 4th International Conference on Visualization in Biomedical Computing, pages
529–534. Springer-Verlag, 1996.
[37] S. Cotin, H. Delingette, and N. Ayache. Real-time elastic deformations of soft tissues
for surgery simulation. IEEE Transactions On Visualization and Computer Graphics,
5(1) :62–73, 1999.
[38] Matthias Muller, Julie Dorsey, Leonard McMillan, Robert Jagnow, and Barbara Cut-
ler. Stable real-time deformations. In SCA ’02 : Proceedings of the 2002 ACM SIG-
GRAPH/Eurographics symposium on Computer animation, pages 49–54. ACM, 2002.
[39] Guillaume Picinbono, Herve Delingette, and Nicholas Ayache. Real-time large displa-
cement elasticity for surgery simulation : Non-linear tensor-mass model. In MICCAI
’00 : Proceedings of the Third International Conference on Medical Image Computing
and Computer-Assisted Intervention, pages 643–652. Springer-Verlag, 2000.
[40] M. Chabanas, V. Luboz, and Y. Payan. Patient specific finite element model of the
face soft tissues for computer-assisted maxillofacial surgery. Medical Image Analysis,
7(2) :131–151, 2003.
[41] Liesbet Roose, Wim De Maerteleire, Wouter Mollemans, and Paul Suetens. Valida-
tion of different soft tissue simulation methods for breast augmentation. International
Congress Series, 1281 :485–490, 2005.
[42] R. Mahnken and E. Stein. A unified approach for parameter identification of inelastic
material models in the frame of the finite element method. Computer Methods in
Applied Mechanics and Engineering, 136(3-4) :225 – 258, 1996.

84
[43] R. Mahnken and E. Stein. Parameter identification for viscoplastic models based on
analytical derivatives of a least-squares functional and stability investigations. Inter-
national Journal of Plasticity, 12(4) :451 – 479, 1996.
[44] R. Mahnken and E. Stein. Parameter identification for finite deformation elasto-
plasticity in principal directions. Computer Methods in Applied Mechanics and En-
gineering, 147(1-2) :17 – 39, 1997.
[45] T. Seibert, J. Lehn, S. Schwan, and F.G. Kollmann. Identification of material pa-
rameters for inelastic constitutive models : Stochastic simulations for the analysis of
deviations. Continuum Mechanics and Thermodynamics, 12(2) :95 – 120, 2000.
[46] T. Harth, S. Schwan, J. Lehn, and F. G. Kollmann. Identification of material parame-
ters for inelastic constitutive models : statistical analysis and design of experiments.
International Journal of Plasticity, 20(8-9) :1403 – 1440, 2004.
[47] W. T. D’Arcy. On Growth and Form. Cambridge University Press, 1917.
[48] U. Grenander and M. I. Miller. Computational anatomy : an emerging discipline. Q.
Appl. Math., LVI(4) :617–694, 1998.
[49] Daniel P. Huttenlocher, Gregory A. Klanderman, Gregory A. Kl, and William J. Ruck-
lidge. Comparing images using the hausdorff distance. IEEE Transactions on Pattern
Analysis and Machine Intelligence, 15 :850–863, 1993.
[50] Guillaume Charpiat, Olivier Faugeras, and Renaud Keriven. Approximations of shape
metrics and application to shape warping and empirical shape statistics. Found. Com-
put. Math., 5(1) :1–58, 2005.
[51] Distance-Based Shape Statistics, volume 5, 2006.
[52] D.G. Kendall. Shape manifolds, procrustean metrics, and complex projective spaces.
Bulletin of the London Mathematical Society, 16(2) :81–121, 1984.
[53] F. L. Bookstein. Size and shape spaces for landmark data in two dimensions. Statistical
Science, 1(2) :181–242, 1986.
[54] Simone Ceolin, William A. P. Smith, and Edwin Hancock. Facial shape spaces from
surface normals and geodesic distance. In DICTA ’07 : Proceedings of the 9th Biennial
Conference of the Australian Pattern Recognition Society on Digital Image Compu-
ting Techniques and Applications, pages 416–423, Washington, DC, USA, 2007. IEEE
Computer Society.
85
[55] Simone Ceolin, William Smith, and Edwin Hancock. Facial shape spaces from surface
normals. In Image Analysis and Recognition, pages 955–965. 2008.
[56] C. R. Rao. Information and accuracy attainable in estimation of statistical parameters.
Bulletin of the Calcutta Mathematical Society, 37 :81–91, 1945.
[57] Shape analysis using the Fisher-Rao Riemannian metric : unifying shape representation
and deformation, 2006.
[58] Adrian M. Peter and Anand Rangarajan. Information geometry for landmark shape
analysis : Unifying shape representation and deformation. IEEE Transactions on Pat-
tern Analysis and Machine Intelligence, 31 :337–350, 2009.
[59] Simone Ceolin and Edwin R. Hancock. Using the fisher-rao metric to compute facial
similarity. In ICIAR (1), pages 384–393, 2010.
[60] J. Glaunes, A. Trouve, and L. Younes. Diffeomorphic matching of distributions : A new
approach for unlabelled point-sets and sub-manifolds matching. In In CVPR, pages
712–718, 2004.
[61] M. Vaillant and J. Glaunes. Surface matching via currents. In Proceedings of Infor-
mation Processing in Medical Imaging (IPMI 2005), number 3565 in Lecture Notes in
Computer Science, pages 381–392, 2005.
[62] J. Glaunes, A. Qiu, M. I. Miller, and L. Younes. Large deformation diffeomorphic
metric curve mapping. Int. J. Comput. Vision, 80(3) :317–336, 2008.
[63] S. Durrleman, X. Pennec, A. Trouve, and N. Ayache. Statistical models of sets of
curves and surfaces based on currents. Medical Image Analysis, 13(5) :793–808, 2009.
Includes Special Section on the 12th International Conference on Medical Imaging and
Computer Assisted Intervention.
[64] N. Acir and C. Guzelis. Automatic spike detection in eeg by a two-stage procedure
based on support vector machines. Computers in Biology and Medicine, 34(7) :561–
575, 2004.
[65] G.-Z. Li, J. Yang, C.-Z. Ye, and D.-Y. Geng. Degree prediction of malignancy in brain
glioma using support vector machines. Comput. Biol. Med., 36(3) :313–325, 2006.
[66] C. Bergeron, F. Cheriet, J. Ronsky, R. Zernicke, and H. Labelle. Prediction of anterior
scoliotic spinal curve from trunk surface using support vector regression. Eng. Appl.
Artificial Intell., 18(8) :973–983, 2005.

86
[67] J. Jaremko, P. Poncet, J. Ronsky, J. Harder, J. Harder, J. Dansereau, H. Labelle, and
R. Zernicke. Genetic algorithm-neural network estimation of cobb angle from torso
asymmetry in scoliosis. J. Biomech. Eng., 124(5) :496–503, 2002.
[68] L. Ramirez, N.G. Durdle, V.J. Raso, and D.L. Hill. A support vector machines classifier
to assess the severity of idiopathic scoliosis from surface topography. IEEE Trans. Inf.
Technol. Biomed., 10(1) :84–91, 2006.
[69] L. Seoud, M.M. Adankon, H. Labelle, J. Dansereau, and F. Cheriet. Prediction of
scoliosis curve type based on the analysis of trunk surface topography. In Biomedical
Imaging : From Nano to Macro, 2010 IEEE International Symposium on, pages 408–
411, 2010.
[70] T.M. Cover and P.E. Hart. Nearest neighbor pattern classification. IEEE Transactions
on Information Theory, IT-13 :21–27, 1967.
[71] T. M. Cover. Estimation by the nearest neighbor rule. IEEE Transactions on Infor-
mation Theory, IT-14(1) :50–55, 1968.
[72] L. Devroye, L. Gyorfi, A. Krzyzak, and G. Lugosi. On the strong universal consistency
of nearest neighbor regression function estimates. The Annals of Statistics, 22 :1371–
1385, 1994.
[73] S. R. Kulkarni and S. E. Posner. Rates of convergence of nearest neighbor estimation
under arbitrary sampling. IEEE Trans. Inf. Theory, 41 :1028–1039, 1995.
[74] G. Biau, F. Cerou, and A. Guyader. Rates of convergence of the functional k-nearest
neighbor estimate. IEEE Transactions on Information Theory, 56 :2034–2040, 2010.
[75] Kilian Weinberger, John Blitzer, and Lawrence Saul. Distance metric learning for large
margin nearest neighbor classification. In Y. Weiss, B. Scholkopf, and J. Platt, editors,
Advances in Neural Information Processing Systems 18, pages 1473–1480. MIT Press,
Cambridge, MA, 2006.
[76] K. Weinberger and L. Saul. Fast solvers and efficient implementations for distance
metric learning. pages 1160–1167, 2008.
[77] K.Q. Weinberger and L.K. Saul. Distance metric learning for large margin nearest
neighbor classification. Journal of Machine Learning Research, 10.
[78] C. Domeniconi, J. Peng, and D. Gunopulos. Locally adaptive metric nearest neighbor
classification. IEEE Trans. Pattern Anal. Mach. Intell., 24(9) :1281–1285, 2002.

87
[79] T. Hastie and R. Tibshirani. Discriminant adaptive nearest neighbor classification.
IEEE Trans. Pattern Anal. Mach. Intell., 18(6) :607–615, 1996.
[80] Y. Lee, D. Terzopoulos, and K. Waters. Realistic modeling for facial animation. In
SIGGRAPH ’95 : Proceedings of the 22nd annual conference on Computer graphics and
interactive techniques, pages 55–62, New York, NY, USA, 1995. ACM.
[81] S. Sarni, A. Maciel, R. Boulic, and D. Thalmann. Evaluation and visualization of
stress and strain on soft biological tissues in contact. In SMI ’04 : Proceedings of the
Shape Modeling International 2004, pages 255–262, Washington, DC, USA, 2004. IEEE
Computer Society.
[82] S. Delorme, Y. Petit, J. A. de Guise, H. Labelle, C.-E. Aubin, and J. Dansereau.
Assessment of the 3D reconstruction and high-resolution geometrical modeling of the
human skeletal trunk from 2D radiographic images. IEEE Transactions on Biomedical
Engineering, 50(8) :989–98, 2003.
[83] H. Si. Tetgen : A quality tetrahedral mesh generator and three-dimensional delaunay
triangulator. http ://tetgen.berlios.de/.
[84] J. R. Shewchuk. Tetrahedral mesh generation by delaunay refinement. In SCG ’98 :
Proceedings of the fourteenth annual symposium on Computational geometry, pages
86–95. ACM, 1998.
[85] M. Teschner, B. Heidelberger, M. Muller, and M. Gross. A versatile and robust model
for geometrically complex deformable solids. In Proceedings of the Computer Graphics
International, pages 312–319. IEEE Computer Society, 2004.
[86] J. L. Jaremko, P. Poncet, J. Ronsky, J. Harder, and J. Dansereau. Indices of torso
asymmetry related to spinal deformity in scoliosis. Clinical Biomechanics, 17(8) :559–
568, 2002.
[87] L. Seoud, F. Cheriet, H. Labelle, and J. Dansereau. A novel method for the 3d recons-
truction of scoliotic ribs from frontal and lateral radiographs. IEEE Transactions in
biomedical engineering, 58(5) :1135–1146, 2011.
[88] V. Pazos, F. Cheriet, J. Dansereau, Janet Ronsky, Ronald F. Zernicke, and Hubert
Labelle. Reliability of trunk shape measurements based on 3-d surface reconstructions.
European Spine Journal, 16(11) :1882–1891, 2007.

88
[89] R. Buchanan, J. G. Birch, A. A. Morton, and R. H. Browne. Do you see what I see ?
Looking at scoliosis surgical outcomes through orthopedists’ eyes. Spine, 28(24) :2700–
2704, 2003.
[90] Goran Devedzic, Sasa Cukovic, Vanja Lukovic, Danijela Milosevic, K. Subburaj, and
Tanja Lukovic. Scoliomedis : Web-oriented information system for idiopathic scolio-
sis visualization and monitoring. Computer Methods and Programs in Biomedicine,
108(2) :736–749, 2012.
[91] V. Pazos, F. Cheriet, H. Labelle, and J. Dansereau. 3d reconstruction and analysis of
the whole trunk surface for non-invasive follow-up of scoliotic deformities. Studies in
health technology and informatics, 91 :296–299, 2002.
[92] T.M.L. Shannon. Dynamic Surface Topography and Its Application to the Evaluation of
Adolescent Idiopathic Scoliosis. PhD thesis, Oxford Brookes University, Oxford, U.K.,
september 2010.
[93] Peter O. Ajemba, Nelson G. Durdle, and V. James Raso. Characterizing torso shape de-
formity in scoliosis using structured splines models. IEEE Trans. Biomed. Engineering,
56(6) :1652–1662, 2009.
[94] S. Li, W. Zhou, Q. Yuan, S. Geng, and D. Cai. Feature extraction and recognition
of ictal eeg using emd and svm. Computers in Biology and Medicine, 43(7) :807–816,
2013.
[95] A. Subasi. Classification of emg signals using pso optimized svm for diagnosis of neu-
romusculardisorders. Computers in Biology and Medicine, 43(5) :576–586, 2013.
[96] E. Comak, A. Arslan, and I. Turkoglu. A decision support system based on support
vector machines for diagnosis of the heart valve diseases. Computers in biology and
Medicine, 37(1) :21–27, 2007.
[97] S. Kiranyaz, T. Ince, J. Pulkkinen, M. Gabbouj, J. Arje, S. Karkkainen, V. Tirronen,
M. Juhola, T. Turpeinen, and K. Meissner. Classification and retrieval on macroinver-
tebrate image databases. Computers in Biology and Medicine, 41(7) :463–472, 2011.
[98] H. M. Muda, P. Saad, and R. M. Othman. Remote protein homology detection and fold
recognition using two-layer support vector machine classifiers. Computers in Biology
and Medicine, 41(8) :687–699, 2011.
[99] T. Hastie, R. Tibshirani, and Friedman. The elements of statistical learning.

89
[100] H. Hotelling. Analysis of a complex of statistical variables into principal components.
Journal of Educational Psychology, 24 :417—-441, 1933.
[101] B. Scholkopf, A.J. Smola, and K.-R. Muller. Nonlinear component analysis as a kernel
eigenvalue problem. Neural Computation, 10(5) :1299–1319, 1998.
[102] X. He and P. Niyogi. Locality Preserving Projections. Cambridge, MA, 2004. MIT
Press.
[103] X. He, D. Cai, S. Yan, and H.-J. Zhang. Neighborhood preserving embedding. In
Proceedings of IEEE International Conference on Computer Vision, volume 2, pages
1208–1213. IEEE, 2005.
[104] H. Wold. Soft Modeling by Latent Variables ; the Nonlinear Iterative Partial Least
Squares Approach. Perspectives in Probability and Statistics. Papers in Honour of M.
S. Bartlett, 1975.
[105] S. Wold, H. Ruhe, H. Wold, and W.J. Dunn III. The collinearity problem in linear
regression. the partial least squares (PLS) approach to generalized inverse. SIAM
Journal of Scientific and Statistical Computations, 5(3) :735–743, 1984.
[106] V. Pazos, F. Cheriet, L. Song, H. Labelle, and J. Dansereau. Accuracy assessment of
human trunk surface 3d reconstructions from an optical digitizing system. Medical and
Biological Engineering and Computing, 43(1) :11–15, 2005.
[107] J.A.K. Suykens, V.T. Gestel, J. De Brabanter, B. De Moor, and J. Vandewalle. Least
Squares Support Vector Machines. World Scientific, Singapore, 2002.
[108] S.-M. Huang and J.-F. Yang. Unitary regression classification with total minimum
projection error for face recognition. IEEE signal processing letters, 20(5) :443–446,
2013.
[109] B.L. Pellom, R. Sarikaya, and J.H.L. Hansen. Fast likelihood computation techniques
in nearest-neighbor based search for continuous speech recognition. IEEE Signal Pro-
cessing Letters, 8(8) :221–224, 2001.
[110] S. Marano, V. Matta, and P. Willett. Nearest-neighbor distributed learning by ordered
transmissions. IEEE Transactions on Signal Processing, 61(21) :221–224, 2013.
[111] Dor Kedem, Stephen Tyree, Kilian Weinberger, Fei Sha, and Gert Lanckriet. Non-linear
metric learning. In P. Bartlett, F.C.N. Pereira, C.J.C. Burges, L. Bottou, and K.Q.

90
Weinberger, editors, Advances in Neural Information Processing Systems 25, pages
2582–2590. 2012.
[112] B. Kulis. Metric learning : A survey. Foundations and Trends in Machine Learning,
5(4) :287–364, 2013.
[113] J. Devore and N. Farnum. Applied Statistics for Engineers and Scientists. Duxbury
Press, 1999.
[114] C.-E. Aubin, Y. Petit, I.A.F. Stokes, F. Poulin, M. Gardner-Morse, and H. Labelle.
Biomechanical modeling of posterior instrumentation of the scoliotic spine. Computer
Methods in Biomechanics and Biomedical Engineering, 6(1) :27–32, 2003.
[115] S. Cotin, H. Delingette, and N. Ayache. A hybrid elastic model allowing real-time
cutting, deformations and force-feedback for surgery training and simulation. The
Visual Computer, 16 :437–452, 2000.
[116] R. Harmouche, F. Cheriet, H. Labelle, and J. Dansereau. 3D registration of MR and
X-ray spine images using an articulated model. Computerized Medical Imaging and
Graphics, 36(5) :410 – 418, 2012.
[117] K.M Cheung and K.D Luk. Prediction of correction of scoliosis with se of the fulcrum
bending radiograph. J. Bone Joint Surg. Am., 79 :1144–1150, 1997.
[118] P. Debanne, V. Pazos, H. Labelle, and F. Cheriet. Evaluation of reducibility of trunk
asymmetry in lateral bending. In 8th Meeting of the International Research Society of
Spinal Deformities (IRSSD 2010), Montreal, Quebec, Canada, 2010.