Embed Size (px)
Citation preview

THE FORECLOSURE CRISIS
BAY AREA CASE STUDY

2
Overview
Research Focus Neighborhood Stabilization Program (NSP) Bay Area Demographics Foreclosures in Bay Area Areas Needing Assistance Take Aways Geographic Information System (GIS) Skills Data Sources Photo Credits

3
Research Focus
Focus: U.S. Department of Housing and Urban Development (HUD) Neighborhood Stabilization Program (NSP)
Case study: San Francisco-Bay Area
Research question: what areas have the greatest need for foreclosure assistance?

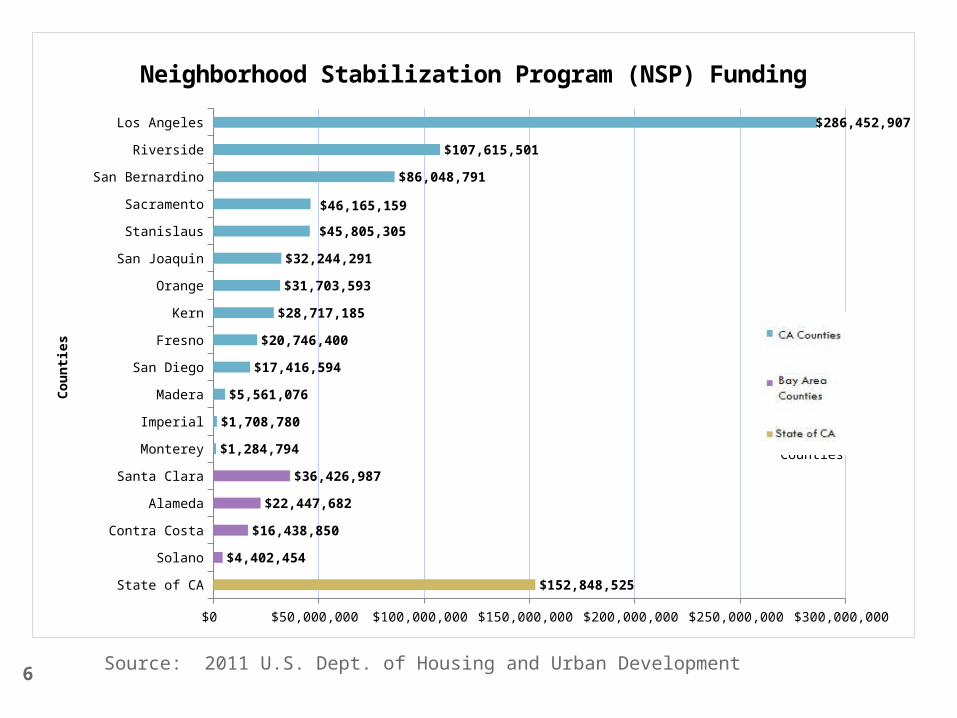
4 Note: State of California funding excluded.
NPS invested $7 billion of federal funds to mitigate “the impact of foreclosures through the purchase and rehabilitation of foreclosed, vacant properties in order to create more affordable housing and renew neighborhoods devastated by the economic crisis.”

5
NSP Summary
Created by the Housing and Economic Revitalization Act of 2009 (HERA)
Three rounds of NSP funding; two rounds of funds distributed by a formula and one round was a competitive application process
States, counties, cities, and nonprofits use NSP funds to purchase and/or rehabilitate foreclosed, blighted, or vacant properties
Households assisted must be 120% of area median income (AMI) and 25% of the grant must serve households below 50% AMI
6
State of CA
Solano
Contra Costa
Alameda
Santa Clara
Monterey
Imperial
Madera
San Diego
Fresno
Kern
Orange
San Joaquin
Stanislaus
Sacramento
San Bernardino
Riverside
Los Angeles
$0 $50,000,000 $100,000,000 $150,000,000 $200,000,000 $250,000,000 $300,000,000
$152,848,525
$4,402,454
$16,438,850
$22,447,682
$36,426,987
$1,284,794
$1,708,780
$5,561,076
$17,416,594
$20,746,400
$28,717,185
$31,703,593
$32,244,291
$45,805,305
$46,165,159
$86,048,791
$107,615,501
$286,452,907
Neighborhood Stabilization Program (NSP) Funding
Total NSP FundingC
ounti
es
Bay Area Counties
CA Coun-ties
Source: 2011 U.S. Dept. of Housing and Urban Development

7Source: 2000 U.S. Census
Data
Nine Bay Area Counties:
One of the areas hardest hit by the foreclosure crisis
Four counties received NSP funds: Alameda, Contra Costa, Santa Clara, and Solano
Five counties were not funded: Marin, Napa, San Francisco, San Mateo, and Sonoma

8
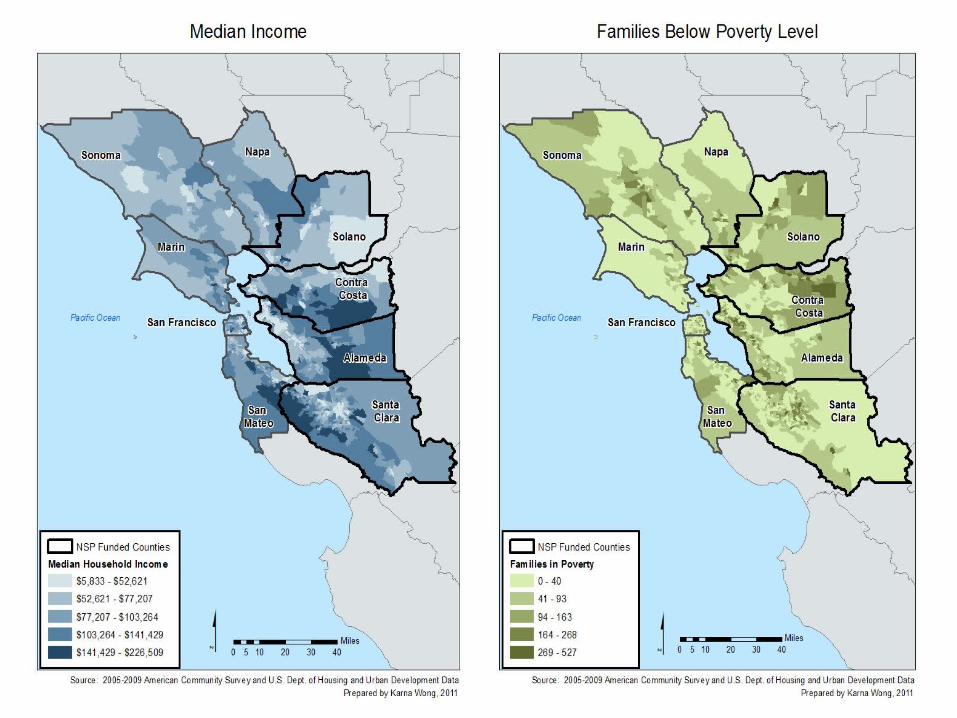
Bay Area Demographics
2005-2009 American Community Survey Data: Total Population Minority Population Families Below Poverty Level Median Household Income Median House Value Median Gross Rent

9

10

11
California Bay Area0
5,000,000
10,000,000
15,000,000
20,000,000
25,000,000
30,000,000
35,000,000
29,357,763
6,950,764
14,050,485 (39%)
2,982,924 (43%)
Total Population Minority Population
12

13
8,333,69
0
1,618,138 (10%)
Poverty in California
Total FamiliesFamilies Below Poverty Level
819,788
102,517 (6%)
Poverty in Bay Area
Total FamiliesFamilies Below Poverty Level

14
Bay Area Housing Data
The Bay Area is expensive:
Bay Area residents earn 25% more than other Californians
Home values in the Bay Area are 29% higher than other places in California
California Bay Area$0
$100,000
$200,000
$300,000
$400,000
$500,000
$600,000
$700,000
$60,392 $75,627
$479,200
$617,441
Income and House ValuesMedian Income Median House Value
Source: 2005-2009 American Community Survey Data
15
HOUSE VALUES:CA median house value $479,200Bay Area median house value $617,441Bay Area house values average $138,241 (29%) higher than CA
RENT:CA median rent $1,116Bay Area median rent $1,273Bay Area rents average $157 (14%) higher than CA
Note: some areas have no renters and are categorized as $0 rent areas
17

18
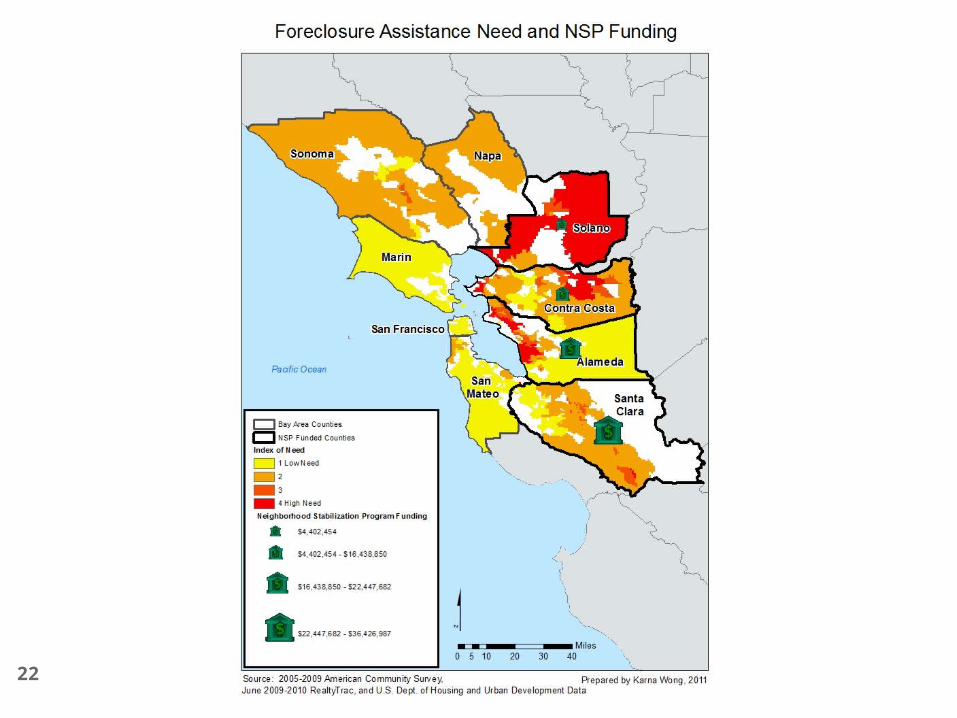
Where is the greatest need?
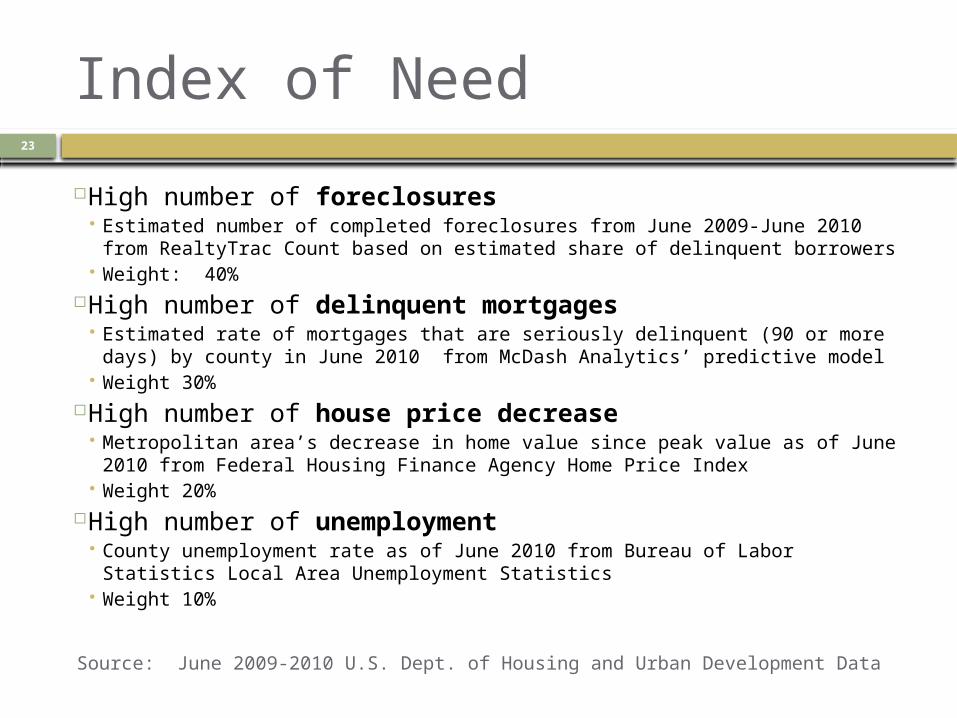
Variables to identify need:
High number of foreclosures
High number of delinquent mortgages
High percentage of house price decrease
High percentage of unemployment
Source: June 2009-2010 U.S. Dept. of Housing and
Urban Development Data
BAY AREA COUNTIES
OTHER CA COUNTIES
TOTAL CA0
50,000
100,000
150,000
200,000
250,000
300,000
350,000
21,054
173,392
194,446
34,256
290,496
324,752
California Housing Data 2009-2010
Foreclosures Delinquent Mortgages
19
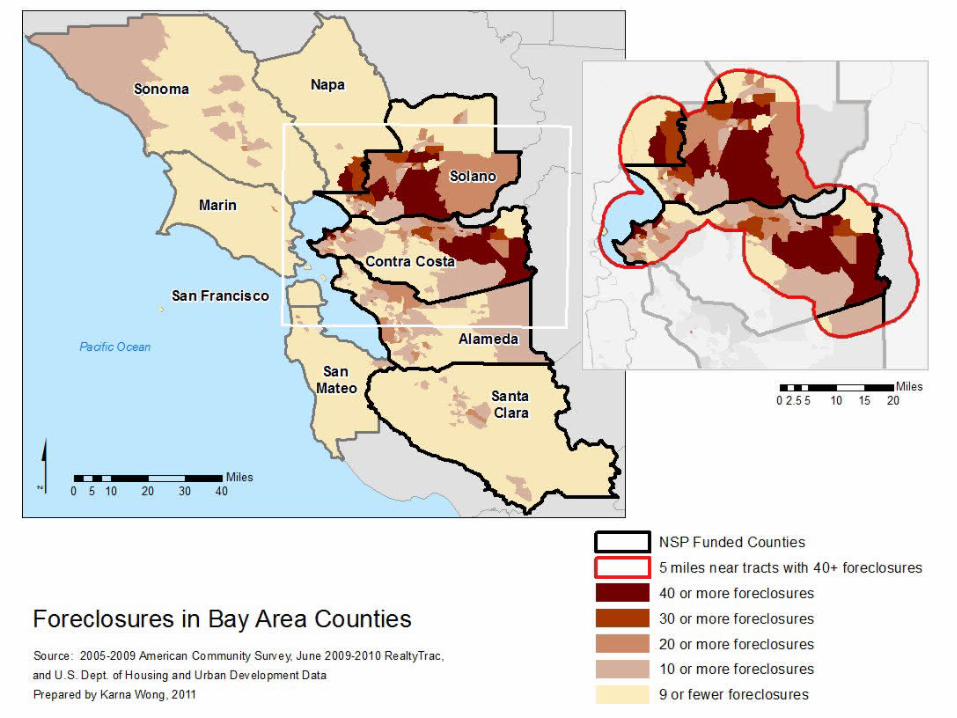
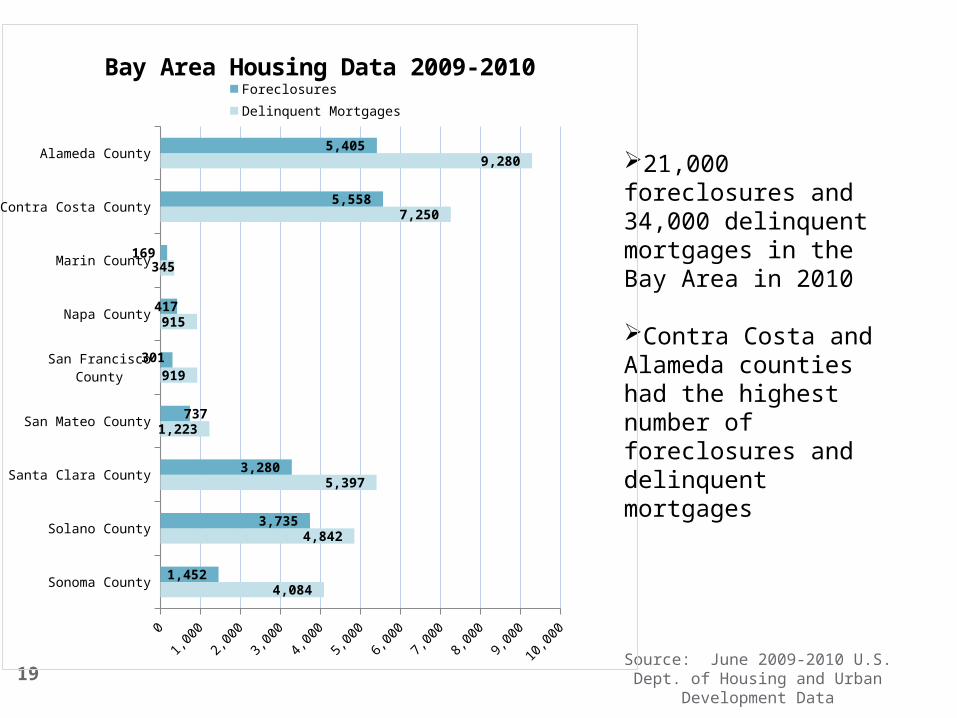
21,000 foreclosures and 34,000 delinquent mortgages in the Bay Area in 2010
Contra Costa and Alameda counties had the highest number of foreclosures and delinquent mortgages
Source: June 2009-2010 U.S. Dept. of Housing and Urban
Development Data
Sonoma County
Solano County
Santa Clara County
San Mateo County
San Francisco County
Napa County
Marin County
Contra Costa County
Alameda County
0 1,000 2,000 3,000 4,000 5,000 6,000 7,000 8,000 9,00010,000
4,084
4,842
5,397
1,223
919
915
345
7,250
9,280
1,452
3,735
3,280
737
301
417
169
5,558
5,405
Bay Area Housing Data 2009-2010Foreclosures Delinquent Mortgages

20Sonoma County
Solano County
Santa Clara County
San Mateo County
San Francisco County
Napa County
Marin County
Contra Costa County
Alameda County
0% 2% 4% 6% 8% 10% 12% 14%
10%
12%
11%
9%
9%
9%
8%
11%
12%
Bay Area Unemployment Rate 2009-2010
Sonoma County
Solano County
Santa Clara County
San Mateo County
San Francisco County
Napa County
Marin County
Contra Costa County
Alameda County
-60% -50% -40% -30% -20% -10% 0%
-33%
-48%
-23%
-18%
-18%
-36%
-18%
-31%
-31%
Bay Area Change in Home Value 2009-2010
Bay Area counties’ average home value decrease was -28%Solano County had the largest decrease (-48%) in home value
Bay Area counties’ average unemployment rate was 10%Alameda and Solano Counties had the highest unemployment rate (12%)
Source: June 2009-2010 U.S. Dept. of Housing and Urban
Development Data

21
22
23
Index of Need
High number of foreclosures Estimated number of completed foreclosures from June 2009-June 2010
from RealtyTrac Count based on estimated share of delinquent borrowers Weight: 40%
High number of delinquent mortgages Estimated rate of mortgages that are seriously delinquent (90 or more
days) by county in June 2010 from McDash Analytics’ predictive model Weight 30%
High number of house price decrease Metropolitan area’s decrease in home value since peak value as of June
2010 from Federal Housing Finance Agency Home Price Index Weight 20%
High number of unemployment County unemployment rate as of June 2010 from Bureau of Labor Statistics
Local Area Unemployment Statistics Weight 10%
Source: June 2009-2010 U.S. Dept. of Housing and Urban Development Data

24

25
Take Aways
NSP funded Bay Area counties with high foreclosure rates
Other variables are indicators of foreclosure assistance need
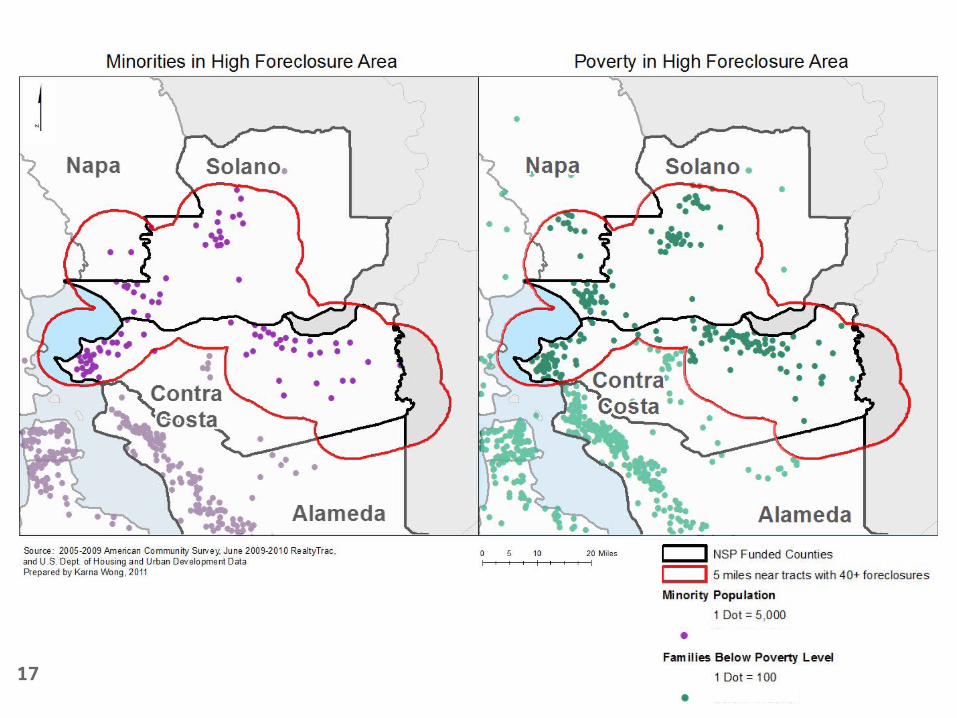
Solano, Contra Costa, and Alameda counties have the highest need for assistance
NSP funded Santa Clara County with the most funding
Policy impact: foreclosure prevention assistance is needed

26
Summary of GIS Skills
1. Inset Map2. Point Graduated
Symbol3. Aggregating
Attribute Data4. Attribute Sub-sets
Selections5. Boundary Sub-sets
Selections
6. Geoprocessing layers
7. Modeling8. Metadata9. Measurement/
Analysis10. Original Data11. Charts and Images12. Hotspot Analysis

27
GIS Modeling

28
Data Sources
2000 U.S. Census and 2005-2009 American Communities Survey
Original data sources: HUD data reflecting housing market
conditions between June 2009-2010 includes RealtyTrac data on foreclosures; concatenated state, county, and census tract codes for geocoding
HUD data as of January 2011 regarding NSP funding for states, counties, cities and nonprofits; aggregated by county (refer to metadata screen shot)

29
Metadata

30
Photo Credits
Slide #1 – The Los Angeles Times, December 18, 2007, Location: Palmdale, CA
Slide #1 - David Butow, The Los Angeles Times, January 6, 2011, Location: Stockton, CA
Slide #3 – Jonathan Alcorn, The Los Angeles Times, March 10, 2011 Location: Los Angeles, CA
Slide #30 - The Los Angeles Times, March 10, 2007, Location: unknown
Presentation by:Karna WongUCLA March 2011GIS 206A Professor Kawano