Embed Size (px)
Citation preview

l

THE FOUNDATION FOR DEVELOPMENT COOPERATION
Transaction Costs of Lending to the Poor
A Case Study of Two Philippine Non-governmental Organisations
Gilberto M. Llanto and Ronald T. Chua

Published by
THE FOUNDATION FOR DEVELOPMENT COOPERATION LTD A.C.N. 011 025 997
232 Adelaide Street, Brisbane, Australia (PO Box 10445 Adelaide Street, Brisbane QLD 4000, Australia) Telephone 61-7-3236 4633 Facsimile 61-7-3236 4696
©The Foundation for Development Cooperation
First published 1996
This book is copyright. Apart from any fair dealing for the purpose of private study, research, criticism or review, as permitted under the Copyright Act, no part may be produced by any pf9cess without written permission from the publisher.
National Library of Australia Cataloguing-in-Publication entry:
Llanto, Gilberto.
Transaction costs oflending to the poor : a case study of two Philippine non-governmental organisations.
Bibliography. ISBN 0 9586728 1 4.
1. Credit - Philippines - Case studies. 2. Banks and bankingPhilippines - Costs - Case studies. 3. Transaction costs - Case studies. 4. Poor - Philippines - Case studies. 5. Non-governmental organizations - Philippines - Case studies. I. Chua, Ronald T. II. Foundation for Development Cooperation. III. Title.
332.175309599
Manuscript editor Barbara Henson
Typeset and printed by Merino Lithographies Pty Ltd
ii

Foreword The Foundation for Development Cooperation is pleased to present this second report in a series dealing with the transaction costs of lending to the poor. Whereas the earlier study dealt with lending in rural India, and focused particularly on the cost structures of banks engaged in such lending,* this second study is concerned with the Philippines, with a primarily urban clientele, and with the cost structures of non-governmental organisations (NGOs). Both studies, however, focus on the delivery of credit to the poor by means of linkages between commercial banks, NGOs and self-help groups of the poor.
Issues of continuing mass poverty, in Asia and elsewhere, of the lack of access to credit for the poor, and of the potential for credit to enable the poor to help themselves, are becoming more widely understood. The establishment by the World Bank of a Consultative Group to Assist the Poorest, focusing on microfinance as a means of poverty alleviation, marks new international recognition of the importance of providing the poor with access to financial services.
The Foundation for Development Cooperation (FDC), which initiated the Banking with the Poor program of research and advocacy in 1990, applauds this act of leadership which has focused the attention of donors and governments on issues of microfinance. The Foundation offers this report as a contribution to understanding of best practice in this important field.
Our pleasure in seeing it appear, however, is not without sadness, because of the close involvement of FDC's late Founder, K. William Taylor, AO (1926-1995) in its production. Bill Taylor's involvement with the NGOs whose work is studied in this report goes back to 1986, when he was a member of an official Australian mission which designed the Philippines-Australia Community Assistance Program. Subsequently, he helped to establish and fund six NGOs which are now members of the APPEND group (Association of Philippine Partners in Enterprise Development).
These include ASKI and KMBI, the subjects of this study. Both NGOs have subsequently attended all three of the Foundation's Asia-Pacific regional workshops on Banking with the Poor, and are members of the BWf P Network of commercial banks and microfinance NGOs from eight Asian countries. Bill Taylor's concern for the ultimate success of their efforts to achieve sustainable operations prompted this study, and he worked closely with the authors, Gilbert Llanto and Ronald Chua, during its conduct.
The study was presented initially at the Foundation's Third Regional Workshop in Brisbane in November 1994. The workshop, and the conduct of the study itself, were supported by the United Nations Development Programme under project RAS/92/006 (Regional Poverty Alleviation Programme). The Foundation as an implementing agency for this activity was
* V. Puhazhendhi, Transaction Costs of Lending to the Rural Poor: Non-governmental Organisations and Self-help Groups of the Poor as Intermediaries for Banks in India, The Foundation for Development Cooperation, 1995.
iii

Tr11ru11etion Co1ts of unJing to the Poor: Philippine NG<A
responsible to the Asian and Pacific Development Centre in Kuala Lumpur, as executing agency for RAS/92/006.
More recently, the Foundation has received further support from the Asian Development Bank, under a technkal assistance grant for review of microenterprise development in selected developing member countries of the Bank. This, and the earlier support of UNDP, are both acknowledged with gratitude.
The authors acknowledge the cooperation of the executive directors and staff of both KMBI and ASKI, particularly Noel Alcaide of KMBI, and Rolando Victoria and Felix Bumanlag of ASKI.
John D. Conroy 8June 1996
Executive Director The Foundation for Development Cooperation
iv

Contents Foreword iii
About the authors viii
Acronyms ix
Executive summary x
1 Introduction 1
2 Research &amework 5 2.1 Objectives of the study 5 2.2 Estimation procedure 5
2.2.1 N<:;Olevel 8 2.2.2 Borrower level 9 2.2.3 Bank level 9
2.3 Data sources 9 2.4 Scope and limitations 9
3 Brief review of literature on transaction costs 11 3.1 Existing research 11 3.2 The present study 12
4 Analytical &amework 13
5 Profde of NGO/SHG microlending programs to the poor 16 5.1 N(;O profile 16 5.2 N<:;O lending programs 20
5.2.1 Program areas of operation 21 5.2.2 Program features 21
5.3 Borrower profile, microenterprise loan experience and impact 27
6 Profde of bank and cooperatives 31 6.1 Areas of operation 31 6.2 Organisational profile 31 6.3 Borrower profile 34 6.4 Lending policies, terms and conditions 38
7 Transaction costs of lending to the poor 39 7 .1 Transaction costs of banks 39
7 .1.1 Total transaction costs 40 7 .1.2 Transaction costs by activity 41 7 .1.3 Composition of lending costs 41 7.1.4 Transaction costs per loan account granted 43 7 .1.5 Transaction costs per peso of loans granted 43 7 .1.6 Transaction costs per peso of loans outstanding 44
7.2 Transaction costs of cooperatives 46 7.2.1 Total transaction costs 46 7 .2.2 Transaction costs by activity 46
v

Transaction Costs of Leruling to the Poor: Philippitu NGOs
7.2.3 Composition oflending costs 47 7.2.4 Transaction costs per loan account granted 47 7.2.5 Transaction costs per peso ofloans granted 47 7.2.6 Transaction costs per peso ofloans outstanding 47
7.3 Transaction costs ofNGOs 48 7.3.1 Total transaction costs 48 7.3.2 Transaction costs by activity 50 7.3.3 Composition oflending costs 50 7.3.4 Component of self-help group promotion and development activities 51 7.3.5 Transaction costs per loan account granted 53 7.3.6 Transaction costs per peso ofloans granted 53 7.3.7 Transaction costs per peso of loans outstanding 53
7.4 Factors affecting transaction costs 54 7.5 Viability ofNGOs' lending to the poor: implications for the linkage
approach 58 7.5.1 A formula for viability 58 7.5.2 Preconditions for the success of the linkage approach 60
7 .6 Borrower transaction costs 60 7.6.1 Borrower level transaction costs 61 7.6.2 Borrower and centre/group officer time 64
8 Conclusions and recommendations 66 8 .1 Overall issues 66 8.2 Specific recommendations 67
Bibliography 69
About The Foundation for Development Cooperation 71
Tables
1 NGO operational highlights 17 2 NGO financial highlights: statement of condition 18 3 NGO financial highlights: statement of receipts and disbursements 19 4 Profile of sample members ofNGOs 26 5 Distribution of NGO borrowers by features oflatest loan 28 6 Comparative profile of intermediaries reviewed 31 7 Assets, liabilities and networth of sample intermediaries 32 8 Income and expenses of sample intermediaries 34 9 Client types provided/serviced with loans by banks in 1989, by type of bank 35
10 Profile of sample clients of banks and NBFis 36 11 Distribution of respondent borrowers of banks and NB Fis, by features of
latest loan 37 12 Operational highlights, by type of financial intermediary 40 13 Average transaction costs, by activity, by type of financial intermediary 42 14 Component of lending costs, by activity, by type of financial intermediary 43 15 Transaction costs per loan account granted, by activity, by type of financial
intermediary 44
vi

16 Transaction costs per peso of loans granted, by activity, by type of financial intermediary 45
Contents
17 Transaction costs per peso ofloans outstanding, by activity, by type of financial intermediary 45
18 NGO lending program highlights 49 19 Component oflending activities, NGOs 51 20 Component of SHG promotion costs 52 21 Transaction cost scenarios: KMBI 57 22 Borrower transaction costs 61 23 Time spent by NGO clients in group activities 62 24 Borrower transaction costs, by type of lending institution: banks and NB Fis 64
Note Financial amounts in this volume are calculated at 1 US$= 26.15 Phil. pesos.
vii

About the authors Gilberto L. Llanto gained his PhD in economics from the University of the Philippines in 1987. He is a Research Fellow of the Philippines Institute for Development Studies in Manila and holds a professorial appointment in the Graduate School of Business and Economics of De La Salle University.
A former Executive Director of the Agricultural Credit Policy Council of the Philippines, Dr Llanto is an extremely experienced researcher of banking and rural credit issues. His broader research interests include fiscal policy, development economics and international finance.
Gilberto Llanto has been a consultant to the Philippines Senate and to a number of international agencies, including the World Bank, FAO, the Asian Development Bank and the United Nations Development Programme.
Ronald T. Chua has recently returned to the academic staff of the Asian Institute of Management in Manila, from which institution he gained a Master's degree in Business Management in 1986.
At AIM he will continue to teach, research and consult in the areas of microenterprise development and microfinance which (along with broader issues of community development) were among his major interests during a three-year term (1993-96) as Managing Director of the Centre for Community Transformation (CCT).
The Centre is a member of the APPEND group (Association of Philippine Partners in Enterprise Development) which includes ASKI and KMBI, the two NGOs studied in this report.
viii

ASKI
BPI
COOP
CRB
DBP
FC
FDC
GC
KMBI
LBP
LC
LTC
NBFI
NGO
oc PAB
PA CAP
PKB
PNB
PO
RB
SGB
SHG
UKMA
Acronyms Alalay sa Kaunlaran sa Gitnang Luzon Inc.
Bank of the Philippine Islands
cooperative
cooperative rural bank
Development Bank of the Philippines
funds mobilisation costs
The Foundation for Development Cooperation
general administration costs
Kabalikat para sa Maunlad na Buhay Inc.
Land Bank of the Philippines
lender costs
lender transaction costs
non-bank financial intermediary
non-governmental organisation
other operational costs
Philippine Amanah Bank
Philippines""'."Australia Community Assistance Program
private commercial bank
Philippine National Bank
people's organisation
rural bank
special government bank
self-help group
Ugnayan ng mga Kristiyanong Mangangalakal
ix

Executive summary
Background
In recent years, there has been increased focus on lending to the poor. One landmark study was The Foundation for Development Cooperation's major report, Banking with the Poor (1992). The study found that the poor are good credit risks-given opportunity and motivation, they are fully bankable. It also found that banks can meet the credit needs of the poor on a commercially sound basis by adopting appropriate delivery systems, using non-governmental organisations (NGOs) and self-help groups (SH Gs) as financial 'middlemen'.
In the Philippines, the government has recognised the importance of access to credit as a poverty alleviating strategy, and has attempted to address the issue by enacting laws that require banks to earmark a portion of their resources for lending to special sectors. On a broader front, the importance of credit in poverty alleviation was recognised by a landmark Social Pact on Credit forged in the first half of 1993 by a multi-sectoral group of banks, government institutions, cooperatives and farmers' groups. The Pact acknowledged the weakness of the current financial system to meet the credit needs of the majority and, in particular, the poor. This has led to an increased interest among banks to explore alternative ways of delivering credit to the poor.
Several initiatives have been tested to explore alternative ways of delivering credit to the poor. A key approach that has been evolved is the bank-NGO-SHG-poor linkage. This approach consists of successive layers of a principal-agency relationship where (I) a bank lends to an NGO; (2) the NGO lends to an SHG; and finally (3) the SHG lends to individual members of the group. Under this approach, the NGO or SHG secures loanable funds from various sources, including a bank, and acts as a credit intermediary to reach individual poor borrowers. This approach works under the assumption that the agency in each of the successive layers has comparative advantage over its principal in lending to the poor, thus minimising transaction costs. This, in turn, contributes to the viability and sustainability of lending to the poor.
This study attempts to determine and quantify the components of transaction costs of lending to the poor through linkages. More specifically, it aims to address the following issues:
• What are the costs ofNGOs/SHGs in lending to the poor?
• How do they compare with banks' direct lending to poor individuals?
• Are they able to cover their costs?
• What are key factors affecting transaction costs?
• What can be done to reduce transaction costs further?
• Can lending to the poor be viable and sustainable?
• What measures must be undertaken at both the organisational and national policy level towards the development of a viable and sustainable financial market for the poor?
x

Executive summary
Methodology of the study
For the subjects of our study, we focused on the credit programs of two NGOs which target the poor using SHGs as delivery channels: Kabalikat para sa Maunlad na Buhay Inc. (KMBI}, and Alalay sa Kaunlaran sa Gitnang Luzon Inc. (ASKI). These two NGOs are part of the Bank of the Philippine Islands bank-NGO/SHG linkage program.
The process oflending to the poor using self-help groups has several important features which differentiate it from the usual retail lending of banks and even of cooperatives. The significant differences noted include a deliberate focus on the poor, the organising of client/members into groups, the use of group mutual accountability and peer pressure as a substitute for traditional physical collateral, and lending in very small amounts over relatively short maturities with weekly repayments.
In the estimate of costs, lender transaction costs were defined by the equation:
LTC = LC+ FC + GC + OC where
LTC LC FC GC oc =
lender transaction costs lending costs funds mobilisation costs general administration costs other operational costs
In the case of the NGOs, the identification and formation of SH Gs was included as a separate activity grouping in the equation. The costs allocation method was used to estimate transaction costs. All staff of the NGO involved directly and indirectly in lending were asked to complete a time allocation chart of activities classified according to the transaction costs equation. Borrower transaction costs were estimated through interviews with program beneficiaries.
The results of a study by Casuga (1994) on transaction costs of banks and non-bank financial intermediaries were used to compare the transaction costs of these intermediary types with NGO transaction costs. To allow for differences in scale of operations, the transaction cost estimates were compared across intermediary types using the following ratios:
• transaction costs per loan account granted
• transaction costs per peso ofloans granted
• transaction costs per peso of loans outstanding
Comparisons of transaction costs
While the commercial banks had lower costs than the rural banks, they had much higher average loan sizes. Transaction coses per peso ofloans granted and per peso ofloans outstanding for the commercial banks were Ps 0.061 and Ps 0.080 respectively, substantially lower than the Ps 0.151 per peso ofloans granted and Ps 0.121 per peso ofloans outstanding for the rural banks. However, the commercial banks had an average loan size of Ps 149,000, compared with only Ps 13,000 for the rural banks.
xi

Trttnst#tion Costs of Lending to the Poor: Philippine NGO.
Credit cooperatives had much higher transaction costs per peso of loans granted of Ps 0.371, compared to Ps 0.185 for multi-purpose cooperatives. The credit cooperatives had the lowest transaction costs per peso of loans outstanding at Ps 0.063. However, the very high estimate for loans outstanding indicates either a predominance of long-term loans or problems with collections, requiring caution in using the loans outstanding figure.
KMBI/UKMA had total transaction costs per peso of loans granted of 0.140 while ASKI had costs of 0.471. KMBI/UKMA's transaction costs per peso ofloans granted compare quite well with the other intermediaries. The ratio was second only to that of the private commercial banks, and was lower than those of the rural banks, the cooperative rural banks, the special government banks, the credit cooperatives and even the multi-purpose cooperatives. This is in spite of the inclusion of the SHG promotion component in the total costs.
The situation changes when we use transaction costs per peso ofloans outstanding. From transaction costs per peso ofloans granted of Ps 0.140, KMBI/UKMA'.s costs per peso of loans outstanding increased to Ps 0.340. For ASKI, the increase was from Ps 0.471 per peso of loans granted to Ps 0.836 per peso of loans outstanding. While these costs are high in comparison with the other intermediary types, there are differences in the average loan size and the average loan maturity period. To provide a more or less equal basis for comparison, it would be necessary to adjust for average loan sizes and maturities.
Factors affecting transaction costs
The comparison of the different types of financial intermediaries highlighted several key factors that affect transaction costs. Based on our cost comparisons, we noted an inverse relationship between an organisation's transaction costs and its number of years in existence. This results from an organisation's capacity to learn and develop. As the NGO programs were relatively new compared with those of the banks and cooperatives, there is much room for the NGOs involved in lending to the poor to improve their transaction costs over time.
In lending to the poor, the credit requirements and situation of this segment define some of the critical lending policies, terms and conditions. Specifically, it is necessary to lend out in very small loans, at relatively short-term maturities, with a higher frequency of loan repayment (that is, daily or weekly as against monthly or quarterly), and without requiring traditionally accepted forms of collateral (for example, land or chattels). Furthermore, to reach the poor effectively and minimise borrower transaction costs, the lender has to go to where the borrowers are rather than the other way around. These conditions combine to make lending to the poor a very labour-intensive process. Our review of the NGOs' lending costs confirms this labour intensity.
Measures to increase productivity
These factors mean that ifNGOs' lending programs are to be commercially viable and sustainable, high productivity is very important. The optimum ratios in terms of number of clients to staff and number of loan accounts to staff will have to be worked out and targeted. High worker productivity also requires a short start-up time and a quick build-up
xii

Executive summary
to the optimum number.of members per field worker. Since training costs form a substantial part of NGO budgets, this means that better, more cost-effective and faster ways of training and motivating field workers must be developed. As substantial social investments are made for a prospective member and borrower, the retention rate of members is also a critical aspect of worker productivity. A high retention rate will also eventually result in higher average loan sizes and thus lower overall transaction costs.
Key ways of improving worker productivity would include the introduction of simpler methods or more creative use of the data processing and information handling potential of computer technology. Another way to reduce transaction costs substantially is for NGOs to wholesale to groups in the same way that the commercial banks are encouraged to work through NGOs. This approach, however, is dependent on the success of the NGOs' SHG building and organising efforts. Through all of these, the lending intermediary has to balance productivity and efficiency with the risk of default.
Our review of NGO viability based on KM Bi's experience shows that with an increased loan size of Ps 10,000 and a member to staff ratio of 200, total transaction costs (excluding SHG promotion and development costs) can be reduced from the current 35 per cent of average loans outstanding to 17 per cent. With a reduced default rate of 5 per cent and the cost of funds set at 12 per cent, total lender costs would be 34 per cent which is one percentage point lower than the current earnings on loans outstanding ratio of 35 per cent. Thus, KMBI's lending to the poor can be a viable proposition if its group building efforts are funded externally and productivity is increased.
Borrower transaction costs
On borrower transaction costs, we found that the cash outlay incurred by borrowers consists primarily of transportation expenses. During the pre-loan stage the costs ranged from zero to 1.3 per cent of loan principal. Office-holders incurred slightly higher expenses due to their additional responsibilities. Post-loan cash expenses also consisted primarily of transportation expenses incurred in attending weekly meetings, and ranged from 0.3 per cent to 4.6 per cent ofloan principal.
Borrowers/members of both KMBI's UKMAandASKI's PACAP programs also invested substantial amounts of time in terms of attendance at weekly meetings. Pre-loan time ranged from 16 hours for KMBI to 40 hours for ASKI, and post-loan time ranged from 12 hours to 196 hours per year. As expected, office-holders spent more time than the regular members because of their additional responsibilities. Interviews, however, indicated that the time thus spent also had other non-quantifiable value for them in terms of camaraderie and mutual encouragement.
Recommendations
(1) The government must seriously consider funding the SHG formation costs, as a means of reducing the transaction costs of lending to the poor. By corollary, the government must allocate resources for pro-poor programs which will enhance their creditworthiness and viability as borrowers.
xiii

Transaction Cosu of Lending to the Poor: Philippine NG<h
(2) The NGOs must continue with their market-based financial intermediation.
(3) The NGOs should continue to work towards increasing volumes and worker productivity.
(4) The NGOs must explore the potential of mobilising more savings (deposits) as an alternative to bring down the cost of funds. In this regard, there is a need to review and possibly formulate an appropriate regulatory and empowering framework for savings mobilisation.
(5) The NGOs must also diversify their loan portfolios.
(6) The NGOs must invest in improved technology for record keeping, report writing and loan monitoring. The advent of cheap computer technology makes this an immediately realisable goal.
(7) The NGOs must be prepared to turn over to self-help groups some of the responsibilities in loan processing, monitoring and retailing of loans.
(8) The NGOs and the banks must have mutual cooperation in the areas of training and consultancy services to strengthen and improve the capabilities ofNGOs further. Areas for common collaboration include loans processing, record keeping, management of information and financial management techniques-for example, product profitability models of banks.
(9) The donors must continue to support the NGOs, especially in the following areas: professionalisation of management and administration; acquisition and installation of appropriate computer technology for efficient loan transactions; and funding assistance for institution building.
xiv

Chapter 1 INTRODUCTION
Background to microcredit
The Foundation for Development Cooperation's major regional project, Banking with the Poor, was based on action research by leading commercial banks and non-governmental organisations in eight Asian countries in 1991-92. Key findings of the project included the following:
(1) the poor are good credit risks; given opportunity and motivation, they demonstrate good savings performance, and are fully bankable
(2) their main problem is whether credit is available, rather than what it costs
(3) given better access to credit, the poor are willing and able to help themselves
(4) women borrowers, especially women organised in groups, have proved to be the most reliable and effective borrowers
(5) non-governmental organisations and self-help groups are providing better access to credit for the poor; they can mobilise group savings, provide group insurance instead of collateral, reduce the operating costs of banks, and achieve high repayment rates on loans
(6) banks can meet the credit needs of the poor on a commercially sound basis by adopting appropriate delivery systems, using non-governmental organisations (NGOs) and self-help groups as financial 'middlemen'
(7) governments and central banks in developing countries, international agencies and financial institutions involved in development cooperation, and donor governments, should all adopt policies and practices supponing the provision of credit for the very poor (Foundation for Development Cooperation 1992).
The findings of the Banking with the Poor study provide very important information on the experience of various organisations engaged in lending to the poor, and highlight a fresh and significant approach to the issue of poverty alleviation. Rather than welfare and subsidies, the study revealed that the poor would prefer access to credit as a means to free themselves from extreme poverty. 1 The study reports that income-earning opportunities are enhanced by access to credit. Conversely, the lack of credit constrains the growth opportunities of the poor. The lack of access to credit is due to, among other reasons, the high transaction costs of small loans and the poor's inability to provide acceptable collateral.
In the Philippines, the importance of access to credit as a poverty-alleviating strategy was recognised in the first half of 1993 by a landmark Social Pact on Credit, forged among a
Informal credit is provided by moneylenders, but the lack of an alternative source may motivate opportunistic behaviour on the part of these lenders.
1

Transaction Costs of !Anding to the Poor: Philippi1U! NGOs
multi-sectoral group composed of government agencies, government financial institutions, private banks, cooperative rural banks, and farmers' groups. The Pact acknowledged the weaknesses of the current financial system in m~eting the diverse credit needs of the majority, more particularly the poor. It set for its goal the 'establishment of a countryside financial system that is efficient, effective, and responsive to the financing (credit) and development needs of the countryside'. The Pact articulated a basic philosophy on credit which included the recognition that credit represented access to opportunity and resources, and that credit was not only a privilege but a right to equal opportunity, which should enable the poor to improve their well-being.
The Pact recognised the role of non-governmental organisations (NGOs) in providing the poor with better access to credit. Specifically, the Pact emphasised that parallel with a credit assistance program, 'adequate social preparation, capability building and value formation programs must be instituted among the target beneficiaries'. It advocated a three-faceted strategy of improving access to credit, one of which was the strengthening of credit schemes for the ultra-poor currently being implemented by NGOs (such as those adapting the approach pioneered by the Grameen Bank in Bangladesh).
Recent developments in the Philippines have sparked the interest of banks in exploring alternative ways of delivering credit to the poor. There is an increased awareness that a society characterised by deep inequities in wealth and income distribution does not have a stable foundation for sustained growth. Indeed, the inequitable income distribution and the concomitant poverty result in political instability which damages the country's growth prospects. Such instability is bad for business and reduces bank profits.
At the same time, there is increased pressure from the government on the banks to pay attention to the credit requirements of specific sectors of the economy through such instruments as the recently enacted Magna Carta for Small and Medium Enterprises, Magna Carta for Small Farmers and similar instruments (Agriculture-Agrarian Reform loan quota and others). On the other hand, the experience of some NGOs and credit cooperatives involved in lending to the poor points to the profit potential from this segment. This lesson is not lost among banks. They, too, realise the importance of widening their financial markets and exploring alternative profit centres, such as rural centres and lending to the poor. Thus, banks are beginning to recognise that the poor are a potentially significant and profitable market, provided a way can be found to transact with them. Some rural banks and cooperative rural banks have credit programs targeted to poor borrowers.2
In general, banks do not lend to the poor because of the very small size of their loan requirements, for which the transaction costs are far too high to make that lending commercially viable. In addition, the poor cannot provide the usual collateral required by banks such as real estate mortgages, government securities, high grade commercial paper and other liquid assets.
2 This usually happens when a rural bank or cooperative rural bank panicipaces in a governmenc-funded credic program cargeced co particular borrowers such as che rural poor.
2

Introduction
The linkage mechanism
The bank-NGO-self-help group (SHG)3-poor linkage is an attempt to deal with the problems of high transaction costs and lack of collateral of the poor. Under this mode of credit delivery, the NGO or SHG secures loanable funds from various sources, including a bank, and acts as a credit intermediary to reach the poor borrowers. The initiative for the linkage may also come from a bank. Sensing the profit opportunities in the lower segment of the financial market unserved by formal lenders, and also conscious of its corporate social responsibility, a bank may extend credit lines to NGOs which lend to the poor.
Banks are also beginning to explore this linkage approach to lending to the poor.4 The Bank of the Philippine Islands (BPI) used its Foundation as its conduit for grants and soft loans to people's organisations (POs) and NGOs. The creditor-borrower relationship is between BPI Foundation and the NGOs, respectively. It was through BPI Foundation that financial assistance was earmarked for lending to the non-bankable sector-for example, microentrepreneurs and self-help groups not serviced by the traditional banking sector.5 As a result of this experience, the Bank of the Philippine Islands (BPI) and BPI Family Bank have recently started extending credit lines directly to NGOs for re-lending.
In the Philippines, banks (in particular the commercial banks) are the dominant financial institutions, controlling most of the financial resources and banking facilities across the country. Given their organisation, capitalisation, wide array of financial services and capacity for innovation, they perform the bulk of financial intermediation and will continue to do so. Banks cannot be ignored in any attempt to create credit programs that are oriented towards a specific clientele or activity. Thus, co-opting or involving them in a given credit program may be a useful strategy to attain the objectives of that program. Within the framework of market-based financial intermediation, NGOs, self-help groups and banks can discover a common interest and work cooperatively to attain certain financial objectives.6
Scope of this study
Given these developments, and that transaction costs are a key factor in the issue of credit access, it is important to attempt to quantify the transaction costs of lending to the poor.
3 Self-help groups or SHGs refer to groups of individuals, usually from the marginalised sectors organised around a common purpose or objective, in this case to access credit and mobilise savings. They are not formal groups in the sense that they are not registered with government entities and do not as yet perform more complex organisational tasks such as those of cooperatives.
4 The GTZ implements through the Land Bank of the Philippines (a special government bank) a bank/self-help group/end borrower linkage project.
5 BPI Foundation started lending to NGOs and cooperatives in 1991. It started by extending financial assistance to Tulay sa Pag-unlad Inc. (TSPI) and the Visayas CO()perative Development Center to be on-lent to microentrepreneurs and member cooperatives, respectively. As of third quarter, 1994, the BPI Foundation has eight NGOs/SHGs in its books and four more in process. This experience is documented in Banking with the Poor (1992).
6 An objective is to provide access to credit to the rural poor which, based on the experience of those NG Os and cooperatives involved in lending to the rural poor, can be a profitable venture for any financial institution, under certain conditions.
3

Transaction Costs of Lending to the Poor: Philippine NG Os
This should be done at different stages of credit intermediation in the bank-NGO-SHGpoor linkage or under alternative credit delivery approaches in order to help establish the viability and sustainability of credit programs oriented toward the poor. This is the objective of this study. We have attempted to estimate the transaction costs ofNGOs' lending to the poor, and have compared this with the transaction costs oflending of banks and other non-bank financial institutions (NBFls) such as cooperatives and self-help groups (SHGs).
The study is organised as follows. Chapter 2 discusses the research framework of the study, which includes the objectives, estimation procedure, data, and the scope and limitations. Chapter 3 is a brief review of the literature on transaction costs. Chapter 4 provides the analytical framework of the study while Chapter 5 provides a profile of the microlending programs of the two NGOs considered in this study. Chapter 6 describes the banks, cooperatives, and their clients that were included in the analysis and comparison of transaction costs. Chapter 7 presents our results of the transaction costs incurred by lenders and poor borrowers. Finally, Chapter 8 concludes and recommends measures to enhance the viability of financial intermediation with the poor.
4

Chapter 2 RESEARCH FRAMEWORK
2.1 Objectives of the study
The issue confronting concerned banks is not whether they want to lend to the poor, but the manner, cost and viability of lending to the poor given high transaction and information costs, and loan default risks. The bank-NGO-self-help group (SHG)-poor linkage is an attempt to address the high transaction and information costs of lending to small and poor borrowers. The order of magnitude of transaction costs (a part of which arises from information asymmetry) oflending to the poor is a major issue that needs close scrutiny. Thus, this study has the following objectives:
(1) To identify major microlending programs in the Philippines which use NGOs and SH Gs as financial intermediaries, and to describe this process of lending to the poor.
(2) To determine and quantify the components of the transaction costs of lending to the poor-at bank, NGO/SHG and borrower levels.
(3) To compare the transaction costs oflending to the poor by NGOs with the cost of direct lending through banks and other non-bank financial intermediaries (NBFis) such as cooperatives.
(4) To determine the various factors affecting transaction costs.
(5) To recommend measures that will minimise the transaction costs of lending to the poor and contribute to its viability and sustainability.
2.2 Estimation procedure
The determination of transaction costs of lending was undertaken at two related levels: NGO and SHG/borrower. The results of the NGO and SHG estimates were then compared with estimates of transaction costs of direct retail lending of banks and other non-bank financial institutions made by Casuga (1994).7
To make our results comparable with those of the Casuga study, the classification and level of detail of the different (transaction) activities of our sample NGOs were made to correspond to those in Casuga's study, which provided the benchmark figures for transaction costs of banks and cooperatives. Our activity classification also tried to capture the nuances and peculiarities of the NGO methodology of credit delivery using self-help groups.
The costs associated with lending are composed of the following:
7 Magdalena S. Casuga, 'Transaction costs under an agrarian reform regime' in Financial Intermediation in an Agrarian Reform Regime, eds Gilberto M. Llanto & Clarence Dingcong, Agricultural Credit Policy Council, Manila, 1994.
5

Transaction Costs ofLenJing to the Poor: Philippine NGOs
(1) cost of funds
(2) lending (operational) costs
(3) funds mobilisation costs
(4) general administration costs
(5) other operational costs
(6) the cost of default.
As the focus of this study is on the transaction costs of lending, the cost of funds or interest cost as well as the cost of default were not part of the cost determination. The study focused only on the expenses incurred in screening and approving loan applications, loan monitoring and recovery, funds mobilisation and programming, administration and other operational activities of the lender. Thus, lender transaction costs are defined by the
equation:
LTC LC+ FC + GC + OC where
LTC LC = FC GC oc
lender transaction costs lending costs8
funds mobilisation costs general administration costs other operational costs
Lending costs (LC) cover four broad activity groups: (1) planning and programming; (2) advertising and promotions specific to lending; (3) loan processing activities composed of screening credit applicants, credit investigation, evaluation and analysis; and (4) loan recovery consisting of monitoring, loan collection, record keeping, report writing, and the management of bad debts.
Funds and deposit mobilisation costs (FC) consist of the expenses incurred in getting information on funding sources, preparation of reports and requests for donor grants,
negotiation with funders, record keeping and attendance at weekly group meetings of beneficiaries. General administrative and incidental costs (GC/OC) consist of management meetings not specific to lending and funds mobilisation, personnel management, training and staff development, maintenance, etc.
In determining the NGO transaction costs of lending, the breakdown of activities allowed for a separation of non-lending activities (that is, group building and formation) from the
lending activities. We added the self-help group promotion as a fifth category of activities under lender transaction costs (LTC). Although group building may be considered as part of the credit process because it leads to the use of a joint liability agreement among group members as security for the loan, and to proper loan utilisation and effective loan recovery, we treated it as a non-lending activity. This is because in another sense, group
8 In all subsequent discussion, lender transaction costs or transaction costs refer to the total LTC, whereas lending costs (LC) refer to the lending cost component of total transaction costs.
6

Research framework
building and formation are part of a whole social development process which is not associated only with lending activities. They have a 'public good character' and confer positive external effects not only to the credit markets, but also to the development process as a whole.
The study used the cost allocation method as described in Untalan {1988) and used by other researchers on transaction costs. The estimation procedure for transaction costs of lending is as follows. Each staff member of the lending institution (that is, the NGO) was asked to complete a time-allocation table of activities related to the different components of transaction costs defined above. Staff were asked to estimate the percentage of time to total hours that they spent on specific activities. We asked for a list of personnel and their corresponding monthly salaries in order to compute a compensation table of the staff members who completed the time allocation table. The transaction costs were computed using the data from the previous step, as follows:
(1) cost for each activity was computed by multiplying the time allocation of a given staff member for activities - say, a to j - by that person's salary as indicated in the compensation table
(2) the estimated values of the transaction costs for specific activities across all bank personnel were summed horizontally
(3) the per cent share of each activity or function to total personnel costs was computed
(4) The results in (3) were used to allocate the lending institution's other non-direct personnel and non-personnel costs, using data from the detailed operating expenses of the institution
(5) direct non-personnel costs were allocated to the activities under which they were incurred
(6) general administration and other costs were then proportionately allocated among the three major activity categories (SHG, LC, and FC).
To allow comparability among the NGOs and other intermediaries and to account for differences in scale of operations, the resulting transaction cost figures derived above were converted into ratios with the following measures as divisor: number of loans released, amount of loans released, and amount of loans outstanding. The transaction cost estimates were then compared across financial intermediary types using the following ratios:
• transaction costs per loan account granted
• transaction costs per peso ofloans granted
• transaction costs per peso of loans outstanding
Transaction costs per loan account granted provide an estimate of the cost of processing and maintaining each loan account during the year under consideration. This particular ratio gives an indication of the amount of effort spent in processing one loan. As a financial intermediary's exposure and revenues per unit of loan are in direct proportion to the size of the loan, it is expected that a lender would spend more in screening loans with larger amounts to minimise its risks, resulting in higher transaction costs per loan account
7

Transaction Costs of Lending to the Poor: Philippine NG Os
granted. Note that, depending on the type and size of a loan, there will be qualitative differences in the screening methodology and consequently the skills required. As an example, the effort spent in assessing the creditworthiness of a small market vendor applying for a Ps 10,000 (US$ 400) working capital loan and the viability of the vendor's enterprise will certainly be different from that of an application for a project to put up a small rice mill worth Ps 250,000 (US$ 10,000) by a farmers' cooperative.
On the other hand, the transaction costs per peso of loans granted give an estimate of how much it costs to process and maintain a peso ofloan for the year under consideration. As is indicated by the formula, for a given total transaction cost, this ratio will vary inversely with the amount ofloans granted for a given period. The amount ofloans granted in a given period is in turn a function of the loan sizes, the number of loans processed, and the loan maturity period.
Taking the ratio of the total transaction costs to loans outstanding provides an estimate of the relative efficiency with which a financial intermediary is using its working asset-that is, its loans outstanding. The ideal would be to use the average daily balance of an intermediary's loans outstanding. However, approximations using the average loans outstanding (average of loans outstanding at beginning of the year and at the end of the year) or, if unavailable, loans outstanding at the end of the year would suffice.
For this study, since the Casuga study did not have beginning loans outstanding figures available for the financial intermediaries included in her study, we use the year-end loans outstanding figures to allow comparison across intermediary types, including that of the two NGOs that are the subject of this study. Using the loans outstanding figure results in a percentage figure for direct comparison with interest rates charged. It can also be used to determine lending margins or spreads when the incomes and other expenses, including financial expenses, are available and are also expressed as a ratio of loans outstanding.
An important qualification in using the transaction costs per peso of loans outstanding (particularly when making comparisons across intermediaries) needs to be made. The ratio is taken with the assumption that the intermediary has a fairly good loan portfolio, little loan restructuring, and that accepted procedures for making loan loss provisions are being followed, so that the loans outstanding figure is not inflated by non-performing accounts. Otherwise, the resulting cost ratios may appear to be much lower than they really are.
To gain further insight into the cost structure of NGOs, transaction cost estimates of sub-activities under lending (LC) and SHG promotion were also reviewed.
2.2.1 NGO level
The credit intermediaries in the bank-NGO-SHG-poor linkage approach are the NGOs and SH Gs. We have estimated the transaction costs of group lending as implemented by our sample of two NGOs, namely: Kabalikat para sa Maunlad na Buhay (KMBI), and Alalay sa Kaunlaran sa Gimang Luzon (ASKI). We focused on their credit programs that target the poor, using self-help groups (SH Gs) as their main credit delivery channel. These are KMBI's Ugnayan ng mga Kristiyanong Mangangalakal Program (UKMA) and ASKl's
8

Research framework
Grameen Replication Program funded by the Philippines-Australia Community Assistance Program, or PACAP Program.
2.2.2 Borrower level
Borrowers incur transaction costs which determine their choice oflender and, in this study, their willingness to borrow from sources such as an NGO or a bank. There are three major components of borrower transaction costs:
(1) costs of applying for and negotiating a loan
(2) documentation expenses
(c) opportunity cost of time spent in negotiating the loan.
The estimation of borrower transaction costs has two levels: (1) the costs at the level of the self-help group or centre, which refer to the extra amount of work related to loan processing, screening and monitoring performed by key officers at the centre level on top of their regular activities as group members; and (2) the costs at the level of an individual borrower.
2.2.3 Bank level
As mentioned previously, transaction cost estimates at the bank level of the Casuga study were used for purposes of comparison.
2.3 Data sources
Field interviews and supporting documents such as balance sheets, income statements, job descriptions and compensation schedules were used in generating the time allocation tables and other data for analysis. Borrowers' transaction costs included actual cash expenditure in connection with loan application, follow-ups, negotiation, documentary expenses and the opportunity cost of time. The cross-section data were for a single year, and the most recent financial and program reports for a period of one year were used: KMBI, calendar year 1993; ASKI/PACAP program, October 1992-0ctober 1993. For the transaction costs of banks an:d cooperatives, we used secondary data from Casuga (1994).
At the borrower level, officers of one centre each of the ASKI/PACAP and KMBl/UKMA programs were interviewed to get an indication of the costs incurred at the individual borrower level and at the centre level.
Information on the profile of members of the two NGO programs was obtained from project documents. Information on ASKI/PACAP's program beneficiaries was based on a year-end evaluation report of all 129 program beneficiaries. The profile of KMBI's UKMA borrowers was based on a sample survey of 80 program beneficiaries. For the profile of bank and cooperative borrowers, secondary data from the Casuga study were used.
2.4 Scope and limitations
lime limitations was the main constraint faced by the authors of this study. We limited our focus to two NGOs which are clients of BPI Foundation. For comparison purposes, we
9

Transaction Costs of Lending to the Poor: Philippine NGOs
used as benchmark for retail lending to individuals earlier estimates done by the Agricultural Credit Policy Council (see Llanto & Dingcong 1994).
The estimation procedure was limited to the cost allocation method covered because of time and data limitations. This process depended on the recall and estimate of respondents for the time allocation across various activities. Thus, the resulting transaction cost figures should be taken as best estimates. A simultaneous equation model similar to that of Cuevas and Graham (1985) would yield a more rigorous estimate of transaction cost.
The cost estimates for the NGOs cover a period of one year and provide only a snapshot view of the NGO programs. A review and comparison of transaction cost estimates over several years would capture the dynamics and progress of the programs over time. Furthermore, an examination of the cost of funds, the quality of the loan portfolio, default experience, and pricing (interest rates and service charges) would yield a more complete analysis of viability and sustainability. These are important subjects for future research. Nevertheless, we feel that our estimated transaction costs oflending to the poor, the first such attempt for NGOs, at least in the Philippines, provides very helpful information and insights.
On the borrower side, the estimates for borrower level transaction costs were done through actual observation of the conduct of one centre meeting for each of the NGOs. Group interviews were conducted to obtain the centre members' estimates of their transaction costs.
The information on borrower income level before and after joining the program was based on surveys of program beneficiaries. In the case of KMBI, no baseline data on income levels before the study were available, and the information was based on the respondents' recall. Noting the usual difficulties encountered in obtaining income estimates, the information presented on borrower incomes should be taken as merely indicative of the impact of the lending programs.
While our study goes beyond the transaction costs ofNGOs and compares transaction costs across different intermediary types (banks, cooperatives), it should be noted that the intermediaries being compared exhibit significant differences in many aspects. These include organisational philosophy (for example, profit vs non-profit) and structure (unit office vs branch), lending strategies and policies, level of technologi~ sophistication, lending program maturity, and cost structure. The resulting transaction cost estimates of each intermediary type reflect the unique combination of these variables. Conclusions drawn from a comparison of costs should take these differences into consideration.
10

3.1 Existing research
Chapter 3 BRIEF REVIEW OF LITERATURE
ON TRANSACTION COSTS
Recent literature emphasises the significance of transaction costs which hinder the efficiency of financial markets. Various researchers consider it a measure of 'friction' in financial markets which increases the costs of intermediation. It is an important component of the costs of borrowing (Bhatt 1978; Adams & Nehman 1979; Ladman 1984; Cuevas 1984). Saito and Villanueva (1981) showed that lenders' transaction costs consist of the cost of administering credit and the cost of risk of default. Other studies concluded that the lender's transaction costs as a percentage of the loan amount decrease with increases in loan size. Because of this, banks lend to large borrowers rather than to small borrowers. Transaction costs differ among various bank types (see, among others, Cuevas & Graham 1984; Untalan & Cuevas 1989; Ahmed 1982).
In the Philippines, lender transaction costs as a percentage of the loan were shown to decline with increases in the loan size (Saito & Villanueva 1981). Untalan's 1988 study concluded that there is great variation in transaction costs among different types of banks. An interesting finding of Untalan is that government credit policies such as the limitation on bank entry and branching in certain areas significantly increased lender transaction costs. In a related study, Untalan and Cuevas (1989) estimated that funds mobilisation activities constituted a greater part of transaction costs among all banks than did lending operations. The higher volume of deposits mobilised by private commercial banks and private development banks was mainly responsible for a lower cost of funds mobilisation than that of rural banks.
An interesting finding is that private commercial bank branches operating in rural and semi-urban settings are more fund-generating units while rural banks are more lending oriented. In the rural areas, the cost of granting a loan is lower for rural banks than for both private development banks and private commercial banks. Untalan and Cuevas concluded that private commercial banks and private development banks hold a comparative advantage in funds mobilisation and lending operations, as measured by per peso cost of delivery, because of their larger volume of operations.
In contrast, more recently, Casuga (1994), using field data from a survey done by the Agricultural Credit Policy Council, determined that banks incurred transaction costs (LTC) five times bigger than cooperatives in agrarian reform areas. A greater proportion of the estimated transaction costs of both banks and cooperatives is attributed to lending operations because of the need to spend more time in screening loan applications and enforcing loan contracts. As measured per peso cost of delivery, the transaction costs of banks (private commercial banks and rural banks) are lower than that of cooperatives
11

Transaction Costs of LenJing to the Poor: Philippine NGOs
because of the bigger scale of loans granted by the former. Thus, cooperatives incurred higher costs per peso of loans partly because they are too small to achieve economies of scale. On the other hand, in a study of a rural bank based in Mindanao, Abiad (1994) estimated that lending costs per loan (LC/unit ofloan) are incurred mainly for loan recovery (31.8 per cent) and loan processing (28.1 per cent) and that since loans processing and documentation do not vary significantly with the loan size, lender transaction costs are relatively stable across loan sizes-approximately the same for large as for small loans. The implication is that a bank would prefer to grant larger loans than small ones.
At the borrower level, two studies by Abiad (1988, 1994) showed that borrower transaction costs are regressive in their impact on borrowers. As a proportion of the loan amount, borrower transaction costs are greater for small borrowers. Transaction costs are determined by two factors: distance to the bank and type of bank. In her 1994 study, she observed that average transaction costs for borrowers are almost five times lower for a loan from the self-help group as compared to a loan from a bank. Casuga (1994) found that the total transaction costs incurred by borrowers of banks were twice as much as that of borrowing members of cooperatives. In particular, the transaction costs incurred by bank borrowers (rural banks, cooperative rural banks, and special government banks) were 0.04 per peso of loans obtained while borrowers of cooperatives spent about 0.02 per peso ofloan.
The previous studies estimated the transaction costs of lenders (banks and cooperatives) and borrowers (small borrowers and agrarian reform beneficiaries). The present study's main concern is the quantification of the NGOs' transaction costs of lending to the poor. This is important in view of the NGOs' unique role in the development process and, in particular, their attempt to provide the poor with access to formal credit markets.
3.2 The present study
Thus, the present study addresses the following issues: Is lending to the poor a viable and sustainable proposition? How can the transaction costs of lending to the poor be reduced? What measures must be undertaken both at the micro level (NGOs, borrowers, banks) and the macro level (policy environment, donor community, institutional context of development strategy, etc.) toward a viable and sustainable financial market for the poor?
12
Chapter 4 ANALYTICAL FRAMEWORK
Transaction costs
Transaction costs of lenders and borrowers are an important dimension of transactions in the credit markets where the poor transact loans. High lender transaction costs on small loans and on dealing with poor and. small borrowers have traditionally limited their access to formal credit.9 On the other hand, the poor themselves may feel discouraged to search for formal credit because of the associated high transaction costs of borrowing from formal sources.10 The asymmetry of information in credit markets also make it difficult for formal lenders to transact with the poor who do not have a credit track record, much less information on their creditworthiness (see Llanco 1989 for a related discussion).
In this context, high transaction costs and the lack of information constitute some 'friction' in financial markets which prevent or hinder the consummation of loan transactions between formal lenders and the poor (borrowers). However, even in this (formal) credit-constrained environment for the poor, arbitrage opportunities arise which can be profitably exploited by the innovative lender. Realisation of this fact motivates different agents to find ways to reduce the high transaction costs of lending to the poor and, at the same time, earn profits from the loan transactions.
The linkage approach
The bank-NGO-self-help group (SHG)-poor credit delivery approach, or 'linkage approach' to lending to poor and small borrowers, is rapidly gaining ground in credit markets. In this approach, successive layers of credit transactions take place (1) between a lending bank and a borrowing NGO; (2) then between the (lending) NGO and a (borrowing) self-help group; and finally (3) between the (lending) self-help group and (borrowing) individual members of the group.
There are other variants of this basic model. For example, another variant of this model has a self-help promoting institution performing capacity-building activities for the poor to make them creditworthy. The layered credit transactions minimise the transaction and information costs oflending to the poor borrowers. This starts from the assumption that it will be more costly for the bank to deal directly with numerous small and poor borrowers, and that using a credit intermediary allows both the bank and NGO to use their
9 On the other hand, the informal lenders have various credit mechanisms that enable them to deal with the high transaction costs of lending to the poor. However, this paper does not discuss the transaction costs of informal lenders, although the formal lenders can, to some extent, learn from their experience and 'mimic' some of the credit mechanisms of informal lenders.
10 Borrower transaction costs have been estimated to be regressive in their impact on borrowers (Abiad 1988). This means that borrower transaction costs as a proportion of the loan are greater for small borrowers than for medium and large borrowers.
13

Transaction Costs of Lending to the Poor: Philippine NGOs
comparative advantage in credit markets where the poor constitute the main bulk of borrowers.
Under an agency-theoretic framework, the bank which wants to reach poor borrowers can profitably use an NGO as a credit intermediary, an 'agent' to deal with the high transaction costs and information void in credit markets with a lot of poor borrowers. The NGO has the advantage of having more information on the target borrowers and the lending areas (for example, the countryside, urban depressed areas) and lower transaction costs, which gives it the comparative advantage in lending. Thus, the 'principal' (the lending bank) provides a line of credit to the NGO, and the bank motivates the NGO to use its own transactional and informational advantage to consummate a credit transaction with the poor. The NGO may choose to lend to individual poor borrowers directly or to use self-help groups (SHG), an emerging institution in credit markets, as conduits for its loans to members of those groups.
In the latter case, the self-help group acts as 'agent' for the NGO which thus provides group loans rather than individual loans. Using the SHG as its own 'agent', the NGO will be able to exploit economies of scale, thereby lowering its own transaction costs and therefore widening its outreach to the poor. This will solve its own problem oflimited personnel and outreach in both rural and urban areas.
The role of self-help groups
The end borrowers (that is, the poor borrowers) organise themselves as a self-help group which is the entity which borrows from the non-governmental organisation (NGO). The group's loan is on-lent to the individual members of the group. It may also be that borrowers get individual loans but their active membership in the group guarantees loan monitoring and repayment. The group members take charge of monitoring the usage of the loan, and enforce the debt contract through such mechanisms as peer monitoring and joint liability agreements among themselves. The organisation of the group may be done by the members themselves out of their own initiative or by an external agent such as an NGO, civic organisation or the government itsel£ What is imponant at this point is that there is a formally organised group11 and that the individual members' participation and involvement with the group's different activities are neither haphazard nor contrived, but result from voluntary action and the conviction that such will confer benefits to the group and the members. Enforcement of group rules and regulations-for example, timely loan repayment-arises from the members' willingness to keep their promise to cooperate.
The role of NGOs
The self-help group acts an 'agent' of its principal, the NGO from which it receives loans, training and institution-building assistance. As a 'principal' the NGO has the means to
11 Formally organised in the sense that there is a formal structure within the group; there are known leaders of the group; the group participates in the activities required of them by the NGO and, in some instances, the group is registered with an official (governmental) authority.
14

Analytklll framework
sanction its 'agent', the self-help group. It can threaten to withhold future loans in the event of a loan default or loan delinquency; it can promise to increase the order of magnitude of future loans as a reward for good borrower behaviour; and it can foreclose the pledged collateral in cases where collateral has been required to secure the group's loan. Thus, a principal-agent relationship exists between the NGO and the self-help group and this makes credit transactions with the poor efficient and effective.
Related issues Under this framework, it is noted that the end borrower has private information about their own intention over the loan. They may choose to use the loan as intended or misuse it or even, in the case of entrepreneurs, reduce the amount of effort that is necessary to make a project succeed.12 In short, moral hazard problems abound, especially in credit markets characterised by high transaction costs and information asymmetry. This motivates the lender-principal to use an 'agent' to undertake the retailing of loans to individuals or groups of individuals. The agent has the 'technology' of lending to the target borrower, and can undertake an unobserved amount of transaction cost reduction. It may choose to behave as its principal dictates-that is, use the loanable funds as intended, monitor the progress of the enterprise for which a loan has been contracted, repay the loan as it matures, and a host of other things necessary to ensure the integrity of the loan contract. It may also choose to do otherwise, in which case the loan and its repayment is jeopardised, to the detriment of the lender-principal.
Following the literature, the design of a compatible incentive structure will obviously be extremely necessary. The principal must be able to encourage cooperative behaviour from its agent. By the same token, the agent must elicit the appropriate behaviour from its own individual borrowers or cohorts of borrowers. Positive and negative sanctions are thus employed to elicit the required behaviour. It is noted that faithful adherence to the required behaviour (on the part of the borrower, timely loan repayment and on the part of the lender, regular and easier access to repeat loans and more affordable or manageable loan terms) further lowers the transaction costs and increases the information content in these credit markets.
12 For example, a farmer who has borrowed from a bank to buy inputs may reduce the amount of feniliser application to the detriment of farm productivity.
15

5.1 NGO profile
Chapter 5 PROFILE OF NGO/SHG MICROLENDING
PROGRAMS TO THE POOR
This section provides a brief profile of the two NGOs considered in this study. They are by no means the only Philippine NGOs involved in credit programs and livelihood projects for the poor, but they are quite unique in that they are oriented towards market-based financial intermediation. They believe that the viability and sustainability of any financial intermediary, including those operating in the informal credit markets, hinges on the acceptance and use of market-based and market-oriented financial principles.
KMBI was formally registered in November 1986 withASKI following a few months after in March 1987. Both NGOs had been organised as non-stock, non-profit corporations registered with the Philippine Securities and Exchange Commission. Table 1 shows some operational highlights of the two NGOs.
For the period under study, average loans outstanding for KMBI were Ps 6.184 million (US$ 236,000) with a total loans disbursement of Ps 22.137 million (US$ 847,000). Average loan size was Ps 8,297 (US$ 317). For ASK!, average loans outstanding was Ps 7.994 million (US$ 306,000). Total loans released amounted to Ps 10.049 million (US$ 384,000) and average loan size was Ps 10,935 (US$ 418). KMBI granted over double the amount ofloans of ASKI for the period. KMBI's loans maturity were six months which was half that of ASKI. KMBI had 22 staff with half of them working as field workers. Beneficiary reach for KMBI was 1,638 while it was 919 for ASKI. ASKI had 15 staff with 7 field workers.
KMBI's main lending program was a group lending and organising program which it called the Ugnayan ng mga Kristiyanong Mangangalakal (UKMA) which is translated Federation of Christian Business Persons. KMBI had initially started off with an individual lending program but was winding this down and focusing on group lending. ASKI on the other hand had three lending programs: the market vendors lending program which used the self-help group as a guarantee mechanism; individual lending; and the PACAP-sponsored Grameen Bank approach replication which was the subject of this study. 13
The organisations' financial statements are shown in Table 2 and Table 3. KMBI had total assets of Ps 13.510 million compared with Ps 17.180 million for ASK!. Both NGOs showed relatively comparable loans receivable of about Ps 9.0 million (US$ 0.344 million). Loans receivable for KMBI constituted 77 per cent of current assets and 65 per cent of total assets, while it was 63 per cent and 53 per cent respectively for ASK!. The main differences
13 Other lending and linkage models are documented in Banking with the Poor (1992).
16

Table 1 NGO operational highlights
Organisation Year organised
NGOISHG micro/ending programs to the poor
KMBI November 1986
ASKI March 1987
Non-stock, non-profit corporations Nature of organisation Reference period Calendar year 1993 Fiscal year ended 30 June 1994
Loans outstanding beginning Loans outstanding ending Average loans outstanding Total assets beginning Average total assets Amount of loans released
Number ofloans released Average loan size (pesos, US$) Number of borrowers
Staff complement Managerial staff Direct program staff
Field workers Field supervisors
Accounting/Administration/Others Total staff
Lending programs
Source: NGO records
Ps US$ ( x 1,000)
3,547 8,821 6,184 9,229
11,370 22,137
2,668 8,297 1,638
2 13
[11] [2]
7 22
UKMA
136 337 236 353 435 847
317
Ps US$ ( x 1,000)
6,947 9,041 7,994
11,560 14,370 10,049
919 10,935
919
2 8
[7] [l] 5
15
266 346 306 442 550 384
418
Market vendors Individual lending
PACAP/Grameen replication
between the asset value of KMBI and ASKI were in the cash and fixed assets accounts. ASKI had more than double the amount of cash on hand and fixed assets as that of KMBI. The proportion of fixed assets to total assets of both NGOs was low at the 8-12 per cent range.
It is interesting to note that both NGOs had started diversifying their fund sources and moved from grants to soft loans to fund their lending activities. KMBI 's loans payable (current and long term) totalled Ps 4.849 million representing 36 per cent of total fund balance and liabilities, while ASKI had Ps 9 .441 million in loans payable or 5 5 per cent of total fund balance and liabilities. KMBl's loans payable were about half its loans receivable, while for ASKI loans payable were over 100 per cent of loans receivable. KMBI had a 1 to 1 ratio between its liabilities and its fund balance, while ASKI was more highly leveraged with a 2 to 1 ratio of total liabilities to fund balance.
17

Tr11nsaetion Costs of Lending to the Poor: Philippine NGOs
Table 2 NGO financial highlights: statement of condition
Organisation KMBI ASKI Year organised November 1986 March 1987 Reference period Calendar year 1993 Fiscal year ended 30 June 1994
Ps US$ % Ps US$ % (x 1,000) (x 1,000)
Assets Cash 2,185 84 16 4,846 185 28 Investments 45 2 0 135 5 0 Loans receivable 8,821 337 65 9,041 346 53
Loan loss allowance 0 0 0 0 Net loans receivable 8,821 337 65 9,041 346 53 Other current assets 349 13 3 220 8 1 Total current assets 11,400 436 84 14,242 545 83 Furniture, fixtures and equipment 965 37 7 834 32 5 Fixed assets 1,050 40 8 2,083 80 12 Other assets 95 4 0 21 0 0
Total assets 13,510 517 100 17,180 657 100
Liabilities Current liabilities
Loans payable 850 33 6 4,583 175 27 Current portion, long-term debt 1,025 39 8 Total loans payable 1,875 72 14 4,583 175 27 Other liabilities** 1,903 73 14 1,966 75 11
Total current liabilities 3,778 144 28 6,549 250 38 Long-term debt 2,974 114 22 4,858 186 28
Total liabilities 6,752 258 50 11,407 436 66
Fund balance Fund balance beginning 6,303 241 47 3,464 132 20 Fund balance during year 455 17 3 2,309 88 13
Total fund balance 6,758 258 50 5,773 221 34
Total liabilities and fund balances 13,510 517 100 17,180 657 100
Source: NGO records **Other liabilities include beneficiaries capital build-up and death insurance funds (Ps 1,667,000 for KMBI and Ps 1,882,000 for ASKI).
The loan sources included a mix of government agencies, local and international NGOs, and corporate foundations, including the Bank of the Philippine Islands Foundation. The
cost of these funds ranged from 5 per cent to 14 per cent per annum. As of June 1994, KMBI had a Ps 750,000 (US$ 28,680) loan from BPI Foundation while ASKI was granted
a Ps 300,000 (US$ 11,472) loan for re-lending. Interest charged by BPI Foundation was 8 per cent per annum.14
18
NGO/SHG micJ-olendingprograms to the poor
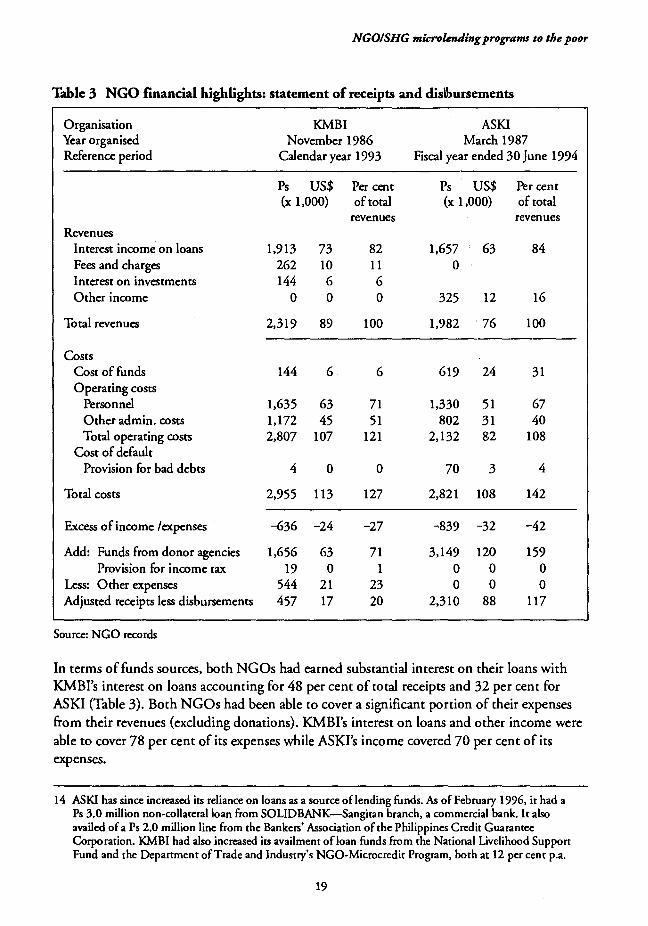
Table 3 NGO financial highlights: statement of receipts and dis\bursements
Organisation KMBI ASKI Year organised November 1986 March 1987 Reference period Calendar year 1993 Fiscal year ended 30 June 1994
Ps US$ Per cent Ps US$ Per cent (x 1,000) of total (x 1,000) of total
revenues revenues Revenues
Interest income on loans 1,913 73 82 1,657 63 84 Fees and charges 262 10 11 0 Interest on investments 144 6 6 Other income 0 0 0 325 12 16
Total revenues 2,319 89 100 1,982 76 100
Costs Cost of funds 144 6 6 619 24 31 Operating costs
Personnel 1,635 63 71 1,330 51 67 Other admin. costs 1,172 45 51 802 31 40 Total operating costs 2,807 107 121 2,132 82 108
Cost of default Provision for bad debts 4 0 0 70 3 4
Total costs 2,955 113 127 2,821 108 142
Excess of income /expenses -636 -24 -27 -839 -32 -42
Add: Funds from donor agencies 1,656 63 71 3,149 120 159 Provision for income tax 19 0 1 0 0 0
Less: Other expenses 544 21 23 0 0 0 Adjusted receipts less disbursements 457 17 20 2,310 88 117
Source: NGO records
In terms of funds sources, both NG Os had earned substantial interest on their loans with
KMBI's interest on loans accounting for 48 per cent of total receipts and 32 per cent for
ASKI (Table 3). Both NGOs had been able to cover a significant portion of their expenses
from their revenues (excluding donations). KMBI's interest on loans and other income were
able to cover 78 per cent of its expenses while ASKl's income covered 70 per cent of its
expenses.
14 ASKI has since increased its reliance on loans as a source oflending funds. As of February 1996, it had a Ps 3.0 million non-collateral loan from SOLIDBANK-Sangiran branch, a commercial bank. It also availed of a Ps 2.0 million line from the Bankers' Association of the Philippines Credit Guarantee Corporation. KMBI had also increased its availment ofloan funds from the National Livelihood Support Fund and the Department ofTrade and Industry's NGO-Microcredit Program, both at 12 per cent p.a.
19

Transaction Costs of Lending to the Poor: Philippine NG Os
Both KMBI and ASKI had come close to reaching operational self-sufficiency. 15 KMBI's revenues (excluding grants and donations) covered 83 per cent of total operating costs while ASKI's revenues covered 93 per cent of its operating costs.
5.2 NGO lending programs
KMBI and ASKI sta.rted with lending programs for individual micro and small entrepreneurs who did not have access to formal credit. These programs were aimed at income generation and job creation. As early as 1991, these NGOs began reviewing and testing out approaches that would more effectively reach the poor, thus making a more conscious effort at targeting the poor.
KMBI reviewed its outreach and started testing out the strategy of delivering credit through self-help groups. It organised its members into groups which were in turn organised into centres. All the centres were federated as the Ugnayan ng mga Kristiyanong Mangangalakal (UKMA) in 1991. Meanwhile, KMBI gradually reduced its loans to individuals. At the end of 1993, the number of individual loan accounts were only 5 per cent of the total number of accounts. In terms of value, individual loans were 14 per cent of total loans granted.
ASKI started to form self-help groups (SH Gs) among its clients and members, particularly among its market vendor clients, and eventually pilot-tested a Grameen type replication in a rural area near Cabanatuan City in the Province ofNueva Ecija. With the receipt of a grant from the Philippines-Australia Community Assistance Program (PACAP), ASKI formally launched its Grameen replication program in the last quarter of 1992.
While KMBI had been lending since 1986, its UKMA program was formally launched in March 1991. On the other hand, ASKI's PACAP Program was started in October 1992 and had only been in operation for slightly over a year at the time of this study. Repayment rate (loans collected divided by loans due) was 90 per cent for ASKI and 92 per cent for KMBI. KMBI's default rate (delinquent loans or loans past maturity divided by loans outstanding) was 3 per cent and its arrears rate (amortisation due for 90 days or more divided by loans outstanding) was 11 per cent. These figures compare favourably with general lending experience considering that these were non-collateralised loans. ASKI did not have the corresponding figures for default and arrears as their PACAP operations was barely a year old.
In terms of the ratio of beneficiaries to direct program staff, it was 117 clients for 1 staff for KMBI and 65 to 1 for ASKI. ASKI's lower beneficiary to staff ratio can be explained by the newness of its program. However, even for KMBI, the ratio was still below the benchmark of from 200 to 300 clients per staff used by Grameen Bank replicators in working out viability models. The client to staff ratio is used as a reasonable indication of workload, as a significant amount of effort is expended in screening and preparing a new member compared to the processing of repeat loans.
15 The World Bank's Consultative Group to Assist the Poorest in its 1996 Project Funding Announcement defines operationally self-sufficient institutions as those that 'have cash receipts from financial service customers which are at least sufficient to cover the non-financial (that is, excluding interest on debt) cash costs of providing those services'.
20

NGO/SHG micro/ending programs to the poor
The NGO programs that were the subject of this study were microcredit programs for the poor. Their objectives and processes were basically similar with some slight variations. Key features included:
• a targeting mechanism for identifying the poor
• organisation of mutual accountability groups as requirement for loan eligibility rather than the use of physical collateral
• intensive supervision and motivation in terms of continuing group formation and training
• granting of small loans that were paid back on a weekly basis
• a graduated loan amount eligibility conditioned on previous performance
• interest rates that were higher than commercial rates but substantially lower than informal moneylender rates
• compulsory group saving schemes.
An important feature was that clients were organised into mutual guarantee groups of five, and centres composed of four to seven groups. These groups were trained to take on some of the responsibility for the credit delivery and savings mobilisation process, and were involved in loan evaluation and approval, collection, record keeping and monitoring. Both ASKI and KMBI planned to separate out these groups into autonomous self-help groups.
These programs represent novel approaches of addressing the issue of credit access by the poor. Their policies, interventions and modes of operation differ significantly from the usual bank lending operation. In order to appreciate the nuances of their approach and the resulting implications for transaction costs, a more detailed discussion of the features and characteristics of these lending programs follows.
5.2.1 Program areas of operation
ASKllPACAP. The program was set up in Palayan City, Province ofNueva Ecija. The city is adjacent to Cabanatuan City where ASKI had its offices. ASKI had rented a house in Palayan City which served the dual purpose of a branch office and staff house. Palayan was considered one of the poorest cities in the country. While it had been declared a city, it was still a predominantly agricultural area. Lands had been covered under the agrarian reform program but the agrarian reform beneficiaries' agricultural activities, for example, crop cultivation, were severely restricted by the lack of irrigation facilities and limited arable land. ASKI had established centres in five out of 18 barangays in the city.
KA1BIIUKMA. KMBI started its lending operations in Valenzuela, a municipality in the northern part of Metro Manila. As of 1993, the program was operational in eight municipalities which were basically urbanised. KMBI ran its operations from an office in Valenzuela and did not see the need to establish field offices.
5.2.2 Program features
Program objective
Pove~ty alleviation.
21

Transaction Costs of LenJing to the Poor: Philippine NGOs
Primary intervention
Provision of non-collateral microcredit for income generation and the promotion of compulsory savings.
Target group
Households falling below the income poverty threshold. In addition, priority is given to women borrowers.
Targeting mechanisms
An-a level. These should be depressed areas as indicated by available socio-economic data and confirmed by field visits.
Household level. Both NGOs employed a screening mechanism for identifying poor households. Field workers made house-to-house visits and used a set of criteria summarised in a Means Test Form to describe, rate, and classify households. These criteria included the following: (1) level of average individual and household incomes; (2) value of asset ownership; (3) type and condition of dwelling unit; (4) availability of, and access to, water and sanitation; and (5) level of educational attainment of the prospective member.
Information dissemination
The basic mode of informing communities about the NGO's lending program was through the conduct of community meetings at prospective sites. Aside from this mode, UKMA members helped disseminate information on the program to others by word of mouth.
Client level organising
Members were required to organise themselves into groups of five. The group was to serve as a mutual accountability and support group. Group members must not be related but should know each other well enough to be familiar with each other's past credit behaviour, personal character and microenterprise experience. They must live in close proximity to each other. Members must be willing to serve as mutual guarantors for loans of group members.
The group elects its set of officers which usually consists of a chairperson and a secretary. In turn, the groups are organised into centres. A centre usually has 3 to 7 groups with a total of 15 to 35 members. The members also elect a set of officers for the centre. Depending on the NGO, centres are further grouped into chapters or branches.
Group and centre officers were required to take on specific responsibilities related to the conduct of group and centre meetings, group discipline and motivation, screening and acceptance of members, loan screening, approval, collection and record keeping, and the managing of group and centre savings funds. They were also expected to help resolve conflicts and assist in addressing individual problems among the members.
Weekly centre meetings
Centres were required to meet weekly on a mutually agreed upon time and venue. These centre meetings were the primary venue of the field worker for providing training and
22

NGO/SHG micro/ending programs to the poor
motivational inputs, and the main occasions in which NGO field workers interacted with the clients. In addition, the meetings were used for loan application evaluation and approval. They were also the venue for loan collection, record keeping, monitoring and the assessment of the status of projects. All members were required to attend the weekly centre meetings which ranged from one to two hours. Centre officers also met among themselves, usually after the general meeting of members.
As both organisations saw their role as basically one of empowering people, their longer range plan was to develop the centres into independent people's organisations. ASKl's plan is to organise a savings and loan association at the barangay (village) level. KMBl's UKMA will eventually encourage the formation of the chapters into cooperatives or other forms of independent registered people's organisations. KMBI projected a possible phase-out from the organised groups in three years' time.
Education and training
Prospective members were required to attend group training sessions before loans were processed and released. ASKI conducted a three-day orientation seminar to prepare the prospective members, whereas KMBI spread its training over eight one-hour weekly meetings. The training was conducted at the centre level in a venue that is accessible to the prospective members. Such training seminars orient and prepare members for effective participation in the credit program.
The training seminars of both NGOs had four basic aims:
• Orient members about the philosophy and aims of the NGO and the rationale of the credit program.
• Set up the organisational structure of the groups and the centre, including orienting officers about their roles and responsibilities.
• Help build effective and functional groups, and develop leaders by providing inputs on leadership and effective group processes.
• Orient and train the members regarding the requirements, processes and mechanics of the credit program. These include systems and procedures for handling loan applications, approvals, processing, release, collection, record keeping and dealing with defaulting or delinquent members.
Depending on the need of the groups and the aims of the NGO concerned, additional training was either conducted during the weekly meetings or scheduled separately. This additional training included technical training for specific income-generating activities or cash management for microenterprises.
An important part of the education process was the weekly recitation of program pledges and objectives, by both the borrowers and the field worker. These pledges were statements of commitment to specific principles and values that were relevant to the development context of the borrowers. Examples of these include the commitment to keep surroundings clean, a commitment to help each other in time of need, and adherence to principles such as honesty, discipline, unity, hard work and patience. This weekly recitation served both an
23

Transaction Costs of Lending to the Poor: Philippine NGOs
educational purpose and a reminder of what was important to the borrowers and their community.
Screening of groups
Prospective groups that have undergone the compulsory group training are tested by NGO officers by way of an oral interview. The test aims to ascertain the readiness of groups to participate in the program as evidenced by their demonstrated understanding of the credit program's philosophy, aims, mechanics, and individual and group duties and responsibilities. Groups judged to be unprepared are given a time to review and prepare more thoroughly.
Lending policies
Loan amounts. First releases range from Ps 500 (US$ 19) to a maximum of Ps 3,000 (US$ 115). Subsequent loan amounts are increased in increments ranging from 1,000 to 2,000 or up to 50 per cent of the previous loan amount depending on the performance of the borrower.
Loan utilisation. Loans must be used for income-generating projects either for expansion or for the setting up of new enterprises. A borrower's use of the loan is checked by both the officers and the NGO's field worker.
Loan tenor and amortisation schedule. Both NGOs charged an interest rate of 2.5 per cent per month. The loan term for ASKI was 50 weeks, with 25 weeks for KMBI. Payment was to be made weekly. Interest due was computed as a straight percentage of the loan amount and not based on the declining balance. The weekly amortisation is computed by dividing the sum of the principal borrowed and the interest due by the number of weeks of the loan term. Loans were released simultaneously to all members in a group.
Collateral substitute. The programs provided non-collateral loans to the poor. However, the groups have to mutually guarantee each other and members must contribute to cover missed payments of fellow members. Peer pressure was employed as a mechanism to encourage loan repayment.
Mechanics of lending
Screening and approval The loan application process started during the compulsory group training. Individual members prepared simple one-page loan applications containing project cost estimates, revenues, net proceeds and loan amount requested. These proposals were discussed, reviewed, revised and approved by the group members and, in turn, presented to the centre for endorsement. Loan ceilings were preset by the NGO lending policy described above. Once approved, necessary loan documents were established. The basic documents required by the two NGOs were an individual promissory note completed by the borrower, and a mutual guarantee form signed by the members of the group or centre. Requirement for continued membership and loan eligibility included maintaining a good repayment record and satisfactory attendance at weekly meetings.
The centre-level-approved applications together with the necessary documents were submitted to the field worker who reviewed and forwarded these to the main office for
24

NGOISHG micro/ending programs to the poor
cheque preparation. Loan processing at the NGO level consisted primarily of a review of the completeness of the required documents, and of the signatures of centre officers and field staff as evidence of their having reviewed the applications. Both NGOs issued cheques to individuals, and these were released for encashment during the centre meeting. In instances where there was no banking institution nearby, the releases were made in cash.
Loan collection. Payments were given to and received by the group secretary who updated the individual passbooks upon receipt of the weekly loan payments. A weekly collection sheet was also completed by the group leader or centre chief. Group collections were turned over to the centre chief during the centre meeting. The centre collection was then turned over to the NGO field worker who in turn deposited this in the bank. Depending on the circumstances in the area, group or centre officers may directly deposit the collections in a bank or turn them over to the NGO office. In the case of KMBI, some centre officers deposit the collections directly to a designated bank.
Record keeping. Both NG Os had records that keep track of individual loan repayment and savings status including weekly centre attendance. There were also records for group and centre savings funds. These records were kept at the individual borrower, group, centre and NGO level. These records included the individual borrower passbooks, weekly collection summaries and individual, group, and centre fund ledgers.
In addition, field workers and supervisors prepared reports summarising performance at various levels (that is, group, centre and branch) and submitted these to NGO officers. The responsibility for the custody and updating of specific records varied among the NGOs. The tasks were divided between the NGO staff and the centre or group officers and members.
Fees
KMBI charged a one-time Ps 10.00 (US$ 0.38) membership fee, a processing fee (0.5 per cent of principal), and a 1 per cent mortgage redemption to cover the loan balance in case of death of a member-borrower. ASKI charged a Ps 10.00 application fee and another Ps 10.00 as mortgage redemption fee. Other than these, no other fees were collected by the NGOs.
Savings mobilisation
The saving habit was not only encouraged but actually required of the members. This took the form of savings funds set up for different purposes. These included a buffer to cover member loan defaults or late payments, a source of emergency loans for members in cases of accidents or illness, a source of cash contribution in case of death of a member or a member's immediate relatives, a source to cover centre-level operating expenses, and to serve as a supplementary loan fund for members. Funds were set up at the group level and at the centre level.
The number and type of savings fund vary among the NGOs. Some funds were refundable and interest earning while others were non-refundable contributions. The funds were
25
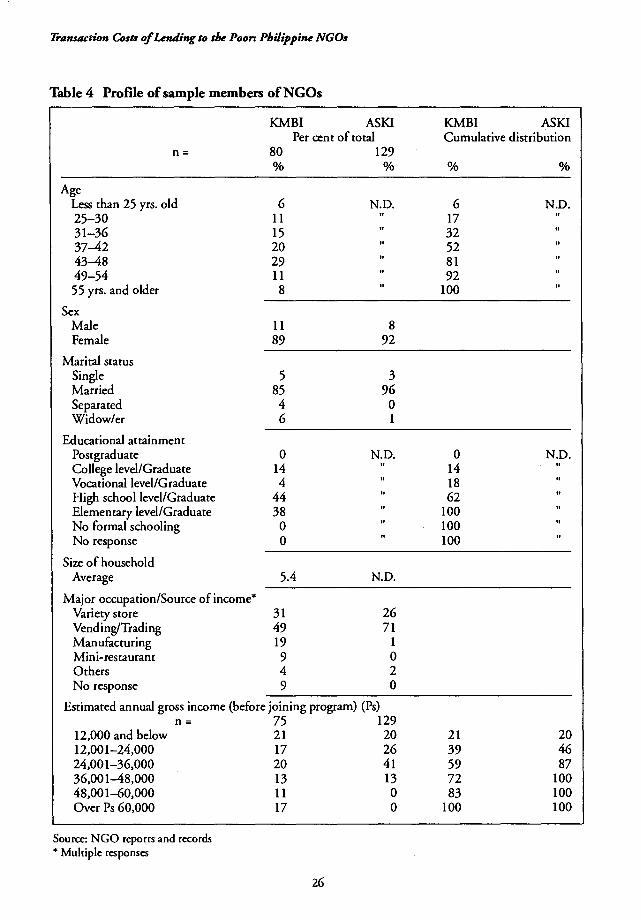
Transaction Costs of Lending to the Poor: Philippine NGOs
Table 4 Profile of sample members of NGOs
KMBI ASKI KMBI ASKI Per cent of total Cumulative distribution
n= 80 129 % % % %
Age Less than 25 yrs. old 6 N.D. 6 N.D. 25-30 11 17 31-36 15 32 37-42 20 52 43-48 29 81 49-54 11 92 55 yrs. and older 8 100
Sex Male 11 8 Female 89 92
Marital status Single 5 3 Married 85 96 Separated 4 0 Widow/er 6 1
Educational attainment Postgraduate 0 N.D. 0 N.D. College level/Graduate 14 14 Vocational level/Graduate 4 18 High school level/Graduate 44 62 Elementary level/Graduate 38 100 No formal schooling 0 100 No response 0 100
Size of household Average 5.4 N.D.
Major occupation/Source of income* Variety store 31 26 Vending/Trading 49 71 Manufacturing 19 1 Mini-restaurant 9 0 Others 4 2 No response 9 0
Estimated annual gross income (before joining program) {Ps) n= 75 129
12,000 and below 21 20 21 20 12,001-24,000 17 26 39 46 24,001-36,000 20 41 59 87 36,001-48,000 13 13 72 100 48,001-60,000 11 0 83 100 Over Ps 60,000 17 0 100 100
Source: NGO reports and records * Multiple responses
26

NGO/SHG mierolending programs to the poor
usually managed by the members but monitored by the NGO field worker. Contribution to the various funds was done in three modes: (1) a one-time contribution computed as a percentage of the loan amount received (5 per cent to 10 per cent); (2) a daily contribution during the conduct of the compulsory group training, and (3) weekly contributions starting from as low as Ps 3.00 per week.
5.3 Borrower profile, microenterprise loan experience and impact
A SKI/ PA CAP
Borrowers were primarily agrarian reform beneficiaries of Palayan City. Information on the borrowers of the ASKI/PACAP were obtained from the first year impact evaluation report of the project. After one year of operation, the program reached a total of 129 beneficiaries: 92 per cent were female and 8 per cent male; 96 per cent of beneficiaries were married (Table 4).
Based on project documents, annual household income for the 129 beneficiaries before the project were all below Ps 48,000 (US$ 153) with 20 per cent earning less than Ps 12,001 (US$ 38). This indicates that at least 87 per cent of the ASKI/PACAP beneficiaries fall below the income poverty line with at least SO per cent of them falling below the food poverty threshold.16 After one year of project implementation, the income distribution showed an upward shift. The percentage of those earning below Ps 12,001 was reduced from 20 per cent to 3 per cent. Those earning Ps 36,001-48,000 (US$ 115-153) increased from 13 per cent to 26 per cent, while 2 per cent earn income in the Ps 48,001-60,000 (US$ 153-191) range.
In terms of loan usage (Table S), 41 per cent of the beneficiaries used the loan proceeds as additional capital while 59 per cent used it as start-up capital for their business. The beneficiaries were primarily engaged in vending and trading (Table 4): 38 per cent in vegetable/fruit vending, 26 per cent in small variety stores, and 30 per cent were market vendors. Four per cent (4 per cent) were engaged in cow/buffalo milk trading and the remaining in garment making and bakery operations. These activities reflected the predominantly rural economy of the area.
KMBI/UKMA
Information on the KMBI/UKMA program was obtained from a sample survey of 80 UKMA beneficiaries conducted in July 1994 (Table 4). UKMA beneficiaries consisted of microentrepreneurs living in the outskirts of Valenzuela and adjacent cities and municipalities including squatter resettlement sites. Of the borrowers interviewed, 89 per cent were women, and 85 per cent were married. In terms of educational attainment,
16 The official per capita poverty threshold in 1991 was Ps 6,106 for rural areas or Ps 42,472 per year for a family of seven. The food poverty threshold for 1991 was estimated at Ps 4,865 or Ps 34,005 for a family of seven. Food poverty threshold is determined based on the minimum daily nutritional requirements of a person. Average family size among the poor had been observed to be higher than the national average while those in the urban areas were lower than the national average.
27

Transaction Costs of Lending to the Poor: Philippine NGOs
Table 5 Distribution of NGO borrowers by features of latest loan
Intermediary KMBI ASKI KMBI ASKI Per cent of total Cumulative distribution
Amount (Ps) n= 80 129
Less than 5,000 19 N.D. 19 N.D. 5,000-6,000 18 37 6,001-7,000 24 61 7,001- 8,000 1 62 8,001-9,000 4 66 9,001-10,000 10 76 Over 10,000 24 100
Maturity n= 65
Less than 6 months 2 2 6-12 months 97 98 13-18 months 2 100 More than 18 months 0 100
Loan purpose* Business start-up 16 59 Business expansion 64 41 Business maintenance 28 0 Other 1 0 No response 8 0
Source: Uanto & Dingcong 1994 * Multiple responses for KMBI N.D. No data
18 per cent had reached the college or vocational level, while 44 per cent had reached the high school level. The remaining 38 per cent had received at least some elementary level education. Age-wise, 86 per cent of the respondents fell within the 25-54 years grouping, with 60 per cent in the 37-54 years grouping.
The respondents' estimates of annual family income before engaging in a microenterprise showed that 83 per cent of them had income below Ps 60,001. 17 In contrast, 80 per cent of respondents estimated their annual family income at the time of the interview to be more than Ps 60,000, indicating an improvement in incomes.
In terms of asset ownership, prior to engaging in microenterprise projects, 50 per cent reported that their assets were less than Ps 30,000, 20 per cent reported owning assets of more than Ps 30,000 while 30 per cent could not make an estimate of their asset worth.
17 Per capita poverty threshold for the National Capital Region (of which Valenzuela is part) was estimated at Ps 9,286 or Ps 55,716 for a family of six.
28

NGO/SHG micro/ending programs to the poor
Asked about current value, 72 per cent of respondents estimated current value of family assets to be more than Ps 30,000. Even considering those who could not make the initial estimate, at least 22 per cent had experienced an increase in asset ownership to over the 30,000 level. While the respondents' replies show a very substantial improvement in income and asset ownership when compared against their pre-loan situation, these figures should at best be taken as indicative estimates only, due to the absence of baseline data prior to project implementation and the difficulty of making income estimates.
KMBI was the main source of credit for the respondents with 92 per cent of74 respondents reporting KMBI as their source of current loans. The most frequently cited reasons (multiple responses) for accessing KMBI loans included acceptable interest rate (96 per cent); easy repayments (80 per cent); free and good business advice (68 per cent); a view of KMBI as a sympathetic organisation to deal with (68 per cent); and the fact that no collateral is required (54 per cent).
In terms of number ofloan cycles from KMBI, 39 per cent of74 reported having obtained a third loan from KMBI while 59 per cent reported having at least a second loan from KMBI. In terms of loan size, 12 per cent reported that their first loans were over Ps 9,000, but 73 per cent reported receiving first loan amounts below Ps 6,001. For 29 respondents who have received their third loans, 48 per cent or 14 received loan amounts of more than Ps 10,000. Only 21 per cent received loan amounts ofless than Ps 6,001.
In terms ofloan usage (Table 5), out of 80 respondents, 16 per cent used borrowed money to start up a business, 64 per cent used borrowed money for business expansion, 28 per cent for business maintenance, and one respondent used borrowed money for house improvement. Regarding the types of businesses engaged in by the KMBI clients, most were trading and trading-related activities: 31 per cent in the variety store business, 24 per cent in various vending ventures (vegetables, fish, water, fruits, brooms), and 14 per cent in buying and selling of assorted goods, ready to wear clothing, scrap material, baby dresses, and rice among others. Eleven per cent (11 per cent) were into consumer product dealership, and 9 per cent were in the mini-restaurant business. Other businesses engaged in included room rental, plastic cup recycling, and piggery (multiple responses).
The bulk of the respondents estimated a very low initial start-up capital with 79 per cent of the respondents estimating that the start-up capital invested in their microenterprise was less than Ps 6,000. Only 8 per cent reported investments of over Ps 10,000.
The respondents were asked about the usefulness ofUKMA meetings. The top four responses were: sharing of business experience and problems (40 per cent); more knowledge in running a business (25 per cent); ability to seek advice from co-borrowers and fellowship with co-borrowers (both at 10 per cent).
When asked to identify the types of improvement in their families' quality of life due to KMBI loans, the respondents mentioned the following: improved/better house facilities (74 per cent); improved/better/more food (69 per cent); improved/better/more education (58 per cent); improved/better hygiene and/or health (55 per cent); and improved/better/more clothing (53 per cent).
29

Tr11ru11etion Costs of Lending to the Poor: Philippine NG<h
The borrower income profile confirms that the NGO clients are poor (defined as falling below the poverty threshold). In addition, they indicated that their incomes showed considerable improvement after having obtained a loan and engaging in microenterprise activities. In the case of the UKMA respondents, the respondents perceive the loan program as having a positive effect on their quality of life.
30

Chapter 6 PROFILE OF BANKS
AND COOPERATIVES
The previous section provided a profile and description of the NGOs and their lending programs that were the subject of this study. To put the comparison of transaction costs among various credit intermediaries into perspective, this section provides a profile of the banks and cooperatives that were the subject of the Llanto and Dingcong study.
6.1 Areas of operation
The institutions selected for the Llanto and Dingcong study were taken from five provinces considered to be major agrarian reform areas. These were: Camarines Sur in the Bicol Region in Southern Luzon, Leyte in the Eastern Visayas Region, Iloilo in the Western Visayas Region, Zamboanga del Sur in Western Mindanao, and Bukidnon in Northern Mindanao.
6.2 Organisational profile
A total of 34 banks, 7 credit cooperatives, 16 multi-purpose cooperatives, and six self-help groups/people's organisations were selected for the study. Table 6 provides a comparative profile of these financial intermediaries, including those of KMBI and ASKI. The banks had been in operation for an average of 14 years with 38 per cent of these having been in operation for 10 to 15 years and 71 per cent in operation for 15 years or less. For the credit cooperatives, the average number of years in operation was 11 while it was five for the multi-purpose cooperatives. Compared to both the banks and the credit cooperatives, the NGOs had been in operation for a shorter period of time.
Table 6 Comparative profile of intermediaries reviewed
Intermediary Banks Credit coop MP coop KMBI ASKI Data as of: June 1990 CY 1993 FY06/94
Number reporting 34 7 16
Years in operation* 14 11 5 7 7
Number of staff (hired}* 19 7 13 22 15
Number of deposit accounts* 5,120 N.D. N.D. N.D. N.D.
Number ofloan accounts* 1,283 920 348 2,668 919
Number of members* NIA 249 235 1,638 919
Sources: Llanto & Dingcong 1994; NGO records * Data for banks and cooperatives are averages. NIA Not applicable N.D. No data available
31

Transaction Costs of Lending to the Poor: Philippin#! NGOs
Table 7 Assets, liabilities and networth of sample intermediaries (in million pesos)
Intermediary Banks Cooperatives NGOs PKBs Thrift RBs SGBs Credit Multi-purpose KMBI ASKI
Farmer Non-farmer Data as of: June 1990 Various periods, 1990 CY 1993 FY06/94
Number reporting 2 2 10 10 7 8 8
Assets 65.6 69.6 12.8 70.2 7.7 2.56 2.98 13.51 17.18
Deposit liabilities* 29.6 68.2 3.3 32.8 N.D. N.D. N.D. 1.67 1.88
Total liabilities 63.7 69.6 10.1 70.1 1.64 1.15 2.29 6.75 11.4
Borrowings from 0.1 *** 3.8 21.7 N.D. N.D. N.D. 4.85 9.44 other banks/CB**
Net worth/ 1.9 0.0 2.7 0.1 6.07 1.41 0.59 6.76 5.77 Fund balance
As a percentage of total assets
Assets 100 100 100 100 100 100 100 100 100
Deposit liabilities 45 98 26 47 N.D. N.D. N.D. 12 11
Total liabilities 97 100 79 100 21 45 77 50 66
Borrowings from 0 0 30 31 N.D. N.D. N.D. 36 55 other banks/CB
Net worth/ 3 0 21 0 79 55 20 50 34 Fund balance
Sources: Llanto & Dingcong 1994; NGO records * For NGOs, represent members' savings and capital build-up. ** For NGOs, borrowed funds sources include banks, foundations, other NGOs and government agencies. ***Less than Ps 0.50 million N.D. No data
The banks had an average of 1,283 loan accounts per branch or unit with half of them having 1,000 or less accounts. The credit cooperatives had an average membership of 249 with four out of six having members in the 101-500 range and two with a membership base of over 500. The average membership of the multipurpose cooperatives was 235 but five had members in the 101-500 range and four had members of over 500. In comparison, KMBI had 2,668 accounts with 1,638 members whileASKI had 919 accounts and members. KMBI had double the loan accounts of both the banks and the credit cooperatives. ASKI, on the other hand, had about the same level of loan accounts.
In terms of number of hired or paid personnel, the banks averaged 19 personnel with 56 per cent having 11-20 staff and 15 per cent having 6-10 staff. The 16 multi-purpose cooperatives averaged 13 staff with five not having any hired staff and nine having staff of 10 or less. The eight credit cooperatives had an average of seven staff with four having five or fewer staff, one without any hired staff and two having 11-20 staff. This compares with KMBl's 22 and ASKl's 15. In general, the cooperatives had fewer hired staff and relied considerably on volunteer services of their members.
32

Profil.e of banks anJ cooperatives
Table 7 summarises key balance sheet accounts of the sample institutions, including those of KMBI and ASKI. As expected, banks had the highest level of assets ranging from a high average of Ps 70.2 million for special government bank branches (SGBs) to a low average of Ps 12.8 million for rural banks (RBs). The credit cooperatives' average asset was at Ps 7.7 million while it ranged from Ps 2.6 million to Ps 2.9 million for the multi-purpose cooperatives. It is interesting to note that the asset size of the two NGOs are in the scale of the rural banks.
Among bank types, the thrift banks had the highest ratio of deposit liabilities to total assets which is consistent with their basic mission. This is followed by the SGB branches and the private commercial bank (PKB) branches. The rural banks had the lowest proportion of deposit liabilities to total assets. In both KMBI and ASKI, members' savings and capital build-up deposited with the NGOs were only 11 per cent of total assets as regulations do not allow NGOs to cake deposits.
Another interesting observation is that the credit cooperatives and the NGOs have very substantial networth or fund balances.18 The figures are significantly higher than those of the commercial bank branches and the rural banks. Cooperatives, particularly credit cooperatives, rely more heavily on internally generated funds and the fixed deposit and share capital of members. In the case of the two NGOs, grants and donations specifically earmarked as loan funds comprise the bulk of this fund balance.
Table 8 recasts the NGOs' receipts and disbursements by separating the interest and other fees from lending operations from receipts and donations. The resulting figures show that the two NGOs under consideration have gross incomes from their lending operations which were comparable with those of the commercial bank branches. On the other hand, a corresponding adjustment on the expense side was not made. The substantially higher proportion of expenses of the NGOs indicate expenditures which are grant fund related. It also reflects the investment that is put into capability building of clients.
Table 9 provides an indication of the extent to which the bank types service the credit requirements of the poor. Among the client types, those classified under the agricultural group represent the rural poverty sectors. Only one out of nine rural banks and four Land Bank of the Philippine (LBP) field offices cited having agrarian reform beneficiaries as their clients. On the other hand, four out of six private commercial banks (PKBs), the Philippine National Bank (PNB), one cooperative rural bank, and all special government banks (except the Philippine Amanah Bank) had serviced marginal fishermen/farmers. Two cooperative rural banks,19 one Development Bank of the Philippines (DBP) branch and five LBP field
18 As a reference, the minimum capitalisation required by the Central Bank of the Philippines (as of 1992) for a commercial bank with FCDU license was Ps l, 125 billion. Ps 50 million for thrift banks operating in 4th class municipalities, and Ps 2 million for rural banks operating outside Metro Manila and First Class A cities. On the other hand, cooperatives and NGOs are not under the Central Bank's direct supervision and there is no minimum capital requirement for them.
19 The cooperative rural banks are owned by cooperatives which are composed of small farmers and microentrepreneurs in the countryside.
33

Trdnsaction Costs of I.Anding to the Poor: Philippine NGOs
Table 8 Income and expenses of sample intermediaries (in million pesos)
Banks NGOs Intermediary PKBs RBs SGBs KMBI ASKI Data as of: June 1990 CY 1993 FY06/94
Number responding 2 9 8
Gross income* 2.7 1.1 4 2.32 1.98 Operating expenses 1.5 0.8 2.5 2.96 2.82 Net income 1.2 0.3 1.5 -0.64 -0.84
As a percentage of gross income Gross income 100 100 100 100 100 Operating expenses 56 73 63 128 142 Net income 44 27 38 -28 -42
Sources: Llanto & Dingcong 1994; NGO records *Gross income ofNGOs consists oflending related earnings (that is, interest and service charges); grants and donations excluded.
offices also serviced the credit requirements of cooperatives/farmers' groups. Information on the clientele type being serviced will be helpful in the review of bank transaction costs.
Out of the total organisations surveyed in the Llanto and Dingcong study, the responses of 16 banks, six credit cooperatives and eight multi-purpose cooperatives were included in the analysis of transaction costs by Casuga. The breakdown of the bank respondents was seven rural banks (RBs), one cooperative rural bank (CRB), two commercial bank branches (PKBs), and six special government banks (SGBs) consisting of three Land Bank of the Philippines Field offices, two Development Bank of the Philippines branches and one branch of the Philippine Amanah Bank.
6.3 Borrower profile
Information on the borrowers of the Casuga study was obtained from a survey of 105 bank clients and 98 cooperative and self-help group clients. These are summarised in Table 10 and Table 11. Average age of borrowers ranged from 46 to 50 years old. Banks had more male clients than women clients while non-bank financial intermediaries (NBFis) had 40 per cent male clients and 60 per cent female clients. This contrasts with the two NGOs which had over 89 per cent women clients. The educational attainment profile of the bank clients, NBFI clients, and NGO clients was almost similar with the bank and NBFI clients showing a higher proportion of those having reached college. The lower educational profile of KMBI's clients is consistent with their deliberate effort at targeting the poor. Note, however, that the incidence of those having no formal schooling is low among all client types. This is consistent with the observed high literacy rate in the country.
A comparison of the income distribution pattern of bank clients with NBFI clients shows that the NBFis had more clients with lower incomes (Table 10). While the banks had a
34

Table 9 Client types provided/serviced with loans by banks in 1989, by type of bank
Bank type RB SGB Total
LBP LBP Field
PKB PNB TB RB CRB Total DBP Branch Office PAB Total No. %
Commercial Businessmen/Traders 6 2 6 9 0 9 6 3 0 1 10 33 32.7 Merchandise firm 1 0 1 1 0 1 0 0 0 0 0 3 3.0 Exporters 0 0 0 0 0 0 0 1 0 0 1 1 1.0 Market vendors 0 0 0 0 0 0 0 0 0 1 1 1 1.0
Industrial Manufacturing firm 1 0 0 0 0 0 0 1 0 0 1 2 2.0 Rice millers 1 0 0 0 0 0 0 1 0 0 1 2 2.0 Contractors 1 0 0 0 0 0 0 0 0 0 0 1 1.0
VJ I Small and medium enterprises 1 0 4 2 0 2 1 0 0 1 2 9 8.9 Vl
Agricultural Agrarian reform beneficiaries 0 0 0 1 0 1 0 0 4 0 4 5 5.0 Marginal farmers/Fisherfolk 4 3 0 0 1 1 3 2 2 0 7 15 14.9
Institutional Cooperatives/Farmers' groups 0 0 0 0 2 2 1 0 5 0 6 8 7.9 Rural financial institutions 0 0 0 0 0 0 0 0 3 0 ·3 3 3.0 ~
Professional/ Service workers !\'"
Teachers 0 0 0 0 0 0 1 0 0 0 1 1 1.0 ~ Military 0 1 1 8 0 8 0 0 0 0 0 10 9.9 t Politicians 0 0 1 0 0 0 1 0 0 0 1 2 2.0 !-Overseas workers 0 0 3 1 0 1 1 0 0 0 1 5 5.0 ~
l Total 15 6 16 22 3 25 14 8 14 3 39 101 100 a
~ No answer 0 0 0 1 0 1 0 0 0 0 0 "' i
Source: Llanto & Dingcong 1994 ~· ~

Transaction Costs of LenJing to the Poor: Philippin. NGOs
Table 10 Profile of sample clients of banks and NB Fis
Client type Bank clients NBFI clients
Private banks 71 Credit cooperatives 48 Government banks 34 Multi-purpose cooperatives 44 Total 105 Self-help groups 6
Total 98
Banks NB Fis Banks NB Fis % % Cumumative distribution
Age 35 years and below 10 16 IO 16 36-45 27 32 36 48 46-55 30 33 67 81 56-65 30 9 96 90 over 65 years old 4 IO IOO 100 Average 50 46
Sex Male 63 40 Female 37 60
Educational attainment Postgraduate 0 1 0 1 College level/Graduate 28 28 28 29 Vocational level/Graduate 1 1 29 30 High school level/Graduate 30 30 58 59 Elementary level/Graduate 39 37 97 96 No formal schooling 0 3 97 99 No response 3 1 100 IOO
Size of household Average 7 7
Major occupation/Source of income Farming 75 72 Fishing 0 0 Livestock raising 7 6 Business 19 18 Practice of profession 26 24 Cooperative 0 0 Ochers 9 8
Estimated annual gross income (Ps) n= 102 97 7,199 and below 18 19 18 19 7,200-14,399 16 22 34 41 14,400-21,599 13 14 47 55 21,600-35,999 16 18 63 73 36,000-59,999 13 11 76 84 60,000-120,000 14 IO 90 94 Over 120,000 12 6 100 100
Average 41,666 32,036
Farmer type Agrarian reform beneficiary 56 31 Non-ARB 44 69 Total farming clients IOO 100
Source: Llanto & Dingcong 1994
36

Profile of banks anJ cooperatives
Table 11 Distribution of respondent borrowers of banks and NB Fis, by features of latest loan
Intermediary RBs GBs All banks Credit Multi-purpose cooperative cooperative
n= 71 34 105 28 64 Per cent of total
Amount (Ps)
64 32 96 27 53 100-1,000 5 0 3 11 21 1,001-5,000 58 56 57 44 40 5,001-10,000 19 31 23 26 23 10,001-25,000 9 13 10 19 17 25,001-60,000 9 0 6 0 0 Ave. amount 9,791 6,709 8,415 5,945 5,216
Maturity 48 24 72 26 52
6 mos. and below 23 54 33 88 63 Over 6 mos. to 1 year 75 33 61 12 21 Over 1 year to 3 years 0 8 3 0 15 Over 3 years 2 4 3 0 0
Ave. maturity (mos.) 11 12 12 5 8
Loan purpose Farm development 59 85 68 25 44 Livestock 4 6 5 0 3 Business 11 6 10 54 25 Consumption 17 0 11 21 16 No response 8 3 7 0 13 Total 100 100 100 100 100
(Cumulative frequency distribution) RBs GBs All banks Credit Multi-purpose
cooperative cooperative
Amount 100-1,000 5 0 3 11 21 1,001-5,000 63 56 60 56 60 5,001-10,000 81 88 83 81 83 10,001-25,000 91 100 94 100 100 25;001-60,000 100 100 100 100 100
Maturity 6 mos. and below 23 54 33 88 63 Over 6 mos. to 1 year 98 88 94 100 85 Over 1 year to 3 years 98 96 97 100 100 Over 3 years 100 100 100 100 100
Source: Uanto & Dingcong 1994
37

Transaction Costs of LenJing to the Poor: Philippine NGOs
significant proportion of borrowers (76 per cent) with incomes below Ps 60,000, the high proportion could be the result of the inclusion of 34 government bank borrowers.20
Comparing NGO program members with those of banks and NBFis shows that the NGOs had a higher proportion of those falling below the poverty threshold. Almost all of the ASKl/PACAP members had incomes falling below the poverty threshold with 87 per cent falling below the food poverty threshold (Table 4). For KMBI, all of the respondents reported pre-program incomes below the poverty threshold. As described previously in Chapter 5, the NG Os deliberately target the poor. In contrast, it is not in the mission of the banks and cooperatives to target the poor.
6.4 Lending policies, terms and conditions
This section briefly describes the lending policies of banks and cooperatives and compares them with those of the NGOs described in the previous section. This comparison is important to put transaction costs of the different types of financial intermediaries into perspective, since costs are clearly a result of these policies.
As is expected, banks grant loans on the basis of an applicant's 'bankability'. The banks in the Casuga study identified and ranked five major factors used in evaluating loan applications:
(I) project viability
(2) reputation/character of borrower
(3) capacity to pay
(4) marketability of collateral
(5) sources of income.
Among these factors, reputation and character and marketability of collateral were the two factors most commonly ranked highest. Project viability as a factor was commonly ranked second and third. These factors rule out the possibility of the poor's access to formal credit unless alternatives are available. In fact, the study concluded that as a result of the uncertainty in land tenure resulting from the agrarian reform program, agrarian reform beneficiaries had problems of access to credit.
Cooperatives on the other hand are membership-based organisations. Loans are granted exclusively to members with the loan amount computed as a multiple21 of the member's fixed deposits or share capital. Collateral is required only for large loan amounts. By comparison, KMBI and ASKI did not require collateral for small loans (below Ps 25,000) and require only a 5 per cent compulsory savings from the loan proceeds.
20 Government banks have specific mandaces co secvice che credic requirements ofidentified prioricy sectors such as agrarian reform beneficiaries.
21 The commonly used muhiple for a firsc-time member borrower is twice the member's fixed deposits and chree times for repeat borrowers.
38

Chapter 7 TRANSACTION COSTS OF LENDING TO THE POOR
An alternative credit delivery mechanism to the poor that has been identified in several workshops and consultations under the Banking with the Poor project is the bank-NGO-SHG-poor linkage. The transaction costs of lending are an important factor in the viability of this credit delivery mechanism. The components and the size of the transaction costs oflending differ among banks and other lending institutions, and these determine to a great extent their willingness to lend to the poor. Their ability to service the poor is indicated by the average loan size reported by the surveyed credit institutions. This section discusses the transaction costs of NGOs and self-help groups. For comparison purposes, the transaction costs of banks and cooperatives will also be discussed.
The analysis of transaction costs of each intermediary will cover total transaction costs, transaction costs broken down by activity, a breakdown of how the costs are allocated across the sub-activities falling under lending costs (LC), transaction costs per loan account granted, transaction costs per peso ofloans granted, and transaction costs per peso ofloans outstanding.
7.1 Transaction costs of banks
How much are the hank's transaction costs if it were to lend directly to small and poor borrowers? How would this compare with the transaction costs of banks if, instead, they were to lend through a credit intermediary such as an NGO or a cooperative? For the first approach (that is, the direct lending approach), we present the earlier estimates done by Casuga (1994). A word of caution here is that the branches of private commercial banks and even the rural banks which were included in Casuga's sample survey reported that the agrarian reform beneficiaries were only roughly 5 per cent of all their borrowing clients. This appears to be the general picture insofar as the private banking system is concerned. Initially, the Land Bank directly lent to individual agrarian reform beneficiaries, but it soon shifted to wholesaling the loans to the rural banks and the cooperatives because of its desire for a greater outreach of clients, easier monitoring, and lower transaction costs and loan default risks on its part.
We review the transaction costs of four types of banks: the private commercial bank branches (PKBs), the rural banks (RBs), the cooperative rural banks (CRBs), and the special government banks (SGBs). Among the four types of banks listed in Table 12, commercial banks (PKBs) had the highest average amount ofloans released at Ps 38.130 million followed by special government banks at Ps 10.7.22 million. The cooperative rural banks (CRBs) with Ps 4.897 million had the lowest average amount ofloans released. PKBs had the highest average loan size at Ps 149,000 (US$ 5,708) while the CRBs had the lowest average loan size at Ps 6,200 (US$ 237). In terms of number ofloans, the CRBs had
39

Transaction Costs of Lending to the Poor: Philippine NGOs
Table 12 Operational highlights, by type of financial intermediary
Intermediary type Banks Cooperatives NGOs PKBs RBs CRBs SGBs Credit MP KMBI ASKI
Amount ofloans 38,130 7,600 4,897 10,722 1,315 1,757 19,139 876 granted (P'OOO)*
Loans outstanding 29,233 9,526 17,364 31,328 7,788 1,398 7,856 493 (P '000)*
Number ofloans* 256 582 791 143 920 348 2,525 196 Average loan size* 148,945 13,058 6,191 74,979 1,429 5,049 7,580 4,469
Total transaction costs 2,330 1,153 1,304 3,138 488 326 2,668 412
Number of respondent 2 7 6 6 8 organisations
Sources: Llanto & Dingcong 1994; NGO records *Loan amount, loans outstanding, number ofloans and average loan size of banks and cooperatives were derived from total cost, cost /loan account granted, cost/peso ofloans granted, and cost/peso ofloans outstanding figures.
released the most at 791 with the SGBs the least at 143. The RBs and CRBs had lower average loan sizes (below Ps 13,000 or US$ 497) but had processed more loan accounts. The SGBs and PKBs on the other hand had processed fewer loans but their average loans were substantially larger.
As noted in Table 9, PKBs and RBs basically offer individual loans while the CRBs and the SGBs offer a combination of individual and institutional loans. Given their lower average loan size and orientation towards individual lending, the rural banks' figures would provide a better approximation of banks' individual lending in small loan sizes, which we will use as a substitute estimate for direct lending co the poor.
A broad indication of the average annual loan turnover of the intermediaries may be obtained by taking the ratio of loans released to loans outstanding and dividing by two. Alternatively, dividing twelve months by the average turnover in a year would give a rough estimate of the average loan term expressed in months. Based on this, the PKBs had a turnover ratio of 0.65 times or about eighteen (18) months, the rural banks had a 0.40 turnover or about thirty (30) months, while both the CRBs and the SGBs had loan terms that were over seventy (70) months. In the case of the government banks, this could be due to the long-term loans given to bigger business enterprises and institutional borrowers. In the case of the CRBs, it could be due to the long-term loans given to member cooperatives.
7.1.1 Total transaction costs
SGBs had the highest average total transaction costs (LTC) at Ps 3.138 million, followed by the commercial banks at Ps 2.330 million. The transaction costs of rural banks and cooperative rural banks were substantially lower at Ps 1.153 million and Ps 1.304 million
40

Transaction costs
respectively (Table 13). The total transaction costs vary across bank types due to differences in the banks' scale of lending operations.
7.1.2 Transaction costs by activity
Table 13 provides a breakdown of transaction costs (LTC) into four categories: self-help group promotion (SC), lending operations (LC), funds mobilisation (FC), and general administrative and other costs (GC/OC). (To provide an easier comparison, the lower section of Table 13 shows the self-help group promotion (SC), lending operations (LC), and funds mobilisation costs (FC) with the general administration and other expenses (GC/OC) allocated proportionately among these costs.) As can be noted, none of the banks incurred any costs for self-help group promotion. Except for the PKB branches, lending activities comprised the bulk of bank transaction costs: (private) rural banks (RBs), 63 per cent; cooperative rural banks (CRBs), 44 per cent; and special government banks (SGBs), 64 per cent. The CRBs' lower proportion of resources allocated to lending activities could be due to their group lending operations which would be expected to decrease lending costs. The special government banks, especially the Land Bank of the Philippines, spent more resources in lending activities than both rural banks and cooperative rural banks because of high loan processing and loan recovery costs.
In contrast, the private commercial banks spent more time and resources in funds mobilisation. This is true both as a proportion of total costs (49 per cent) and in absolute terms (Ps l, 132). It was 28 per cent for rural banks, 38 per cent for cooperative rural banks and 19 per cent for special government banks. The rural banks had access to the Land Bank's rediscount window and agrarian reform credit, while the special government banks had a monopoly of government deposits. Neither, therefore, were as compelled to mobilise savings as the private commercial banks. Some cooperative rural banks22 also had access to
the Land Bank's rediscount window, but they also mobilise deposits from their member cooperatives. These findings confirm earlier observations of the Philippine financial markets that the private commercial banks use their extensive branching network as a deposit-mobilisation arm in the countryside.
However, there has been a change in the business strategy of commercial banks in the countryside. Some of them have bought rural banks which operate as independent units mobilising savings and lending to the smaller borrowers in their areas of operation, while they continue to lend to manufacturing, industry, agribusiness enterprises and commercial farms. This strategy of using the rural banks as credit intermediaries may be useful in reaching the poor, but this depends also on the internal policies and procedures of the rural bank which operates as an independent unit bank.
7.1.3 Composition oflending costs
Table 14 shows the composition of lending costs (LC) of the different types of banks and non-bank financial institutions (NBFis). For all types of banks, loan recovery costs
22 Please note that Llanto and Dingcong's survey was done in agrarian reform areas.
41

Table 13 Average transaction costs, by activity, by type of financial intermediary (P'OOO) ~ Iii
~ Intermediary rype Banks Cooperatives NGOs
s· ;s
PKBs RBs CRBs SGBs All banks Credit MP KMBI ASKI ~ ... (Ps) o/o {Ps) o/o (Ps) o/o (Ps) o/o (Ps) % (Ps) % (Ps) % {Ps) % (Ps) % ti'
~ !;'
Activity ~ ;s· SHG promotion (SC) 0 0 0 0 0 0 0 0 0 0 0 0 0 0 586 22 88 21 ~
~
Lending operations (LC) 877 38 722 63 573 44 2,005 64 1,213 59 257 53 246 75 1,175 44 215 52 ~ Funds mobilisation (FC) 1,132 49 319 28 493 38 588 19 532 26 149 31 32 10 405 15 68 17 ~
Cl :t
General admin/Others 321 14 112 10 238 18 545 17 309 15 82 17 48 15 502 19 41 10 ~ (GOOC) ....: ~·
Total transaction costs (LTC) 2,330 100 1,153 100 1,304 100 3,138 100 2,054 100 488 100 326 100 2,668 100 412 100 ~
""" I i" N
~ Total transaction costs with allocated general ad.min. costs I ~
Intermediary type Banks Cooperatives NGOs
PKBs RBs CRBs SGBs All banks Credit MP KBMI ASKI
(Ps) o/o (Ps) % (Ps) % (Ps) o/o {Ps) % (Ps) % (Ps) % (Ps) % (Ps) %
Activity
SHG promotion (SC) 0 0 0 0 0 0 0 0 0 0 0 0 0 0 722 27 98 24
Lending operations (LC) 1,017 44 800 69 701 54 2,426 77 1,428 70 309 63 288 88 1,447 54 239 58
Funds mobilisation (FC) 1,313 56 353 31 603 46 712 23 626 30 179 37 38 12 499 19 76 18
Total transaction costs (LTC) 2,330 100 1,153 100 1,304 100 3,138 100 2,054 100 488 100 326 100 2,668 100 413 100
Sources: Llanto & Dingcong 1994; Interviews with NGOs

Transaction costs
Table 14 Component of lending costs, by activity, by type of financial intennediary (P'OOO)
Banks Cooperatives Intermediary rype PKBs RBs CRBs SGBs Credit Multi-purpose
o/o of o/o of o/o of o/o of o/o of o/o of (Ps) Total (Ps) Total (Ps) Total (Ps) Total (Ps) Total (Ps) Total
Lending activities
Advertising and 24 3 28 4 74 13 97 5 0 0 3 promotions
Planning and 34 4 42 6 24 4 llO 5 2 45 18 programming
Loan processing (investigation- 455 52 300 42 161 28 860 43 110 43 148 60 release)
Loans recovery 364 42 352 49 314 55 938 47 144 56 so 20
Total lending 877 100 722 100 573 100 2,005 100 257 100 246 100 activities
Sources: Llanto & Dingcong 1994; interviews with NGOs
comprise almost half of the lending costs, with cooperative rural banks having the highest amount of resources devoted to it (55 per cent). The private commercial banks showed their very conservative character as they spent more time and resources in loan screening and processing which made possible the lowest proportion of loan recovery costs among all bank types.
7.1.4 Transaction costs per loan account granted
The estimated transaction costs per loan account granted were highest for the special government banks at Ps 21,944. This was followed by the commercial banks at Ps 9,101. Again, the rural banks and the cooperative rural banks had the lowest transaction costs per loan account granted at Ps 1,981 and Ps 1,648 respectively (Table 15). Out of the total transaction costs, lending costs (LC) were Ps 3,973 for commercial banks, Ps 1,374 for rural banks, and Ps 886 for cooperative rural banks. While the cooperative rural banks had a higher total transaction costs compared with the rural banks, their transaction costs per loan account granted were lower because they processed more loans than the rural banks.
7.1.5 Transaction costs per peso of loans granted
As is to be expected, private commercial bank branches had the lowest transaction costs per peso ofloans granted at 0.061 (Table 16). These low costs were due to the big amount of loans that the PKB branches released for the period. The special government banks had the highest transaction costs per peso ofloans granted at 0.292. The SGBs' loan volume was not high enough to offset their high total transaction costs. While the rural banks and cooperative rural banks had lower total transaction costs, their transaction costs per peso of loans granted were higher than that of the PKBs because of the substantially smaller loan
43

Transaction Costs of Lending to the Poor: Philippine NGOs
Table 15 Transaction costs per loan account granted, by activity, by type of financial intermediary (Ps)
Intermediary type Banks Cooperatives NGOs
PKBs RBs CRBs SGBs Credit MP KMBI ASKI
SHG promotion cost (SC) 0 0 0 0 0 0 286 499
Lending operations {LC) 3,973 1,374 886 16,968 336 829 573 1,218
Funds mobilisation (FC) 5,128 607 762 4,976 195 108 198 385
Total transaction costs (LTC) 9,101 1,981 1,648 21,944 531 937 1,057 2,102
Sources: Llanto & Dingcong 1994; NGO records and interviews
amounts that they processed. While they had processed more loans, the average loan size (Ps 13,000 for RBs and Ps 6,191 for CRBs) was much smaller than the PKBs' average loan
size of Ps 149,000, resulting in a lower total amount ofloans released and, consequently, a
higher cost per peso _ofloans granted. Between the RB and the CRB, the transaction costs per peso of the CRBs were higher than those of the RBs because their higher total costs and lower loan volumes.
The same situation is observed for the lending costs component (LC) of total transaction
costs (Table 16). Private commercial banks had the lowest lending costs of 0.027. The rural banks with 0.105 and cooperative rural banks with 0.143 had comparatively lower lending
costs than the special government banks with 0.226, since these bank types had the comparative advantage in screening loan applications and enforcing loan contracts in the countryside. In addition, the special government banks sometimes suffer from the
perception that loans secured from the government have lower priority in loan repayment.
Except for the SGBs, an inverse relationship between the average loan size and the
transaction costs per peso ofloans granted is observed. Under the prevailing operational circumstances of these bank types (for example, lending policies, terms, cost structure),
smaller loans are costlier than larger loans on a per peso of loans basis.
7.1.6 Transaction costs per peso of loans outstanding
The resulting transaction costs per peso of loans outstanding computations in Table 17 show that the cooperative rural banks had the lowest costs at 0.075, followed by the commercial banks at 0.08, SGBs at 0.10 and the rural banks at 0.121. The corresponding
lending costs were: PKBs, 0.035; RBs, 0.084; CRBs, 0.040; and SGBs, 0.077. The rural
banks had the highest ratio as they had the lowest amount of loans outstanding at Ps 9.526 million. The low ratio for the CRBs and SGBs was due to their higher loans outstanding balances. It should be noted, however, that the loans outstanding figures for CRBs and SGBs indicate loan maturities of over five years.
The resulting costs per peso of loans granted and costs per peso of loans outstanding of the
PKBs, CRBs and RBs indicate an inverse relationship between transaction costs and loan
44

Transaction costs
Table 16 Transaction costs per peso of loans granted, by activity, by type of financial intennediary (Ps)
Intermediary type Banks Cooperatives NG Os
PKBs RBs CRBs SGBs Credit MP KMBI ASKI
SHG promotion cost (SC) 0 0 0 0 0 0 0.038 0.112
Lending operations (LC) 0.027 0.105 0.143 0.226 0.235 0.164 0.076 0.273
Funds mobilisation (FC) 0.034 0.046 0.123 0.066 0.136 0.021 0.026 0.086
Total transaction costs (LTC) 0.061 0.151 0.266 0.292 0.371 0.185 0.140 0.471
Sources: Llanto & Dingcong 1994; NGO records and interviews
sizes: transaction costs increase with a decrease in loan size. In conclusion, private commercial banks in general do not lend to small borrowers. This was confirmed by the PKBs' survey responses (Table 9) and their large average loan size. Their lower total transaction costs per peso of loans granted and per peso of loans outstanding are due to the fact that they cater to the bigger borrowers in the countryside.
The rural banks' experience in comparison with that of the PKBs shows that the transaction costs of retail lending are higher. While the rural banks incur only half the total transaction costs of commercial banks (Ps 1.553 million vs Ps 2.330 million) their experience shows that the transaction costs oflending in smaller amounts is much more expensive. The rural banks' lending costs (LC) per peso of loans granted were four times that of the PKBs, and their lending costs (LC) per peso of loans outstanding were higher by 50 per cent. This is despite a longer average loan maturity period of 30 months compared to 18 months for the commercial banks. It is also worth mentioning that the rural banks' average loan size of Ps 13,000, while small, is still double that of KMBI's average loan size, and almost three times that of the ASKI/PACAP program. Assuming rural banks maintain the same lending approach, a decrease in loan size below the current average of Ps 13,000 would likely result in a further increase in transaction costs.
Table 17 Transaction costs per peso of loans outstanding, by activity, by type of financial intennediary (Ps)
Intermediary type Banks Cooperatives NG Os
PKBs RBs CRBs SGBs Credit MP KMBI ASKI
SHG promotion cost (SC) 0 0 0 0 0 0 0.092 0.198
Lending operations (LC) 0.035 0.084 0.040 0.077 0.040 0.206 0.184 0.484
Funds mobilisation (FC) 0.045 0.037 0.035 0.023 0.023 0.027 0.064 0.153
Total transaction costs (LTC) 0.080 0.121 0.075 0.100 0.063 0.233 0.340 0.835
Sources: Llanto & Dingcong 1994; NGO records and interviews
45

Transaction Costs of Lending to the Poor: Philippine NG Os
If individual lending directly to the poor seems to be relatively costly, how does a group lending strategy compare? What is the magnitude of total transaction cost incurred by other types oflenders, that is, cooperatives and NGOs which have used group lending as a strategy for lending to the poor?
7.2 Transaction costs of cooperatives
Here we compare the transaction costs of two types of cooperatives: the credit cooperative and the multi-purpose cooperative. These cooperatives have as members the small farmers, fisherfolk, microentrepreneurs and small merchants in both rural and urban areas, and may be considered as catering in general to the credit demand of small and poor borrowers (see Uanto 1994b for a related study). There is an ongoing debate among the Philippine cooperative federations as to which type of cooperative is most suitable to act as credit institution/intermediary. One school of thought says that the credit cooperatives are better structured to act as credit institutions because of their specialisation in financial activities. This is in contrast to the multi-purpose cooperatives which spread scarce managerial and administrative talent and skills too thinly over a number of financial and non-financial activities, with the consequence, allegedly, that they do not function as efficient credit institutions. The opposing view is chat integrated or multi-purpose cooperatives are better able to address the various financial and non-financial needs of members than a specialised institution. Everything is under one roof and therefore the members are better served by multi-purpose cooperatives. Pending further study and investigation, we cannot yet take a position on chis debate. However, the information reported here would be useful in such discussions.
Referring to Table 12, the average value ofloans granted by the credit cooperatives (Ps 1.315 million) was about 75 per cent that of multi-purpose cooperatives. However, in terms of individual loan sizes, credit cooperatives not only lent out in much smaller amounts {Ps 1,429 as compared to Ps 5,049), they also had a greater number of accounts (920 as against 348) compared to multi-purpose cooperatives.
7.2.l Total transaction costs
The average total transaction costs of credit cooperatives and multi-purpose cooperatives were both below Ps 500,000 with the credit cooperatives having an average total transaction cost that was 50 per cent more than the multi-purpose cooperatives. The low total transaction costs of both types of cooperatives are likely due to the fact that cooperatives-in particular, small ones-rely a lot on the volunteer work of their officers. Furthermore, the loans screening procedure is fairly simple with loan eligibility based on membership and loanable amounts computed as a multiple of fixed deposits.
7.2.2 Transaction costs by activity
In terms of transaction costs by activity {Table 13), multi-purpose cooperatives used more time and resources (75 per cent) in lending activities-that is, screening, processing, and recovery of loans-than the credit cooperatives with 53 per cent. In contrast, the latter
46

Transaction costs
devoted more resources to funds mobilisation than multi-purpose cooperatives. This may be because the credit cooperatives are more conscious of the need to generate deposits from members and appreciate more fully the rudiments of financial intermediation. Perhaps as a result of this emphasis, the credit cooperatives had a higher net worth than the multi-purpose cooperatives in both absolute and relative terms (Table 7).
A known fact, however, is that many of the cooperatives organised by the Land Bank are multi-purpose types which are expected to provide for the various financial and non-financial requirements (for example, marketing of farm produce) of the members. These multi-purpose cooperatives had the benefit of access to the Land Bank's rediscount window for cooperatives, and therefore did not have as much pressure as credit cooperatives to raise deposits in the savings market. The general administrative costs of both cooperative types as a component of total transaction costs were almost the same.
7 .2.3 Composition of lending costs
Referring to Table 14 for the breakdown of lending activities, credit cooperatives used less resources than the multi-purpose cooperatives in loan processing (Ps 0.110 million compared to Ps 0.147 million), but had considerably higher loan recovery costs.
7 .2.4 Transaction costs per loan account granted
While the credit cooperatives had total transaction costs that were higher than those of the multi-purpose cooperatives (Table 12) they had been able to process over 2.5 times the number of loans of the multi-purpose cooperatives. This resulted in lending costs per loan account granted of Ps 336 which were about 4/10 of the multi-purpose cooperatives' lending costs. The credit cooperatives' total transaction costs per loan account granted were Ps 531 and were 57 per cent that of multi-purpose cooperatives' costs (Table 15).
7.2.5 Transaction costs per peso of loans granted
In terms of transaction costs per peso ofloans granted (Table 16), credit cooperatives had higher costs per peso ofloans granted of Ps 0.371 compared to Ps 0.185 for multi-purpose cooperatives. The credit cooperatives' higher average total transaction costs (LTC) coupled with smaller loan sizes, smaller total loans released, and high funds mobilisation costs combine to bring up their transaction costs per peso granted. The credit cooperatives' lending costs (LC) per peso ofloans granted were also 43 per cent more than that of the multi-purpose cooperatives. Note, however, that the credit cooperatives' average loan size of Ps 1,500 was only a third that of the multi-purpose cooperatives. Thus, if we were to increase their average loan size assuming all other factors constant, their transaction costs per peso would go down.
7.2.6 Transaction costs per peso of loans outstanding
With their large loans outstanding figure, the credit cooperatives had the lowest total transaction costs at Ps 0.063 per peso of loans outstanding (Table 17). While the results of
47

Transaetion Costs of Lending to the Poor: Philippiru NG<h
the individual client survey23 indicated an average loan maturity of five months, and with no loan maturities beyond one year, the ratio of loans outstanding to loans released for the period indicates either a predominance of long-term loans or problems with their collection.
7.3 Transaction costs ofNGOs
With the fragmentation of credit markets in developing countries, the NGOs have found a critical role to play in the service of poor borrowers. They are becoming an alternative source of credit for these borrowers, because of their organisational orientation, credit philosophy, and their comparative advantage in screening and monitoring of small loans, and in enforcement of loa~ contracts in a credit market characterised by high transaction costs and information asymmetry. This section presents the transaction costs oflending to the poor incurred by two sample NGOs: KMBI and ASKI.
The costs presented here cover KMBl's UKMA program and ASKI's PACAP program. While the two programs have similar methodologies, a comparison of costs between the two should consider the programs' respective stage of development or level of maturity, the start-up context, and the loan terms. ASKl's PACAP program was in its first year of implementation whereas KMBI already had a lead time of dose to two years. Furthermore, KMBl's UKMA program started with a group of existing beneficiaries in areas where KMBI already had operations while ASKI's program started in a new area in an adjacent city. Another consideration is that KMBI's program operated in urbanised areas whereas Palayan City was still a predominantly agricultural area with relatively low population density.
At the time of the study, KMBl/UKMA's loan volume had reached Ps 19.139 million compared to ASKI/PACAP's Ps 0.876 million which is less than 5 per cent of the former's volume (Table 18). ASKI's total loans granted for its PACAP program was slightly less than 10 per cent of its total loans for the relevant year, but estimated program personnel costs consisted of 20 per cent of total personnel costs of the organisation. In terms ofloans outstanding, KMBI/UKMA had a loans outstanding balance of Ps 7.856 million compared with the ASKI/PACAP's balance of Ps 0.493 million. The ASKI/PACAP program had 129 members compared with KMBI/UKMA's 1,525. Loan accounts for KMBI/UKMA totalled 2,525 compared with ASKI/PACAP's 196. The average loan size of KMBI/UKMA was Ps 7,580 while that of ASKI/PACAP was Ps 4,469, refle~ting their orientation towards very small loan sizes for the poor. Note that ASKI/PACAP's loan term is one year while that of KMBI/UKMA is six months. Given the same loan size, the loan term would mean that KMBI would be able to double its volume compared to that of ASKI's in a given period. ASKI's relatively high costs and lower outputs were due to the newness of its program. The other cost ratios discussed subsequently will continue to reflect this situation for ASKI.
7.3.1 Total transaction costs
KMBI/UKMA's total transaction costs were Ps 2.668 million while those of ASKI/PACAP were Ps 0.412 million (Table 12). The difference between the two programs is accounted for
23 See Chapter 6, Borrower profile and Table 11.
48

Table 18 NGO lending program highlights
Program
Loans granted during period {'000) Number ofloans Average loan size Loans outstanding ('000) Interest income ('000)
Loans due (principal) {'000) Loans collected (principal) {'000) Delinquent loans (past maturity) ('000) Repayment rate* (%) Default rate** (%) Arrears rate*** (%)
Number of centres Number of groups formed Number of members Capital build-up ('000)
Loan terms First loan
Minimum amount Maximum
Reloan Minimum amount Maximum
Interest charged Amortisation computation
Transaction costs
KMBI ASKI (Ps) (US$) {Ps) (US$)
19,139 732 876 33 2,525 196 7,580 290 4,469 171 7,856 300 493 19 1,914 73 91 3
18,492 707 334 13 17,012 651 302 12
223 9 N.A. N.A. 92 92 90 90
3 3 N.A. N.A. 11
30 5 245 28
1,525 129 1,005 7
1,000 38 1,000 38 3,000 115 5,000 191
1,000 38 1,000 38 25,000 956 20,000 765
2.5%/MO 2.5%/MO (Principal + lnterest)/Number of payments
Tenor Mode of repayment
6months Weekly
1 year Weekly
Direct program staff Field supervisors Field workers
Total direct program staff
Sources: NGO records and interviews * Repayment rate = Loans collected I Loans due for the year ** Default rate = Loans past maturity I Loans outstanding *** Arrears rate = Loans due 90 days and over I Loans outstanding
2 11 13
1 1 2
by the difference in their stage of maturity and consequently of their scale. Comparing these total costs with those of the other institutions, KMBI's total cost of operations is comparable to that of a private bank branch while ASKI/PACAP's costs come closer to those of a credit cooperative. However, as these institutions differ in the scale of operations,
49

Transaction Costs of LenJing to the Poor: Philippine NGOs
the comparisons will be more meaningful if taken in the context of the other operational measures namely: number of accounts granted, amount of loans released, and amount of loans outstanding.
7.3.2 Transaction costs by activity
Table 13 indicates that of the two sample NGO programs, the ASKl/PACAP had lending costs as a big proportion (52 per cent) of total transaction costs. The comparable figure for KMBI was 44 per cent. They had almost the same proportion of self-help group promotion · and funds mobilisation costs. They had similar funds mobilisation techniques as well as self-help promotion measures. Self-help promotion activities constituted over a fifth of total transaction costs. We note that of the credit institutions shown in Table 13, it is only the NGOs which incurred costs for building the capacity of self-help groups. The hanks did not incur such costs because of their orientation to individual and largely collateral-based lending. In the case of the cooperatives also, no self-help group costs were incurred as the loans were given to the individual member and not to a group. However, cooperatives set aside a portion of their net surplus for the organisations' training and education fund which would he the equivalent of the investments made by the NGOs in self-help group promotion.
7.3.3 Composition oflending costs
The detailed components of the lending activities of the NGOs are shown in Table 19. NGOs did not spend on advertising and promotions but devoted a relatively large amount of time and resources to planning and programming as compared to hanks and credit cooperatives.
Because of the technology of using centres and/or groups in loan screening, including credit investigation, the NGOs had relatively lower loan processing costs.24 Loan processing costs for both NGO programs accounted for 20 per cent of total lending costs. This was much lower when compared with the other lending institutions with proportions ranging from 28 per cent for a cooperative rural bank to 60 per cent for a multi-purpose cooperative.
The price to pay for providing numerous small loans is the high proportion of loan recovery costs. On the average, about 60 per cent oflending costs were due to loan recovery costs. This was not due to any failure or inability to collect loans. In fact, loan collections comprised only 8 per cent of total lending costs for KMBI. They were higher at 20 per cent for ASKI.
The high percentages for loan recovery are consistent with the operational requirements of providing small loans. The magnitude of the loan recovery task increases substantially for small loans collected in small amounts over shorter intervals for a given tenor (weekly vs quarterly).25 The project officers of these NGOs had to attend the weekly meetings at the centre level where the loan repayments from the individual borrowers were made. The more
24 The loan processing and screening are described fully in Chapter 5, NGO lending programs. 25 Weekly loan repayment meant that records had to be updated in the same frequency. As an illustration, a
50-week loan will require 50 visits and at least the same number of recording entries.
50

Transaction costs
Table 19 Component oflending activities, NGOs
Per cent of total Per cent of total transaction costs lending costs ASK! KMBI ASK! KMBI
Lending activities Planning and programming 9 7 18 17
Loan processing (investigation-release) 10 10 19 22 Centre level
- Actual loan application, processing 1 1 1 2 and approval at the centre level
- Loans release 2 0 4 0 Total 3 1 5 3
NGO level (loan application review, 7 9 14 19 cheque preparation, etc.)
Loans recovery 33 27 63 61 Loans utilisation check 2 3 5 Collections
- Centre level 4 2 7 4 - NGO level 7 2 12 4 Total 10 3 20 8
Loans monitoring 5 2 9 4 Record keeping and report writing 12 10 24. 23 Program monitoring (field visits) 4 9 7 21
Total lending activities 52 45 100 100
Source: NGO records and interviews
sizeable sources of high loan recovery costs were the record keeping, report writing and program monitoring which included field visits. It is obviously more costly to monitor and keep records on numerous small loans than on the large loans typically provided by private commercial banks, especially if these small loans are those given on very short-term maturities and for diverse purposes such as working capital, purchase of inputs, consumption and emergency needs. What we observed in the field work was that the NGOs spent an enormous amount of time in record keeping and report writing. If we exclude these activities from our estimate oflending costs, it will appear that the NGOs actually had very low loan processing and loan recovery costs. For KMBI, loans utilisation checks and collections were only 13 per cent of total lending costs. This depends on the formation of good (borrower) groups which help the NGOs minimise the transaction costs of lending.
7 .3.4 Component of self-help group promotion and development activities
This brings us to a discussion of the effort exerted by NGOs in helping build up the creditworthiness and loan absorptive capacity of SH Gs. The NGOs incurred large social development costs (20 per cent of total costs) because of the promotion and preparation of
51

Transaction Costs of Lending to the Poor: Philippine NG Os
Table 20 Component of SHG promotion costs
Per cent of total Per cent of total transaction costs SHG promotion costs ASKI KMBI ASKI KMBI
Promotion/ strengthening of SHGS
Area identification and mobilisation 8 7 36 37 -Area survey 6 3 26 15 - Conduct means test 0 2 11 - Projection meetings 2 2 10 11
Group formation & evaluation 1 2 4 11 - Preliminary group formation activities 0 1 2 5
(identifying prospective members, preliminary meetings, etc.)
- Screening and acceptance of groups 0 1 2 5 for compulsory group training
Compulsory group training {listed are 13 5 59 27 key topic areas of training) - Training and orientation on NGO 8 3 37 16
program, group/centre organisation, membership, structure, functions, duties, responsibilities, procedures, election of officers, etc.
- Training and orientation on lending 4 2 20 11 policies and procedures
Testing and approval of groups by NGO 0 6 0 25 (group recognition test)
Total: Promotion/Strengthening ofSHGs 22 20 100 100
Source: NGO records and interviews
SH Gs. Table 20 shows the detailed components of the SHG promotion activities of NGOs. The major activities which led to the capacity building of SH Gs were those for area identification and mobilisation, group formation and evaluation, compulsory group training, and testing and approval of groups. Without these activities it is doubtful if the group lending strategy adopted by the NGO would work. The success of the bank-NGO-SHG-poor linkage hinges on this activity which is, to say the least, indispensable. The NGOs had so far internalised these expenses which contributed to the increase in their transaction costs of lending to the poor.
One can argue that the process of SHG promotion is integral to the entire credit intermediation process as practised by NGOs and that it is, therefore, at the core of the NGO credit policies and procedures. At present, costs associated with SHG formation are funded essentially through grants from donors. There are likely to be some positive
52

Transaction costs
externalities arising from this process which may not be fully appropriated by the NGO which has cared to invest resources in SHG promotion. If the NGO cannot fully or largely appropriate for itself the benefit of SHG promotion, there may be less incentive to expand this activity. Another possibility is that this activity may not be sustainable and thus, cease at some future time, especially if donor funds for this process are not forthcoming. Hence, there is a strong case for continued donor support for such activities, and for such support to be extended to other NGOs in the future. Otherwise, it is likely that expenditure on forming and promoting SHGs will be below the socially optimal level. .
7.3.5 Transaction costs per loan account granted
KMBI/UKMA's transaction costs per loan account granted were Ps 1,057 while those of ASKI were Ps 2, 102 (Table 15). KMBI/UKMA's costs per account were comparable to those of the multi-purpose cooperative. On the other hand, ASKI/PACAP's costs per account were closer to those of the rural banks. ASKI's costs, however, should be taken in the light of the early stage of development of its program. We note, however, that the NGOs' total costs included a self-help group promotion component which was not present in the banks or cooperatives. If we compare only the lending costs (LC), then KMBI's lending costs are second to the lowest next to that of the credit cooperative. This was because KMBI had processed over 2,500 loans which was far above the number of the other intermediary types.
7.3.6 Transaction costs per peso of loans granted
KMBI/UKMA had total transaction costs per peso of loans granted of 0.140 while ASKI had costs of 0.471 (Table 16). KMBI/UKMA's transaction costs per peso ofloans granted compare quite well with the individual lending experience of the rural banks. They were much better than those of the cooperative rural banks, the special government banks, the credit cooperatives and even the multi-purpose cooperatives-this in spite of the inclusion of the self-help group promotion component in the total costs. Its lending costs per peso of loans granted of 0.076 were next only to that of the private commercial bank branch.
The 'familiarity with poor borrowers and the use of group lending had brought down costs ofloan processing for KMBI. KMBI also had the advantage oflending to repeat borrowers which drastically reduced the transaction costs of lending. The approval process for repeat loans was much simpler than a first l.oan application and the repeat loan amount can increase by as much as 50 per cent of the previous amount. These factors account for KMBl/UKMA's loan volume of Ps 19 million which was the second highest next to the PKBs' loan volume of Ps 38 million. AS Ki's higher costs, on the other hand, were due to the low amounts it processed. Note, however, that ASKI/PACAP had a lower average loan size of Ps 4,500 compared to KMBI/UKMA's Ps 7,600.
7.3.7 Transaction costs per peso of loans outstanding
The situation changes when we use transaction costs per peso of loans outstanding as a measure of efficiency (Table 17). KMBI's ratio of loans outstanding to loans released
53

Transaction Costs of Lending to the Poor: Philippine NGOs
indicated an average loan term of 10 months, compared to 14 months for ASKI. From transaction costs per peso ofloans granted of Ps 0.140, KMBl/UKMNs costs per peso of loans outstanding increased to Ps 0.34. For ASKI, the increase was from Ps 0.471 per peso ofloans granted to Ps 0.835 per peso ofloans outstanding. The lending costs per peso of loans outstanding were Ps 0.184 and Ps 0.484 for KMBl/UKMA and ASKl/PACAP respectively. While these costs are high in comparison with the other intermediary types, we note that there are differences in the average loan size and the average loan maturity period. To provide a more or less equal basis for comparison, it would be necessary to adjust the average loan sizes and maturities.
7.4 Factors affecting transaction costs
The preceding discussion of the different types of financial intermediaries highlights several key factors that affect transaction costs. These include the organisation's stage of maturity; the cost structure; the scale of operations; staff productivity; lending policies, terms and conditions; the lending technology employed; intensity of use of information technology; and, of course, the clientele profile.
Organisational maturity
The longer the life of an organisation, the more efficient it is expected to be in terms of its processes, systems and procedures. This results from both the organisation's capacity to learn from its past successes and mistakes, and the increased task proficiency that is acquired from performing similar tasks over an extended period of time. In our comparison of transaction costs, the banks had the longest average number of years in operation followed by, in order, the credit cooperatives, KMBI's UKMA, the multi-purpose cooperatives and finally ASKI. While maturity is not the only factor, it is interesting to note that based on our cost comparisons, there is an inverse correspondence between the organisation's transaction costs and its number of years in existence. Costs were highest for ASKI, which was the newest, and least for the PKB among the banks. As ASKI's program was barely a year old and even KMBl's UKMA program which started in 1991 was barely three years old, there is much room for the NGOs involved in lending to the poor to improve their transaction costs over time.
Cost structure
The cost structure of an organisation has a direct impact on its resulting transaction costs. The cost structure, in turn, is the result of decisions made by the organisation in response to external factors such as the regulatory and competitive environments. One key factor which defines the scale of operations and consequently its cost structure is the minimum capitalisation and reserve requirements set.by the central bank. Among the types of institutions we compared, the private commercial bank had the highest minimum capital requirements, followed by the special government banks and then the rural banks (including the cooperative rural banks). There was practically no minimum capital requirement for either the cooperatives or the NGOs. Again, the amount of the transaction costs corresponded directly with the amount of capitalisation required. A related factor that
54

Transaction costs
affects transaction costs is the extent to which an intermediary type is regulated by the government-the more regulation, the higher the transaction costs. In this regard, the cooperatives and NGOs have an advantage.
Another key factor figuring in the cost structure is the extent of investment in fixed assets, and the consequent mix of fixed and variable costs. The higher the overhead (fixed costs), the higher the costs unless this is compensated by appropriate volume. While not part of this study, the situation of the informal lenders is one extreme where in most cases there are very minimal fixed costs.
Lending policies, terms and conditions
Transaction costs are also a function of the lending policies, terms and conditions employed. Key determinants are loan sizes, the repayment frequency, and the term or maturity of the loan. In general, the smaller the loan sizes, the more frequent the repayment, and the shorter the maturity, the higher the transaction costs. This follows from the amount of work required to process and keep track of these transactions. In the case of lending to the poor, the situation and credit requirements of this segment pre-define some of the critical lending policies, terms and conditions.
Specifically, field experience has shown that it is necessary to lend out in very small loans, at relatively short-term maturities, with a higher frequency ofloan repayment (that is, daily or weekly as against monthly or quarterly), and without requiring traditionally accepted forms of collateral such as land or chattels. Furthermore, to reach the poor effectively and minimise borrower transaction costs, the lender has to go to where the borrowers are rather than the other way around. These conditions combine to make lending to the poor a very labour-intensive process. Our review of the sub-components of lending costs confirm this labour intensity with the finding that KMBI's loans recovery activities accounted for over a fourth of their total transaction costs. The bulk of the time spent was in record keeping and in staff time attending meetings and making collections.
The small loan amounts translate also to a small amount of interest earned per transaction, thus creating additional pressure to go for substantial volume and to minimise fixed costs. This translates into a need for very high volumes at the program level, very prudent investments in infrastructure or equipment, the maintenance oflow overhead, achieving economies of scale through high individual worker productivity, and low personnel costs.
Staff productivity
Thus, the salary scales and staff productivity have a significant impact on transaction costs. The higher the salary structure, the more pressure there is for increased output per individual. The ability of staff to process more loans and service more borrowers will significantly impact costs. While we have no data on the salary structure of the banks reviewed, it would be safe to say that their salary scales would be considerably higher than those of the cooperatives and the NGOs. The logical response in such a situation would be to go for bigger loans per account to compensate for the higher salary structure.
55

Tr11ns11etion Costs of Lending to the Poor: Philippine NG Os
As small loan sizes are a given factor in lending to the poor, at least at the borrowers' initial entry, staff productivity becomes all the more critical. The optimum ratios in terms of number of clients to staff and number of loan accounts to staff will have to be worked out and targeted. As substantial social investments are poured into a prospective member and borrower, the retention rate of members is also another critical aspect of worker productivity that bears watching. A high retention rate not only means optimal social investment costs, it will also eventually result in higher average loan sizes and thus lower overall transaction costs.
High worker productivity not only means high output per individual. It also requires a short start-up time and a quick build-up to the optimum number of members per field worker. Since training costs form a substantial part of the NGO budget, this means that better, more cost-effective and fa~ter ways of training and motivating field workers must be developed to reduce transaction costs and improve the loan portfolio quality. Doing so will also mitigate the problem of high staff turnover confronting most credit NGOs. One method to cut expenses would be to share the costs of curriculum development and physical facilities among several NGOs or to share the costs with the banks who are the principals in the linkage approach.
Lending technology
One of the key strategies that can be employed to increase worker productivity and reduce the transaction costs oflending to the poor is to transfer as much of the loan screening, evaluation, processing, and collection task to the clients. This will, of course, require quality inputs in group organisation and formation.
Increasing worker productivity and cultivating repeat business can increase loan volume. However, given the relatively higher costs of lending in small amounts, another alternative would be to adopt a cross-subsidising strategy by having a diversified portfolio of larger borrowers.
All attempts at reducing transaction costs, however, must be balanced with the need to keep the risks of default low. The key is to identify the appropriate mix of conditions, sanctions and incentives that will motivate repayment and ensure contractual compliance without unnecessarily raising transaction costs and barriers for the borrower. In the case of the NGO programs, the use of peer group pressure, the gradual increase in loanable amounts subject to prior repayment performance, and participation in group activities ensure an increasing knowledge about and confidence in the borrower.
Client profile and group training
A lot of room still remains for the NGO to improve its transaction cost situation. Cultivating and maintaining repeat borrowers with good track records will contribute substantially to increasing loan volumes and interest income. On the lending costs component of transaction costs, loans recovery accounted for a big proportion and was close to Ps 0.04 out of Ps 0.139 of the costs per peso of loans granted. This was over a fourth of KMBI's total transaction costs. As discussed earlier, the bulk of these costs lies in
56

Transaction costs
Table 21 Transaction cost scenarios: KMBI
Intermediary type KMBI Actual Scenarios
II III N
Assumptions Total lending costs (P'OOO) 1,447 1,447 1,447 Total transaction costs (P'OOO} 2,668 2,668 2,668 Average loan size (P'OOO) 7.6 Number ofloans released 2,525 Loans released (P'OOO) 19,190 24,898 30,400 40,000 Loans outstanding* (P'OOO} 7,856 10,208 12,464 16,400 Average loan maturity (months} 12 12 12 Number of active members 1,638 1,638
Operational ratios
Number of times borrowed I year 1.5 1.5 1.5 1.5 Number of staff 13 13 13 13 Number ofloans per staff 194 252 308 Number of members per staff 126 126
Transaction cost ratios
Cost per peso ofloans granted - Lending costs 0.075 0.058 0.048 0.057 0.036 - Total transaction costs 0.139 0.107 0.088 0.106 0.067 Cost per peso of loans outstanding - Lending costs 0.184 0.142 0.116 0.140 0.088 - Total transaction costs 0.340 0.261 0.214 0.258 0.163
Shaded areas indicate changes in parameter5 * Loans outstanding figure in scenarios estimated on the basis ofloans released and the loan maturity period.
record keeping and in staff time for attending meetings and making collections. A key way to reduce these costs substantially is to deal wholesale with the self-help groups, which means building up the groups to take on more of the credit delivery functions from processing and approval to collection and record keeping. This follows the same logic that it may be better for the commercial banks to lend wholesale to an agent who can retail it more effectively for them.
Such wholesaling to self-help groups is a direction in which KMBI is already moving, and it has already made some progress towards turning over lending responsibilities to centre leaders. As of July 1994, 50 per cent of their centres have been handling wholesale loans with KMBI issuing one cheque to the leader of a centre of 15 to 35, and maintaining only one set of records per centre rather than maintaining individual records. (The same is also being done in India, where MYRADA has the intention to turn over full responsibility to SHGs within two or three years from their establishment.) This further underscores the importance of the social development inputs in the area of group formation and training.
57
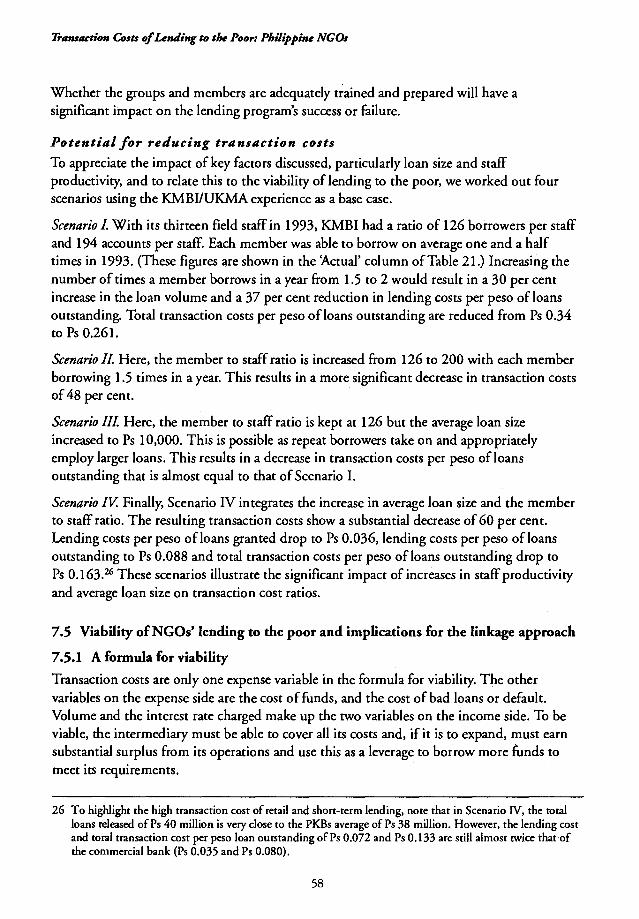
Transaction Costs of LenJing to the Poor: Philippine NGOs
Whether the groups and members are adequately t~ained and prepared will have a significant impact on the lending program's success or failure.
Potential for reducing transaction costs
To appreciate the impact of key factors discussed, particularly loan size and staff productivity, and to relate this to the viability of lending to the poor, we worked out four scenarios using the KMBl/UKMA experience as a base case.
Scenario L With its thirteen field staff in 1993, KMBI had a ratio of 126 borrowers per staff and 194 accounts per staff. Each member was able to borrow on average one and a half times in 1993. (These figures are shown in the 'Actual' column of Table 21.) Increasing the number of times a member borrows in a year from 1.5 to 2 would result in a 30 per cent increase in the loan volume and a 37 per cent reduction in lending costs per peso of loans outstanding. Total transaction costs per peso ofloans outstanding are reduced from Ps 0.34 to Ps 0.261.
Scenario IL Here, the member to staff ratio is increased from 126 to 200 with each member borrowing 1.5 times in a year. This results in a more significant decrease in transaction costs of 48 per cent.
Scenario Ill Here, the member to staff ratio is kept at 126 but the average loan size increased to Ps 10,000. This is possible as repeat borrowers take on and appropriately employ larger loans. This results in a decrease in transaction costs per peso ofloans outstanding that is almost equal to that of Scenario I.
Scenario IV. Finally, Scenario IV integrates the increase in average loan size and the member to staff ratio. The resulting transaction costs show a substantial decrease of 60 per cent. Lending costs per peso ofloans granted drop to Ps 0.036, lending costs per peso ofloans outstanding to Ps 0.088 and total transaction costs per peso of loans outstanding drop to Ps 0.163.26 These scenarios illustrate the significant impact of increases in staff productivity and average loan size on transaction cost ratios.
7.5 Viability ofNGOs' lending to the poor and implications for the linkage approach
7.5.1 A formula for viability
Transaction costs are only one expense variable in the formula for viability. The other variables on the expense side are the cost of funds, and the cost of bad loans or default. Volume and the interest rate charged make up the two variables on the income side. To be viable, the intermediary must be able to cover all its costs and, if it is to expand, must earn substantial surplus from its operations and use this as a leverage to borrow more funds to meet its requirements.
26 To highlight the high transaction cost of retail and short-term lending, note that in Scenario N, the total loans released of Ps 40 million is very close to the PKBs average of Ps 38 million. However, the lending cost and total transaction cost per peso loan outstanding of Ps 0.072 and Ps 0.133 are still almost twice that of the commercial bank (Ps 0.035 and Ps 0.080).
58
Transaction costs
Based on KMBI's statement of receipts and disbursements for 1993, it was able to cover 74 per cent of its costs from its interest earnings and related charges (excluding interest earned on investments). These costs included interest paid on borrowed funds which averaged only 2.3 per cent of average loans outstanding.27 A negligible amount was allotted to provide for bad debts. We had estimated its transaction costs per peso of loans outstanding at Ps 0.34 which included Ps 0.09 spent on SHG promotion and development. This is equal to transaction costs of Ps 0.48 per peso of average loans outstanding, including Ps 0.13 for SHG promotion and development. Its default rate (loans past maturity/ loans outstanding) was 3 per cent while its arrears rate (amount of loans due 90 days and over I loans outstanding) amounted to 11 per cent.
With a 2.5 per cent interest per month and a six-month loan maturity, its total revenues on average loans outstanding was 35 per cent. If we exclude the SHG promotion and development costs from KMBI's transaction costs (which it has funded from grants), we see that KMBI had been able to cover its transaction costs amounting to 35 per cent on average loans outstanding, but not the cost of defaults and the cost of funds. If we assume a cost of funds of 12 per cent28 and a cost of default at 10 per cent, KMBI's costs would total Ps 0.57 per peso of average loans outstanding which is 22 percentage points more than the 35 per cent it is currently earning. To improve its viability, KMBI must decrease its transaction costs, keep its costs down, continue to identify low cost funds, increase its output without increases in total costs, become more efficient in the use of its funds29 and consider increasing its current interest rate and charges. 30
The cost reductions and increases in efficiency required for viability are within the reach of KMBI. KMBl's total costs as a percentage of average loans outstanding would be reduced to Ps 0.17 (excluding the SHG promotion costs) if loan sizes were increased to Ps 10,000 and the member to staff ratio improved to 200. With a reduction of the default rate to 5 per cent and the cost of funds still set at 12 per cent, total lender costs would be 34 per cent which is one percentage point lower than its current earnings on average loans outstanding ratio of 35 per cent. There is room for substantial improvements in KMBI's operations considering that it started the UKMA program only in 1993. The NGOs' lending to the poor can be a viable proposition if its group building efforts are funded, efficiency in the use of funds is increased, worker productivity is improved, the volume ofloans is expanded, the proportion of bad loans is reduced and, if necessary, its pricing is reviewed.
27 While KMBI's loans payable accounted for 36 per cent of its total liabilities and fund balance, a substantial portion of these payables consisted of soft loans.
28 Inflation rate in 1993 was 7.6 per cent; 91-day government treasury bill rates reached a high of 16.187 per cent in December 1993 and a low of9.931 per cent in June 1993.
29 While KMBI was earning 35 per cent on its average loans outstanding at an interest charge of2.5 per cent per month, the effective interest rate of2.5 per cent per month paid weekly over six months is over 55 per cent. This indicates the upside potential of a more efficient funds use which means increasing the turnover velocity.
30 As a reference point, in 1995 lending investors in the Philippines charged at least 4 per cent per month for loans with chattel or real estate mortgage, pawnshops charged 5 per cent to 7 per cent per month, and informal moneylenders' charges ranged from as much as 20 per cent per day to 20 per cent over 40 days.
59

Transaction Costs of Lending to the Poor: Philippine NGOs
7.5.2 Preconditions for the success of the linkage approach
Finally, the linkage approach hinges on the attractiveness of the arrangement to both the prospective principal and the prospective agent. From the side of the principal, they have to be convinced that the agent will be capable of relending with returns that are enough to cover the agent's own costs, including the cost of defaults, and the interest charges to be paid to the principal. On this front, the NGOs and cooperatives have already proven their capability as evidenced by the experience with BPI Foundation-NGO/Cooperative linkage program.31
Several conditions have to be in place for the agent to adopt the linkage approach. The repayment schedule required by the principal must match their own cash flow pattern which is dictated by the agent's own lending terms and conditions set for their clientele. Furthermore, as reloans in increasing amounts is a key to decreasing their own costs, the agent's requirement for funds will be long term and continuing in nature. While this is a basic consideration, banks should understand the peculiarities of lending to the poor and its resulting effect on the agent's cash flow pattern, and adapt their collection schedule accordingly.
The transaction costs of dealing with the principal must also be acceptable to the agent. The conditions imposed must not result in additional transaction costs for the agent and the need to impose additional requirements on their own clients. A concrete example of such conditions would be the requirement of notarised individual promissory notes of the agent's borrowers as a prerequisite for subsequent loan releases by the principal to the agent.
Lastly, the interest being charged on the funds for relending should be seen as recoverable under the agent's relending terms and collection experience. It must also be in the same price range as that of other available alternatives. The costs must also be seen to be lower than the agent's own cost of mobilising funds.32 Thus, the attractiveness of the linkage approach to the agent will depend on the availability of alternative sources of cheaper funds. As long as cheaper sources continue to be available in the magnitudes that the agent requires, the linkage will not happen. This scenario, however, is becoming less and less likely as grant funds and low-cost loans-are dwindling and will not be enough to meet the magnitude required to address the credit needs of the poor in the country in a significant way.
7.6 Borrower transaction costs
Borrower transaction costs refer to all costs incurred by the borrower in applying for and maintaining the loan. Thus, it consists of actual cash payments (interest +service/other charges) made to the lender, and all other cash and non-cash outlays. In this section, we estimate the transaction costs incurred by borrowers consisting of cash outlays and non-cash outlays but excluding the actual payments made to the lender. The cash outlays include expenses incurred in applying for a loan such as transportation, facilitation fees, and
31 See Banking with the Poor (1992) for a detailed discussion of this experience. 32 The costs ofNGOs' funds mobilisation among the poor is another area that needs further study. In the
same way that cheaper alternatives have been found to lend to the poor, cheaper alternatives to mobilise savings from the poor have to be explored and evaluated.
60

Table 22 Borrower transaction costs1
Fees Membership fee Application fee* Loan insurance*
Transport Pre-loan meetings Post-loan meetings Loan collection
Average loan granted Total borrower transaction costs % average loan size
Source: Field interviews 1 In pesos except where indicated
KMBI Minimum Maximum
0 10 0.5% 0.5% 1.0% 1.0%
0 48 0 156
20.8 62.5
7,580 7,580 134.5 390.2
1.8 5.1
* Figures from KMBI are percentages of total loan size
Transaction costs
ASKI Minimum Maximum
0 0 10 10 10 10
18 59 0 0
163 204
4,469 4,469 201 283 4.5 6.3
costs incurred in preparing the documentation required in applying for a loan. Non-cash outlays consist basically of the opportunity cost of time spent in the process of applying for a loan.
A key difference in the lending methodology of the NGOs reviewed from the other types of financial intermediaries is the continuation of group activities after the loans are released. Thus, the costs related to this activity were also estimated. Furthermore, officers elected from among the members perform tasks in addition to those of an ordinary member borrower. In this section, we therefore review borrower transaction costs at the borrower-member level and at the officer level. Borrowers' direct cash outlays are summarised in Table 22 and estimates of time spent by NGO borrowers in group activities are summarised in Table 23.
7.6.1 Borrower level transaction costs
Interviews with the officers of ASKI/PACAP's Imelda I Centre and KMBI/UKMA's Centre II in Bagong Silang reveal that the only cash outlay of both officers and members, before and after loan release, consisted of transportation costs incurred in attending meetings and, in some instances, in turning over centre collections. To have a better appreciation of the situation of these centres, a brief description of the location of these two centres follows.
Palayan City was primarily an agricultural town with poor road conditions (mostly gravel roads) and relatively high transportation costs. It only had one rural bank that had just re-opened in 1994. The Imelda I Centre had 24 members most of whom were agrarian
61

Transaction Costs of Lending to the Poor: Philippine NGOs
Table 23 Time spent by NGO clients in group activities (hours per year)
Pre-loan (first loan only) Post-loan Total
Source: Field interviews
KMBI Member Officer
16 104 120
16 156 172
ASKI Member Officer
30 104 134
40 156 196
reform beneficiaries. It was located in a barangay that was adjacent to the city centre. Public transportation to the city centre cost Ps 6.00 per round trip. Transportation to Cabanatuan City cost Ps 17.00 per round trip. The members all lived within walking distance of the centre assembly hall which was a concrete cum hollow block multi-purpose structure. The centre was about five minutes' walk off the main concrete highway.
Bagong Silang in Caloocan City on the other hand was one of the earlier squatter
resettlement sites of the government. The area had become highly urbanised with relatively
heavy traffic along the main thoroughfare. The route was serviced by jeepneys and tricycles. The centre had 36 members and was one of the earlier centres set up by KMBI. The
majority of the members lived within a jeepney- or tricycle-ride distance from the centre meeting place. The centre meeting place was the back yard of an officer who was an early
beneficiary of the government resettlement program. A jeepney ride cost 1.00 one way or 2.00 round trip, a tricycle ride cost 6.00 per trip or 12.00 round trip.
The main cash outlay incurred by borrowers of both centres before loan release and during the group formation stage consisted of transportation expenses spent in attending training seminars and meetings. Officers had to attend more meetings than members and thus
incurred additional expenses. The estimated transportation expenses for the Imelda I Centre
were Ps 18.00 for a member and Ps 59.00 for an officer, 0.4 per cent and 1.3 per cent respectively for an average loan of Ps 4,469. In addition there was an application fee of
Ps 10.00 and loan insurance of Ps 10.00. The Imelda I officers did not identify any other cash outlay. Food expenses were practically nil as the officers stated that they brought pack
lunches during the training sessions.
In the case of the Bagong Silang group, a prospective member would have to observe the centre weekly meetings for at least four weeks before he/she is considered for membership. The fastest time a prospective member can be accepted and his/her loan processed by the group was eight weeks. Transportation expenses ranged from zero (walking) to Ps 8.00 Qeepney ride) and Ps 48.00 (tricycle ride). Hence, costs to a borrower before loan release
ranged for zero to 0.6 per cent for an average loan of Ps 7,580. In addition, KMBI charged a one-time Ps 10.00 membership fee, an 0.5 per cent processing fee and a 1 per cent loan
redemption insurance.
The centre management unit officers were also responsible for undertaking a credit and
character investigation with respect to the prospective member. However, they considered
62

Transaction costs
the cash outlays related to the performance of their functions to be minimal. They tapped their local sources of information or identified somebody who lived near the applicant.
The total cash outlay before loan release as a percentage of the loan, including both fees and transport costs, was generally lower for Palayan (0.9 per cent to 1.8 per cent) than for Bagong Silang (1.5 per cent to 2.1 per cent). This was despite the fact that KMBI's average loan size was considerably greater than ASKI's. It reflected the additional charges imposed by KMBI and the need for an UK.MA applicant to attend the weekly meetings at least eight times before the first loan was processed.
In Imelda I, borrowers did not spend for transportation after loan release as weekly meetings were held in the barangay hall which was within walking distance of the members' homes. After loan release, members are required to attend the regular weekly meetings. Individual borrowers brought their weekly payments to the group secretary who also lived within walking distance from the group members. Collections of the groups were then consolidated at the centre meeting.
Officers of both centres were responsible for turning over their collections to the NGO office or a designated bank. In ASKI's case, the assigned field worker did not accept collections to avoid having to carry large sums ofloan collections during her field visits. Centre officers made weekly trips to Cabanatuan to turn over collections. Their estimated transportation costs amounted to Ps 68.00 per month and were shared equally by the group members. With a group size of four to five members, the costs per member ranged from Ps 13.60 to Ps 17.00 per month or Ps 163.00 to Ps 204.00 per member per year. However, officers timed the turning over of collections with their regular trips to Cabanatuan City to avoid incurring additional transportation expenses. Clients made regular visits to Cabanatuan to transact business, sell and buy goods. Hence, post-loan release transportation costs per borrower per year (the term of the loan) ranged from Ps 163.00 to Ps 204.00 per year for the officers. This was 3.6 per cent to 4.6 per cent of an average sized loan.
In the case of the KMBI Bagong Silang chapter, the only cash outlay after loan release that was identified consisted of transportation costs incurred in commuting to and from the centre meeting place. This ranged from zero to Ps 312.00 for a year or Ps 156 for six months which was the usual tenor of an UK.MA loan. The transportation expenses incurred by KMBl/UKMA's officers in turning over loan collections were much lower than for ASKI, because of the lower transportation costs in Bagong Silang. This ranged from Ps 104.00 to Ps 312.00 per group leader or Ps 20.80 to Ps 62.50 per member for a group of 5 members. Hence total post-loan transportation costs ranged from Ps 20.80 to Ps 218.50, or from 0.3 per cent to 2.9 per cent of an average loan (Table 22).
In summary, pre-loan release borrower transaction costs, excluding fees paid to the NGOs, ranged from zero to 1.3 per cent while post-loan expenses ranged from 0.3 per cent to 4.6 per cent. Including fees, total borrower transaction costs ranged from 1.8 per cent to 6.3 per cent.
For comparison purposes, the borrower transaction cost estimates of the Casuga study are shown in Table 24. These were costs incurred by borrowers from loan application up to loan
63

Transaction Costs of Lending to the Poor: Philippine NGOs
Table 24 Borrower transaction costs, by type of lending institution: banks and NBFis
Average expense (Ps) Total TC Non-cash Opportunity No. Weighted
Cash outlay outlay cost of time reporting ave.amt.
Bank borrowers RB 99.96 79.58 38 179.54 CRB 176.70 4.00 56.2 20 236.90 SGB 139.57 44.25 33 183.82 Sub-total 131.19 0.88 61.63 91 193.70
Non-bank borrowers Credit cooperatives 37.02 0.38 22.61 26 60.01 Multi-purpose cooperatives 25.13 0.38 63.62 52 89.12 SH Gs 0.95 15.27 4 Sub-total 27.71 0.36 48.26 82 76.33
All sample borrowers 82.14 2.27 55.29 173 138.07
Source: Llanto & Dingcong 1994
release. A comparison of the pre-loan direct cash outlay of the NGO clients with the cash outlay of the respondents in the Casuga survey show that the NGO borrower cash outlays were higher than those incurred by the non-bank borrowers but lower than those of the bank borrowers. This comparison is made, however, without considering the time difference in the two sources of data. Thus, if a correction factor is introduced, the NGO borrower costs may fall within the same range as that of the NBFI borrowers. The issue of the opportunity cost of time is discussed in the next section.
7.6.2 Borrower and centre/group officer time
The other item that can be considered as a cost is the amount of time a borrower spends in applying for a loan, and in attending meetings-that is, if we impute the opportunity cost of time. For the centre and group officers, additional time was spent in meetings beyond the regular weekly meetings and in carrying out the tasks of a centre or group leader. Indeed, a substantial amount of time was spent in attending meetings. A weekly 2-hour meeting (including travel time) for members translates into 104 hours per year or 13 person days a year. Centre officers spent even more time. Aside from the extra meetings, they also conducted credit investigation and conducted site visits. The estimated time spent by members and officers is summ;trised in Table 23. However, the weekly meetings and the voluntary acceptance of responsibility are key elements in the credit delivery technology of the NGOs under study, and are indispensable.
The issue is how this time spent is to be valued. The usual way would be to base the cost on the estimated actual earnings of the individuals concerned. This assumes that earnings opportunities are lost as a result of the additional activities that they have to perform as
64

Transaction costs
group members and officers. Nevertheless, when asked if the centre meetings and their functions as centre and group officers interfered with their economic and livelihood activities, the officers of the two centres interviewed had common responses. In their case, they were usually able to make arrangements for someone to take their place if it should be necessary. Husbands or children came in handy to take the women's place for household work. Some scheduled their activities such that the meetings did not come in the way of their livelihood activities. Others simply worked extra hours to catch up on lost time. Those who were engaged in livestock growing or crop cultivation did not consider the meetings an obstacle to their livelihood activities.
While the Imelda I group did not have much past experience to go by, the responses of the Bagong Silang officers were very interesting. Comments that were shared include: 'We find the weekly meetings worth coming to because we also discuss spiritual matters and have Bible reflections'; 'We learn a lot from the meetings'; 'We have many friends in the group'; 'We learn a lot about running a business'; 'We forget and leave our problems behind when we come to the meetings'. In short, it seems that at least for the Bagong Silang Centre II leaders, the regular weekly meetings have taken on a non-quantifiable worth for them in terms of camaraderie, mutual encouragement and spiritual formation. This of course may not be true for all centres but it is certainly something that can strengthen the groups.
Furthermore, the requirement for attendance at weekly meetings also served as a screening mechanism to test the level of need and interest of the member. Because of its time-consuming nature, people with very high opportunity cost of time would not find attendance in weekly meetings appealing, considering the size of the initial loans that one gets in return. We note that the poor who do not have access to the normal bank credit do not find the weekly meetings such a high cost to pay for the chance to get credit, and to meet and interact with other members of the community.
65

8.1 Overall issues
Chapter 8 CONCLUSIONS AND
RECOMMENDATIONS
Lending to the poor using the bank-NGO-SHG-poor linkage approach can be understood in terms of an agency-theoretic framework, as applied in this study. This approach can reduce the cost of screening loan applications and borrowers. It can also create an incentive structure or mechanism for loan repayment, enforcing the loan contract and recovering the loan. The transaction costs oflending to the poor by NGOs, so far the only credit intermediaries directly dealing with and lending to the poor, need not be as great as commonly assumed. Such transaction costs may be reduced by adopting group lending as a strategy. The use of self-help groups (SH Gs} in pre-screening loan applications, credit investigation, loan release, monitoring and loan recovery is an important component of this lending technology. However, successful reduction in the transaction costs of lending to the poor depends a lot on the quality of the SHG. This quality is a function of the group promotion activities conducted by NGOs, and this implies some significant cost on the part of the NGOs. It was shown that taking out the SHG promotion costs would significantly reduce the transaction costs oflending to the poor.
Some NGOs cross-subsidise the more costly lending to the poor by net returns from their other credit programs. However, they have to find ways to make lending to the poor a 'net return centre' for them and not a program forever in need of subsidy. Improving the SHG development process as well as lobbying for more government expenditure in pro-poor programs will go a long way to improve the viability and profitability of the projects of the poor. In addition, the NGOs must consider the need to diversify the loan portfolio, to maximise returns and minimise the loan default risks.
By their very nature and organisational structure, the banks-in particular the commercial banks--do not have comparative advantage in lending to the poor. The transaction costs and informational requirement of lending to this type of borrower may be beyond the capacity of commercial banks. It is likely that the banks could more profitably deal with the poor by providing wholesale loans to the NGOs. The cooperative rural banks and the credit cooperatives are potential lenders to the poor, especially because they are largely 'owned' by small borrowers. However, their transaction costs of lending have to be brought down if they want to sustain this type of lending.
Certain other considerations are also relevant to a consideration of the potential of the credit cooperatives to play a greater role in lending to the poor. As noted above, those credit cooperatives from which data cited in this study are drawn have been in operation for around ten or eleven years, much longer than the two NGOs described here. They are more 'mature' institutions, especially compared with ASKI whose programs here described
66

Conclusions anti ret:ommnulations
have very recently been established. Both ASKI and KMBI, but particularly the former, have considerable scope for achieving lower costs through economies of scale in years to come.
The credit cooperatives discussed here, while successfully lending in small amounts at low levels of transaction costs per loan, appear to be operating in a static 'low-cost/low-activity' situation, with loans averaging around Ps 1430 (US$65), some of which are extended for consumption, and with relatively fewer loans per member than the NGOs. Furthermore, they lend without a specific focus on targeting the poor.
The NGOs seem to be the logical alternative but our estimates of their transaction costs of lending to the poor show that they have to increase their lending volumes and decrease their transaction costs. Increasing worker productivity is critical. This includes the need to improve their record keeping and monitoring schemes to bring down costs of loan recovery. Investment in computer technology and hardware will be useful in bringing down transaction costs, since this will free precious manpower for recruitment of new members and formation of groups. Using an agency approach, they may also use the SHG as a conduit for group loans. At present, the loans they provide are really individual loans although the loan utilisation check, credit investigation, recovery and monitoring are done through the SHG at the centre level. Perhaps, the preferred option is to have a varied approach: group loans where they will matter most and individual loans as the occasion demands. In short, there is a need for diverse credit delivery mechanisms even within the NGO.
At the borrower level, the transaction costs mainly emanate from the transportation expenses incurred in attending weekly meetings and turning over collections to the NGO. Participation in weekly meetings is a time-intensive activity for the borrowers as well as the SHG officers. However, this is their only gateway to credit. The possibility of repeat loans will undoubtedly mitigate in a way the cost of actual physical travel to the centre sites. It is therefore doubtful if this participation in meetings represents a high opportunity cost of their time. In the absence of the SHG and the weekly meetings, the only alternative is the moneylender. They also derive non-monetary benefits from these weekly meetings which strengrhen the common bond of the group. Obviously, this will bring down the transaction costs oflending to the poor.
8.2 Specific recommendations
In view of the foregoing, we recommend the following:
(I) The government must seriously consider funding the SHG formation costs, as a means of reducing the transaction costs of lending to the poor. Similarly, the government must allocate resources for pro-poor programs which will enhance their creditworthiness and viability as borrowers.
(2) The NGOs must continue with their market-based financial intermediation.
(3) The NGOs should continue to work towards increasing volumes and worker productivity.
67

Trt1tu11etion Co1ts of unJing to the Poor: Philippine NG<h
(4) The NGOs must explore the potential of mobilising more savings (deposits) as an alternative to bring down the cost of funds. In this regard, there is a need to review and possibly formulate an appropriate regulatory and empowering framework for savings mobilisation.
(5) The NGOs must also diversify their loan portfolios.
(6) The NGOs must invest in improved technology for record keeping, report writing and loan monitoring. The advent of cheap computer technology makes this an immediately realisable goal.
(7) The NGOs must be prepared to turn over to self-help groups some of the responsibilities in loan processing, monitoring and retailing ofloans.
(8) The NGOs and the banks must have mutual cooperation in the areas of training and consultancy services to strengthen and improve the capabilities ofNGOs further. Areas for common collaboration include loans processing, record keeping, management of information and financial management techniques-for example, product profitability models of banks.
(9) The donors must continue to support the NGOs, especially in the following areas: professionalisation of management and administration; acquisition and installation of appropriate computer technology for efficient loan transactions; and funding assistance for institution building.
68

Bibliography Abiad, Virginia. 1988. Borrower transaction costs and credit rationing in rural financial
markets: The Philippines case. Unpublished dissertation, University of the Philippines, Manila.
-------· 1994. Transaction costs of borrowers and lenders in the Philippine linkage project. Unpublished paper.
Adams, D. & Nehmen, G. 1979. 'Borrowing costs and the demand for rural credit'. The Journal of Development Studies, vol. 15.
Ahmed, Zia U. 1982. Transaction costs in rural financial markets in Bangladesh: A case study of a rural credit market. Unpublished dissertation, University of Virginia, USA.
Bhatt, V. 1978. 'Interest rate, transaction costs and financial innovations'. Domestic Studies, no. 47. World Bank.
Casuga, Magdalena. 1994. 'Transaction costs under an agrarian reform regime'. In Financial Intermediation in an Agrarian Reform Regime, eds Gilberto M. Llanto & Clarence Dingcong. Agricultural Credit Policy Council, Manila.
Casuga, M. & Morte, E. 1992. 'The borrowing experience of agrarian reform beneficiaries, 1985-1989: Results of the 1990 survey of the welfare of ARBs, issues and policy implications'. Studies in Rural Finance and Development, vol. 3, no. l, June.
Cuevas, Carlos. 1984. Intermediation costs, credit and scale economies of banking under financial regulation in Honduras. Unpublished dissertation, Ohio State University, USA.
Cuevas, C. & Graham, D. 1984. 'Rationing agricultural credit in LDCs: The role and determinants of transaction costs for borrowers'. Agriculture Finance Program, Ohio State University, USA.
------------· 1985. 'Transaction costs of borrowing and credit rationing in agriculture: A simultaneous-equations approach'. Economics and Sociology, occasional paper no. 1180. Agriculture Finance Program, Ohio State University, USA.
Foundation for Development Cooperation. 1992. Banking with the Poor: Report and recommendations based on case studies prepared by leading Asian banks and non governmental organisations. Foundation for Development Cooperation, Brisbane, Australia.
Ladman, Jerry. 1984. 'Loan transaction costs, credit rationing and market structure: The case of Bolivia'. In Undermining Rural Development with Cheap Credi.t, D. Adams, D. Graham & J.D. von Pischke. Westview Press, Boulder, Colorado, USA.
---------· 1989. J\symmetric information in rural financial markets and interlinking of transactions through self-help groups'. journal of Philippine Development, first semester, vol. XVI.
Llanto, Gilberto M. 1994a. The impact of collateral substitutes on bank lending behavior: An analytical framework. Unpublished paper, July.
---------· 1994b. 'The financial structure and performance of Philippine credit cooperatives'. PIDS Discussion Paper Series, no. 94-04, July.
69

Trtlns11etion Costs of LenJing to the Poor: Philippine NGOs
Uanto, Gilberto M. & Dingcong, Clarence (eds). 1994. Financial Intermediation in an Agrarian Refonn Regime. Agricultural Credit Policy Council, Manila.
Saito, K. & Villanueva, D.P. 1981. 'Transaction costs of credit to small scale sectors in the Philippines'. Economic Development and Cultural Change, vol. 29.
Untalan, Teodoro. 1988. 'Transaction costs of banks: A comparative study'. Unpublished master's thesis, University of the Philippines, Manila.
Untalan,T. & Cuevas, C. 1989. 'Transaction costs and the viability of rural financial intermediaries'.journal of Philippine Development, first semester, vol. XVI.
70

About The Foundation for Development Cooperation
The Foundation for Development Cooperation (FDC) is an independent, non-profit and non-partisan organisation whose aim is to strengthen international cooperation and development. It does this by undertaking, promoting and supporting activities to improve the quality and increase the quantity of aid to developing countries, and to promote development cooperation with these countries. It is the only such organisation in Australia. The late Bill Taylor, AO founded FDC in 1990 and served as Vice-Chairman until 1995.
The mandate of FDC calls for it to conduct policy-oriented research, foster public awareness, mobilise broader Australian and overseas interest and participation, and support non-governmental efforts to promote development, especially at the grassroots level. This mandate has been endorsed by legisation of the Australian Parliament, amending the Income Tax Assessment Act, to allow tax-deductible status for the Foundation.
The Foundation has developed close working relationships with Australian and international organisations (official, private and voluntary) and with its overseas counterparts (the Overseas Development Institute in the UK, the Overseas Development Council in the United States and the North-South Institute in Canada).
FDC's core budget is derived entirely from private sources. Support is now being received from other private foundations, corporations and individuals which will ensure the Foundation's viability as an independent policy research organisation contributing to international development and cooperation. Among these is a recent substantial grant from the Ford Foundation. Funding for specific project-related activities has also been received from private, government and international sources - the Australian Bankers' Association, the Australian Agency for International Development (AusAID), the World Bank, the Asian Development Bank and the United Nations Development Programme).
The policies and programs of FDC are determined by a Board of Governors comprising Dr Brian Scott (Chair), General Eva Burrows, Sir Liew Edwards, Sir Laurence Muir, Mr Stephen Taylor, Professor Roy Webb and the Hon. John Wheeldon. The late Sir Gordon Jackson, who chaired the committee whose 1984 report (the Jackson Report) revitalised Australia's official development cooperation program, was a founding governor. The Executive Director is Dr John Conroy. He is responsible for the implementation of policies and programs agreed by the Board, with the advice and assistance of a Program Advisory Panel.
The Foundation's major activity to date has been a project, Banking with the Poor, which has demonstrated the scope for increased access to credit for the poor in developing countries on a sound commercial basis. It has shown that the creative and productive capacities of the poor can be realised by their increased access to credit. The uniqueness of this project lies in the establishment of linkages between commercial banks, indigenous
71

Trt1,.,Mtio11 Cosa of IANli11g to the Poor: Philippiu NGO,
non-government organisations (NGOs) and self-help groups of the poor to provide a sustainable flow of credit, thus helping the poor to help themselves.
Apart from projects of an applied and action-research nature, such as Banking with the Poor, the Foundation is an innovator in its studies of international and regional development issues, and in particular the aid, trade and investment relationships of Australia with its neighbours in the Asia-Pacific region.
The Foundation for Development Cooperation Ltd A.C.N. 011 025 997 232 Adelaide Street, Brisbane, Australia (Postal address: PO Box 10445 Adelaide St, Brisbane QLD 4000, Australia) Telephone 61-7-3236 4633 •Facsimile 61-7-3236 4696
72

This report focuses on the credit programs of two Philippine NGOs which target the poor using self-help groups as delivery channels. Both NGOs are involved in contractual relationships with commercial banks, thus providing the link for a flow of bank loan capital to the self-help groups whose members are the ultimate borrowers. Significant features include a deliberate focus on the poor, organisation of clients into groups, and the use of group mutual accountability as substitute for traditional collateral.
The challenge for NGOs providing microcredit under these conditions is to achieve transaction costs of lending low enough to enable them to cover their costs. Only with low costs of lending, loan approval, administration and collection can they hope to achieve commercial sustainabilty and maintain the flow of credit to the poor.
The authors of this study have quantified the transaction costs incurred by both the NGOs and their ultimate borrowers, and analysed the productivity improvements necessary to assure the longer term sustainability of such lending operations. Their recommendations are applicable to microfinance institutions more generally, and have significant implications for the commercial viability of microlending. They also suggest areas where banks can assist NGOs to strengthen their capabilities, and indicate priorities for strategic assistance by governments and donor agencies.