Embed Size (px)
Citation preview

From the Department of Medicine III, Grosshadern Hospital and GSF, Clinical Cooperative Group ‘’Leukemia’’
Ludwig-Maximilians-University, Munich Chair: Prof. Dr. med. Wolfgang Hiddemann
The four and a half LIM domain protein 2 (FHL2)
interacts with CALM and is highly expressed in acute
myeloid leukemia (AML) with complex aberrant
karyotypes
Thesis Submitted for a Doctoral degree in Human Biology
at the Faculty of Medicine Ludwig-Maximilians-University,
Munich, Germany
Submitted by
Zlatana Pašalić
From Skövde, Sweden
2008

Aus der Medizinischen Klinik und Poliklinik III am Klinikum Großhadern
und GSF, Klinische Kooperations Gruppe‚’’Leukämie’’ der Ludwig-Maximilians-Universität München,
Direktor: Prof. Dr. med. Wolfgang Hiddemann
Das Four and a half LIM Domänen Protein 2 (FHL2)
interagiert mit CALM und ist hoch experimiert in
akuten myeloischen Leukämien (AML) mit komplex
aberranten Karyotypen.
Dissertation zum Erwerb des Doktorgrades der Humanbiologie
an der Medizinischen Fakultät der Ludwig-Maximilians-
Universität zu München, Deutschland
Vorgelegt von
Zlatana Pašalić
Aus
Skövde, Schweden
2008

Mit Genehmigung der Medizinischen Fakultät der Universität München
Berichterstatter: Prof. Dr. Stefan K. Bohlander Mitberichterstatter: Priv. Doz.Dr.Susanne Schnittger
Prof. Dr. Ania C. Muntau Mitbetreuung durch den promovierten Mitarbeiter: Dekan: Prof. Dr. med. Dr. h.c. M. Reiser, FACR Tag der mündlichen Prüfung: 16.12.2008

To my family

Acknowledgments I would like to thank, Prof. Stefan Bohlander for giving me the opportunity to work in this completely new
field for me. I would like to express my deep gratitude for his support and
understanding that were essential to complete this work.
all the colleagues from the CCG leukemia, the AG Bohlander members Belay Tizazu,
Alexandre Krause, Deepak Bararia, Purvi Kakadia, Luciana Fontanari-Krause, Leticia
Fröhlich Archangelo, especially Philipp Greif and Medhanie Mulaw for helpful and
fruitful discussions as well as Marc Weinkauf from Dr. Dreylings group for the
hematopoietic cell lines
my colleague, my close friend and neighbour Pawandeep Kaur sharing many “tea-
evenings“ with discussions, laughs and “tears”
my close friends Zoofa Shahidi, Dr. Soledad Funes as well as my neighbours Selma
and Sead Granulo
my boyfriend Ensar Muratović for always finding a way to give me new energy and
make me laugh
my sister Majida and my brother Senad that always find a way to encourage me
my parents Asima and Salih for the constant encouragement, the unconditional
support, their conviction and belief in me

Abbreviation
I
Abbreviations
aa amino acids Ab antibody AD activation domain ALL acute lymphoblastic leukemia AML acute myeloid leukemia Amp ampicillin AML-comp AML with complex aberrant karyotype AML_nk AML with normal karyotype ANTH domain AP180 N-terminal homology domain AP-2 clathrin adaptor protein complex 2 APS ammonium persulfate Aqua dest. water, deionized BD binding domain bp base pairs BSA bovine serum albumine cDNA complementary DNA, synthetic DNA
transcribed from a specific RNA through the action of the reverse transcriptase
cfu colony forming unit CME clathrin mediated endocytosis CML chronic myelogenous leukemia CoIP co-immunoprecipitation Conc concentration DAPI 4',6-diamidino-2-phenylindole dCTP Deoxycytosine triphosphate ddH2O double distilled water DEPC diethylpyrocarbonate DMEM Dulbecco’s Modified Eagle Medium DMSO dimethylsulfoxide dGTP Deoxyguanosine triphosphate DMF Dimethylformamide DNA deoxyribonucleic acid dNTP Deoxynucleotide triphosphate DO drop out DTT dithiothreitol dTTP Deoxythymidine triphosphate ECFP Enhanced Cyan Fluorescent Protein EDTA ethylenediaminetetraacetic acid e.g. example EGFP Enhanced Green Fluorescent Protein EST expressed sequence tags EtBr Ethidium-bromide EtOH ethanol

Abbreviation
II
EYFP Enhanced yellow fluorescent protein FAB French-American-British classification system
for acute leukemia FBS Fetal bovine serum FCS Fetal calf serum g gram g relative centrifugal acceleration GAL Galactose GAL4 yeast transcription factor GAL4-AD GAL4 transcriptional activation domain GAL4-DBD GAL4 DNA binding domain GAL4-UAS GAL4 upstream activating sequence Gly Glycine GFP green fluorescent protein GST glutathione S transferase HEPES N-(2-Hydroxythyl) piperazine-N’-2-ethan
sulphuric acid His Histidine HRP horse radish peroxidase hr(s) hour(s) HSC Hematopoietic stem cell IPTG isopropyl β-D thiogalactoside KAc Potassium acetate kb kilobase KCl Potassium chloride kDa kilodalton KH hnRNP K homology domain KH2PO4 Potassium dihydrogenphosphate l liter LacZ E. coli gene encoding beta-galactosidase LB Luria Bertani bacterial medium Leu = L Leucine LiAc lithium acetate LIM Lin11, Isl-1 and Mec-3 domain Lys = K Lycine M Molar m milli (1 x 10⁻³) MCS multiple cloning site Met = M Methionine MgCl2 Magnesium chloride MgSO4 Magnesium sulfate min minute(s) ml milliliter MLL Myeloid/lymphoid or mixed-lineage leukemia mM Milli Molar

Abbreviation
III
MOPS 3-N-morpholino-propanesulfonic acid mRNA messenger RNA MW Molecular weight n Nano (1 x 10⁻⁹) NaAC sodium acetate NaOH sodium hydroxide NaH2PO4 sodium dihydrogenphosphate Na2HPO4 disodium hydrogenphosphate (NH4)2SO4 ammonium sulfate NLS nuclear localization signal nt nucleotide O/N overnight ºC degree Celsius OD optical density ORF open reading frame PAGE polyacrylamide gel electrophoresis PBS phosphate buffer saline PCR polymerase chain reaction PEG polyethylenglycol Pen/Strep Penicillin/Streptomycin PFA paraformaldehyde pg pico gram PHD plant homeodomain Phe = F Phenylalanine PMSF Phenylmethylsulfonyl fluoride PtdIns(4,5)P2 phosphatidylinositol-4,5-bisphosphate RNA ribonucleic acid RNAse ribonuclease Rpm revolutions Per Minute RPMI Roswell Park Memorial Institute culture
medium RT room temperature SD synthetic defined Dropout medium SDS sodium dodecylsulfate sec second(s) Taq Thermus aquaticus (-Polymerase) TBS tris buffered saline TE tris-EDTA buffer TEMED N,N,N’,N’-Tetramethylethylendiamine Thr = T Threonine Tris trishydroxymethylaminomethane Trp = W Tryptophan tot. total Tm melting temperature Tyr = Y Tyrosine

Abbreviation
IV
U unit UTR untranslated region UV ultraviolet V volts Val = V Valine vector plasmid or phage chromosome used to carry
cloned DNA segment vol. volume v/v volume per volume ratio w/v weight per volume ratio WB Western blot x g gravity (9.81 m/s2) X-gal 5-bromo-4-chloro-3-indolyl-β-D-
galactopyranoside Y2H yeast two hybrid YFP yellow fluorescent protein YPD yeast extract, peptone, dextrose μ micro (1 x 10⁻⁶) μl micro liter μm micro meter μM micro molar

Table of Contents
V
Table of contents
Abbreviations....................................................................................................................... I Table of content ................................................................................................................. V Table of figures .............................................................................................................. VIII 1 Introduction................................................................................................................. 1
1.1 Hematopoiesis ...................................................................................................... 1 1.1.1 Hematopoietic stem cell................................................................................ 1
1.2 Chromosomal translocation.................................................................................. 4 1.3 The CALM/AF10 fusion gene ............................................................................. 7
1.3.1 CALM, AF10 and the CALM/AF10 fusion ................................................. 7 2 Material and Methods ............................................................................................... 11
2.1 Material .............................................................................................................. 11 2.1.1 Reagents...................................................................................................... 11 2.1.2 Material and Kits......................................................................................... 13 2.1.3 Laboratory equipment................................................................................. 14 2.1.4 Software ...................................................................................................... 14 2.1.5 Buffers and Solutions.................................................................................. 15 2.1.6 Culture media.............................................................................................. 20 2.1.7 Bacterial strain (Escherichia coli)............................................................... 21 2.1.8 Yeast strain.................................................................................................. 21 2.1.9 Mammalian cell lines.................................................................................. 22 2.1.10 Plasmids ...................................................................................................... 23 2.1.11 Constructs ................................................................................................... 24 2.1.12 Oligonucleotides ......................................................................................... 24 2.1.13 Antibodies ................................................................................................... 25
2.2 Methods.............................................................................................................. 26 2.2.1 Isolation of DNA......................................................................................... 26 2.2.2 Determination of nucleic acid concentration .............................................. 29 2.2.3 Digestion of DNA....................................................................................... 29 2.2.4 Ethanol precipitation of DNA..................................................................... 29 2.2.5 Ligation....................................................................................................... 30 2.2.6 DNA transformation into bacterial cell....................................................... 30 2.2.7 Agarose-gel electrophoresis for DNA ........................................................ 31 2.2.8 Isolation of DNA fragments........................................................................ 32 2.2.9 RNA extraction ........................................................................................... 32 2.2.10 Agarose-gel electrophoresis for RNA......................................................... 33 2.2.11 cDNA synthesis – reverse transcriptase reaction........................................ 34 2.2.12 Polymerase chain reaction- PCR ................................................................ 34 2.2.13 Cloning of constructs .................................................................................. 36 2.2.14 Culture of mammalian cells ........................................................................ 37 2.2.15 Transient transfection of adherent cells ...................................................... 37 2.2.16 Fixation of transfected cells and microscopy.............................................. 38 2.2.17 Yeast two hybrid ......................................................................................... 39 2.2.18 Protein extraction........................................................................................ 43

Table of Contents
VI
2.2.19 Determination of protein concentration ...................................................... 44 2.2.20 SDS-PAGE gel electrophoresis .................................................................. 44 2.2.21 Expression of GST fusion proteins ............................................................. 46 2.2.22 Immunoprecipitation................................................................................... 48 2.2.23 Immunofluoroscence................................................................................... 49 2.2.24 GAL4-based reporter gene assays .............................................................. 50
2.3 Micro array analysis ........................................................................................... 51 2.3.1 Expression analysis of FHL2 in leukemia samples .................................... 51
3 Results....................................................................................................................... 52 3.1 Identification of CALM interacting proteins using the yeast two hybrid system .. ............................................................................................................................ 52 3.2 Confirmation of potential protein interactions ................................................... 60 3.3 Mapping of the CALM-FHL2 interaction in yeast ............................................ 61
3.3.1 Construct of FHL2 bait protein................................................................... 61 3.3.2 Mapping of the CALM interaction domain of FHL2 ................................. 63 3.3.3 Mapping the FHL2 interaction domain of CALM...................................... 64
3.4 CALM-FHL2 GST pulldown assay ................................................................... 66 3.4.1 Expression of FHL2.................................................................................... 66 3.4.2 CALM interacts with FHL2 in vitro ........................................................... 67
3.5 CALM interacts with FHL2 in vivo ................................................................... 68 3.6 Co-localization of CALM and FHL2................................................................. 70 3.7 Co-localization of CALM/AF10 and FHL2....................................................... 73 3.8 Transcriptional activation assays ....................................................................... 77
3.8.1 CALM does not activate transcription in a GAL4-based transactivation assay ..................................................................................................................... 77 3.8.2 FHL2 acts as transcriptional activator in a GAL4 based transactivation assay ..................................................................................................................... 79 3.8.3 CALM interferes with the transcriptional activation of GAL4 DBD-FHL2 .. ..................................................................................................................... 80 3.8.4 CALM/AF10 does not affect FHL2 activation........................................... 82 3.8.5 FHL2 disturbs GAL4DBD-CALM/AF10-mediated transcriptional activation................................................................................................................... 83
3.9 Expression analysis of the FHL2 protein ........................................................... 85 3.9.1 Expression analysis of FHL2 in hematopoietic cell lines........................... 85 3.9.2 Expression analysis of FHL2 in normal and solid tumor cell lines ............ 86 3.9.3 Expression analysis of Fhl2 in rodent cell lines.......................................... 87
3.10 Expression analysis of FHL2 mRNA in leukemia samples ........................... 88 3.10.1 Microarray................................................................................................... 88
4 Discussion................................................................................................................. 90 4.1 Identification of CALM interacting proteins ..................................................... 90
4.1.1 CATS .......................................................................................................... 91 4.1.2 PCBP1......................................................................................................... 91 4.1.3 TSG101....................................................................................................... 92 4.1.4 CALM......................................................................................................... 93 4.1.5 FLNA .......................................................................................................... 93

Table of Contents
VII
4.1.6 FABP4......................................................................................................... 94 4.1.7 DPP7 ........................................................................................................... 94
4.2 FHL2 .................................................................................................................. 95 4.2.1 FHL2 interacts with CALM and influences the subcellular localization of CALM ..................................................................................................................... 96 4.2.2 FHL2 is expressed in tumor cell lines......................................................... 98 4.2.3 FHL2 is highly expressed in CML and AML with complex aberrant karyotypes ................................................................................................................. 99
4.3 Possible mechanisms of CALM/AF10-mediated leukemogenesis .................. 101 5 Summary ................................................................................................................. 104 6 Zusammenfassung................................................................................................... 105 7 References............................................................................................................... 107 Curriculum Vitae ............................................................................................................ 117

Table of Figures
VIII
Table of figures
Figure 1.1 The hematopoietic system.. ............................................................................... 2 Figur 1.2 Signaling pathways regulating self renewal and stem cells ................................ 3 Figure 1.3 Balanced chromosomal translocation................................................................ 5 Figure 1.4 Malignant transformation-1............................................................................... 5 Figure 1.5 Malignant transformation-2............................................................................... 6 Figure 1.6 The CALM/AF10 and AF10/CALM fusion genes.. ......................................... 7 Figure 1.7 Scheme of AF10 and CALM proteins, respectively AF10/CALM and CALM/AF10 translocations................................................................................................ 8 Figure 2.1The CALMΔ10 fused to GAL4 DBD binds to GAL4-UAS upstream of the reporter genes.................................................................................................................... 40 Figure 2.2 Reporter gene assay......................................................................................... 50 Figure 3.1 Diagrammatic representation of GAL4-DBD-CALM deletion constructs. .... 52 Figure 3.2 Map of cDNA, Open Reading Frames (ORFs) of full length proteins and the extent of the DNA sequence in the prey clones isolated in the yeast two hybrid screens with pGBKT7-CALMΔ10. ............................................................................................... 58 Figure 3.3 Interaction of CALM with 8 different proteins ............................................... 60 Figure 3.4 A) Diagram of the FHL2 deletion constructs cloned into pGBKT7 B) Western blot of FHL2 deletion mutants fused to the GAL4 DBD. C) Western blot of FHL2 fused to the GAL4-AD. .............................................................................................................. 62 Figure 3.5 Full length FHL2 is needed for the interaction with CALM........................... 63 Figure 3.6 FHL2 interacts with amino acids 294 to 335 of CALM.................................. 64 Figure 3.7 Diagram of FHL2 fused to GST...................................................................... 66 Figure 3.8 GST and the GST-FHL2 fusion protein on a Coomassie stained PAGE gel .. 66 Figure 3.9 GST pulldown assay........................................................................................ 67 Figure 3.11 CALM interacts with FHL2 in vivo .............................................................. 69 Figure 3.12 YFP-CALM, YFP-CALM/AF10 and YFP-FHL2 overexpressed in U2OS cells. .................................................................................................................................. 71 Figure 3.14 YFP-CALM/AF10 and FLAG-FHL2 co-localize mainly in the cytoplasm. 74 Figure 3.15 FLAG-CALM/AF10 and YFP-FHL2 colocalize in the cytoplasm............... 76 Figure 3.16 Diagram of CALM in GAL4-based transactivation assay ............................ 77 Figure 3.17 FHL2 transcription assay model.................................................................... 79 Figure 3.18 FHL2 fused to GAL4DBD acts as activator of transcription ........................ 79 Figure 3.19 Model of CALM-FHL2 interaction............................................................... 80 Figure 3.20 CALM disturbs the activation of GAL4DBD-FHL2. ................................... 81 Figure 3.21 Model of GAL4-DBD-FHL2 co-transfected with CALM/AF10.................. 82 Figure 3.22 YFP-CALM/AF10 does not affect GAL4 DBD-FHL2-mediated transcriptional activation in 293T cells............................................................................. 82 Figure 3.23 Cartoon of GAL4DBD-CALM/AF10 influenced by FHL2.......................... 83 Figure 3.24 Transcriptional activation by GAL4 DBD-CALM/AF10 is disturbed by FLAG-FHL2.. ................................................................................................................... 84 Figure 3.25 Expression of FHL2 in hematopoietic cell lines. .......................................... 85 Figure 3.26 Western blot analyses of FHL2 in normal and solid tumor cell lines.. ......... 86 Figure 3.27 Expression of FHL2 in rodent cell lines........................................................ 87

Table of Figures
IX
Figure 3.28 FHL2 is expressed at higher levels in CML (Chronic myeloid leukemia) and AML (Acute myeloid leukemia) with complex aberrant karyotype................................. 89 Figur 4.1 Domain structure of the FHL2 protein.. ............................................................ 95

1 Introduction
1
1 Introduction
1.1 Hematopoiesis
1.1.1 Hematopoietic stem cell
Our body generates billions of blood cells every day. Hematopoiesis, the formation of red
and white blood cells, begins already in the embryonic yolk sac. During the development
of the human fetus, hematopoietic stem cells (HSC) migrate from the yolk sac to the fetal
liver and thereafter to the spleen. After the 7th month of gestation the differentiation of
HSCs in the bone marrow becomes the major location of hematopoiesis. HSCs consists
of two subpopulations -one with short-term repopulation ability (<10 weeks) and the
second population with a long-term repopulating ability that lasts the lifetime of an
organism (Morrison S. and Weissman I., 1994). There are two standards for defining a
cell as a normal stem cell: it must have the ability (1) to self-renew and (2) to
differentiate into the various blood cells (Till J.E. and McCullough E.A., 1961;
Weissman I. L., 2000). Early in hematopoiesis the HSC differentiates either into a
lymphoid progenitor cell or into a myeloid progenitor cell. Progenitor cells are cells that
have lost the capacity to self-renew and are destined to a particular cell lineage. The
lymphoid progenitor gives rise to B-, T- and natural killer (NK) cells, while the myeloid
progenitor give rise to red blood cells (erythrocytes), white blood cells (neutrophils,
eosinophils, basophils, monocytes, mast cells) and megakaryocytes. In figure 1.1 a model
of the differentiation pathways of the hematopoietic system is shown.

1 Introduction
2
Figure 1.1 The hematopoietic system.The HSC differentiates into the common lymphoid progenitor
(CLP) or into the common myeloid progenitor (CMP). The CMP differentiates in turn into red blood cells,
white blood cells and megakaryocytes. The CLP differentiates into B-, T- and NK cells.
The physiological function of hematopoietic stem cells is to replace blood cells that were
lost in illness or trauma, and in normal cell turnover. Under normal conditions stem cells
can be in a quiescent state for a longer time period, however once they exit this state they
start to self renew or differentiate to generate needed progenies (McCulloch E. and Till
J.E., 2005; Moore M. et al., 2006; Weissman I. L., 2000).
Stem cell niche
It is an evolutionarily conserved phenomenon that stem cells interact with their micro
environment- the so called stem cell niche, to establish and maintain their properties
(Fuchs E. et al., 2004). To be considered a stem cell niche, the environment has to enable
the stem cells to reproduce or self renew (Scadden D., 2006). Recently it has been shown
that osteoblasts, the bone-forming cells, are essential regulatory components of the HSC
niche in the bone marrow compartment that influence HSC function through Notch

1 Introduction
3
signaling (Calvi L., 2006; Stier S. et al., 2005). Once the stem cell compartment is
formed in a tissue the stem cells often go into a quiescent state. This is for example the
case when HSC that express the tyrosine kinase receptor Tie2 adhere to osteoblasts in the
bone marrow niche. The interaction of Tie2 and its ligand angiopoietin-1 (Ang-1) results
in HSCs tightly adhering to the stromal cells, which in turn leads to the maintenance of
their long term repopulating activity of HSC (Suda T. et al., 2005). As the HSC
progressively mature they lose contact with the stromal cells and start to proliferate. They
migrate towards the central bone marrow cavity where they differentiate and proliferate
and finally as mature blood cells they enter the blood vessels.
Self renewal and leukemogenesis
There is increasing evidence that the Notch, Hedgehog and Wnt pathways, that control
many developmental processes, also regulate the self-renewal of hematopoietic
progenitors and stem cells. These pathways have also been shown to be deregulated in
cancers (Bhardwaj G. et al., 2001; Reya T. et al., 2001; Varnum-Finney B. et al., 2000) as
shown in figure1.2.
Figur 1.2 Signaling pathways regulating self renewal and stem cells. Notch, Hedgehog and Wnt
pathways regulate developmental processes, self-renewal of hematopoietic progenitors and stem cells, and
have been shown to be involved in cancers when deregulated (Picture from Reya, 2001).

1 Introduction
4
In the case of Wnt signaling, the Wnt proteins are produced by HSCs themselves but also
by the surrounding microenvironment (Rattis F.M. et al., 2004), implicating that Wnt can
modulate HSC indirectly by influencing the microenvironment. Since normal stem cell
and cancer cell share the ability to self renew (Al-Hajj M. and Clarke MF., 2004; Bonnet
D. and Dick J., 1997) it is reasonable to assume that newly arising cancer cell use the
machinery for self-renewing cell division that is used by stem cells for their own ends.
There are two reasons to believe that stem cells themselves are the target of
transformation: (1) stem cells already have self-renewal capacity and (2) self-renewing-
stem cells often persist for long periods of time, instead of dying after short periods of
time like many mature cells in highly proliferative tissues. This means that stem cells
have the opportunity and time to accumulate the mutations that are required for malignant
transformation.
1.2 Chromosomal translocation
Nowell and Hungerford discovered in 1960s a small acrocentric chromosome that was
very often observed in association with chronic myeloid leukemia (CML) (Nowell and
Hungerford, 1960). It was named the Philadelphia chromosome and was one of the first
chromosomal abnormalities to be associated with a human cancer. The nature of this
abnormality was unclear but it was assumed that a loss of chromosomal material from
one of the small G-group chromosomes had occurred and that this loss was somehow
associated with the development of leukemia. Following this discovery, recurring
chromosomal abnormalities and the discovery that the Philadelphia chromosome in CML
was the result of a balanced chromosomal translocation (Rowley J.D., 1973) led to an
enormous increase in our understanding of the genetic changes that occur in leukemic
cells. At the cytogenetic level most chromosome translocations in leukemia arise in
hematopoietic stem cells and are reciprocal, stable and balanced (Zhang Y. and Rowley
J., 2005). In balanced chromosomal translocations, genetic material between two non-
homologues chromosomes is exchanged (fig 1.3).

1 Introduction
5
Figure 1.3 Balanced chromosomal translocation. The small arrows indicate the breakpoints.
Such balanced translocations can have either of two consequences: (1) the juxtapposition
of a coding region from one gene with a promoter of another gene leading to deregulated
gene expression or (2) the fusion of two coding regions which creates a new chimaeric
gene that encodes for a fusion protein (Rowley J.D., 1999; Rowley J.D., 2000; Rowley
J.D., 2001). A classic example of the first consequence is the first molecularly
characterized translocation t(8;14) that causes Burkitt’s lymphoma (Zech L. et al., 1976).
The translocation juxtapposes the immunoglobulin heavy chain (IGH) promoter region to
the MYC coding sequence resulting in abnormal expression of the MYC oncogene as
seen in figure 1.4.
Figure 1.4 Malignant transformation-1.The juxtaposition of a coding region from one gene with a
promoter of another gene inducing altered expression of Gene B. (Adapted of Rowley, 2001)

1 Introduction
6
The examples for the second consequence is the t(9;22)(q34;q11) translocation which
leads to a fusion between the breakpoint cluster region (BCR) gene and the Abelson
tyrosine kinase (ABL) gene resulting in the production of the BCR/ABL fusion protein,
figure 1.5.
Figure 1.5 Malignant transformation-2. Fusion of two coding regions that create a new chimaeric gene
that encodes a new fusion protein. (Picture adapted from Rowley, 2001)
The association of particular chromosomal translocations with specific subtypes of
leukemia and lymphomas led to a strong research activity in this field and today leukemia
and lymphoma are the most extensively characterized human malignant diseases. As a
result of this activity a network of different fusion genes has emerged showing that some
genes are involved in more than one translocation forming fusion genes with several
partner genes. The most prominent genes involved in more than one translocation in this
network are the RUNX1 (AML1), ETV6 and MLL genes, which have been shown to play
central roles in the pathogenesis of different leukemias (Bohlander S.K. et al., 2000).

1 Introduction
7
1.3 The CALM/AF10 fusion gene
1.3.1 CALM, AF10 and the CALM/AF10 fusion
The t(10;11)(p13;q14) translocation was first characterized at the molecular level in the
human monocytic cell line U937 (Dreyling M. et al., 1996). This balanced translocation
results in a fusion of CALM on chromosome 11, band q14, to AF10 on chromosome 10
band p13 as shown in figure 1.6.
Figure 1.6 The CALM/AF10 and AF10/CALM fusion genes.The distal part of the short arm of
chromosome 10 is fused to the proximal long arm of chromosome 11 resulting in the formation of an
AF10/CALM fusion gene at the breakpoint. The distal part of the long arm of chromosome 11 is fused to
the proximal part of the short arm chromosome 10 resulting in the formation of the CALM/AF10 fusion
gene.
The breakpoint in the CALM gene is located at the C-terminus of the gene and the
breakpoint in AF10 is located near the N-terminus of AF10. The CALM/AF10 fusion
contains almost the complete open reading frames of both the CALM and AF10 genes
(Dreyling M. et al., 1996), whereas the AF10/CALM fusion only encodes for a truncated
AF10 protein consisting of 84 amino acids as seen in figure 1.7.

1 Introduction
8
Figure 1.7 Scheme of AF10 and CALM proteins, respectively AF10/CALM and CALM/AF10
translocations.Breakpoints in the protein in U937 cell line are indicated by arrows, and breakpoints found
in cells from patients are indicated by triangles. It can be seen that CALM/AF10 translocation contains
almost the whole AF10 and CALM gene while AF10/CALM translocation contains the small leftover parts.
PHD: plant homeodomain zinc fingers; NLS: nuclear localization signal; AT: AT-hook motif; OM:
octapeptide motif; LZ: leucine zipper; Q: glutamic acid rich domain; ANTH: AP180 N-terminal homology
domain.
Due to the location of the breakpoints in CALM and AF10 the reciprocal fusion mRNAs
encode fusion proteins of unequal size. Analysis of the breakpoint region in
t(10;11)(p13;q14) leukemia showed three different breakpoints in CALM and four
breakpoints in the AF10 gene with no apparent correlation between the location of the
breakpoints and the phenotype or outcome of disease (Bohlander S.K. et al., 2000;
Kumon K. et al., 1999). The CALM/AF10 fusion transcript has mainly been identified in
T-cell acute lymphoblastic leukemia (ALL), undifferentiated acute myeloid leukemia
(AML) (FAB M0 or M1) and in malignant lymphoma and has a poor prognosis (Dreyling
M. et al., 1998; Kumon K. et al., 1999; Narita M. et al., 1999). Later CALM/AF10
translocations were also observed in more differentiated AML subtypes (FAB M4, M5

1 Introduction
9
and M7) (Abdou S.M. et al., 2002; Carlson K. et al., 2000; Jones L.K. et al., 2001;
Nakamura F. et al., 2003; Salmon-Nguyen F. et al., 2000).
Most t(10;11)(p13;q14) translocations generate CALM/AF10 as well as the AF10/CALM
fusion transcripts. However, AF10/CALM transcripts are not detected in all leukemia
samples indicating that it is probably the CALM/AF10 fusion transcript that directs the
transformation process (Carlson K. et al., 2000). Desphande et al, showed that the
expression of the CALM/AF10 fusion protein is sufficient to cause an aggressive
biphenotypic leukemia in a murine bone marrow transplantation model (Deshpande A. et
al., 2006 ).
The AF10 gene (ALL 1 fused gene from chromosome 10), was first identified as a fusion
partner of MLL in 3 AML patients with a t(10;11)(p12;q23) translocation (Chaplin T. et
al., 1995). In 1996, Dreyling et al described the second translocation involving AF10- the
CALM/AF10 translocation. The AF10 gene is located on chromosome 10 band p12 and
encodes a 1,027 amino acids long protein. The AF10 gene encodes a putative
transcription factor containing N-terminally two LAP/PHD (Leukemia Associated
Protein/Plant Homeo Domain) zinc finger motifs, three extended LAP/PHD fingers, a
nuclear localization signal (NLS), an AT-hook domain, an octapeptide motif (OM), a
leucine zipper (LZ) motif and a glutamic acid rich region (Q rich region). The Drosophila
homologue of AF10, alhambra, has been suggested to play a role in heterochromatin-
mediated transcriptional silencing (Debernardi S. et al., 2002; Linder B. et al., 2001;
Linder B. et al., 2000; Perrin L. et al., 2003; Perrin L. and Dura J.M., 2004; Saha V. et al.,
1995).
CALM was first identified as the fusion partner of AF10 in the human monocytic cell line
U937 that harbors the t(10;11)(p13;q14) translocation (Dreyling M. et al., 1996). The
clathrin assembly lymphoid myeloid leukemia protein (CALM) is the ubiquitously
expressed homologue of the neuron-specific protein AP180 (Tebar F. et al., 1999). CALM
is located on chromosome 11 band q14 and encodes a 652 amino acid long protein. The
homologous proteins of CALM: LAP (in Drosohophila melanogaster) and Unc11 (in
Caenorhabditis elegans) are both implicated in clathrin-mediated endocytosis (CME).
Mutations of LAP and Unc11 suggest that these proteins play a role in the regulation of

1 Introduction
10
endocytic vesicle size (Kalthoff C. et al., 2002; Meyerholz A. et al., 2005; Nonet M. et
al., 1999). It has also been shown that CALM plays a role in clathrin mediated
endocytosis by promoting the assembly of clathrin into clathrin cages and taking part in
the initial stage of coated pit formation and invagination together with clathrin, AP-2 and
PtdIns(4,5)P2 containing membranes (Ford M. et al., 2001; Kim H.L. and Kim J.A., 2000;
Kim J.A. and Kim H.L., 2001; Meyerholz A. et al., 2005; Tebar F. et al., 1999). This
process is probably mediated by binding of phosphoinositides through the CALM Epsin
N-terminal homology (ENTH) domain and binding of clathrin through the CALM C-
terminal region. The CALM- clathrin interaction has been shown, in vitro, to promote the
assembly of clathrin triskelia into clathrin cages (Ford M. et al., 2001; Kim H.L. and Kim
J.A., 2000). Both overexpression and down regulation of CALM have been shown to
inhibit CME and impair the trafficking of receptors between the trans golgi network and
endosomes (Meyerholz A. et al., 2005; Tebar F. et al., 1999). Point mutations in the
mouse homologue Picalm were shown to cause abnormalities in hematopoiesis, iron
metabolism and bone growth (Klebig M. et al., 2003).
However, many aspects of the function of CALM or the leukemogenic CALM/AF10
fusion protein are unknown. We chose to learn more about the function of CALM by
searching for CALM interacting proteins with a yeast two hybrid screen. One of the
interesting proteins discovered in our screen was the FHL2 protein (four and a half LIM
domain protein 2).

2 Material and Methods
11
2 Material and Methods
2.1 Material
2.1.1 Reagents
1-kb-DNA Ladder Invitrogen, Karlsruhe, Germany
β-Mercaptoethanol Sigma, Taufkirchen, Germany Acetic acid Merck, Darmstad, Germany Acrylamid Rotiphorese® Gel 30 (37, 5:1) Carl Roth, Karlsruhe, Germany Agar Carl Roth, Karlsruhe, Germany Agarose ICN Biomedicals Inc. Amino acids (yeast two-hybrid) Sigma, Taufkirchen, Germany Ammonium persulfate (APS) Sigma, Taufkirchen, Germany Ampicillin Na-Salt Pan Biotech, Aidenbach, Germany BigDye™ terminator mix PE Applied Biosystems, Foster City, CA Boric acid Carl Roth, Karlsruhe, Germany Bovine serum albumin Sigma, Taufkirchen, Germany Bromophenol blue Carl Roth, Karlsruhe, Germany Calcium chloride (CaCl2) Sigma, Taufkirchen, Germany Coomassie® stain solution BioRad, Hercules, CA D(+)-Glucose-Monohydrate Merck, Darmstadt, Germany Dakocytomation Mounting Medium DakoCytomation, Hamburg, Germany DAPI- 4',6-diamidino-2-phenylindole Sigma, Taufkirchen, Germany d2H2O Millipore, Eschborn, Germany Deoxyribonuclease I, Amplification Grade Invitrogen, Karlsruhe, Germany Diethyl Pyrocarbonate (DEPC) Sigma, Taufkirchen, Germany Dimethyl formamide (DMF) Carl Roth, Karlsruhe, Germany Dimethyl sulfoxide (DMSO) Merck, Darmstadt, Germany Dithiothreitol (DTT) Carl Roth, Karlsruhe, Germany dNTP Set, PCR Grade Invitrogen, Karlsruhe, Germany DPBS Pan Biotech, Aidenbach, Germany Dulbecco´s Modified Eagle medium (DMEM), Pan Biotech, Aidenbach, Germany ECL™ Plus Western Blotting Detection Reagent Amersham, Freiburg, Germany ECL™ Western Blot Detection reagents Amersham, Freiburg, Germany EDTA Carl Roth, Karlsruhe, Germany Ethanol Merck, Darmstadt, Germany Ethidium bromide Carl Roth, Karlsruhe, Germany Fetal bovine serum (FBS) Gibco Invitrogen cell culture, Karlsruhe, Germany Formaldehyde 37% Carl Roth, Karlsruhe, Germany Formamide Carl Roth, Karlsruhe, Germany Glutathione-Agarose Sigma, Taufkirchen, Germany Glycerin 87% neoLab, Heidelberg, Germany Glycerol Carl Roth, Karlsruhe, Germany Glycine Merck, Darmstadt, Germany Herring Testes Carrier DNA denatured DB Biosciences Clontech, Heidelberg, Germany Hydrochloridric acid 37% Merck, Darmstadt, Germany

2 Material and Methods
12
Hydrogen peroxide (H2O2) solution 35% Merck, Darmstadt, Germany IPTG Roche, Mannheim, Germany Isopropanol Carl Roth, Karlsruhe, Germany Kanamycin Pan Biotech, Aidenbach, Germany Klenow Fragment MBI Fermentas, St. Leon-Rot, Germany L-Glutamine Pan Biotech, Aidenbach, Germany Lithium acetate Sigma, Taufkirchen, Germany Magnesium Sigma, Taufkirchen, Germany Methanol Merck, Darmstadt, Germany Milk powder Carl Roth, Karlsruhe, Germany MOPS (3-(N-Morpholino)-propanesulfonic acid) Carl Roth, Karlsruhe, Germany NP40 (Nonidet P-40) Roche, Mannheim, Germany Oligo (dT)12-18 Primer Invitrogen, Karlsruhe, Germany PanScript DNA Polymerase Pan Biotech, Aidenbach, Germany Paraformaldehyde Electron Microscopy Sciences, Hatfield, USA Penicillin/streptomycin Pan Biotech, Aidenbach, Germany Pepstatin Sigma, Taufkirchen, Germany Peptone, meat pancreatic digested Merck, Darmstadt, Germany Phenol/chloroform/isoamyl (25:24:1) Invitrogen, Karlsruhe, Germany Phenylmethylsulfonylfluorid (PMSF) Sigma, Taufkirchen, Germany Platinum® Taq DNA Polymerase Invitrogen, Karlsruhe, Germany Polyethylenglycol (PEG) 4000 Merck, Darmstadt, Germany Potassium acetate (KAc) Calbiochem, San Diego, USA Potassium chloride (KCl) Calbiochem, San Diego, USA Protein A-Agarose Roche, Mannheim, Germany Protein G-Agarose Roche, Mannheim, Germany Proteinase inhibitor cocktail Sigma, Taufkirchen, Germany Proteinase K Sigma, Taufkirchen, Germany Restriction enzymes MBI Fermentas, Germany Restriction enzymes NewEngland Biolabs, Schwalbach, Germany Ribonuclease A MBI Fermentas, Sigma or Qiagen, Germany RNA Ladder, High Range MBI Fermentas, St. Leon-Rot, Germany RNA polymerase Roche, Mannheim, Germany RNase Away Carl Roth, Karlsruhe, Germany RNaseOUT™ Recombinant Ribonuclease Inhibitor Invitrogen, Karlsruhe, Germany Roswell Park Memorial Institute culture Medium (RPMI 1640)
Pan Biotech, Aidenbach, Germany
Roti®-Fect transfection reagent Carl Roth, Karlsruhe, Germany SDS- Sodium dodecyl sulfate Carl Roth, Karlsruhe, Germany SeeBlue® Plus2 pre-stained standard Invitrogen, Karlsruhe, Germany Shrimp Alkaline Phosphatase (SAP)l MBI Fermentas, St. Leon-Rot, Germany Sodium acetate, Anhydrous (NaAC) Calbiochem, San Diego, USA Sodium chloride (NaCl) Merck, Darmstadt, Germany Sodium deoxycholate Sigma, Taufkirchen, Germany Sodium hydroxide (NaOH) Merck, Darmstadt, Germany Sodium phosphate dibasic anhydrous (Na2HPO4) Sigma, Taufkirchen, Germany Sodium phosphate monobasic monohydrate (Na2HPO4) Calbiochem, San Diego, USA Sucrose Sigma, Taufkirchen, Germany Sybr Green Roche, Mannheim, Germany

2 Material and Methods
13
SuperScript™ II RNase H- Reverse Transcriptase Invitrogen, Karlsruhe, Germany T4 DNA Ligase NewEngland Biolabs, Schwalbach, Germany Trichloroacetic acid (TCA) Carl Roth, Karlsruhe, Germany Tris- trishydroxymethylaminomethane Carl Roth, Karlsruhe, Germany Triton X-100 Carl Roth, Karlsruhe, Germany Trypsin-EDTA Gibco™, Germany Tween® 20 Sigma, Taufkirchen, Germany X-α- gal Clontech, Heidelberg, Germany Yeast extract Sigma, Taufkirchen, Germany Yeast nitrogen base without amino acids Difco, Detroit MI, USA
2.1.2 Material and Kits
Blotting paper GB003 and GB002 Schleicher & Schuell, Dassel, Germany Coverslips Menzel-Gläser®, Braunschweig, Germany Cryotube™ vials Nalge Nunc Internacional, Denmark DNeasy®Tissue Kit (50) Qiagen, Hilden, Germany Dual-Luciferase® Reporter Assay System Promega, Mannheim, Germany Electroporation cuvettes 2mm EquiBio, Kent, UK Endofree® Plasmid Maxi kit (10) Qiagen, Hilden, Germany Eppendorf tubes Eppendorf, Hamburg, Germany Filter 0.22μm Millipore, Belford, USA Genomed Plasmid Mega Kit Genomed, St. Louis, USA Glass beads Sigma, Taufkirchen, Germany Glassware Schott, Jena, Germany Hybond-N nylon membranes Amersham, Freiburg, Germany Hybond™ ECL™ nitrocellulose membrane Amersham, Freiburg, Germany Hypercassete™ 18x24 cm Amersham, Freiburg, Germany Hyperfilm ECL high performance Amersham, Freiburg, Germany JETSTAR MEGA Cartridge Genomed, Bad Oeynhausen, Germany Luminometer tube (Disposable Cuvettes 12 mm x 50 mm)
Promega, Mannheim, Germany
Microcentrifuge tubes (1.5 ml) Eppendorf, Hamburg, Germany Microscope slides Menzel-Gläser®, Braunschweig, Germany Mitsubishi thermal papervideo-printer Mitsubishi, Hatfield, UK Nescofilm sealing film Carl Roth, Karlsruhe, Germany Pipette tips Carl Roth, Karlsruhe, Germany Plastic cuvettes for OD Carl Roth, Karlsruhe, Germany Plastic ware for cell culture Greiner Labortechnik, Frickenhausen, Germany Plastic ware for cell culture Sarstedt, Nümbrecht, Germany Plastic ware for cell culture Corning, USA Qiagen Gelextraction Kit Qiagen, Hilden, Germany Qiagen RNEasy Mini Kit Qiagen, Hilden, Germany Qiagen Midi Kit Qiagen, Hilden, Germany Qiagen EndoFree Maxi Kit Qiagen, Hilden, Germany QIAquick columns Qiagen, Hilden, Germany Qiashredder™ columns Qiagen, Hilden, Germany RNeasy™ mini kit Qiagen, Hilden, Germany Surgical blades Feather Safety Razor Co. Med. Div., Japan

2 Material and Methods
14
Syringe Braun, Melsungen, Germany
2.1.3 Laboratory equipment
Axioplan 2 Imaging microscope Carl Zeiss, Jena, Germany AxioCam HR digital camera Carl Zeiss, Jena, Germany Axiovert 200M microscope Carl Zeiss, Jena, Germany BioPhotometer 6131 Eppendorf, Hamburg, Germany Centrifuge 5417 C Eppendorf, Hamburg, Germany Centrifuge 5417 R Eppendorf, Hamburg, Germany Cryotome CM 1850 Leica Microsystems, Wetzlar, Germany Electroporator (Easyject Prima) EquiBio Peqlab, Erlangen, Germany Gel Air™ Drying System BioRad Laboratories, Hercules, CA Genetic Analyzer automated sequencer ABI PRISM 310 PE Applied Biosystems, Foster City, CA GS Gene Linker™ UV Chamber BioRad Laboratories, Hercules, CA Cell Culture Incubators Heraeus Instruments, Langenselbold, Germany Innova™ 4400 Incubator Shaker New Brunswick Scientific, Nürtingen, Germany Orion Microplate Luminometer Berthold Detection System Thermomixer 5436 Eppendorf, Hamburg, Germany Trans-Blot® SD Semi -Dry Transfer Cell BioRad Laboratories, Hercules, CA X-Ray Automatic Processor Curix 60 Agfa, Köln Germany
2.1.4 Software
Microsoft Office 2003 (Microsoft Corporation, USA) was used for text editing, table
calculations and graphic images, Adobe Reader 7.0 (Adobe Systems, Mountain View,
U.S.A) was used to convert documents into PDF format. Pictures were processed with
Adobe Photoshop CS3 (Adobe Systems, Mountain View, U.S.A.). The Vector™ NTI
Suite 9 (Oxford Molecular Group) was used for sequence analysis and primers design.
The Leica Software was used for confocal imaging (Leica Microsystems, Germany).
2.1.4.1 R program
R (Bell Laboratories) is an object oriented program for statistical computing and
graphics, written initially by Robert Gentleman and Ross Ihaka at Statistics Department
of the University of Auckland, New Zealand. R can be used to analyze probe sets from
micro array data. R is a free open source environment. Its strength is the graphical
facilitiy that produce publication-quality graphs which can include mathematical
symbols.
2 Material and Methods
15
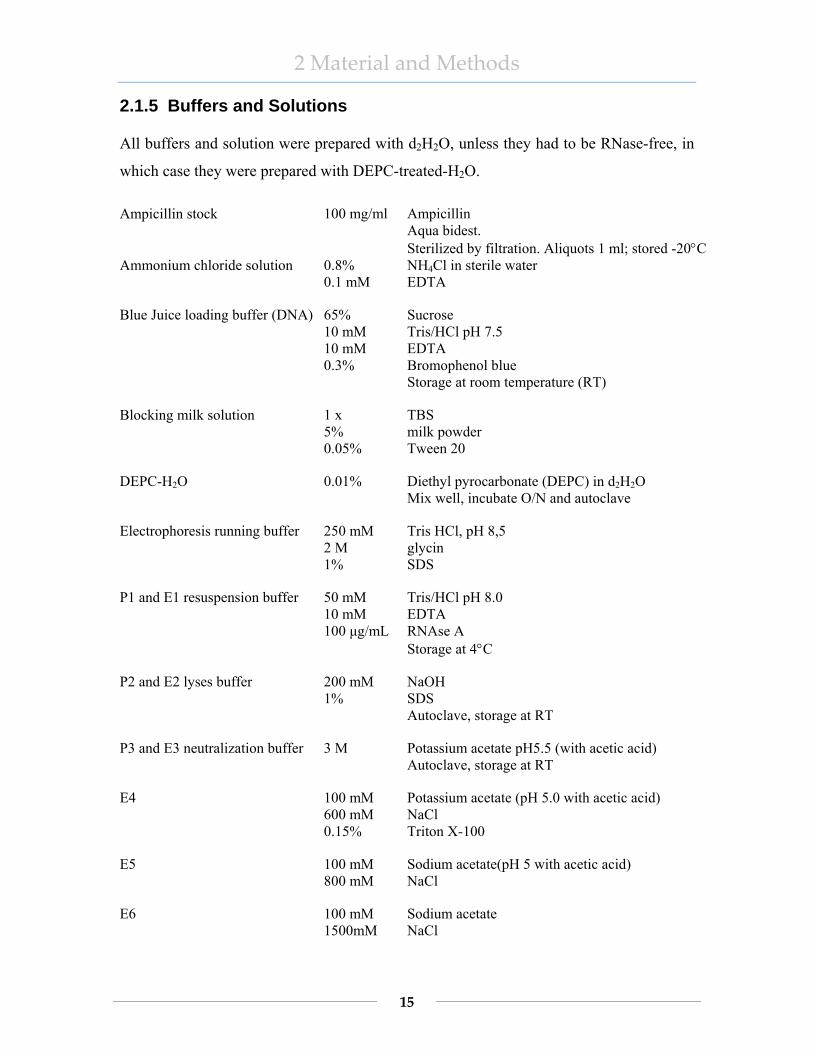
2.1.5 Buffers and Solutions
All buffers and solution were prepared with d2H2O, unless they had to be RNase-free, in
which case they were prepared with DEPC-treated-H2O.
Ampicillin stock
100 mg/ml Ampicillin Aqua bidest. Sterilized by filtration. Aliquots 1 ml; stored -20°C
Ammonium chloride solution 0.8% 0.1 mM
NH4Cl in sterile water EDTA
Blue Juice loading buffer (DNA) 65% 10 mM 10 mM 0.3%
Sucrose Tris/HCl pH 7.5 EDTA Bromophenol blue Storage at room temperature (RT)
Blocking milk solution 1 x 5% 0.05%
TBS milk powder Tween 20
DEPC-H2O 0.01% Diethyl pyrocarbonate (DEPC) in d2H2O Mix well, incubate O/N and autoclave
Electrophoresis running buffer
250 mM 2 M 1%
Tris HCl, pH 8,5 glycin SDS
P1 and E1 resuspension buffer 50 mM 10 mM 100 μg/mL
Tris/HCl pH 8.0 EDTA RNAse A Storage at 4°C
P2 and E2 lyses buffer 200 mM 1%
NaOH SDS Autoclave, storage at RT
P3 and E3 neutralization buffer 3 M Potassium acetate pH5.5 (with acetic acid) Autoclave, storage at RT
E4 100 mM 600 mM 0.15%
Potassium acetate (pH 5.0 with acetic acid) NaCl Triton X-100
E5 100 mM 800 mM
Sodium acetate(pH 5 with acetic acid) NaCl
E6 100 mM 1500mM
Sodium acetate NaCl

2 Material and Methods
16
Gel fixation solution 20% 10%
methanol (v/v) acetic acid (v/v)
40% Glucose 40% w/v (400g)
D-(+)-Glucose Fill up to 1l of d2H2O Autoclave
GST buffer 100 mM 25 mM 0.1%
NaCl Tris pH 7.5 NP-40
IP buffer 0.1 % NP-40 PBS
Kanamycin stock
50mg/ml Kanamycin Aqua bidest. Sterilized by filtration. Aliquots 1 ml; stored at -20°C
Lyses solution for yeast cells 10 mM 1 mM 100 mM 2% 1%
Tris/HCl pH 8.0 EDTA NaCl Triton X-100 SDS
2x Lämmli sample buffer 10% 6% 20% 0.2 mg/ml 0.025X
β-mercaptoethanol SDS Glycerol Bromophenol blue Lämmlie stacking buffer (optional) Store up to 2 month at RT
2.5x Lämmli stacking buffer 0.3 M 0.25%
Tris/HCl pH 6.8 SDS Store up to 1 month at 4°C
NETN buffer
150 mM 20 mM 1 mM 0.5%
NaCl Tris/HCl pH 8.0 EDTA pH 8.0 Triton X-100

2 Material and Methods
17
Buffer A for cytoplasmic extract
20 mM 10 mM 3 mM
1% 10% 0.2 mM
HEPES NaCl MgCl2
NP 40 Glycerol EDTA
PBS-DEPC 30 ml 15 ml 955 ml
5 M NaCl 1 M Sodium phosphate buffer pH 7.3 DEPC-H2O
PEG/LiAc solution 8 vol. 1 vol. 1 vol.
50% PEG 4000 10X TE buffer 10X LiAc
10x LiAc solution 1 M Lithium acetate Adjust to pH 7.5 with acetic acid and autoclave
2% PFA 1 ml 4 ml
PFA (Paraformaldehyde) PBS
Phosphate buffer saline (PBS) 140 mM 5.4 mM 9.7 mM 2 mM 800 ml
NaCl KCl Na2HPO4 x 2H2O KH2PO4 d2H2O adjust pH 7.4 with HCl, complete to 1 l vol. and autoclave
RIPA buffer 1X 1% 0.5% 0.1%
10XPBS Triton X-100 Sodium deoxycholate SDS
RNA sample buffer (325 µl) 75 µl 45 µl 180 µl 25 µl
Formaldehyde 37% 10X MOPS RNA running buffer Formamide Ethidium bromide (1 µg/µl)
RNase solution (TNT) 10 mM 0.5 M 0.1%
Tris/HCl pH 7.5 NaCl Tween® 20 in d2H2O

2 Material and Methods
18
Rödel Mix
1.85M 7.4% 20 mM 641 μl
NaOH β-mercaptoethanol 200mM PMSF d2H2O
10x MOPS RNA running buffer 0.2M 20 mM 10mM
MOPS, NaAC EDTA Add DEPC-H2O to complete 1 l vol., adjust to pH 7.0. Filter sterile and store at RT protected from light
SDS 10% 10% (w/v) Sodium dodecyl sulfate Aqua bidest. Autoclave
Sodium phosphate buffer 684 ml 316 ml
1 M Na2HPO4 1 M NaH2PO4 pH 7.2
Stripping solution for WB 62.5 mM 0.1 M 2%
Tris/HCl pH 6.8 β-mercaptoethanol SDS
5 x TBE 445 mM 445 mM 10 mM
Tris/HCl pH 8.0 Boric acid EDTA
TE buffer
10 mM 1 mM
Tris/HCl (stock 1M pH 8.0) EDTA Aqua bidest.
10x TE buffer 100 mM 10 mM
Tris/HCl (stock 1M pH 8.0) EDTA pH 8.0 or 7.5 (for Y2H experiments)
1x TBS 10 mM 150 mM
Tris/HCl pH 8.0 NaCl
1x TBST washing buffer 1X 0.1%
TBS Tween®20
Transfer buffer(1 l) 25 mM 1.44%(w/v) 20%
Tris Base Glycin Methanol Aqua bidest.
72% Trichloroacetic acid (TCA) 72 g 100 ml
Trichloroacetic acid (TCA) Aqua bidest

2 Material and Methods
19
10x Tris-Glycine electrophoresis buffer
250 mM 2.5 M 1%
Tris Glycine SDS
10x TE buffer 100 mM 10 mM
Tris, bring to pH 7.5 with HCl EDTA d2H20
1x TE /1x LiAc 0.2 ml 0.2 ml 1.6 ml
10X TE LiAc solution d2H2O
Tfb 1 30 mM 50 mM 100 mM 10 mM 15%
KAc MgCl2 KCl CaCl2 Glycerol adjust to pH 5.8 (with 0.2 M NaOH), filter sterilize, aliquot and store at -20°C
Tfb 2 10 mM 75 mM 10 mM 15%
MOPS CaCl2 KCl Glycerol adjust to pH 6.8 (with acetic acid), filter sterile, aliquot and store at -20°C
1x Thermal buffer (PCR) 20 mM 10 mM 10 mM 2 mM 0.1% (pH 8.8)
Tris-HCl (NH4)2SO4 KCl MgSO4 Triton X-100
Trypan blue solution
0.9% 0.5%
NaCl Trypan blue dye Aqua bidest.

2 Material and Methods
20
2.1.6 Culture media
2.1.6.1 Culture medium for bacteria
The components for the Luria Bertani (LB) medium were dissolved in d2H2O and
thereafter the medium was autoclaved LB medium 1% peptone 0.5% yeast extract 1% NaCl 1.5% agar (for LB agar plates only)
To select transformed cells, ampicillin or kanamycin was added to the medium to a final
concentration of 50 µg/ml or 25 µg/ml, respectively. LB-agar medium with antibiotics
was poured into Petri dishes and stored at 4˚C.
2.1.6.2 Culture medium for yeast
All yeast media and solutions were prepared and handled in sterile conditions.
YPD medium 20 g/l peptone 10 g/l yeast extract 20 g/l agar (for YPD agar plates only) 950 ml d2H2O, autoclave
The pH was adjusted to 6.5 (with NaOH) and the medium was autoclaved. When medium
cooled to approximately 55°C, 50 ml of 40% glucose stock solution was added to 950 ml
of medium. The YPD-agar medium was poured into Petri dishes and stored at 4°C.
To make minimal yeast medium lacking one or more specific nutrients, a combination of
minimal SD base and a dropout (DO) solution was used. For each selective SD/DO
medium, nutrients were added separately according to the desired selection. 10x stock
dropout solution was prepared lacking histidine, adenine, leucine, or tryptophan (-H/-A/-
L/-W). 10x DO -His, -Ade, -Leu, -Trp
200 mg
Arginine
300 mg Isoleucine 300 mg Lysine 200 mg Methionine 500 mg Phenylalanine 2000 mg Threonine 300 mg Tyrosine 200 mg Uracil 1500 mg Valine

2 Material and Methods
21
1000 ml d2H2O, autoclave SD -His, -Ade, -Leu, -Trp
6.7 g
yeast nitrogen base without amino acids
20 g agar (for SD plates only) 850 ml d2H2O 100 ml 10x dropout solution (-His, -Ade, -Leu, -Trp)
For SD –His, -Leu, -Trp 200 mg Adenine was added
For SD –Leu, -Trp 200 mg Adenine, and Histidine were added
The pH was adjusted to 5.8, and the medium was autoclaved. When the medium had
cooled to approximately 55°C, 50 ml of 40% glucose stock solution was added to 950 ml
of medium. For SD -His, -Ade, -Leu, -Trp plates supplemented with X-α-gal, 1:1000
volume of X-α-gal (20 mg/ml in DMF- dimethylformamide) was added to the medium.
SD-agar medium was poured into Petri dishes and subsequently stored at 4˚C.
2.1.6.3 Culture medium for cells
Cell culture media and solutions were handled in sterile conditions and were stored at
4°C. All cell lines used were cultivated in an incubator set at 37˚C with 95% relative air
humidity in the presence of 5% CO2. The cell culture media RPMI-1640 and DMEM
were supplemented with 20% and 10% FBS, respectively. 5 U/ml each of penicillin and
streptomycin were added.
2.1.7 Bacterial strain (Escherichia coli) Strain Usage XL1’ Blue host for plasmid amplification XL 10 host of choice for GST fusion protein expression and plasmid amplification DH5α host for plasmid amplification
2.1.8 Yeast strain
Yeast reporter strain was purchased from DB Biosciences Clontech, Heidelberg,
Germany
Strain Reporter Transformation markers AH 109 HIS3, ADE2, lacZ, MEL1 trp1, leu2

2 Material and Methods
22
2.1.9 Mammalian cell lines
All cell lines are available from the Cell Culture Collection of the Deutsche Sammlung
von Mikroorganismen und Zellkulturen GmbH (DSMZ).
2.1.9.1 Murine and rat cell lines
Name Cell type/ Origin NIH3T3 swiss mouse embryo fibroblast TGR rat fibroblast BA/F3 mouse pro B-cells, IL-3 dependent line established from peripheral blood
2.1.9.2 Human cell lines
Normal cell lines Name Cell type/ Origin 293T human embryonal kidney LCL 3.1* B-cell EBV mortalized *courtesy of Dr. Martin Dreyling, CCG-Leukemia, Grosshadern, Munich Tumor cell lines Name Cell type/ Origin HeLa human cervix carcinoma U2OS human osteogenic sarcoma, p53 wild type SaOS human osteogenic sarcoma, p53 null B-cell leukemia and B-cell lymphoma cell lines Name Cell type/ Origin DG-75 Cell line established from the pleural effusion of a 10-year-old boy with Burkitt lymphoma in
1975 Granta 519* Cell line established from the peripheral blood from a 58-year-old Caucasian woman with
previous history of cervical carcinoma at relapse of a high-grade B-NHL (leukemic transformation of mantle cell lymphoma, stage IV)
HBL-2* human mature B-cell line derived from B-NHL (diffuse large cell), carries the t(11;14)(q13;q32) which juxtaposes the IGH promoter to the BCL1 gene
JeKo-1* human B-cell lymphoma established from the peripheral blood of a 78-year-old woman with B-cell non-Hodgkin’s lymphoma (B-NHL), specifically mantle cell lymphoma
Karpas 422* human B-cell lymphoma established from the pleural effusion of a 73-year-old woman with B-NHL
NCEB-1* human mature B-cell line derived from B-NHL (diffuse centroblastic-centrocytic), carries the t(11;14)(q13;q32) which juxtaposes the IGH promoter to the BCL1 gene
Rec* Human B-cell lymphoma, established from the lymph node or peripheral blood from a 61-year-old man with B-cell Non-Hodgkin lymphoma.
* courtesy of Dr. Martin Dreyling, CCG-Leukemia, Grosshadern, Munich

2 Material and Methods
23
T-cell leukemia Name Cell type/ Origin Jurkat* human T cell leukemia, immature T cell line established from the peripheral blood of a 14-year-
old boy with ALL HUT78 human mature T-cell line derived from the peripheral blood of a 50-year-old male patient with
Sézary syndrome (cutaneous T-cell lymphoma). MOLT-4 human immature T cell line established from the peripheral blood of a 19-year-old man with ALL * courtesy of Dr. Martin Dreyling, CCG-Leukemia, Grosshadern, Munich Myeloid leukemia cell lines Name Cell type/ Origin HL-60* human acute myeloid leukemia established from the peripheral blood of a 35-year-old woman
with AML (FAB M2). Cells can carry amplified c-myc gene and lack wild type p53 KASUMI-1 ♣
human acute myeloid leukemia. Cell line established from the peripheral blood of a 7-year-old Japanese boy with AML (FAB M2). Cells carry the t(8;21) ETO-AML1 fusion gene
K-562 ♣ Human chronic myeloid leukemia in blast crisis, established from the pleural effusion of a 53-year old woman with chronic myeloid leukemia (CML) Expresses BCR-ABL fusion gene
MOLM-13 ♣ Human acute myeloid leukemia, established from the peripheral blood of a 20-year-old man with AML (FAB M5a)
U937 human histiocytic lymphoma. Cells express markers and properties of monocytes and carry the t(10;11) resulting in the CALM-AF10 fusion gene
* courtesy of Dr. Martin Dreyling, CCG-Leukemia, Grosshadern, Munich ♣courtesy of Dr. Tobias Kohl, CCG-Leukemia, Grosshadern, Munich
2.1.10 Plasmids pACT2 Shuttle vector for expression of GAL4-AD (amino acids 768-881) fusion
proteins in yeast, DB Biosciences Clontech, Heidelberg, Germany pcDNA6/V5 Contains V5 epitope, Invitrogen, Karlsruhe, Germany pGEM®-T Cloning vector with 3’-T overhangs at insertion site for direct cloning of PCR
products, Promega, Madison, USA pGEM®-T Easy Cloning vector with 3’-T overhangs at insertion site for direct cloning of PCR
products, Promega, Madison, USA pGBKT7 Shuttle vector for expression of GAL4-DBD (amino acids 1-147) fusion
proteins in yeast, DB Biosciences Clontech, Heidelberg, Germany pGADGH; pGADT7 Shuttle vector for expression of GAL4-AD (amino acids 768-881) fusion
proteins in yeast, DB Biosciences Clontech, Heidelberg, Germany pEYFP-C1 Mammalian expression vector for yellow (YFP) fluorescent fusion proteins,
DB Biosciences Clontech, Heidelberg, Germany pGEX-4T1 Expression of GST fusion proteins in bacterial cells. Vector contains a tac
promoter for protein expression after IPTG induction, Amersham Pharmacia Biotech
pM1 Mammalian expression vector for GAL4-DBD (1-147) fusion proteins, DB Biosciences Clontech, Heidelberg, Germany
pGAL4-LUC Reporter plasmid encoding the luciferase gene under the transcriptional control of 5 GAL4-binding sites and the min SV40 promoter
pGAL45tkLUC Reporter plasmid encoding the luciferase gene under the transcriptional control of the Herpes simplex virus thymidine kinase promoter and 5 GAL4-binding sites, (Netzer C. et al., 2001)
pRL-null Co-reporter vector encoding the Renilla luciferase protein, Promega, Madison, USA

2 Material and Methods
24
2.1.11 Constructs pcDNA3-FLAG-FHL2 (aa 1-279)
Dr. Paul Riley, Molecular Medicine Unit Institute of Child Health, London, UK
pCMX-GAL4DBD-Flirt1 (aa 1-279)
Dr. Judith Müller, Universität-Frauenklinik, Freiburg, Germany
pGBKT7-CALMΔ10 (aa 1-408) Britta Kaltwasser, CCG Leukemia, GSF, Munich, Germany pGBKT7-LIM ½ (aa 1-75) Zlatana Pasalic, CCG Leukemia,GSF, Munich, Germany pGBKT7-LIM ½-1 (aa 1-143) Zlatana Pasalic, CCG Leukemia,GSF, Munich, Germany pGBKT7-LIM ½-2 (aa 1-202) Zlatana Pasalic, CCG Leukemia,GSF, Munich, Germany pGBKT7-LIM ½-3 (aa 1-262) Zlatana Pasalic, CCG Leukemia,GSF, Munich, Germany pGEX-4T-1-FHL2 (aa 1-279) Dr. Judith Müller, Universität-Frauenklinik, Freiburg, Germany
GAL4-CALMΔ3 (aa 1-652) Sigrun Bartels, Institute für Humangenetik, Göttingen, Germany pAS2-CALMΔ1 (aa 1-294) Sigrun Bartels, Institute für Humangenetik, Göttingen, Germany pAS2-CALMΔ4 (aa 1-335) Sigrun Bartels, Institute für Humangenetik, Göttingen, Germany pAS2-CALMΔ7 (aa 1-221) Sigrun Bartels, Institute für Humangenetik, Göttingen, Germany pAS2-CALMΔ8 (aa 1-105) Sigrun Bartels, Institute für Humangenetik, Göttingen, Germany pEYFP-FHL2 (aa 1-279) Zlatana Pasalic, CCG Leukemia,GSF, Munich, Germany YFP-CALM/AF10 Dr. Alexandre Krause, CCG Leukemia, GSF, Munich, Germany
2.1.12 Oligonucleotides
All nucleotides were synthesized by Metabion GmbH, Martinsried, Munich, and supplied
at a concentration of 100 pmol/µl.
FHL2 specific primers Oligonucleotide Sequence Position at
FHL2 sequence*
Tm °C
DRAL66T 5’-GCTGAGAACTGTGTCTTCCTGGAG-3’ 66 61 DRAL450B 5’-GCATTCCTGGCACTTGGATGAG-3’ 450 61 FHL2-T-143-BamHI 5’-CATTGGATCCACCATGACTGAGCG
CTTTGA C-3’ 143 60
FHL2-B-961EcoRI 5’-TGTGTTGAATTCGATGTCTTTCCC ACAGTC-3’
961 60
FHL2T-XhoI 5’-CCTCTCGAGAAATGACTGAGCGCTTTG-3’ 140 57 FHL2B-EcoRI 5’-GTGTTGAATTCAGATGTCTTTCCC-3’ 980 57 FHL2-T94 5’-ATTACCATGGATGGCTGGCATTTT
GACTTTGGG-3’ 94 63
FHL2-LIM1/2 5’-CGGGATCCCTGACGAACAGGGTCT CAAAGCACAC-3’
226 63
FHL2-LIM1/2-1 5’-CGGGATCCCGCATTCCTGGCACTT GGATGAG-3’
429 63
FHL2-LIM1/2-2 5’-CGGGATCCCTGACGCACTGCATGG CATGTTG-3’
607 63
FHL2-LIM1/2-3 5’-CGGGATCCCTGACCCAGCACACTT CTTGGCATAC-3’
786 63
*GenBank acc. Nr L42176 (HUMDRAL)

2 Material and Methods
25
Vector primers Oligonucleotide Sequence Position Tm °C GAPDHforward 5’-GCACCACCAACTGCTTAGCACC-3’ Exon 7
(530-551) 60
GAPDHreverse 5’-GTCTGAGTGTGGCAGGGACTC-3’ Exon 9 (1166-1146)
60
NG2T7/T1096 5’-TGGCAAGCACTGGTCTAT-3; 1073-1091 Y2H2 5’-TCATCGGAAGAGAGTAG-3’ (1155-1171 pGBKT7) 55 Y2H3’AD 5’-AGATGGTGCACGATGCACAG
-3’ (2102-2083 pGADT7) 55
pGEX5’ 5’-GGGCTGGCAAGCCACGTTT GGTG-3’
(869-891) 55
pEGFPC-1240-1258 5’-AAAGACCCCAACGAGAAGC-3’ (1240-1258) 55 *GenBank acc. Nr.: U55763 (pEGFP-C1), U13854 (pGEX-4T2), NM_002046 (human GAPDH)
2.1.13 Antibodies Name Company dilution Alexa Fluor® 555 goat anti-mouse Invitrogen 1:500 Anti-β-Actin clone AC-15 Sigma® 1:2000 Anti-FLAG Sigma® 1:6000 Anti-FHL2 (F4B2-B11) Cell Sciences , Inc 1:250 Anti-GFP rabbit IgG fraction Molecular Probes, Inc. 1:6000 Anti-V5 Invitrogen 1:6000 CALM (S-19) Santa Cruz Biotechnology, Inc. 1:1000 CALM (G-17) Santa Cruz Biotechnology, Inc. 1:1000 CALM (C-18) Santa Cruz Biotechnology, Inc. 1:1000 GAL4 (DBD) (RK5C1) Santa Cruz Biotechnology, Inc. 1:1000 Donkey anti-rabbit IgG-HRP conjugated Santa Cruz Biotechnology, Inc. 1:2000 Donkey anti-goat IgG-HRP conjugated Santa Cruz Biotechnology, Inc. 1:2000 goat anti-mouse IgG-HRP conjugated Chemicon International 1:1000-3000 Goat anti-mouse IgG + IgM-Cy™3 conjugated
Jackson ImmunoResearch Laboratories, Inc. 1:500

2 Material and Methods
26
2.2 Methods
The molecular biology methods in this work were performed according to the “Molecular
Cloning” (Sambrook and Russell, 2001) with minor or no modifications. All buffers used
in this work are described in chapter 2.1.5 with exception for some Qiagen and Promega
buffers.
2.2.1 Isolation of DNA
Plasmids were prepared from E.coli XL-1’ blue, DH5α and XL10 bacterial cultures
grown in the presence of selective antibiotics. All Mini, Midi, Maxi and Mega
preparations are procedures that isolate plasmid DNA from bacteria, using the alkaline
method followed by isopropanol precipitation.
2.2.1.1 Mini preparation (Mini Prep)
Miniprep were performed during the cloning procedure to isolate small amounts of DNA
from a large number of clones. Each single colony was inoculated in 4 ml of LB medium
(plus 100 μg/ml Amp or 50 μg/ml Kan) and grown O/N at 37°C with vigorous shaking
(260 rpm). 1.5 ml of the overnight culture was transferred to Eppendorf tubes and
bacterial cells were harvested by centrifugation at 14000 rpm for 2 min. The pellet was
resuspended in 300 μl of cold buffer P1 containing RNase (0.1 mg/ml). 300 μl of buffer
P2 was added, mixed gently, and the mixture was incubated at RT for 5 min. The lysed
pellet was neutralized by gently mixing with 300 μl of Buffer P3, which was immediately
thereafter centrifuged at 14’000 rpm for 15 min. 800 μl of the supernatant was transferred
to a new sterile Eppendorf tube and 0.7 volume of isopropanol was added. The precipitate
was vortexed and incubated at -20°C for 10-20 min and then centrifuged at 14’000 rpm
for 20 min. The pellet was washed with 500 μl of 70% ethanol and centrifuged 10 min at
14’000 rpm. Then the pellet was dried for 10-20 min and redissolved in 20 μl of sterile
water. The DNA was stored at -20°C.
2 Material and Methods
27
2.2.1.2 Midi preparation (Midiprep)
To isolate larger amount of plasmid DNA for cloning, Midi preparation was done. A
bacterial colony or 20 μl of a glycerol stock was inoculated in 25 ml of LB medium
containing appropriate selective antibiotics and grown overnight at 37°C with vigorous
shaking (270 rpm). Cells were harvested by centrifugation at 6000 x g for 15 min at 4°C.
4 ml of buffer P1 was used to resuspend the pellet. For cell lysis 4 ml of Buffer P2 was
added and mixed by inversion, and the mixture was incubated at RT for 5 min. 4 ml of
pre-chilled Buffer P3 was added, mixed and incubated on ice for 15 min. After incubation
the mixture was centrifuged at ≥20'000 x g for 30 min at 4°C. The supernatant was
transferred to fresh 50 ml Falcon tube and once more centrifuged at ≥20'000 x g for 15
min at 4°C. During centrifugation the Qiagen tip 100 was equilibrated with 4 ml of
Buffer QBT. The supernatant was then applied to the column, whereafter the flow-
through was discarded and the column-bound DNA was washed twice with Buffer QC.
The DNA was eluted with 5 ml of Buffer QF and precipitated with 0.7 volumes RT
isopropanol (in order to minimize the salt precipitation). The mixture was mixed and
centrifuged at ≥15'000 x g for 30 min at 4°C. The supernatant was carefully discarded
and the pellet was washed with 2 ml of RT 70% ethanol by centrifugation at ≥15'000 x g
for 10 min at 4°C. Ethanol removes the precipitated salt and replaces isopropanol with
the more volatile ethanol. The pellet was air dried for 5-10 min and redissolved in 100 μl
or appropriate volume of 1x TE buffer or sterile d2H2O. To ensure that the DNA plasmid
obtained was correct a digestion with appropriate restriction enzymes was performed.
2.2.1.3 MaxiEndofree preparation (Maxi Prep)
For transfection experiments the DNA was prepared using Qiagen Maxi Endofree kit. A
bacterial colony or 20 μl of a glycerol stock were inoculated in 100 ml of LB medium in
the presence of ampicillin (50 μg/ml) or kanamycin (25 μg/ml), and grown overnight at
37°C with vigorous shaking (230 rpm). The cells were harvested by centrifugation at
6000 x g for 15 min at 4°C. 10 ml of buffer P1 was used to resuspend the pellet. For cell
lysis 10 ml of Buffer P2 was added and mixed by inversion, and the mixture was
incubated at RT for 5 min. The solution was neutralized by adding 10 ml of ice-cold

2 Material and Methods
28
buffer P3 and gently inversion. The suspension was applied into the Qiafilter Cartridge
and incubated at RT for 10 min. Thereafter the suspension was filtered through the
Qiafilter Cartridge. 2.5 ml of ER buffer was added to the lysate and the solution was
incubated at ice for 30 min. During the incubation a Qiagen column was equilibrated with
10 ml Buffer QBT. The supernatant from the cell lysate was subsequently poured into the
column to bind the DNA to the column. The DNA was eluted with 15 ml of Buffer QN
and precipitated with 0.7 volumes of isopropanol by centrifuging ≥ 15’000 x g for 30 min
at 4°C. To neutralize the isopropanol the DNA pellet was washed with 15 ml of 70%
ethanol by centrifuging ≥ 15’000 x g for 15 min at 4°C. The supernatant was discarded
and the pellet was dried for 10-20 min and dissolved in 200-500 μl, depending of the size
of the pellet, of endotoxin Free buffer (EB). After determining the concentration the
DNA was stored at -20°C. To ensure that the DNA plasmid obtained is correct a
restriction enzyme digestion analyses is done.
2.2.1.4 Mega Preparation (Mega Prep)
After amplifying the yeast two hybrid thymus cDNA library as single colonies on 150
mm LB plates a plasmid mega preparation was performed. The colonies from the plates
(50 plates) were scraped into 500 ml LB medium with selective antibiotics, and grown at
37˚C O/N with vigorous shaking (300 rpm). The overnight culture was harvested by
centrifuging at 6000 x g for 15 min at 4˚C. The pellet was resuspended in 50 ml buffer
E1. For cell lysis 50 ml E2 was added and mixed until a homogenous lysate was
obtained. Neutralization of lysis was performed by mixing 50 ml E3. The mixture was
centrifuged for 20 min at 12’000 x g at RT, meanwhile the MEGA Cartridge was
equilibrated with 100 ml buffer E4. The suspension was filtered through the MEGA-
cartridge and the DNA absorbed to the column. DNA was eluted with 50 ml of elution
Buffer E6 and precipitated with 0.7 volumes of isopropanol by centrifuging ≥ 13’000 x g
for at least 30 min at 4°C. The precipitated DNA was washed with 10 ml of 70-80%
ethanol by centrifugation for 5 min at 13’000 x g at 4°C. Pellet was air dried for 10 min
at RT and then redissolved in appropriate volume of 1xTE. The DNA was stored at -20°.

2 Material and Methods
29
2.2.2 Determination of nucleic acid concentration
To determine the quality and yield, the DNA was measured with an UV
spectrophotometer (BioPhotometer 6131, Eppendorf) at a wavelength of 260 and 280 nm.
The dilution used for measurements was 1:100. DNA preparations with a concentration
of less than 0.2 μg/ml and a ratio below 1.5 were discarded. The DNA concentration is
calculated by the spectrophotometric conversion in which 1A260 unit corresponds to 50
μg/ml of double-stranded DNA or 40 μg/ml of RNA (Sambrook, 1989).
2.2.3 Digestion of DNA
Type II restriction endonucleases are essential for specific digestion of DNA. These
enzymes recognize, bind and cleave short defined mostly palindromic base sequences in
the DNA. Different buffers are used for different enzymes, but for multiple enzyme
digestion the Five Buffer Plus System such as Y+/Tango™ (MBI Fermentas), was
required. The digest with a single restriction enzyme was performed in an Eppendorf tube
as follows: 1 μg DNA 5U restriction enzyme 1-2X appropriate restriction enzyme buffer x μl, up to 20 μl, of sterile water
The reaction was incubated from 2-3 h to O/N at 37°C (or at the recommended
temperature) depending on enzymes used.
2.2.4 Ethanol precipitation of DNA
Ethanol precipitation was used to purify DNA from buffers in previous reactions (e.g.
digestion and sequencing). 1 volume of DNA sample was mixed with 2.5 volumes of
100% - ethanol and 1:10 volumes of 3M NaAc (pH 5.2). The mixture was incubated at -
20°C for 10 min and centrifuged at 14 000 rpm in a table top centrifuge for 30 min at
4˚C. The supernatant was discarded and the pellet was washed with 500 μl of 70%
ethanol by centrifuging at top speed for 10 min at 4°C. The pellet was dried at RT or for
10 min at 56˚C in a thermo block. The pellet was resuspended in 20μl 1x TE or sterile
d2H2O. The purified DNA was stored at -20˚C.

2 Material and Methods
30
2.2.5 Ligation
Both the vector and the insert (the restriction fragment) were restricted in such a way that
they contained compatible ends. A 1:4 (vector: insert) ratio was used and mixed in a 1.5
ml eppendorf tube as described below: X ng restricted vector DNA (2.2.3) and X ng insert purified (2.2.4) 4 μl 5X T4 DNA ligase buffer 1 μl T4 DNA ligase (5 U/μl) to 20μl d2H2O
The ligation reaction was incubated O/N at 4 ˚C.
2.2.6 DNA transformation into bacterial cell
For bacterial transformation two different protocols were used, the heat shock and the
electroporation transformation. For chemical transformation the XL10 cells were used
while the electrocompetent Epicurian coli XL1-blue cells were used for the
electroporation. The buffers used are described in 2.1.5.
2.2.6.1 Preparation of chemically competent cells
An aliquot (200 μl) of frozen cells (E. coli strain XL10) was inoculated into 10 ml LB
medium and incubated O/N with vigorous shaking at 37°C. The O/N culture was diluted
in 300 ml LB medium and incubated for an additional 2-3 hrs until the culture reached an
OD600 of 0.5-0.7. The bacterial culture was cooled on ice and cells were harvested by
centrifugation at 4000 rpm at 4°C. The cell pellet was resuspended in 100 ml Tfb1 and
incubated on ice for 10-15 min. The suspension was centrifuged at 4 000 rpm at 4°C for
10 min, whereafter the supernatant was discarded and the cells were resuspended in 4 ml
of Tfb2. The competent cells were aliquoted (200 μl), frozen in liquid nitrogen and stored
at -80°C.
2.2.6.2 Transformation
100 μl of the chemically competent cells were mixed with 1 to 5 µl of 50-100 ng/μl
plasmid DNA or 5μl ligation reaction (2.2.5). The reaction was first incubated on ice for
30 min then heat shocked for 50 sec at 42°C and then again cooled on ice for one more
minute. 900 μl LB medium was added to the reaction, which was incubated for 1h

2 Material and Methods
31
shaking at 37°C. After incubation, cells were streaked on LB agar plate with appropriate
selective antibiotics. The plates were then incubated O/N at 37°C.
2.2.6.3 Preparation of XL1-Blue electrocompetent cells
An aliquot (50μl) of frozen cells (E. coli strain XL1-blue MRF’) was inoculated into 10
ml LB medium and incubated O/N with vigorous shaking at 37°C. The overnight culture
was diluted in 400 ml LB medium and incubated for 2-3 hrs until the culture reached an
OD600 of 0.5-0.6, and was then cooled on ice. The cells were harvested by centrifugation
and the pellet was washed twice with 40 ml ice cold sterile d2H2O, twice with 20 ml ice
cold 10% glycerol (in d2H2O) and then resuspended in 800 μl 10% glycerol. The
electrocompetent cells were aliquoted in 50 μl and stored at -80°C. The centrifugation
steps were all carried out at 4 500 rpm for 5 min at 4°C.
2.2.6.4 Electroporation
Electrocompetent cells (50 μl aliquot) (2.2.6.3) were mixed with 1 μl plasmid DNA (50-
100 ng) or 1 μl ligation reaction (2.2.5). They were thereafter incubated for 1 min on ice
and transferred to a pre-cooled electroporation cuvette. The cuvette was placed in an
electroporator and cells were electroporated at 2.5 kV in 3-4 msec pulse (Easyject-
Equibio, 6.125 kV/cm maximum field strength). 1 ml of pre-warmed LB medium (37°C)
was immediately added to the cells and the suspension was transferred to a fresh
Eppendorf tube. The cells were incubated for 1 h vigorously shaking at 37°C, then plated
on LB agar plates containing selective antibiotics, and incubated O/N at 37°C.
2.2.7 Agarose-gel electrophoresis for DNA
To separate DNA fragments both for analysis and isolation, non denaturing agarose gel
electrophoresis was used. According to the size of the linear DNA fragments to be
separated, gels of different concentration were used.
Agarose (%) Range of separation of linear DNA 0.5 700 bp to 25 kbp 0.8 500 bp to 15 kbp 1.0 250 bp to 12 kbp 1.2 150 bp to 6 kbp

2 Material and Methods
32
Agarose was mixed and boiled in 50 ml 0.5x TBE. 3 μl Ethidium bromide was added to
the solution and the gel was poured into a gel chamber. The DNA samples were mixed
with 1x Blue Juice loading buffer (2.1.5) and then loaded in the wells. The negatively
charged nucleic acids were run under electric current (60-110 V) moving from the
negative to the positive pole.
2.2.8 Isolation of DNA fragments
After the gel electrophoresis the DNA fragments were cut out of the gel under the UV
light (312 nm) and transferred to an Eppendorf tube. The Qiagen Gel Extraction Kit
(using microcentrifuge) was used to extract the DNA from the agarose gels. For each 100
mg gel slice 300 μl buffer QG was added and the reaction was incubated at 50°C for 10
min. Every 2-3 min the tubes were vortexed. When the gel slice had dissolved
completely, 1 gel volume of the isopropanol was added and mixed. To bind the DNA,
800 μl of the reaction was applied to a QIAquick column and centrifuged for one minute.
Flow-through was discarded and the column was soaked with 750 μl wash Buffer PE for
3 min and thereafter the bound DNA was washed by centrifugation for one minute. The
flow-through was discarded and the QIAquick column was centrifuged for additional one
minute to remove the residual ethanol from the buffer. The QIAquick column was
transferred to a fresh sterile microcentrifuge tube and the DNA was eluted with 30 μl
elution buffer EB or sterile d2H2O by centrifugation for one minute. The DNA was stored
in -20°C. The purified DNA fragments were used for reactions such as ligations (2.2.5).
2.2.9 RNA extraction
2.2.9.1 RNeasy® Mini Kit
Total RNA was prepared from cultured cell lines (2.2.13) with the RNeasy® Mini Kit
(Qiagen). For RNA extraction, approximately 5.5 x 10⁶ cells were lysed by the addition
of 600 μl RLT buffer. For homogenization, samples were applied to a QIAshredder spin
column placed in a 2 ml collection tube and centrifuged for 2 min at 14’000 rpm at 20-
25˚C. 1 volume (600 μl) of 70% ethanol was added to the homogenized lysate and mixed
thoroughly by pipetting. 700 μl of the lysate was applied to a RNeasy mini column placed
in a 2 ml collection tube and centrifuged for 15 sec at 8 000 x g. The flow-through was

2 Material and Methods
33
discarded and the RNA bound to the column was washed once with 700 μl RW1 buffer
(15 sec at 8 000 x g) and twice with 500 μl RPE buffer (2 min at 8 000 x g). The flow-
through was discarded after each washing step. RNeasy column was placed in a fresh 1.5
ml tube. To elute the RNA that was bound to the column 50 μl RNase-free H2O was
applied to the column and incubated for 1 min at RT. The RNA was collected By
centrifuging for one minute at 8000 x g. The RNA concentration was measured as
described in (2.2.2), and the quality was determined by loading 2 μl of the prepared RNA
on a 1% agarose gel (2.2.10). The RNA was stored at -80°C.
2.2.9.2 Trizol RNA extraction
For total RNA extraction approximately 5.5 x 10⁶ cells were harvested by centrifugation
at 1000 x g for 5 min at 4˚C. The cells were lysed in 1 ml TRIzol Reagent by repetitive
pipetting and then incubated at RT for 5 min. 0.2 ml chloroform per sample was added
and shaked vigorously by hand for approximately 15 sec and then incubated at RT for 2-3
min. The phase separation was performed by centrifugation at 12’000 x g for 15 min at
4˚C. The mixture separated in lower red, phenol-chloroform phase, an interphase and a
colorless upper aqueous phase, which contains the RNA. The aqueous phase was
transferred to a fresh RNAse free tube and 0.5 ml of isopropanol was added. The samples
were incubated for 10 min at RT and centrifuged at 12 000 x g for 10 min at 4˚C and
RNA precipitate formed a gel like pellet. The supernatant was discarded and 1 ml of 75%
ethanol was added to the RNA pellet, vortexed and centrifuged at 7’500 x g for 5 min at
4˚C. RNA pellet was air dried for 10 min at RT or 1 min at 58°C and dissolved in an
appropriate volume, 50-75 μl, of DEPC-H2O. The samples were incubated at 58°C for 10
min. RNA aliquots were stored in -80°C.
2.2.10 Agarose-gel electrophoresis for RNA
To analyze the quality of the RNA, a denaturing 1%- agarose gel was prepared by boiling
1g of Agarose in 74 ml DEPC-H2O and 10 ml 10x MOPS RNA running buffer. When the
gel was cooled down 16.6 ml of 37% formaldehyde was added. Gel solution was poured
into an RNase free gel chamber and the RNA samples were prepared on ice to avoid
degradation. 1 μl of the RNA sample was mixed with 5μl DEPC-H2O, 5 μl 1.5x RNA

2 Material and Methods
34
sample buffer and 1 μl EtBr (1 μg/ μl). The RNA samples were then incubated at 65°C
for 10 min and then cooled on ice for one minute. 3 μl of RNA loading buffer was added
to the mixture and the samples were run on the gel. The electrophoresis was carried out in
1x MOPS running buffer (diluted in DEPC- H2O) at RT for 1,5 hr at 60V.
2.2.11 cDNA synthesis – reverse transcriptase reaction
cDNA is DNA synthesized in vitro on a RNA template by the reverse transcriptase
enzyme. The most important advantage of cDNA is that it is more stable than mRNA and
can be used as template in PCR reactions. A complementary DNA strand -cDNA, of
mRNA is synthesized with the extension of oligo(dT) primers by the reverse transcriptase
enzyme. cDNA is used as a template for subsequent PCR reactions as described in 2.2.12.
To avoid genomic DNA contamination the RNA (2.2.9) was pretreated with DNAse I as
follows: 1 μg of RNA was mixed with 1 μl 10x DNase I reaction buffer, 1 μl DNase I (1
U/μl) and DEPC- H2O to a final volume of 10 μl and then the mixture was incubated for
15 min at RT. The reaction was inactivated by adding 1 μl of 25 mM EDTA and heating
it at 65ºC for 10 min. For the cDNA synthesis 2 μg DNAse-free RNA was mixed with 5
μl dNTP mix (2 mM), 1 μl oligo(dT) primer (500 μg/ml) and DEPC- H2O to a final
volume of 12 μl. The mixture was denatured at 65ºC for 5 min and then chilled on ice for
1 min. The contents of the tube was collected by brief (5-10 sec) centrifugation and 4 μl
of 5x First-Strand Buffer, 2 μl of 0.1M DTT and 1 μl RNaseOut recombinant
ribonuclease inhibitor (40 U/μl) were added to the reaction. The mixture was gently
mixed and incubated at 42ºC for 2 min. 1 μl of SuperScript II enzyme was added to the
reaction and the mixture was incubated at 42°C for 50 min. The RT enzymes was
nactivated incubating the reaction at 70ºC for 15 min. For the PCR reactions (2.2.11) 1 μl
of the synthesized cDNA (20 μl total vol.) was used.
2.2.12 Polymerase chain reaction- PCR
The PCR technique is employed to amplify specific regions of DNA in vitro. This is
achieved by using two primers (synthetic DNA oligonucleotides) flanking the sequence
to be amplified. The principle of the PCR is that the reaction needs a brief heat treatment
to separate the two strands of the DNA double helix. Subsequent cooling of the reaction

2 Material and Methods
35
and an excess of the two primers DNA oligonucleotides allows the primers to hybridize
to the target sequence. The annealed mixture is then incubated with DNA polymerase and
dNTPs so that the region downstream of the primers is synthesized. When the procedure
is repeated the newly synthesized fragments serve as template, and already after few
cycles there is an excess of the desired DNA fragment because it is amplified in an
exponential fashion. As the template 1 μl cDNA (2.2.11), or 0.5 ng plasmid DNA was
used. The PCR reaction was performed by mixing template, 2 μl 10x PCR Buffer, 1.5-
5mM total concentration of MgCl2 depending on the primer pairs, 2 μl dNTP (2 mM), 0.2
μM- 0.5 μM forward primer (tot. conc.), 0.2 μM- 0.5 μM reverse primer (tot. conc.), 0.16
μl Taq polymerase (5 U/μl) and d2H2O to a final volume of 20 μl. Sometimes reactions
were scaled up to a volume of 50 μl.
Reaction was run in a thermocycler as follows:
95°C : 2 min (denaturation) 94°C : 30- 45 sec (denaturation), 56°C-62°C: 30 sec to 1 min (annealing), 72°C : 40-45 sec (extension) (25-35 cycles) 72°C : 5 min (final extension)
Depending on the primer pair, the annealing temperature varied. The extension time
varied according to the expected size of the PCR product. As a general rule of thumb 1
min per kb was used.
2.2.12.1 DNA Sequencing
DNA Sequencing was performed to identify a clone or to examine the fidelity of plasmid
DNA after a cloning step. The sequencing reactions were performed according to the
Sanger chain-termination method. Cycle-sequencing, like ordinary PCR, consists of
cycles of denaturation, annealing and extension in presence of polymerase and dNTP’s,
with the exception that by sequencing additional dye labeled ddNTP’s are also added.
Reaction was prepared as follows: 4 μl BigDye terminator 1 μl primer (1 μM tot.conc) 1 μg DNA was used of plasmid DNA, 4 μl d2H2O To 10 μl total volume of per reaction.

2 Material and Methods
36
Reaction was run in a thermocycler as follows:
96°C: 2 min (denaturation), 96°C: 30 sec (denaturation), 50°C: 15 sec (annealing), 60°C: 4 min (extension) (25 cycles)
After cycling had been completed, 10 μl d2H2O was added to the reaction followed by
ethanol precipitation (2.2.4). The precipitated DNA was diluted in 20 μl sterile d2H2O
whereafter 10μl was used to run the samples into the Genetic Analyzer automated
sequencer ABI PRISM 310 (PE Applied Biosystems).
2.2.13 Cloning of constructs
For mapping the CALM interaction domain of FHL2 in the yeast two hybrid system,
various portions of the FHL2 cDNA were inserted into the pGBKT7 vector to produce a
series of GAL4 DBD-FHL2 deletion mutants. The appropriate portions of the FHL2
cDNA were amplified with the primers FHL2-T, FHL2-LIM1/2, FHL2-LIM1/2-1, FHL2-
LIM1/2-2 and FHL2-LIM1/2-3 (2.1.12) and inserted into the NcoI and BamHI restriction
sites of the pGBKT7 vector (fig 3.4 A).
For immunofluoroscence, the pEYFP-FHL2 construct was cloned. The full length FHL2
DNA fragment was generated by PCR amplification using pACT2-FHL2 with primers
containing sites for the restriction enzymes XhoI and EcoRI (FHL2T-XhoI and FHL2B-
EcoRI). The 840 bp PCR product corresponding to FHL2 isoform 2 was digested with
these restriction enzymes and cloned in frame with the green fluorescent proteins into the
pEYFP-C1 vector (2.1.10).
For immunoprecipitation, the pcDNA6/V5-FHL2 construct was cloned. The full length
FHL2 DNA fragment was generated by PCR amplification using pACT2-FHL2 with
primers containing sites for the restriction enzymes BamHI and EcoRI (FHL2-T-143-
BamHI and FHL2-B-961EcoRI. The 818 bp PCR product corresponding to FHL2
isoform 2 was digested with these restriction enzymes and cloned in frame with the V5
proteins into the pcDNA6/V5 vector (2.1.10).

2 Material and Methods
37
2.2.14 Culture of mammalian cells
Adherent cells were grown in DMEM supplemented with 10% heat inactivated FBS and
1% penicillin/streptomycin. Suspension cells were grown in RPMI medium
supplemented with 20% heat inactivated FBS. Cells were cultured in a humidified
incubator with 5% carbon dioxide at 37°C. Splitting of confluent cultures of adherent
cells was done every 2-4 days in a 1:4- 1:6 ratios. The cells were first washed with DPBS
and then trypsinized with Trypsin/EDTA for approximately 5 min at 37°C. Fresh medium
was added to the trypsinized cells, whereafter the cells were replated in new Petri dishes.
Suspension cells were split by aliquoting part of the growing culture in a new flask and
then adding fresh medium to these cells. For long-term storage, the cells were harvested
by centrifuging for 5 min at 1 000 rpm at 4°C. The pellet was then washed with DPBS
and resuspended in 90% FBS and 10% DMSO. The cells were aliquoted in Cryotube™
vials and were put in pre cooled ice box that was then placed in a -80°C freezer.
2.2.15 Transient transfection of adherent cells
For protein co-localization and protein expression, transient transfections were
performed, using Roti®-Fect and polyethylenimine (PEI) transfection reagents. For co
localization, one day before transfection, approximately 4x10⁵, cells were seeded and
grown in 6-well plates, with 18x24 mm cover slips placed in the wells. 2 ml of growth
medium was added and the cells were incubated O/N (or until the cells were 30-40%
confluent).
For reporter gene assay, 5x10⁴, HEK 293T cells were seeded the day before transfection
and grown in 24 well plates with 0.5 ml of growth medium containing serum. The cells
were incubated O/N. The transfection was performed on the next day. To examine the
functional role of the CALM on GAL4 DBD-FHL2 the total amount of 1020 ng DNA
was transfected into, 5x10⁴cells; 400 ng of plasmid encoding GAL4 SV40 minimal
promoter, 20 ng of p-RL co reporter vector (Promega), 200 ng GAL4 DBD-FHL2 and
100, 200 respectively 400 ng YFP-CALM.
To investigate the role of CALM/AF10 on GAL4 DBD-FHL2, the total amount of 1020
ng DNA was transfected; 400 ng of plasmid encoding SV40 minimal promoter, 20 ng of

2 Material and Methods
38
p-RL co reporter vector (Promega), 200 ng GAL4 DBD-FHL2 plasmid and 100, 200 or
400 ng YFP-CALM/AF10 plasmid.
To study the role of FHL2 on GAL4 DBD-CALM/AF10, cells were co transfected with
100 ng plasmid encoding GAL4 SV40 minimal promoter, 10 ng of p-RL co reporter
vector (Promega), 100 ng GAL4 DBD alone or GAL4 DBD-CALM/AF10 expression
plasmids and 100 ng FLAG-FHL2. The total amount of the transfected DNA was kept
constant by adding pcDNA6/V5 in all experiments.
For the protein extractions, 2x10⁶ cells were seeded in a 100 mm Petri dish the day before
the transfection. On the next day, the cells were washed with DPBS and 8 ml fresh
medium was added.
For reporter gene assay-the different DNA concentrations described, for co localization-
2 μg plasmid DNA and for the protein extraction 8 μg plasmid DNA was mixed with 30,
60 or 200 μl pure medium (free from serum and antibiotics) in reaction A. In reaction B -
30, 60 or 200 μl medium and 10-50 μl Roti®-Fect or 1.5 volumes of PEI was mixed. In
order to form DNA lipid complexes reaction A and B were mixed and incubated for 30
min. The cells were meanwhile washed with DPBS and growth medium with serum was
added to the cells. The mixture of the DNA lipid complex was added to the cells and
incubated for 24-48 hrs. After incubation, the cells were either harvested for reporter
gene assay (2.2.23) and protein extraction (2.2.17) or fixed for microscopy (2.2.15).
2.2.16 Fixation of transfected cells and microscopy
After the transfection (2.2.14), cells were once washed with ice cold PBS and fixed for 10
min in RT with freshly prepared 2% paraformaldehyde (in PBS). After fixation, the cells
were washed with ice cold PBS and stained with 2 ml DAPI solution (5 mg/ml stock
diluted 1:10’000 in PBS) for 2 min. The cells were washed one more time with PBS
whereafter the coverslips were mounted on glass slides with Dakocytomation Mounting
Medium and sealed with nail polisher. The Axiovert 200M microscope (Carl Zeiss, Jena,
Germany), with filter sets for visualization of DAPI, cyan (CFP) and yellow (YFP) and
Texas Red was used to observe the cells. Openlab 3.08 software (Improvision, Coventry,
UK) was used to record the images of the cells.

2 Material and Methods
39
2.2.17 Yeast two hybrid
The yeast two hybrid assay is a sensitive method for detecting weak and transient protein
interactions in living yeast cells. Even though some interactions cannot be biochemically
detectable they may be critical for proper functioning of complex biological systems,
(Van Criekinge W. and Beyaert R., 1999). The yeast two hybrid assay is a GAL4-based
assay, based on the coexpression of the bait protein (here CALM fused in frame to the
GAL4- DBD) and a prey protein (a library of random cDNA’s expressing protein X fused
in frame to the GAL4-AD). The plasmid cDNA library used for the screen was a
commercially available HeLa cDNA-library that was cloned into the pGAD-GH vector
and a human thymus cDNA library cloned into pACT2. When an interaction between the
bait and prey proteins occurs, the GAL4-DBD and GAL4-AD are brought into proximity
and a transcriptional activator complex is reconstituted that activates the expression of
reporter genes in the yeast (Figure 2.1). The yeast strain used is AH109 that contains the
reporter constructs in which the ADE2, HIS3 and lacZ/MEL1 genes are under control of
different GAL UAS and TATA boxes. The single yeast clones can be obtained by plating
them on selective plates. Expression of HIS3 and ADE2 enables the yeast cells to grow
on plates lacking nutrients (2.1.6.2). MEL1 provides the catalytic color reaction on the
plates supplemented with X-α-GAL. The product of MEL1 gene converts X-α-GAL into
a blue color.
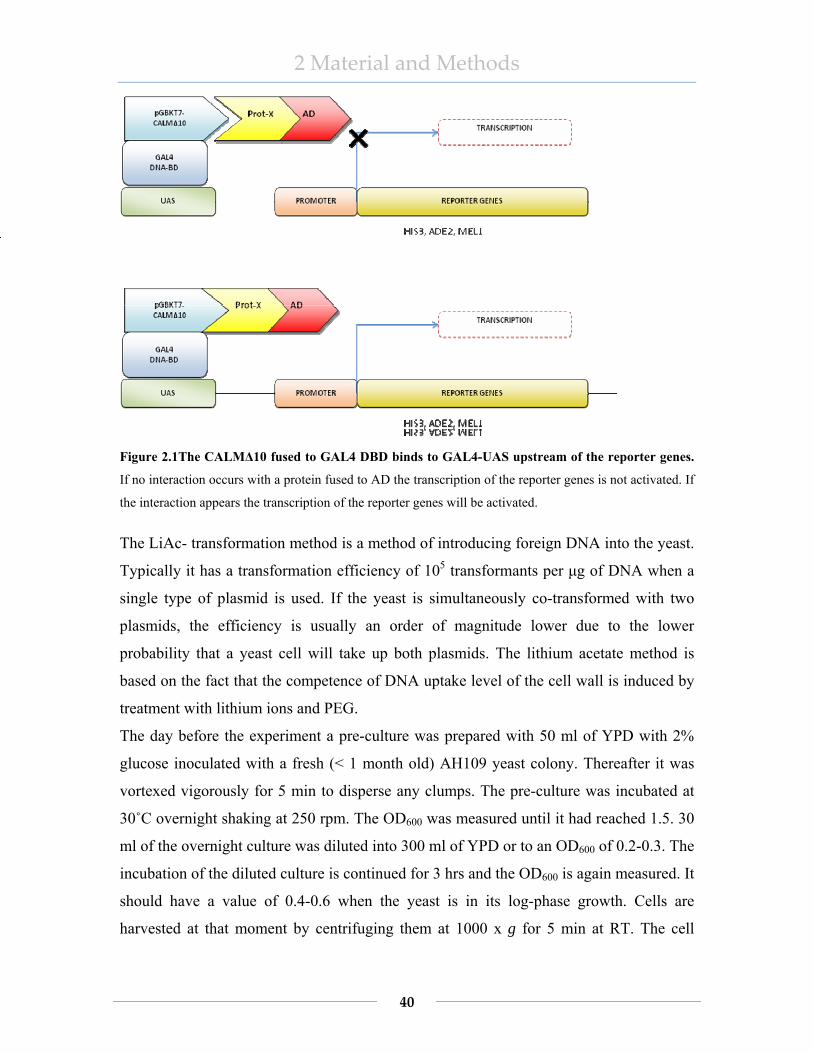
2 Material and Methods
40
Figure 2.1The CALMΔ10 fused to GAL4 DBD binds to GAL4-UAS upstream of the reporter genes.
If no interaction occurs with a protein fused to AD the transcription of the reporter genes is not activated. If
the interaction appears the transcription of the reporter genes will be activated.
The LiAc- transformation method is a method of introducing foreign DNA into the yeast.
Typically it has a transformation efficiency of 105 transformants per μg of DNA when a
single type of plasmid is used. If the yeast is simultaneously co-transformed with two
plasmids, the efficiency is usually an order of magnitude lower due to the lower
probability that a yeast cell will take up both plasmids. The lithium acetate method is
based on the fact that the competence of DNA uptake level of the cell wall is induced by
treatment with lithium ions and PEG.
The day before the experiment a pre-culture was prepared with 50 ml of YPD with 2%
glucose inoculated with a fresh (< 1 month old) AH109 yeast colony. Thereafter it was
vortexed vigorously for 5 min to disperse any clumps. The pre-culture was incubated at
30˚C overnight shaking at 250 rpm. The OD600 was measured until it had reached 1.5. 30
ml of the overnight culture was diluted into 300 ml of YPD or to an OD600 of 0.2-0.3. The
incubation of the diluted culture is continued for 3 hrs and the OD600 is again measured. It
should have a value of 0.4-0.6 when the yeast is in its log-phase growth. Cells are
harvested at that moment by centrifuging them at 1000 x g for 5 min at RT. The cell

2 Material and Methods
41
pellet is resuspended in 25 ml of sterile water and recentrifuged at 1000 x g for 5 min at
RT. Then the cells are resuspended in sterile 1xTE/ 1xLiAc. For each transformation
reaction, 100 μl of competent yeast cells, 0.1 mg herring testes carrier DNA and 0.1 μg
plasmid DNA were mixed in a sterile 1.5 ml eppendorf tube, and 600 μl of 1x PEG/LiAc
solution was added. The transformation reaction was incubated at 30˚C, vigorously
shaking at 200 rpm for 30 min. Then 70 μl of DMSO was added and the culture was
mixed gently by inversion, followed by a heat shock at 42˚C for 15 min. The cells were
cooled on ice for 1-2 min and then centrifuged in RT at top speed for 5 sec. The pellet
was resuspended in 1xTE buffer. 100 μl of the cells were streaked on selective plates and
incubated at 30˚C until the colonies appeared (3-7 days).
2.2.17.1 Test of the bait protein
Using the lithium acetate transformation protocol, pGBKT7-CALMΔ10 and pGBKT7
(used as the control) were transformed separately into the yeast strain AH109. The cells
were streaked on SD –Trp plates. The transformed yeast cells were then replated on
plates lacking Trp and His. If growth occurred on this selection plate, it would indicate an
activation of the HIS3 reporter gene through the bait protein alone. This would mean that
the construct would have to be modified to exclude any domain that acts as an activation
domain.
2.2.17.2 Large scale cDNA library transformation
To obtain high transformation efficiency e.g. high number of transformants expressing
individual library plasmids, a large scale transformation was done with the Hela S3 and
the human thymus cDNA libraries. By sequential transformation the pGBKT7-
CALMΔ10 bait plasmid was introduced into the yeast cells as in small scale
transformation described in 2.2.16.1. The pGBKT7-CALMΔ10 positive colonies were
grown on SD –Trp plates whereafter they were made competent as described in 2.2.16.1.
16 μl (8µg) of Thymus cDNA and 2 μl (3µg) of HeLa cDNA was used to obtain a
maximal amount of transformation efficiency (this was calculated in pilot experiments),
that in this case was 4x10⁴ transformants/μg DNA. After the transformation cells were
incubated in 12.5 ml (250 μl/plate) of YPD medium for 1hr in 30°C. After centrifuging,

2 Material and Methods
42
the pellet was washed and resuspended in 12.5 ml 1xTE buffer. 250 μl of the transformed
yeast cells were plated on 50 medium stringency (SD –Trp, -Leu, -His) selection plates,
which were incubated at 30°C for 3 to 7 days or until the colonies appeared. To estimate
the transformation efficiency, 2 μl of the transformation mixture was streaked on SD –
Leu and SD –Trp, -Leu.
2.2.17.3 Isolation of plasmid DNA from yeast
The positive clones were inoculated into 2 ml of SD-medium in a sterile 15 ml Falcon
tube, and grown O/N at 30°C with vigorous shaking (230rpm). 1.5 ml of each overnight
culture was transferred to an Eppendorf tube and was spun for 5 sec at top speed. The
pellet was vortexed and thereafter resuspended in 200 μl of breaking buffer, 0.3 g of glass
beads (0.45-0.52 mm acid-washed) and 200 μl of phenol/chloroform/isoamyl (25:24:1).
This mixture was vortexed for 2 min at high speed, and thereafter centrifuged for 5 min at
top speed at RT. 250 μl of the supernatant was then transferred to a new Eppendorf tube,
and the DNA was ethanol precipitated as described in 2.2.4. The DNA was resuspended
in 20 μl sterile water and 5 μl were used for transformation into chemically competent
bacterial cells 2.2.6.1.

2 Material and Methods
43
2.2.18 Protein extraction
2.2.18.1 Protein extraction from yeast cells
A fresh (< 1 month old) yeast colony was inoculated in 5 ml YPD medium, mixed by
vortexing and incubated O/N at 30°C with vigorous shaking (230 rpm). The overnight
culture was measured with UV-spectrometer as described in chapter 2.2.2 and a total
volume of 2 OD’s were transferred to fresh Eppendorf tubes. The culture was centrifuged
for 15 min at 14’000 rpm at RT. The pellet was resuspended in 250 μl of 50 mM Tris (pH
8). 50 μl of Rödel mix (2.1.5) was added to the mixture and incubated for 10 min on ice.
220 μl of 72% Trichloroacetic acid (TCA) was added and the mixture was mixed by
vortexing. Another incubation was done on ice for 15 min, whereafter the mixture was
centrifuged for 40 min at 14 000 rpm in 4ºC. The pellet was washed with 1ml pre cooled
acetone by centrifuging 10 min at 14 000 rpm at 4ºC. Pellet was air dried for 10 min at
RT, and resuspended in 200 μl of 2x Lämmli buffer. Samples were subsequently boiled
for 5 min at 95ºC, and 30 μl of the samples were loaded on a 10% SDS PAGE.
2.2.18.2 Protein extraction from mammalian cells
Extraction of proteins from transfected and non-transfected cells was performed by
washing the cells with ice-cold PBS (2000 rpm for 5 min at 4˚C). The cells were lysed in
RIPA buffer (for Western blot), with freshly added protease inhibitors (cocktail diluted
1:100). The cells were homogenized by rotating them (15 rpm) at 4ºC for 30 min and
thereafter the cell extract was cleared by centrifugation at top speed for 15 min at 4ºC.
The supernatant was transferred to a fresh sterile microcentrifuge tube and stored at -
80ºC.
2.2.18.3 Cytoplasmic protein extraction for immunoprecipitation (IP)
1x10⁷ 293T cells were harvested by centrifuging at 1 000 rpm for 5 min. The cells were
washed three times with 5 ml ice cold PBS by centrifuging at 2 000 rpm for 5 min. The
pellet was resuspended in buffer A (2.1.5) and incubated on ice for 10-15 min with
occasional tapping. Nuclei were pelleted by centrifugation at 2 000 rpm for 5 min at 4°C.

2 Material and Methods
44
The cytoplasmic fraction (the supernatant) was transferred to a fresh sterile
microcentrifuge tube and was further used for IP (2.2.21).
2.2.19 Determination of protein concentration
The Bradford method was used to determine of protein concentration. A standard Bovine
Serum Albumine- BSA curve, against which the protein concentration was measured,
was calibrated with diluted stock solution (1 μg/μl BSA) in the volume of d2H2O shown
in the table below.
BSA 0 1 5 10 15 20 25 d2H2O 800 799 795 790 785 780 775 Bradford reagent 200 200 200 200 200 200 200
For measuring the protein, 1 μl of the protein extract was diluted in 799 μl d2H2O and
200 μl of Bradford reagent was added to each sample. Measurements were performed
with an Eppendorf BioPhotometer 6131.
2.2.20 SDS-PAGE gel electrophoresis
The protein samples prepared for the analyses were all denatured and coated with
detergents by heating in the presence of SDS and a reducing agent. This results in a net
negative charge which is proportional to the size of the protein. The proteins are then
separated on the basis of their molecular mass. To separate the proteins, SDS-
Polyacrylamide (SDS-PAGE) gel electrophoresis with denaturing conditions was used.
Depending on the size of the proteins, the concentration of the gels was determined
according to the table below:
Linear range of separation (kDa) Acrylamide concentration (%) 12-43 15 16-68 10 36-94 7.5 57-212 5

2 Material and Methods
45
The components for the resolving gel were mixed as follows: Components (5 ml) 8% 10% 12% d2H2O 2.3 ml 1.9 ml 1.6 ml 30% Acrylamide mix 1.3 ml 1.7 ml 2.0 ml 1.5 M Tris/HCl (pH 8.8) 1.3 ml 1.3 ml 1.3 ml 10% SDS 0.050 ml 0.050 ml 0.050 ml 10% APS 0.050 ml 0.050 ml 0.050 ml TEMED 0.003 ml 0.002 ml 0.002 ml
The stacking gel was prepared after the resolving gel was polymerized as follows:
Components (2 ml) Stacking gel 5% d2H2O 1.4 ml 30% Acrylamide mix 0.33 ml 1 M Tris/HCl (pH 6.8) 0.25 ml 10% SDS 0.02 ml 10% APS 0.02 ml TEMED 0.002 ml
As the resolving gel already was polymerized the stacking gel was poured directly on it.
2.2.20.1 Coomassie staining
To detect the proteins in the gel after the electrophoresis, the PAGE gel was Coomassie
stained by incubating the gel for 1 h in Coomassie® solution (BioRad) at RT with gentle
shaking. The proteins were fixed and the unspecific binding of the Coomassie® solution
was washed away with 10% acetic acid and 40% methanol diluted in d2H2O. Destaining
was performed at RT O/N, or until the protein bands were visible. The stained gel was
fixed by incubation in 1% glycerol diluted in d2H2O for 30 min to 1 hour with gentle
shaking at RT. Finally, the gel was dried for 2 hrs at 80˚C in a Gel Air™ Drying System
(BioRad).
2.2.20.2 Western blot analysis
After separation on a SDS PAGE gel, the proteins were transferred to membranes for
further analysis. The transfer from the SDS PAGE gel to a nitrocellulose membrane was
performed with a semi-dry system. The blotting papers (GB003) and the nitrocellulose
membrane were pre-wetted in transfer buffer. 3 sheets of blotting paper, the nitrocellulose
membrane, the gel and finally again the 3 blotting papers were laid on top of each other
on a Trans-Blot® SD Semi–Dry Transfer Cell (BioRad). The negatively charged proteins
were transferred to the membrane under electric current from negative to the positive

2 Material and Methods
46
pole at 200 mA for 1 hr. After transfer, the non specific binding sites on the membrane
were blocked with 5% nonfat dried milk for one hour at RT. The specific antibodies were
diluted in 5% nonfat dried milk to their optimal concentration. Immunoblotting was
carried out by incubating the primary antibodies O/N at 4˚C. Then the membranes were
washed 3x10 min with TBST, to remove all the unbound antibodies. To detect the
primary antibody, a secondary antibody1 was applied to the membrane and incubated for
1 hr at RT whereafter the membrane was washed (3x10 min) with TBST. Finally,
enhanced chemiluminescent reagent was applied for 5 min at RT (ECL, Amersham
Pharmacia biotech). The membrane is then wrapped in Saran wrap and placed in an X-
ray cassette. The films were exposed between 15 sec and 15 min depending on the
strength of the signals.
Re use of the membranes was possible by stripping, which was performed by incubating
membranes in the stripping solution (2.1.5) at 56˚C for 1hr. The stripped membrane was
washed twice with TBST for 10 min and the blocking procedure with milk was repeated
as described above.
2.2.21 Expression of GST fusion proteins
To express the GST-FHL2 fusion protein the bacterial strain XL1’blue (2.1.7) was
transformed (2.2.6.3), with the pGEX4T1-FHL2 construct (2.1.11). The transformed
colonies were inoculated into 10 ml LB medium with Ampicillin and inoculated O/N at
37°C with vigorous shaking. The O/N culture was diluted in 100 ml LB medium with
Ampicillin and grown to an OD600 of 0.6-0.8 at 37°C. The expression of the GST fusion
protein was induced by incubating the cells for 2 hrs in the presence of 1 mM IPTG. The
cells were harvested by centrifugation at 4 500 rpm for 15 min at 4°C and the pellet was
resuspended in 5 ml ice-cold NETN buffer plus protease inhibitors (1:100 protease
inhibitor cocktail and 1 mM PMSF). Sonification of the cells was performed for 30 sec
on ice, whereafter the cell lysates were transferred to Eppendorf tubes and centrifuged at
14 000 rpm for 5 min at 4°C. The protein extracts were stored at -80°C. To examine if the
1 The secondary antibody, conjugated to horseradish peroxidase (HRP) enzyme catalyzes a colorimetric reaction when appropriate reagent is added, here ECL (Amersham Pharmacia biotech), resulting in a deposition of the substrate on the membrane at the reaction site.
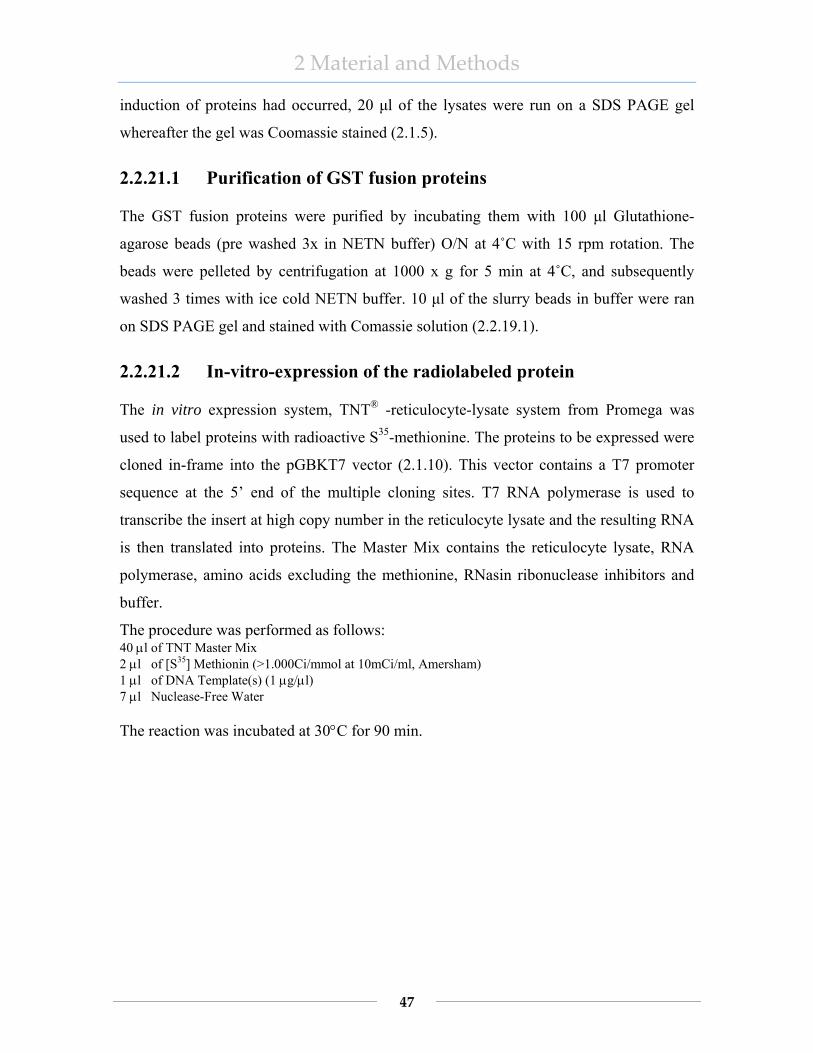
2 Material and Methods
47
induction of proteins had occurred, 20 μl of the lysates were run on a SDS PAGE gel
whereafter the gel was Coomassie stained (2.1.5).
2.2.21.1 Purification of GST fusion proteins
The GST fusion proteins were purified by incubating them with 100 μl Glutathione-
agarose beads (pre washed 3x in NETN buffer) O/N at 4˚C with 15 rpm rotation. The
beads were pelleted by centrifugation at 1000 x g for 5 min at 4˚C, and subsequently
washed 3 times with ice cold NETN buffer. 10 μl of the slurry beads in buffer were ran
on SDS PAGE gel and stained with Comassie solution (2.2.19.1).
2.2.21.2 In-vitro-expression of the radiolabeled protein
The in vitro expression system, TNT® -reticulocyte-lysate system from Promega was
used to label proteins with radioactive S35-methionine. The proteins to be expressed were
cloned in-frame into the pGBKT7 vector (2.1.10). This vector contains a T7 promoter
sequence at the 5’ end of the multiple cloning sites. T7 RNA polymerase is used to
transcribe the insert at high copy number in the reticulocyte lysate and the resulting RNA
is then translated into proteins. The Master Mix contains the reticulocyte lysate, RNA
polymerase, amino acids excluding the methionine, RNasin ribonuclease inhibitors and
buffer.
The procedure was performed as follows: 40 μl of TNT Master Mix 2 μl of [S35] Methionin (>1.000Ci/mmol at 10mCi/ml, Amersham) 1 μl of DNA Template(s) (1 μg/μl) 7 μl Nuclease-Free Water
The reaction was incubated at 30°C for 90 min.

2 Material and Methods
48
2.2.21.3 In vitro GST pulldown assay
The purified GST fusion protein (2.2.20.2) was used for the GST pulldown assay. The
reaction for the pulldown was mixed as follows: 20 μl of in vitro translated (S35-methionine-labeled) pGBKT7-CALMΔ10 10 μl of purifed GST-FHL2 100 μl GST-buffer
The reaction was incubated ON at 4˚C on a rotating platform. After incubation the
reaction was centrifuged for 5 min at 2000 rpm at 4˚C. The beads were washed 4 times
with 500 μl GST buffer (2.1.5) and finally resuspended in 20 μl of 2x Lämmli loading
buffer (2.1.5). The reaction was boiled at 95°C for 5 min and run on 10% SDS PAGE gel.
The gel was stained with Comassie blue for 1h and thereafter destained with a solution
consisting of 10% acetic acid and 90% d2H2O. To avoid damage to the gel during drying,
the gel was incubated in 1% glycerol water for 30 min. The gel was placed onto pre-
wetted 3 MM Whatman paper, covered with Saran wrap and dried at 80°C under constant
vacuum for 2 hrs. The Saran wrap was then removed, and the gel was exposed to an X-
ray film (Kodak) O/N at RT.
2.2.22 Immunoprecipitation
Plasmids expressing the desired proteins were co transfected into HEK293T cells by the
lipofectamin method (2.2.14) Cells were lysed as described in 2.2.17.3 24 h after the
transfection. Protein G-agarose beads (Roche) were washed with DPBS. 200 μl lysate
was incubated with 3μg anti-CALM antibodies (2.1.13) for 1 hr. Thereafter the protein
G-agarose beads were added to the total lysate and the mixture was incubated for another
3 hrs rotating in 4˚C and then put on ice for 30 min. The mixture was centrifuged for 5
min at 2000 rpm at 4˚C. The supernatant was discarded and the beads were washed with
1 ml NETN buffer (2.1.5) 4 times. The beads were resuspended in 5 μl of Lämmli buffer
and boiled at 95 ˚C for 5 min. The immunoprecipitated proteins were analyzed by 10%
SDS-PAGE (2.2.19), blotted, and detected with, respectively, monoclonal mouse anti-V5
and a mixture of polyclonal goat anti-CALM antibodies. Secondary antibodies used were
the horseradish peroxidase-coupled goat anti-mouse and the donkey anti-goat IgG.
Detection was achieved with the ECL detection system (2.1.1).

2 Material and Methods
49
For the second immunoprecipitation experiment performed with GFP binder beads
(Rothbauer U. et al., 2008)200 µl lysate as described in 2.2.17.3, 15µl slurry pre washed
GFP binder beads, and 200 µl IP buffer (2.1.5) were incubated for 30 min rotating at 4ºC.
The beads were then washed 3x with the IP buffer whereafter they were resuspended in 5
μl of Lämmli buffer and boiled at 95 ˚C for 5 min.
2.2.23 Immunofluoroscence
2x 10⁵ U2OS cells were seeded and grown on 18 x 24 mm coverslips placed in 6 well
plates. Cells were incubated for 24 hrs at 37°C in a CO2 incubator. Thereafter they were
washed with PBS and fixed for 10 min in 2% PFA (2.1.5). After fixation, the cells were
washed 3x with PBS and incubated in the dark for 15 min in PBS/NP-40 (0.1%)
whereafter the cells were blocked with PBS/FBS (10%) for 1.5 hour in RT. For the
immunofluoroscence reaction the FLAG antibodies were diluted 1:500 in 1.5 ml
PBS/FBS (1.5%), added to the fixed cells and incubated O/N at 4°C in a humidified
chamber. Next step was to wash the cells 3x6 min with PBS/NP-40 (0.1%) at RT. The
secondary antibody Alexa 555 diluted 1:500 in PBS/FBS (1.5%) and the cells were
incubated for 45 min at RT. The cells were subsequently washed 3x15 min with PBS/NP-
40 (0.1%). Finally a DAPI counter-stain (5 mg/ml stock solution, diluted 1:10’000 in
PBS) was applied for 2 min and the cells were washed once with PBS. Coverslips were
mounted on slides with Dakocytomation Mounting Medium and sealed with nail polish.
Cells were visualized with an automated Axiovert 200M microscope (Carl Zeiss, Jena,
Germany) equipped with single-band pass filter sets for visualization of DAPI, yellow
(YFP) and red (Cy3) fluorescence.

2 Material and Methods
50
2.2.24 GAL4-based reporter gene assays
Reporter gene assays are used to study eukaryotic gene expression. They are most
frequently used as indicators for the transcriptional activity in the cells. The reporter
system used is based on the expression of a protein of interest fused to GAL4-DNA
binding domain (DBD) in the mammalian system. The protein is targeted to the cell
nucleus and bound to the GAL4UAS that is located in the promoter region of the reporter
gene. If the protein of interest has transcriptional properties it will either repress or
activate the expression of the luciferase reporter genes as seen in fig 2.2.
Figure 2.2 Reporter gene assay. In mammalian cells the GAL4-DBD fusion protein is expressed. The
GAL4-DBD of the fusion protein binds to the GAL4UAS in the promoter region of the reporter gene. (A) If
the expressed protein is an activator of transcription the transcription of the luciferase reporter gene, from
the pGAL4LUC plasmid, will be induced. (B) If the protein is a repressor of transcription the constitutive
expression of the luciferase reporter gene, from the pGAL45tkLUC plasmid will be repressed.
Transfection of the human embryonal kidney 293T cells was performed as described in
2.2.16. 24 hrs after the transfection, cells were washed with 1 ml PBS and 120 μl of
passive lyses buffer (PLB) was added to the cells (5x10⁴ cells). The cells were incubated
for 15 min at RT shaking vigorously. After incubation, the cell lysates were mixed by
pipetting and 10 μl of the lysate was applied to 96-well luminometry plates (Promega).
The Dual-Luciferase® Reporter Assay System (Promega) was used because it provides
the possibility to measure the two reporter genes firefly Photinus pyralis and Renilla

2 Material and Methods
51
Renilla reniformis, sequentially from a single sample. The assay was processed by Orion
Microplate Luminometer as follows: 50 μl Luciferase Assay Reagent II (LARII) was
injected to the samples and the firefly luciferase activity was measured. Next, Stop &
Glo® Reagent was injected to the samples and the Renilla luciferase activity was
measured. The program was performing a 2-sec pre measurement delay, followed by a
10-sec measurement period for each reporter assay. Firefly luciferase expression was
normalized to the Renilla luciferase expresssion.
2.3 Micro array analysis
2.3.1 Expression analysis of FHL2 in leukemia samples
Micro array data from 139 samples, 129 leukemia samples and 10 normal bone marrow
samples, were used to analyze the expression levels of FHL2. The HG-U133A and HG-
U133B Affymetrix chips were used. The leukemic patient samples were from 13
different leukemia subgroups; CML, CALM/AF10 positive leukemias, AML_nk: AML
with normal karyotype, AML_comp: AML with complex aberrant karyotype,
AML_MLL: AML with MLL rearrangement,s AML_M4: AML with CBFB/MYH11
fusion, AML_M3: AML with PML/RARA fusion, AML_M2: AML with AML1/ETO
fusion, AML_FLT3: AML with normal karyotype and with a FLT3 internal tandem
duplication, ALL_Ph: ALL with BCR/ABL fusion, c-ALL (common ALL) and pro-ALL.
The data set was normalized using the VSN (Variance stabilization and calibration for
microarray data) and presented as boxes using the “boxplot” function. The expression
signal intensities are displayed on a logarithmic scale.

3 Results
52
3 Results
3.1 Identification of CALM interacting proteins using the yeast two hybrid system
In order to identify CALM-interacting proteins, yeast two-hybrid screens were
performed. Previously, different CALM deletion mutants had been cloned in frame into
the pGBKT7 and pAS2 yeast expression vectors as fusions with the GAL4 DNA binding
domain (GAL4-DBD). They had been tested for transcriptional activity in yeast with
respect to different reporter genes (HIS3, ADE2 beta-GAL) (2.2.16.2). These
experiments revealed the presence of at least two independent transcriptional
transactivation domains in CALM between aa 408 and 572. The longest C-terminal
CALM deletion mutant without transactivation activity, the pGBKT7-CALMΔ10 (fig
3.1), was used as bait for the yeast two hybrid screens (Fröhlich-Archangelo L. et al.,
2006)
Figure 3.1 Diagrammatic representation of GAL4-DBD-CALM deletion constructs. “+” and “-“
indicates growth and no growth of AH109 yeast cells transformed with the CALM deletion constructs and
then plated on SD plates lacking tryptophan and histidine (Fröhlich-Archangelo L. et al., 2006).

3 Results
53
Two human cDNA libraries expressing proteins as GAL4 activation domain fusion
proteins (prey) were screened with the pGBKT7-CALMΔ10 bait plasmid: a HeLa (HeLa
S3) and a Thymus cDNA library.
If the bait and prey proteins interact the GAL4-DBD and GAL4-AD are brought into
proximity. The transcriptional activator complex is then reconstituted and activates the
expression of reporter genes in the yeast. The yeast strain used was AH109 which
includes four reporter genes ADE2, HIS3 and lacZ/MEL1 genes.
For the yeast two hybrid screen using the HeLa cDNA library, a high stringency screen of
2x10⁶ transformants yielded 2 and 3 colonies in two independent screens. These clones
were able to grow as blue colonies on highly stringent selection plates lacking histidine,
adenine, leucine and tryptophan (-His, -Ade, -Leu, -Trp) supplemented with X-α-GAL
(2.2.16). The product of MEL1 reporter gene converts the colorless X-α-GAL substrate
into blue color. The prey plasmid (pGAD-GH) inserts of these colonies were sequenced
with vector primers Y2H2 and Y2H3’AD (2.1.12). A BLAST nucleotide similarity
search of the insert sequences revealed homologies with four genes: 1) CALM interacting
protein expressed in thymus and spleen (CATS); 2) poly(rC)-binding protein 1 (PCBP1);
3) Tumor susceptibility gene 101 protein (TSG101), 4) Clathrin assembly lymphoid
myeloid leukemia protein (CALM). Table 3.1 summarizes the potential interacting
proteins of CALM from the screens with the HeLa cDNA library and gives a brief
description of each interaction protein.

3 Results
54
Table 3.1 Putative CALM interacting partners obtained from the HeLa S3 cDNA library
Protein name
Sub Cellular localization
Protein description* No of independent clones
NCBI Accession Nummer
CATS Predominantly in nucleus
CALM interacting protein expressed in thymus and spleen [1]
1 NM_019013
PCBP1 Nucleus. Cytoplasm
poly(rC)-binding protein 1. Single-stranded nucleic acid binding protein that binds preferentially to oligo dC [2]
1 NM_006196.2
TSG101 Cytoplasm Tumor susceptibility gene 101 protein. Regulator of vesicular trafficking process. [3]
1 BC002487
CALM Cytoplasm Clathrin assembly lymphoid myeloid leukemia protein. Involved in CALM/AF10 translocation. Recruites clathrin and adaptor protein complex 2 (AP2) to cell membranes..[4]
1 AB210017.1

3 Results
55
In the thymus cDNA library high stringency screen of a total of 2x10⁶ transformants in
two screens 4 independent colonies were obtained in the first screen and 3 independent
clones in the second screen. These 7 clones grew as blue colonies when plated on -His, -
Ade, -Leu, -Trp selection plates supplemented with X-α-GAL. The inserts of the prey
plasmids (pACT2) from these clones were sequenced, and the BLAST analysis revealed
homologies to five different cDNAs. For one clone no sequence could be obtained. Two
clones were coding for Filamin A (FLNA). One clone each was identical to: 1) Fatty acid
binding protein 4- (FABP4); 2) Poly(rC) binding protein 1 (PCBP1); 3) Dipeptidyl-
peptidase 7 (DPP7); 4) Four and a half LIM domain protein 2 (FHL2). Table 3.2
summarizes the potential interacting proteins of CALM from the screen with Thymus
cDNA library and gives a brief description of each interaction-protein. Protein name
Sub Cell localization
Protein description* Nr of independent
clones
NCBI Accession Nummer
FLNA cytoplasmic Filamin A, actin binding protein 280, promotes orthogonal branching of actin filaments and links actin filaments to membrane glycoproteins [5]
2 NM_001456
FABP4 cytoplasmic Fatty acid binding protein 4, adipocyte. Lipid transport protein in adipocytes. Binds both long chain fatty acid and retinoic acid [6]
1 BC003672.1
PCBP1 Nucleus. Cytoplasm
poly(rC) binding protein 1, Single-stranded nucleic acid binding protein that binds preferentially to oligo dC , [7]
1 NM_006196.2
DPP7 Lysosome. Cytoplasmic
vesicle
dipeptidyl-peptidase 7, Plays an important role in the degradation of some oligopeptides [8]
1 NM_013379
FHL2 Nucleus. Cytoplasm
Four and a half LIM domain protein 2. Transcriptional co activator of β-catenin, integrin-signaling pathway.
1 L42176.1
Table 3.2 Putative CALM interacting partners from the Thymus cDNA library.

3 Results
56
Figure 3.2 schematically depicts the full length cDNA sequence (protein coding region as
bigger dark grey box) of the CALM interacting proteins (top in each drawing) and the
prey clones (bottom) obtained from the library screens. The activation domain (AD)
encodes for 113 amino acids of the yeast GAL4 transcription factor which is part of the
prey vector. The pink colored box denotes the sequenced part of the clones. The clones
were sequenced from the 5’ as well as the 3’ ends using Y2H2 and Y2H3’AD primers
(2.1.12). From our yeast two hybrid experiment we obtained the C-terminus of the
alternative spliced variant 2 coding for isoform 2 of CATS. The prey clones of PCBP1,
CALM, FABP4 and DPP7 do not contain the N terminus. The FHL2 prey clone was full
length. Note that FLNA is drawn at half scale compared to the other clones.

3 Results
57

3 Results
58
Figure 3.2 Map of cDNA, Open Reading Frames (ORFs) of full length proteins and the extent of the
DNA sequence in the prey clones isolated in the yeast two hybrid screens with pGBKT7-CALMΔ10.
Activation domain (AD) is coding for 113 amino acids. The pink colored box denotes the sequenced part of
the clones. The clones were sequenced from the 5’ as well as the 3’ ends using Y2H2 and Y2H3’AD
primers (2.1.12). From our yeast two hybrid experiment we obtained the alternative spliced variant 2
coding for isoform 2 of CATS. CALM, FABP4 and DPP7 sequences are all missing the N-terminal part,
however the missing parts are of different sizes. TSG101 and FLNA obtained from the yeast two hybrid are
containing the C-terminal part of the full length sequence. FHL2 obtained from the yeast two hybrid screen

3 Results
59
is the full length FHL2. Because of the size, FLNA is depicted in half size in comparison to the rest of the
proteins

3 Results
60
3.2 Confirmation of potential protein interactions
As an initial test to confirm that the proteins identified in the screen are indeed CALM
interacting partners, we co-transformed the CALM bait plasmid with the individual prey
plasmids into yeast strain AH109. Figure 3.3 shows the growth of the co-transformed
yeast clones containing the CALM bait and one of the prey plasmids of the interacting
partners: FHL2, FABP4, PCBP1, DPP7, CALM, TSG101, CATS and FLNA (FLJ00343)
on selective plates lacking the essential nutrients histidine (His, H), adenine (Ade, A),
leucine (Leu, L) and tryptophan (Trp, W). These results indicate that all the clones
initially identified in the screen could be confirmed as potential interacting partners.
Figure 3.3 Interaction of CALM with 8 different proteins. Yeast strain AH109 was cotransformed with
pGBKT7-CALMΔ10 and the prey plasmids from the screen. Transformed cells were streaked on high
stringency SD plates lacking His, Ade, Trp and Leu.
The different interaction partners of CALM suggest that CALM is involved in several
different cellular processes. The CALM interaction partner FHL2, which had been shown
to be important in several leukemia-associated cellular pathways, was chosen for further
detailed analysis including colocalization, co-immunoprecipitation experiments and
reporter gene assays.

3 Results
61
3.3 Mapping of the CALM-FHL2 interaction in yeast
3.3.1 Construct of FHL2 bait protein
For mapping the CALM interaction domain of FHL2, various portions of the FHL2
cDNA were inserted into the pGBKT7 vector to produce a series of GAL4 DBD-FHL2
deletion mutants. The appropriate portions of the FHL2 cDNA were amplified with the
primers FHL2-T, FHL2-LIM1/2, FHL2-LIM1/2-1, FHL2-LIM1/2-2 and FHL2-LIM1/2-3
(2.1.12) and inserted into the NcoI and BamHI restriction sites of the pGBKT7 vector (fig
3.4 A). As a full length FHL2 clone the prey clone (fused to GAL4 AD) obtained from
the two hybrid screen was used.
The FHL2 deletion mutants were transformed into yeast strain AH109. The expression of
the different FHL2 deletion mutants was analyzed with Western blot using a GAL4-DBD
antibody. Lanes 1- 6 show pGBKT7-LIM1/2, pGBKT7-LIM1, pGBKT7-LIM2,
pGBKT7-LIM3, pGBKT7-CALMΔ10 and pGBKT7 empty, respectively (fig 3.4 B). The
full length FHL2 fused to the GAL4-AD (original prey plasmid) was detected with a
GAL4-AD antibody as seen in lane 1 in fig 3.4 C.

3 Results
62
Figure 3.4 A) Diagram of the FHL2 deletion constructs cloned into pGBKT7. The deletion constructs
were cloned into pGBKT7 vector to produce GAL4-DBD-fused FHL2 deletion proteins. The full length
FHL2 clone in the pACT2 vector was obtained from the initial yeast two hybrid screen. B) Western blot of
FHL2 deletion mutants fused to the GAL4 DBD. Protein was isolated from AH109 cells transformed
with pGBKT7-LIM ½ (Lane 1), pGBKT7-LIM ½-1 (lane 2), pGBKT7-LIM ½-2 (lane 3), pGBKT7-LIM
½-3 (lane 4), pGBKT7-CALMΔ10 (lane 5) and pGBKT7 alone in lane 6. GAL4-DBD antibodies were
used for detection. C) Western blot of FHL2 fused to the GAL4-AD. pACT2-FHL2 (lane 1) and
pGBKT7 alone in lane 2 were transformed in AH109 yeast cells. GAL4-AD antibodies were used for
detection.

3 Results
63
3.3.2 Mapping of the CALM interaction domain of FHL2
The different FHL2 deletion mutants had been tested for transcriptional activity with
respect to different reporter genes in AH109 (HIS3, beta-GAL) (2.2.16.2). These
experiments did not reveal a transcriptional transactivation domains in FHL2 (data not
shown). To map the CALM interaction domain of FHL2, pGAD-GH-CALM (aa 114-
652) was cotransformed into AH109 with the deletion mutants of FHL2 (described in
1.3.1). Note that the full length FHL2 (fused to GAL4-AD obtained from the screen) was
transformed with pGBKT7-CALMΔ10 (2.1.11). Co transformants were plated on
selective plates lacking His, Ade, Leu and Trp. Growth occurred only when full length
FHL2 was co transformed with pGBKT7-CALMΔ10, fig 3.5.
Figure 3.5 Full length FHL2 is needed for the interaction with CALM. The yeast strain AH109 was
cotransformed with the various pGBKT7-FHL2 deletion mutants and the pGAD-GH-CALM (expressing aa
114-652) clone or with the pGBKT7-CALMΔ10 (fig 3.1) and the pACT2-FHL2 clone. Transformed cells
were streaked out on selective plates lacking tryptophan, leucine, histidine and adenine. The interaction
occurs only between the full length FHL2 fused to GAL4 AD and pGBKT7-CALMΔ10.

3 Results
64
3.3.3 Mapping the FHL2 interaction domain of CALM
To map the FHL2 interaction domain on CALM, the various CALM deletion mutants
fused to the GAL4-DBD (in the pGBKT7 and pAS2 plasmid) and FHL2 fused to GAL4-
AD (in pACT2) shown in fig 3.1, were used in the yeast two hybrid assay. The co-
transformants were assayed for growth on selective plates as seen in fig 3.6. CALMΔ4
(aa 1-335) and CALMΔ10 (aa 1-408) show an interaction with FHL2 in contrast to
CALMΔ1 (aa 1-294), CALMΔ7 (aa 1-221) and CALMΔ8 (aa 1-105) which are not
displaying any interaction. These data suggest that FHL2 requires amino acids 294-335
of CALM for interaction.
Figure 3.6 FHL2 interacts with amino acids 294 to 335 of CALM. The yeast strain AH109 was
cotransformed with plasmids expressing GAL4 DBD-CALM deletion mutants and a plasmid (pACT-
FHL2) expressing the GAL4 AD-FHL2 fusion. Transformed cells were serially diluted (1:100, 1:1000,
1:10000 and 1:20000) and plated on medium lacking histidine, adenine, leucine and tryptophan ( -H/ -A/-
L/-W). The interaction occurs only between the CALM deletion mutants CALMΔ10 and CALMΔ4, and

3 Results
65
the full length FHL2 indicating that the FHL2 interaction domain in CALM lies between 294 and 335 of
CALM.

3 Results
66
3.4 CALM-FHL2 GST pulldown assay
To confirm the direct interaction between CALM and FHL2, a glutathione S-transferase
(GST) pulldown assay was carried out.
3.4.1 Expression of FHL2
For the GST pulldown assay, full length FHL2 fused to GST expressed from the pGEX-
4T1-FHL2 plasmid was used (2.1.11) (fig 3.7) (Müller J. et al., 2000). Bacterially
expressed GST-FHL2 protein was purified using glutathione sepharose beads.
Figure 3.7 Diagram of FHL2 fused to GST. The FHL2 was cloned into pGEX-4T1 vector (Müller J. et
al., 2000).
Subsequently the samples were loaded on a SDS PAGE gel and stained with Coomassie
blue, fig 3.8. 10 μl of the proteins were loaded per lane.
Figure 3.8 GST and the GST-FHL2 fusion protein on a Coomassie stained PAGE gel. Lane 1: protein
expressed from empty pGEX-4T1. Lane 2) GST-FHL2. In each lane 10 µl protein lysate was loaded. The
total amount of lysate was obtained from a 50 ml culture.

3 Results
67
3.4.2 CALM interacts with FHL2 in vitro
To analyze the CALM-FHL2 interaction in vitro, a GST pulldown assay with the full
length FHL2 fused to GST (GST-FHL2) and a S-35 methionine labeled CALMΔ10
protein (expressed from pGBKT7 in a TNT reaction) was performed. Only GST-FHL2
construct bound to glutathione beads was able to retain the S-35 methionine-labeled
CALM, fig 3.9. Input reflects 10% of the protein incubated with the beads.
Figure 3.9 GST pulldown assay. Lane 1) 10% input of the S35-labeled CALMΔ10 protein. Lane 2) no
unspecific interaction occurs between GST only and S35-labeled CALMΔ10 protein. Lane 3) Direct
interaction between full length FHL2 fused to GST and CALMΔ10 proteins is confirmed.

3 Results
68
3.5 CALM interacts with FHL2 in vivo
To establish whether CALM and FHL2 interact in vivo, a co-immunoprecipitation
experiment was performed. Human endothelial kidney (HEK) 293T cells were transiently
co-transfected (2.2.14) with pEYFP-C1-CALM and pcDNA6/V5-FHL2 (2.1.11).
Immunoprecipitation was performed using CALM antibodies. After immunoprecipitation
and Western blotting, the mixture of polyclonal anti-CALM antibodies detected the
immunoprecipitated YFP-CALM fusion protein and the two bands with the expected size
of endogenous CALM (66 and 72 kDa), (fig 3.10). The membrane was stripped and
reprobed with a monoclonal anti-V5 antibody. In lane 2 a band can be seen which
corresponds to the co-immunoprecipitated V5-FHL2 protein. A weak band is also seen in
lane 1, suggesting that endogenous CALM interacts with overexpressed V5-FHL2. In
lanes 4, 5 and 6 the input lysates are run as controls for protein expression. These results
clearly show that the overexpressed YFP-CALM protein interacts with the overexpressed
V5-FHL2 protein and that it is very likely that endogenous CALM is also interacting with
the overexpressed V5-tagged FHL2 protein.
Figure 3.10 CALM interacts with FHL2 in vivo. Lane 1) Precipitation of endogenous CALM with
CALM antibodies co-precipitates small amounts of the overexpressed V5-FHL2, seen as a weak band.
Lane 2) Precipitation of YFP-CALM with CALM antibodies co-precipitates V5-FHL2. FHL2 is detected
with a V5 antibody. Lane 3) V5 alone and the precipitated YFP-CALM detected with CALM antibody.

3 Results
69
Lanes 4), 5) and 6) loaded with the input lysates. The amounts of heavy chain detected in lane 1, 2 and 3
demonstrate that the amount of antibodies used in the experiment is constant.
To exclude nonspecific binding between YFP and FHL2 we performed the co-
immunoprecipitation also using the GFP-binder protein, which is a single chain camelid
antibody highly specific for GFP (Rothbauer U. et al., 2008). While precipitation of YFP-
CALM results in co-precipitation of FLAG-FHL2, precipitation of YFP alone does not
co-precipitate FLAG-FHL2, (fig 3.11) YFP and YFP-CALM are detected by rabbit
monoclonal anti GFP antibodies, while FHL2 is detected with the mouse monoclonal
anti-FLAG antibody.
Figure 3.11 CALM interacts with FHL2 in vivo. The precipitation was performed with GFP-binder
(Rothbauer U. et al., 2008) Lane 1) 10% of the input lysate from 293T cells expressing YFP-CALM and
FLAG FHL2. Lane 2) The precipitated YFP-CALM co-precipitates FLAG-FHL2. Lane 3) 10% of the
lysate input, from 293T cells expressing YFP and FLAG FHL2. Lane 4) The precipitated YFP does not co-
precipitate FHL2. YFP-CALM is detected with rabbit anti- GFP antibody and FLAG-FHL2 is detected
with mouse monoclonal anti-FLAG antibody.

3 Results
70
3.6 Co-localization of CALM and FHL2
To further explore the CALM-FHL2 interaction and examine whether the expression of
one of the proteins has an influence on the subcellular localization of the other protein, a
YFP-tagged CALM and CALM/AF10 protein (YFP-CALM, YFP-CALM/AF10) and a
FLAG-tagged FHL2 (FLAG-FHL2) were co-expressed in U2OS (Human Osteosarcoma
cells). The transfected cells were fixed and then stained with FLAG antibody before
being analyzed with a confocal microscope. As previously reported, YFP-CALM and
YFP-CALM/AF10 are predominantly located in the cytoplasm (fig 3.12). It has also been
shown that CALM and CALM/AF10 shuttle between the cytoplasm and nucleus
(Fröhlich-Archangelo L. et al., 2006). YFP-CALM is rather homogenously distributed in
the cytoplasm, while the cells expressing YFP-CALM/AF10 have a “speckled” pattern in
both the cytoplasm and to a lesser extent also in the nucleus. In particular, it was
noticable that cells expressing YFP-CALM/AF10 are partially forming cytoplasmic
inclusions in contrast to cells expressing YFP-CALM or YFP-FHL2. As previously
reported, FHL2 is localized in both the cytoplasm and the nucleus (fig 3.12) (Lee S-W. et
al., 2005; Ng E.K. et al., 2002). After incubation with FLAG antibodies and Alexa 555
conjugated secondary antibodies, no signal is detected in the Cy3 channel in cells that
were only transfected with YFP-CALM, YFP-CALM/AF10 or YFP-FHL2. Only
minimal background signal is detected in the Cy3 channel at the maximum level of laser
stimulation (600 V). Thus we exclude cross reactivity between the FLAG antibody and
YFP-fusion-proteins in the immunofluorescence experiments described below.

3 Results
71
Figure 3.12 YFP-CALM, YFP-CALM/AF10 and YFP-FHL2 overexpressed in U2OS cells. YFP-
CALM and YFP-CALM/AF10 are mainly located in the cytoplasm. In cells expressing YFP-CALM/AF10,
inclusion bodies are visualized, in contrast to the cells expressing YFP-CALM and YFP-FHL2. YFP-FHL2
is located in both nucleus and cytoplasm. Since only minimal background signal is seen in the Cy3 channel
the cross reaction between the FLAG antibody and the three different YFP-fusion proteins used in co-
localization experiments was excluded.

3 Results
72
In cells co-expression YFP-CALM and FLAG-FHL2, co-localization of the two proteins
can be observed in the cytoplasm and also in several nuclear spots. Co-localization is
indicated by yellow color in the merged image and overlapping peak intensities in the
line scan (fig 3.13). Thus, shuttling YFP-CALM might be retained in the nucleus through
interaction with FLAG-FHL2.
Figure 3.13 CALM and FHL2 colocalize in the nucleus and the cytoplasm. A series of confocal images
of U2OS cells co-expressing YFP-CALM and FLAG-FHL2. YFP-CALM is mainly located in the
cytoplasm. FLAG-FHL2 is located in both the cytoplasm and nucleus. The confocal line scan shows
overlapping signal intensity peaks of YFP-CALM and FLAG-FHL2 in the cytoplasm as well as in nuclear
spots. The green line corresponds to YFP-CALM, red to FLAG-FHL2 and the blue line corresponds to the
DAPI staining.

3 Results
73
3.7 Co-localization of CALM/AF10 and FHL2
In order to examine if FHL2 has an effect on the subcellular distribution of CALM/AF10
or vice versa, we performed the colocalization experiments with FHL2 and CALM/AF10.
In initial experiments, we observed that the expression of YFP-CALM/AF10, but not of
YFP-CALM or of YFP-FHL2, leads to the formation of partial intracellular inclusions
(fig 3.12). In the cells that co-express YFP-CALM/AF10 and FLAG-FHL2 the
“speckled” pattern of YFP-CALM/AF10 remains unchanged, however, in addition to its
normal distribution FLAG-FHL2 appears to be enriched in the cytoplasmic CALM/AF10
spots (fig 3.14). This co-localization is indicated by yellow color in the merged image
and by overlapping peak intensities in the line scan (fig 3.14).

3 Results
74
Figure 3.14 YFP-CALM/AF10 and FLAG-FHL2 co-localize mainly in the cytoplasm. While both
proteins show their original distribution, with a speckled CALM/AF10 pattern and FHL2 both in the
nucleus and the cytoplasm, the signals strongly overlap in cytoplasmic spots, seen in yellow color in the
merged image and overlapping peak intensities in the confocal line scan. The green line corresponds to
YFP-CALM/AF10, red to FLAG-FHL2 and the blue line corresponds to the DAPI staining.

3 Results
75
To examine whether the distribution pattern of CALM/AF10 is influenced by the
relatively large green fluorescent protein (GFP) fluorescent tag (27 kDa) we also used
another CALM/AF10 expressing construct with a short FLAG-tag to transfect U2OS
cells. FLAG-CALM/AF10 showed a similar mainly cytoplasmic localization like the
YFP-CALM/AF10 protein. However, the distribution appears to be slightly more
homogenous with fewer speckles. This might be due to a more stable protein expression
or changes in solubility. Furthermore, we did not observe differences in the localization
of FLAG-FHL2 and YFP-FHL2 when expressed alone. Co-expression of YFP-FHL2
together with FLAG-CALM/AF10 led to similar results like the co-expression of the
YFP-CALM/AF10 and FLAG-FHL2 proteins, with co-localization in the cytoplasm (fig
3.15). Thus we could exclude any major influence of the fluorescent tags on the
subcellular localization of the proteins we examined.

3 Results
76
Figure 3.15 FLAG-CALM/AF10 and YFP-FHL2 colocalize in the cytoplasm. Confocal images of
U2OS cells cotransfected with YFP-FHL2 and FLAG-CALM/AF10. The FLAG-CALM/AF10 is localized
in the cytoplasm, while YFP-FHL2 is found both in the cytoplasm and in the nucleus. YFP-FHL2 and
FLAG-CALM/AF10 colocalize in the cytoplasm which is seen in in orange color of the merged image and
overlapping peak intensities in the confocal line scan. The green line corresponds to YFP-FHL2, red to
FLAG-CALM/AF10 and the blue line corresponds to the DAPI staining.

3 Results
77
3.8 Transcriptional activation assays
After demonstrating that CALM and FHL2 interact both in vitro and in vivo, we asked
what the functional consequences of this interaction would be. Vecchi et al., (2001)
reported that CALM activates the transcription of a GAL4 promoter driven luciferase
reporter gene when fused to the GAL4 DNA-binding domain (GAL4 DBD) in
mammalian cells. In addition, it is known that FHL2 can act as a co-activator or co-
repressor for a number of transcription factors. In fact, it was shown by Müller et al.,
(2000), that FHL2, when fused to the GAL4 DNA-binding domain, will activate a GAL4
promoter driven luciferase reporter gene. We therefore used a luciferase reporter gene
assay to examine the possible functional consequences of FHL2 on CALM-mediated
transcriptional activation.
3.8.1 CALM does not activate transcription in a GAL4-based transactivation assay
Figure 3.16 shows a diagram with the possible effects of CALM when activating or
repressing the transcription of a luciferase reporter gene.
Figure 3.16 Diagram of CALM in GAL4-based transactivation assay. a) If CALM is an activator of
transcription the transcription of the luciferase reporter gene is activated. To examine transcriptional
activation, a reporter plasmid was used in which the luciferase reporter gene was under the control of 5
GAL4 UAS sites and an SV40 minimal promoter (Gal4-Luc) b) If CALM is a repressor of transcription the
constitutive expression of the luciferase reporter gene will be reduced. Constitutive expression of the
luciferase reporter gene is achieved with a reporter plasmid in which the luciferase reporter gene is under
the control of 5 GAL4 UAS sites and the Herpes Simplex Virus thymidine kinase promoter (Gal4-tk-luc).
To examine if CALM is a transcriptional activator, CALM together with the GAL4 Luc
plasmid was transfected into HEK 293T cells. In the plasmid GAL4 Luc, the firefly
luciferase reporter gene is under the control of 5 GAL4 UAS sites and a GAL4 SV40
minimal promoter. If CALM is a transcriptional activator the transcription of the

3 Results
78
luciferase reporter gene is activated. To achieve constitutive expression of the luciferase
reporter gene and examine if CALM acts as a transcriptional repressor, the Gal4-tk-Luc
plasmid is transfected into the cells. In the Gal4-tk-Luc plasmid the luciferase reporter
gene is under the control of 5 GAL4 UAS sites and the Herpes Simplex Virus thymidine
kinase promoter. If CALM acts as a repressor the transcription the constitutive expression
of the luciferase reporter gene will be reduced.
We were unable to reproduce the CALM-mediated transcriptional activation reported by
Vecchi et al., (2001) and decided not to use GAL4 DBD-CALM for further experiments.

3 Results
79
3.8.2 FHL2 acts as transcriptional activator in a GAL4 based transactivation assay
Müller et al., (2000) reported that GAL4 DBD-FHL2 can act as a transcriptional
activator. Fig 3.17 shows a diagram of this experiment.
Figure 3.17 FHL2 transcription assay model. When GAL4DBD-FHL2 binds to upstream activating
sequence the transcription of the luciferase reporter gene is activated (Müller et al., 2001).
GAL4 DBD-FHL2 induced up to 40 fold increase in reporter gene activity in comparison
to GAL4 DBD alone (Fig 3.18). The positive control, GAL4 DBD-STAT 2, activated the
transcription of the luciferase reporter gene on average 3520 fold (data not shown). We
confirmed that FHL2 activates the transcription of the luciferase gene, as reported
previously. The experiment was performed four times (fig 3.18.)
Figure 3.18 FHL2 fused to GAL4DBD acts as activator of transcription. The GAL4 DBD-FHL2
activated the transcription of the luciferase up to 40 fold in 293T cells. The cells were transfected with
GAL4 DBD and GAL4 Luc as negative controls. The positive control, GAL4 DBD-STAT 2, activated the
transcription of the luciferase reporter gene on average 3520 fold (data not shown). Firefly luciferase
expression was normalized to Renilla luciferase expression.

3 Results
80
3.8.3 CALM interferes with the transcriptional activation of GAL4 DBD-FHL2
Since we had shown that FHL2 interacts with CALM and can also affect the subcellular
localization of CALM, we asked whether CALM would affect the transcriptional activity
of FHL2 (fig 3.19).
Figure 3.19 Model of CALM-FHL2 interaction. The interaction between FHL2 and CALM might affect
the transcriptional activation of the luciferase reporter gene.
We could show that GAL4 DBD-FHL2 significantly (up to 40 fold) activates the
transcription of the luciferase reporter gene (Fig 3.18 and 3.20). Interestingly, when
GAL4 DBD-FHL2 was cotransfected with YFP-CALM (100 ng, 200 ng and 400 ng) in
293T cells, the transcriptional activation mediated by GAL4 DBD-FHL2 was reduced by
about 50% (fig 3.20). These results were very consistent in four independent experiments
with three measurements per sample. The positive control, GAL4 DBD-STAT 2,
activated the transcription of the luciferase reporter gene 981 fold (on average, data not
shown).

3 Results
81
Figure 3.20 CALM disturbs the activation of GAL4DBD-FHL2. GAL4DBD-FHL2 alone activates the
transcription of luciferase significantly. Co-transfecting (100 ng, 200 ng and 400 ng) YFP-CALM results in
significant inhibition of transcriptional activation. The error bars represent standard deviations. 4
independent experiments with 3 measurements per sample were performed. The positive control, GAL4
DBD-STAT 2, activated the transcription of the luciferase reporter gene to an average of 981 fold (data not
shown). Firefly luciferase expression is normalized to Renilla luciferase expression.
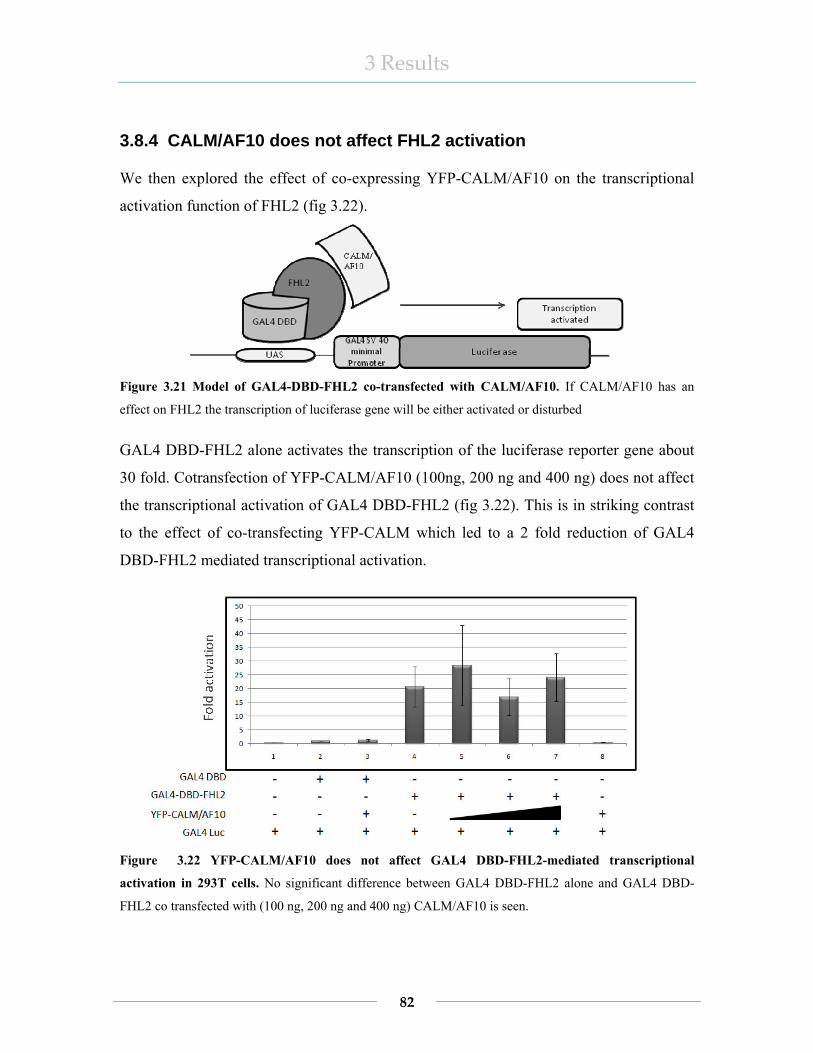
3 Results
82
3.8.4 CALM/AF10 does not affect FHL2 activation
We then explored the effect of co-expressing YFP-CALM/AF10 on the transcriptional
activation function of FHL2 (fig 3.22).
Figure 3.21 Model of GAL4-DBD-FHL2 co-transfected with CALM/AF10. If CALM/AF10 has an
effect on FHL2 the transcription of luciferase gene will be either activated or disturbed
GAL4 DBD-FHL2 alone activates the transcription of the luciferase reporter gene about
30 fold. Cotransfection of YFP-CALM/AF10 (100ng, 200 ng and 400 ng) does not affect
the transcriptional activation of GAL4 DBD-FHL2 (fig 3.22). This is in striking contrast
to the effect of co-transfecting YFP-CALM which led to a 2 fold reduction of GAL4
DBD-FHL2 mediated transcriptional activation.
Figure 3.22 YFP-CALM/AF10 does not affect GAL4 DBD-FHL2-mediated transcriptional
activation in 293T cells. No significant difference between GAL4 DBD-FHL2 alone and GAL4 DBD-
FHL2 co transfected with (100 ng, 200 ng and 400 ng) CALM/AF10 is seen.

3 Results
83
3.8.5 FHL2 disturbs GAL4DBD-CALM/AF10-mediated transcriptional activation
Since we could show that GAL4 DBD-FHL2 is affected by YFP-CALM but not by YFP-
CALM/AF10, we wondered whether there would be any effect of FHL2 on GAL4 DBD-
CALM/AF10 (figure 3.23).
Figure 3.23 Cartoon of GAL4DBD-CALM/AF10 influenced by FHL2.
In pilot experiments we determined that GAL4 DBD-CALM/AF10 is indeed an activator
of transcription of the luciferase reporter gene, leading to a 50-fold activation of
transcription compared to the expression of GAL4 DBD alone. Interestingly, when a
FLAG-FHL2 expressing plasmid was cotransfected in this system the transcriptional
activation of GAL4 DBD-CALM/AF10 was reduced to only 20-fold (fig 3.24).

3 Results
84
Figure 3.24 Transcriptional activation by GAL4 DBD-CALM/AF10 is disturbed by FLAG-FHL2. A
clear reduction in transcriptional activation of GAL4 DBD-CALM/AF10 is observed when FLAG-FHL2 is
cotransfected in 293T cells. Three independent experiments were performed and measured in duplicates.

3 Results
85
3.9 Expression analysis of the FHL2 protein
3.9.1 Expression analysis of FHL2 in hematopoietic cell lines
Western blot analysis was used to examine the expression of the FHL2 protein in
different hematopoietic cell lines (fig 3.25). High expression of FHL2 was found in the
human chronic myeloid leukemia in blast crisis (CML) cell line K-562. Lower expression
of FHL2 can be seen in the human B cell lymphoma cell line Karpas 422 and the Epstein
Barr-virus (EBV) transformed B-cell cell line LCL 3.1. No FHL2 expression was found
in DG-75, which is a human Burkitt lymphoma cell line. None of the AML cell lines, T-
cell lines or the B-cell lines NCEB-1, Jeko-1, Granta 519 and Nalm-6 express FHL2 at
the protein level (fig 3.25b).
a)
b) Figure 3.25 Expression of FHL2 in hematopoietic cell lines. a) Strong expression of FHL2 is seen in
K562, weaker expression in Karpas 422 and LCL 3.1 but no expression in DG-75. In a) 80 µg of protein
lysate was loaded in each lane. b) No protein expression of FHL2 could be detected in several other cell
lines. The lysate from 293T cells overexpressing V5-FHL2 was used as a positive control. In b) 100 µg
protein was loaded in each lane. FHL2 was detected with a mouse monoclonal anti-FHL2 antibody (2.1.13)

3 Results
86
3.9.2 Expression analysis of FHL2 in normal and solid tumor cell lines
We also examined the expression of FHL2 in cell lines of normal tissue and solid tumors.
Western blot analysis revealed expression of FHL2 in a cervical cancer cell line (HeLa),
an osteosarcoma cell line (U2OS) and human embryonic kidney cells (293T). In the
human lung fibroblast cell line (Wi38) and the osteosarcoma cell line (SaOS) no
expression of FHL2 could be detected.
Figure 3.26 Western blot analyses of FHL2 in normal and solid tumor cell lines. FHL2 is expressed in
HeLa, U2OS, and the 293T cell lines but not in Wi38 or the SaOS cell line. 100 µg protein was loaded in
each lane and FHL2 was detected with a mouse monoclonal anti-FHL2 antibody.

3 Results
87
3.9.3 Expression analysis of Fhl2 in rodent cell lines
Since the monoclonal anti human FHL2 antibody cross-reacts with the mouse and rat
FHL2 proteins we examined the expression of Fhl2 in several rodent cell lines. For
expression analyses of murine cell lines 100 µg protein was used and Fhl2 was detected
with the monoclonal FHL2 antibody (2.1.13). Fig 3.27 shows that the mouse pro B-cell
(BA/F3) cell line does not express FHL2 in contrast to the mouse embryonic fibroblast
cell line NIH3T3 and the rat fibroblast cell line TGR which show strong expression.
Figure 3.27 Expression of FHL2 in rodent cell lines. Fhl2 is strongly expressed in a mouse embryonic
fibroblast cell line (NIH3T3) and in a rat fibroblast cell line (TGR). The murine pro B-cell cell line Ba/F3
does not express FHL2. As positive control V5-FHL2 expressed in 293T cells was used. 100 µg of protein
was loaded in each lane.

3 Results
88
3.10 Expression analysis of FHL2 mRNA in leukemia samples
3.10.1 Microarray
We used Affymetrix microarray data to analyze the expression levels of FHL2 in 129
leukemia patient samples and 10 normal bone marrow samples. The leukemic patient
samples were from 13 different leukemia subgroups including 10 samples from
CALM/AF10 positive leukemias. The other leukemias included chronic myeloid
leukemia (CML), several subtypes of acute myeloid leukemia (AML) and of acute
lymphoblastic leukemia (ALL). For the analysis of the VSN normalized data set the
dChip program was used. A comparison of different subtypes of leukemia and normal
bone marrow revealed a higher expression of FHL2 in CML and in AML samples with
complex aberrant karyotype (fig 3.28). The expression level of FHL2 was relatively low
in all the other subgroups examined including the CALM/AF10 positive leukemias. The
higher expression of FHL2 in CML and AML patients with complex aberrant karyotypes
did not reach statistical significance at the 0.05 level but suggested a trend, which needs
to be examined in a larger patient cohort.

3 Results
89
Figure 3.28 FHL2 is expressed at higher levels in CML (Chronic myeloid leukemia) and AML (Acute
myeloid leukemia) with complex aberrant karyotype. A microarray analysis was performed on 129 patient
samples and 10 normal bone marrow samples. Boxplots depicts the mRNA expression levels of FHL2 in
normal bone marrow (nBM), CML, CALM/AF10 positive leukemias, in 7 different AML subtypes
(AML_nk: AML with normal karyotype, AML_comp: AML with complex aberrant karyotype,
AML_MLL: AML with MLL rearrangement, AML_M4: AML with CBFB/MYH11 fusion; AML_M3:
APL with PML/RARA fusion; AML_M2: AML with AML1/ETO fusion; AML_FLT3: AML with normal
karyotype and with a FLT3 internal tandem duplication), ALL_Ph: ALL with BCR/ABL fusion; c-ALL:
(common ALL) and pro-ALL. Expression intensities are depicted on a logarithmic scale. The box presents
50% of the dataset and is called the interquartile range (IQR). It is obtained by subtracting the first quartile
from the third quartile. An expression value was considered to be an outlier when it lies more than 1.5 IQR
lower or higher than the first or third quartile, respectively. Outliers are represented as circles. The smallest
and largest values that are not outliers are indicated by a vertical tic mark or "whisker” which are connected
to the box via a horizontal line.

4 Discussion
90
4 Discussion
The t(10;11)(p13;q14) translocation is a chromosomal abnormality observed in patients
with acute myeloid and lymphoblastic leukemias (AML and ALL) (Dreyling M. et al.,
1996). The t(10;11)(p13;q14) translocation results in the fusion of CALM on chromosome
11 band q14 to AF10 on chromosome 10 band p13. The CALM/AF10 fusion protein
encompasses nearly all the protein domains of both CALM and AF10 (Fig 1.7) (Dreyling
M. et al., 1996). Deshpande et al. showed that expression of CALM/AF10 induces
leukemia in a murine bone marrow transplant model (Deshpande A. et al., 2006 ). To
learn more about CALM/AF10, the physiological functions of CALM and AF10 need to
be understood. In order to elucidate the function of CALM we searched for CALM
interacting proteins using a yeast two hybrid screen.
The CALM-Gene (Clathrin Assembly Lymphoid Myeloid Leukemia Gene) encodes a 652
amino acid long protein that is ubiquitously expressed and has a high homology with the
neuronal specific protein AP180. CALM is a clathrin assembly protein and has been
demonstrated to play an essential role in clathrin-mediated endocytosis (CME). CALM is
involved in protein-protein and protein-lipid interactions that lead to the stable
recruitment of clathrin coats (Evans R. and Owen J., 2002; Hinrichsen L. et al., 2006;
Legendre-Guillemin V. et al., 2004). CALM is involved in two different translocations
and fusion proteins: the CALM/AF10 and the MLL/CALM. This together with the
finding that several other endocytic proteins have been identified in leukemia-associated
gene fusion, suggests that alterations of the CME play a hitherto underappreciated role in
leukemia development (Bohlander S.K. et al., 2000; Dreyling M. et al., 1996; Floyd S.
and De Camilli P., 1998; Polo S. et al., 2004; Wechsler D.S et al., 2003).
4.1 Identification of CALM interacting proteins
By identifying protein interaction partners of CALM, we would be able to connect
CALM with cellular pathways and place it in a functional context within the living cell.
We performed two yeast two hybrid screens using the N-terminal portion of CALM (aa
1-408) as a bait. In a HeLa cDNA library we identified the following CALM interacting

4 Discussion
91
partners: the CALM interacting protein expressed in thymus and spleen (CATS), the
poly(C)-binding protein 1 (PCBP1), the Tumor susceptibility gene 101 (TSG101) and
CALM itself. The proteins obtained from the screen of the thymus cDNA library were
filamin actin binding protein (FLNA), adipocyte fatty acid binding protein 4 (FABP4),
dipeptidyl-peptidase 7 protein (DPP7) and four and a half LIM domain protein 2 (FHL2).
4.1.1 CATS
The CALM interactor CATS was first identified in a previous yeast two hybrid screen of
our group as a CALM interacting protein. The CATS protein does not contain any known
conserved protein motifs. The CATS transcript is highly expressed in thymus, spleen and
colon (Fröhlich-Archangelo L. et al., 2006). From our yeast two hybrid experiment we
obtained the alternative spliced variant 2 coding for isoform 2 of CATS. The CALM-
CATS interaction had previously been confirmed with GST-pulldown experiment, co-
immunoprecipitation assay as well as in immunofluorescence assay. It is known that the
localization of a protein is critical for its function. Intriguingly, it was demonstrated that
in mouse fibroblasts cells (NIH3T3) the presence of CATS can affect the subcellular
localization of CALM and CALM/AF10. When CATS was coexpressed with
CALM/AF10, most of the CALM/AF10 protein was drawn to the nucleus. In contrast to
CALM which shifted only partially to the nucleus upon co-expression with CATS
(Fröhlich-Archangelo L. et al., 2006). Interestingly, CATS was shown to be highly
expressed in lymphoid tissues, which indicate that the CATS-CALM interaction might be
important in CALM/AF10 mediated leukemogenesis.
4.1.2 PCBP1
The CALM interactor poly(C)-binding protein 1 (PCBP1) is a member of the PCBP1
protein family. PCBP1 is characterized by three K-homologous (KH) domains which
may be involved in RNA binding (Leffers H. et al., 1995). PCBP1 is a RNA binding
protein that has been shown to be involved in mRNA stabilization, translational
activation and silencing, and is therefore likely to play a role in a diverse set of post-
transcriptional control pathways (for review see (Makeyev A. and Liebhaber S., 2002).
Together with the poly(C)-binding protein 2 (PCBP2), PCBP1 functions as translational

4 Discussion
92
coactivator of poliovirus RNA (Blyn L.B et al., 1996). PCBP1 has also been implicated
in the translational control of the human papilloma virus (Collier B. et al., 1998). The
PCBP1 clone obtained from our yeast two hybrid screen lacks the first KH domain
completely. Interestingly, PCBP1 has also been shown to interact with CATS (Fröhlich
Archangelo L., 2006). Thus, it is tempting to speculate that CALM and CATS are
competing for the binding on PCBP1 or they might form a trimeric complex. Since
PCBP1 is a shuttling protein (Makeyev A. and Liebhaber S., 2002) it is possible that the
interaction with CALM might keep PCBP1 in the cytoplasm. Considering the fact that
CATS completely relocated the CALM/AF10 protein (and not CALM) to the nucleus it is
tempting to speculate that the CALM/AF10 fusion protein could disrupt the physiological
function of the CALM-PCBP1 interaction.
4.1.3 TSG101
The tumor susceptibility gene 101, which was found to interact with CALM by us, was
first identified in a screen for potential tumor suppressors (Li L. and Cohen S., 1996).
TSG101 is an endocytic adaptor protein that has been shown to be crucial in cell
proliferation, cell survival (Krempler A. et al., 2002), and has a role in the ubiquitin-
controlled endosomal sorting pathways (Bishop N. and Woodman P.G., 2000). Normally,
TSG101 functions in the cellular vacuolar protein sorting (VPS) pathway, coordinating
the sorting of membrane associated proteins. This pathway is composed of a series of
endosomal compartments, and eventually the proteins are delivered to the lysosomes
(Dupre S. et al., 2001; Piper R. and Luzio J., 2001). Impairment of TSG101 protein
function disturbs the endosomal trafficking which results for example in prolonged
signaling of growth factor receptors. This effect is believed to contribute to the
tumorigenic phenotype exhibited by the TSG101 mutant fibroblasts (Babst M. et al.,
2000).
The TSG101 clone obtained in our yeast two hybrid screen lacked the N-terminal
domain. This suggests that only the C-terminal part of TSG101 (aa 280-390) is needed
for an interaction with CALM. The C-terminal portion of TSG101 which was identified
in our screen contains part of the putative coiled coil domain (~37 aa), the PTAP motif
4 Discussion
93
and the steadiness box (S-Box). It has been shown that the expression of the C-terminal
fragment of TSG101 blocks the budding of PTAP- and PPPY dependent retroviruses like
HIV (Johnson M. et al., 2005). Depletion or overexpression of TSG101 arrested or
decreased the release of HIV-1, thereby functionally linking TSG101 to virus budding
and release (Demirov D.G. et al., 2002; Garrus et al., 2001).
Clathrin-coated vesicles mediate endocytosis of transmembrane receptors and the
transport of newly synthesized lysosomal hydrolases from the trans-Golgi network
(TGN) to the lysosomes (Schmid S., 1997). Clathrin and various adaptor protein
complexes play also an important role in shaping the budding vesicles as well as in the
packaging of cargo (Ritter B. and McPherson P.S., 2004). This demonstrates that protein
sorting and vesicle budding are functionally integrated. Interestingly, clathrin has been
described as the major binding partner of CALM. After overexpressing CALM,
inhibition of endocytosis and disruption of clathrin localization in the TGN was observed.
This resulted in perturbance in the TGN-endosome trafficking (Tebar F. et al., 1999).
Despite the unknown biological function of the CALM-TSG101 interaction, it is quite
apparent that these two proteins are involved in the same pathways, including the
endosomal sorting pathway. Thus, it is conceivable that the CALM/AF10 fusion protein
might disrupt the endosomal sorting pathway through protein relocalization.
4.1.4 CALM
The CALM gene was first identified as fusion partner of AF10 in the t(10;11)(p13;q14)
translocation, which was observed in acute myeloid leukemia (AML), acute
lymphoblastic leukemia (ALL) and malignant lymphoma (Dreyling M.H. et al., 1998).
We identified CALM as a CALM interacting protein suggesting that CALM might
dimerize or multimerize with itself. The prey clone of CALM which we obtained in our
yeast two hybrid screened lacked the first 114 amino acids. The biological function of
CALM dimerization or multimerization is still unknown and remains to be explored.
4.1.5 FLNA
The CALM interactor FLNA is a homodimeric F-actin crosslinker organizing actin
filaments in parallel arrays or three dimensional webs linking them to the cell membrane

4 Discussion
94
(Gorlin J. et al., 1990 ). FLNA contributes to the stability of the membrane by anchoring
membrane proteins to the actin cytoskeleton. There is increasing evidence that FLNA
also plays a role in the regulation of nuclear functions. Previous findings indicate that
FLNA is processed by proteolysis. The proteolytic products of FLNA seem to play a role
as signaling molecules integrating nuclear and cytosolic pathways (Garcia E. et al., 2006;
Uribe R. and Jay D., 2007). Our FLNA prey clone contained only the C-terminal part (aa
2306 - 2595) of FLNA. FLNA and the adapter protein complex 2 (AP-2) are competing
for the binding sites on the prostate specific membrane antigen (PSMA) (Rajasekaran A.
et al., 2005). Interestingly, CALM has also been shown to interact with AP-2 (Owen D.
and Luzio P., 2000). It has been suggested that the dissociation of FLNA facilitates the
binding of AP-2 to PSMA (Ghosh A. and Heston W., 2007). PSMA is then endocytosed
via CME (Hinrichsen L. et al., 2006; Rajasekaran A. et al., 2005). Depletion of AP-2
weakens the association between CALM and the plasma membrane (Meyerholz A. et al.,
2005). It is therefore possible that the detached CALM relocates to the spot where the
endocytic cycle starts. The exact function of the CALM-FLNA interaction in this
complicated process remains to be explored.
4.1.6 FABP4
Adipocyte fatty acid binding protein (FABP4) is a member of the intracellular fatty acid
binding protein (FABP) family. It plays a role in lipid metabolism, fatty acid uptake,
transport, metabolism and homeostasis in adipocytes (Michal J. et al., 2006). For the
CALM-FABP4 interaction the C-terminal part (aa 36-153) of FABP4 seems to be
required, since this portion of FABP4 was contained in our prey clone. The biological
function of CALM-FABP4 interaction is unknown. One possibility is that CALM has an
unknown role in the regulation of lipids and glucose homeostasis.
4.1.7 DPP7
Dipeptidyl-peptidase 7 protein (DPP7) is a post-proline cleaving aminopeptidase
expressed in quiescent lymphocytes. These quiescent lymphocytes are protected from
programmed cell death by a cellular program that suppresses apoptosis. Downregulation
of DPP7 inhibits the suppression of the apoptosis and resting lymphocytes become active

4 Discussion
95
(Chiravuri M. et al., 1999). Our DPP7 prey clone lacks the first 130 amino acids. The
interaction between CALM and DPP7 suggest a possible role of CALM in the regulation
of quiescence of lymphocytes. The leukemogenic CALM/AF10 fusion protein might
disrupt the function of DPP7 for example through relocalization. The CALM-DPP7
interaction might thus play an important role in CALM/AF10-mediated leukemogenesis.
4.2 FHL2
We chose to examine the interaction between CALM and the four and a half LIM protein
2 (FHL2) in more detail. FHL2, also called DRAL for Downregulated in
Rhabdomyosarcoma LIM protein, was first identified because of its differential
expression between normal human myoblasts and their malignant counterparts, the
rhabdomyosarcoma cells (Genini M. et al., 1997). The FHL2 protein is composed of 4
complete LIM domains and a half LIM domain at its N-terminus (figure 4.1).
LIM is an acronym for Lin-11, Isl-1 and Mec-3 which are the first three proteins in which
the LIM motif was found (Freyd G. et al., 1990; Karlsson O. et al., 1990; Way J. and
Chalfie M., 1988). LIM domains are characterized by a highly conserved double zinc
finger motif. The cysteine and histidine residues bind two zinc atoms as shown in figure
4.1 (Michelsen J.W. et al., 1993; Schmeichel K.L. and Beckerle M.C., 1997).
Figur 4.1 Domain structure of the FHL2 protein. FHL2 is composed of 9 zinc fingers in total. Note that
the half LIM domain on N-terminus contains just one zinc finger. One LIM domain consists of two zinc
fingers. Zinc atoms (grey spheres) in the middle, are bound by the cystein and histidine residues (yellow).

4 Discussion
96
The FHL2 prey clone isolated from our yeast two hybrid assay contains the complete
coding sequence of the FHL2 protein. The FHL2 gene is located on chromosome 2 band
q12-q13 and encodes a protein of 279 amino acids (Chan K. et al., 1998).
FHL2 is a protein interacting with many different proteins belonging to diverse functional
classes including steroid receptors like estrogen receptor alpha (ERalpha), androgen
receptor (AR), integrin receptor a7ß1, structural proteins, signal transducers, transcription
factors and cofactors, splicing factors, DNA replication-, repair- and diverse other
enzymes (Kobayashi S. et al., 2004; Müller J. et al., 2000; Samson T. et al., 2004).
Intriguingly, it has been shown that transcription of the FHL2 gene can be stimulated by
p53. P53 induces FHL2 expression during apoptosis (Scholl F. et al., 2000). p53
mutations or deletions are found in nearly all tumor types. It is estimated that they can be
found in more than 50% of all cancers (Berkson R. et al., 2005). In addition, it has been
observed that increased nuclear FHL2 expression correlates with progression to a highly
malignant phenotype in prostate carcinoma (Müller J. et al., 2002). Strong nuclear FHL2
immunoreactivity was also observed in lung tumor biopsies, while no FHL2 was detected
in healthy lung tissue (Borczuk A. et al., 2004). Compared to normal tissue, elevated
expression of FHL2 was also detected in human epithelial ovarian cancer (Gabriel B. et
al., 2004). In expression analyses, FHL2 mRNA levels were increased in patients with
AML-FAB M7 subtype, compared to other AML’s (Lotem J. et al., 2005). The finding of
increased expression of FHL2 in various types of cancers made it an interesting candidate
for further characterization.
4.2.1 FHL2 interacts with CALM and influences the subcellular localization of CALM
The CALM and FHL2 interaction was confirmed in a GST pulldown assay and was
further corroborated in vivo by co immunoprecipitation. We showed that the full length
FHL2 was necessary for the CALM-FHL2 interaction to take place. The FHL2
interacting domain in CALM was determined to be between amino acids 294 and 335.
Interestingly, FHL2 binds to β-integrin (Samson T. et al., 2004), which together with
clathrin, a major binding partner of CALM, has been shown to be involved in endocytosis

4 Discussion
97
of bacteria (Tebar F. et al., 1999; Van Nhieu G.T. et al., 1996). This suggests a possible
role for the CALM–FHL2 interaction in the complex interaction network of endocytosis.
The hypothesis that FHL2 and CALM act together in the cytoplasm in the endocytic
machinery is supported by the fact that expression of YFP-CALM and FLAG-FHL2 in
U2OS cells result in co-localization of both proteins in the cytoplasm and at the cell
membrane. In addition, there was also co-localization of FHL2 and CALM in the nucleus
of the U2OS cell when CALM and FHL2 were cotransfected, suggesting a nuclear
function for these proteins.
FHL2 has previously been shown to localized to both the nucleus and the cytoplasm (Hill
A. and Riley P., 2004; Labalette C. et al., 2004; Scholl F. et al., 2000). We performed
immunofluoroscence experiments with YFP tagged CALM/AF10 and FLAG tagged
FHL2 to examine the possible colocalization of FHL2 with CALM/AF10. However, the
cells expressing the YFP-CALM/AF10 protein formed inclusion bodies of YFP-
CALM/AF10 making it difficult to interprete the results. The same experiments were
performed using YFP tagged FHL2 and FLAG tagged CALM/AF10. These experients
revealed FLAG-CALM/AF10 mainly in the cytoplasm while FHL2 was predominantly
seen in the nucleus. A minor fraction of the FHL2 co-localized with CALM/AF10 in the
cytoplasm. It could be shown by several investigators that increased nuclear FHL2
expression correlates with progression to a highly malignant phenotype of prostate
carcinoma, lung tumor and human epithelial ovarian cancer (Borczuk A. et al., 2004;
Gabriel B. et al., 2004; Müller J. et al., 2002). Overexpression of FHL2 has also been
observed to induce apoptosis in human rhabdomyosarcoma (RD) cells, transformed
monkey kidney (COS-1) cells, and normal mouse fibroblast (NIH 3T3) cells (Scholl F. et
al., 2000).
When fused to the GAL4 DNA binding domain (GAL4-DBD), FHL2 is activating the
transcription of the luciferase reporter gene (Müller J. et al., 2000). We could show that
CALM co transfected with GAL4-DBD-FHL2 significantly disturbed the transcriptional
activation induced by FHL2. Since the FHL2 interaction domain on CALM is present in
the CALM portion of the leukemogenic CALM/AF10 we also tested whether

4 Discussion
98
CALM/AF10 would influence the transcriptional activation function of GAL4 DBD-
FHL2. Surprisingly, this was not the case. The fact that the transcriptional activation
mediated by FHL2 was inhibited by CALM but not by CALM/AF10 could mean that in
the presence of the CALM/AF10 fusion protein the normal negative regulatory role of
CALM on FHL2 is reduced thereby increasing the tumor promoting activity of FHL2.
Since Vecchi et al., had shown that a GAL4-DBD-CALM fusion acts as a transcriptional
activator in a reporter gene assay we were interested to see which influence the co-
expression FHL2 would have in this system (Vecchi M. et al., 2001). However, we were
unable to reproduce the results of Vecchi et al. Intrestingly, we were able to show that a
GAL4-DBD-CALM/AF10 fusion behaved as a potent transcriptional activator in our
reporter gene assays. Co transfection of FHL2 and GAL4 DBD-CALM/AF10 led to a
marked reduction of the CALM/AF10-mediated transcriptional activation of the
luciferase reporter gene. In contrast, there was no influence of CALM/AF10 on the
transcriptional activiation mediated by GAL4 DBD-FHL2. One explanation for this lack
of influence could be that CALM/AF10, being a protein of about 170 kDa, is expressed at
a much lower molarity than the small FHL2 protein (~ 33 kDa). The CALM/AF10 would
therefore not be able to effectively bind to and influence the much more abundant GAL4
DBD-FHL2. On the other hand, when GAL4-DBD-CALM/AF10 is expressed, the FHL2
protein binds to all the GAL4-DBD-CALM/AF10 protein molecules thus inhibiting or
quenching the transcription induced by CALM/AF10. Another explanation might be that
the CALM interacting domain of FHL2 is masked when FHL2 is fused to the GAL4-
DBD protein.
4.2.2 FHL2 is expressed in tumor cell lines
FHL2 has been shown to be expressed in heart (Kong Y. et al., 2001; Müller J. et al.,
2000; Scholl F. et al., 2000), brain, liver, lung (Tanahashi H. and Tabira T., 2000), human
skeletal muscle (Genini M. et al., 1997; Morgan MJ. , 1996), as well as in human
osteoblasts (Chu P. et al., 2000). In expression analyses of different normal and tumor
cell lines, we observed FHL2 expression in the cervical cancer cell line HeLa, the
osteosarcoma cell line U2OS and the human embryonal kidney cell line 293T. No

4 Discussion
99
expression was seen in the human lung fibroblast cell line Wi38 and the osteosarcoma
cell line SaOS. It has been shown that enhanced levels of p53 stimulate the expression of
FHL2 (Johannessen M. et al., 2006), conversely one would expect very low levels of
FHL2 in cells with low p53 expression. Since the osteosarcoma cell line SaOs does not
express p53 this might be the explanation for the absence of FHL2 expression in this cell
line. Expression of FHL2 has been observed in the MRC-5 cell line, which is a normal
lung fibroblast cell line (Tanahashi H. and Tabira T., 2000). Therefore we expected to see
expression of FHL2 in the normal lung fibroblast cell line Wi38 but in our experiments
no FHL2 expression was detected. The Wi-38 cell line was derived from a female fetus
of about 3 months gestational age while the MRC-5 cell line is derived from a 14 week
male fetus. We thus lack a possible explanation for the absence of FHL2 in Wi38 cells.
Expression studies on rodent cell lines revealed strong expression of FHL2 in the mouse
embryonic fibroblast cell line NIH3T3 and the rat fibroblast cell line TGR. No FHL2
expression was detected in the murine pro B cell line Ba/F3. Except for the EBV-
transformed B-cell cell line LCL 3.1, no expression of FHL2 could be detected in human
B-cell cell lines . None of the T-cell nor AML cell lines were showing any expression of
the FHL2. FHL2 expression was observed in the B-cell lymphoma cell line Karpas 422
and the BCR/ABL expressing CML cell line K562. The explanation for the expression of
FHL2 in K562 cells might be that these cells express the BCR-ABL fusion gene. It has
been reported that expressing BCR-ABL in Ba/F3 cells resulted in an increased
expression of the p53 (Wendel H-G. et al., 2006). In addition, it was shown that p53 can
stimulate the expression of FHL2 (Scholl F. et al., 2000). Combining these findings
suggest the following picture: BCR/ABL induces the expression of p53 in K562 cells,
which in turn stimulates the expression of FHL2. The fact that the cell lines Karpas 422
and LCL 3.1 also express p53 and FHL2 supports this conclusion.
4.2.3 FHL2 is highly expressed in CML and AML with complex aberrant karyotypes
We also analyzed the expression levels of FHL2 in a series of cytogenetically and
genetically well-characterized AML, ALL and CML samples for which Affymetrix
micro-array expression data were available. Interestingly, the results from the K562 cell

4 Discussion
100
line that FHL2 expression might be high in CML were also mirrored in the patient
samples. FHL2 showed higher expression in CML patients and patients with AML with
complex aberrant karyotypes compared to other leukemia subgroups. However, the
standard deviations of the FHL2 expression levels in the CML and complex aberrant
AML leukemia subgroups were quite high. This might indicate that these groups are
heterogeneous with respect to their FHL2 expression levels (containing subgroups of
FHL2 high and low expressions). An alternative explanation for this observation is the
fact that we only examined a very small number of patient samples in each group (n =
10).
One of the characteristics of AML with complex aberrant karyotypes is the frequent loss
of chromosome 5 as well as a high incidence of TP53 deletions and/or mutations
resulting in an overall unfavorable prognosis (Schoch C. et al., 2002). Interestingly, Qian
et al. showed that therapy related myelodysplastic syndrome (t-MDS) and acute myeloid
leukemia (t-AML) characterized by a loss of a whole chromosome 5 or a deletion of the
long arm of chromosome 5 (-5/del(5q)) showed elevated FHL2 expression levels (Qian
Z. et al., 2005). These issues need to be addressed by analyzing the FHL2 expression in a
larger number of patients with CML and AML with complex aberrant karyotypes (with
and without -5/del(5q)).
If the expression levels of FHL2 are significantly different in these leukemia subgroups it
might even be possible to use FHL2 as a marker for these groups. These observations are
also consistent with the fact that a high FHL2 expression in solid tumors is associated
with an adverse prognosis.
FHL proteins have been described as coregulators of transcription by integrating the
activity of different transcription factors (Fimia GM. et al., 2000; Johannessen M. et al.,
2006). Despite their structural similarity, they seem to have evolved specialized functions
by regulating distinct transcription factors (Fimia G-M. et al., 2000). Interestingly, it was
recently shown that another member of the FHL family, FHL1, plays a role in AML
prognosis. High expression of FHL1 correlated with a poor prognosis in cytogenetically
normal AML (Metzeler K. et al., 2007). Intriguingly, FHL1 was found to be
overexpressed in MLL wild type versus MLL knock out cells (Schraets D. et al., 2003). It

4 Discussion
101
was shown that the homeobox gene HOX11 is a transcriptional regulator for FHL1 (Rice
KL. et al., 2008). HOX11 has also been implicated to function as an oncogenic
transcriptional activator in leukemogenesis (Zhang N. et al., 1996). Together these
findings suggest a hitherto underappreciated role of four and a half LIM domain proteins
in leukemogenesis.
4.3 Possible mechanisms of CALM/AF10-mediated leukemogenesis
It is intriguing to speculate that the dimerization potential of CALM plays a critical role
in the malignant transformation potential of the CALM/AF10 fusion protein. The mixed
lineage leukemia gene (MLL) is involved in more than 50 chromosomal translocations
associated with human acute leukemias (Popovic R. and Zeleznik-Le N.J., 2005). One of
the chromosomal translocations involving MLL is the MLL-AF10 translocation. MLL-
AF10 was found in AML (Chaplin T. et al., 1995). It is known that certain MLL fusion
proteins dimerize and then bind to DNA, and that the dimerization domains are supplied
by the fusion partner. It is thus conceivable that the dimerization domain provided by
CALM is very critical in the malignant transformation mediated by the CALM/AF10
fusion protein.
Alternatively, the critical domain supplied by the CALM moiety in the CALM/AF10
fusion protein might be the transcriptional activation domain of CALM. A transcriptional
activation domain could be mapped to the C-terminal portion of the CALM protein which
is also contained in the CALM/AF10 fusion protein. This activation domain mapping of
CALM was performed in the yeast system. In our hands, however, this transcriptional
activation domain of CALM was not very apparent in mammalian cells (luciferase
reporter assays). An argument against CALM developing the same transcriptional
activity in CALM/AF10 fusions as MLL in the MLL/AF10 fusion is the structural
difference between CALM and MLL. In contrast to CALM, which lacks DNA binding
domains, the N-terminal of MLL has two DNA binding domains: the AT hook motifs and
the DNA methyltransferase homology region. These two domains guide MLL to the
specific chromosomal sites. (Martin M.E. et al., 2003; Slany R., 2005). The C-terminal
domain of CALM has been described to behave as a long fishing line (Evans R. and

4 Discussion
102
Owen J., 2002). We propose that CALM dimerization occurs when these “fishing lines”
anchor to each other thus providing a platform for recruitment of additional clathrin
assembly proteins and proteins involved in endocytosis and membrane trafficking. In the
presence of the CALM/AF10 fusion this platform normally provided by CALM might be
disturbed.
However, we can not exclude that CALM/AF10 also leads to a disruption of normal
AF10 function. AF10 has a Drosophila homologue called Alhambra that has been shown
to regulate transcription through Polycomb group-responsive elements (PREs) (Perrin L.
et al., 2003). These elements maintain transcriptional decisions to ensure correct cell
identity during development and differentiation. Together with the findings that AF10 is
a putative transcription factor it is possible that a disruption of AF10 function by
CALM/AF10 leads to a transcriptional deregulation of the many genes that are regulated
by polycomb and trithorax complexes. Interestingly, in support of this idea we and others
could show that CALM/AF10 fusion-positive patients show overexpression of the
polycomb group gene BMI1, the homeobox gene MEIS1 and the HOXA cluster genes,
(Caudell D. et al., 2007; Krause A. et al., 2004). In addition, it was shown that patients
with MLL rearrangements had a very similar HOX expression pattern as CALM/AF10
positive patients (Krause A., 2006). The important role of HOX genes in acute leukemias
is well established (Bergeron J. et al., 2006; Rice K. and Licht J.D., 2007; Soulier J. et al.,
2005; Thorsteinsdottir U. et al., 2001).
A structure/function analysis of AF10 in the leukemogenic fusion proteins MLL/AF10
and CALM/AF10 showed that the octapeptide motif (OM) and the leucine zipper (LZ) of
AF10 are required for malignant transformation mediated by both proteins (DiMartino
JF. et al., 2002; Okada Y. et al., 2005). Interestingly, the AF10 interaction domain for the
lymphoid transcriptional regulator Ikaros was mapped to the OMLZ domain of AF10,
suggesting an important role of Ikaros in CALM/AF10 and MLL/AF10 induced
leukemias (Greif P. et al., 2007). AF10 has also been shown to interact with the histone
methyl transferase DOT1L (disruptor of telomeric silencing 1), as well as with the
GAS41 which is a component of the chromatin remodeling complex (Debernardi S. et al.,
2002; Okada Y. et al., 2005).

4 Discussion
103
Alternatively to disrupting the normal AF10 function, the CALM/AF10 fusion protein
might mediate some of its effects by using the AF10 moiety to disrupt other cellular
functions. It was shown that CATS can recruit the CALM/AF10 fusion protein to the
nucleolus. It is thus possible that the AF10 portion of CALM/AF10 might affect the
function of nucleolar proteins (Fröhlich-Archangelo L. et al., 2006). Nucleolar proteins
regulate cell proliferation and growth by ribosome biogenesis and are very important in
controlling p53 function (Horn H. and Vousden K., 2004; Maggi l. and Weber J., 2005;
Olson MO., 2004; Rubbi CP. and Milner J., 2003). Deregulation of these mechanisms is
the key event in the initiation and progression of malignant transformation (Horn H. and
Vousden K., 2004; Lohrum M. and Vousden K., 2000).
It has become clear during the course of this discussion that there are many different
possible mechanisms by which CALM/AF10 might induce leukemogenesis. The careful
dissection of CALM/AF10 protein interactions, like the CALM-FHL2 interaction, will
provide new entry points for unravelling the complicated mechanisms which are
responsible for the leukemogenic potential of the CALM/AF10 fusion protein.

5 Summary
104
5 Summary
The Clathrin Assembly Lymphoid Myeloid gene (CALM) was first found in the fusion
gene CALM/AF10 as the fusion partner of AF10 resulting from the t(10;11)(p13;q14)-
translocation. The CALM/AF10 fusion protein has been shown to play a crucial role in
CALM/AF10 associated leukemogenesis. In order to gain insight into the function of
CALM yeast two hybrid screens of HeLa and Thymus cDNA library were performed
using the N-terminal half of CALM as bait. Eight different putative CALM interacting
proteins were obtained including the four and a half LIM domain protein (FHL2). The
interaction between CALM and FHL2 was confirmed with co-immunoprecipitation, GST
pulldown assay and colocalization experiments. The FHL2 interaction domain in CALM
was mapped to amino acids 294 to 335. This domain is also contained in the
CALM/AF10 fusion protein.. Luciferase reporter gene assays were performed to analyze
the effect of FHL2, CALM and CALM/AF10 on each other as transcriptional regulators.
Interestingly we could show that the GAL4DBD-FHL2-induced activation of
transcription was inhibited when CALM was coexpressed, and that the GAL4DBD-
CALM/AF10-induced activation of transcription was strongly inhibited by FHL2.
Western blot analyses showed no expression of FHL2 in any of the AML, T-cell and B-
cell cell lines tested except for the EBV-transformed B-cell cell line L.C.L 3.1 and the B-
cell lymphoma cell line Karpas 422. FHL2 was highly expressed in cervical cancer,
osteosarcoma and CML cell lines. Micro array analyses of FHL2 expression levels in 139
leukemia and normal bone marrow samples showed that FHL2 is highly expressed in
CML and in AML complex aberrant karyotypes. The inhibitory function of CALM on
FHL2 in our reporter gene assays as well as the high expression levels of FHL2 in CML
and AML with complex aberrant karyotypes suggests that FHL2 might play an important
role in leukemogenesis not only in CALM/AF10 positive leukemias but also in a broader
spectrum of leukemias.
The identification of the CALM-FHL2 interaction provides an interesting new entry point
to dissect the mechanisms by which the CALM/AF10 fusion protein mediates
leukemogenesis.

6 Zusammenfassung
105
6 Zusammenfassung
Das Clathrin Assembly Lymphoid Myeloid Gen (CALM) wurde zuerst als Fusionspartner
von AF10 in dem Fusionsgen CALM/AF10, bei der t(10;11)(p13;q14) Translokation
entdeckt.. Das CALM/AF10 Fusionsprotein spielt eine entscheidende Rolle in der
CALM/AF10 assoziierten Leukämieentstehung. Um einen Einblick in die Funktion von
CALM zu erlangen, sind Yeast Two Hybrid Screens von HeLa und Thymus cDNA
Bibliotheken mit der N-terminalen Hälfte von CALM als Köder durchgeführt worden.
Dabei konnten acht potentielle CALM Interaktionspartner identifiziert werden,
einschlieβlich des four and a half LIM domain Proteins (FHL2). Die Interaktion zwischen
CALM und FHL2 wurde durch Koimmunopräzipitations-, GST-pulldown- und
Kolokalisationsexperimente bestätigt. Die FHL2 Interaktionsdomäne von CALM wurde
den Aminosäuren 294 bis 335 zugeordnet. Diese Domäne ist auch in dem CALM/AF10
Fusionsprotein enthalten. Die Expression von FHL2 führt zu einer Anreicherung von
CALM in dem Zellkern, aber die vorwiegend zytoplasmatische Lokalisation von dem
leukämischen Fusionsprotein CALM/AF10 wird nicht beeinflusst. Um den Einfluss von
FHL2, CALM und CALM/AF10 aufeinander als Transkriptionsregulatoren zu
analysieren, sind Luciferase Reportergenexperimente durchgeführt worden. Die
Ergebnisse zeigen eine Hemmung der GAL4DBD-FHL2-induzierten
Transkriptionsaktivierung durch gleichzeitige Expression von CALM. Ebenso wurde die
GAL4DBD-CALM/AF10-induzierte Transkriptionsaktivierung stark durch
Koexpression von FHL2 gehemmt. Western-Blot Analyse zeigt, dass FHL2 in weder in
AML, noch in T- oder B-zell Zelllinien experimiert wird. Exprimiert wird FHL2
hingegen in der EBV-transformierten B-Zell Zelllinie L.C.L 3.1, in der B-Zell Lymphom
-Zelllinie Karpas 422 exprimiert sowie in den Cervixkarzinom-, Osteosarkom- und CML-
Zelllinien. Die Micro Array Analyse von dem FHL2 Expressionsniveau in 139 Proben
von Leukämiepatienten und normalen Knochenmark zeigen auf, dass FHL2 in AML mit
komplexem Karyotyp sowie in CML hochexprimiert ist.
Sowohl die hemmende Funktion von CALM auf FHL2 in unserem
Reportergenexperiment, als auch das hohe Expressionsniveau von FHL2 in CML und

6 Zusammenfassung
106
AML mit komplexem Karyotyp, deuten an, dass FHL2 nur bei der Leukämieentstehung
in CALM/AF10 positiven Leukämien sondern auch in einem breiteren Spektrum von
hämatologischen Tumoren eine wichtige Rolle spielt.

7 References
107
7 References
Abdou S.M., Jadayel D.M., Min T., Swansbury G.J., Dainton M.G., Jafer O., Powles R.L., and Catovsky D. 2002. Incidence of MLL rearrangement in acute myeloid leukemia, and a CALM-AF10 fusion in M4 type acute myeloblastic leukemia. Leuk Lymphoma 43:89-95.
Al-Hajj M., and Clarke MF. 2004. Self-renewal and solid tumor stem cells. Oncogene Sep 20;23(43)::7274-82.
Babst M., Odorizzi G., Estepa E.J., and Emr S.D. 2000. Mammalian tumor susceptibility gene 101 (TSG101) and the yeast homologue, Vps23p, both function in late endosomal trafficking. Traffic. Volume 1, :248-258
Bergeron J., Clappier E., Cauwelier B., Dastugue N., Millien C., Delabesse E., Beldjord K, Speleman F., Soulier J., Macintyre E., and Asnafi V. 2006. HOXA cluster deregulation in T-ALL associated with both a TCRD-HOXA and a CALM-AF10 chromosomal translocation. Leukemia. 20:1184-7.
Berkson R., Hollick J., Westwood N., Woods J., Lane D., and Lain S. 2005. Pilot screening programme for small molecule activators of p53. Int J Cancer.
Bhardwaj G., Murdoch B., Wu D., Baker D.P., Williams K.P., Chadwick K., Ling L.E., Karanu F.N., and Bhatia M. 2001. Sonic hedgehog induces the proliferation of primitive human hematopoietic cells via BMP regulation. Nature Immunol. 2:172–180
Bishop N., and Woodman P.G. 2000. ATPase-defective mammalian VPS4 localizes to aberrant endosomes and impairs cholesterol trafficking Mol. Biol. Cell 11.
Blyn L.B, Swiderek K.M, Richards O, Stahl D.C, Semler B.L, and Ehrenfeld E. 1996. Poly(rC) binding protein 2 binds to stem-loop IV of the poliovirus RNA 5' noncoding region: identification by automated liquid chromatography-tandem mass spectrometry. Proc. Natl. Acad. Sci. U.S.A. . 20:11115-20.
Bohlander S.K., Muschinsky V., Schrader K., Siebert R., Schlegelberger B., Harder L., Schemmel V., Fonatsch C., Ludwig W-D., Hiddemann W., and Dreyling M. 2000. Molecular analysis of the CALM/AF10 fusion: identical rearrangements in acute myeloid leukemia, acute lymphoblastic leukemia and malignant lymphoma patients. Leukemia, . Vol 14, :Pages 93-99.
Bonnet D., and Dick J. 1997. Human acute myeloid leukemia is organized as a hierarchy that originates from a primitive hematopoietic cell. Nat Med 3(7):730-7.
Borczuk A., Shah L., Pearson G., Walter K., Wang L., Austin J., Friedman R., and Powell C. 2004. Molecular Signatures in Biopsy Specimens of Lung Cancer. American Journal of Respiratory and Critical Care Medicine 170:167-174.
Calvi L. 2006. Osteoblastic Activation in the Hematopoietic Stem Cell Niche. Ann N Y Acad Sci. 1068:477-88.
Carlson K., Vignon C., Bohlander S., Martinez-Climent J.A., Le Beau M.M., and Rowley J.D. 2000. Identification and molecular characterization of CALM/AF10fusion products in T cell acute lymphoblastic leukemia and acute myeloid leukemia. Leukemia 14:100-104.

7 References
108
Caudell D., Zhang Z., Chung Y., and Aplan P. 2007. Expression of a CALM-AF10 Fusion Gene Leads to Hoxa Cluster Overexpression and Acute Leukemia in Transgenic Mice. Cancer Research. 87:8022-8031.
Chan K., Tsui S., Lee S., Luk S., Liew C., Fung K., Waye M., and Lee C. 1998. Molecular cloning and characterization of FHL2, a novel LIM domain protein preferentially expressed in human heart. Gene. 210:345-350.
Chaplin T., Ayton P., Bernard O., Saha V., Della Valle V., Hillion J., Gregorini A., Lillington D., Berger R., and Young B. 1995. A Novel Class of Zinc Finger/Leucine Zipper Genes Identified From the Molecular Cloning of the t(10; 11) Translocation in Acute Leukemia. Blood 85:1435-41.
Chiravuri M., Schmitz T., Yardley K., Underwood R., Dayal Y., and Huber B. 1999. A novel apoptotic pathway in quiescent lymphocytes identified by inhibition of a post-proline cleaving aminodipeptidase: a candidate target protease, quiescent cell proline dipeptidase. J. Immunol. .
Chu P., Ruiz-Lozano P., Zhou Q., Cai C., and Chen J. 2000. Expression patterns of FHL/SLIM family members suggest important roles in skeletal muscle and cardiovascular system. Mech. Dev. . 95:259–265.
Collier B., Goobar-Larsson L., Sokolowski M., and Schwartz S. 1998. Translational Inhibition in Vitro of Human Papillomavirus Type 16 L2 mRNA Mediated through Interaction with Heterogenous Ribonucleoprotein K and Poly(rC)-binding Proteins 1 and 2. The Journal of Biological Chemistry. 273, No. 35, :22648–22656.
Debernardi S., Bassini A., Jones L., Chaplin T., Linder B., de Bruijn D., Meese E., and Young B. 2002. The MLL fusion partner AF10 binds GAS41, a protein that interacts with the human SWI/SNF complex. Blood 99:275-281.
Demirov D.G., Ono A., Orenstein J.M., and Freed E.O. 2002. Overexpression of the N-terminal domain of TSG101 inhibits HIV-1 budding by blocking late domain function. Proc. Natl. Acad. Sci. USA 99:955-960.
Deshpande A., Cusan M., Rawat V., Reuter H., Krause A., Pott C., Quintanilla-Martinez L., Kakadia P., Kuchenbauer F., Ahmed F., Delabesse E., Hahn M., Lichter P., Kneba M., Hiddemann W., Macintyre M., Mecucci C., Ludwig W.D., Humphries K., Bohlander S., Feuring-Buske M., and Buske C. 2006 Acute myeloid leukemia is propagated by a leukemic stem cell with lymphoid characteristics in a mouse model of CALM/AF10-positive leukemia. Cancer Cell. 10:363-374
DiMartino JF., Ayton PM., Chen EH., Naftzger CC., Young BD., and Cleary ML. 2002. The AF10 leucine zipper is required for leukemic transformation of myeloid progenitors by MLL-AF10. Blood. 99:3780-5.
Dreyling M., Martinez-Climent J., Zheng M., Mao J., Rowley J., and Bohlander S. 1996. The t(10;11)(p13;q14) in the U937 cell line results in the fusion of the AF1O gene and CALM, encoding a new member of the AP-3 clathrin assembly protein family. Proc Natl Acad Sci U S A. . 93(10):4804–4809.
Dreyling M., Schrader K., Fonatsch C., Schlegelberger B., Haase D., Schoch C., Ludwig W.-D., Löffler H., Büchner T., Wörmann B., Hiddemann W., and Bohlander S. 1998. MLL and CALM Are Fused to AF10 in Morphologically Distinct Subsets

7 References
109
of Acute Leukemia With Translocation t(10;11): Both Rearrangements Are Associated With a Poor Prognosis. Blood. Vol. 91:4662-4667.
Dreyling M.H., Schrader K., Fonatsch C., Schlegelberger B., Haase D., Schoch C., Ludwig W-D., Löffler H., Büchner T., Wörmann B., Hiddemann W., and Bohlander SD. 1998. MLL and CALM Are Fused to AF10 in Morphologically Distinct Subsets of Acute Leukemia With Translocation t(10;11): Both Rearrangements Are Associated With a Poor Prognosis Blood. 21:4662-4667.
Dupre S., Volland C., and Haguenauer-Tsapis R. 2001. Membrane transport: ubiquitylation in endosomal sorting. . Curr. Biol., . 11:932–934.
Evans R., and Owen J. 2002. Endocytosis and vesicle trafficking. Current Opinion in Structural Biology. 12:814-821.
Fimia G-M., Cesare D-D., and Sassone-Corsi P. 2000. A Family of LIM-Only Transcriptional Coactivators: Tissue-Specific Expression and Selective Activation of CREB and CREM. Molecular and Cellular Biology 20:8613-8622.
Fimia GM., De Cesare D., and Sassone-Corsi P. 2000. LIM domains: multiple roles as adapters and functional modifiers in protein interactions. Mol Cell Biol. . 20:8613–8622. .
Floyd S., and De Camilli P. 1998. Endocytosis proteins and cancer: a potential link? . Trends in Cell Biology Volume 8,:299-301
Ford M., Pearse B., Higgins M., Vallis Y., Owen D., Gibson A., Hopkins C., Evans P., and McMahon H. 2001. Simultaneous binding of PtdIns(4,5)P2 and clathrin by AP180 in the nucleation of clathrin lattices on membranes. Science. 291:1051-5.
Freyd G., Kim S., and Robert H. 1990. Novel cysteine-rich motif and homeodomain in the product of the Caenorhabditis elegans cell lineage gene lin-11. Nature. 344:876 - 879.
Fröhlich-Archangelo L., Glasner J., Krause A., and Bohlander S. 2006. The novel CALM interactor CATS influences the subcellular localization of the leukemogenic fusion protein CALM/AF10. Oncogene. 25(29).
Fröhlich Archangelo L. 2006. Functional characterization of the CATS gene with respect to its role in normal hematopoiesis and in leukemia. In Faculty of Medicine. Vol. human biology. Ludwig-Maximilians-University, Munich, Germany.
Fuchs E., Tumbar T., and Guasch G. 2004. Socializing with the Neighbors: Stem Cells and Their Niche. Cell 116:769-778.
Gabriel B., Mildenberger S., Weisser C., Metzger E., Gitsch G., Schuele R., and Mueller J. 2004. Focal adhesion kinase interacts with the transcriptional coactivator FHL2 and both are overexpressed in epithelial ovarian cancer. Anticancer Res. . 24(2B):921-7.
Garcia E., Stracher A., and Jay D. 2006. Calcineurin dephosphorylates the C-terminal region of filamin in an important regulatory site: a possible mechanism for filamin mobilization and cell signaling. Arch Biochem Biophys 446(2):140–150.
Garrus, J.E., von Schwedler U.K., Pornillos O.W., Morham S.G., Zavitz K.H., Wang H.E., Wettstein D.A., Stray K.M., Cote M., Rich R.L., Myszka D.G., and Sundquist W. 2001. Tsg101 and the vacuolar protein sorting pathway are essential for HIV-1 budding. . Cell. 107:55-65.

7 References
110
Genini M., Schwalbe P., Scholl F., Remppis A., Mattei M., and Schafer B. 1997. Subtractive cloning and characterization of DRAL, a novel LIM-domain protein down-regulated in rhabdomyosarcoma. DNA Cell Biol. 16(4):433-42
Ghosh A., and Heston W. 2007. Understanding Prostate-Specific Membrane Antigen and Its Implication in Prostate Cancer Humana Press.
Gorlin J., Yamin R., Egan S., Stewart M., Stossel T., Kwiatkowski D., and Hartwig J. 1990 Human endothelial actin-binding protein (ABP-280, nonmuscle filamin): a molecular leaf spring. J Cell Biol 111:1089–1105.
Greif P., Tizazu B., Krause A, Kremmer E., and Bohlander SK. 2007. The leukemogenic CALM/AF10 fusion protein alters the subcellular localization of the lymphoid regulator Ikaros. Oncogene:1-11.
Hill A., and Riley P. 2004. Differential Regulation of Hand1 Homodimer and Hand1-E12 Heterodimer Activity by the Cofactor FHL2. Molecular and cellular biology. 24:9835–9847.
Hinrichsen L., Meyerholz A., Groos S., and Ungewickell E. 2006. Bending a membrane: How clathrin affects budding. PNAS
Horn H., and Vousden K. 2004. Guarding the guardian? Nature. 427 Johannessen M., Møller S., Hansen T., Moens U., and Van Ghelue M. 2006. The
multifunctional roles of the four-and-a-half-LIM only protein FHL2. Cellular and Molecular Life Sciences (CMLS) 63, Number 3 268-284.
Johnson M., Spidel J., Ako-Adjei D., Wills J., and Vogt V. 2005. The C-Terminal Half of TSG101 Blocks Rous Sarcoma Virus Budding and Sequesters Gag into Unique Nonendosomal Structures. J Virol. . 79:3775–3786.
Jones L.K., Chaplin T., Shankar A., Neat M., Patel N., Samuel D.P., Hill A.S., Debernardi S., Bassini A., Young B.D., and Saha V. 2001. Identification and molecular characterisation of a CALM-AF10 fusion in acute megakaryoblastic leukaemia. Leukemia 15 910-914.
Kalthoff C., Alves J., Urbanke C., Knorr R., and Ungewickell E. 2002. Unusual structural organization of the endocytic proteins AP180 and epsin 1 J Biol Chem. 277.
Karlsson O., Thor S., Norberg T., Ohlsson H., and Edlund T. 1990. Insulin gene enhancer binding protein Isl-1 is a member of a novel class of proteins containing both a homeo- and a Cys-His domain. Nature 344:879 - 882
Kim H.L., and Kim J.A. 2000. Purification of clathrin assembly protein from rat liver. Exp Mol Med 32(4)::222-6.
Kim J.A., and Kim H.L. 2001. Cell-free expression and functional reconstitution of CALM in clathrin assembly. Exp Mol Med 33(2)::89-94.
Klebig M., Wall M., Potter M., Rowe E., Carpenter D., and Rinchik E. 2003. Mutations in the clathrin-assembly gene Picalm are responsible for the hematopoietic and iron metabolism abnormalities in fit1 mice Proc Natl Acad Sci USA 100(14)::8360-5
Kobayashi S., Shibata H., Yokota K., Suda N., Murai A., Kurihara I., Saito I., and Saruta T. 2004. FHL2, UBC9, and PIAS1 are novel estrogen receptor alpha-interacting proteins. Endocr Res 617-21.

7 References
111
Kong Y., Shelton J., Rothermel B., Li X., Richardson J., Bassel-Duby R., and Williams R. 2001. Cardiac-specific LIM protein FHL2 modifies the hypertrophic response to beta-adrenergic stimulation. Circulation 103:2731–2738.
Krause A. 2006. Analysis of the Leukemogenic Potential of the CALM/AF10 Fusion Gene in Patients, Transgenic Mice and Cell Culture Models. In Faculty of Veterinary Medicine. Vol. Doctor in Veterinary Medicine. Ludwig-Maximilians-University Munich. 170.
Krause A., Kohlmann A., Haferlach T., Schoch C., Schnittger S., Mecucci C., Ludwig WD., and Bohlander SK. 2004. The CALM/AF10 fusion: Molecular analysis of the fusion transcripts in 13 cases of AML and ALL: Gene expression profiling reveals HOX gene deregulation. . Blood 104:791.
Krempler A., Henry M., Triplett A., and Wagner K-U. 2002. Targeted Deletion of the Tsg101 Gene Results in Cell Cycle Arrest at G1/S and p53-independent Cell Death. The Journal of Biologocial Chemistry. 277, No. 45,:43216–43223.
Kumon K., Kobayashi H., Maseki N., Sakashita A., Sakurai M., Tanizawa A., Imashuku S., and Kaneko Y. 1999. Mixed-lineage leukemia with t(10;11)(p13;q21): an analysis of AF10-CALM and CALM-AF10 fusion mRNAs and clinical features Genes Chromosomes Cancer. 25(1)::33-9.
Labalette C., Renard C., Neuveut C., Buendia M., and Wei Y. 2004. Interaction and functional cooperation between the LIM protein FHL2, CBP/p300 and b-catenin. Mol. Cell. Biol. 24:10689–10702.
Lee S-W., Kim E-J., and Um S-J. 2005. FHL2 mediates p53-induced transcriptional activation through a direct association with HIPK2. Biochemical and Biophysical Research Communications. 339:1056-1062.
Leffers H., Dejgaard K., and Celis J. 1995. Characterisation of two major cellular poly(rC)-binding human proteins, each containing three K-homologous (KH) domains. Eur. J. Biochem. . 2(230):447-53.
Legendre-Guillemin V., Wasiak S., Hussain N., Angers A., and McPherson P. 2004. ENTH/ANTH proteins and clathrin-mediated membrane budding. Journal of Cell Science 117:9-18
Li L., and Cohen S. 1996. Tsg101: a novel tumor susceptibility gene isolated by controlled homozygous functional knockout of allelic loci in mammalian cells. Cell 85:319-329.
Linder B., Gerlach N., and Jäckle H. 2001. The Drosophila homolog of the human AF10 is an HP1-interacting suppressor of position effect variegation. EMBO Rep. . 2(3) 211–216.
Linder B., Newman R., Jones L.K., Debernardi S., Young B.D., Freemont P., Verrijzer C.P., and Saha V. 2000. Biochemical analyses of the AF10 protein: the extended LAP/PHD-finger mediates oligomerisation. Journal of Molecular Biology. Vol 299:369-378.
Lohrum M., and Vousden K. 2000. Regulation and function of the p53-related proteins: same family, different rules. Trends in Cell Biology. 10:197-202.
Lotem J., Netanely D., Domany E., and Sachs L. 2005. Human cancers overexpress genes that are specific to a variety of normal human tissues. Proc Natl Acad Sci U S A. . 102(51)::18556-61.

7 References
112
Maggi l., and Weber J. 2005. Nucleolar Adaptation in Human Cancer. Cancer Invest. . 23:599–608.
Makeyev A., and Liebhaber S. 2002. The poly(C)-binding proteins: A multiplicity of functions and a search for mechanisms. RNA 8:265–278.
Martin M.E., Milne T., Bloyer S., Galoian K., Shen W., Gibbs D., Brock H., Slany R., and Hess J. 2003. Dimerization of MLL fusion proteins immortalizes hematopoietic cells Cancer Cell. 4:197-207.
McCulloch E., and Till J.E. 2005. Perspectives on the properties of stem cells. Nature Medicine 11 1026 - 1028
Metzeler K., Hummel M., Bloomfield CD., Spiekermann K., Sauerland M., Heinecke A., Radmacher M., Marcucci G., Whitman SP., Maharry K., Paschka P., Larson R., Berdel W., Büchner T., Wörmann T., Mansmann U., Hiddemann W., Bohlander S., and Buske C. 2007. An 86-Probe Gene Expression Signature Can Predict Survival in AML with Normal Karyotype Independently of FLT3 ITD and NPM1 Mutation Status - A Collaborative Study from the AMLCG and CALGB Study Groups. Journal of the American Society of Hematology. 110.
Meyerholz A., Hinrichsen L., Groos S., Esk P-C., Brandes G., and Ungewickell E. 2005. Effect of Clathrin Assembly Lymphoid Myeloid Leukemia Protein Depletion on Clathrin Coat Formation. Traffic Vol 6 1225.
Michal J., Zhang Z., Gaskins C., and Jiang Z. 2006. The bovine fatty acid binding protein 4 gene is significantly associated with marbling and subcutaneous fat depth in Wagyu x Limousin F2 crosses. International Society for Animal Genetics. 37:400–402.
Michelsen J.W., Schmeichel K.L., Beckerle M.C., and Winge D.R. 1993. The LIM motif defines a specific zinc-binding protein domain Proc Natl Acad Sci U S A. . 90(10): :4404–4408.
Moore M., Shieh J-H., and Lee G. 2006. Hematopoietic Cells Methods in Enzymology. Volume 418: 208-242
Morgan MJ. , M.A. 1996. Slim defines a novel family of LIM-proteins expressed in skeletal muscle. Biochem Biophys Res Commun. 14;225(2)::632-8.
Morrison S., and Weissman I. 1994. The long-term repopulating subset of hematopoietic stem cells is deterministic and isolatable by phenotype. Immunity. 1:661-673.
Müller J., Isele U., Metzger E., Rempel A., Moser M., Pscherer A., Breyer T., Holubarsch C., Buettner R., and Schüle R. 2000. FHL2, a novel tissue-specific coactivator of the androgen receptor. EMBO Journal. 19:359-369.
Müller J., Metzger E., Greschik H., Bosserhoff A-K., Mercep L., Buettner R., and Roland Schüle. 2002. The transcriptional coactivator FHL2 transmits Rho signals from the cell membrane into the nucleus. The EMBO Journal 21:736–748.
Nakamura F., Maki K., Arai Y., Nakamura Y., and Mitani K. 2003. Monocytic leukemia with CALM/AF10 rearrangement showing mediastinal emphysema. American Journal of Hematology. 72:138-142.
Narita M., Shimizu K., Hayashi Y., Taki T., Taniwaki M., Hosoda F., Kobayashi H., Nakamura H., Sadamori N., Ohnishi H., Bessho F., Yanagisawa M., and Ohki M. 1999. Consistent detection of CALM-AF10 chimaeric transcripts in

7 References
113
haematological malignancies with t(10;11)(p13;q14) and identification of novel transcripts. British Journal of Haematology 105 (4):928–937.
Netzer C., Rieger L., Brero A., Zhang CD., Hinzke M., Kohlhase J., and Bohlander S. 2001. SALL1, the gene mutated in Townes-Brocks syndrome, encodes a transcriptional repressor which interacts with TRF1/PIN2 and localizes to pericentromeric heterochromatin. Hum Mol Genet. 10:3017-24.
Ng E.K., Chan K.K., Wong C.H., Tsui S.K., Ngai S.M., Lee S.M., Kotaka M., Lee C.Y., Waye M.M., and Fung K.P. 2002. Interaction of the heart-specific LIM domain protein, FHL2, with DNA-binding nuclear protein, hNP220. J. Cell. Biochem. . 84:556-566.
Nonet M., Holgado A., Brewer F., Serpe C., Norbeck B., Holleran J., Wei L., Hartwieg E., Jorgensen E., and Aixa A. 1999. UNC-11, a Caenorhabditis elegans AP180 Homologue, Regulates the Size and Protein Composition of Synaptic Vesicles. Mol Biol Cell. :2343–2360.
Nowell, and Hungerford. 1960. A minute chromosome in human chronic granulocytic leukemia. Science 132:1497.
Okada Y., Feng Q., Lin Y., Jiang Q., Li Y., Coffield VM., Su L., Xu G., and Zhang L. 2005. hDOT1L links histone methylation to leukemogenesis. Cell. 121:167-178.
Olson MO. 2004. Sensing cellular stress: another new function for the nucleolus? . J. Cell Biol. . 155:181–185.
Owen D., and Luzio P. 2000. Structural insights into clathrin-mediated endocytosis Current Opinion in Cell Biology 12:467-474.
Perrin L., Bloyer S., Ferraz C., Agrawal N., Sinha P., and Dura Jean M. 2003. The leucine zipper motif of the Drosophila AF10 homologue can inhibit PRE-mediated repression: implications for leukemogenic activity of human MLL-AF10 fusions. Molecular and Cellular Biology. 23:119-130, .
Perrin L., and Dura J.M. 2004. Molecular genetics of the Alhambra (Drosophila AF10) complex locus of Drosophila. Mol Genet Genomics 272(2):156-61.
Piper R., and Luzio J. 2001. Late endosomes: sorting and partitioning in multivesicular bodies. . Traffic. 2:612–621.
Polo S., Pece S., and Di Fiore P. 2004. Endocytosis and cancer Current Opinion in Cell Biology Volume 16,:156-161
Popovic R., and Zeleznik-Le N.J. 2005. MLL: how complex does it get? J Cell Biochem. :234-42.
Qian Z., Mao L., and Lebeau M. 2005. Genetic Pathways in Therapy-Related Leukemia: FHL2 Cooperates with del(5q). Blood (ASH Annual Meeting Abstracts) 106:648 Abstract
Rajasekaran A., Anilkumar G., and Christiansen J. 2005. Is prostate-specific membrane antigen a multifunctional protein? Am J Physiol Cell Physiol 288:975-981.
Rattis F.M., Voermans C., and Reya T. 2004. Wnt signaling in the stem cell niche. Curr Opin Hematol. . 11(4):284.
Reya T., Morrison S.J., Clarke M.F., and Weissman I.L. 2001. Stem cells, cancer, and cancer stem cells. Nature 414:105–111
Rice K., and Licht J.D. 2007. HOX deregulation in acute myeloid leukemia J Clin Invest. . 117:865–868.

7 References
114
Rice KL., Kees UR., and Greene WK. 2008. Transcriptional regulation of FHL1 by TLX1/HOX11 is dosage, cell-type and promoter context-dependent. Biochem Biophys Res Commun. . 367:707-13.
Ritter B., and McPherson P.S. 2004. Molecular mechanisms in clathrin-mediated membrane budding. In Regulatory Mechanisms of Intracellular Membrane Transport. Vol. Volume 10/2004. Springer Berlin / Heidelberg.
Rothbauer U., Zolghadr K., Muyldermans S., Schepers A., Cardoso MC., and Leonhardt H. 2008. A versatile nanotrap for biochemical and functional studies with fluorescent fusion proteins. Mol Cell Proteomics. 7:282-9.
Rowley J.D. 1973. Letter: A new consistent chromosomal abnormality in chronic myelogenous leukaemia identified by quinacrine fluorescence and Giemsa staining. Nature:290-3.
Rowley J.D. 1999. The role of chromosome translocations in leukemogenesis Semin Hematol. 36:59-72.
Rowley J.D. 2000. Molecular genetics in acute leukemia. Leukemia. 14:513-7. Rowley J.D. 2001. Chromosome translocations: Dangerous liaisons revisited. Nature
Reviews Cancer 1:245-250 Rubbi CP., and Milner J. 2003. Disruption of the nucleolus mediates stabilization of p53
in response to DNA damage and other stresses. EMBO Journal. 22:6068-77. Saha V., Chaplin T., Gregorini A., Ayton P., and Young B.D. 1995. The leukemia-
associated-protein (LAP) domain, a cysteine-rich motif, is present in a wide range of proteins, including MLL, AF10, and MLLT6 proteins. Proc Natl Acad Sci U S A 9737–9741.
Salmon-Nguyen F., Busson M., Daniel M., Leblanc T., Bernard O.A., and Berger R. 2000. CALM-AF10 fusion gene in leukemias: simple and inversion-associated translocation (10;11). Cancer Genetics and Cytogenetics. 122:137-140.
Samson T., Smyth N., Janetzky S., Wendler O., Müller J., Schüle R., von der Mark H., von der Mark K., and Wixler V. 2004. The LIM-only proteins FHL2 and FHL3 interact with - and β-subunits of the muscle 7β1 integrin receptor J. Biol. Chem
Scadden D. 2006. The stem-cell niche as an entity of action. Nature 441:1075-1079. Schmeichel K.L., and Beckerle M.C. 1997. Molecular dissection of a LIM domain. Mol
Biol Cell. :219–230. Schmid S. 1997. CLATHRIN-COATED VESICLE FORMATION AND PROTEIN
SORTING:An Integrated Process. Annual Review of Biochemistry. 66:511-548. Schoch C., Kohlmann A., Schnittger S., Brors B., Dugas M., Mergenthaler S., Kern W.,
Hiddemann W., Eils R., and Haferlach T. 2002. Acute myeloid leukemias with reciprocal rearrangements can be distinguished by specific gene expression profiles. Proc Natl Acad Sci U S A 2:10008-10013
Scholl F., McLoughlin P., Ehler E., de Giovanni C., and Schafer B. 2000. DRAL is a p53-responsive gene whose four and a half LIM domain protein product induces apoptosis. J. Cell. Biol. 151:495–506.
Schraets D., Lehmann T., Dingermann T., and Marschalek R. 2003. MLL-mediated transcriptional gene regulation investigated by gene expression profiling. Oncogene 22:3655–3668.

7 References
115
Slany R. 2005. When epigenetics kills: MLL fusion proteins in leukemia. Hematol Oncol 2005; 23: 1–9. 23:1–9.
Soulier J., Clappier E., Cayuela JM., Regnault A., Garcia-Peydró M., Dombret H., Baruchel A., Toribio ML., and Sigaux F. 2005. HOXA genes are included in genetic and biologic networks defining human acute T-cell leukemia (T-ALL). Blood. 106:274-86.
Stier S., Ko Y., Forkert R., Lutz C., Neuhaus T., Grünewald E., Cheng T., Dombkowski D., Calvi L., Rittling S., and Scadden D. 2005. Osteopontin is a hematopoietic stem cell niche component that negatively regulates stem cell pool size J. Exp. Med. . 201:1781-1791.
Suda T., Arai F., and Shimmura S. 2005. Regulation of stem cells in the niche. Cornea 24:12-17.
Tanahashi H., and Tabira T. 2000. Alzheimer’s disease-associated presenilin 2 interacts with DRAL, a LIM-domain protein. Hum. Mol. Genet. :2281–2289.
Tebar F., Bohlander S., and Sorkin A. 1999. Clathrin Assembly Lymphoid Myeloid Leukemia (CALM) Protein: Localization in Endocytic-coated Pits, Interactions with Clathrin, and the Impact of Overexpression on Clathrin-mediated Traffic. Molecular Biology of the Cell. 10:2687-2702.
Thorsteinsdottir U., Kroon E., Jerome L., Blasi F., and Sauvageau G. 2001. Defining Roles for HOX and MEIS1 Genes in Induction of Acute Myeloid Leukemia Molecular and Cellular Biology. 21: 224-234.
Till J.E., and McCullough E.A. 1961. A direct measurement of the radiation sensitivity of normal mouse bone marrow cells. Radiat. Res. 14:213–222.
Uribe R., and Jay D. 2007. A review of actin binding proteins: new perspectives Molecular Biology Reports.
Van Criekinge W., and Beyaert R. 1999. Yeast Two-Hybrid: State of the Art. Biol Proced Online. 2:1-38.
Van Nhieu G.T., Krukonis E., Reszka A., Horwitz A., and Isberg R. 1996. Mutations in the Cytoplasmic Domain of the Integrin b1 Chain Indicate a Role for Endocytosis Factors in Bacterial Internalization. The Journal of Biological Chemistry. 271:7665-7672.
Varnum-Finney B., Xu L., Brashem-Stein C., Nourigat C., Flowers D., Bakkour S., Pear W., and Bernstein I. 2000. Pluripotent, cytokine-dependent, hematopoietic stem cells are immortalized by constitutive Notch1 signaling. Nature Med. . 6:1278–1281
Way J., and Chalfie M. 1988. mec-3, a homeobox-containing gene that specifies differentiation of the touch receptor neurons in C. elegans. Cell. 54(1):5-16
Vecchi M., Polo S., Poupon V., van de Loo J., Benmerah A., and Di Fiore P. 2001. Nucleocytoplasmic shuttling of endocytic proteins J Cell Biol. :1511-7.
Wechsler D.S, Engstrom L.D, Alexander B.M, Motto D.G, and Roulston D. 2003. A novel chromosomal inversion at 11q23 in infant acute myeloid leukemia fuses MLL to CALM, a gene that encodes a clathrin assembly protein. Genes Chromosomes Cancer. 36:26-36.
Weissman I. L. 2000. Stem cells: units of development, units of regeneration, and units in evolution. Cell. 100 (1):157-68.

7 References
116
Wendel H-G., de Stanchina E., Cepero E., Ray S., Emig M., Fridman J., Veach D., Bornmann W., Clarkson B., McCombie R., Kogan S., Hochhaus A., and Lowe S. 2006. Loss of p53 impedes the antileukemic response to BCR-ABL inhibition PNAS. 103:7444-7449
Zech L., Haglund U., Nilsson K., and Klein G. 1976. Characteristic chromosomal abnormalities in biopsies and lymphoid-cell lines from patients with Burkitt and non-Burkitt lymphomas. Int. J. Cancer 17:47–56.
Zhang N., Shen W., Ho AD., and Lu M. 1996. Three distinct domains in the HOX-11 homeobox oncoprotein are required for optimal transactivation. Oncogene. 13:1781-7.
Zhang Y., and Rowley J. 2005. Chromatin structural elements and chromosomal translocations in leukemia. DNA repair. 5:1282–1297.

Curriculum Vitae
117
Curriculum Vitae
ZLATANA PAŠALIĆ Pfingstrosenstrasse 62 • 81377 Munich, Germany•0049-(0)179-876 78 97• [email protected]
Education HELMHOLTZ ASSOCIATION, Munich, Germany Clinical Cooperative Group ‘’Leukemia’’, Ludwig-Maximilians University Department of Medicine III, Grosshadern Hospital Ph.D Candidate, 2003- 2008
• Title: The four and a half LIM domain protein 2 (FHL2) interacts with CALM and is highly expressed in acute myeloid leukemia (AML) with complex aberrant karyotypes
UNIVERSITY OF SKÖVDE Sweden, Germany MSc in Computer Science; Graduated 2003 Master Thesis, EMBL-Hamburg Outstation
• Title: Evaluation of Molecular Replacement using MolRep
Presentations: Z. Pasalic, P. Greif, M. Mulaw, B. Tizazu, L. Fröhlich-Archangelo, S. Bohlander. Helmholz Zentrum- Munich, Germany. The four and a half LIM domain protein 2 (FHL2) interacts with CALM and is highly expressed in AML with complex aberrant karyotpes, Haematologica 2007; 92[suppl.2]:178. Abstract 0480 European Society of Human Genetics (ESHG) Barcelona, Spain
2008 Z. Pasalic, B. Tizazu, M. Mulaw, L. Fröhlich-Archangelo, A. Krause, P. Greif, S. Bohlander. The four and a half LIM domain protein 2 (FHL2) interacts with CALM and is highly expressed in AML with complex aberrant karyotypes. GSF- MEDIII, CCG-Leukemia, Munich-Germany. American Society of Human Genetics (ASHG) San Diego, USA
2007 Z Pasalic. –Method seminar: Yeast two hybrid screening for protein-protein interactions, Sonderforschungsbereich (SFB) Herrsching, Germany
2007 Pasalic Z, Tizazu B., Fröhlich_Archangelo L., Krause A., Greif P., Bohlander S.; The four and a half LIM domain protein 2(FHL2) interacts with CALM and is highly expressed in AML with complex aberrant Karyotypes 18. Jahrestagung der Deutschen Gesellschaft für Humangenetik, Bonn, Germany
2007 Z. Pasalic, B. Tizazu, L. Archangelo, A. Krause, P. Greif, and S.K. Bohlander. The Four and a Half LIM Domain Protein 2 (FHL2) Interacts with CALM and is highly expressed in AML with complex aberrant karyotypes. Blood (ASH Annual Meeting Abstracts), Nov 2006; 108: 4337. Z. Pasalic, B. Tizazu, S. Bohlander. The four and a half LIM domain protein 2 (FHL2) interacts with CALM, 10th congress of the European Hematology Society Stockholm-Sweden
2005

Curriculum Vitae
118
Pasalic Z., Tizazu B, Bohlander S. The Four and a Half LIM domain protein FHL2 interacts with CALM, 16. Jahrestagung der Deutschen Gesellschaft für Humangenetik gemeinsam mit der Österreichischen Gesellschaft für Humangenetik und der Schweizerischen Gesellschaft für Medizinische Genetik,
Halle/Saale, Germany 2005
Workshops ReMaT-Research management training Sweden
2008 Nationales Genomforschungsnetz-NGFN, Course in Practical DNA Microarray analysis Germany
2008 European School of Genetic medicine in Bertinoro di Romagna, 7th course in Bioinformatics for Molecular Biologists Italy
2007 EUCOMM/GSF training event: Protection and Commercialization of Intellectual Property Germany
2006
Experience University of Skövde, Sweden Student Ambassador 1999-2000 The primary task was to promote the University at education fairs, job centres etc. all over Sweden, but also receive assemblies of academic visits who arrive in order to get more information about the university Voluntary work University of Skövde, Sweden
• Department of Computational Science, University of Skövde, Sweden Elected class representative 2000-2002 • Studentkåren i Skövde (student´s union) 2000 Elected member of authorized representative (1 mandate) • Department of Nature Science, University of Skövde 1999-2000 Elected member of “institutionsnämnden”. Institutionsnämnden is the executive group of the
department and consists of 5 professors and 2 students. The student representatives pass on the opinions of students to theprofessors and vice versa. Among the fields where institutionsnämnden operates is the distribution of the budget of the department or forming the educational programs that will be offered at the department.
• Dataföreningen vid Högskolan i Skövde (Student´s computer Association) Elected member of the party committee 1997-1998
Other work experiences Eriksdalskolan, Primary and secondary school, Classes 1-10 Skövde,Sweden Worked as a substitute teacher 2002-2003 Bosnisk-Hercegovinska Kvinnoförbundet, Skövde, Sweden (Bosnia-Herzegovinas National Assocation for Women) 1994-2000 Co-worker in the magazine ”Kvinna-Zena” (Woman Swe-Bos)