Embed Size (px)
Citation preview

EMPLOYMENT RELATIONS RESEARCH SERIES 122
The Fourth Work-Life Balance Employee Survey
SARAH TIPPING, JENNY CHANFREAU, JANE PERRY AND CLARE TAIT
NATCEN
JULY 2012

About Labour Market Analysis Labour Market Analysis (LMA) is a multi-disciplinary team of economists, social researchers and statisticians, based in the Labour Market Directorate of the Department for Business, Innovation and Skills (BIS).
Our role is to provide the evidence base for good policy making in employment relations, labour market and equality and discrimination at work. We do this through:
Conducting periodic benchmark surveys
Commissioning external research reports
Conducting in-house research and analysis
Assessing the regulatory impact of new employment laws
Monitoring and evaluating the impact of government policies
We publicly disseminate the results of this research through the BIS Employment Relations Research Series and other publications. For further details of the team’s work, including PDF versions of all our publications, please see our web pages at:
www.bis.gov.uk/policies/employment-matters/research
Published in July 2012 by the Department for Business, Innovation and Skills (BIS) © Crown Copyright 2012
URN 12/P151 ISBN 978-0-85605-769-4
Please contact us at [email protected] if you would like to receive regular email updates on our research, new publications and forthcoming events. Enquiries should be addressed to this e-mail address or to:
Labour Market Analysis Team Department for Business, Innovation and Skills Level 3, Abbey 2 1 Victoria Street, London SW1H 0ET
The views expressed in this report are the authors’ and do not necessarily reflect those of the Department or the Government.
ii

Foreword
This publication was produced in June 2012 and at this time the Department for Business, Innovation and Skills (BIS) leads work to build a dynamic and competitive UK economy by creating the conditions for business success, promoting innovation, enterprise and science and giving everyone the skills and opportunities to succeed. To achieve this, we will foster world-class universities and promote an open global economy.
Within the Department, the Labour Market Analysis team provides the evidence and information that underpins policy making and delivery in the Labour Market Directorate. This involves an extensive programme of analysis, research and evaluation on areas including domestic and European employment legislation; labour market flexibility and diversity; employment and industrial relations; and monitoring developments in Acas and other organisations in the employment relations area.
The project on which this report is based is funded under the Labour Market Analysis’ research programme, and co-sponsored by the Government Equalities Office (GEO). The report provides the findings of the Fourth Work-life Balance (WLB4) Employee Survey, which was carried out in early 2011. It benchmarks key policy changes since the 2006 survey (WLB3), including the Work and Families Act 2006, that is the extension of the ‘right to request’ flexible working to parents of children under the age of 17 (2009) and to co-resident carers (2007).
We hope you find it of interest. Electronic copies of this and all other reports in our Employment Relations Research Series (ERRS) can be downloaded from the BIS website (we have discontinued publishing printed copies).
Bill Wells
Deputy Director, Labour Market Analysis
Department for Business, Innovation and Skills
iii

Acknowledgements All the individuals who took part in the survey deserve our sincere thanks for their time, help and enthusiasm. At the Department for Business, Innovation and Skills, we would like to thank Jane Carr, Hulya Hooker and Kate Millward for their support and valuable feedback at various stages in the study.
A number of NatCen colleagues have contributed to the project, and we would like to extend our thanks to Peyman Damestani, Chris Massett and all the NatCen interviewers who worked on the survey.
iv

Contents Foreword .........................................................................................................iii
Glossary of abbreviations and acronyms ......................................................xiv
Glossary of terms .......................................................................................... xv
Executive summary......................................................................................... 1
Aims and objectives ................................................................................................ 1
Background ............................................................................................................. 2
Headline findings..................................................................................................... 2
About this project..................................................................................................... 8
About the authors .................................................................................................... 9
1. Introduction ............................................................................................... 10
1.1 Background to the study.................................................................................. 10
1.2 Aims and objectives ........................................................................................ 11
1.3 Methodology.................................................................................................... 12
1.4 Report content................................................................................................. 16
1.5 Interpreting the results..................................................................................... 16
2. Hours or work and annual leave................................................................ 18
2.1 Introduction...................................................................................................... 18
2.2 Hours of work .................................................................................................. 18
2.3 Overtime.......................................................................................................... 23
2.4 On call working................................................................................................ 30
2.5 Satisfaction with hours of work........................................................................ 34
2.6 Annual leave.................................................................................................... 35
v

2.7 Summary ......................................................................................................... 41
3. Work-life balance practices and policies ................................................... 43
3.1 Introduction...................................................................................................... 43
3.2 Awareness....................................................................................................... 43
3.3 Perceived availability in the workplace............................................................ 46
3.4 Take-up ........................................................................................................... 58
3.5 Requests and outcomes.................................................................................. 67
3.6 Who employers seem to prioritise ................................................................... 75
3.7 Summary ......................................................................................................... 76
4. Attitudes to work-life balance .................................................................... 78
4.1 Importance of availability of flexible working arrangements ............................ 78
4.2 Consequences of working flexibly ................................................................... 84
4.3 Satisfaction with current working arrangements.............................................. 90
4.4 Attitudes to work-life balance practices ........................................................... 92
4.5 Summary ......................................................................................................... 97
5. Parents and carers .................................................................................... 99
5.1 Characteristics of parents and carers.............................................................. 99
5.2 Working time disrupted by child(ren)’s illness ............................................... 101
5.3 Antenatal appointments – fathers’ leave arrangements ................................ 104
5.4 Parental leave ............................................................................................... 105
5.5 Time off for dependants ................................................................................ 106
5.5 Childcare ....................................................................................................... 107
5.6 Summary ....................................................................................................... 110
vi
6. The flexible worker .................................................................................. 112
6.1 Introduction.................................................................................................... 112
6.2 Characteristics of flexible workers................................................................. 112
6.3 Work-life balance of flexible workers............................................................. 117
6.4 Employment relations of flexible workers ...................................................... 121
6.5 Attitudes by flexible worker status ................................................................. 122
6.6 Flexible working of employees without the legal right to request flexible working124
6.7 Summary ....................................................................................................... 127
References.................................................................................................. 129
Annex A: Methodology ................................................................................ 130
Background ......................................................................................................... 130
The sample.......................................................................................................... 130
Cognitive testing of new questions...................................................................... 131
Pilot 132
Response rates ................................................................................................... 133
Weighting ............................................................................................................ 135
Comparisons with previous surveys.................................................................... 136
How the analysis was conducted and tested ...................................................... 137
Annex B: Description of the sample ............................................................ 139
Annex C: Supplementary tables.................................................................. 144
Annex D: Multivariate output ....................................................................... 398
Annex E: Correlations of take-up ................................................................ 402
Employment Relations Research Series ..................................................... 408
Tables and Figures
vii

Table 1.1 True response rates by sample type ........................................................ 15
Figure 2.1: Usual hours worked ............................................................................... 19
Figure 2.2: Usual hours worked by flexible worker status ........................................ 22
Figure 2.3: Flexible working practices related to long hours..................................... 23
Figure 2.4: Trends in the proportion of employees working paid/unpaid overtime ... 24
Figure 2.5 Reasons for working overtime, for those who worked overtime .............. 26
Figure 2.6 Trends in the main reasons given for working overtime. ......................... 27
Figure 2.7 Reasons for working overtime, whether paid or unpaid. ......................... 28
Figure 2.8 Frequency of on call working................................................................... 32
Figure 2.9 Average hours per calendar month spent on call .................................... 33
Figure 2.10 Satisfaction with working hours ............................................................. 34
Figure 2.11 Annual paid holiday entitlement (excluding bank holidays) for full and part-time employees ................................................................................................ 36
Figure 2.12: Reasons given for not taking full leave entitlement .............................. 39
Figure 3.1: Perceived availability of flexible working arrangements in employees’ workplace ................................................................................................................. 47
Figure 3.2: Number of flexible working arrangements perceived to be available in the workplace ................................................................................................................. 57
Figure 3.3: Take-up of flexible working arrangements in the last 12 months............ 59
Figure 3.4: Requested changes to working arrangements ....................................... 68
Figure 3.5: Outcome of requests to change working arrangements......................... 70
Figure 3.6: Proportion of requests declined by type of change requested................ 71
Figure 3.7: Proportion of responses received by each form of communication ........ 72
Figure 3.8: Who dealt with the employee’s request for changes to their work arrangements ........................................................................................................... 73
Figure 3.9: Reasons given by employees for not requesting changes to their work arrangements ........................................................................................................... 74
Figure 3.10: Employee groups felt to be given priority in flexible working requests . 76
Figure 4.1 Importance of flexible working when initially deciding to take job by industry..................................................................................................................... 80
viii

Figure 4.2 Importance of flexible working - initially and now .................................... 82
Figure 4.3 Positive consequences of employee working flexibly.............................. 85
Figure 4.4 Negative consequences of employee working flexibly ............................ 86
Figure 4.5 Positive consequences of colleagues’ working flexibly ........................... 87
Figure 4.6 Negative consequences of colleagues’ working flexibly.......................... 88
Figure 4.7 Satisfaction with working arrangements.................................................. 91
Figure 4.8: Attitudes to work-life balance practices .................................................. 92
Figure 5.1 Arrangements made to cover disruption ............................................... 102
Figure 5.2 Number of antenatal appointments attended ........................................ 105
Figure 5.3 Forms of childcare support available..................................................... 108
Figure 6.1: Flexible working practices by full- and part-time status ........................ 113
Figure 6.2: Levels of satisfaction with working hours: parents and joint parents/carers............................................................................................................................... 118
Figure 6.3: Levels of satisfaction with working hours: mothers and fathers............ 119
Figure 6.4: Levels of satisfaction with current working arrangements: mothers and fathers .................................................................................................................... 120
Figure 6.5: Relations between managers and employees by flexible working ....... 121
Figure 6.6: Agree that employers have a responsibility to help people with work-life balance................................................................................................................... 122
Figure 6.7: Agree that employees who work flexibly create more work for others.. 123
Figure 6.8: Agree that employees who work flexibly are less likely to get promoted............................................................................................................................... 124
Figure 6.9: Take up of flexible working practices by entitled and non-entitled groups............................................................................................................................... 125
Table A1.1 Fieldwork outcomes by sample type .................................................... 133
Table A1.2 True response rates by sample type.................................................... 134
Table A1.3 Weights produced for WLB4 ................................................................ 136
Table B1.1 Comparison of WLB4 and the LFS ...................................................... 139
Table B1.2 Comparison of WLB4 and the LFS: Parents of 0-5 year olds............... 140
ix

Table B1.3 Comparison of WLB4 and the LFS: Parents of 6-17 year olds............. 141
Table B1.4 Comparison of WLB4 and APMS: Carers ............................................ 143
Table C2.10 Reasons for not taking leave ............................................................. 195
Table C3.9 Perceived flexible working practices available in the workplace - Work reduced hours for a limited period................................................................. 225
Table C3.10 Perceived flexible working practices available in the workplace - Work flexitime ...................................................................................................... 229
Table C3.11 Perceived flexible working practices available in the workplace - Job-share ...................................................................................................... 233
Table C3.12 Perceived flexible working practices available in the workplace – Compressed working week .................................................................................... 237
Table C3.13 Perceived flexible working practices available in the workplace – Work only during school-term................................................................................. 241
Table C3.14 Perceived flexible working practices available in the workplace – Work from home on a regular basis ....................................................................... 245
Table C3.15 Perceived flexible working practices available in the workplace – Work annualised hours........................................................................................... 249
Table C3.16 Number of flexible working arrangements perceived to be available in the workplace – none, 1 or more............................................................................ 253
Table C3.17 Number of flexible working arrangements perceived to be available in the workplace – 0 to 2, 3 or more........................................................................... 257
Table C3.18 Take-up of flexitime working .............................................................. 261
Table C3.19 Take-up of flexitime working among parents ..................................... 264
Table C3.20 Take-up of flexitime working among carers ....................................... 265
Table C3.21 Take-up of regularly working from home............................................ 266
Table C3.22 Take-up of regularly working from home among parents................... 269
Table C3.23 Take-up of regularly working from home among carers..................... 270
Table C3.24 Take-up of part-time working in last 12 months ................................. 271
Table C3.25 Take-up of part-time working among parents .................................... 274
Table C3.26 Take-up of part-time working among carers ...................................... 275
Table C3.27 Take-up of annualised hours working ................................................ 276
x

Table C3.28 Take-up of annualised hours working among parents ....................... 279
Table C3.29 Take-up of annualised hours working among carers ......................... 280
Table C3.30 Take-up of school term-time working................................................. 281
Table C3.32 Take-up of school term-time working among carers .......................... 285
Table C3.33 Take-up of compressed hours working.............................................. 286
Table C3.34 Take-up of compressed hours working among parents ..................... 289
Table C3.35 Take-up of compressed hours working among carers ....................... 290
Table C3.36 Take-up of temporarily reduced hours working.................................. 291
Table C3.37 Take-up of temporarily reduced hours working among parents ......... 294
Table C3.38 Take-up of temporarily reduced hours working among carers ........... 295
Table C3.39 Take-up of job-share working ............................................................ 296
Table C3.40 Take-up of job-share working among parents.................................... 299
Table C3.41 Take-up of job-share working among carers...................................... 300
Table C3.42 Made a request to change regular working arrangements in the past 2 years ...................................................................................................................... 301
Table C3.43 Outcome of request to change working arrangements in last two years............................................................................................................................... 305
Table C3.44 Communication of outcome of request .............................................. 309
Table C3.45 Reason for not making request to work change working arrangements............................................................................................................................... 313
Table C4.1 Importance of availability of flexible working arrangements when initially deciding to work for employer ................................................................................ 318
Table C4.2 Importance of availability of flexible working arrangements when initially deciding to work for employer - parents ................................................................. 322
Table C4.3 Importance of availability of flexible working arrangements when initially deciding to work for employer - carers ................................................................... 323
Table C4.4 Importance of availability of flexible working now ................................ 324
Table C4.5 Importance of availability of flexible working now - parents ................. 328
Table C4.6 Importance of availability of flexible working arrangements now - carers............................................................................................................................... 329
xi

Table C4.7 Satisfaction with current working arrangements .................................. 330
Table C4.8 Attitudes towards work-life balance: It is not the employer's responsibility to help people balance their work and life .............................................................. 334
Table C4.9 Parents' attitudes towards work-life balance: It is not the employer’s responsibility to help people balance their work and life......................................... 338
Table C4.10 Attitudes to work-life balance: Having more choice in working arrangements improves workplace morale............................................................. 339
Table C4.11 Parents' attitudes towards work-life balance: Having more choice in working arrangements improves workplace morale ............................................... 343
Table C4.12 Attitudes to work-life balance: People who work flexibly create more work for others. ...................................................................................................... 344
Table C4.13 Parents' attitudes towards work-life balance: People who work flexibly create more work for others. .................................................................................. 348
Table C4.14 Attitudes to work-life balance: People who work flexibly are less likely to get promoted. ......................................................................................................... 349
Table C4.15 Parents' attitudes towards work-life balance: People who work flexibly are less likely to get promoted................................................................................ 354
Table C5.1 Characteristics of parents by age of child ............................................ 355
Table C5.2 Characteristics of carers by type of responsibility ................................ 359
Table C5.3 Whether working time disrupted by child's illness in past 3 months..... 362
Table C5.4 Arrangements when working time disrupted due to child’s illness in past 3 months ................................................................................................................ 366
Table C5.5 Whether father took time off for antenatal appointments ..................... 371
Table C5.6 How many antenatal appointments were attended and how time off was taken (fathers) ........................................................................................................ 372
Table C5.7 Parental leave in past 12 months......................................................... 373
Table C5.8 Time off to care for dependants in past 12 months.............................. 376
Table C5.9 Type of childcare support provided by employer ................................. 380
Table C6.1 Flexible working by full-time employees .............................................. 387
Table C6.2 Flexible working by part-time employees............................................. 391
Table C6.3 Flexible working by full-time employees who do not have the legal right to flexible working....................................................................................................... 395
xii

Table D1.1 Results of logistic regression - characteristics associated with full-time flexible working....................................................................................................... 398
Table D1.2 Results of logistic regression - characteristics associated with part-time flexible working....................................................................................................... 400
Table D1.3 Results of logistic regression - characteristics associated with flexible working of full-time employees without the legal right to flexible working ............... 401
Table E1.1 Correlation of take up of flexible working arrangements ...................... 402
Table E1.2 Correlation of take up of flexible working arrangements by parents..... 404
Table E1.3 Correlation of take up of flexible working arrangements by carers....... 406
xiii

Glossary of abbreviations
and acronyms
AML Additional Maternity Leave
BIS Department for Business, Innovations and Skills
CATI Computer-assisted telephone interviewing
ERWS Employment Rights at Work Survey
LFS Labour Force Survey
MPRS Maternity and Paternity Rights Survey
NatCen National Centre for Social Research
RDD Random Digit Dialling
SIC Standard Industrial Classification
SMP Statutory Maternity Pay
SOC Standard Occupation Classification
SPP Statutory Paternity Pay
TOIL Time off in lieu
TPS Telephone Preference Service
TU Trade Union
WLB Work-life balance
WLB1 First Work-Life Balance Study
WLB2 Second Work-Life Balance Study
WLB3 Third Work-Life Balance Employee Survey
WLB4 Fourth Work-Life Balance Employee Survey
xiv

xv
Glossary of terms
Annualised hours Where the number of hours an employee has to work is calculated over a full year, e.g. instead of 40 hours a week, employees are contracted to work 1,900 hours per year (after allowing for leave and other entitlements).
Compressed hours Where an employee works full-time hours over a fewer number of days in their working week. For example, working a 40 hour week over four days, or working a nine-day fortnight (also called compressed working week (CWW)). This is not the same as shift-working.
Flexitime Where an employee can vary their start and finish times but have an agreement to work a set number of hours per week or per month. This may be informally or formally agreed.
Job-share This is a type of part-time working where a full-time job is divided, usually between two people. The employees sharing the job work at different times, although there may be a changeover period. Sharers each have their own contract of employment and share the pay and benefits of a full- time job on a pro rata basis.
Non-flexible worker One of the categories of ‘flexible worker status’, this is an employee who does not work (or has not done in the past 12 months) any of the eight flexible working arrangements.
Part-time work Defined for this survey as working less than 30 hours a week.
Part-time worker One of the categories of ‘flexible worker status’, this is an employee who works (or has done so in the past 12 months) on a part-time basis.
Reduced Where an employee has an agreement to cut their hours hours for a for a set period of time (e.g. a month, six months) and limited period then return to their original working hours.
Term-time working Where an employee works only during school term times.
Working from home Situation where an employee regularly works all, or some of, their time at home.

Executive summary
The Fourth Work-Life Balance Employee Survey was conducted in early 2011. It found that the majority of employees were satisfied with their hours and current working arrangements. Levels of awareness of the right to request flexible working were high; 75 per cent of all employees, 73 per cent of employees with non-childcare caring responsibilities and 79 per cent of parents were aware of the right, rising to 82 per cent for parents of young children.
Flexitime, working from home and part-time working were the forms of flexible working most commonly taken up by employees. The views of employees regarding flexible working were generally positive. The vast majority of employees agreed that having more choice in working arrangements improves morale (90 per cent), although over one third (35 per cent) thought that people who work flexibly create more work for others. The availability of flexible working was important for just over two in five employees (41 per cent) when they made their decision to work for their current employer. Those with flexible working arrangements were more likely to work long hours, suggesting that such practices facilitate greater labour market involvement.
Around three out of every ten parent employees reported some disruption to their working time due to child illness in the last three months. This was most commonly dealt with by taking leave (47 per cent), followed by working flexibly (30 per cent). Even among those without a flexible working arrangement, 17 per cent were able to respond to their child’s illness by working flexibly.
Aims and objectives
The main aims of the Fourth Work-Life Balance Employee Survey were:
To ascertain the demand for work-life balance practices and employee perceptions of the availability of such practices in their workplace.
To assess take-up of work-life balance practices including reasons for non-take-up (e.g. impact on job security and promotion).
To ascertain employees’ views on both the benefits and detrimental effects of flexible working.
To ascertain employees’ views on the impact of work-life balance practices, including the impact on employee commitment, and the employment relations climate.
To examine entitlements and take-up of paid annual leave and other forms of emergency and parental leave.
To explore weekly working hours in terms of number of hours worked, paid and unpaid overtime and number of days off.
1

Background
The Department for Education and Employment carried out the first Work-Life Balance Survey (WLB1) in 2000. It was used to assess how far employers operated work-life balance practices and whether employees felt that existing practices met their needs. The first survey was followed up in 2003 by a second survey of employees (WLB2) and by a third in early 2006. The fourth Work-Life Balance Survey (WLB4) was carried out in early 2011. It benchmarks key policy changes since the 2006 survey including the Work and Families Act 2006, that is the extension of the ‘right to request’ flexible working to parents of children under the age of 17 (2009) and to co-resident carers (2007).
Headline findings
Working hours
Employees were asked to report the usual number of hours they worked per week in their main paid job, excluding meal times, overtime and any on call working. On average, employees worked 34 hours in a usual working week. Seventy-four per cent of employees usually worked 30 hours or more per week, with six per cent working over 48 hours. Twenty-six per cent of employees worked less than 30 hours per week.
There were a number of notable differences in the number of hours worked between particular groups of employees. Unsurprisingly, working less than 30 hours per week was more common among women (40 per cent), but also among those aged under 25 (39 per cent) and those aged 60 or over (40 per cent), those without managerial responsibilities (33 per cent) and those in routine/manual/intermediate occupations (36 - 37 per cent). Working more than 48 hours per week was more common among men (ten per cent), those with higher qualifications (15 per cent among those with a postgraduate degree), those with higher incomes (24 per cent of those with an income of £40k or higher), those working in the private sector (seven per cent) and those in male dominated workplaces (ten per cent).
Those with flexible working practices were more likely to work longer hours than those without (ten per cent compared with six per cent among full-time employees), suggesting that such practices facilitate greater labour market participation. Working longer hours was particularly notable among full-time employees who regularly worked from home (18 per cent working more than 48 hours), and part-time employees who worked flexitime and those who had had temporarily reduced hours (19 per cent and 34 per cent respectively working 35 to 40 hours).
Overtime
Forty-eight per cent of all employees reported that they had worked overtime in a usual week, 44 per cent stated whether this was paid, unpaid or both. Of these employees, half (49 per cent) were not paid for working overtime. Working unpaid overtime was predominantly driven by workload demands. It was more common among those with higher qualifications (81 per cent of those with a postgraduate degree and 60 per cent among those with a degree), higher levels of personal
2

income (82 per cent of those with incomes of £40k or more), those in managerial positions (63 per cent), full-time employees (54 per cent), and public sector workers (62 per cent).
Paid overtime was driven by workload demands and the desire to make more money. Working paid overtime only was more common among part-time employees (49 per cent), private sector workers (42 per cent), those working in manufacturing (55 per cent) and in distribution, retail, hotels, and restaurants (56 per cent).
On call working
Seventeen per cent of employees said they were required to work on call in their current job. On call working was more common among men (21 per cent), those with high personal earnings (24 per cent of those with income of £40k or more), full-time employees (19 per cent), those with managerial responsibilities (24 per cent) and those with flexible working (22 per cent among those working full-time).
Employees who spent longer on call, typically spent a smaller proportion of that on call time actually working. On call employees who were solely based in the workplace spent fewer hours on call in total than those with less workplace contact when on call.
Annual leave
The mean number of paid holidays (excluding bank holidays) varied by the number of hours worked; full-time employees reported an average of 27 days’ paid leave and part-time employees reported an average of 21 days of annual leave.
Among full-time employees, those who are older, employees in managerial and professional occupations, those who had been with their employer longer, those with flexible working and employees on a permanent contract tended to have greater leave entitlement. Differences were also evident by industry. Among part-time employees, however, higher personal income and trade union membership were linked with greater entitlements.
Not all employees used their full leave entitlement, with only 76 per cent doing so. Men (73 per cent), those on a higher income (59 per cent), those working full-time with a flexible working arrangement (69 per cent) and those with higher qualifications (68 per cent) were among those less likely to use full entitlement. The largest single reason given by employees for not using full leave entitlement was ‘work pressures’ (34 per cent). The majority of employees (70 per cent) who had not taken their full leave entitlement were compensated by their employer (most often by carrying the entitlement forward).
Right to request and availability of flexible working
The majority of employees (75 per cent) were aware of the right to request flexible working, with awareness, unsurprisingly, being more common among parents (79 per cent). Awareness was also higher among those in managerial/professional occupations (85 per cent) with particularly low awareness among those in routine or manual occupations (64 per cent).
3

Availability of flexible working
Part-time working was the most commonly available form of flexible working (reported by 80 per cent of employees), followed by temporarily reduced hours (56 per cent) and flexitime (48 per cent).
The availability of many forms of flexible working was most commonly reported by women, those with higher qualifications, those in managerial/professional occupations, public sector employees, trade union members or those whose pay and conditions were agreed between the employer and a union.
There were notable differences by industry. Employees in public administration, education and health and those within banking, insurance, professional and support services most commonly reported the availability of flexible working. The reverse was true for those in manufacturing and construction.
The availability of flexible working was more likely to be reported among those employees in workplaces where there was a relatively equal gender split or the employees were mostly women.
Take up of flexible working
Flexitime, working from home and part-time working were the forms of flexible working most commonly taken up by employees (taken up by 49 per cent, 44 percent and 40 per cent of those where it was available to them, respectively).
The take up of many forms of flexible working was more common among women, parents, those with higher qualifications, those in the public sector and trade union members. However, the patterns of take up for part-time working, reduced working hours and job share were somewhat different in some respects, such as being more likely among those in routine or manual occupations and employees who are not trade union members.
Less than a quarter of employees (22 per cent) had requested a change to their working arrangement in the last two years, most commonly a change to when they work, including number of days (35 per cent) or a reduction in hours (23 per cent). Women, parents and carers were most likely to have made a request (with 28, 27 and 30 per cent doing so, respectively). In the majority of cases, the request was accepted (79 per cent) and the outcome communicated face to face (76 per cent).
Those who had not requested a change to their working arrangement typically had not done so for personal reasons, such as being happy with their current arrangement (84 per cent). However, there was a proportion (15 per cent) who had not done so due to reasons related to the business/employer, which may be real or perceived.
Importance of flexible working
The majority of employees were satisfied with their current working arrangements (85 per cent, with 37 per cent very satisfied). High levels of satisfaction were more
4
common amongst those working part-time (45 per cent very satisfied) and those with other flexible working arrangements (46 per cent of part-time, flexible employees and 40 per cent of full-time, flexible employees were very satisfied).
The availability of flexible working was important or very important for 41 per cent of employees when they made their decision to work for their current employer. When asked about the importance to them now (at the time of the interview), 57 per cent of employees reported that the availability of flexible working was very or quite important to them now.
Flexible working was, both when taking the job and at the time of the survey interview, more important to women, employees who were parents and those with caring responsibilities. Among these groups, 32-33 per cent thought that the availability of flexible working was very important when they made their decision to work for their employer and 40-42 per cent thought it was very important at the time of the interview. It was also most important to those actually working part-time or having some other flexible working arrangement at the time of the interview.
The gender differences in the importance of flexible working were significant across all employees, among parent employees and among those with caring responsibilities.
There were also significant differences by industry. The availability of flexible working was least important to those in the manufacturing and construction industries.
Consequences of flexible working
The main advantages of flexible working for those who had done so were an increase in the amount of free time (cited by 24 per cent), increased time spent with family (18 per cent), improved work-life balance (17 per cent) and greater convenience (14 per cent). Nearly half (48 per cent) of those working flexibly did not feel that there were any negative consequences of doing so. Lower pay was the most frequently cited negative consequence (18 per cent).
Those employees who mentioned one or more flexible working arrangements being available in their workplace were then asked if any of their colleagues worked in these ways and if so, asked to comment on the positive and negative consequences for them of their colleagues working flexibly. Over half of employees with colleagues working flexibly did not think that this had positive or negative consequences for them personally (55 per cent and 57 per cent, respectively). However, a better working atmosphere (14 per cent) and staff flexibility (seven per cent) were most frequently cited as positive consequences. A lack of interaction between staff (nine per cent), colleagues being unavailable (nine per cent) and increased workload (eight per cent) were the most commonly cited negative consequences.
These views were echoed in the attitudes of all employees towards work-life balance practices. The vast majority of employees agreed that having more choice in working arrangements improves morale (90 per cent). However, around one third of all employees (35 per cent) thought that people who work flexibly create more work for others.
5

Around one quarter of employees (26 per cent) thought that it was not the employers’ responsibility to help people balance their work and life. This was more common among those employees with no qualifications (36 per cent), in routine and manual occupations (33 per cent) and those with low household incomes (31 per cent among those with an income of less than £15k). These groups were also less likely to view the availability of flexible working as important and more likely to agree that people working flexibly create more work for others.
Around one third of employees (32 per cent) believed that people working flexibly were less likely to get promoted. This view was most commonly held by those not working flexibly (38 per cent), men (37 per cent), those in routine and manual occupations (36 per cent), those in managerial and profession occupations (33 per cent) and those in the private sector (35 per cent).
Parental leave
By law parents are entitled to take unpaid leave of up to 13 weeks to look after their child within the first 5 years after the birth. Only 11 per cent of parents with children under six had taken parental leave. This may reflect a lack of need to use this entitlement or their ability/preference to use other paid options to accommodate parenting responsibilities.
By law an employee can take unpaid leave at short notice during working hours when a dependant falls ill or is injured or because of unexpected disruption or incident during their care. Almost one in five employees had taken time off for a dependant in the last 12 months. This was most common among parents and those with caring responsibilities. Those employees who had been with their employer less than 12 months were less likely to take this.
Around three out of every ten parent employees (29 per cent) reported some disruption to their working time due to child illness in the last three months. This was more common among the parents of younger children (34 per cent) and lone parents (35 per cent) or dual-earner parent couples (30 per cent). It was least common among those parents in routine or manual occupations (22 per cent). The issue was most commonly dealt with by parents taking some form of leave (with or without arranging alternative childcare). Those without a flexible working arrangement (40 per cent), trade union members (42 per cent) and those in the public sector (34 per cent) were most likely to take leave.
Thirty per cent of parents with an ill child responded by working flexibly (including home working) and this was more common among men (35 per cent), those in managerial/professional occupations (35 per cent) and private sector employees (36 per cent). Even among those without a flexible working arrangement, 17 per cent were able to respond to their child’s illness by working flexibly.
Around half of employees with children aged under six (54 per cent) said that the father had taken time off to attend antenatal appointments. This was more common in households with higher income (65 per cent of those employees on household with income in excess of £45,000) and dual earner families (60 per cent). Most commonly the fathers took additional paid leave (39 per cent), annual leave (29 per cent) or time off in lieu (24 per cent) to attend these.
6

Childcare
Over half of parent employees (57 per cent) worked for employers who provided no support with childcare, with one third (33 per cent) receiving financial support and one tenth (ten per cent) workplace childcare. Some form of support was more commonly reported among employees with higher qualifications (55 per cent of those with degrees and 57 per cent of those with postgraduate degrees), with managerial responsibilities (49 per cent), in higher occupational groups (55 per cent of those in managerial/professional occupations) and with higher income (56 per cent of those with a household income of £45,000 or above). The provision of some form of support was also associated with working in the public sector (59 per cent), being a trade union member (50 per cent), having longer service (46-48 per cent among those with five years service or more) and working in larger workplaces (63-66 per cent among those working for employers with 250 or more employees). It was less common among those working in certain industries: manufacturing, construction, distribution, retail hotel and restaurant industries (23-30 per cent).
Flexible workers
Part-time employees were more likely than their full-time counterparts to take up all other forms of flexible working where available. The most common form of flexible working for both groups was flexitime.
Working flexibly was more common among full-time employees who were older (aged between 40 and 49), were parents or carers, had higher qualifications, higher incomes and had managerial responsibilities. Working flexibly was also more likely among trade union members, those full-time employees with contracts of employment, those working in professional occupations, in large workplaces and in the public sector. Once other factors were accounted for using multivariate analysis, flexible working for full-time employees is positively associated with being older, well educated, in a professional occupation, working in a mixed gender or female-dominated workplace and in industries outside manufacturing and distribution, retail, hotels and restaurants.
Among part-time employees, working flexibly in other ways was more likely among higher earners, those with managerial responsibilities, trade union members, those in managerial and professional occupations and in the public sector. Unlike full-time employees, part-time employees were more likely to work flexibly if they were in male-dominated workplaces. Multivariate analysis showed that, among part-time flexible workers, working in male-dominated workplaces and the public sector were positively associated with working flexibly once other factors were controlled for, as was higher personal income.
For parent employees (who were not carers) and those who were both parents and carers, satisfaction with working hours varied significantly according to their flexible working status. Levels of satisfaction were higher amongst part-time working parents and lower for those working full-time (including full-time flexible workers). This was true for both mothers and fathers and those employees with joint parent/caring responsibilities. Satisfaction with current working arrangements varied according to the type of flexible working undertaken by the employee. Part-time flexible workers had highest levels of satisfaction of all the groups. This was true when looking at all
7

employees and for the following sub-groups: mothers, fathers and parents who did not have additional caring responsibilities.
Employees with flexible working were more likely than employees without flexible working to report good working relations between employees and managers within their workplace. Full-time flexible workers were more likely (64 per cent) than part-time flexible workers (50 per cent) and non-flexible workers (54 per cent) to agree or strongly agree with the statement ‘It’s the employer’s responsibility to help people balance their work with other aspects of their life’.
Employees who are neither parents nor carers do not currently have the legal right to request flexible working. Unsurprisingly, rates of flexible working among this group were lower than those for parents or carers.
Full-time employees without the legal right to request flexible working were more likely to work flexibly if they were older (46 per cent of those aged 40 to 49), had higher qualifications (62 per cent of employees with a postgraduate degree), were higher earners (60 per cent of those who earned £40,000 or more), were trade union members (44 per cent) and in managerial or professional occupations (48 per cent). They were also more likely to work flexibly if they worked in the public sector (52 per cent), in mixed gender workplaces (44 per cent) and had a contract of employment (37 per cent). Controlling for other factors, the findings of the multivariate analysis confirmed that, among full-time employees without a legal right to request flexible working, being well educated, in better paid employment, working in a female dominated or mixed gender workplace and working in the public sector were significant predictors for flexible working.
About this project
This research was carried out as part of the Department for Business, Innovation and Skills (BIS) Employment Relations Research Series. The report presents findings from the Fourth Work-Life Balance Employee Survey (WLB4), conducted in early 2011 amongst individuals aged 16 and over living in Great Britain and working as employees. Individuals who were self-employed or proprietors were not eligible for the survey. The survey included a boost of employees that were parents and employees with non-child caring responsibilities. The research was carried out by the National Centre for Social Research (NatCen) using Computer-Assisted Telephone Interviewing (CATI). A total of 2,767 telephone interviews were conducted in February and March of 2011.
The data from this survey will be archived with the UK Data Archive www.data-archive.ac.uk/. An accompanying technical report containing details of the sample design, survey protocols and questionnaire, will be published alongside the data.
Some comparisons are made in this report between findings from WLB4 and previous Work-Life Balance Surveys. These findings should be treated with caution due to changes over years in methodology and question wording.
8

About the authors
Sarah Tipping and Clare Tait are Research Directors at NatCen. Sarah works as a Survey Statistician and specialises in sample design and weighting methods. Clare works in the Income and Work Team, specialising in survey research around employment and all aspects of income. Jenny Chanfreau is a Senior Researcher (Analyst) in the Income & Work team at NatCen and works on quantitative analysis projects. Jane Perry is a freelance research associate working with NatCen on a number of analytical projects.
9
1. Introduction
1.1 Background to the study
In 2000, the Government launched the Work-Life Balance Campaign aimed at employers to promote the benefits of flexible working for all employees. This campaign aimed to promote flexible working for all types of employee, and was not specifically aimed at individual groups such as parents or carers.
The Employment Act (2002) introduced the right for employees with a child aged five or under (18 or under for disabled children) to request flexible working, with their employer having the duty to consider this request. This ‘right to request’ was extended in the Work and Families Act (2006) to include employees caring for sick or disabled adult household members (effective from 2007) and parents of children under the age of 17 (effective from 2009).
The following sets out the current provisions relating to work-life balance:
Maternity rights. Employed mothers are entitled to 52 weeks of statutory maternity leave (26 weeks’ ordinary maternity leave and 26 weeks of additional maternity leave which starts after ordinary maternity leave). Since April 2007, pregnant employees who meet qualifying conditions based on their length of service and average earnings are entitled to receive from their employers up to 39 weeks Statutory Maternity Pay (SMP), which is paid at 90 per cent of a mother’s full pay for the first six weeks and a flat rate (currently £135.45) for the remaining 33 weeks. Maternity allowance is also available to low-paid mothers and self-employed mothers, providing they meet certain criteria, and is paid at the flat rate for a period of 39 weeks.
Paternity rights. Employed fathers who have been with their employer a minimum period are entitled to up to two consecutive weeks of paternity leave and Statutory Paternity Pay (SPP) to care for their baby or to support the mother in the eight weeks after the birth. Statutory Paternity Pay is paid at the same flat rate paid to mothers. This applies to both biological and adoptee fathers. Since April 2011, after the survey was conducted, Additional Paternity Leave and Pay (APL&P) has been introduced allowing fathers up to 26 weeks’ leave if their partner is returning to work, of which up to 13 weeks can be paid.
Adoptive rights. An eligible employee who is adopting a child is entitled to 52 weeks of adoption leave, comprising 26 weeks ordinary adoption leave and a further 26 weeks’ additional adoption leave. During the ordinary adoption leave, employees who meet qualifying conditions based on their length of service and average earnings are entitled to receive from their employers up to 39 weeks Statutory Adoption Pay (SAP), which is paid at the same flat rate as maternity pay.
Parental leave entitlements. Employed parents with a child aged under five have the right to unpaid parental leave if they have at least one year of continuous service with their employer. This allows them to take up to 13 weeks of leave before their child’s fifth birthday or the fifth anniversary of the adoption placement with the
10

employee (or their 18th birthday if that occurs first). Employed parents with a disabled child aged under 18 have the right to take up to 18 weeks of leave before the child’s 18th birthday.
Parents and carers’ right to request flexible working. Employees have the right to ask for a flexible working pattern if they have worked for their employer for 26 weeks and have parental responsibility for a child aged under 17 (or under 18 if the child has a disability), or have adult caring responsibilities for a close relative or someone within the household. There have been two key changes since the last Work-life Balance Survey of Employees: the extension of the right to request flexible working to include employees with adult caring responsibilities from April 2007, and the inclusion of employees with children aged six to 16 in April 2009 (previously eligibility was restricted to those with children aged under six).
Time off for dependants in an emergency. Employees have the right to a reasonable amount of unpaid time off work to deal with emergencies involving a 'dependant'. This includes spouses, partners, children, parents, or anyone living in the household as a member of the family. A dependant may also be anyone who reasonably relies on the employee for help in an emergency. The right does not include an entitlement to pay.
The first Work-Life Balance Survey (WLB1) was conducted in 2000 and used to provide baseline measure of the availability of work-life balance practices and whether employees felt that existing practices met their needs. The second and third surveys conducted in 2003 and early 2006 examined changes during this period.
As noted above, there have been a number of significant changes in provision since then. However, there has been little information available to assess their impact, in particular the right for co-resident carers to request flexible working, as noted in the report Work and Families Act 2006 Evaluation Report (2010).
The Fourth Work-Life Balance survey (WLB4) was carried out in early 2011. As such it plays an important role in developing our understanding of how the changes introduced by the Work and Families Act are influencing employees’ working arrangements, whether they take up these opportunities and their general awareness of what is available to them in the workplace. In light of the more recent announcement of plans to further encourage flexible working arrangements (including the extension of the right to request flexible working to all employees), this survey provides baseline figures about the current use of flexible working arrangements in Britain, against which the impact of any policy changes can be assessed.
1.2 Aims and objectives
The main aims of WLB4 were:
To ascertain the demand for work-life balance practices and employee perceptions of the availability of such practices in their workplace.
To assess take-up of work-life balance practices including reasons for non-take-up (e.g. impact on job security and promotion).
11
To ascertain employees’ views on both the benefits and detrimental effects of flexible working.
To ascertain employees’ views on the impact of work-life balance practices, including the impact on employee commitment, and the employment relations climate.
To examine entitlements and take-up of paid annual leave and other forms of emergency and parental leave.
To explore weekly working hours in terms of number of hours worked, paid and unpaid overtime and number of days off.
1.3 Methodology
This section gives an overview of the methodology used to conduct WLB4. Further details are given in Annexes A and B and in a technical report to accompany the survey, which will be published on the UK Data Archive1 alongside the dataset.
Sample design
The sample for WLB4 comprised a core sample plus two boost samples. The core sample was designed to be representative of all employees (that is, individuals who were not self-employed or proprietors) aged 16 years or over and living in Britain. The two boost samples each covered an employee sub-group of specific interest, namely: working parents of children aged 0-17 years and employees with non-child caring responsibilities.
The survey was conducted using Computer-Assisted Telephone Interviewing (CATI) and administered by interviewers from NatCen’s Telephone Unit. A sample of telephone numbers was generated using Random Digit Dialling (RDD). This is an efficient method of producing a random sample of telephone numbers and ensures non-listed numbers and households that have signed up to the Telephone Preference Service are included. Phone numbers covered all regions across Britain.
The sample was split into core and boost telephone numbers prior to being issued to interviewers. For numbers flagged as core sample, interviewers were instructed to screen for households with employees aged 16 or over. For numbers flagged as boost sample, interviewers were instructed to screen for employees who were aged 16 or over and were either a carer or a parent.
Questionnaire development
The WLB4 questionnaire was based on that used for WLB3. The questionnaire was modified and a number of new questions were added to allow the specific aims of the 2011 survey to be addressed. The questionnaire was split into the following sections:
1 www.data-archive.ac.uk/.
12

Section A: Background information
Section B: Hours of work
Section C: Work-Life Balance Practices and Policies
Section D: Holidays and Time off work
Section E: Carers
Section F: Childcare
Section G: About your employer
Section H: About your job
Section I: About you
Section A covered the questionnaire introduction and background information such as parent and carer status. This information was needed to route the employee to relevant questions later in the interview.
Section B covered the usual hours worked by employees, whether they worked paid or unpaid overtime, and if so, the amount they worked and the reasons for working overtime. It also covered details about any on call working and whether they were satisfied with their working hours. This section also collected information on the length of time the employees had worked for their employer, whether they had a written contract and whether their job was permanent or temporary.
Section C covered work-life balance practices and policies. This section asked employees whether they were aware of the right to request flexible working, whether they were satisfied with their current working arrangements, and whether they had made any requests to change their normal working arrangement. If so, employees were asked how they made the request, who dealt with it, whether it was agreed to and whether they had appealed the decision. Section C then went on to ask what working arrangements were available at the employees’ place of work, whether they worked any of these arrangements and the positive and negative consequences of doing so. The working arrangements of colleagues were also asked about, along with the consequences for the employees of these. Employees were asked why they used particular working arrangements, or why they did not make use of them, whether they would like any of these arrangements and whether their job could be done by someone working any of these arrangements. The final questions in this section covered employee attitudes. Employees were asked whether they felt their employers treated everyone the same when responding to requests to work flexibly, whether they did enough to promote work-life balance for their employees, and how important the availability of flexible working was to employees.
Section D covered holidays, time off in an emergency and parental leave. Employees were asked whether they had taken time off at short notice to deal with an emergency involving a dependant, how much time they had taken and the reasons for taking different types of leave (for example, as paid or unpaid leave).
13

They were also asked about parental leave and leave for antenatal appointments. Finally, they were asked about their paid holiday entitlement and the holiday they had taken in their last leave year.
Section E asked employees about their caring responsibilities. This section included questions on whether the employee cared for an adult and if that adult lived with them. Section F concerned childcare. Employees were asked whether their employer provided any form of childcare.
Section G asked about the employer: whether relations between employees and their managers was good, the gender mix of their workplace and whether they agreed to statements such as the extent of employer responsibilities for their employees’ work-life balance and the impact of flexible working on the workplace.
Finally, Sections H and I collected more information about the employee’s job and personal characteristics.
The full questionnaire is included in the technical report for this survey.
New questions were tested using cognitive methods. The Questionnaire Development and Testing Hub (QDT Hub) at NatCen reviewed and cognitively tested 30 questions between September and October 2010 to test how the questions worked with the survey population. These questions collected information on:
identifying employees with significant parental responsibilities; the extent employees feel they have control over the hours they work; employees’ working arrangements when they make requests to change their
working patterns; the outcome of requests to change the way employees work and how
employees are informed of initial and appeal decisions; perceptions of equality of opportunity at the workplace to request flexible
working; the range of flexible working practices available at the workplace and the
impact of colleagues working in this way on the employee; the need and take up of dependant leave; the need and take up of parental leave; how working fathers arrange leave to attend antenatal appointments; and how working parents manage child care arrangements for their children.
The findings from the cognitive testing fed into the development of the final WLB4 questionnaire. The new questionnaire was piloted to provide information on the interview length, consider the flow of the questionnaire, identify areas for improvement in question wording or interviewer instructions and highlight any routing issues. The piloting was carried out after the cognitive testing to allow new questions to be incorporated. Thirty CATI interviews were conducted by interviewers from NatCen’s Telephone Unit as part of the pilot.
14

Fieldwork
Fieldwork was carried out in the February and March of 2011. Table 1.1 shows the true response rates for the core and boost samples. The true response rate is calculated as the number of achieved interviews divided by the total number of eligible households. This includes households with known eligibility, plus the estimated number of eligible households at numbers where interviewers could not establish eligibility. For example, 46 per cent of households in the core sample with known eligibility were eligible, hence 46 per cent (4,332) of the 9,479 households in the core sample with unknown eligibility were assumed to be eligible. Therefore the total number of eligible households in the core sample was estimated to be 8,441 (4,332 + 4,109) and the true response rate for the core sample was 22 per cent (1,873 divided by 8,441).
Table 1.1 True response rates by sample type Estimated true response rate Total (core +
boost) Core Cases Boost Cases
Issued cases 65000 31823 33177 Invalid and non-residential numbers 27114 13353 13761 Total with known eligibility 18393 8991 9402Number of ineligible 11195 4882 6313Number of eligible 7198 4109 3089% eligible 39% 46% 33% Total with unknown eligibility 19493 9479 10014Number of unknown eligible likely to be eligible 7628 4332 3290 Estimated total number eligible (those with known eligibility plus estimated number with unknown eligibility) 14826 8441 6379Number of productive interviews 2765 1873 892Estimated true response rate 19% 22% 14%
1 Two partials were included in the final dataset: The final dataset contains 2767 cases - 1874 core and 893 boost.
Source: WLB4 2011
Interviewers conducted 2,767 interviews in total. This broke down as 1,874 core sample interviews plus 893 additional boost interviews. The boost interviews were combined with similar employees from the core sample during analysis. The combined samples gave 829 carers and 1,373 parents of children aged 0-17.
Weights
The survey required weights to adjust for differential selection probabilities of individuals within households and non-response to the survey. A set of weights were generated for analysis of the core and boost samples. The aim is to reduce non-
15

response bias resulting from differential non-response to the interview by age, sex, Standard Industry Classification (SIC) and sector. The weights were generated using calibration methods. More details are given in Annex B.
1.4 Report content
Chapter 2 explores hours of work and annual leave. It looks at the usual hours worked by employees, levels of employee satisfaction with their hours, overtime and on call working, and annual leave entitlement and take-up.
Chapter 3 provides an analysis of employee awareness of the right to flexible working. The perceived availability and take-up of flexible working practices is examined. It then looks in more detail at employee requests to flexible working and their outcomes.
Chapter 4 examines employees’ attitudes to flexible working. It explores how important flexibility was when employees initially took up their jobs and how important it is to them now. It looks at the consequences of flexible working arrangements on employees and their colleagues. Employees’ satisfaction with their current working arrangements is explored. The chapter closes by examining wider attitudes to flexible working.
Chapter 5 focuses on parents and carers. It explores the use of parental leave, time-off for children’s illnesses and father’s time off for antenatal appointments. It examines time-off taken for dependants in emergencies and closes with an examination of childcare support available to parents through their employers.
Chapter 6 examines the flexible worker in more detail. It identifies the defining characteristics of flexible workers and looks at levels of satisfaction of flexible workers with their employment relations and work attitudes. It concludes with an investigation into the take up of flexible working arrangements by full-time employees who do not have a legal right to flexible working.
1.5 Interpreting the results
The tables in the report contain the total number of unweighted cases in the whole sample, or in the particular group being analysed, and the base for different columns (e.g. employees working different hours). The base for the tables include all eligible respondents (i.e. all respondents or all respondents who were asked a particular question), minus missing cases. Therefore, while the base description might be the same across several tables (e.g. all part-time employees), the base sizes might differ slightly due to the exclusion of missing cases. Due to rounding, percentages may not add up to exactly 100 per cent. In some instances key breaks have been collapsed due to small sample sizes. Where this occurs, it is flagged in the table footnotes in the appendix.
Unless stated otherwise, when differences are reported in the text, these differences are statistically significant, at 95 per cent confidence interval or above. These
16

differences are shaded in the tables. The following symbols have been used in tables:
[ ] to indicate a percentage based on fewer than 50 unweighted cases
* percentages based on fewer than 25 unweighted cases are not shown
(blank) to indicate that no respondents gave that answer
0 to indicate a percentage value of less than 0.5 per cent.
17

2. Hours or work and
annual leave
2.1 Introduction
Working Time Regulations state that an adult employee cannot be forced to work more than 48 hours per week; for those aged 15-17 and over compulsory school age, working hours are limited to 40 hours per week. In addition employees have a statutory entitlement to 28 days of paid leave per year (which may include public holidays).
This chapter investigates hours of work and annual leave. It starts by discussing the ‘usual hours of work’ reported by employees and levels of employee satisfaction with their hours. Overtime and amount of time spent on call are then examined, before looking at annual leave entitlement and take up.
All reported differences are statistically significant unless otherwise stated.
2.2 Hours of work
Employees were asked to report the ‘usual number of hours’ they worked per week in their main paid job excluding meal times, overtime and any on call working. On average, employees worked 34 hours in a usual working week. Just under half (44 per cent) worked more than 35 and up to 40 hours and around a quarter (26 per cent) worked up to 30 hours. Nine per cent or employees worked 40 to 48 hours in a usual working week, six per cent worked more than 48 hours, with two per cent working more than 55 hours. Figure 2.1 shows a breakdown of usual hours worked2.
2 The distribution was compared with figures from quarter 1 of the Labour Force Survey, which covers the same reporting period as WLB4. While there are some differences in the actual figures, the overall patterns are very similar, with the majority of employees working more than 35 and up to 40 hours per week (LFS = 33 per cent, WLB4 = 44 per cent), followed by employees working fewer than 30 hours per week (LFS = 29 per cent, WLB4 = 26 per cent). Only a small proportion in either group worked more than 55 hours per week (LFS = four per cent, WLB4 = two per cent). It should be noted that there were some differences in question wording between the two surveys (LFS included on call working in their totals).
18

Figure 2.1: Usual hours worked
Usual hours w orked
92
4
26
15
44
0
5
10
15
20
25
30
35
40
45
50
< 30 hours 30 - 35 hours >35 - 40 hours >40 - 48 hours >48 - 55 hours >55 hours
Per
cen
tBase: All employees
Unweighted base: 1,867 Source: WLB4 2011
Employees working fewer than 30 hours per week were split evenly between those working 20 to 29 hours and those working fewer than 20 hours; hence 13 per cent of all employees worked fewer than 20 hours per week.
There were significant differences in the usual number of hours worked by employee’s sex, age, level of highest qualification, income (both personal and household), flexible worker status, managerial responsibilities, socio-economic group, industry, sector and gender make up of the workplace (Table C2.1 in Annex C). These differences are described in more detail below.
Men were more likely to work long hours. One in ten (ten per cent) male employees worked more than 48 hours per week, compared with two per cent of female employees. Women were more likely to work part-time, with 40 per cent women working fewer than 30 hours per week, compared with 13 per cent of men.
Younger (under 25 years) and older (60 years or over) employees were more likely to work part-time, with 39 per cent of younger employees and 40 per cent of older employees doing so. Employees aged 50 to 59 years were most likely to work longer hours; 11 per cent of employees in this age group worked more than 48 hours in a usual week, compared with one per cent of employees aged under 25.
19
Long hours were associated with higher qualification levels. Fifteen per cent of employees with a postgraduate degree worked more than 48 hours in a usual week, compared with three per cent for employees with no qualifications, GCSEs only or A levels.
Higher incomes were also associated with longer hours. Twenty-four per cent of employees with a personal income of £40,000 or more worked more than 48 hours in a usual week, compared with less than one per cent of employees earning below £10,000.
Employees with managerial responsibilities were less likely to work part-time. Fifteen per cent worked fewer than 30 hours per week, compared with a third (33 per cent) of employees without managerial responsibilities.
Professional and managerial employees were less likely to work part-time. Fourteen per cent of these employees worked fewer than 30 hours per week, compared with 37 per cent of employees from intermediate and 36 per cent of routine and manual occupations.
Employees in the private sector were more likely to work longer hours. Seven per cent of private sector employees worked more than 48 hours in a usual working week, compared with four per cent of public sector employees.
Employees in manufacturing were much more likely to work full-time, with 83 per cent of employees in this industry working between 35 and up to 48 hours in a usual week. Employees in distribution, retail, hotels and restaurants were most likely to work part-time, with nearly half (46 per cent) working less than 30 hours.
Employees in male dominated workplaces were most likely to work full-time or do long hours (ten per cent work more than 48 hours per week, 12 per cent work fewer than 30 hours per week), followed by employees in workplaces where the gender split is roughly equal (six per cent worked more than 48 hours per week, 27 per cent worked fewer than 30 hours per week) and employees in female dominated workplaces (three per cent worked more than 48 hours per week, 38 per cent worked fewer than 30 hours per week).
In summary, working longer hours (more than 48 hours per week) was more common among men, those with higher qualifications, those with higher incomes, those working in the private sector and those in male dominated workplaces. Working fewer than 30 hours per week was more common among women, those aged under 25 and those aged 60 or over, those without managerial responsibilities and those in routine, manual and intermediate occupations.
There were also differences by flexible worker status. These are discussed more fully below.
The association between ‘usual hours’ and flexible worker status was investigated separately for full and part-time workers. Employees were considered to be flexible workers if they did at least one of the following:
20

Worked part-time (fewer than 30 contracted hours per week) in the past year3
Worked only during school term-time Job-shared, where a full-time job is divided between 2 or more people
and they work at different times Worked flexitime, where the employee has no set start or finish time but
an agreement to work a set number of hours per week or per month Worked reduced hours for a limited period, where the employee has
an agreement to cut their hours for a set period of time such as a month or six months
Worked from home on a regular basis, where the employee works all or some part of the time from home as part of their working hours
Worked a compressed working week, where the employee works their contracted hours over a fewer number of days
Worked annualised hours, where the number of hours the employee has to work is calculated over a full year rather than a week or month
Employees working full-time but with flexible working practices (i.e. employees who had listed any of the above flexible working practices other than part-time hours) were more likely to work 48 hours or more in a usual working per week. Ten per cent of this group did so, compared with six per cent of those without flexible working.
Part-time workers with other, additional, flexible working practices were more likely to work longer hours than part-time workers without additional flexible working practices. Flexible workers with contracted part-time hours were more likely to work more than 35 and up to 40 hours in a usual week; 12 per cent worked these hours, compared with five per cent of contracted part-time workers without flexible working. This is shown in Figure 2.2.
3 There is no specific definition of part-time hours. This definition was used to retain measurement consistency.
21

Figure 2.2: Usual hours worked by flexible worker status
8373
11
12
18 17
5
61 59
15
10 612
9
0%
20%
40%
60%
80%
100%
Part-time only Part-time and flexibleworking
Flexible working otherthan part-time
No part-time or flexibleworking
Per
cen
t
< 30 hours 30 - 35 hours >35 - 40 hours >40 - 48 hours 48+Base: All employees
Unweighted base: 1,656 Source: WLB4 2011
In order to identify what was driving these differences, the types of flexible working practices taken up by full- and part-time employees were investigated in more detail. This is shown in Figure 2.3. It was found that:
Full-time employees who worked regularly from home were significantly more likely to work long hours (48 hours or more) in a usual week; 18 per cent, compared with six per cent of those who did not.
Flexitime, annualised hours, compressed hours, temporarily reduced hours, working school term only and job shares were not significantly related to the number of hours worked in a usual week for full-time employees.
Part-time employees who had worked temporarily reduced hours or flexitime in the last year worked longer hours than part-time employees without flexible working arrangements. Thirty-four per cent of part-time employees, who had temporarily reduced their working hours in the past year, worked 35 to 40 hours in a usual week, compared with six per cent of part-time employees who had not temporarily reduced their working hours. Similarly, 19 per cent of part-time employees who also worked flexitime over the past year worked 35 to 40 hours in a usual week, compared with eight per cent of part-time employees without flexitime.
Annualised hours, compressed hours, working from home, working school term only and job-shares were not significantly related to the number of hours worked in a usual week for part-time employees.
22

Figure 2.3: Flexible working practices related to long hours
55
8271
84
11
12
10
8
14 16
34
6
198
6066
7
10186
0%
20%
40%
60%
80%
100%
Yes No Yes No Yes No
PT employees - worked temporarilyreduce hours in past year
PT employees - worked flexitime FT employees - worked from homein past year
Per
cen
t
<30 hours 30 - 35 hours >35 - 40 hours >40 - 48 hours > 48 hours
Unweighted bases: Part-time employees where flexitime is available = 292 Part-time employees where temp reduced hours is available = 344 Full-time employees where working from home is available = 367 Source: WLB4 2011
The characteristics of flexible workers are investigated more fully in Chapter 6.
2.3 Overtime
Employees were asked for the number of hours paid and unpaid overtime they worked in a usual week. Forty-four per cent of employees provided the information about their overtime in a usual week4. Of these employees, half (49 per cent) were not paid for working overtime, just over a third (36 per cent) had been paid for all the overtime worked and the remaining 15 per cent did a mixture of both paid and unpaid overtime. A comparison with WLB3 and WLB4 suggests an increase in the proportion of unpaid overtime amongst employees working overtime, although differences in the methodology used to select respondents in previous survey years mean this cannot be tested for statistical significance. These figures, along with those from WLB3 and WLB2 are shown in figure 2.4.
4 Employees were asked whether or not they worked overtime and how many hours they worked (paid and unpaid) in a usual week; 48 per cent of employees stated that they had worked overtime in their main job, 44 per cent of employees stated whether this was paid, unpaid or both.
23

Figure 2.4: Trends in the proportion of employees working paid/unpaid overtime
15 17
3640 43
4943
14
43
0%
20%
40%
60%
80%
100%
WLB4 WLB3 WLB2
Per
cen
t
Both paid and unpaid Paid only Unpaid onlyBase: All employees doing overtime
Unweighted base: WLB4 = 737, WLB3 = 1364, WLB2 = 1068 Source: WLB4 2011; IES/ICM 2006, Stevens et al 2004
Type of overtime worked
Differences exist in the type of overtime worked (worked paid overtime only, unpaid overtime only or a mixture of paid and unpaid) by employee characteristics (Table C2.2):
Compared with other age groups, employees aged between 40 and 49 years were more likely to work unpaid overtime only; 59 per cent of employees in this age group were in this category, compared with 56 per cent of employees aged 50 to 59 years, 48 per cent of employees aged 25 to 39 years and 50 per cent of employees aged 60 or over. Twenty-six per cent of employees aged between 50 and 59 worked paid overtime only, compared with 28 per cent of employees aged 40 to 49 years, 37 per cent of employees aged 25 to 39 years and 35 per cent of employees aged 60 or over.
Eighty-one per cent of employees with a postgraduate degree and 60 per cent with a degree worked unpaid overtime only, compared with 29 per cent of employees whose highest qualifications were GCSEs or A levels.
Eighty-two per cent of employees with a personal annual income of £40,000 or more worked unpaid overtime only, compared with 22 per cent of employees with a personal annual income under £10,000.
Sixty-three per cent of managers worked unpaid overtime only, compared with 36 per cent of non-managers.
24

Sixty-nine per cent of managerial and professional employees worked unpaid overtime only, followed by 42 per cent of those in intermediate and 18 per cent in routine and manual occupations.
Full-time employees were more likely to work unpaid overtime, with 54 per cent doing so, compared with 32 per cent of part-time employees. Part-time employees were more likely to do paid overtime only. Half (49 per cent) of the part-time employees that worked overtime were paid for all the overtime they did, compared with a third (32 per cent) of full-time employees.
Full-time flexible workers were more likely to do unpaid overtime only, 71 per cent, compared to 24 per cent of employees who worked part-time with no other flexible working arrangements.
Sixty-two per cent of public sector employees worked unpaid overtime only and 21 per cent worked paid overtime only. The comparative figures for private sector workers were 44 per cent for unpaid overtime only and 42 per cent for paid overtime only.
Employees in manufacturing and distribution, retail, hotels and restaurants were most likely to work paid overtime only with just over a half of each group falling in this category (55 per cent for manufacturing and 56 per cent for distribution, etc). Twenty-five per cent of employees in banking, insurance, professional and support services and 25 per cent of employees in public administration, education and health did paid overtime only.
Half (50 per cent) of employees working fewer than 30 hours in a usual week worked paid overtime only, compared with around a third (33-34 per cent) of employees working more than 30 and up to 48 hours .
In summary, higher paid workers, older workers, managerial workers, those working full-time and those working in the public sector do more unpaid overtime.
Hours of overtime worked
Employees were asked to give the number of hours they spent doing paid and unpaid overtime in a usual week. On average, employees who worked any paid overtime worked an additional 6.2 hours5 in a usual week. Employees who worked any unpaid overtime did 6.6 extra hours. Both these figures are a reduction on the previous WLB3 which reported 6.38 and 7.03 hours respectively, although differences in the methodology used to select respondents in previous survey years mean this cannot be tested for statistical significance
Employees who only did unpaid overtime generally worked a greater number of hours in total in a usual week; on average they worked 45 hours in total (once usual hours and overtime were combined), compared with 40 hours for employees doing
5 Excludes any respondents who said they did overtime but reported zero hours.
25

paid overtime only and 42 hours for employees doing a combination of paid and unpaid overtime.
Respondents were asked to cite their main reason for working overtime. The reasons given are shown in Figure 2.5.
Figure 2.5 Reasons for working overtime, for those who worked overtime
Reasons for w orking overtime
19
7
3
2
2
1
1
15
3
27
19
0 5 10 15 20 25 30
Other
Meet deadlines/f inish job
Make more money (overtime)
Nature of job/role
Too much w ork
Staff shortages
Nature of the business
Employer expects it
I like my job
To help business succeed
Business travel
Percent
Base: All employees working overtime
Unweighted base: 927 Source: WLB4 2011
The reasons given were split into three categories: workload demands, organisational culture and personal choice as follows:
Workload demands To meet deadlines/finish job/fulfil client/customer requirement I have too much work to finish in my normal working hours Nature of job/role Staff shortages, absences, sickness Meetings/training/events/specific task(s) Business travel To help the business succeed
Organisational culture Nature of the business/company culture My employer expects it/encourages it My colleagues all work more hours
Personal choice To make more money (overtime)
26

I like my job Other
Unspecified reasons, Insufficient information to code
The majority (71 per cent) of employees cited reasons related to workload demands as the main motive for working overtime. This group comprised employees who worked overtime to meet deadlines or finish things off (27 per cent), employees who said it was the nature of their role (19 per cent), employees who had too much work to do (15 per cent), employees who worked overtime due to staff shortages (seven per cent) and employees who worked overtime in order to complete specific tasks, including business travel (one per cent).
Five per cent of employees cited reasons that came into the category of work culture as the main motive for their overtime. This included employees who worked overtime because it was the nature of the business or company they worked for (three per cent), employees who said their employer expected/encouraged it (two per cent) and employees who worked overtime because their colleagues did it (less than one per cent).
Twenty-one per cent of employees cited personal reasons. Employees who worked overtime to make additional money (19 per cent) made up the bulk of this group alongside a smaller number of employees who said liking their job was their main reason for working overtime (two per cent). The remaining three per cent cited ‘other’ unspecified reasons. These employees are dropped from the remaining analysis to make it comparable to WLB2 and WLB3.
A comparison with previous WLB surveys suggests an increase in employees citing workload demands as their main reason for working overtime. This is shown in Figure 2.6.
Figure 2.6 Trends in the main reasons given for working overtime.
73
61
6
1514
2130
56
25
0%
20%
40%
60%
80%
100%
WLB4 WLB3 WLB2
Per
cen
t
Workload demands Organisational culture Personal choiceBase: All employees doing overtime
Unweighted base: WLB4 = 851, WLB3 = 1364, WLB2 = 1068 Source: WLB4 2011; IES/ICM 2006, Stevens et al 2004
27

During the same period there has been a corresponding decrease in employees citing reasons relating to organisational culture, specifically, a drop in employees saying their employer expects/encourages them to work overtime (down from 11 per cent in WLB2, to eight per cent in WLB3, to two per cent in WLB4). Differences in the methodology used across surveys mean this cannot be tested for statistical significance.
There were some large differences in the reasons given for working overtime by the type of overtime worked. Ninety per cent of employees doing unpaid overtime only cited workload demands, compared with a 52 per cent of employees doing paid overtime only. Forty-two per cent of employees working paid overtime only were doing so out of personal choice (including to make more money), compared with five per cent for employees working unpaid overtime only. This is shown in Figure 2.7.
Figure 2.7 Reasons for working overtime, whether paid or unpaid.
73
52
5
6
522
42
90
5
0%
10%
20%
30%
40%
50%
60%
70%
80%
90%
100%
Both Paid only Unpaid only
Per
cen
t
Workload demands Organisational culture Personal choiceBase: All employees doing overtime
Unweighted base: 811 Source: WLB4 2011
Employees working ‘any paid overtime’, as opposed to those who worked ‘only paid overtime’, (Table C2.3) were more likely to give workload demands as their main reason for doing so if they were6:
Female: 65 per cent of female employees cited this, compared with 53 per cent of male employees.
6 Some response categories have been combined due to the smaller sample size (n=371). Employees not working any paid overtime are excluded, resulting in very small numbers in some of the original categories.
28

Older: employees aged over 50 years were most likely to cite workload reasons (70 per cent), followed by employees aged 40 to 49 (65 per cent) and employees aged 16 to 39 (50 per cent).
Had a higher personal income: 73 per cent of employees with an annual income of £25,000 or more cited workload reasons, compared with 44 per cent of employees with an annual income that is less than £10,000.
Had managerial responsibilities: 80 per cent of employees with management responsibilities cited workload demands, compared with 48 per cent of non-managers
Spent longer with their current employer: 71 per cent of employees who had been with their employer ten years or more cited workload reasons while only 49 per cent of those with who had been there less than 12 months said this.
In a managerial or professional occupation: 81 per cent of this group reported workload reasons, compared with 44 per cent among those in routine and manual occupations.
Worked in the public sector: 81 per cent of public sector employees cited workload reasons compared with 52 per cent among employees in the private sector.
Worked in public administration, education and health: 77 per cent of employees in this industrial category reported workload reasons, compared with 46 per cent of those in manufacturing, and 41 per cent of employees in transport, storage and communication.
Overall, employees working any unpaid overtime were more likely than those working any paid overtime to cite workload demands as their main reason for working that particular form of overtime. However, within each of the two types of overtime, there were similarities in the characteristics of employees who were more likely to give workload demands as a reason.
As with paid overtime, employees were more likely to give workload demands as a reason for working ‘any unpaid overtime’ if they were older, worked in a managerial role and worked in the public sector. Other differences were also observed (Table C2.4). These differences are summarised below7:
Eighty-one per cent of employees aged between 16 and 39 gave workload demands as the main reason, compared with 90 per cent of employees aged 50 or over and 88 per cent of employees aged 40 to 49 years.
Ninety per cent of employees with managerial responsibilities cited workload demands, compared with 81 per cent of non-managers.
7 Some response categories have been combined due to the smaller sample size (n=565). Employees not working any unpaid overtime are excluded, resulting in very small numbers in some of the original categories.
29
Ninety-one per cent of employees in the public sector cited workload reasons for their unpaid overtime, compared with 83 per cent among those in the private sector.
Employees working in the north of England were less likely to cite workload reasons for unpaid overtime (75 per cent), compared with 87 per cent in the Midlands and 90 per cent or more elsewhere. Employees in Northern England were far more likely to state personal choice compared with other regions. Twenty-two per cent of employees in the North stated personal reasons, whilst the proportion for other reasons ranged between three and six per cent.
Employees with a higher personal income were more likely to cite workload reasons. Ninety-three per cent of employees earning £40,000 or more per year gave this reason, compared with 78 per cent of employees earning under £15,000.
Employees in public administration, education and health (92 per cent) and employees in banking, insurance, professional and support services (86 per cent) were more likely to cite workload demands, compared with employees in distribution, retail, hotels and restaurants (75 per cent) and manufacturing (71 per cent).
2.4 On call working
Employees were asked if they were required to do on call working. On call working is defined as when employees have to make themselves available to be called to do work if it is needed. For example, security or maintenance workers may have periods when they are not required on site for routine work but are obliged to attend if there is an emergency, similarly, fire fighters or doctors may be required to go into work in the event of emergencies. In all, 17 per cent of employees said they were required to work on call in their current job8. Particular groups of employees were more likely to work on call than others (Table C2.5). In summary:
Twenty-one per cent of male employees worked on call, compared with 13 per cent of female employees.
Employees with higher personal earnings were more likely to be on call. Twenty-four per cent of employees with an annual income of £40,000 worked on call compared with nine per cent of employees earning under £10,000 per year.
Nineteen per cent of full-time employees worked on call, compared with 11 per cent of part-time employees.
8 The Employment Rights at Work Survey 2005 found that 16 per cent of employees were required to do on call working.
30

Twenty-four per cent of employees who had managerial responsibilities worked on call, compared with 12 per cent of non-managers.
There were large variations in on call working by employees’ length of service with their current employer. The rate was low for newer employees, nine per cent of employees who had been with their current employer less than six months worked on call. It then rose sharply to 27 per cent for employees who had been with their employer six to 11 months, before falling to 13 per cent for employees who had been with their current employer one to four years. The rate then went up again to 22 per cent for employees who had been with their employer for over ten years.
Full-time flexible workers were most likely to work on call (22 per cent), whilst part-time workers with no other flexible working arrangements were least likely (six per cent).
Eighteen per cent of employees with an employment contract worked on call, compared with 11 per cent of employees without a contract.
Managerial and professional employees were most likely to work on call (19 per cent), followed by those in routine and manual occupations (16 per cent) and employees in intermediate occupations (ten per cent).
Twenty-nine per cent of employees in Wales worked on call. The proportion in the remaining regions ranged between 14 and 18 per cent.
Employees working on call were asked to give the frequency of their on call working. Nine per cent of these employees were on call on a daily basis, with a further 20 per cent on call at least once a week and 18 per cent on call not every week but more than once a week. Around a half (54 per cent) of employees who were obliged to be on call did so once a month or at less frequent intervals (ten per cent were on call monthly, 17 per cent regularly but less than monthly and 27 per cent regularly) . Figure 2.8 shows the frequency of on call working.
31

Figure 2.8 Frequency of on call working
10
27
17
9
20
18
0
5
10
15
20
25
30
All the time Every week Not every weekbut > once a
month
Every calendarmonth
Regularly butless than monthly
Irregularly
Per
cen
t
Base: All employees on call
Unweighted base: 293 Source: WLB4 2011
Employees who worked on call were asked how many hours they usually spent on call. Those who worked on call on a weekly basis were asked to record the number of hours they spent on call per week; employees who worked on call once a month were asked for the number of hours per month. Employees were also asked how many of those hours were spent in the workplace and how many hours were spent actually working. The following relates to on call working for employees who regularly work on call in addition to their usual hours. Employees for whom on call working was a usual daily working practice have been excluded from the following figures. Irregular (less than once every six months) and seasonal on call workers have also been excluded.
Employees who undertook on call working spent an average of 60 hours per calendar month on call. However, there is a lot of variation within this; 22 per cent of employees spent less than five hours on call per calendar month and 17 per cent spent more than one hundred. This is shown in Figure 2.9.
32

Figure 2.9 Average hours per calendar month spent on call
9
5
13
17
8
22
14
13
0 5 10 15 20 25
< 5 hours
5-<10 hours
10-<20 hours
20-<30 hours
30-<40 hours
40-<50 hours
50-<100 hours
100 hours +
Percent
Base: All employees who work on call regularly but not daily
Unweighted base: 154 Source: WLB4 2011
Employees spent 24 hours on average per calendar month on call ‘in the workplace’. Thirty-nine per cent of employees on call spent less than five hours per calendar month in the workplace; in an average calendar month these employees spent five hours on call. Three per cent of employees on call said they spent more than 100 hours on average per calendar month on call in the workplace. These individuals tended to be in managerial positions and had SIC codes belonging to ‘other services’.
Sixty-eight per cent of employees on call spent all of their time on call within the workplace. Thirty-two per cent spent only a proportion of their time on call in the workplace. On average, this group of employees spent around a quarter (24 per cent) of their time spent on call actually in the workplace. It was rare for employees on call to never visit the workplace, less than one per cent of employees on call spent no time at all in the workplace.
On call employees who were solely based in the workplace spent fewer hours on call in total. These employees spent 22 hours on average per calendar month on call in the workplace, whereas employees who split their time between the workplace and another location spent a total of 68 hours on average per calendar month on call, twelve of which were spent in the workplace.
Employees were asked how many hours on call were spent actually working. Employees who were on call regularly but not daily spent a mean of 18 hours per
33

calendar month actually working. Again, this average hides a fair degree of variation. Forty-six per cent worked fewer than five hours on average per calendar month whilst on call and two per cent worked more than one hundred hours on average per calendar month whilst on call.
Nearly half (48 per cent) of employees spent all their time on call actually doing work, working 18 hours on average per calendar month. For the remaining 52 per cent of employees, only a proportion of their time on call was spent actually working. For example, an employee might be called upon in emergency situations but be obliged to be on standby the rest of the time. If an emergency does not arise, that time spent on call would be spent not working. These employees spent more hours on call in total (50 hours on average per calendar month) but fewer hours actually working (ten hours on average per calendar month) than employees who worked for their entire on call period (who worked 18 hours on average per calendar month).
2.5 Satisfaction with hours of work
Employees were asked how satisfied they were with the hours they worked. The majority of employees (78 per cent) said they were either satisfied or very satisfied with their working hours. A third of employees (33 per cent) said they were very satisfied. Less than one in ten (seven per cent) of employees were dissatisfied and three per cent said they were very dissatisfied. This is shown in Figure 2.10.
Figure 2.10 Satisfaction with working hours
45
33
3 7
12
0
5
10
15
20
25
30
35
40
45
50
Very dissatisfied Dissatisfied Neither satisfied nordissatisfied
Satisfied Very satisfied
Per
cen
t
Base: All employees
Unweighted base: 1,867 Source: WLB4 2011
The level of satisfaction with working hours varied between employees with different characteristics, as shown in Table C2.6:
34

Thirty-four per cent of employees from a white ethnic background were very satisfied with their working hours, compared with 29 per cent of those from a non-white ethnic background.
Thirty-five per cent of employees with no qualifications and 36 per cent of employees with GCSEs only were very satisfied with their working hours, compared with 27 per cent of employees with a postgraduate degree.
Sixteen per cent of employees with a disability said they were dissatisfied or very dissatisfied, compared with nine per cent of employees without a disability. Although around a third of both groups of employees were very satisfied with their working hours.
Employees on a permanent contract were more likely to be very satisfied (34 per cent), compared with 26 per cent of employees on fixed-term, temporary-seasonal, agency or casual work or working under other forms of temporary contracts.
Employees in intermediate occupations were most likely to be very satisfied (38 per cent), compared with employees in routine or manual occupations (33 per cent) and employees in professional or managerial occupations (32 per cent).
Generally, satisfaction increases as hours decrease. Forty-two per cent of employees who worked fewer than 30 hours per week were very satisfied with their hours, compared with 33 per cent of employees working 30 to 35 hours, 36 per cent of employees working more than 35 and up to 40 hours, 12 per cent of employees working more than 40 and up to 48 hours and six per cent of employees working more than 48 hours.
Flexible working was not found to be significantly related to satisfaction.
2.6 Annual leave
Employees were asked to report the number of days paid leave to which they were entitled per year. All employees should get 28 days leave, including bank holidays. The mean number of paid holidays (excluding bank holidays) varied by the number of hours worked; full-time employees reported an average of 27 days paid leave and part-time employees reported an average of 21 days.
The number of reported annual leave days excluding bank holidays is shown in Figure 2.11. Forty-one per cent of part-time workers reported having fewer than 20 days paid leave a year and seven per cent reported more than 30 days. Seven per cent of full-time workers reported having fewer than 20 days paid leave per year and 15 per cent reported more than 30 days.
35
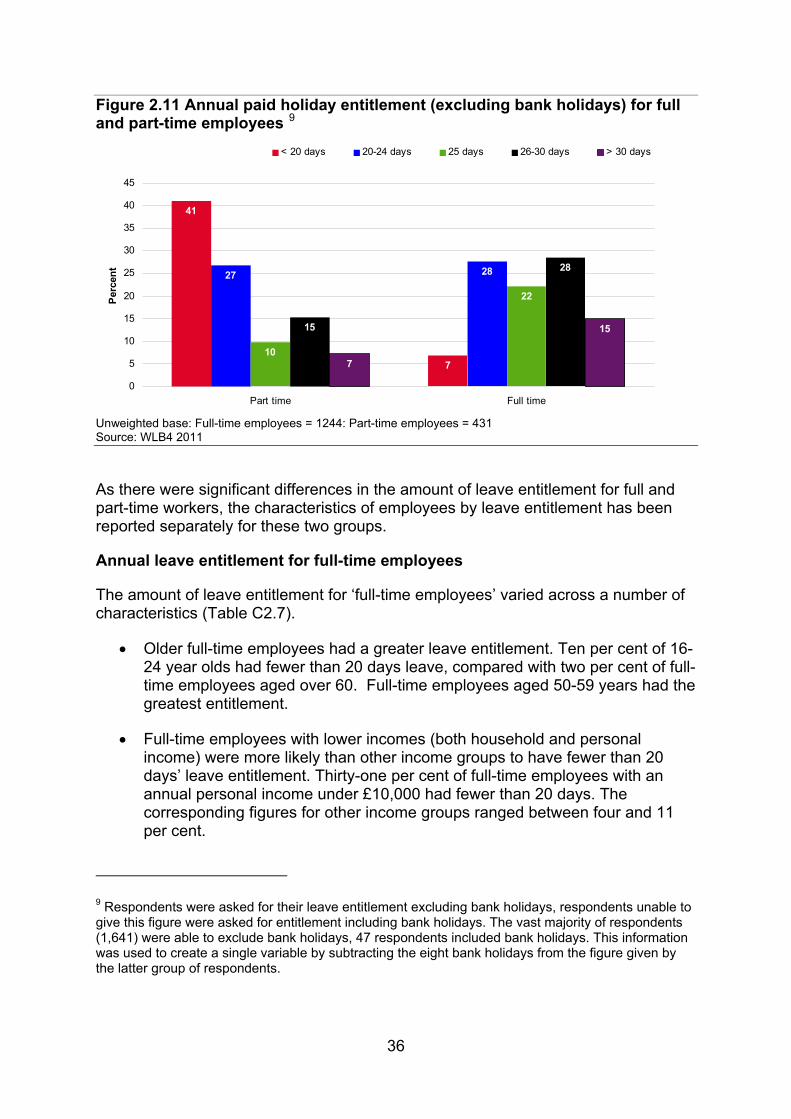
Figure 2.11 Annual paid holiday entitlement (excluding bank holidays) for full 9and part-time employees
41
7
27 28
10
22
28
7
1515
0
5
10
15
20
25
30
35
40
45
Part time Full time
Per
cen
t
< 20 days 20-24 days 25 days 26-30 days > 30 days
Unweighted base: Full-time employees = 1244: Part-time employees = 431 Source: WLB4 2011
As there were significant differences in the amount of leave entitlement for full and part-time workers, the characteristics of employees by leave entitlement has been reported separately for these two groups.
Annual leave entitlement for full-time employees
The amount of leave entitlement for ‘full-time employees’ varied across a number of characteristics (Table C2.7).
Older full-time employees had a greater leave entitlement. Ten per cent of 16-24 year olds had fewer than 20 days leave, compared with two per cent of full-time employees aged over 60. Full-time employees aged 50-59 years had the greatest entitlement.
Full-time employees with lower incomes (both household and personal income) were more likely than other income groups to have fewer than 20 days’ leave entitlement. Thirty-one per cent of full-time employees with an annual personal income under £10,000 had fewer than 20 days. The corresponding figures for other income groups ranged between four and 11 per cent.
9 Respondents were asked for their leave entitlement excluding bank holidays, respondents unable to give this figure were asked for entitlement including bank holidays. The vast majority of respondents (1,641) were able to exclude bank holidays, 47 respondents included bank holidays. This information was used to create a single variable by subtracting the eight bank holidays from the figure given by the latter group of respondents.
36

Thirteen per cent of full-time employees with a disability had fewer than 20 days’ annual leave, compared with six per cent for those without a disability.
Three per cent of full-time employees with managerial responsibilities had fewer than 20 days’ annual leave entitlement, compared with nine per cent of non-managers.
Fourteen per cent of full-time employees in routine and manual occupations had fewer than 20 days’ annual leave, compared with two per cent of intermediate occupations and four per cent of professional and managerial employees.
There was an expected relationship between leave entitlement and length of employment. Full-time employees who had spent a greater length of time with their current employer had had time to build up a greater leave entitlement. Twenty-five per cent of employees who had been with their current employer over ten years reported having more than 30 days annual leave, compared with two per cent of employees who had been there less than six months.
Full-time flexible workers were more likely to have a greater leave entitlement. Just over one in five (22 per cent) had more than 30 days annual leave, compared with 12 per cent of full-time employees without flexible working.
There are large differences by industry; 14 per cent of full-time employees in manufacturing and 13 per cent of full-time employees working in distribution, retail, hotels and restaurants had fewer than 20 days’ leave. The corresponding proportions for other industries ranged between three and five per cent. Thirty-three per cent of full-time public administration, education and health employees had more than 30 days’ leave, the majority of these cases are employed in the education sector and thus entitled to longer periods of leave. The figure for other industries ranged between six and ten per cent.
Thirty-nine per cent of full-time employees in the public sector have more than 30 days’ leave entitlement per year, compared with six per cent in the private sector.
Sixteen per cent of full-time employees without a contract had fewer than 20 days entitlement, compared with six per cent of full-time employees with a contract.
Annual leave entitlement for part-time employees
For ‘part-time employees’, annual leave entitlement varied by personal income and trade union membership only, as shown in Table C2.810:
10 Some response categories have been combined due to the smaller sample size (n=431). Only part-time employees are included, resulting in very small numbers in some of the original categories.
37

Part-time employees who were a member of a trade union had a greater number of days leave entitlement. Twenty-seven per cent had fewer than 20 days’ leave and 19 per cent had more than 30 days’ annual leave. The corresponding figures for non-union members were 45 per cent with fewer than 20 days and four per cent with more than 30 days.
Part-time employees with an annual personal income of £15,000 or higher had a greater leave entitlement; 14 per cent had more than 30 days and 30 per cent had fewer than 20 days leave, compared with four per cent with more than 30 days and 51 per cent with fewer than 20 days for part-time employees earning less than £10,000 per year. Household income was not significantly related to leave entitlement.
Annual leave take up
The majority of employees (76 per cent) took their full leave entitlement. The figures from WLB3 (74 per cent) and WLB2 (71 per cent) suggest an increase in the proportion of employees taking their full leave, although differences in the methodology used in previous years mean this trend cannot be tested for significance.
The difference in the take up of leave entitlement by full and part-time working status (79 per cent for part-time versus 75 per cent full-time) was not significant, therefore the two have been grouped for the remainder of this section. Differences in the level of leave take up between other characteristics are summarised below (Table C2.9).
Women were more likely than men to take their full annual leave entitlement; 80 per cent compared with 73 per cent.
Eighty-three per cent of employees with lower qualification levels (GCSE only or no qualifications) and 82 per cent of employees with vocational qualification took their full leave entitlement, compared with 68 per cent of employees with a postgraduate degree.
Employees in routine and manual occupations were more likely to take their full leave, with 81 per cent doing so, followed by 79 per cent of those in intermediate occupations and 71 per cent of those in professional and managerial occupations.
Employees with a personal annual income between £10,000 and £14,999 were most likely to take their full entitlement (86 per cent), followed by employees earning between £15,000 and £24,999 (82 per cent) and employees earning less than £10,000 (79 per cent). Higher earners with an annual personal income above £40,000 were least likely to take their full entitlement, with only 59 per cent doing so.
Sixty-nine per cent of employees working full-time with flexible working practices took their full leave entitlement, compared with 78 per cent of full-time employees without flexible working. The impact of flexible working on part-time employees was less; 79 per cent of part-time workers with flexible
38

working took their full leave, compared with 76 per cent of employees working part-time only.
Seventy-two per cent of employees with managerial responsibilities compared with 79 per cent of employees without managerial responsibilities took their full leave entitlement.
Employees in very small businesses with fewer than ten employees that were part of a larger organisation or in businesses with more than 250 employees that were part of a larger organisation were least likely to take their leave with 71 per cent and 68 per cent doing so respectively, compared with around 80 per cent (or higher) among those working for different sized employers.
Employee reasons for not taking their entitlement
Employees were asked to cite their reasons for not using up their full leave entitlement. Employees were able to give more than one reason. The largest single reason (34 per cent) was work pressures, where the employee was unable to take leave because they were too busy, under too much pressure or told they were not allowed. A further 12 per cent did not take leave because their leave entitlement for the year had expired as they had not used it by a specified date. Twenty-one per cent of employees did not take their leave entitlement because they knew they would be compensated either with extra money or by carrying the leave over to the next year. Twenty-six per cent of employees said they did not take leave because they did not want to do anything specific with it or because they felt they could not afford a holiday. Two per cent of employees reported that they did not take leave because they were not eligible for paid leave.
Figure 2.12 shows the reasons given for not taking full leave entitlement.
Figure 2.12: Reasons given for not taking full leave entitlement
Other reasons 3%
Ill / maternity leave8%
Not eligible for pay2%
Work reasons - too busy, pressure, not
allow ed34%
Didn't use it by a specif ied date
12%
Wanted to accumulate leave/cash
21%
Didn't w ant/couldn't afford to take it
26%
Base: Employees who did not take leave entitlement(multiple coded response)
Unweighted base: 413 Source: WLB4 2011
39

These multiple response categories were grouped into a single response variable with four response categories for further analysis. There were no significant differences in the characteristics of the employees within these different groups as seen in Table C2.10.
Employee compensation for not taking their leave entitlement
Employees were asked whether or not they were compensated for not taking their full leave entitlement. The majority of employees (70 per cent) who had not taken their full leave entitlement were compensated by their employer. This is lower than WLB3 (75 per cent) but higher than WLB2 (59 per cent).
Employees were more likely to be compensated if they were a parent or a flexible worker (Table C2.11):
Seventy-seven per cent of parents were compensated for leave not taken, compared with 66 per cent of employees who were not parents.
Seventy-eight per cent of employees working full-time with flexible working practices were compensated, compared with 68 per cent of employees working full-time without flexible working arrangements and 60 per cent of all employees working part-time (either with or without flexible working).
No other characteristics were significantly related.
Methods of compensation for untaken leave varied. Figure 2.13 shows the most common forms of compensation. Sixty-two per cent of compensated employees were allowed to carry their leave over and 20 per cent were paid for all or some of their unused leave. Thirteen per cent carried some over but were not paid for the uncarried leave, whereas three per cent were paid for some unused leave and carried the rest over. Compensation was not significantly related to the size of leave entitlement.
Figure 2.13: How leave compensation was given
Carried all over62%
Paid for all/some20%
Carried rest, paid some3%
Carried some, not paid13%
Other2%
Base: Compensated employees
Unweighted base: 282
40

Source: WLB4 2011
2.7 Summary
Seventy-four per cent of employees usually worked 30 hours or more per week, with six per cent working over 48 hours. Satisfaction with working hours typically declined as hours worked increased. There were a number of notable differences in the number of hours worked between particular groups of employees.
Unsurprisingly, working less than 30 hours per week was more common among women, but also among those aged under 25 and those aged 60 or over, those without managerial responsibilities and those in routine, manual and intermediate occupations.
Working more than 48 hours per week was more common among men, those with higher qualifications, those with higher incomes, those working in the private sector and those in male dominated workplaces.
Those with flexible working practices were more likely to work longer hours than those without, suggesting that such practices facilitate greater labour market participation. Working longer hours was particularly notable among full time employees who regularly worked from home, and part-time employees who worked flexitime and who had had temporarily reduced hours.
Working unpaid overtime was predominantly driven by workload demands. It was more common among those with higher qualifications and higher levels of personal income, those in managerial positions, full-time employees and those from public sector.
Paid overtime was driven by workload demands and the desire to make more money. Working paid overtime was more common among part-time employees, those from private sector, employees working in manufacturing and in distribution, retail, hotels and restaurants.
On call working was more common among men, those with high personal earnings, full-time employees, those with managerial responsibilities and those with flexible working.
Employees spending longer on call, typically spend a smaller proportion of that time actually working. On call employees who were solely based in the workplace spent fewer hours on call in total than those with less workplace contact when on call.
Among full-time workers, older employees, those in non-routine/non-manual occupations, those who had been with their employer longer, those with flexible working and those on a permanent contract tended to have greater leave entitlement. Differences were also evident by industry. Among part-time workers, being a parent and member of a trade union were linked with greater leave entitlements.
41

Not all employees used their full annual leave entitlement. Men, those on higher income, those working full-time with a flexible working arrangement and employees with higher qualifications were among those less likely to use their leave entitlement. This was most commonly due to work pressures and, in most cases, was compensated (most often by carrying the entitlement forward).
42

3. Work-life balance
practices and policies
3.1 Introduction
Current legislation grants some employees the right to request a flexible working pattern. Employees have the right to make a request if they have worked for their employer for 26 weeks and have parental responsibility for a child aged under 17 (under 18 if the child has a disability), or have adult caring responsibilities. There have been two key changes since the last Work-Life Balance survey: the extension of the right to request flexible working to include employees with adult caring responsibilities from April 2007, and the inclusion of employees with children aged six to 16 in April 2009 (previously eligibility has been restricted to those with children aged under six).
Such requests must be fully considered by employers and can only be rejected if there is a legitimate business reason for doing so.
At present, other employees may also ask their employer for a flexible working arrangement but their employer is not bound to consider this request.
This chapter starts with an exploration of employees’ awareness of the right to request flexible working. It then goes on to look at the availability of flexible working practices in the workplace as perceived by the employees, employees’ take-up of these flexible working arrangements and finally, the incidence of requests to work flexibly and the outcomes of these requests.
All reported differences are statistically significant unless otherwise stated. All tables referenced can be found in Annex C, unless otherwise stated.
3.2 Awareness
In the 2011 Work-Life Balance survey, employees were asked three questions about their awareness of the right to request flexible working:
‘By law, employers have a duty to seriously consider requests for flexible working arrangements for employees with caring responsibilities for children or adults.
Were you aware of the right to request flexible working?’
If aware of right to request, employees were then asked:
43

‘Were you aware of the right to flexible working for employees caring for children?
Were you aware of the right to flexible working for employees caring for adults?’
This differs from the WLB3 survey which asked one question about the right to request for parents of children under the age of six or disabled children under the age of 18.
Overall, three-quarters (75 per cent) of employees were aware of the general right to request flexible working. Of these, the majority (92 per cent) were aware of parents’ right to request and nearly three-quarters (74 per cent) were aware of carers’ right to request (Tables C3.1, C3.2 and C3.3).
As Table C3.1 shows, general awareness of the right to request was highest among:
Women (79 per cent, compared with 72 per cent among men)
Those aged 60 and over (81 per cent falling to 58 per cent among those aged 16-24 )
11 Parents (79 per cent, compared with 73 per cent among non-parents )
Those with A levels or higher qualification (around 80 per cent, compared with 67 per cent among those the GCSEs or no qualifications)
Those living in the Midlands (83 per cent, compared with 71-78 per cent of those in other regions)
Women working full-time (82 per cent, compared with 74 per cent of women working part-time, 73 per cent of men working full-time and 67 per cent of men working part-time)
Those with managerial or supervisory responsibilities (83 per cent, compared with 71 per cent of those without such responsibilities )
Those who had been with their current employer five years or more (80 per cent, compared with 70 per cent among those with one to four years’ service)
Those who were working flexibly, other than part-time (87 per cent), and those working part-time and flexibly (79 per cent), with lowest awareness among those working part-time only (69 per cent) and those not working part-time or flexibly (73 per cent)
Those who were a member of a trade union or staff association (81 per cent, compared with 73 per cent among non-trade union members)
11 The 2008 Fair Treatment at Work Survey also found that levels of awareness were similar for parents and non-parents.
44

Those in managerial or professional occupations (85 per cent, compared with only 64 per cent of those in routine and manual occupations)
Those working in the public sector (83 per cent, compared with 72 per cent of private sector employees)
Those working in a public administration, education or health industry (83 per cent, compared with 67-79 per cent in other industries)
Those whose workplace was a single site business of 250 employees or more (89 per cent compared with 68-81 per cent among employees working for different sized employers).
Awareness of the right to request was particularly low among those aged 16 to 24 (58 per cent) and those in a routine or manual occupations (64 per cent).
Parents’ awareness of right to request
Tables C3.4 and C3.5 show levels of awareness of the right to request among parents12 in more detail, taking into account factors, such as family and employment status. Overall, 79 per cent of parents were aware of the general right to request flexible working and 94 per cent of parents were aware of parents’ specific right to request flexible working. Awareness of the general right to request flexible working was highest for female employees with dependant children (84 per cent), compared with male employees with dependant children (73 per cent) and for parents whose youngest child was aged under six years (82 per cent), compared with parents whose youngest child was six years or over (76 per cent). This may reflect a lower level of awareness of recent changes i.e. the extension of the provision to include parents of older children. When looking at gender and partnership status, mothers who were part of a couple were most likely to be aware of this general right to request (87 per cent), compared with lone mothers (74 per cent) and lone and couple fathers (73 per cent for both, although base size for lone fathers is very small (n=33)). Amongst parents who were aware of the general right to request, there were no significant differences in the awareness of parent specific rights, either by family or employment status.
Carers’ awareness of right to request
Tables C3.6 and C3.7 show levels of awareness of the right to request flexible working amongst employees with caring responsibilities13. Seventy-three per cent of carers were aware of the general right to request and 77 per cent of carers who knew of the general right to request were aware that carers had specific rights. Older carers were more likely to know about the right to request, both in general and for carers. Eighty-one per cent of employees aged 60 or over were aware of the general right to request and 92 per cent of these knew carers had a specific right, compared with 71 per cent of employees aged between 25 and 39 being aware of the general
12 The combined core and parent boost samples contained 1,373 parents in total.
13 The combined core and carer boost samples contained 829 carers in total.
45

provision, and of these, a similar proportion knowing about the specific right for carers. Table C3.1 showed that older employees tend to have better awareness of the right to request. It is also the case that carers tend to be older (the mean age of employees with caring responsibilities was 44 years, compared with 38 years for non-carers).
Comparisons over time
The findings from WLB4 suggest that there has been an increase in the awareness of the right to request flexible working arrangements amongst employees. Fifty-six per cent reported being aware of this right in WLB3, compared with 75 per cent in WLB4. However, in both surveys, similar characteristics were associated with awareness. In both WLB3 and WLB4, women, public sector employees and those with managerial or supervisory responsibilities were more likely to be aware of this right. Income was also shown to be factor associated with awareness in WLB3 but this has not been observed in WLB4.
However, these comparisons should be treated with caution, partly due to the difference in the question wording but also the change in survey design.
3.3 Perceived availability in the workplace
Employees were asked a series of questions about their perceived availability of eight different flexible working arrangements in their workplace. The introductory question and flexible working arrangements questions were as follows:
‘Are any of the following working arrangements available at your workplace…?
14…Work part-time, this means working less than 30 hours a week ?
…Work only during school term-time?
…Job-share, this is where a full-time job is divided between two or more people and they work at different times?
…Work flexitime, this is where an employee has no set start or finish time but an agreement to work a set number of hours per week or per month?
…Work reduced hours for a limited period, this is where an employee has an agreement to cut their hours for a set period of time such as a month or six months?
…Work from home on a regular basis, this means an employee works all or some part of the time from home as part of their working hours?
14 There are no specific hours that define part-time work but this definition was used to retain measurement consistency.
46

…Work a compressed working week, this means working your contracted hours over a fewer number of days?
…Work annualised hours, this is where the number of hours an employee has to work is calculated over a full year rather than a week or month?
The perceived availability of each of these flexible working arrangements is shown in Figure 3.1.
Figure 3.1: Perceived availability of flexible working arrangements in employees’ workplace
80
34
4348
56
17
53
4447
29
68
51
64
3
14 12
5
15
2
10
19
30
17
39
0
10
20
30
40
50
60
70
80
90
Part-time Term-timeonly
Job share Flexitime Temporaryreducedhours
Work formhome
(regularly)
Compressedworking week
Annualisedhours
Per
cen
t
Yes No Don't knowBase: All employees
Unweighted base=1,874
Source: WLB4 2011
The rest of this section looks at the employees’ perceived availability of these flexible working arrangements and the associated characteristics.
Part-time working
As shown in Figure 3.1, the most commonly perceived flexible working arrangement available in the workplace was part-time working (80 per cent). Seventeen per cent of employees said that this was not available and three per cent said that they did not know.
All of the employees who worked flexibly in some way perceived that part-time work was available, compared with 77 per cent of employees who were not working any of the flexible working patterns listed (Table C3.8).
The perception of the availability of part-time work varied by employee and employer characteristics, in particular:
Women were more likely to report part-time working being available than men (91 per cent, compared with 69 per cent). Men were more likely to say they did not know whether part-time working was available (five per cent, compared with one per cent of women).
47

Employees with no qualifications were less likely to report part-time working being available (66 per cent), compared with those with a qualification (79-85 per cent).
Employees with caring responsibilities were more likely to report part-time working being available (84 per cent) than employees without (78 per cent).
Employees with a disability were more likely to perceive part-time working to be available (85 per cent), compared with those without (79 per cent).
Those in routine and manual occupations were less likely to report part-time working being available (75 per cent), compared with those in managerial and professional (83 per cent) or intermediate occupations (86 per cent).
Public sector employees were more likely to report part-time working being available (91 per cent), compared with private sector employees (76 per cent), this is likely to be related to the higher proportion of female workers in the public sector.
Employees in distribution, retail, hotels and restaurants (88 per cent), public administration, education and health (89 per cent) and banking, insurance, professional and support services (85 per cent) were more likely to report part-time working being available, compared with employees in construction (53 per cent) or manufacturing (55 per cent). Employees in these latter two industries and employees in transport, storage and communication were also more likely to say they did not know whether part-time working was available (between seven and nine per cent), compared with employees in the two former categories (one per cent). As above, this is related to differences in the gender compositions of the sectors.
Employees in workplaces where the staff were mostly women or about half women and half men were also more likely to report part-time working being available (91 and 88 per cent, respectively), compared with those employees in workplaces where the staff were mostly men (57 per cent).
Working reduced hours for a limited period
Over half of all employees (56 per cent) perceived that working reduced hours for a limited period was available in their workplace (Figure 3.1). Twenty-nine per cent of employees reported that it was not available and 15 per cent did not know.
The majority of employees who were already flexible workers, either full-time (75 per cent) or part-time (65 per cent), reported this type of flexible working was available in their workplace (Table C3.9), compared with 40 per cent of part-time workers with no other flexible arrangements and 45 per cent of full-time workers without any flexible working arrangement.
Other significant differences in the perceived availability of working reduced hours were as follows:
48

Women were more likely to report the availability of working reduced hours (59 per cent), compared with men (53 per cent).
Employees aged between 40 and 49 and employees aged between 50 and 59 were more likely than employees in other age groups to state that working reduced hours was available in their workplace (63 per cent and 59 per cent, respectively). The proportions for other age groups ranged between 51 and 53 per cent. Employees aged between 40 and 59 were also less likely to say that they did not know whether reduced hours was available (11 per cent), compared with other age groups (17-19 per cent).
Employees from a white ethnic background were more likely to state that reduced hours working was available (57 per cent, compared with 45 per cent among non-white employees). However, non-white employees were more likely to say that they did not know whether this flexible working practice was available (22 per cent, compared with 14 per cent among white employees).
Employees with an annual household income of £45,000 or more were more likely to say reduced hours working was available (67 per cent), compared with those in lower income groups (48-60 per cent), with the lowest availability reported by those with an annual household income under £15,000.
Managers or supervisors were more likely to claim this practice being available (64 per cent), compared with employees without these responsibilities (52 per cent).
Employees who had been with their workplace less than six months were less likely to mention temporary reduced hours (42 per cent, compared with 51-62 per cent for employees who had been with their employer longer.
Employees working on a permanent contract (54 per cent) were more likely than those working on a seasonal, casual, fixed-term or temporary contract (44 per cent).
The reported availability of temporary reduced hours was more common among members of a trade union or staff association (62 per cent), compared with those who were not members (54 per cent); and more common among employees in workplaces where pay and conditions are affected by agreements between the employer and trade union/staff association (66 per cent), compared with employees in workplaces where this was not the case (55 per cent).
Employees in managerial and professional occupations were more likely to report the availability of reduced hours working (65 per cent), compared with those in routine or manual occupations (48 per cent) or intermediate occupations (53 per cent).
Higher levels of perceived availability were also evident among public sector employees (62 per cent), compared with those working in the private sector (54 per cent).
49

Employees working in transport, storage and communication industry (66 per cent) and those working in the banking, insurance, professional and support services (63 per cent) were more likely to report reduced hours working compared with those working in distribution, retail, hotels and restaurants (51 per cent), manufacturing (50 per cent) or construction (42 per cent) industries.
Employees working at larger workplaces of 250 or more employees that are part of a larger organisation (65 per cent) or single site businesses of 250 or more employees (60 per cent) were most likely to report the availability of reduced hours working compared with those working at smaller workplaces of either one to nine employees (49 per cent) or ten to 49 employees (50 per cent) that are part of a larger organisation.
Flexitime
Working flexitime was perceived to be available by just under half of employees (48 per cent). A similar proportion (47 per cent) reported that this type of working arrangement was not available and five per cent were not sure whether it was available in their workplace.
When looking at employee and employer characteristics a number were found to be significantly associated with the perceived availability of flexitime (Table C3.10):
Non-white employees were more likely than white employees to say that flexitime was available (60 per cent, compared with 46 per cent).
Employees without qualifications were the least likely to report flexitime being available (38 per cent), compared with employees with a degree or postgraduate degree (55 per cent).
Employees with an annual household income of more than £45,000 were more likely to report the availability of flexitime (55 per cent), compared with employees with lower incomes (42-48 per cent).
There was some association between region and the availability of flexitime, with employees in the Midlands (51 per cent) or the South (51 per cent) most likely to report this type of flexible working and lowest perceived availability in Scotland (36 per cent).
Employees with managerial responsibilities were more likely to report the perceived availability of flexitime (52 per cent), compared with employees without (46 per cent).
Employees working part-time and flexibly (64 per cent) or those working flexibly other than part-time (71 per cent) were more likely to perceive flexitime as being available, compared with those working part-time only (30 per cent) and those not working part-time or flexibly (30 per cent).
Non-trade union members (50 per cent) were more likely to report flexitime being available compared with those employees who were members of a trade union (43 per cent). However, employees in workplaces where the pay
50

and conditions were agreed between trade unions and employers were more likely to report flexitime (53 per cent) than employees in workplaces without such arrangements (46 per cent).
Those in managerial and professional occupations (56 per cent) were most likely to perceive flexitime as being available in their workplace, compared with those in intermediate occupations (42 per cent) and routine and manual occupations (40 per cent).
Public sector employees were more likely than private sector employees to say flexitime was available in their workplace (53 per cent and 46 per cent respectively).
Those working in the banking, insurance, professional and support services (58 per cent) were most likely to report flexitime as a working arrangement available to them, whilst those in working in manufacturing were least likely to report this (36 per cent).
Those employed in single site workplaces of 250 or more staff were most like to offer flexitime (60 per cent), with the lowest incidence being reported in single site workplaces of 50-249 staff (36 per cent).
Flexitime was most commonly perceived to be available by those employees working in workplaces where the gender ratio of the staff was roughly equal (55 per cent) compared with mostly female staff (43 per cent) or mostly male staff (44 per cent).
Job-share
Forty-three per cent of employees reported that job-share was a flexible working arrangement available in their workplace; a similar proportion (44 per cent) said it was not available and 12 per cent were unsure.
A number of differences in the perceived availability of job-share were evident (Table C3.11). In summary, the reported availability was higher among the following groups:
Women (53 per cent), compared with men (34 per cent)
Employees aged between 40 and 49 (48 per cent) and employees aged between 50 and 59 (47 per cent) were more likely than employees aged between 16 and 24 (32 per cent).
Those whose highest qualification was a degree (51 per cent) or postgraduate degree (52 per cent), compared with those with A levels/ GCSEs (39-40 per cent) or no qualifications (34 per cent)
Part-time employees (48 per cent), compared with full-time employees (42 per cent).
Employees with management responsibilities (49 per cent), compared to those without these responsibilities (40 per cent).
51

Those who had been working with their current employer for five to nine years (45 per cent) or over ten years (50 per cent), compared with employees who had been with their employers for a shorter period (29-41 per cent).
Employees working flexibly other than part-time (62 per cent) and employees working flexibly and part-time (56 per cent), compared with those working part-time only (31 per cent) and employees working full-time without any flexible working arrangements (36 per cent).
Trade union members (57 per cent), compared with non-union members (38 per cent).
Employees in workplaces where pay and conditions agreed between the employer and the union (61 per cent), compared with those in workplaces where this was not the case (37 per cent).
Those working in a managerial and professional occupations (52 per cent), compared with those working in routine and manual occupations (34 per cent) and those working in intermediate occupations (43 per cent)
Public sector workers (66 per cent), compared with private sector workers (34 per cent).
Employees working in the public administration, education and health industry (61 per cent), compared with those in other industries, with particularly low availability reported by those working in construction (31 per cent) or manufacturing (20 per cent).
Employees working in large single site workplaces of 250 or more (55 per cent), compared with those working in workplaces with one to nine members of staff (29 per cent) that were part of a larger organisation.
Employees in workplaces where the staff are mostly women (53 per cent) or have a roughly equal gender split (48 per cent), compared with those where the staff are mostly men (27 per cent).
Compressed working week
Nearly two-fifths (39 per cent) of employees reported that a compressed working week (CWW) was perceived to be available at their workplace. Just over half (51 per cent) said this was not available and ten per cent did not know if this working arrangement was available or not.
Table C3.12 shows the full analysis of the perceived availability of this work arrangement. The significant findings were as follows:
Women (42 per cent) were more likely to report a CWW being available at their workplace, compared with men (36 per cent).
Forty-five per cent of those working part-time reported a CWW being available, compared with 37 per cent of those working full-time.
52

Managers or supervisors more commonly reported the availability of a CWW (44 per cent), compared with employees without these responsibilities (37 per cent).
Employees working flexibly other than part-time (55 per cent) and employees working flexibly and part-time (53 per cent) were more likely to say that a CWW was offered, compared with those employees working part-time only (37 per cent) or those not working part-time or flexibly (25 per cent).
A higher proportion of employees on fixed-term, seasonal, casual or temporary contacts said that a CWW was available (54 per cent), compared with employees on permanent contracts (38 per cent).
Employees in workplaces where pay and conditions were agreed between the employer and the union were more likely to report a CWW arrangement being available (44 per cent), compared with 38 per cent of employees in workplaces where this arrangement was not used to agree pay and conditions.
Employees in managerial and professional (44 per cent) or intermediate occupations (42 per cent) were more likely to report a CWW being available at their workplace than those in routine and manual occupations (33 per cent).
Public sector workers were more likely to say that a CWW arrangement was available (45 per cent), compared with private sector workers (37 per cent).
The availability of a CWW was most commonly reported by those working in the banking, insurance, professional and support services industry (46 per cent) and least likely to be reported by those working in construction (26 per cent) or manufacturing (27 per cent).
There was some association with workplace size and availability of a CWW arrangement with those in a workplace of 250 or more staff more likely to report this (46 per cent where part of a larger organisation and 48 per cent where a single site); however it was also common in smaller single site workplaces of one to nine staff (50 per cent). It was least common in workplaces of one to nine employees (33 per cent) that were part of a larger organisation.
Employees in workplaces where the staff gender ratio was roughly equal and those in workplaces where the majority of staff were women were more likely to report a CWW being available (44 per cent and 40 per cent respectively), compared with employees in workplaces where the majority of staff were men (31 per cent).
Term-time working
Thirty-four per cent of employees reported that term-time working was available in their workplace, whereas 53 per cent said this was not available and 14 per cent did not know.
53

Table C3.13 shows characteristics related with the perceived availability of term-time working by employees. The employees most likely to report this form of flexible working were:
Women (41 per cent), compared with men (26 per cent).
Employees whose highest qualification was a postgraduate degree (44 per cent), compared with employees with lower or no qualifications (31-35 per cent).
Employees with caring responsibilities (35 per cent), compared with those without (33 per cent).
Part-time workers (41 per cent), compared with full-time workers (31 per cent).
Employees currently working flexibly and part-time (54 per cent), and those who work flexibly and full-time (43 per cent), compared with employees who work part-time without any other flexible working arrangements (26 per cent) and employees who work non-flexibly full-time (25 per cent).
Members of a trade union or staff association (44 per cent), compared with non-members (30 per cent).
Employees in workplaces where pay and conditions were agreed between the employer and the union (43 per cent), compared with employees in workplaces where such arrangements are not in place (29 per cent).
Public sector workers (55 per cent), compared with private sector workers (25 per cent).
Those working in the public administration, education and health industry (52 per cent), compared with those working in other industries; for example, construction (23 per cent), transport, storage and communication (20 per cent) and manufacturing (13 per cent).
Those working in workplaces where the staff were mainly women (44 per cent) or have a roughly equal gender split (40 per cent), compared with employees in workplaces where the staff were mostly men (15 per cent).
Working from home
Thirty per cent of employees mentioned that working from home was perceived to be available in their workplace, 68 per cent said this was not available and two per cent were not sure or did not know whether this was available.
The availability of working from home was associated with a number of employee and employer characteristics (Table C3.14). These are summarised below:
The availability of working from home was most likely to be reported by men (33 per cent), compared with women (27 per cent).
54

Those aged 25 to 59 (32-35 per cent) were more likely to say working from home was available, compared to those aged 16 to 24 (13 per cent) or aged 60 or older (23 per cent).
Reporting the availability of this flexible working arrangement was more common among employees whose highest qualification was a postgraduate degree (49 per cent) or degree (43 per cent) and least common among those with no qualifications (11 per cent) or GCSEs (16 per cent).
Employees with an annual household income of £45,000 or more were more likely to say working from home was available (50 per cent), compared with those with lower incomes (12 to 31 per cent, with the lowest level among those with an annual income of under £15,000).
Working from home was more likely to be reported by employees in the South (34 per cent) and the Midlands (30 per cent), compared with employees in the North (26 per cent), Wales (23 per cent) or Scotland (22 per cent).
The availability of working from home was more commonly reported by full-time workers (34 per cent), compared with part-time workers (18 per cent).
Employees with managerial or supervisory responsibilities were more likely to report working from home being available (42 per cent), compared with employees without these responsibilities (23 per cent).
Employees who had been working at their current workplace between five and nine years (35 per cent) or ten or more years (34 per cent) were more likely to report working at home being available, compared with employees who had been with their current employer less time, for example, only 25 per cent of those with less than six months service reported this.
Employees currently working flexibly and full-time were most likely to perceive working at home was available in their workplace (58 per cent) most commonly reported the availability of working from home, compared with employees who work flexibly and part-time (27 per cent) and employees who work part-time without any other flexible working arrangements (nine per cent) and employees who work non-flexibly full-time (20 per cent).
The availability of working from home was more common among those working at workplaces where pay and conditions are agreed between the employer and the union (42 per cent) than workplaces where such arrangements are not made (28 per cent).
It was also more common among those in managerial and professional occupations (49 per cent), compared with employees in intermediate occupations (28 per cent) and routine and manual occupations (nine per cent)
Those employees in banking, insurance, professional and support services (51 per cent) were most likely to report the availability of working form home. The lowest reported availability was among those in the distribution, retail, hotels and restaurants industry (ten per cent).
55
Working from home was more commonly available to employees working in single site workplaces of staff of 250 or more (50 per cent) or workplaces of the same size (44 per cent) that were part of a larger organisation. It was less common among smaller workplaces (26-33 per cent)
Employees in workplaces where the staff make-up was about half women and half men (38 per cent) were most likely to report the availability of working from home, compared with workplaces where the staff were mostly women (23 per cent) or mostly men (28 per cent).
Annualised hours
Working annualised hours was the flexible working arrangement which was least likely to be perceived as being available by employees in their workplaces. Seventeen per cent said this was available, 64 per cent said it was not available and 19 per cent did not know whether this was available or not.
Table C3.15 shows the perceived availability of this arrangement by the characteristics of the employees and their workplace. The key findings are as follows:
Employees working full-time and flexibly (26 per cent) and employees working part-time and flexibly (24 per cent) were more likely to report this working arrangement being available, compared with ten per cent of those not working part-time or flexibly and 13 per cent of employees working part-time only.
Trade union members were more likely to report the availability of annualised hours (21 per cent), compared with non-members (16 per cent).
Employees working in workplaces where the pay and conditions were agreed between the employer and the union were more likely to perceive this arrangement to be available (23 per cent), compared with employees in workplaces where such arrangements were not in place (16 per cent).
Public sector workers (23 per cent) were more likely to report annualised hours being available, compared with those working in the private sector (15 per cent).
Employees working in the public administration, education and health industry (22 per cent) were more likely to report the availability of annualised hours, compared with those in the manufacturing (11 per cent) or construction (12 per cent) industries.
Overall availability of flexible working arrangements
Figure 3.2 shows the overall number of flexible working arrangements perceived by employees to be available in their workplace. The majority (92 per cent) of employees reported that some form of flexible working was available. Just over a third of employees (34 per cent) reported that between three and four arrangements were available, and a small minority of employees (three per cent) reported that all
56

eight types of arrangements were available. The mean number of flexible arrangements reported as available was 3.5.
Figure 3.2: Number of flexible working arrangements perceived to be available in the workplace
8
1314
17 17
13
10
6
32
4
6
8
10
12
14
16
18
20
0 1 2 3 4 5 6 7 8
Per
cen
t
Base: All employees
Unweighted base: 1,871
Source: WLB4 2011
Table C3.16 presents the number of flexible working arrangements available by employee and employer characteristics. A number of statistically significant differences are evident:
Women were more likely to report that at least one flexible working arrangement was available, compared with men (97 per cent and 88 per cent, respectively)
Employees without any qualifications were least likely to report one or more flexible working arrangements available (81 per cent), compared with employees with qualifications (92-96 per cent)
Region was also significant. Employees living in the Midlands (97 per cent) were most likely to say that one or more flexible working arrangement was available, whilst those in Wales least likely (86 per cent)
Trade union members (95 per cent) were more likely to state that one or more flexible working arrangement was available in their workplace, compared with non-members (92 per cent). In addition, employees at workplaces where pay and conditions were agreed between the employer and the union (95 per cent) were more likely to do so than those in workplaces where pay and conditions were agreed by other means (91 per cent)
Employees working in routine and manual occupations were the least likely to report flexible working being available (89 per cent), compared with those in
57

intermediate occupations (93 per cent) and employees in professional and managerial occupations (96 per cent).
Public sector workers were more likely than private sector workers to say at least one flexible working arrangement was available (97 per cent, compared with 91 per cent).
Employees working in the manufacturing (84 per cent) or construction (77 per cent) industries were least likely to report that flexible working arrangements were available, compared with employees in distribution, retail, hotels and restaurants (93 per cent), transport, storage and communication (92 per cent), banking, insurance, professional and support services (97 per cent) and public administration, education and health (96 per cent).
There was some association with the size of the workplace, those in workplaces of 1 to 9, 10 to 49 (part of a larger organisation) and those in workplaces of 1 to 9, 10 to 49 (single site) being those least likely to say flexible working arrangements were available (89 per cent, 90 per cent, 90 per cent and 91 per cent respectively), compared with single site workplaces of 50 to 249 employees (97 per cent) and over 250 employees (99 per cent).
Employees in workplaces where staff members were mostly women (97 per cent) or half men and half women (96 per cent) were more likely to say flexible working arrangements were available, compared with those in workplaces where the staff were mostly men (82 per cent).
Similar associations were found when employees reporting availability for up to two flexible working arrangements were compared to those reporting three or more flexible arrangements (Table C3.17).
Comparisons over time
Due to changes in the question wording, it is not possible to compare the findings from WLB4 with previous waves with regards to the type and number of flexible working arrangements available. In WLB3, the questions asked specifically what flexible working arrangement would be available to the employees if they personally needed it, whereas WLB4 asked a more general question about what was available at their workplace.
3.4 Take-up
Sixty eight per cent of employees who said that one or more flexible working arrangements were available were actually working flexibly. As such, 32 per cent of employees who reported to have the availability in their workplaces had not taken it up. This was 60 per cent of employees overall. The proportion of employees taking up flexible working has increased since WLB3 where 62 per cent of employees who had a flexible working arrangement available had taken up flexible working and 56 per cent of employees overall.
58

For each flexible working arrangement that an employee mentioned being available in their workplace, they were then asked if they currently worked or had worked in this way in the last 12 months.
Figure 3.3: Take-up of flexible working arrangements in the last 12 months
44
40
30
29
26
14
9
54
53
41
30
36
24
15
10
49
0 10 20 30 40 50 60 70
Flexitime
Work from home
Part-time
Annualised hours
Term-time only
Compressed working week
Temporary reduced hours
Job share
Percent
All Employees Parent employeesBase: Employees with flexible work ing arrangement available
Unweighted base: bases vary depending on type of flexible working arrangement mentioned.
All employees (core sample), Parent employees (boost sample)
Source: WLB4 2011
15Analysis of the take-up of flexible working arrangements was carried out for all employees who had mentioned these and then separately for parent employees and carer employees only. The following section looks at each of the arrangements in turn, once again highlighting any significant differences by employee and employer characteristics.
Flexitime take-up
As shown in Figure 3.3, flexitime was taken up by just under half of all employees for whom flexible working was available (49 per cent).
Certain employee characteristics were associated with the take-up of flexitime (Table C3.18). Take up was more common among parents (55 per cent), compared with non parents (45 per cent). It was higher for those whose highest qualification was degree level (63 per cent), compared with employees with no qualifications (35 per cent) or whose highest qualification was below degree level (41-44 per cent). Employees living in Scotland (66 per cent) were more likely to have taken-up flexible working, compared with those living in other regions with the lowest take-up in the Midlands (39 per cent). Although Scotland had low perceived availability of this working practice (36 per cent, Table C.3.10), where this form of flexible working was
15 Throughout this section the terms ‘take-up’ or ‘taken up’ refers to those employees currently working in this way or who had worked in this way in the last 12 months.
59

available, take-up was high. In terms of employer characteristics, flexible working was more likely to have been taken up by those working in the public sector (56 per cent), compared with those working in the private sector (45 per cent).
With regards to parents and their family and employment status (Table C3.19), the take-up of flexible working was higher among women with dependant children (59 per cent), compared with men with dependent children (48 per cent). Lone parents (65 per cent) were more likely to take up flexible working than couple parents (52 per cent) and lone mothers (67 per cent) were more likely to take up flexible working than either couple mothers (57 per cent) or couple fathers (48 per cent). Among carers, take up was 52 per cent (Table C3.20). However, there were no significant differences by carer status or by age and sex of carers.
Working from home take-up
Overall, 44 per cent of employees for whom working from home was available had taken up this arrangement (Table C3.21)16. Thirty-six per cent of employees aged between 16 and 39 worked from home, compared to 48-49 per cent of employees in older age groups. Half of parents (50 per cent) worked at home on a regular basis, compared with 39 per cent of non parents. Half of those whose highest qualification was a postgraduate degree (50 per cent) worked at home, falling to 25 per cent of those with GCSEs only. Fifty-four per cent of employees with an annual household income of £45,000 or more worked at home regularly, compared with those in lower income groups, for example 29 per cent of employees with an annual household income less than £25,000 did so (Table C3.21).
Take-up of working from home was also more common among employees with managerial or supervisory responsibilities (51 per cent), compared with those without these responsibilities (35 per cent). Those in managerial or professional occupations were also more likely have worked or be currently working from home in the last 12 months (50 per cent), compared with those in routine and manual occupations (20 per cent) or intermediate occupations (25 per cent). Sixty per cent of those working in the transport, storage and communication industry reported having taken up this type of flexible working, compared with 27 per cent of employees in manufacturing, 41 per cent of those in banking, insurance and professional and support services and 49 per cent of those in public administration, education and health.
There were no statistically significant differences in take-up among parents by family or employment status and take-up when parent employees were examined separately (Table C3.22) or among carers by carer status, age or gender (Table C3.23).
Part-time working take-up
Forty per cent of employees for whom part-time working was available reported that they had taken up this working arrangement in the last 12 months (Figure 3.3). There
16 Some response categories have been combined due to the smaller sample size (n=158). Employees not working from home are excluded, resulting in very small numbers in some of the original categories.
60

were several associations between the take-up of this type of flexible working and employee and employer characteristics (Table C3.24). Take-up was more common among the following:
Women (50 per cent), compared with men (27 per cent).
Those aged 16 to 24 (62 per cent) and those aged 60 and over (57 per cent), compared with employees aged between 25 and 59, among whom around 33-34 per cent worked part-time.
Those without qualifications (57 per cent), decreasing with higher qualification attainment to 29 per cent of those with a postgraduate degree.
Those with an annual household income of under £15,000 (71 per cent) and the proportions decreasing with higher income levels, with take-up being least common among those with an annual household income of £45,000 or more (23 per cent).
Non-managerial or supervisory positions (50 per cent), compared with those with managerial or supervisory responsibilities (23 per cent).
Those who had been working with their employer for under six months (53 per cent) and decreasing with length of service, with take-up least being likely among those who had been working for their employer for over ten years (31 per cent).
Those on a fixed-term, seasonal, casual or temporary contract (65 per cent), compared with those on a permanent contract (38 per cent).
Those who were not a member of a trade union or staff association (44 per cent), compared with those who were (29 per cent).
Those in routine and manual occupations (58 per cent), compared with employees in intermediate occupations (46 per cent) and employees in managerial occupations (23 per cent).
Those working the private sector (41 per cent), compared with those working in the public sector (35 per cent).
Those in the distribution, retail, hotels and restaurant industry (61 per cent), compared with those in other industries, with the lowest take-up among employees in the manufacturing industry (18 per cent).
Those working in a workplace of one to nine staff which is part of a larger organisation (53 per cent) or a single site (67 per cent), compared with those in larger workplaces, with the lowest levels of take-up among those working in sites of 250 or more employees, where around a quarter worked part-time (25 per cent in multi-site workplaces of 250 employees or more and 24 per cent in single site workplaces of the same size).
61

Among parents, there were significant associations between family and employment status and the take-up of part-time working (Table C3.25):
Fifty-nine per cent of women with dependent children had taken up part-time working, compared with 16 per cent of men with dependent children.
Fifty-four per cent of lone parents had taken up part-time working, compared with 39 per cent of couple parents.
Take-up of part-time working was most common among mothers who were part of a couple (59 per cent) and lone parent mothers (56 per cent), compared with coupled fathers (15 per cent).
Fifty-four per cent of lone parent earners and 43 per cent of dual earner parent couples had taken up part-time working, compared with 27 per cent of single earners who were parents and part of a couple.
There were differences in the take-up of part-time working by carers along the lines of age and gender17. Take-up was highest among those aged 16-39 (52 per cent) and those aged 60 or older (55 per cent), compared with 37-40 per cent among other age groups. In addition, 50 per cent of female carers worked part-time, compared with 36 per cent of male carers. There were no other statistically significant differences by carer status (Table C3.26).
Annualised hours take-up
Thirty per cent of employees for whom working annualised hours was available had taken up this arrangement. The only significant associations between employee or employer characteristics (Table C3.27) and the take-up of this type of working arrangement were in relation to qualifications and trade union membership. The take-up of this working arrangement declined as qualification level increased, with the lowest level of take-up among employees whose highest qualification was a postgraduate degree (21 per cent). Take-up of annualised hours was also more common among those who were a member of a trade union or staff association (38 per cent), compared with those who were not (25 per cent). The overall take-up among parents was 30 per cent, which was very close to that of non parents (29 per cent). No significant associations were found among parent employees between the take-up of annualised hours and their family or employment status (Table C3.28).There was a significant difference in take-up among carers18 by age; carers aged 40-49 (22 per cent) were less likely to work annualised hours than carers aged 50 or over (38 per cent). There were no other statistically significant differences by carer status (Table C3.29).
17 Some response categories have been combined due to the smaller sample size (n=705). Only part-time carer employees are included in this analysis, resulting in very small numbers in some of the original categories.
18 Again, the response categories have been grouped due to the small sample size (n=165)
62

Term-time working take-up
Overall, 29 per cent of all employees for whom term-time working was available had taken-up or were currently working term-time only (Table C3.30). There were some significant differences in the take-up of this type of flexible working. Take up was more likely among:
Women (33 per cent), compared with men (22 per cent).
Parents (34 per cent), compared with non-parents (25 per cent).
Those whose highest qualification was a degree (39 per cent) or post graduate degree (37 per cent), compared with employees with other or vocational qualifications (18 per cent) or those with GCSEs of A levels (25-26 per cent).
Employees living in Scotland (40 per cent), compared with those living elsewhere, with the lowest take-up among those in the North (21 per cent).
Part-time workers (43 per cent), compared with full-time workers (22 per cent) and, specifically, for women working part-time (45 per cent), compared with women working full-time (25 per cent) or men working full-time (18 per cent).
Members of a trade union or staff association (39 per cent), compared with those who were not members (23 per cent).
Those in routine and manual occupations (32 per cent) and those on managerial and profession occupations (30 per cent), compared with those in intermediate occupations (13 per cent).
Those working in the public sector (37 per cent), compared with those working in the private sector (21 per cent).
Employees in public administration, education and health industry (43 per cent), particularly compared with those in the banking, insurance, professional and support services (four per cent).
Employees in a workplace of 10-49 or 50-249 staff (36-37 per cent) and least common among employees in workplaces of 250 or more (nine per cent)19.
The gender difference remained when looking solely at parents; women with dependent children were more likely to work school terms only (42 per cent), compared with men with dependent children (24 per cent). Couple and lone mothers (42 per cent and 41 per cent, respectively) were more likely, compared with couple and lone fathers (24 per cent and 27 per cent respectively). As expected, there was a higher take-up of school term working for parents of school aged children. Twenty-
19 This variable was grouped (i.e. the categories combine single site workplaces and workplaces that were part of a larger organisation) due to the smaller sample size (n=683) that resulted in very small numbers in some of the original categories.
63

eight per cent of parents whose youngest child was aged under six worked school terms, compared with 41 per cent of parents whose youngest child was older than six (Table C3.31). There were no statistically significant differences in take up among carers by carer status, age or gender (Table C3.32).
Compressed working week take-up
Twenty-six per cent of all employees for whom compressed working week was available had taken up this arrangement (Table C3.33). This was more common among non-white employees (46 per cent), compared with white employees (24 per cent).
Twenty-five per cent of those in the manufacturing industry had taken up a compressed working week, compared with 21 per cent of employees working in public administration, education and health and 20 per cent of employees in banking, insurance, and professional and support services. Fifty per cent of those in a single site workplace of one to nine staff worked term-time only, compared with 20-27 per cent among those working for employers of other sizes.
Among parents, the take-up of a compressed working week arrangement was 24 per cent. There was a significant difference by age of youngest child. Twenty-nine per cent of parents whose youngest child was aged under six worked a compressed week, compared with 20 per cent of parents whose youngest child was six or older. There were no other statistically significant associations with the parents’ characteristics and the take-up of this type of working arrangement (Table C3.34). There were no statistically significant differences among carers by carer status, age or gender (Table C3.35).
Reduced working hours take-up
Fourteen per cent of all employees for whom working temporarily reduced hours was available were currently working in this way or had done so in the last 12 months (Table C3.36). This type of working arrangement was more common among part-time employees (20 per cent), compared with full-time employees (13 per cent). It was also more common for employees who reported they had a longstanding illness or disability (22 per cent), compared with those who did not (13 per cent).
There was an association between reduced working hours and the length of time the employee had been with their current employer. Twenty-one per cent of those who had been with their employer for one to four years having taken up this type of working, compared with 13 per cent of those who had been with their employer five to nine years, 11 per cent of those who had been with their employer over ten years and nine per cent of those who had been with their employer less than 12 months.
Reduced working hours take-up was also most common among those who were not a member of a trade union (17 per cent), compared with ten per cent of trade union members. Employees in routine and manual occupations were more likely to work reduced hours (22 per cent), compared with employees in managerial occupations (nine per cent) or those in intermediate occupations (15 per cent). Employees working in the private sector were more likely than public sector employees to work reduced hours (16 per cent, compared with 11 per cent).
64

Finally, this type of working arrangement had been most frequently taken up by those employees in single site workplaces of one to nine staff (29 per cent) and least frequently taken-up by those in single site workplaces of 50 to 249 staff (nine per cent) or 250 or more (nine per cent).
Among parents, the take-up of reduced working hours was 15 per cent. There were no statistically significant associations with the parents’ characteristics and the take-up of this type of working arrangement (Table C3.37). There were no statistically significant differences in take-up among carers by carer status, age or gender (Table C3.38).
Job-share take-up
The take-up of job-share was the least frequent of all the flexible working arrangements. Among all employees for whom job-share was available, the take-up was less than one in ten (nine per cent).
There were some associations between take-up of this type of working arrangement and employee and employer characteristics (Table C3.39). These were as follows:
Job-share take up was more common among employees with an annual household income of less than £24,999 (15-16 per cent) and least common among those with annual household incomes of between £25,000 and £34,999 (six per cent) or more than £45,000 (five per cent).
Part-time workers were more like to have taken up job-share (21 per cent), compared with full-time workers (four per cent), and this was most common for female part-time workers (22 per cent).
Employees who were not a member of a trade union (eleven per cent) were more likely to have taken up job-share, compared with those who were a member of a trade union (six per cent).
Employees on a permanent contract (eight per cent) were less likely to job-share than employees working on fixed-term, seasonal, casual or temporary contracts (19 per cent).
Those in routine and manual occupations (17 per cent) were more likely to have worked or were working a job-share arrangement, compared with those in managerial and professional occupations (four per cent) and those in intermediate occupations (11 per cent).
Employees with managerial responsibilities were less likely to job-share than those without (five per cent, compared with 11 per cent).
Take-up of job-share among parent employees was ten per cent (Table C3.40). This was more common among female employees with dependent children (14 per cent), compared with male employees with dependent children (four per cent). It was also more common among mothers who were part of a couple (14 per cent), compared with fathers who were part of a couple (four per cent). There were no statistically
65

significant differences in take up among carers by carer status, age or gender (Table C3.41).
Comparisons over time
Differences in the methodology used in WLB3 and WLB4 mean that it is difficult to make direct comparisons but there are some similarities in the take-up of arrangements - where these were available to employees - with flexitime being most common and job-share least common at both waves. Generally, the figures are very similar.
When the proportion of all employees’ take-up are examined over time (Table 3.1), the figures suggest a notable increase in the proportion of employees working part-time (32 per cent, compared to 26 per cent in WLB3). There also seems to be an increase in the proportion of employees working regularly from home (13 per cent, compared with ten per cent in WLB3). This increase may partially be due to improvements in technology. As can be seen in Table 3.1, the overall proportion of employees working flexibly has increased steadily, from 51 per cent in WLB2 citing ‘they currently worked flexibly or have done so in the last 12 months’ to 60 per cent in WLB4. This appears to be driven by the notable increase in part-time workers.
Table 3.1: The proportion of all employees taking up flexible working arrangements
WLB1 WLB2 WLB3 WLB4
% % % %
Part-time working 24 28 26 32
Flexi-time 24 26 26 23
Temporary reduced hours N/A 13 10 8
201 Regular home working 11 10 13
Compressed working week 6 11 8 10
Annualised hours 2 6 6 5
Job-share 4 6 6 4
Term-time working 14 15 13 10
Not worked flexibly in last 12 months - 49 44 40
Currently working flexibly, or has done so in the last 12
months
- 51 56 60
Unweighted base 7,561 2,003 2,081 1,874
1 In WLB1this question was asked as part of a separate section from other flexible working arrangements and was very differently worded making comparison particularly unreliable
Source: WLB4 2011, Hogarth et al., 2001; Stevens et al., 2004; and IES/ICM, 2006
66

Commonly combined forms of flexible working
Certain combinations of flexible working were more common than others. The correlation between different forms of flexible working was investigated further. Table E1.1 in Annex E shows the correlation of different flexible working arrangements for employees who had taken up more than one type of flexible working arrangement. The following associations were significant.
Part-time working was positively correlated with school-term working, job-shares and temporarily reduced hours. It was however negatively correlated with flexitime and working from home, which suggests that employees were unlikely to combine either flexitime or working from home with part-time work.
Flexitime was also negatively associated with school-term working, job-shares and working temporarily reduced hours. Working from home was also negatively correlated with job-shares (in addition to part-time working).
Working compressed hours was positively correlated with working temporarily reduced hours. Working annualised hours was positively correlated with school-term working.
The correlation between different forms of flexible working was investigated among parent employees (Table E1.2). There were some similar patterns to those reported in Table E1.1 for all employees who have the availability to take up these working arrangements, although temporarily reduced hours were no longer significantly related to either flexitime or part-time work. Flexitime was no longer significantly correlated with job-shares. For parents, working annualised hours was positively correlated with compressed hours. There were other significant differences when carers were concerned, as given in Table E1.3. Flexitime and working at home were positively correlated, whereas compressed hours correlated negatively with both flexitime and working from home.
Part-time working was the most commonly available form of flexible working, followed by temporarily reduced hours and flexitime. Flexitime was the most commonly taken up form of flexible working, followed by working from home and part-time working. Flexitime is used by highly qualified managerial staff in the public section whereas part-time work, job-share and term-time only working are the preserve of women.
3.5 Requests and outcomes
This section looks at the proportion of employees who had requested a change in their working arrangements in the last two years (or since they had started working their current employer if this was less than two years ago). Requests are only reported if they concerned a change in working arrangements for a sustained period of more than one month. The section then goes on to examine the outcome of the employees’ request and how this was communicated. Finally, the reasons for employees not requesting a change in working arrangements are examined.
67

Requests to change working arrangements
Overall, 22 per cent of employees had made a request to change their working arrangements in the last two years. Thirty-five per cent of employees making a request had asked for a change in the days they work, including a change in the number of days, 23 per cent of the requests asked specifically for a reduction in hours and 14 per cent requested flexitime. Nine per cent of requests had asked for an increase in hours of work. A breakdown of the type of requests made is shown in Figure 3.4.
Figure 3.4: Requested changes to working arrangements
Type of request made
35
23
14 13
75 5
9
0
10
20
30
40
Change whenwork incl
number ofdays
Reduce hoursof work
Flexitime Unspecified Increase hoursof work
Work fromhome
Work part-time Time off/ leavearrangements
Per
cent
Base: All employees who made a request
Unweighted base: 435
Source: WLB4 2011
The proportion of employees making requests by individual and employment characteristics are shown in Table C3.42. Female employees (28 per cent) and parents (27 per cent) were more likely to have made a request, compared with male employees (17 per cent) and non-parents (19 per cent). The likelihood of making a request was also higher among those with caring responsibilities for an adult in their household (30 per cent), compared with non-carers (21 per cent).
Other significant associations with employees making a request to change their working arrangements were as follows:
It was more common among employees working part-time (31 per cent), compared with those working full-time (19 per cent)
Those currently working part-time and flexibly and employees who worked part-time only were more likely to have made a request (38 and 32 per cent, respectively), compared with those employees who were not working part-time or flexibly and those working flexibly but not part-time (14 per cent and 20 per cent, respectively).
Making a request was also more common among public sector workers (25 per cent), compared with private sector workers (21 per cent).
68

Those working in the construction (11 per cent) and manufacturing industries (15 per cent) were least likely to have made a request to change their working arrangements. It was more likely among those working in public administration, education and health (26 per cent), distribution, retail, hotels and restaurants (23 per cent), transport, storage and communication (24 per cent) and banking, insurance, professional and support services (19 per cent).
Finally, those in a workplace where the staff were mostly men were least likely to have requested a change in working arrangements request (16 per cent), compared with those in workplaces where the staff were mostly women (26 per cent) and workplaces of a roughly equal gender mix (24 per cent).
How requests were made
Employees were asked how they had made their request and could list from five responses:
letter or form
face-to-face meeting or discussion
telephone
some other way.
Employees could list more than one method of communication as they could have used multiple channels (both formal and informal) to put their request forward. Eighty-five per cent of employees had made a request face to face, 16 per cent had used a letter or form, nine per cent used email and four per cent made a request by phone.
The employees’ responses were re-coded into formal and informal requests. Written requests (email and letter or form) were coded as ‘formal’ and spoken requests (face-to-face or telephone, other) were coded as informal. If an employee mentioned both an informal and formal method, their response was re-coded as formal. Seventy six per cent of the requests made had been through formal channels (letter or form, email), the remaining 24 per cent were informal requests (face to face meeting or discussion by phone).
Outcome of requests
Seventy-nine per cent of employees had their request to change their working arrangements accepted, with 61 per cent being accepted without negotiation/compromise/appeal and 18 per cent of requests being accepted after negotiation/compromise/appeal. Eight per cent were still awaiting the outcome of their request and 13 per cent had their request declined or declined after appeal. This is shown in Figure 3.5. The corresponding figures for WLB3 were; 68 per cent agreed outright, ten per cent agreed after negotiation, 17 per cent declined and five per cent still awaiting the outcome.
69

Figure 3.5: Outcome of requests to change working arrangements Base: All employees mak ing a request
Accepted after negotiation,compromise
or appeal18%
Awaiting the outcome or decision
8%
Declined or declined after appeal
13%
Accepted61%
Unweighted base=435
Source: WLB4 2011
Table C3.43 shows the outcome of the request by employee characteristics. Although the proportion of requests that were accepted was similar for both female and male employees (62 per cent and 60 per cent, respectively), men were more likely to have their requests declined (18 per cent), compared with women (10 per cent). Also, a higher proportion of women were awaiting the outcome of a decision; nine per cent, compared with five per cent of men.
There were also differences depending on the employees’ working status, with employees working part-time (68 per cent) being more likely to have their request accepted, compared with those working full-time (57 per cent). A similar pattern was seen with those working part-time and flexibly, as they were more likely to have their request accepted (78 per cent), compared with those working part-time only (53 per cent) and those not working part-time or flexibly (45 per cent). This latter sub-group were also more likely to have their request declined (22 per cent).
Figure 3.6 shows the proportion of requests that were declined for each change in working practice that had been requested. This was a multi-coded question as employees could have requested more than one change. Twelve per cent of the requests made by employees for a change in when they worked, including the number of days, were declined. Sixteen per cent of requests for an increase in working hours were declined. The proportion of requests declined for reduced hours (seven per cent), flexitime (nine per cent) , working from home (six per cent), working part-time (six per cent) and alternative leave arrangements (three per cent of requests were for time off/leave arrangements) were lower than the overall proportion of declined requests (13 per cent, Figure 3.5). The proportion of unspecified requests that were declined was higher than any of the other groups (23 per cent). These requests could not be coded and it is likely that the less standard nature of these requests contributed to their higher rate of decline.
70

Figure 3.6: Proportion of requests declined by type of change requested
% of each request type that was refused
12
79
23
6 63
16
0
10
20
30
40
Change whenwork incl
number ofdays
Reduce hoursof work
Flexitime Unspecified Increase hoursof work
Work fromhome
Work part-time Time off/ leavearrangements
Per
cen
t
Base: All employees mak ing a request
Unweighted base: 435
Source: WLB4 2011
Communication of the outcome of requests
Employees who had requested a change to their working arrangements were asked how the outcome of this request was communicated to them with the possibility of five responses:
letter or form
face-to-face meeting or discussion
telephone
some other way.
Figure 3.7 shows the proportion of employees receiving a response by each of the five methods of communication (note that percentages in this figure do not sum to 100. Employees were able to list more than one method since it was possible for employees to be notified of an outcome through more than one channel). The majority (76 per cent) of employees who made a request had received a response face-to-face. Fewer employees received responses by letter or form (21 per cent), email (11 per cent) or telephone (five per cent). One per cent gave an ‘other’ response.
71

Figure 3.7: Proportion of responses received by each form of communication
5
11
21
76
1
0 10 20 30 40 50 60 70 80
Other
Telephone
Letter or form
Face to face
Percent
Base: Employees who made a flexible work ing request
Unweighted base=435
Source: WLB4 2011
20These five responses were then re-coded into :
formal (written): letter or form, email,
and informal (spoken): face-to-face meeting or discussion, telephone, some other way.
Table C3.44 shows how the outcome of the request was communicated by a number of individual and employee characteristics. Seventy per cent of employees were notified of an outcome by informal methods of communication only. The remaining 30 per cent received their response either by formal written communication only or a combination of formal and informal methods.
This table shows that women were more likely to receive a formal notification of the outcome of their request, compared with men (38 per cent, compared with 18 per cent of men). Formal notification was also more commonly reported among employees who were a member of a trade union (41 per cent), compared with non-members (27 per cent). Employees working in routine and manual occupations were more likely to be told the outcome of their request informally (80 per cent), compared with employees in intermediate occupations (65 per cent) or employees in managerial and professional occupations (62 per cent). Employees working in the private sector (75 per cent) were more likely than employees in the public sector to be told informally (59 per cent).
20 Written requests (email and letter or form) were coded as ‘formal’ and spoken requests (face-to-face or telephone, other) were coded as informal. This question allowed multi-response; employees could give as many answers as relevant. If an employee mentioned both an informal method and a formal method, their response was re-coded as formal.
72

Sixty per cent of employees who made formal requests and had received an outcome were informed through formal (written) channels or by a mixture of formal and informal means of notification. The remaining 40 per cent of employees who had made a formal request received an informal (spoken) response only. Eighty per cent of employees who had made requests through informal channels received notification of their outcome through similar channels, with the remaining 20 per cent finding out through formal avenues.
Who dealt with the request to change working arrangements
Employees were asked who dealt with their request to change working arrangements. This is shown in Figure 3.8. Just over half (53 per cent) of employees said their line manager or supervisor dealt with their request. Twenty-seven per cent had their request dealt with by the managing director or company owner and ten per cent said head of department. Personnel/HR dealt with the request for eight per cent of employees and one per cent gave an ‘other’ response.
Figure 3.8: Who dealt with the employee’s request for changes to their work arrangements
Line manager/ supervisor
53%
Head of Department10%
Managing director/ owner/ director
27%
Personnel/ HR department
8%Other1%
Base: Employees who made a request
Unweighted base=435
Source: WLB4 2011
There was no significant association between who had dealt with the request and the final outcome.
Reasons for not making a request to change working arrangements
All those employees who had not made a request to change their working arrangements in the last two years were asked the reason for not doing so. Employees’ responses were coded into a list of 15 possible options, which were categorised into personal reasons, business/employer reasons and other reasons, as follows:
73

Personal reasons Doesn't suit domestic/household arrangements Content with current working arrangement Happy with current work-life balance Already working flexibly
Business/employer reasons Job does not allow it / Doesn’t suit my job Too much work to do Concerned about the extra workload for my colleagues Concerned about my career Concerned about my job security Not convinced my employer would allow it Do not feel confident enough to ask my employer Not eligible to request flexible working
Other reasons Could not afford any reduction in my income Not aware of the new right Other
It was possible for employees to cite more than one reason for not requesting a change to their working arrangement. Figure 3.9 shows the ‘grouped’ reasons for not making a request. The majority of employees (84 per cent) said they had not made a request to change their working arrangements due to personal reasons, 12 per cent said it was for business reasons, three per cent for both personal and business reasons and one per cent for other reasons.
Figure 3.9: Reasons given by employees for not requesting changes to their work arrangements
Personal84%
Other1%
Business12%
Both personal and business
3%
Base: Employees who did not make a request in past 2 years
Unweighted base=1,399
Source: WLB4 2011
74

Table C3.45 shows the reasons employees gave for not requesting to change their working arrangements by employee and employer characteristics. These significant differences are summarised below:
Employees with a disability or long-term illness were less likely to cite personal reasons (77 per cent), compared with those employees without a disability (85 per cent) and more likely to mention business reasons (19 per cent).
Full-time workers were more likely than part-time workers to say their reason for not requesting a change in working arrangements was due to business reasons (seven per cent, compared with 14 per cent).
Employees who were not working part-time or flexibly or working part-time only were more likely to mention business reasons for not requesting a change in their working arrangements (15 per cent and 13 per cent respectively), compared with those with other flexible working arrangements (seven to eight per cent).
Non-members of a trade union (85 per cent) were more likely to cite personal reasons for not requesting a change in working arrangements, compared to employees who were members of a trade union (80 per cent).
3.6 Who employers seem to prioritise
Employees were asked whether they felt their employers treated all staff requests to work flexibly the same, or whether they felt their employers prioritised some groups over others. The majority of employees (73 per cent) felt that their employers treated all requests the same, 21 per cent said they felt their employers prioritised certain groups of staff and six per cent said they did not know.
Employees were asked to identify which groups of staff they felt were treated more favourably by their employers when considering requests to work flexibly. This is shown in Figure 3.10. Employees who felt that staff were not treated with equal weight by employers when considering requests for flexible working were most likely to identify specific staff members or individuals (41 per cent) as being given priority within their workplace. Eighteen per cent of employees felt parents were prioritised and 13 per cent felt that staff members from specific departments within their workplace were more likely to be allowed to work flexible. Eleven per cent of employees felt senior managers were treated more favourably, compared with two per cent who felt staff from lower grades were.
75
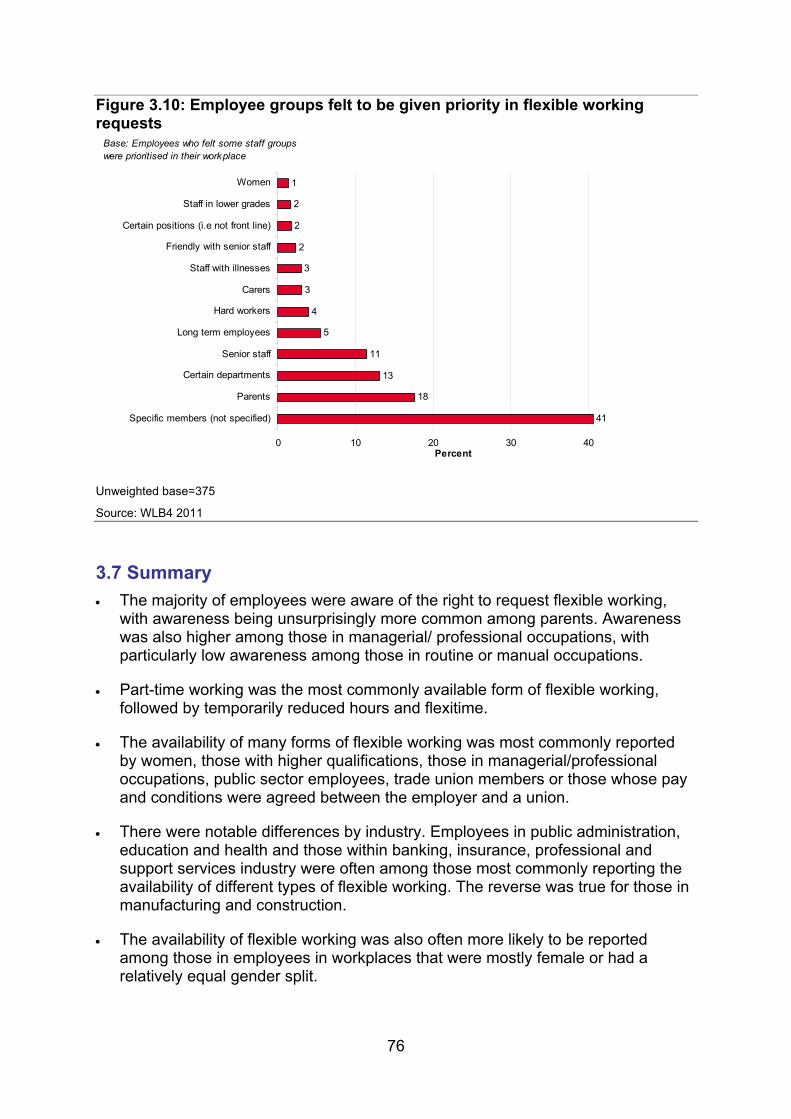
Figure 3.10: Employee groups felt to be given priority in flexible working requests
18
13
11
5
4
3
3
2
2
2
1
41
0 10 20 30 40
Specific members (not specified)
Parents
Certain departments
Senior staff
Long term employees
Hard workers
Carers
Staff with illnesses
Friendly with senior staff
Certain positions (i.e not front line)
Staff in lower grades
Women
Percent
Base: Employees who felt some staff groupswere prioritised in their workplace
Unweighted base=375
Source: WLB4 2011
3.7 Summary
The majority of employees were aware of the right to request flexible working, with awareness being unsurprisingly more common among parents. Awareness was also higher among those in managerial/ professional occupations, with particularly low awareness among those in routine or manual occupations.
Part-time working was the most commonly available form of flexible working, followed by temporarily reduced hours and flexitime.
The availability of many forms of flexible working was most commonly reported by women, those with higher qualifications, those in managerial/professional occupations, public sector employees, trade union members or those whose pay and conditions were agreed between the employer and a union.
There were notable differences by industry. Employees in public administration, education and health and those within banking, insurance, professional and support services industry were often among those most commonly reporting the availability of different types of flexible working. The reverse was true for those in manufacturing and construction.
The availability of flexible working was also often more likely to be reported among those in employees in workplaces that were mostly female or had a relatively equal gender split.
76
Flexitime, working from home and part-time working were the forms of flexible working most commonly taken up by employees.
The take-up of many forms of flexible working was often more common among women, parents, those with higher qualifications, those in the public sector and trade union members.
However, the patterns of take-up for part-time working, reduced working hours and job-share were somewhat different in some respects such as being more likely among those in routine or manual occupations, those not in managerial roles and non-trade union members.
Less than a quarter of employees had requested a change to their working arrangement in the last two years, most commonly a change in when they work or a reduction in hours. Women, parents and carers were most likely to have made a request. In the majority of cases, the request was accepted and the outcome communicated face-to-face.
Those who had not requested a change to their working arrangement typically had not done so for personal reasons (such as being happy with their current arrangement). However, there was a proportion who had not done so due to reasons related to the business/employer, which may be real or perceived.
77

4. Attitudes to work-life
balance
This chapter examines employees’ attitudes to flexible working. Section 4.1 begins by exploring how important flexibility was when employees initially took up their jobs and how important it is to them now. For employees who said they were working flexibly, Section 4.2 then goes on to consider the consequences of their working arrangements on them personally. For those whose colleagues work flexibly, the consequences of colleagues’ flexible working arrangements is also explored. Section 4.3 examines employees’ satisfaction with their current working arrangements and Section 4.4 closes the chapter by examining their wider attitudes to flexible working.
For each area differences between employee groups are examined. Relationships are only reported in the text if they are statistically significant (unless otherwise stated). In some instances key breaks have been collapsed due to small sample sizes, where this occurs it is flagged in the table footnotes.
4.1 Importance of availability of flexible working arrangements
21 Importance of flexibility to job choice
Employees were asked how important the availability of flexible working was for them when they initially decided to work for their current employer. Twenty-three per cent of employees said flexibility was ‘very important’, 18 per cent said it was ‘quite important’ and 58 per cent said flexibility was ‘not important’ when they initially took up their current job (Table C4.1).
The proportion of employees saying that flexible working was important to them when they initially decided to take up their current job has increased since 2006. In the WBL3 survey, 19 per cent of employees said it was ‘very important’ and 20 per cent ‘quite important’22.
21 When considering the relationship between different personal characteristics and importance of flexible working when initially deciding to take a job, it should be remembered that some personal characteristics (e.g. having dependent children) may have changed since the job was started. Characteristics reported here were recorded at the time of interview in 2011, not as they were when the job was started (which could have been some years before). It may therefore be more robust to consider importance of flexible working now according to personal characteristics – see next sub-section.
22 Note: due the change in survey design at WLB4, these changes cannot be tested for statistical significance.
78

The availability of flexible working in the decision to take up a job corresponded to the employees’ current flexible working status. Seventy-two per cent of those not working part-time or flexibly said the availability of flexible working had not been important when they decided to take that job, compared with 59 per cent of those working flexibly other than part-time, 39 per cent of those working part-time and flexibly and 35 per cent of those working part-time only.
When initially deciding to take up a job, flexible working was more important to women than men. Thirty-three per cent of women said flexible working was ‘very’ important compared with 14 per cent of men. However, working patterns also made a difference: overall, 45 per cent of those working part-time said flexible working was ‘very important’, compared with 16 per cent of those working full-time. Part-time employees were predominantly women (see Section 2.2). When looking just at part-time employees, the gender gap was still evident, but had narrowed: 48 per cent of women working part-time said flexibility was ‘very important’ compared with 37 per cent of men working part-time. Similarly for full-timers, 24 per cent of women working full-time said flexibility was very important, compared with only 10 per cent of men working full-time.
The availability of flexible working was also more likely to be ‘very important’ for:
Non-white employees (31 per cent), compared with white employees (23 per cent).
Parents (32 per cent), compared with those without children (18 per cent).
Those with lower annual household incomes (32 per cent of those with annual income of less than £15,000, compared with 18 per cent of those with an income of £45,000 or more).
Employees with caring responsibilities for a relative or an adult in the household (31 per cent), compared with those with no caring responsibilities (22 per cent).
Employees living in the Midlands (30 per cent), Wales (27 per cent) and the South of England (24 per cent), compared with the North of England (19 per cent) and Scotland (16 per cent).
Employees who had started their current job in the last year – 27 per cent for those who had been with their current employer for less than six months and 31 per cent for the six to 11 month group, compared with 20 per cent for those who had been with their current employer for ten or more years.
There were also differences by type of job and/or employer, although these are easier to distinguish by looking at the proportions who said that flexible working was ‘not important’:
Those who were managers or supervisors (63 per cent) were more likely to say that availability of flexible working arrangements was not important,
79

compared with those without management or supervisor responsibilities (55 per cent).
Similarly, those in managerial or professional occupations (63 per cent) were more likely to say that availability of flexible working arrangements was not important, compared with those in routine and manual occupations (53 per cent).
There was some association with size of the workplace with those in larger workplaces, for example, those employees working in at a workplace of 250 or more, which were part of a larger organisation, (67 per cent) were more likely to say flexible working arrangements were not important in their decision to take up the job compared with those in workplace of one to nine on a single site (48 per cent).
Finally, there were interesting differences according to industry type (Fig 4.1). Flexible working was most likely to be ‘not important’ for those in transport, storage and communications (76 per cent), construction (75 per cent) and manufacturing (74 per cent), compared with 44 per cent of those working in distribution, retail, hotels and restaurants and 52 per cent of those working in public administration, education and health. These latter two groups were most likely to say flexible working was ‘very important’ (30 per cent and 29 per cent, respectively), followed by banking, insurance, professional and support services (20 per cent).
Figure 4.1 Importance of flexible working when initially deciding to take job by industry
146
30
1320
29 25
1219
26
11
16
1918
74 75
44
7664
52 57
0
20
40
60
80
100
Manufacturing Construction Distribution,retail, hotels &
restaurants
Transport,storage &
communication
Banking,insurance,
professionaland support
services
Public Admin,Education,
Health
Other activities
Per
cen
t
Very important Quite important Not importantBase: All employees
Unweighted base: 1,858 Source: WLB4 2011
Further analysis was carried out using the parents and carers boost samples to look at how important the availability of flexible working arrangements was to parents and carers in their decision to take up a job.
80

For parents: Table C4.2 clearly demonstrates a gender split between parents: 64 per cent of females with dependant children said flexible working had been an important factor in their initial decision to take up a job (47 per cent ‘very important, 17 per cent ‘quite important’), compared with 32 per cent of men with dependent children (17 per cent ‘very important’, 15 per cent ‘important’).
This gender difference existed regardless of relationship status: half of the mothers who were a lone parent (50 per cent) and nearly half of mothers who were part of a couple (47 per cent) said flexible working arrangements were very important, compared with 16 per cent of fathers who were part of a couple. This is likely to be related to how family work patterns relate to childcare. Lone parent earners (who are predominantly female) and dual earner couples were most likely to say flexible working was very important (46 per cent and 34 per cent, respectively). This proportion was much lower for couple parents where there was a single earner (21 per cent) and the other partner (usually the mother) was available for childcare.
There was no statistically significant difference according to age of child.
For carers: Table C4.3 shows that the availability of flexible working when making initial job choice was more likely to be very important for carers who were:
Part-time employees – 52 per cent of carers working part-time said ‘very important’ compared with 22 per cent for carers working full-time.
Women – 39 per cent of female carers compared with 21 per cent of male carers.
Parents – 38 per cent compared with 27 per cent of non parents.
Those aged under 45. The proportion was 35 per cent for the 16-44 age group compared with 27-28 per cent for older employees (this may be related to parental status).
There were no statistically significant differences according to type of caring responsibility.
Importance of flexible working now
In addition to asking employees how important the availability of flexible working was in their initial decision to take up their job, they were also asked how important this was for them now (at the time of the interview). The results of this analysis, by the standard sub-groups, are shown in Table C4.4.
Overall, 31 per cent said the current availability of flexible working in their workplace was ‘very important’ to them now; a further 26 per cent said this was ‘quite important’ and 43 per cent said this was ‘not important’. This shows an interesting increase in the proportion reporting that flexible working was ‘very important’ or ‘quite important’ now, compared with when the job was initially taken up (Figure 4.2). This may reflect changes in circumstances (for example having a child) and/or changes in attitude to flexible working.
81
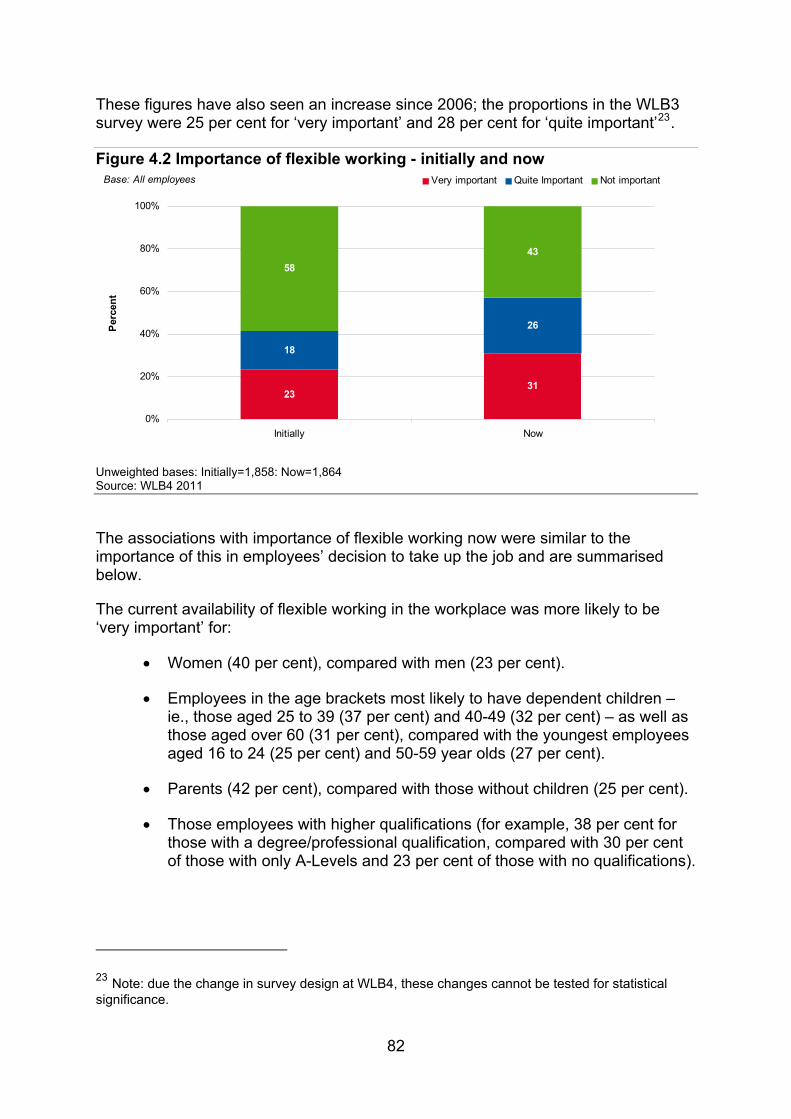
These figures have also seen an increase since 2006; the proportions in the WLB3 survey were 25 per cent for ‘very important’ and 28 per cent for ‘quite important’23.
Figure 4.2 Importance of flexible working - initially and now
2331
18
26
58
43
0%
20%
40%
60%
80%
100%
Initially Now
Per
cen
t
Very important Quite Important Not importantBase: All employees
Unweighted bases: Initially=1,858: Now=1,864 Source: WLB4 2011
The associations with importance of flexible working now were similar to the importance of this in employees’ decision to take up the job and are summarised below.
The current availability of flexible working in the workplace was more likely to be ‘very important’ for:
Women (40 per cent), compared with men (23 per cent).
Employees in the age brackets most likely to have dependent children – ie., those aged 25 to 39 (37 per cent) and 40-49 (32 per cent) – as well as those aged over 60 (31 per cent), compared with the youngest employees aged 16 to 24 (25 per cent) and 50-59 year olds (27 per cent).
Parents (42 per cent), compared with those without children (25 per cent).
Those employees with higher qualifications (for example, 38 per cent for those with a degree/professional qualification, compared with 30 per cent of those with only A-Levels and 23 per cent of those with no qualifications).
23 Note: due the change in survey design at WLB4, these changes cannot be tested for statistical significance.
82

Those employees with caring responsibilities for a relative or an adult in the household (40 per cent) compared with those with no caring responsibilities (29 per cent).
Again, part-time workers were more likely than full-time workers to say flexible working was currently ‘very important’ (50 per cent, compared with 25 per cent). Female part-time workers were most likely to say flexible working was currently ‘very important’ (53 per cent), followed by male part-time workers (41 per cent). This was compared with 31 per cent for female full-time workers and 21 per cent for male full-time workers.
When looking at employer characteristics, two factors were found to be associated with the importance of flexible working; the industry type and size of workplace:
Employees in manufacturing or construction were those most likely to say the current availability of flexible working was ‘not important’ (57 and 56 per cent respectively) and those in public administration, education and health most likely to say it was ‘very important’ (38 per cent).
The association with size of workplace was more complex but there is an indication that flexible working may be more important to those in smaller or very large workplaces. Those in workplaces of 50-249 employees (whether a single site or part of larger organisation) were more likely than those in smaller or much larger single site workplaces to say flexible working was not important.
As above, further analysis was carried out to establish the importance of the ‘current availability’ of flexible working arrangements among parents and carers.
For parents (Table C4.5): again, analysis demonstrated clearly a gender split between parents: 81 per cent of females with dependent children said availability of flexible working was important now (58 per cent ‘very important’, 23 per cent ‘quite important’), compared with 59 per cent for men with dependent children (28 per cent ‘very important’, 31 per cent ‘important’).
This gender difference existed regardless of relationship status: 54 per cent of mothers who were a lone parent and 59 per cent of mothers who were part of a couple said flexible working arrangements were ‘very important’, compared with 27 per cent of fathers who were part of a couple. Again, this is likely to be related to how family work patterns relate to childcare. Lone parent earners (who are predominantly female) and dual earner couples were most likely to say flexible working was ‘very important’ (50 per cent and 46 per cent, respectively). This proportion was lower for couple parents where there was a single earner (32 per cent) and the other partner (usually the mother) was available for childcare.
In this analysis of the importance of the availability of flexible working to parents now, the age of child was statistically significant: 75 per cent of parents with a child aged under six said flexible working was important (50 per cent ‘very’, 25 per cent ‘quite’). This decreased among parents whose youngest child was aged 6-11 (71 per cent – 44 per cent ‘very’, 27 per cent ‘quite’) and was lowest for those with older children, aged 12 or over (60 per cent, 30 per cent ‘very’, 30 per cent ‘quite’).
83

For carers (Table C4.6): The availability of flexible working now was more likely to be ‘very important’ for carers who were:
Part-time employees – 54 per cent of carers working part-time said ‘very important’, compared with 34 per cent of carers working full-time.
Women – 44 per cent of female carers, compared with 34 per cent of male carers.
Parents – 45 per cent, compared with 37 per cent of non-parents.
Although there appeared to be differences according to type of caring responsibility and age, these were not large enough to be statistically significant.
4.2 Consequences of working flexibly
Consequences of individual working flexibly
All those employees who mentioned that they currently worked or had worked flexibly in the last 12 months24 were asked to consider what the positive and negative consequences were of them working in this way. These were open questions: respondents were invited to express their spontaneous opinions in their own words and their answers were then coded by the interviewer. Multiple responses could be given, but respondents were not prompted to consider particular things.
ere
). Five per cent said there were no positive consequences of them working flexibly.
Figure 4.3 below shows the range of responses employees gave as being the positive consequences of working flexibly. Just under a quarter (24 per cent) said it meant they had more free time (including more holidays), 18 per cent said they wable to spend more time with their family and 17 per cent said that their work-life balance improved. Other commonly cited positive consequences were around the concept of convenience, including suiting their circumstances (14 per cent) and also allowing them to make suitable childcare arrangements (12 per cent
24 Those who worked one or more flexible arrangement in the last 12 months.
84
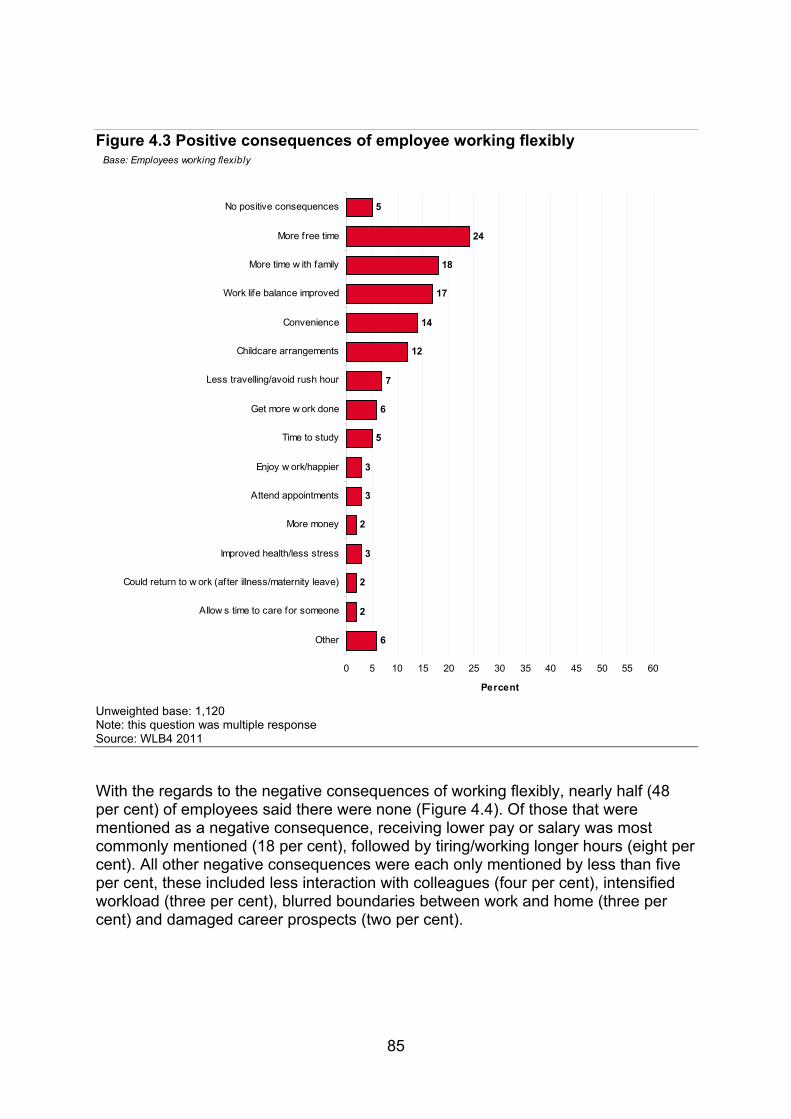
Figure 4.3 Positive consequences of employee working flexibly
6
2
2
3
3
3
5
6
7
12
14
17
18
24
5
2
0 5 10 15 20 25 30 35 40 45 50 55 60
Other
Allow s time to care for someone
Could return to w ork (after illness/maternity leave)
Improved health/less stress
More money
Attend appointments
Enjoy w ork/happier
Time to study
Get more w ork done
Less travelling/avoid rush hour
Childcare arrangements
Convenience
Work life balance improved
More time w ith family
More free time
No positive consequences
Percent
Base: Employees working flexibly
Unweighted base: 1,120 Note: this question was multiple response Source: WLB4 2011
With the regards to the negative consequences of working flexibly, nearly half (48 per cent) of employees said there were none (Figure 4.4). Of those that were mentioned as a negative consequence, receiving lower pay or salary was most commonly mentioned (18 per cent), followed by tiring/working longer hours (eight per cent). All other negative consequences were each only mentioned by less than five per cent, these included less interaction with colleagues (four per cent), intensified workload (three per cent), blurred boundaries between work and home (three per cent) and damaged career prospects (two per cent).
85

Figure 4.4 Negative consequences of employee working flexibly
13
1
1
1
2
2
3
3
4
8
18
48
2
0 5 10 15 20 25 30 35 40 45 50 55 60
Other
Logistics e.g. unable to attendmeetings
No over time/set hours
No f lexibility over holiday time
Damaged career prospects
Holidays more expensive
Missing out on family time
Intensif ied w orkload
Blurred boundaries betw eenw ork and home
Less interaction w ithcolleagues
Tiring/w orking longer hours
Receive low er pay/salary
None
Percent
Base: Employees working flexibly
Unweighted base: 1,116 Note: this question was multiple response Source: WLB4 2011
Consequences for employees of colleagues working flexibly
Those employees who mentioned one or more flexible working arrangements being available in their workplace were then asked if any of their colleagues worked in these ways and if so, asked to comment on the positive and negative consequences for them of their colleagues working flexibly.
As shown in Figure 4.5, more than half of employees (55 per cent) did not perceive themselves to gain any positive consequences from their colleagues working flexibly. The positive consequences that were mentioned included a ‘better working atmosphere/happier staff’ (14 per cent), ‘allows staff flexibility’ (seven per cent), ‘allows business flexibility’ (three per cent) and ‘allows me (the employee) to work
86

flexibly’ (three per cent). Despite emphasis in the question wording that the positive consequences were for the respondent themselves, three per cent mentioned ‘colleagues have more job satisfaction/work harder’ and a further two per cent said that it meant colleagues had a better work-life balance which suggest that some respondents misunderstood the question.
Figure 4.5 Positive consequences of colleagues’ working flexibly
9
1
1
1
2
2
3
3
3
7
14
55
1
0 5 10 15 20 25 30 35 40 45 50 55 60
Other
Less stressful
Everyone treated the same
Convenient
Know ing that f lexible w orkingis an option
Keeps valued members ofstaff
Better w ork-life balance forcolleague
Allow s business f lexibility
Allow s me to w ork flexibly
Colleagues have more jobsatisfaction/w ork harder
Allow s staff f lexibility
Better w orking atmosphere
None
Percent
Base: Employees with colleagues working flexibly
Unweighted base: 1,341 Note: this question was multiple response Source: WLB4 2011
Fifty-seven per cent of employees reported there were no negative consequences of their colleagues working flexibly (Figure 4.6). Among those who did mention a negative consequence the most commonly reported were; ‘lack of interaction between staff’ (nine per cent), ‘increased workload/varied workload’ (eight per cent) and ‘colleagues not available’ (eight per cent).
87

Figure 4.6 Negative consequences of colleagues’ working flexibly
8
1
1
2
2
3
4
8
8
9
57
2
0 5 10 15 20 25 30 35 40 45 50 55 60
Other
Work not completed/delays inw ork being completed
Low staff morale
Stressful/puts more pressureon other people
Restriction in holidays/time off
Continuity issues
Staff shortages/staff unw illingto cover
Cover colleagues w ork
Increased w orkload/variedw orkload
Colleagues not available
Lack of interaction betw eenstaff
None
Percent
Base: Employees with colleagues working flexibly
Unweighted base: 1,320 Note: this question was multiple response Source: WLB4 2011
Comparisons over time
Since WLB3 there have been some changes in the proportions of participants expressing positive and negative views of the consequences of the employee or employees colleagues’ working flexibly. These are summarised below but it should be noted that, due to the change in survey design at WLB4, these changes cannot be tested for statistical significance.
Positive consequences for employees:
88

The proportions reporting ‘more free time’ and ‘more time with family’ have reduced at WLB4, compared with WLB3 (19 per cent v 34 per cent and 18 per cent v 33 per cent, respectively)
The proportions reporting ‘work-life balance improved’, ‘convenience’ and ‘childcare arrangements’ have increased at WLB4, compared with WLB3 (17 per cent v two per cent, 14 per cent v four per cent and 12 per cent v two per cent, respectively)
Similar proportions reported no positive consequences (WLB4 five per cent v WLB3 six per cent).
Negative consequences for employees:
Similar proportions reported no negative consequences (WLB4 48 per cent v WLB3 52 per cent)
Proportions for other negative consequences were also similar for example, ‘receive low pay/salary’ (WLB4 18 per cent v WLB3 19 per cent).
25Positive consequences of colleagues working flexibly :
A higher proportion reported no positive consequences of their colleagues working flexibly at WLB4 (55 per cent), compared with WLB3 (15 per cent)
All of the proportions of the positive consequences of colleagues working flexibly were lower at WLB4 apart from ‘better working atmosphere’ (WLB4 14 per cent v WLB3 11 per cent).
Negative consequences of colleagues working flexibly:
A higher proportion reported no negative consequences of their colleagues working flexibly at WLB4 (57 per cent), compared with WLB3 (41 per cent)
A higher proportion reported ‘lack of interaction between staff’ as a negative consequences of their colleagues working flexibly at WLB4 (nine per cent), compared with WLB3 (two per cent)
Proportions for other negative consequences were similar for example, ‘cover colleagues work’ (WLB4 five per cent v WLB3 six per cent).
It is important to note that, due to the change in survey design at WLB4, these changes cannot be tested for statistical significance.
25 Note: there was major change in question emphasis between WBL3 and WBL4. In WBL3 it was recognised that many respondents were thinking about positive and negative consequences for the colleague rather than themselves. In WBL4 the question wording emphasised that the respondent was to report consequences for themselves, not for their colleagues.
89

4.3 Satisfaction with current working arrangements
All employees were asked the following question:
‘How satisfied are you with your current working arrangements? Are you satisfied, neither satisfied nor dissatisfied or dissatisfied?
If satisfied: Is that very satisfied or satisfied?
If dissatisfied: Is that very dissatisfied or dissatisfied?’
The majority of employees were very satisfied or satisfied with their current working arrangements (85 per cent – 37 per cent ‘very satisfied’ and 48 per cent ‘satisfied’). Eight per cent were neither satisfied nor dissatisfied, six per cent were dissatisfied and two per cent were very dissatisfied (Figure 4.7).
There were differences in employees’ level of satisfaction, in particular there were differences based on their current flexible working arrangements (Figure 4.7):
Part-time workers were more likely than full-time workers to say they were ‘very satisfied’ with their working arrangements (45 per cent, compared with 34 per cent of full-time workers) and less likely to express dissatisfaction (four per cent, compared with nine per cent for full-time workers).
Employees with flexible working were much more likely then those without flexible working to say they were ‘very satisfied’ with their current arrangements (46 per cent for part-time flexible workers, 40 per cent for full-time flexible workers, compared with 37 per cent for those with part-time working only and 31 per cent of those with no flexible or part-time working).
Those with flexible working arrangements were similarly less likely to express dissatisfaction (three per cent for those with part-time flexible working, six per cent for full-time flexible workers compared with 10 per cent for both part-time and full-time employees with no flexible working).
90

Figure 4.7 Satisfaction with working arrangements
37 3746
3140
48 46
45
52
46
8 8
7
88
6 8 9 4
0
20
40
60
80
100
All Part-time only Part-timeflexible
Full-time only Full-time f lexible
Per
cen
t
Very satisfied SatisfiedNeither satisfied nor dissatisfied DissatisfiedVery dissatisfied
Base: All employees
Unweighted base: 1,873 Source: WLB4 2011
Employees were also significantly more likely to be dissatisfied with their current working arrangements if they were:
Middle aged – the proportion reporting that they were dissatisfied/very dissatisfied rose with age from five per cent for 16-24 to 11 per cent of those aged 50-59, but dropped to three per cent for those aged 60 plus
White – eight per cent, compared with 12 per cent among non-white employees
Disabled – 14 per cent, compared with seven per cent of those without a long standing illness or disability
26 Not permanent employees – 17 per cent, compared with seven per cent for permanent employees
Trade union members – ten per cent, compared with seven per cent for those were not members of a union (Table C4.7)
Finally, the size of the employees’ workplace was found to be associated with the level of the employees’ satisfaction, with those in workplaces of 50 to 249 staff,
26 Includes temporary (seasonal, agency or casual), fixed term and other arrangements – categories combined because numbers in these sub-groups were too low to be analysed separately.
91

whether they were part of a large organisation or a single site organisation, least likely to be very satisfied (26 per cent and 34 per cent, respectively).
4.4 Attitudes to work-life balance practices
All employees were asked to give their opinion about four attitude statements about work-life balance:
“It is not the employer’s responsibility to help people balance their work and family life”
“Having more choice in working arrangements improves workplace morale”
“People who work more flexibly create more work for others”
“People who work flexibly are less likely to get promoted”
The results, summarised in Figure 4.8, show a generally high level of support for work-life balance practices, with a particularly high percentage having a positive view of the impact on workplace morale. Opinion regarding the impact of flexible working on the workloads of others and on promotion prospects was more divided.
Figure 4.8: Attitudes to work-life balance practices
26
90
35 32
20
6
22 24
5444 44
5
0%
20%
40%
60%
80%
100%
It is not the employer'sresponsibility to help
people balance their w orkand life.
Having more choice inw orking arrangementsimproves w orkplace
morale.
People w ho w ork f lexiblycreate more w ork for
others.
People w ho w ork f lexiblyare less likely to get
promoted.
Per
cen
t
Strongly agree or agree Neither agree nor disagree Disagree or strongly disagreeBase: All employees
Unweighted base: 1,854 Source: WLB4 2011
Below employees’ responses to each question are analysed by the standard breaks, with additional analysis of the parent boost samples.
92

It is not the employer's responsibility to help people balance their work and life.
Over half of employees disagreed with this statement (54 per cent – 39 per cent disagreeing and 15 per cent strongly disagreeing). Twenty per cent neither agreed nor disagreed. Only 26 per cent agreed that it was not the employer’s responsibility to help people balance their work and life (22 per cent agreed; four per cent strongly agreed).
Table C4.8 shows that those employees most likely to agree with the statement that flexible working was not the employers’ responsibility were:
Those with no qualifications (36 per cent, with the proportion agreeing that work-life balance was not the employers’ responsibility falling to 20-21 per cent for those with a degree/post-graduate qualification).
Those on the lowest household incomes of less than £15,000 (31 per cent, with the proportions who agreed falling as household income rose, to 18 per cent for those with household incomes of £45,000 or more).
Those who work part-time and flexibly and those working full-time and non-flexibly (both 28 per cent), compared with those working part-time non-flexibly (24 per cent) and those working full-time and flexibly (21 per cent). Part-time flexible workers were most likely to strongly agree, with five per cent doing so, compared with two per cent of full-time non-flexible workers.
Those who are not members of a trade union (29 per cent, compared with 21 per cent of trade union members)
Those in routine and manual occupations (33 per cent, compared with 21 per cent of those in intermediate occupations and 22 per cent of those in managerial/professional occupations)
Working in the private sector (27 per cent, compared with 22 per cent in the public sector)
There were also differences by occupational categories: those working in the construction industry were most likely to agree with the statement that work-life balance was not the employers’ responsibility (42 per cent), followed by those in manufacturing (30 per cent), distribution, retail, hotels and restaurants (27 per cent), transport, storage and communication (27 per cent) and public administration, education and health (23 per cent). Employees in banking, insurance, professional and support services were least likely to agree with this statement (21 per cent).
When looking at parents (Table C4.9), there were no significant differences according to gender or family status. However, there were differences when family and work status were combined: mothers and fathers who were part of a couple were those most likely to disagree with this statement (61 per cent and 56 per cent, respectively), compared with lone mothers (52 per cent). Twenty-two per cent of women with children who were currently working full-time strongly disagreed with this statement, compared with 15 per cent of mothers working part-time.
93

Among parents there were significant differences according to age of child: those with the youngest children (aged under 6) were least likely to agree that work-life balance was not employers’ responsibility – 22 per cent with 18 per cent ‘agreeing’ and only four per cent ‘agreeing strongly’ (Table C4.9). This was compared with 28 per cent agreement for those with youngest children aged 6-11 and 12 and over (for whom 25-26 per cent ‘agreed’, three per cent ‘strongly agreed’, respectively).
Having more choice in working arrangements improves workplace morale.
The majority of employees agreed with this statement (90 per cent) with 52 per cent agreeing and 38 per cent strongly agreeing, six per cent neither agreeing nor disagreeing, and four per cent disagreeing with one per cent strongly disagreeing.
Table C4.10 shows that employees were more likely to disagree that having more choice improves morale if they were:
Male (six per cent disagreed, compared with four per cent of female employees)
Older employees – seven per cent of those over 60 and aged 50-59 disagreed, compared with five per cent of those aged 40-49, and four per cent of those aged 25-39. No one aged under 25 disagreed with the statement, although this age group were more likely than the others to say ‘neither agree nor disagree’
Full-time workers – five per cent disagreed, compared with two per cent of part-time workers
Those with A-levels or degree/professional qualifications were least likely to disagree/disagree strongly (one per cent and two per cent respectively), compared with five per cent of those whose highest qualification was GCSE (or equivalent) and 11 per cent of those with no qualifications. However, seven per cent of those with postgraduate degrees disagreed, illustrating that the relationship with highest level of qualification relates to likelihood of expressing any opinion as well as in which direction opinion is expressed (those with degree/professional qualifications and post-graduate degrees were less likely than other groups to say ‘neither agree nor disagree).
For parents, 94 per cent of female employees with children agreed that flexibility improved morale (46 per cent ‘strongly agreed’), compared with 91 per cent of male employees with children (37 per cent ‘strongly agreed’; Table C4.11).
The gender differences in levels of agreement were not affected by work status: overall there was no difference between females with children currently working full-time or part-time in terms of whether they were likely to agree (94 and 95 per cent respectively, compared with 91 per cent of males working full-time). However, the females with children who were working part-time were less likely than mothers or fathers working full-time to confidently disagree with the statement (one per cent, compared to four and five per cent, respectively).
94

People who work flexibly create more work for others.
Forty-four per cent of employees disagreed with this statement with 35 per cent disagreeing and nine per cent strongly disagreeing. Just over a fifth (22 per cent) neither agreed nor disagreed and 35 per cent agreed (with seven per cent ‘strongly agreeing’).
The main significant differences in the responses to this statement are summarised below (Table C4.12):
Forty per cent of males agreed with this statement (33 per cent agreed, seven per cent strongly agreed), compared with 30 per cent of females (24 per cent agreed, six per cent strongly agreed).
Non-white employees were more likely to agree with this statement (49 per cent – 42 per cent agreed, seven per cent strongly agreed) than white employees (34 per cent – 27 per cent agreed, seven per cent strongly agreed).
Those employees with no qualifications were the group most likely to agree that people who work flexibly create more work for others (41 per cent agreed, seven per cent strongly agreed). The proportions agreeing declined as qualifications increased. Among those with a postgraduate degree (20 per cent agreed, six per cent strongly agreed). This latter group were most likely to disagree with the statement (54 per cent – 41 per cent disagreed, 14 per cent strongly disagreed).
Employees with an annual household income of £45,000 or more were least likely to agree with the statement (26 per cent – 21 per cent agreed, five per cent strongly agreed). Those with an annual household income of under £15,000 were most likely to agree (48 per cent – 39 per cent agreed, nine per cent strongly agreed). The proportions agreeing tended to decline as income rose, with the exception of those with middle incomes (£25,000-£34,000) who were less likely to agree than those in the bracket above.
Those with caring responsibilities were more likely than those without to agree that people who worked flexibly created more work for others (40 per cent of carers – 30 per cent agreed, ten per cent strongly agreed, compared with 33 per cent of non-carers – 27 per cent agreed, six per cent strongly agreed).
Those with flexible working other than part-time working were least likely to agree (24 per cent – five per cent strongly agreed, 19 per cent agreed). This compares to 38-39 per cent among other groups: those working part-time only (38 per cent – seven per cent strongly agreed, 31 per cent agreed), those working part-time and flexibly (39 per cent – nine per cent strongly agreed, 30 per cent agreed) and those without part-time or flexible working (39 per cent – six per cent strongly agreed, 32 per cent agreed).
Those in intermediate occupations were least likely to agree that people who work flexibly create more work for others (22 per cent - four per cent strongly agreed, 18 per cent agreed), followed by those in managerial and professional
95

occupations (29 per cent – five per cent strongly agreed, 24 per cent agreed). Those in routine and manual occupations were most likely to agree (45 per cent – nine per cent strongly agreed, 36 per cent agreed).
Employees working in the private sector were more likely to agree (36 per cent – seven per cent strongly agreed, 29 per cent agreed) than those in the public sector (31 per cent – five per cent strongly agreed, 26 per cent agreed).
Among the different industry types, those working in construction were most likely to agree with the statement (54 per cent – eight per cent strongly agreed, 46 per cent agreed), followed by those working in distribution, retail, hotels and restaurants (45 per cent – ten per cent strongly agreed, 35 per cent agreed). Least likely to agree were those in banking, insurance, professional and support services (26 per cent – two per cent strongly agreed, 24 per cent agreed).
There were also significant differences according to size of employer. These are difficult to interpret, but it appears that those in larger workplaces of 250 or more employees, either a single site or part of a larger organisation, were more likely to disagree with the statement that people who work flexibly create more work for others.
Looking just at parents, there were also significant associations with parental status and agreement or disagreement with the statement that people who work flexibly create more work for others (Table C4.13). Women with dependent children were more likely to disagree (39 per cent) or strongly disagree (14 per cent) with the statement, compared with men with dependent children (33 per cent disagreed, nine per cent strongly disagreed). Looking at family status, lone parents were more likely to strongly agree with the statement (12 per cent), compared with five per cent of parents who were part of a couple. Fifty-four per cent of mothers who were part of a couple disagreed (40 per cent) or strongly disagreed (14 per cent) with the statement, compared with a 42 per cent of fathers who were part of a couple (33 per cent disagreed, nine per cent strongly disagreed).
There were some interesting associations with family employment status. Lone parent earners were most likely to strongly agree with the statement that people who work flexibly make more work for others (12 per cent), however a similar proportion of this group (11 per cent) strongly disagreed with the statement. This group was also least likely to neither agree nor disagree (15 per cent). Among the other groups dual earner couples with children were most likely to disagree with the statement (51 per cent – 38 per cent disagreed, 13 per cent strongly disagreed).
Finally, 52-53 per cent of females working part-time or full-time disagreed (strongly or otherwise) with the statement, compared with 43 per cent of male full-time workers.
People who work flexibly are less likely to get promoted.
Overall just under a third, 32 per cent of employees agreed with this statement, with six per cent strongly agreeing and 26 per cent agreeing. Twenty-four per cent of
96
employees neither agreed nor disagreed, 37 per cent disagreed and seven per cent strongly disagreed.
Unlike the previous statements, there were fewer significant associations with employees’ characteristics and agreement or disagreement with the statement (Table C4.14). Those differences that were found are as follows:
Men were more likely to agree with this statement than were women (37 per cent, compared with 28 per cent).
Seventeen per cent of non-white employees agreed strongly that people who work flexibly are less likely to get promoted, compared with five per cent of white employees.
Those employees not currently working part-time or with flexible working were most likely to agree with the statement (38 per cent), compared with 27 per cent of those working part-time with flexible working and 24 per cent of those working full-time with flexible working. Those currently working flexibly other than part-time were least likely to agree (24 per cent) and most likely to strongly disagree with the statement (13 per cent).
Employees working in intermediate occupations were least likely to agree that people who work flexibly are less likely to get promoted (25 per cent), compared with those in managerial and professional occupations (32 per cent) and those in routine and manual occupations (36 per cent).
Employees working in the private sector were more likely to agree (35 per cent) than those in the public sector (28 per cent).
With regards to parents, there were no significant associations with their family or employment status and the likelihood of agreeing or disagreeing with the statement ‘people who work flexibly are less likely to get promoted’ (Table C4.15).
4.5 Summary
The majority of employees were satisfied with their current working arrangements. High levels of satisfaction were more common among those working part-time and those with other flexible working arrangements.
The availability of flexible working was important for just over two in five employees when they made their decision to work for their current employer, and may have increased in importance since the last WLB survey.
The importance of flexible working has increased among employees since they started with their employers, with almost three in five reporting that the availability of flexible working was very or quite important to them now.
Flexible working was, both when taking the job and at the time of the survey interview, more important to women, employees who were parents and those
97

with caring responsibilities. It was also most important to those who were now actually working part-time or other flexible working arrangement.
The gender differences in the importance of flexible working were significant across all employees, among parent employees and among those with caring responsibilities.
There were also significant differences by industry. The availability of flexible working was least important to those in the manufacturing and construction industries.
The main advantages of flexible working for those doing so were an increase in the amount of free time, increased time spent with family, improved work-life balance and greater convenience. Nearly half of those working flexibly did not feel that there were any negative consequences of doing so. Lower pay was the negative consequence most cited.
Over half of employees with colleagues working flexibly did not think that this had positive or negative consequences for them personally. However, a better working atmosphere and staff flexibility were most cited as positive consequences. A lack of interaction between staff, colleagues being unavailable and increased workload were seen as a the most common negative consequences.
These views were echoed in the attitudes of all employees towards work-life balance practices. The vast majority of employees agreed that having more choice in working arrangements improves morale. However, around one third thought that people who work flexibly create more work for others.
Around one quarter of employees thought that it was not the employer’s responsibility to help people balance their work and life. This was more common among those employees with no qualifications, in routine and manual occupations and with low household incomes. These groups were also less likely to view the availability of flexible working as important and more likely to agree that people working flexibly create more work for others.
Around one third of employees believed that people working flexibly were less likely to get promoted. This view was most commonly held by those not working flexibly, men, those in routine and manual occupations, those in managerial and professional occupations and those in the private sector.
98

5. Parents and carers
This chapter begins by exploring the characteristics of employees who are parents and/or have caring responsibilities. Attention then focuses on three particular types of leave relevant to parents:
Time off for children’s illness.
Fathers’ leave for antenatal appointments.
Parental leave.
The use of time-off for dependents is then examined, looking at the incidence of taking time off for an emergency and the characteristics of those who were most likely to have taken time off to deal with an emergency. The chapter concludes by examining the sorts of employer-provided childcare support available to parents.
Relationships reported in the text of this chapter are statistically significant unless otherwise stated. In some instances key breaks have been collapsed due to small sample sizes, where this occurs it is flagged in the table footnotes.
5.1 Characteristics of parents and carers
Defining parents
For the purpose of this report, parents were defined as those employees who had:
a child aged under 18 who was living with them as part of their family, including biological and step-children, foster or adopted children;
a child aged under 18 who did not live in the household but whom the employee looked after or cared for.
Defining carers
Carers were identified by asking the following two questions:
‘Do you look after or give any help or support to family members, friends, neighbours or others because of either long-term physical or mental ill-health or disability, or problems related to old age? Do not include anything you do as part of your paid employment.’
If an employee said yes to this question they were then asked if this person (or people) was:
99

27‘… a child under the age of 18 ,
… adult relative(s) living inside or outside the household,
… a non-relative adult living in the household,
… a non-relative adult living outside the household?’
More than half (56 per cent) of this group of employees were parents only, 29 per cent carers only and 15 per cent were both a parent and a carer.
Parents. Forty-six per cent of parent employees interviewed had a dependant child aged under six, for 28 per cent their youngest child was age six to 11 and the remaining 26 per cent had a youngest child aged 12 or over. Age of youngest child in the household was significantly associated with a number of parental characteristics. The employment and individual characteristics related to employees being parents of young children (whose youngest child is aged less than six years) are shown in Table C5.1 in Annex C. Specifically:
Fifty-one per cent of male parent employees had a youngest child aged under six years, compared to 41 per cent of female parent employees.
Seventy-four per cent of parent employees aged 39 or under had a youngest child aged under six years, compared to only nine per cent of parent employees aged 50 plus.
Fifty-seven per cent of non-white parent employees whose youngest child was under six, compared to 45 per cent of parents from a white ethnic background.
Fifty-two per cent of parent employees with A-Levels and 58 per cent of those with degree-level qualifications had a youngest child under six years, compared with 36 per cent of parent employees with GCSEs only.
Parent employees who did not have a disability (47 per cent) were also more likely to have a youngest child under six than those with a disability (33 per cent).
Parent employees who had been with their current employer for more than ten years were less likely to have a youngest child aged under six (38 per cent), compared with those who had been with their employer less than six months (49 per cent). This is related to age of the parent.
Forty-nine per cent of parent employees who were not trade union members had a youngest child under six, compared with 40 per cent of trade union members.
27 If an employee said that the person was a child under the age of 18, this initiated a check to establish that they provide help or support because the child was sick or disabled.
100

Parent employees working in the private sector were more likely to have a youngest child under six (49 per cent) compared to those working in the public sector (40 per cent).
Carers: Carers aged below 50 were more likely to be just caring for a disabled child; ten per cent of those aged less than 39 and 15 per cent of those aged 40-49, compared with five per cent of those aged 50 or over. Carers with an annual household income of below £15,000 were more likely to be caring for both a child and another relative/friend (12 per cent), compared with carers with an annual household income of £45,000 and above (six per cent). Carers in the public sector were more likely to be caring for just a child (14 per cent, compared to seven per cent of carers employed in the private sector). These figures are shown in Table C5.2.
5.2 Working time disrupted by child(ren)’s illness
Employees who were parents were asked:
‘Thinking only about the last three months, has your working time been disrupted by your child(ren)’s illnesses necessitating special arrangements to be made with work or childcare?’
Less than one third (29 per cent) of employees who were parents had had their working time disrupted by their child’s illness in the last three months (Table C5.3). (Note: as interviews took place in early 2011 ‘the last three months’ refers to the winter period.)
The following groups were significantly more likely to have had their work disrupted by child’s illness in last three months:
Parents with younger children – 34 per cent of parents with a dependent child aged under six and 31 per cent of those with a youngest child aged 6-11, compared to 17 per cent of those with children aged 12 or over.
Younger parents aged 39 and under (32 per cent) and those aged 40-49 (30 per cent), compared to parents aged 50 and over (13 per cent).
Those with degree or postgraduate qualifications (34 per cent and 38 per cent, respectively), compared to those with no qualifications (19 per cent).
Lone parents (35 per cent) and dual earner couples (30 per cent), compared to couple parents where only one parent worked (22 per cent).
Those in the North (34 per cent), Wales (33 per cent) and South (29 per cent), compared with 23 per cent of those from the Midlands and 22 per cent from Scotland.
Those in managerial/professional or intermediate occupations (33 per cent and 31 per cent, compared to 22 per cent for those in routine/manual occupations).
101

Public sector employees (33 per cent), compared with private sector employees (27 per cent).
Arrangements made to cover disruption
Parents who said their working days had been disrupted by their child’s illness were asked about the sort of arrangements they had made to cover this (Table C5.4).
Overall, nearly half (47 per cent) of parents who had had their working time disrupted by a child’s illness had taken leave to cover it (31 per cent said they had just taken paid or unpaid leave, while the remaining 16 per cent said they had used a combination of arranging other childcare and taking leave). A further third (30 per cent) said they had worked flexibly (including from home). Nineteen per cent said they had had to arrange alternative care, including child’s other parent and formal or informal childcare and five per cent gave another answer.
Figure 5.1 Arrangements made to cover disruption
Worked flexibly, including from home
30%
A combination of arranging care and
taking leave16%
Other5%
Took paid or unpaid leave31%
Arranged care19%
Base= Parent employees who had had working time disrupted by child’s illness Unweighted base: 412 cases Source: WLB4 2011
There were differences according to gender. Fathers were more likely to have worked flexibly (35 per cent, compared to 25 per cent for mothers). Mothers were more likely to have taken leave (35 per cent, compared to 26 per cent) or used a combination of leave and other arrangements (17 per cent, compared to 14 per cent of fathers).
Examining gender and work pattern (full-time/part-time) together revealed that nearly all of the fathers who had their working time disrupted had been working full-time28.
28 There were only seven fathers working part-time who had had their working time disrupted by child’s illness in the last three months. Most of these had arranged alternative care.
102
Whilst there were no statistically significant differences in the types of arrangement made between fathers working full-time, mothers working full-time and mothers working part-time, there were more similarities in the behaviour of full and part-time mothers than there were between full-time mothers and full-time fathers. Thirty-three per cent of mothers working full-time and 36 per cent of mothers working part-time had just taken leave, compared with 28 per cent of fathers working full-time. A quarter of mothers who had had working time disrupted in the last three months had worked flexibly (25 per cent for both full-and part-time mothers), compared with 35 per cent of fathers.
Some of the gender differences may be related to differences according to status or demands of jobs:
Those working with no access to flexible working (part-time or full-time) were more likely to have taken paid or unpaid leave. Full-time workers with flexible working were most likely to have worked flexibly (42 per cent), part-time workers with flexible working less so (27 per cent). However, 17 per cent of those with no part-time or formal flexible working said they had worked flexibly, indicating that some employees negotiated flexibility even without a formal arrangement already in place.
Those in managerial/professional occupations were more likely to have worked flexibly (including from home – 35 per cent, compared to 12 per cent of intermediate occupations and 27 per cent of those in routine and manual occupations) and they were less likely to have taken leave.
Trade union members were more likely to have taken leave (42 per cent, compared to 26 per cent of non-members), whilst non-members were more likely to have worked flexibly (35 per cent, compared to 17 per cent of members).
Those working in the private sector were more likely to have worked flexibly (36 per cent, compared to 20 per cent in the public sector). Those in the public sector were more likely to have taken leave (58 per cent had taken leave or combined leave with other arrangements, compared with 38 per cent in the private sector).
There were also significant differences according to region (with those in the South and Midlands being more likely to work flexibly – 38 per cent and 31 per cent respectively, compared to 23 per cent in the North). Differences also emerged according to industry type, but small numbers in each sub-group mean these are more difficult to interpret.
There were no statistically significant differences according to age of child.
Time off to deal with child’s illness
In total, only 185 parents had taken paid or unpaid leave to deal with children’s illness in the last three months. Of these, ten per cent had taken less than a day off and a further 40 per cent had taken just one day off. Forty-seven per cent had taken
103

‘more than one day but less than a week’ and only four per cent had taken a week or more.
There were no statistically significant relationships between the length of time parents had taken off for a child’s illness and personal, family or job characteristics, including parents’ gender or age of child. This is probably due to the small number of cases involved.
5.3 Antenatal appointments – fathers’ leave arrangements
Parents with children aged under six were asked whether the father had taken any time off work to attend antenatal appointments for their youngest child. Time off to attend antenatal appointments included scans, mid-wife appointments or nurse visits related to the pregnancy. Fathers being interviewed were asked directly whether they had taken any time off work to attend antenatal appointments. In cases where the respondent was a mother, they were asked if their partner attended such appointments.
Note: where mothers were asked about their partner, no information was collected about the partners’ personal or job characteristics. Therefore, analysis in Table C5.5 is confined to household characteristics.
Overall, 54 per cent of families with a child under six said that the father had taken time off work29 (Table C5.5). In terms of differences according to different household characteristics, expectant fathers were more likely to have had time off if:
They had higher annual household income – 65 per cent of fathers with a household income of over £45,000 had time off, compared to 56 per cent of those with an income of £25,000-£44,999 and only 41 per cent of those with a household income of under £24,999.
Family status, at the time of interview, was ‘a couple’ (57 per cent, compared to 21 per cent for those who were lone parents at the time of the interview).
They were in a dual earner couple family (60 per cent, compared to 49 per cent for single earner couple families).
In all, there were 155 fathers with a child aged under six who had had time off for an antenatal appointment. They were asked how many appointments they had attended and how they had taken that time off.
Most fathers said they had attended two (29 per cent) or three (21 per cent) appointments; 29 per cent had attended five or more, with the maximum reported number of appointments being 12 (Table C5.6).
29 The 2009 Maternity and Paternity Rights Survey (MPRS) found 66 per cent of fathers had taken time off before the birth of their child. This included, but was not restricted to, antenatal visits. This, coupled with the timing of the interview (the MPRS was carried out when children were aged between 12 and 18 months, hence fathers would have better recall) are likely to explain the difference.
104

Figure 5.2 Number of antenatal appointments attended
6 6
29
21
108
10
13
0
6
0 1
0
5
10
15
20
25
30
35
Don'tknow
1 2 3 4 5 6 7 8 9 10 11 12
No. of antenatal appointments
Per
cen
t
Base= Male respondents with child aged under 6 years who reported they had taken time off work to attend antenatal appointments Unweighted base: 155 cases Source: WLB4 2011
The most common arrangement was for expectant fathers to be given paid time off in addition to annual leave (39 per cent). Twenty-nine per cent of expectant fathers had taken annual leave and 24 per cent were given time off in lieu. Only nine per cent had taken unpaid leave and two per cent said they had taken sick leave (Table C5.6)30.
Further analysis of differences according to personal, job or family characteristics was not possible because of the small base size.
5.4 Parental leave
Under the Employment Relations Act 1999, employees are entitled to 13 weeks' unpaid parental leave if:
They have at least one year's continuous service with their employer;
They have a child under the age of five, a child who is disabled and under the age of 18, or a child who was adopted within the past five years and is under the age of 18;
30 Note: employees could give more than one answer – percentages sum to more than 100 per cent.
105
They have – or expect to have – parental responsibility for the child.
An employee is entitled to 18 weeks' unpaid parental leave if their child is entitled to receive disability living allowance.
Parents with a child aged under 6 were asked about their take-up of parental leave:
‘By law parents are entitled to take unpaid leave of up to 13 weeks to look after their child within the first 5 years after the birth. This is called parental leave. In the last 12 months and with your current employer, have you taken parental leave?’31
Eleven per cent of parent employees with a child aged under 6 said they had taken parental leave (Table C5.7). There were no significant differences associated with taking parental leave by respondent type. Although some variables, such as household income, show apparent differences these were not large enough to be statistically significant.
5.5 Time off for dependants
By law, an employee can take unpaid leave at short notice during working hours when a dependant falls ill or is injured or because of unexpected disruption or incident during their care32. The right to time off is available to all those who have a contract of employment with an employer (whether in writing or not), whether they work full-time or part-time. It allows employees to take a reasonable amount of time off work to deal with certain unexpected emergencies and to make necessary longer-term arrangements. A dependant is a husband, wife, child or parent of the employee, or may be someone living with the employee as part of their family or someone who reasonably relies on them to arrange care. Time off for other emergencies is not covered by this right and is a contractual matter between employer and employee. The right does not include an entitlement to pay.
Overall, 19 per cent of employees had taken time off for dependants in the last 12 months33 (Table C5.8).
There were some statistically significant differences between different groups. Employees were more likely to have had time off for dependants if:
31 This question is the same as that asked in WBL3. However, the question routing restricted the question to parents with a child aged under 6 (whereas in the WBL3 survey the question was asked of all parents). This means the proportions presented in the two survey reports are not comparable.
32 Section 57A of the Employment Rights Act 1996, as amended by the Employment Relations Act 1999, which came into effect on 15 December 1999.
33 This figure is lower than those presented in previous Work-life Balance Employee surveys. In WLB4 (in contrast to earlier years) the question specifically explained what time off for dependents was and so responses were more likely to have kept within the definition of the regulations. This different question wording, together with placement within a set of questions regarding different sorts of leave, may explain the lower response to ‘time off for dependents’ in WBL4.
106

They were white rather than non-white (20 per cent, compared to 12 per cent);
They were parents (23 per cent, compared to 17 per cent among non-parents);
As expected, they were employees with caring responsibilities (29 per cent), compared to those without (17 per cent).
Further, employees were less likely to have had time off for dependants if:
They were male employees working part-time (nine per cent), compared to 22 per cent of female part-time employees and 19 per cent of male and female full-time employees;
They had been with their current employer for less than 12 months (seven per cent), compared with those who had been with their employer one to four years (19 per cent) or five to nine years (23 per cent).
5.5 Childcare
All parent employees were asked whether their employer provided support with childcare regardless of whether they used it or not. This included a workplace childcare facility, financial help with childcare costs, help with arrangements during the school holidays, information about provision of local childcare or other childcare arrangements.
Fifty-seven per cent of parent employees said that their employer did not provide any support with childcare. Forty-three per cent of parent employees said that their employer provided one or more forms of childcare support. The most common form of childcare support identified by parent employees was financial support (33 per cent), followed by provision of information about childcare (13 per cent) and workplace childcare facilities (ten per cent). This is shown in Figure 5.3.
107

Figure 5.3 Forms of childcare support available
10
33
6
13
2
57
0
10
20
30
40
50
60
Childcare facility Financial help Help w itharrangementsduring holidays
Information Other None
Per
cen
t
Base= Parent employees Unweighted base: 1286 Mulit-code question: percentages will not add to 100% Source: WLB4 2011
A priority order was used to group the multi-code question into a single measure of employer childcare provision, this was;
1. childcare facility,
2. financial help,
3. help with arrangements during the holidays,
4. provision of information, and
5. other.
Hence an employee whose employer provided both a childcare facility and help with arrangements during holidays would be listed under ‘childcare facility’. This single coded variable was used to compare childcare provision for different employee characteristics, the results of which are shown in Table C5.9. There were a number of differences between employee groups, some of which appeared to relate to occupational status. For example:
Employees with no qualifications, with only GCSEs or with A Levels were much more likely than those with higher qualifications to report that their employer did not offer any help with childcare. Eighty-one per cent of those with no qualifications and 70 per cent of those with GCSEs only, compared with 45 per cent with degrees and 43 per cent with postgraduate degrees.
108

There were also differences by annual household income. Forty-four per cent of families earning more than £45,000 per year had no form of help, compared with 74 per cent of lower income families earning less than £15,000.
Similarly, childcare support was related to job status: non-managerial staff were much more likely than managers/supervisors to report no employer help with childcare (61 per cent v 51 per cent for managers).
Seventy-seven per cent of those working in routine/manual occupations said their employer offered no support with childcare, compared to 52 per cent of those working in intermediate occupations and 45 per cent of those working in managerial or professional occupations.
Full-time employees were more likely to report financial help (30 per cent, compared to 22 per cent of part-time employees). Within this, female full-time employees were most likely to say their employer offered financial help; 33 per cent, compared to 28 per cent of male full-time employees and 23 per cent of female part-time employees.
However, there were also broader differences according to type of employer, length of service and size of workplace:
Employers who offered flexible working also appeared to be more likely to give support with childcare: 42 per cent of parent employees working full-time with flexible working, and 56 per cent of those working part-time with flexible working, said their employer did not provide any support with childcare, compared with 62 per cent of those working full-time with no flexible working and 67 per cent of those working part-time only
Half (50 per cent) of trade union members said their employer offered no childcare support, compared with 60 per cent of those who were not trade union members. In particular, trade union members were more likely to say that their employer offered workplace childcare facilities (15 per cent, compared with eight per cent of those who were not trade union members)
Sixty-four per cent of private sector employees said their employer did not offer any support with childcare, compared to 41 per cent of public sector employees. Manufacturing, construction and distribution, retail, hotel and restaurant industries were particularly likely not to offer any childcare support (ranges between 70-77 per cent). By comparison, 47 per cent of parent employees working in public administration, education and health, 48 per cent of those in transport, storage and communication and 42 per cent of those in banking, insurance and professional and support services said their employer offered no support with childcare.
Longer-term employees were more likely to have employer support with childcare; 54 per cent of those with ten or more years service and 52 per cent of those with between five and nine years of service had no support at all from their employers, compared with 74 per cent of those with fewer than 12 months of service.
109

Employees in larger workplaces were less likely to say their employer offered no support. Thirty-four per cent of parent employees in single-site workplaces with 250 or more employees and 37 per cent of parents employees in multi-site workplaces with 250 or more employees offered no support at all, compared with 84 per cent of employees in single-site workplaces and 70 per cent of employees in workplaces with one to nine employees that were part of a larger organisation.
5.6 Summary
Around three out of every ten parent employees reported some disruption to their working time due to child illness in the last three months. This was more common among the parents of younger children and lone parents or those in dual earner couples. It was least common among those parents in routine or manual occupations. This was most commonly dealt with by taking leave (with or without arranging alternative childcare). Those without a flexible working arrangement, trade union members and those in the public sector were most likely to take leave.
Thirty per cent of those reporting some disruption to their working time due to child illness responded by working flexibly (including home working) and this was more common among men, those in managerial/ professional occupations and private sector employees. Even among those without a flexible working arrangement, a sizeable proportion were able to respond to their child’s illness by working flexibly.
Around half of employees with children aged under six said that the father had taken time off to attend antenatal appointments. This was more common in households with higher income and in dual earner families. Most commonly, the fathers took additional paid leave, annual leave or time off in lieu to attend these.
Only 11 per cent of parents with children under six had taken parental leave. This may reflect a lack of need to use this entitlement or their ability/preference to use other paid options to accommodate parenting responsibilities.
Almost one in five employees had taken time off for a dependent in the last 12 months. This was most common among parents and those with caring responsibilities. Those employees who had been with their employer less than 12 months were less likely to take this.
Almost three-fifths of parent employees (57 per cent) worked for employers who provided no support with childcare, with one third receiving financial support and one tenth workplace child care. Some form of support was more commonly reported among employees with higher qualifications, with managerial responsibilities, in higher occupational groups and with higher income. The provision of such support was associated with working in the public sector, being a trade union member, having longer service and working in larger workplaces. It was less common among
110

those working in certain industries: manufacturing, construction, distribution, retail hotel and restaurant industries.
111

6. The flexible worker
6.1 Introduction
This section aims to identify the defining characteristics of the flexible worker. It starts by outlining the key characteristics associated with flexible workers, investigating them in detail using multivariate analysis. It then looks at levels of satisfaction of flexible workers and their employment relations and work attitudes. It concludes by investigating the take up of flexible working practices by employees not entitled to flexible working under the current law.
The analysis in this section is based on the core sample plus child and carer boosts where appropriate. All findings are statistically significant unless otherwise stated.
6.2 Characteristics of flexible workers
The flexible worker status of employees was based on whether their working arrangements (currently, or in the last 12 months) included any flexible working practices from the following:
34 Worked part-time (fewer than 30 hours per week) in the past year Worked only during school term-time Job-shared, where a full-time job is divided between two or more people and
they work at different times Worked flexitime, where an employee has no set start or finish time but an
agreement to work a set number of hours per week or per month Worked reduced hours for a limited period, this is where an employee has
an agreement to cut their hours for a set period of time such as a month or six months
Worked from home on a regular basis, this means an employee works all or some part of the time from home as part of their working hours
Worked a compressed working week, this means working your contracted hours over a fewer number of days
Worked annualised hours, this is where the number of hours an employee has to work is calculated over a full year rather than a week or month
Take up for each flexible working arrangement has been calculated as take up by employees who have that particular arrangement available to them. Employees who do not have a particular flexible working available are excluded from the base. Sixty-three per cent of employees who had at least one of the above flexible working
34 For most of the analyses in this chapter, part-time working has been excluded from the list of flexible working practices as findings are reported separately by part-time and full-time status.
112

arrangements available to them had worked some form of flexible arrangement over the last year and nearly half (47 per cent) of employees worked with flexible arrangements other than part-time working over the past year.
The evidence suggests there may be differences in the characteristics of full- and part-time flexible workers. For that reason, we distinguish between flexible and non-flexible full- and part-time workers throughout this chapter. Full- and part-time status in this section is based on the employees’ response to the flexible working practice questions, rather than their reported actual hours, this is to be consistent with the reporting of other flexible working practises covered by this section35. Flexible working is more common within part-time workers; 57 per cent of part-time employees (who had flexible working arrangements available to them) and 40 per cent of full-time employees had worked some sort of flexible working arrangement in the past year.
The proportions of full- and part-time employees taking up different types of flexible working practices are shown in Figure 6.1. The most popular working practice was flexitime; 59 per cent of part-time workers took up flexitime where it was available in their workplace and 45 per cent of full-time workers. Part-time employees were more likely than their full-time counterparts to take up all forms of flexible working, although rates of home working were fairly close; 42 per cent of full-time workers worked from home where available, compared with 46 per cent of part-time workers.
Figure 6.1: Flexible working practices by full- and part-time status
19
39
22
45
59
4246
21
31
19
33
2
7
29
0
10
20
30
40
50
60
70
Full-time Part-time
Per
cen
t
Term-time Job-share FlexitimeReduced hours Work from home Compressed hoursAnnualised hours
Base: All employees
Bases vary depending upon the numbers for whom each type of flexible working was available. Core full-time employees and core part-time employees (based on Flexwork2). Source: WLB4 2011
35 There were 109 core employees who claimed to be working part-time but had also reported that they were working more than 30 hours per week in main job, likewise 34 employees said they worked full-time but had reported fewer hours. In other sections we have based part and full-time work on actual hours worked. In this section, to be consistent with the recording of other flexible working practices (which asked ‘Do you currently, or have you worked in the past year…’), we have used the employees self-reported status, hence the part-time category could include current full-time workers.
113

Full-time employees
This section concerns employees who were currently working full-time and had not worked part-time over the last twelve months. Flexible working varies by some key individual and employer characteristics, as demonstrated in Table C6.1 (Annex C) for full-time flexible and non-flexible workers:
Nearly half (48 per cent) of full-time employees aged between 40 and 49 had worked flexibly, followed by full-time employees aged 25 to 39 (43 per cent). Employees aged 16-24 were the least likely to have flexible work arrangements, only twelve per cent did so, although the base for this age group was small.
Forty-five per cent of full-time parents worked flexibly, compared with 38 per cent of non-parents.
Employees with higher qualifications were more likely to work flexibly. Sixty-one per cent of full-time employees with a post-graduate degree and 57 per cent of employees with a degree had done some form of flexible working, compared with 18 per cent of employees without qualification and 25 per cent of employees with GCSEs only.
Fifty-two per cent of full-time employees with an annual household income of over £45,000 worked flexibly, compared with 21 per cent of full-time employees in households with an annual income below £15,000. A statistically significant relationship was also found between personal income and working flexibly and in the same direction; 59 per cent of employees with a personal income of £40,000 or more worked flexibly, compared with 22 per cent of employees earning between £10,000 and £14,999.
Forty-eight per cent of full-time carers worked flexibly, compared with 39 per cent of non-carers.
Forty-eight per cent of full-time employees with managerial responsibilities worked flexibly, compared with 34 per cent of full-time employees without.
Forty-eight per cent of full-time employees who were trade union members worked flexibly, compared with 37 per cent of non-union members.
Flexible working rates were higher amongst those in higher socio-economic groups. Fifty-three per cent of full-time employees in managerial and professional occupations, 34 per cent of employees in intermediate occupations and 20 per cent employees in routine and manual occupations worked flexibly.
Over half (55 per cent) of full-time public sector employees and around a third (34 per cent) of full-time private sector employees worked flexibly
Flexible working was least likely in manufacturing and distribution; 22 per cent of full-time employees in manufacturing and 18 per cent of full-time
114

employees in distribution, retail, hotels and restaurants worked flexibly. Fifty-two per cent of full-time employees in public administration worked flexibly.
Flexible working practises were more common for employees working in larger organisations. Rates were lowest in workplaces with fewer than 50 employees (28 per cent) that were part of a larger organisation and highest in single site workplaces of 250 employees or more (58 per cent).
Female-dominated and mixed workplaces had higher rates of flexible working; 46 per cent of full-time employees in female dominated or mixed workplaces worked flexibly, compared with 28 per cent in male dominated workplaces. There was no statistically significant association between employee gender and flexibly working, however.
Forty-two per cent of full-time employees with an employment contract worked flexibly, compared with 24 per cent of those without.
Fifty-three per cent of employees working 48 hours or more worked flexibly, compared with 42 per cent of employees working 30 to 35 hours and 41 per cent of employees working 35 to 40 hours. Twenty nine per cent of employees working 40 to 48 hours worked flexibly.
Lone parents working full-time and couple parents who were dual earners (with at least one parent working full-time) were more likely to work flexibly. Fifty five per cent of lone parents and 48 per cent of dual-earning couple parents worked flexibly. Take up was 38 per cent for non-parents and 37 per cent for couple parents with a single earner.
Part-time employees
Table C6.2 shows how flexible working practices vary according to individual and employer characteristics of employees who were currently working part-time or had done so over the last twelve months:
Sixty-seven per cent of part-time employees with managerial responsibilities and 54 per cent of those without worked flexibly.
Sixty-six per cent of part-time trade union members worked flexibly, compared with 54 per cent of those who were not union members.
Seventy per cent of part-time employees in managerial and professional occupations worked flexibly, followed by 53 per cent of employees in routine and manual occupations and 48 per cent of employees in intermediate occupations.
Seventy-two per cent of public sector part-time employees and 51 per cent of private sector part-time employees worked flexibly.
115

Flexible working increased as part-time employees’ personal income increased but there was no association between household income and flexible working. Seventy-four per cent of part-time employees with annual personal earnings of £15,000 or more worked flexibly, compared with 47 per cent of part-time employees earning less than £10,000.
Female-dominated and mixed workplaces had lower rates of flexible working for part-time employees. Seventy-one per cent of part-time employees in male-dominated workplaces worked flexibly, compared with 56 per cent in mixed workplaces and 52 per cent in female-dominated workplaces. For part-time workers, there was no association between an employee’s gender and whether they worked flexibly.
There are some similarities in the characteristics of flexible workers within the two groups of employees. For both full- and part-time workers, rates of flexible working were higher for employees in professional and managerial occupations, compared with other occupations and for those employees with managerial responsibilities relative to those without. Rates were also higher for higher earners (personal, rather than household, income) relative to lower earners, public sector workers relative to private sector workers and trade union members compared with non-members.
There were also some differences. For part-time workers, flexible working was more likely in male-dominated workplaces relative to female-dominated workplaces, whilst the reverse was true for full-time workers.
Multivariate analysis of the characteristics of flexible workers
Multivariate analysis was carried out to identify the individual, job and employer characteristics associated with increased likelihood of being a flexible worker when controlling for other variables. Full- and part-time employees were modelled separately in order to draw out the different relationships and characteristics of the two groups.
Full-time employees. The multivariate analysis indicates that for full-time employees there were a number of factors significantly associated with working flexibly, and that the associations were similar to the bivariate analysis reported above in Table C6.1.
Full-time employees from the following groups, and with the following characteristics, were more likely to work flexibly:
Those with a degree, a professional qualification at degree level or a postgraduate degree were more likely to work flexibly than similar employees with GCSEs only.
Employees in professional or managerial occupations were more likely to work flexibly than those in routine or manual occupations.
116

Employees in organisations where the gender make-up of their workplace was mostly female or mixed, were more likely to work flexibly, compared with those in workplaces that were mostly male.
Full-time employees from the following groups, and with the following characteristics, were less likely to work flexibly:
Those aged between 16 and 24 (compared with those aged 40 or over).
Those who worked in manufacturing or in the distribution, retail and hotel industries were significantly less likely to work flexibly, compared with employees who worked in other activities.
This suggests the flexible worker tends to be an older, well-educated professional who works in mixed gender or female-dominated workplaces in industries outside manufacturing and distribution, retail, hotels and restaurants. The full model is shown in Table D1.1 in Annex D.
Part-time employees. There were fewer characteristics related to working flexibly for part-time employees. These associations were similar to those reported in the bivariate analysis in Table C6.2.
Part-time employees from the following groups, and with the following characteristics, were more likely to work flexibly:
Those earning £25,000 or more per year were more likely to work flexibly than similar employees with an annual income below £10,000.
Those in male-dominated workplaces were more likely to work flexibly than part-time employees in workplaces where the majority of staff were female.
Part-time employees in the public sector were more likely to work flexibly than part-time employees in the private sector.
This suggests part-time flexible workers are more likely to be found in male-dominated public sector workplaces. The analysis also suggests better paid occupations are more likely to support flexible working for part-time employees. The full model is shown in Table D1.2.
6.3 Work-life balance of flexible workers
Employees were asked to state how satisfied they were with their hours of work and their current working practices. Levels of satisfaction were compared for all employees and for four different sub-groups of employees of particular interest, namely; employees who were both parents and carers, employees who were parents only, employees who were carers only and employees who were neither parents nor carers. The parent group was further split by gender, in order to ascertain whether any variation in the satisfaction of mothers by flexible working status was matched by that of fathers. Within each of these sub-groups, satisfaction was compared across the four working groups outlined earlier (full- and part-time employees split by flexible
117

and non-flexible working practices, with part-time work treated separately from other flexible working practices).
Satisfaction with working hours
Seventy-nine per cent of employees were satisfied or very satisfied with their working hours. There were no statistically significant differences in levels of employee satisfaction with hours of work by flexible worker status for the ‘all employee’ group, for carers (who were not also parents) and for employees who were neither parents nor carers. However, for parents (who were not carers) and employees who were both parents and carers, satisfaction with working hours varied significantly according to the employees’ flexible working status. For both groups, levels of satisfaction were higher for part-time workers and lower for full-time workers, although the difference between the two groups was more pronounced for parents who were also carers. This can be seen in Figure 6.2.
Figure 6.2: Levels of satisfaction with working hours: parents and joint parents/carers
10 10
32 3624 25
90 90
68 64
86 8676 75
14 14
0%
20%
40%
60%
80%
100%
PT only PT andflexible
FT andflexible
No PT orflexible
PT only PT andflexible
FT andflexible
No PT orflexible
Parents and carers Parents only
Per
cen
t
Neutral/ dissatisfied/ very dissatisfied Very satisfied/ satisfied
Unweighted base: Parents and carers (boost sample) = 271: Parents employees who are not carers (boost sample) = 947 Source: WLB4 2011
Higher levels of satisfaction were also seen for part-time workers relative to full-time workers when looking separately at mothers and fathers (all parents, including carers). In each case, the differences in levels of satisfaction were statistically significant. Mothers working full-time were marginally less likely to express satisfaction with their hours if they worked flexibly (75 per cent were satisfied, compared with 77 per cent of full-time mothers not working flexibly), whereas the reverse was true for fathers; 75 per cent of fathers who were flexible full-time workers were satisfied, compared with 71 per cent of fathers who worked non-flexibly and full-time. This is shown in Figure 6.3.
118

Figure 6.3: Levels of satisfaction with working hours: mothers and fathers
13 1525 23 25 29
87 8575 77
8795
75 71
135
0%
20%
40%
60%
80%
100%
PT only PT andflexible
FT andflexible
No PT orflexible
PT only PT andflexible
FT andflexible
No PT orflexible
Mothers Fathers
Per
cen
t
Neutral/ dissatisfied/ very dissatisfied Very satisfied/ satisfied
Unweighted base: All mothers = 763: All fathers = 454 Source: WLB4 2011
Satisfaction with current working arrangements
Satisfaction with current work arrangements was generally high, although there were some differences in levels of satisfaction by part- and full-time flexible and non-flexible work status. Satisfaction with current working arrangements varied significantly across flexible working groups when looking at all employees overall, employees who were parents but not carers and all mothers and fathers. Levels of satisfaction did not vary significantly across flexible working groups when looking at carer employees only, employees who were both parents and carers and employees who were neither parents nor carers.
Eighty-five per cent of employees overall were satisfied or very satisfied with their working arrangements. This ranged from 90 per cent for part-time flexible workers, to 86 per cent for full-time flexible workers and 82 per cent for both part-time and full-time employees without flexible working arrangements.
A different pattern was seen for employees who were parents but did not have other caring responsibilities. Overall, 88 per cent of these employees were satisfied or very satisfied with their current work arrangements. Part-time flexible workers were again most satisfied (94 per cent), followed by full-time flexible workers (90 per cent). However, for this group of parents, part-time workers without flexible working arrangements had higher levels of satisfaction than their full-time counterparts (88 per cent, compared with 83 per cent for full-time workers without any flexible arrangements).
The patterns for mothers and all fathers, when analysed separately, were similar to each other; non-flexible full-time workers were less satisfied than the other employee groups used throughout this chapter, although the large majority were still satisfied.
119

Eighty-two per cent of mothers working full-time without flexible work arrangements were satisfied with their current work arrangements, compared with 93 per cent of mothers working part-time and flexibly and 87 per cent of mothers who worked part-time but without any other flexible working arrangements. The same was true of fathers; 81 per cent of fathers who worked full-time without flexible work arrangements were satisfied, compared with 90 per cent of full-time flexible fathers. This is shown in Figure 6.4.
Figure 6.4: Levels of satisfaction with current working arrangements: mothers and fathers
137
16 1810
19
8793
84 8287
9590
81
135
0%
20%
40%
60%
80%
100%
PT only PT andflexible
FT andflexible
No PT orflexible
PT only PT andflexible
FT andflexible
No PT orflexible
Mothers Fathers
Per
cen
t
Neutral/ dissatisfied/ very dissatisfied Very satisfied/ satisfied
Unweighted base: All mothers = 762: All fathers = 454 Source: WLB4 2011
120

6.4 Employment relations of flexible workers
Employees were asked to assess the general relations between employees and managers in their workplace. Just over a third (34 per cent) of employees said that general relations between management and employees at their place of work were very good and a further 39 per cent said relations were good. Six per cent said relations were bad and two per cent said they were very bad. The remaining 19 per cent said the relationship between managers and employees was neither good nor bad. There was a significant difference in the quality of relations reported by employees with flexible working status; employees working part- and full-time with flexible working arrangements were more likely to report good or very good working relations in their place of work. Eighty per cent of employees working flexibly and part-time stated that relations were good or very good, compared with 78 per cent of employees working flexibly and full-time, 70 per cent of employees working part-time only and 68 per cent of full-time employees not working flexibly. This is shown in Figure 6.5. Figure 6.5: Relations between managers and employees by flexible working
2920 22
33
7080 78
68
0%
20%
40%
60%
80%
100%
Part-time only Part-time and flexibleworking
Full-time and flexibleworkiing
Full-time, no flexibleworking
Per
cen
t
Neutral/bad/Very bad Good/Very goodBase: All employees
Unweighted base: All employees = 1650 Source: WLB4 2011
121

6.5 Attitudes by flexible worker status
The attitudes of employees to statements about the impact of flexible working in the workplace were compared across employee groups. Employees were asked whether they strongly agreed, agreed, neither agreed nor disagreed, disagreed or strongly disagreed with the following statements:
It’s the employer’s responsibility to help people balance their work with other aspects of their life.
Having more choice in working arrangements improves workplace morale. People who work flexibly create more work for others. People who work flexibly are less likely to get promoted.
Fifty-four per cent of employees overall agreed or strongly agreed with the statement ‘It’s the employer’s responsibility to help people balance their work with other aspects of their life’. Levels of agreement varied significantly across flexible working groups, ranging from 63 per cent for full-time flexible workers, to 46 per cent for part-time workers without flexible arrangements. This is shown in Figure 6.6. Figure 6.6: Agree that employers have a responsibility to help people with work-life balance
54 50
3746
46 50
6354
0%
20%
40%
60%
80%
100%
Part-time only Part-time and flexibleworking
Full-time and flexibleworkiing
Full-time, no flexibleworking
Per
cen
t
Strongly disagree/Disagree/Neutral Strongly agree/AgreeBase: All employees
Unweighted base: All employees = 1648 Source: WLB4 2011
There was overwhelming agreement with the statement ‘having more choice in the workplace improves morale’. Overall, 90 per cent of employees agreed or agreed strongly to the statement and four per cent disagreed or disagreed strongly but levels of agreement did not vary significantly by flexible worker status. Thirty-four per cent of employees overall agreed or strongly agreed that ‘people who work flexibly create more work for others’. Agreement varied significantly across flexible working groups. Employees were least likely to agree with the statement if
122

they worked full-time with some form of flexible working. Twenty-four per cent of this group agreed with the statement, compared with 38-39 per cent of the other employee groups. This is shown in Figure 6.7. Figure 6.7: Agree that employees who work flexibly create more work for others
62 61
76
61
38 39
24
39
0%
20%
40%
60%
80%
100%
Part-time only Part-time and flexibleworking
Full-time and flexibleworkiing
Full-time, no flexibleworking
Per
cen
t
Strongly disagree/Disagree/Neutral Strongly agree/AgreeBase: All employees
Unweighted base: All employees = 1627 Source: WLB4 2011
Thirty-two per cent of employees overall agreed or strongly agreed that ‘employees who work flexibly are less likely to get promoted’ and agreement varied significantly by employee flexible status. Employees were least likely to strongly agree with the statement if they were full-time employees with flexible working arrangements. Twenty-four per cent of this group agreed, compared with 27 per cent of part-time flexible workers and 38 per cent of part- and full-time employees without flexible working. This is shown in Figure 6.8.
123

Figure 6.8: Agree that employees who work flexibly are less likely to get promoted
6373 75
3827 24
38
62
0%
20%
40%
60%
80%
100%
Part-time only Part-time and flexibleworking
Full-time and flexibleworkiing
Full-time, no flexibleworking
Per
cen
t
Strongly disagree/Disagree/Neutral Strongly agree/AgreeBase: All employees
Unweighted base: All employees = 1609 Source: WLB4 2011
6.6 Flexible working of employees without the legal right to request flexible working
This section looks at the take-up of flexible working practices by employees who do not have the legal right to request flexible working under the current legislation. By law, employers have a duty to seriously consider requests for flexible working arrangements for employees who have parental responsibility for a child aged under 17 (under 18 if the child has a disability) or have adult caring responsibilities.
Employees who are neither parents nor carers are therefore without the legal right to flexible working, and indeed their rates of flexible working are lower than those for parents or carers. Forty one per cent of these employees worked with flexible working practices (including part-time work), compared with 51 per cent of parents (excluding parent carers), 55 per cent of carers (excluding parent carers) and 52 per cent of employees with both parent and caring responsibilities.
There was some variation in the take up of individual flexible working practices between employees with and employees without the legal right to request. For each of the listed flexible working arrangements (including part-time work), take up was higher amongst employees with the Right. However, there were similarities in the relative popularity of different practices within the two groups of employees. Flexitime was the most common practice for both groups (55 per cent of employees with the right, 42 per cent for those without). Working at home and part-time working were also popular, although employees without the legal right to request were equally likely to work at home as they were to work part-time (both 37 per cent), whereas those with the right to request were more likely to work at home; 49 per cent worked from home and 43 per cent worked part-time. This is shown in Figure 6.9.
124

Figure 6.9: Take up of flexible working practices by entitled and non-entitled groups
43
3734
23
108
55
42
17
12
49
37
2527
31
28
0
10
20
30
40
50
60
Have legal right No legal right
Per
cen
t
Part-time Term-time Job-shareFlexitime Reduced hours Work from homeCompressed hours Annualised hours
Base: All employees with flexible work ing available
Unweighted base: Core employees with legal right = 864: Core employees without legal right = 1010 Source: WLB4 2011
The remainder of this section concentrates on the flexible working practices of those full-time employees who do not have the legal right to request flexible working under the current legislation. Just over a third of these (35 per cent) have (or have had over the past year) some form of flexible working arrangement, and this 35 percent differ in some individual and job-related characteristics from those (also without the right) who do not work flexibly (see Table C6.3):
Amongst full-time employees without the legal right to request:
Those aged between 40 and 49 years were most likely to work flexibly (46 per cent), followed by employees aged 25 to 39 (41 per cent).
Those with first and post-graduate degrees were more likely to work flexibly; 62 per cent with postgraduate degrees and 58 per cent with first degrees worked flexibly, compared with 22 per cent of those who had GCSEs only.
Forty-four per cent of trade union members worked flexibly, compared with 32 per cent of non-union members.
Forty-eight per cent of employees in managerial and professional occupations worked flexibly, compared with 27 per cent of intermediate employees and 19 per cent of routine and manual employees. Individual managerial responsibilities were not significantly related.
Twenty-eight per cent of those in the private sector worked flexibly, compared with 52 per cent in the public sector.
125

Rates of flexible working were highest amongst those working in public administration, education and health (50 per cent) and lowest amongst those working in manufacturing (21 per cent) and distribution, retail, hotels and restaurants (14 per cent).
Those in small workplaces had lower rates of flexible working (19 per cent) than those in other workplaces; those in larger workplaces of fifty or more employees had rates of 43-44 per cent.
Employees with higher personal incomes were more likely to work flexibly (60 per cent for those with annual personal incomes of £40,000 or more), compared with those earning less than £15,000 per year (14 per cent). Household income was not significantly related.
Those in mixed gender workplaces were more likely to work flexibly; 44 per cent, compared with 38 per cent of those in female-dominated workplaces and 21 per cent in male-dominated workplaces.
Multivariate analysis of the characteristics of flexible workers without the legal right to flexible working
Regression analysis was used to identify the individual, job and employer characteristics associated with increased likelihood of a full-time employee without legal rights to flexible working to choose a flexible arrangement when controlling for other variables.
The characteristics associated with flexible working were similar to those seen in the bivariate analysis and shown in Table C6.3, namely:
Those with a personal income of £40,000 or more a year were more likely to work flexibly than employees earning below £15,000.
Those with a degree and employees with a postgraduate degree were both more likely to work flexibly than employees with GCSEs only.
Employees who worked in a workplace where the majority of employees were female or the gender split was roughly equal were more likely to work flexibly than similar employees in workplaces that were mostly male
Employees in the public sector were more likely to work flexibly than employees in the private sector.
This suggests full-time employees without a legal right to flexible working are more likely to become flexible workers if they are well educated, in better paid employment, work in a female dominated or mixed gender workplace and work in the public sector. The full model is shown in Table D1.3.
126

6.7 Summary
Part-time employees were more likely than their full-time counterparts to take up all forms of flexible working where available. The most common form of flexible working for both groups was flexitime.
Working flexibly was more common among full-time employees who were older (aged between 40 and 49), parents or carers, had higher qualifications, higher incomes and managerial responsibilities. Working flexibly was also more likely among trade union members, those full-time employees with contracts of employment, those working in professional occupations, in large workplaces and in the public sector.
Once other factors were accounted for, the results of the multivariate analysis suggest that, among full-time employees, flexible working is positively associated with being older, well educated, in a professional occupation, working in a mixed gender or female dominated workplaces and in industries outside manufacturing and distribution, retail, hotels and restaurants.
Among part-time employees working flexibly was more likely among higher earners, those with managerial responsibilities, trade union members, those in managerial and professional occupations and in the public sector. Unlike full-time employees, part-time employees were more likely to work flexibly if they were in male-dominated workplaces.
Multivariate analysis showed that, among part-time flexible workers, working in male-dominated workplaces and the public sector were positively associated with working flexibly once other factors were controlled for, as was higher personal income.
Levels of satisfaction with working hours were higher amongst part-time workers than those working full-time. This was true for parents (both mothers and fathers) and for employees with joint parent/caring responsibilities.
Satisfaction with current working arrangements varied by flexible worker status. Part-time flexible workers had highest levels of satisfaction of all the groups. This was true for all employees, for mothers, for fathers and for parents who did not have additional caring responsibilities.
Employees with flexible working were more likely than employees without flexible working to report good working relations between employees and managers within their workplace.
Full-time flexible workers were more likely than part-time flexible workers and non-flexible workers to agree or strongly agree with the statements ‘It’s the employer’s responsibility to help people balance their work with other aspects of their life’ and ‘Having more choice in working arrangements improves workplace morale’. They were more likely that the other groups to disagree and strongly disagree with the statements ‘People who work flexibly create more work for others’ and ‘People who work flexibly are less likely to get promoted’.
127

Employees who are neither parents nor carers are without the legal right to request flexible working. Unsurprisingly, rates of flexible working among this group are lower than those for parents or carers.
Controlling for other factors, multivariate analysis suggests that, among full-time employees without a legal right to request flexible working, being well educated, in better paid employment, working in a female dominated or mixed gender workplace and working in the public sector were significant factors positively associated with flexible working. The same patterns were seen in the bivariate analysis.
128

References
Casebourne, J., Regan, J., Neathey F. and Tuohy, S. (2006) Employment Rights at Work – Survey of Employees 2005. Employment Relations Research Series No.51
Chanfreau, J., Gowland, S., Lancaster, Z., Poole, E., Tipping, S. and Toomse, M. (2011) Maternity and Paternity Rights and Women Returners Survey 2009. NatCen, prepared for BIS and DWP (not yet published)
Department for Business, Innovation and Skills (2010) Work and Families Act 2006 Evaluation Report.
Deville, J-C, & Sarndal, C-E, (1992) Calibration estimators in survey sampling. Journal of the American Statistical Association, Vol 87, 376-382.
DfEE (2000), Work-Life Balance: Changing Patterns in a Changing World. Department for Education and Employment, London (DfEE).
Hogarth, T., Hasluck, C., Pierre, G., Winterbotham, M. and Vivian, D. (2001) Work-Life Balance 2000: results from the Baseline Study. Research Report RR249. DfEE. http://www.dfes.gov.uk/research/data/uploadfiles/RR249.PDF
Hooker, H., Neathey F., Casebourne, J., Munro, M. (2007) The Third Work-Life Balance Employee Survey: Main findings. Employment Relations Research Series No.51
Lewis, J. (2008) Work-family balance policies: issues and development in the UK 1997-2005 in comparative perspective. In Scott, J., Dex, S. and Joshi, H. (Eds.) Women and Employment: Changing Lives and New Challenges. Cheltenham: Edward Elgar.
Stevens, J., Brown, J. and Lee, C. (2004) The Second Work-Life Balance Study: Results from the Employees’ Survey. Employment Relations Research Series No. 27. DTI. http://www.dti.gov.uk/files/file11499.pdf
129

Annex A: Methodology
Background
In 2000, the Government launched the Work-Life Balance Campaign aimed at employers to promote the benefits of flexible working for all employees. This campaign aimed to promote flexible working for all types of employees and was not specifically aimed at individual groups, such as parents or carers.
The Employment Act (2002) introduced the right for employees with a child aged five or under (18 or under for disabled children) to request flexible working, with their employer having the duty to consider this request. This ‘right to request’ was extended in the Work and Families Act (2006) to include employees caring for sick or disabled adult household members (effective from 2007) and parents of children under the age of 17 (effective from 2009).
The Fourth Work-life Balance Survey (WLB4) is important in providing much needed data about how the changes to the Work and Families Act are influencing peoples’ working arrangements, whether they are taking up these opportunities and their general awareness of what is available to them in the workplace. In light of the Coalition Government’s recent announcement of plans to extend the right to request flexible working to all employees, WLB4 also acts as a baseline about the current use of flexible working arrangements in Great Britain.
The Department for Education and Employment carried out the first Work-Life Balance Survey (WLB1) in 2000. It was used to assess how far employers operated work-life balance practices and whether employees felt that existing practices met their needs. The first survey was followed up in 2003 by a second survey of employees and by a third in early 2006. The WLB4 was carried out in early 2011.
The sample
The sample for WLB4 comprised a core sample plus two boost samples. The core sample was designed to be representative of all employees (that is, individuals who were not self employed or proprietors) aged 16 years or over and living in Britain. In addition, the sample was designed to boost two employee sub-groups of specific interest to BIS. These groups are: working parents of children aged 0-17 years and employees with non-child caring responsibilities.
The survey was conducted using Computer-Assisted Telephone Interviewing (CATI) and administered by interviewers from NatCen’s Telephone Unit. NatCen interviewers had undergone specific training for WLB4. This included a face-to-face project briefing covering project background, important concepts and terminology and good practice in contacting respondents. Silent monitoring of interviews was
130

undertaken as part of NatCen’s quality control, which allowed supervisors and researchers to monitor a proportion of interviews whilst they were in progress.
A sample of phone numbers was generated using Random Digit Dialling (RDD). RDD is an efficient method of producing a random sample of telephone numbers and includes non-listed numbers and households that had signed up to the Telephone Preference Service. The sample was provided by Survey Sampling International. Phone numbers were randomly generated and covered all regions across Britain.
The sample was split into core and boost telephone numbers prior to being issued to interviewers. When numbers were flagged as core sample, interviewers were instructed to screen for household with employees aged 16 or over. When numbers were flagged as boost sample, interviewers were instructed to screen for employees who were aged 16 or over and were either a carer or a parent. The boost samples were designed to achieve additional interviews with 250 employed parents of 0 to 5 year olds, 250 employed parents of 6 to 17 year olds, and 250 employees with non-childcare caring responsibilities.
At each contacted household one person was selected at random using the last birthday method; the respondent in the household who has had the most recent birthday and fits the eligibility criteria was selected for the survey. Birthdays are distributed randomly across months, hence this method allowed one eligible household member to be easily chosen at random. Household members were eligible if they were employees (that is, not self employed or proprietors), aged 16 years or over. This approach was designed to produce a representative sample of employees aged 16 and over.
Full interviewer instructions and more details about the sampling are given in the accompanying Technical Report.
Cognitive testing of new questions
The Questionnaire Development and Testing Hub (QDT Hub) at NatCen reviewed and cognitively tested 30 questions in September-October 2010. The primary objective of the cognitive testing was to test how the questions worked with the survey population. These questions collected information on:
Identifying employees with significant parental responsibilities; the extent employees feel they have control over the hours they work; working arrangements employees are on when they make requests to change
their working patterns; the outcome of requests to change the way employees work and how
employees are informed of initial and appeal decisions; perceptions of equality of opportunity at the workplace to request flexible
working; the range of flexible working practices available at the workplace and the
impact of colleagues working in this way on the respondent; the need and take up of dependent leave; the need and take up of parental leave;
131

how working fathers arrange leave to attend antenatal appointments; and how working parents manage child care arrangements for their children.
Cognitive Methods
Cognitive interviews use methods derived from cognitive psychology that enable researchers to examine in detail the question and answer processes. This form of testing helps to identify problems with questions and illuminate possible solutions to these issues. The project was designed to combine the advantages of testing the questions in the actual mode they were to be administered with the added advantages of face-to-face probing. Towards this, the questions were asked over the telephone similar to the main stage CATI survey and then retrospectively probed face-to-face. Interviewers administered the test questions over the telephone in another room (from mobile phone to landline or mobile phone). By replicating the survey conditions as close as possible evidence could be obtained about whether the questions worked as intended.
Interviewers were briefed and debriefed on the study, at a whole day face-to-face meeting.
Sample and Recruitment
Cognitive interviews are qualitative in nature so the samples are purposive and designed to reflect the range and diversity of the population of interest, rather than to be statistically representative. Quotas were used to ensure that sufficient numbers were recruited for different types of working parents and employees with adult caring responsibilities to test the questions.
Twenty face-to-face interviews were conducted with employees. Interviewers carried out their own recruitment, screening in possible respondents using a standardised recruitment protocol once consent had been gained. Interviews took place in North London, Manchester and York, lasted approximately one hour and were digitally recorded with the respondent’s consent. Three of NatCen’s experienced cognitive interviewers carried out the interviews. The interviews were arranged at a time and place convenient for the respondent, for example, in respondents’ homes. Respondents were given a £20 high-street voucher as a thank you for their participation.
After each interview, the interviewers made detailed notes on their cognitive interview, based on the interview recording. The findings fed into the WLB4 questionnaire.
Pilot
The questionnaire was piloted in December 2010. Thirty interviews were carried out in CATI by interviewers in the NatCen Telephone Unit. The pilot allowed the questions, routing and administration of the survey to be assessed before fieldwork started early 2011.
132

Response rates
Table A1.1 shows fieldwork outcomes broken down by sample type. In total, 65,000 telephone numbers were generated using RDD, 42 per cent of which were screened out because they were invalid or non-residential numbers. A further 30 per cent were connected phone numbers that were never answered (despite a number of contact attempts being made) or where the interviewer was unable to complete the screening questions. Eligibility of households at these numbers could not be established. At the remaining 28 per cent interviewers were able to make contact and complete the screening questions.
Interviewers conducted 2,767 interviews in total. The final sample sizes were 1874 for the core sample plus 893 additional boost interviews. These broke down as 280 boost interviews with parents whose youngest child in the household was aged 0-5 years and 320 boost interviews with parents whose youngest child was aged 6-17 years. There were also 290 additional boost interviews with employees with non-childcare caring responsibilities. The boost interviews were combined with similar employees from the core sample during analysis. The combined samples gave 829 carers and 1373 parents of children aged 0-17 (582 parents whose youngest child was aged 0-5 and 784 parents whose youngest child was aged 6-17. There were seven parents of children whose ages are unknown).
Table A1.1 Fieldwork outcomes by sample type Final outcomes Total Core Cases Boost Cases Count Count Count % % %
% Covered
% Covered
% Covered
Total numbers covered 65000 31823 33177 100 100 100 Invalid and non-residential numbers 27114 13353 13761 42 42 41
1798 875 923 3 3 3 - Non-residential 25316 12478 12838 39 39 39 - Invalid number
Numbers with unknown Eligibility 57802 27714 30088 30 30 30
- Unknown eligibility - contact made 11369 5533 5836 17 17 18
- Unknown eligibility - no contact made 8124 3946 4178 12 12 13
Numbers with known eligibility 18393 8991 9402 28 28 28- Ineligible households 11195 4882 6313 17 15 19 - Eligible households 7198 4109 3089 11 13 9
% of those
with known
eligibility
% of those
with known
eligibility
% of those
with known
eligibility
133

27651 38 1873 46 892 29Productive interviews
- Partial interviews 16 0 12 0 4 0
- Refusal 2856 40 1450 35 1406 46
- No contact with selected respondent
13 11 15910 457 453
- Other unproductive 651 9 317 8 334 11
1
Two partials were included in the final dataset: The final dataset contains 2767 cases - 1874 core and 893 boost.
Source: WLB4 2011
Table A1.2 shows the true response rates for the core and boost samples. The true response rate is calculated as the number of achieved interviews divided by the total number of eligible households. This includes households with known eligibility and plus the estimated number of eligible households at numbers where interviewers could not establish eligibility. For example, 46 per cent of households in the core sample with known eligibility were eligible, hence 46 per cent (4,332) of the 9,479 households in the core sample with unknown eligibility were assumed to be eligible. Therefore the total number of eligible households in the core sample was estimated to be 8,441 (4,332 + 4,109) and the true response rate for the core sample was 22 per cent (1,873 divided by 8,441).
Table A1.2 True response rates by sample type Estimated true response rate Total (core +
boost) Core Cases Boost Cases
Issued cases 65000 31823 33177 Invalid and non-residential numbers 27114 13353 13761 Total with known eligibility 18393 8991 9402Number of ineligible 11195 4882 6313Number of eligible 7198 4109 3089% eligible 39% 46% 33% Total with unknown eligibility 19493 9479 10014Number of unknown eligible likely to be eligible 7628 4332 3290 Estimated total number eligible (those with known eligibility plus estimated number with unknown eligibility) 14826 8441 6379Number of productive interviews 2765 1873 892Estimated true response rate 19% 22% 14%
1 Two partials were included in the final dataset: The final dataset contains 2767 cases - 1874 core and 893 boost.
Source: WLB4 2011
134
Weighting
WLB4 required weights to adjust for differential selection probabilities of individuals within households and non-response to the survey.
Individual selection weights At each contacted household the interviewer selected the eligible individual who had had the most recent birthday. Individual selection weights are required to ensure individuals in larger households are not under-represented in the sample. The individual selection weight is equivalent to the number of eligible individuals in the household.
Non-response weights A set of non-response weights were generated for analysis of the core and boost samples. The aim is to reduce non-response bias resulting from differential non-response to the interview by age, sex, Standard Industry Classification (SIC) and sector. The weights were generated using calibration methods (Deville J-C & Sarndal C-E, 1992). Calibration weighting uses an iterative procedure to adjust a starting weight (in this case the individual selection weight) until the distribution of the (weighted) sample matches that of the population for a set of key variables. The adjustments are made within a set of constraints that keep the values of the final weights as close as possible to those of the initial weights, thus ensuring the properties of the initial weights are retained in the final calibrated weights.
Calibration weighting requires a set of population estimates to weight to. The population estimates for the core sample and parent boost were taken from the (weighted) Labour Force Survey (LFS). As a household survey, the LFS suffers from its own non-response issues and therefore may contain bias. However, no alternative robust estimates are available for the specific population covered by WLB4. The key variables used to create the non-response weight were: age, sex, sector and Standard Industry Classification (SIC). The exact breakdowns used to generate the weights are shown in Annex B. The weights ensure that the sample will match the LFS population estimates for these key variables.
The carers boost was weighted using a different set of population estimates. The definition of carer used in the LFS does not match that used in WLB4, as only paid carers are identified. This meant we were unable to identify an equivalent group of carers in the LFS and an alternative source of population data was required. The 2007 Adult Psychiatric Morbidity survey (APMS) was selected as it was a robust random probability sample that used a definition of carers that matched the one used in WLB4. Calibration weighting methods were used to weight the age and sex profile of carers in WLB4 to that of the APMS.
Annex B shows a breakdown of sample and population estimates and Table A1.3 shows the weights produced for WLB4 and when they should be used. More details and further discussion of the weights can be found in the WLB4 Technical Report.
135

Table A1.3 Weights produced for WLB4 Sample1 Name Label Use
Wt_core Core sample weight
All core sample For any analysis of working adult employees
Combined 0-5 and 6-17 boost samples + eligible core sample
For any analysis of Wt_bst017 Parents parents with the
youngest child 0-17 years
Wt_bstcare Carers boost weight
Carers boost sample + eligible core sample
For any analysis of employees
with caring responsibilities Wt_bstall Carers and
parents Carers and parents boost samples and eligible core sample
For any analysis of employees with caring responsibilities who are also parents
1The appropriate sample members are automatically selected once weights are applied, non-sample members do not have a weight and are excluded from the analysis
Source: WLB4 2011:
Comparisons with previous surveys
We advise caution when comparing results from WLB4 with previous waves. This is because a number of changes have been made to the survey methodology over the years, which limits the validity of a statistical testing of differences.
WLB1-3 used quota sampling, whereas WLB4 used a random sample. WLB3 used interlocking age and gender quotas plus a separate public/private sector quota. Quotas ensure that set sample sizes are attained for specific groups but do not address problems of non-response bias as unwilling individuals are effectively replaced by more willing ones. This increases the number of similar respondents in the sample but does not address bias if the respondents who refuse to participate are systematically different to those who are willing. Changes were also made in the survey’s methodology between WLB1 and WLB2. The first survey set quotas during the fieldwork stage, whereas in the second survey, quotas were set before the fieldwork period.
In addition, in WLB3 the decision was taken to specifically interview the youngest eligible person in each household. This selection process would have introduced bias into the sample as younger people living in households with older adults would have been over-sampled, as a result they would be over-represented in the sub-group of younger people in the sample. Likewise, older people living in households with grown up children would have been under-sampled, which means the sub-group of older people in the sample would be biased towards older people not living with younger adults. This is not representative of all older people in the population.
Changing these aspects of the design will have improved the representativeness of WLB4 but has impacted on comparisons between WLB4 and previous survey years.
136

In some instances in this report, statistics from earlier published work-life balance reports are presented alongside statistics from other waves with a caveat reminding the reader of the change in methodology.
How the analysis was conducted and tested
This section outlines the proposed methodology for analysis, including the approaches to statistical testing of differences and details of possible multivariate analysis. The analysis was carried out using SPSS (PASW version 18) 36. The analysis was based on all fully productive interviews37 and all analyses applied the appropriate weights to adjust for individual selection and non-response (see WLB4 Technical Report for more details about the weights). The WLB4 sample comprises a core sample plus two boost samples. The core sample was used for analysis of the employee population and for prevalence estimates; for example, to find the proportion of carers in the employee population. The relevant boosts were included for all relevant sub-group analyses, hence these analyses used individuals from the boost sample plus any corresponding individuals from the core. The results of the bivariate analyses are presented in Annex C. The cross-tabulations were produced in SPSS using the ‘Tables’ command (available in the Tables Original option) and all tables show weighted statistics (percentages or means as appropriate) along with unweighted base numbers. Any differences significant at the 5% level were marked in the tables by ‘shading’ the relevant rows. Significant differences in the answers to one question by the break variables are tested for using a bivariate logistic regression. Pair-wise significance testing between individual categories of a break variable has not been carried out as this increases the risk of finding spurious significant differences purely by chance due to multiple testing. As the WLB4 sample is stratified, the bivariate logistic regression was run using the CSLOGISTIC command to take the complex survey design into account. The CSLOGISTIC command is available in SPSS as part of the Complex Samples option. The complex samples option in SPSS allows analysts to specify the cluster, strata and weight variables by setting up a plan file which is used by SPSS in the logistic regression to adjust the standard errors around the estimates and therefore obtain more reliable significance results. Chapter 6 investigates flexible workers further using a mix of descriptive and multivariate analytical methods. The first step was to run a bivariate analysis to identify which individual and employment characteristics were significantly related to
36 NatCen uses SPSS version PASW (1200) 18.0 with the following add-on options: Tables Original (1201) 18.0; PASW Regression (1202) 18.00; 1210 (1210) 18.0 and PASW Complex Samples (1211) 18.0.
37 Using ZPart as our cut-off point for inclusion in the analysis, there were 14 partial interviews which have not answered up to this question. We do not have the background information about these respondents necessary to include them in the analysis. The remaining 2 partials are included.
137

flexible working take-up. These variables were then entered into a stepwise logistic regression model (where the outcome is a binary variable denoting whether an employee worked flexibly vs. not working flexibly). The model identifies significant relationships between the individual and employment characteristics and flexible working take-up whilst holding other factors constant. The stepwise regression uses an iterative procedure to identify significant characteristics. The variables suggested by the model, and the direction of the associations, are checked to ensure they are credible (it is possible for the stepwise procedure to identify relationships that occur purely by chance). These variables are then entered into the final model. This model is run using CSLOGISTIC and takes the complex survey design into account, hence gives more accurate standard errors and coefficients.
138

139
Annex B: Description of the
sample
Table B1.1 shows a comparison of the fourth Work-Life Balance Survey (WLB4) core sample (all employees aged 16 and over and living in Britain) with data from the Labour Force Survey (LFS) 2011, quarter 1.
Table B1.1 Comparison of WLB4 and the LFS
Labour force Survey employees aged 16+ (quarter 1) 1
Core sample unweighted
Core sample with selection weights only2
Core sample weighted by the final weight
Age band 16-24 14 6 8 14
25-34 23 15 14 23
35-44 24 26 25 24
45-54 23 30 32 23
55-64 13 20 19 13
65 and over 2 2 2 2
Sex Male 51 41 42 51 Female 49 59 58 49 Public or private sector (reported)
Private 71 62 62 71
Public 29 38 38 29 Industry sector in main job
Manufacturing 11 10 10 11
Construction 5 3 3 5 Distribution, hotels
and restaurants 20 17 18 20 Transport and
communication 8 8 8 8 Banking and finance 15 13 12 15 Public admin,
education and health 33 42 42 33 Other services
(inc agr and energy) 7 6 6 7
Ethnicity White 91 92 91 90 Non-white 9 8 9 10 Number of Under 25 34 33 33 35 employees 25-49 13 14 14 13

140
at workplace 50-499 35 36 36 35 (reported) 500+ 18 17 17 17 Hours worked Full-time 73 71 71 74 Part-time 27 29 29 26
Parents No children 64 59 58 63
Children (all ages) 36 41 42 37 Total employees
24992840 1874 4065 1874
Age of youngest Under 2 20 15 13 20
(parents only) 2 to 5 25 24 22 25
6 to 11 28 30 29 28
12 to 15 19 22 24 19
16 to 17 7 9 13 7
Total parents 9086647 769 1699 685
Source: Labour Force Survey 2011, Quarter 1: WLB4 2011
1Labour Force Survey 2011, Quarter 1.All employees aged 16 years and over. 2Weights correct for unequal selection probabilities of individuals in households with more than one eligible person Missing values: Don’t know/refusal Column percent The following tables show similar comparisons of WLB4 to the LFS for employees aged 16 and over and living in Britain who are parents.
The boost samples were designed to achieve additional interviews with 250 employed parents of 0 to 5 year olds, 250 employed parents of 6 to 17 year olds. During analysis, these boost samples were combined with their counterparts from the core sample. In total there were 582 parents whose youngest child was aged between 0 and 5 years and 784 parents whose youngest child was aged between 6 and 17 years.
Table B1.2 shows a comparison for parents whose youngest child was aged between 0 and 5 years. Table B1.3 shows a comparison for parents whose youngest child was aged between 6 and 17 years.
Table B1.2 Comparison of WLB4 and the LFS: Parents of 0-5 year olds
Labour force Survey1
Core+boost sample unweighted
Core+boost sample with selection weights only2
Core+boost sample weighted by the final weight
% % % %
Age band 16-24 6 4 4 6
25-34 45 35 34 45
35-44 43 50 51 43
45+ 6 10 11 6

141
Sex Male 54 48 50 54 Female 46 52 50 46 Public or private sector (reported)
Private 72 64 64 71
Public 28 36 36 29 Industry sector in main job
Manufacturing 11 10 10 11
Construction 6 3 3 6 Distribution, hotels and
restaurants 18 16 16 18 Transport and
communication 9 9 9 9 Banking and finance 17 17 18 17 Public admin, education
and health 33 40 41 33 Other services (inc agr
and energy) 7 5 5 7
Ethnicity White 85 86 85 85 Non-white 15 14 15 15 Number of Under 25 32 29 28 31 employees 25-49 13 16 16 15 at workplace 50-499 34 37 36 36 (reported) 500+ 21 19 19 18 Hours worked Full-time 70 69 70 72 Part-time 30 31 30 28
Age of youngest Under 2 years 45 40 40 44
2 to 5 years 55 60 60 56
Total parents whose youngest child is 0-5 years 4176347 582 582 582
Source: Labour Force Survey 2011, Quarter 1: WLB4 2011
1Labour Force Survey 2011, Quarter 1.All employees aged 16 years and over whose youngest child is aged between 0 and 5 years. 2Weights correct for unequal selection probabilities of individuals in households with more than one eligible person Missing values: Don’t know/refusal Column percent
Table B1.3 Comparison of WLB4 and the LFS: Parents of 6-17 year olds
Labour force Survey1
Core+boost sample unweighted
Core+boost sample with selection weights only2
Core+boost sample weighted by the final weight
% % % %
Age band 16-34 8 7 6 8
35-44 45 42 39 45
45-54 43 46 50 43
55+ 4 5 5 4

142
Sex Male 45 35 37 44 Female 55 65 63 56 Public or private sector (reported)
Private 64 55 55 64
Public 36 45 45 36 Industry sector in main job
Manufacturing 11 7 8 11
Construction 5 3 3 5 Distribution, hotels and
restaurants 16 13 14 16 Transport and
communication 8 8 9 8 Banking and finance 14 12 12 14 Public admin, education
and health 41 51 49 42 Other services (inc agr
and energy) 6 5 5 6 Ethnicity White 91 91 90 90 Non-white 9 9 10 10 Number of Under 25 32 32 32 34 employees 25-49 15 16 16 15 at workplace 50-499 35 36 36 36 (reported) 500+ 18 17 16 15 Hours worked Full-time 68 68 69 71 Part-time 32 32 31 29
Age of youngest 6 to 11 52 50 44 52
12 to 15 35 35 36 35
16 to 17 13 15 20 14
Total parents whose youngest child is 6-17 years 4910300 784 784 784
Source: Labour Force Survey 2011, Quarter 1: WLB4 2011
1Labour Force Survey 2011, Quarter 1.All employees aged 16 years and over whose youngest child is aged between 6 and 17 years 2Weights correct for unequal selection probabilities of individuals in households with more than one eligible person Missing values: Don’t know/refusal Column percent Table B1.4 shows a comparison of WLB4 to the 2007 Adult Psychiatric Morbidity Survey (APMS) for employees aged 16 and over and living in Britain who are carers. The LFS could not be used as the definition of carers used is different to that used in WLB4.

143
Table B1.4 Comparison of WLB4 and APMS: Carers
APMS1
Core+boost sample unweighted
Core+boost sample with selection weights only2
Core+boost sample weighted by the final weight
% % % %
Age band 16-34 24 11 11 24
35-44 26 20 18 26
45-54 29 39 42 29
55 and over 21 30 29 21
Sex Male 45 35 36 45 Female 55 65 64 55
Ethnicity White 92 93 92 91 Non-white 8 7 8 9 Hours worked Full-time 67 68 68 70 Part-time 33 32 32 30
Parents No children 66 62 61 66
Children (0-17) 34 38 39 35
Age of youngest Under 6 31 26 25 31
(parents only) 6 to 17 69 74 75 69
Under 2 12 9 8 12
2 to 5 19 18 17 19
6 to 11 33 33 29 33
12 to 15 21 28 30 21
16 to 17 15 13 17 15
Total carers 920 829 829 829
Source: APMS 2007: WLB4 2011
1Adult Psychiatric Morbidity Survey 2007. All employees aged 16 years and over who have caring responsibilities 2Weights correct for unequal selection probabilities of individuals in households with more than one eligible person Missing values: Don’t know/refusal Column percent

144
Annex C: Supplementary
tables
The tables in the report contain the total number of unweighted cases in the whole
sample, or in the particular group being analysed, and the base for different columns
(e.g. employees in different types of employment). The base for the tables include
all eligible respondents (i.e. all respondents or all respondents who were asked a
particular question), minus missing cases. Therefore, while the base description
might be the same across several tables (e.g. all employees who work part-time), the
base sizes might differ slightly due to the exclusion of missing cases.
In some instances key breaks have been collapsed, for example, age and income
bands widened. This is due to avoid small cell sizes caused by the small sample
sizes in some analyses.
Due to rounding, percentages may not add up to exactly 100 per cent.
‘Shaded rows’ indicate differences are statistically significant at 95 per cent
confidence interval or above.
The following symbols have been used in tables:
[ ] to indicate a percentage based on fewer than 50 unweighted cases
* percentages based on fewer than 25 unweighted cases are not shown
(blank) to indicate that no respondents gave that answer
0 to indicate a percentage value of less than 0.5 per cent.

Table C2.1 Usual hours worked by employees
Less than 30 hours
30 - 35 hours
>35 - 40 hours
>40 - 48 hours
>48 - 55 hours
>55 hours Unweighted bases
All employees 26 15 44 9 4 2 1867
Gender Female 40 18 35 4 2 0 1093
Male 13 11 53 13 7 3 774
Age 16-24 39 12 41 8 1 110
25-39 22 16 46 9 5 2 490
40-49 23 15 47 9 4 2 553
50-59 23 14 44 8 7 4 503
60+ 40 15 34 9 0 1 177
Ethnicity White 26 15 44 8 4 2 1688
Non-white 28 15 44 10 2 1 150
Parental status Parent 28 16 39 9 5 2 768
Non-parent 25 14 47 9 4 2 1099
Highest qualification level
None 31 14 45 7 2 1 152
GCSEs/O Level/CSEs 35 14 39 10 2 1 372
A Levels 31 14 43 9 3 0 293
Degree/Professional 21 15 50 6 4 4 357
145

Table C2.1 Usual hours worked by employees
Less than 30 hours
30 - 35 hours
>35 - 40 hours
>40 - 48 hours
>48 - 55 hours
>55 hours Unweighted bases
qualifications
Postgraduate degree 21 13 42 10 11 4 281
Other vocational or academic qualifications, level not specified
18 19 50 7 4 2 254
Other 28 11 41 14 3 2 118
Household income Under £15,000 55 21 20 4 1 160
£15,000 - £24,999 31 17 39 11 2 0 269
£25,000 - £34,999 24 12 46 12 4 2 246
£35,000 - £44,999 23 12 54 6 3 1 213
£45,000 or more 13 15 49 10 8 5 506
Carer status Yes, child [45] [13] [27] [4] [5] [6] 33
Yes, relative in any household or non-relative adult in this household
29 15 41 9 5 2 315
Yes, non-relative adult in another household
[39] [14] [39] [2] [6] 33
No 25 15 45 9 4 2 1486
Disability status No 25 15 45 9 4 2 1589
146

Table C2.1 Usual hours worked by employees
Less than 30 hours
30 - 35 hours
>35 - 40 hours
>40 - 48 hours
>48 - 55 hours
>55 hours Unweighted bases
Yes 32 13 42 7 2 4 252
Religion or faith None 24 15 46 8 4 2 564
Christian 27 15 43 9 5 2 1171
Other 27 12 46 13 2 99
Region South 26 14 43 9 6 2 845
North 26 15 45 9 4 1 413
Midlands 28 13 47 8 2 2 312
Wales 27 19 44 6 2 2 107
Scotland 25 19 41 9 2 3 190
Level of responsibility Manager/supervisor 15 13 50 11 8 4 692
Not manager/supervisor 33 16 41 7 2 1 1157
Time with current employer
Less than 6 months 32 18 41 6 3 1 85
6 to 11 months 30 17 44 4 3 3 54
1 year to 4 years 30 15 42 8 4 1 536
5 to 9 years 23 17 43 11 4 3 475
10 years or more 22 12 48 9 6 2 717
147

Table C2.1 Usual hours worked by employees
Less than 30 hours
30 - 35 hours
>35 - 40 hours
>40 - 48 hours
>48 - 55 hours
>55 hours Unweighted bases
Flexible worker status Part-time only 83 11 5 1 250
Part-time and flexible working 73 12 12 2 0 0 362
Flexible working other than part-time
2 18 61 9 8 2 450
No part-time or flexible working 3 17 59 15 4 2 594
Tenure Permanent 24 15 45 9 4 2 1746
Temporary - seasonal, agency or casual, Fixed term, Other
48 11 33 4 3 1 117
Trade union membership
TU/SA member 20 18 49 9 3 2 632
Not TU/SA member 29 13 42 9 5 2 1211
Socio-economic classification
Managerial and professional occupations
14 16 50 9 7 4 887
Intermediate occupations 37 15 45 4 0 273
Routine and manual occupations 36 14 37 10 2 1 672
Sector Private 26 14 43 10 5 2 1132
Public 27 16 46 7 3 1 691
Industry Manufacturing 8 5 70 12 4 1 183
148

Table C2.1 Usual hours worked by employees
Less than 30 hours
30 - 35 hours
>35 - 40 hours
>40 - 48 hours
>48 - 55 hours
>55 hours Unweighted bases
Construction 12 9 53 16 7 2 58
Distribution, retail, hotels & restaurants
46 15 29 7 2 1 306
Transport, storage & communication
13 15 47 12 8 4 149
Banking, insurance, professional and support services
19 19 44 8 6 3 235
Public Admin, Education, Health 28 18 43 6 3 2 758
Other activities 32 10 37 15 2 4 112
Size of workplace Part of larger organisation: 1-9 38 6 40 12 3 1 145
Part of larger organisation: 10-49 30 17 40 6 5 1 357
Part of larger organisation: 50-249
21 18 45 9 6 1 373
Part of larger organisation: 250+ 16 12 55 10 4 2 388
Single site: 1-9 45 14 26 7 5 4 124
Single site: 10-49 26 14 48 9 2 2 211
Single site: 50-249 26 15 39 10 5 5 111
Single site: 250+ 17 22 44 8 9 78
149

Table C2.1 Usual hours worked by employees
Less than 30 hours
30 - 35 hours
>35 - 40 hours
>40 - 48 hours
>48 - 55 hours
>55 hours Unweighted bases
Personal earned income Under £10,000 76 14 9 1 0 323
£10,000 - £14,999 34 21 38 7 0 0 234
£15,000 - £24,999 11 13 62 11 2 1 417
£25,000 - £39,999 4 14 63 12 4 3 365
£40,000 or more 5 13 43 14 16 8 251
Gender make-up of workplace
Mostly women 38 18 35 6 2 1 723
Mostly men 12 10 56 13 7 3 492
About half women and half men 27 16 44 7 4 2 629
Employment contract of terms and conditions
Yes 24 15 46 8 4 2 1656
No 43 11 28 12 3 2 200
Base: All employees (Core Sample).
Missing values: don’t know / refusal
Row per cent.
150

Table C2.2 Overtime worked by employees
Whether worked paid or unpaid overtime
Both paid only unpaid only Unweighted bases
All employees working overtime
15 36 49 845
Gender Female 17 32 51 470
Male 13 40 47 375
Age 16-24 [13] [72] [15] 42
25-39 15 37 48 217
40-49 13 28 59 271
50-59 18 26 56 238
60+ 15 34 50 63
Ethnicity White 14 37 49 777
Non-white 22 29 49 55
Parental status Parent 14 33 53 357
Non-parent 15 38 47 488
Highest qualification level None [14] [64] [22] 48
GCSEs/O Level/CSEs 17 53 30 142
151
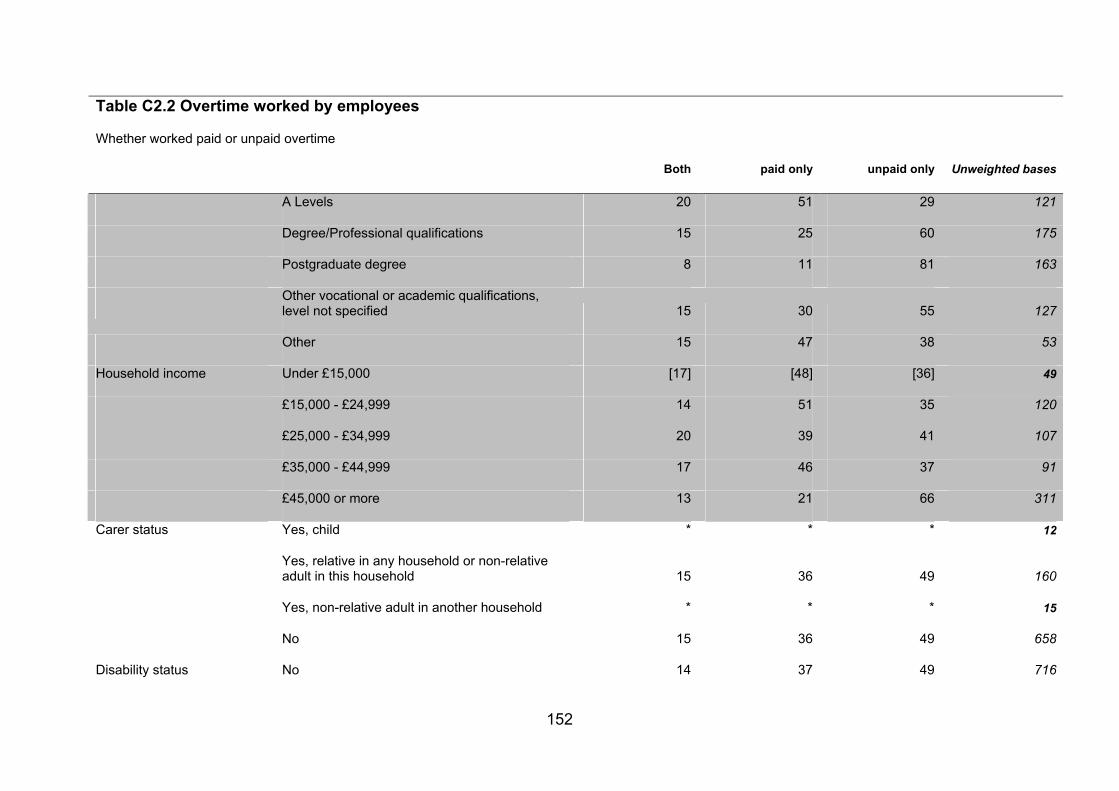
Table C2.2 Overtime worked by employees
Whether worked paid or unpaid overtime
Both paid only unpaid only Unweighted bases
A Levels 20 51 29 121
Degree/Professional qualifications 15 25 60 175
Postgraduate degree 8 11 81 163
Other vocational or academic qualifications, level not specified 15 30 55 127
Other 15 47 38 53
Household income Under £15,000 [17] [48] [36] 49
£15,000 - £24,999 14 51 35 120
£25,000 - £34,999 20 39 41 107
£35,000 - £44,999 17 46 37 91
£45,000 or more 13 21 66 311
Carer status Yes, child * * * 12
Yes, relative in any household or non-relative adult in this household 15 36 49 160
Yes, non-relative adult in another household * * * 15
No 15 36 49 658
Disability status No 14 37 49 716
152

Table C2.2 Overtime worked by employees
Whether worked paid or unpaid overtime
Both paid only unpaid only Unweighted bases
Yes 20 29 51 120
Religion or faith None 13 38 49 259
Christian 15 36 49 533
Other [24] [32] [44] 39
Region South 12 36 52 395
North 19 33 48 189
Midlands 17 38 45 135
Wales [17] [51] [32] 43
Scotland 12 36 52 83
Full-time or part-time worker Part-time 18 49 32 189
Full-time 14 32 54 649
Level of responsibility Manager/supervisor 13 23 63 402
Not manager/supervisor 16 48 36 435
Time with current employer Less than 12 months 9 47 44 60
1 year to 4 years 14 43 43 237
5 to 9 years 19 30 51 212
153

Table C2.2 Overtime worked by employees
Whether worked paid or unpaid overtime
Both paid only unpaid only Unweighted bases
10 years or more 14 31 55 336
Flexible worker status Part-time only 19 57 24 82
Part-time and flexible working 16 39 45 134
Flexible working other than part-time 10 19 71 236
No part-time or flexible working 17 42 41 294
Tenure Permanent 14 37 49 799
Temporary - seasonal, agency or casual, Fixed term, Other [16] [35] [49] 44
Trade union membership TU/SA member 20 31 49 324
Not TU/SA member 13 38 49 510
Socio-economic Managerial and professional occupations classification 13 17 69 484
Intermediate occupations 18 40 42 83
Routine and manual occupations 17 65 18 259
Sector Private 14 42 44 490
Public 17 21 62 339
Industry Manufacturing 20 55 26 80
154

Table C2.2 Overtime worked by employees
Whether worked paid or unpaid overtime
Both paid only unpaid only Unweighted bases
Construction [15] [46] [40] 25
Distribution, retail, hotels & restaurants 15 56 29 115
Transport, storage & communication 4 47 49 73
Banking, insurance, professional and support services 13 25 62 109
Public Admin, Education, Health 18 25 58 363
Other activities 13 24 62 53
Size of workplace Part of larger organisation: 1-9 13 41 47 65
Part of larger organisation: 10-49 17 47 35 169
Part of larger organisation: 50-249 9 42 49 188
Part of larger organisation: 250+ 18 27 55 185
Single site: 1-9 [9] [14] [77] 41
Single site: 10-49 19 43 38 86
Single site: 50-249 23 25 52 52
Single site: 250+ [18] [82] 28
Personal earned income Under £10,000 21 57 22 94
155

Table C2.2 Overtime worked by employees
Whether worked paid or unpaid overtime
Both paid only unpaid only Unweighted bases
£10,000 - £14,999 13 59 28 96
£15,000 - £24,999 19 45 36 197
£25,000 - £39,999 15 27 58 196
£40,000 or more 7 11 82 171
Usual hours worked Less than 30 hours 18 50 32 192
30 - 35 hours 16 33 51 128
>35 - 40 hours 15 34 51 378
>40 - 48 hours 16 33 51 80
>48 - 55 hours [2] [18] [80] 47
>55 hours * * * 19
Employment contract of terms and conditions
Yes 15 36 49 768
No 13 40 48 74
Base: All employees (Core sample).
Missing values: don’t know / refusal
Row per cent.
156

Table C2.3 Main reason for working any paid overtime
Reason for overtime - compressed
Workload demands
Organisational culture
Personal choice Unweighted bases
All employees working paid overtime 58 6 36 371
Gender Female 65 6 29 199
Male 53 5 42 199
Age 16-39 50 4 46 138
40-49 65 8 27 105
50+ 70 8 23 123
Ethnicity White 57 6 36 339
Non-white [70] [30] 27
Parental status Parent 64 9 27 153
Non-parent 55 4 41 218
Highest qualification level None [63] [1] [37] 33
GCSEs/O Level/CSEs 49 9 42 92
A Levels 49 4 47 76
Degree/Professional qualifications 73 6 21 56
157

Table C2.3 Main reason for working any paid overtime
Reason for overtime - compressed
Workload demands
Organisational culture
Personal choice Unweighted bases
Postgraduate degree [59] [41] 25
Other vocational or academic qualifications, level not specified [70] [4] [26] 49
Other [65] [7] [28] 32
Household income Under £25,000 48 8 44 99
£25,000 - £44,999 63 3 34 107
£45,000 or more 72 11 17 89
Carer status Yes, child * * 7
Yes, relative in any household or non-relative adult in this household 58 2 40 69
Yes, non-relative adult in another household * * 5
No 58 7 35 290
Disability status No 59 5 36 318
Yes 51 12 37 50
Religion or faith None 57 5 38 111
Christian 57 6 37 234
158
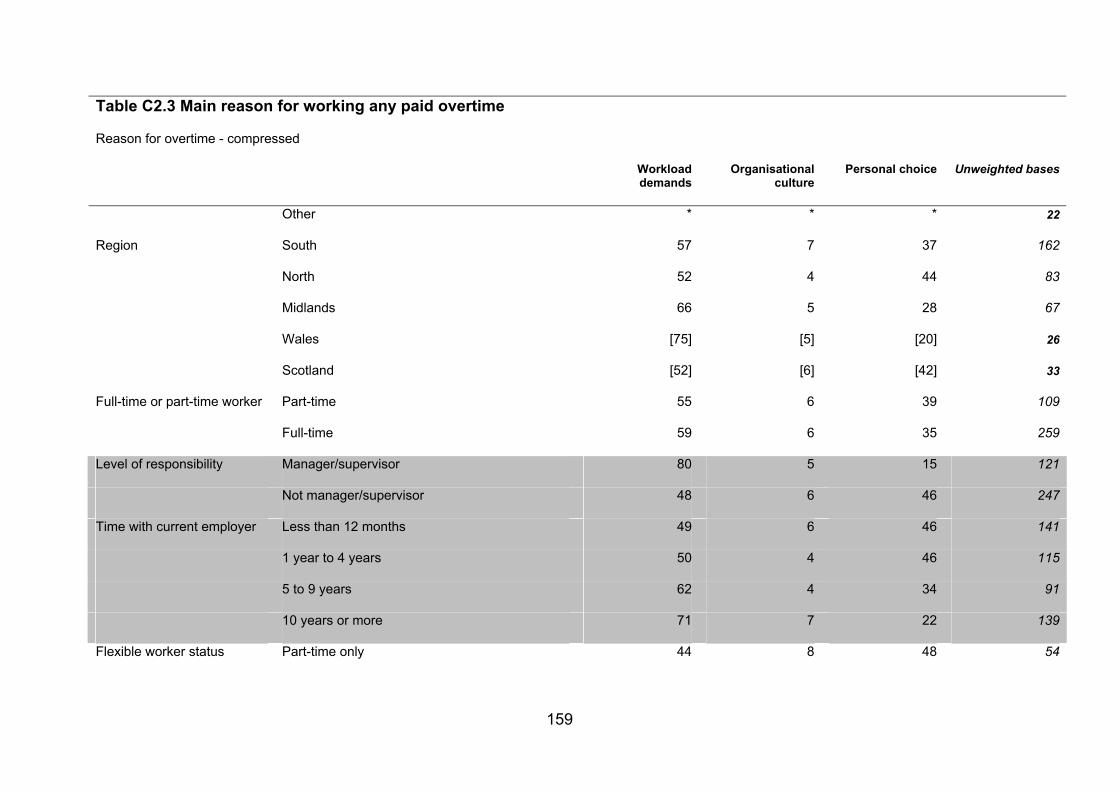
Table C2.3 Main reason for working any paid overtime
Reason for overtime - compressed
Workload demands
Organisational culture
Personal choice Unweighted bases
Other * * * 22
Region South 57 7 37 162
North 52 4 44 83
Midlands 66 5 28 67
Wales [75] [5] [20] 26
Scotland [52] [6] [42] 33
Full-time or part-time worker Part-time 55 6 39 109
Full-time 59 6 35 259
Level of responsibility Manager/supervisor 80 5 15 121
Not manager/supervisor 48 6 46 247
Time with current employer Less than 12 months 49 6 46 141
1 year to 4 years 50 4 46 115
5 to 9 years 62 4 34 91
10 years or more 71 7 22 139
Flexible worker status Part-time only 44 8 48 54
159
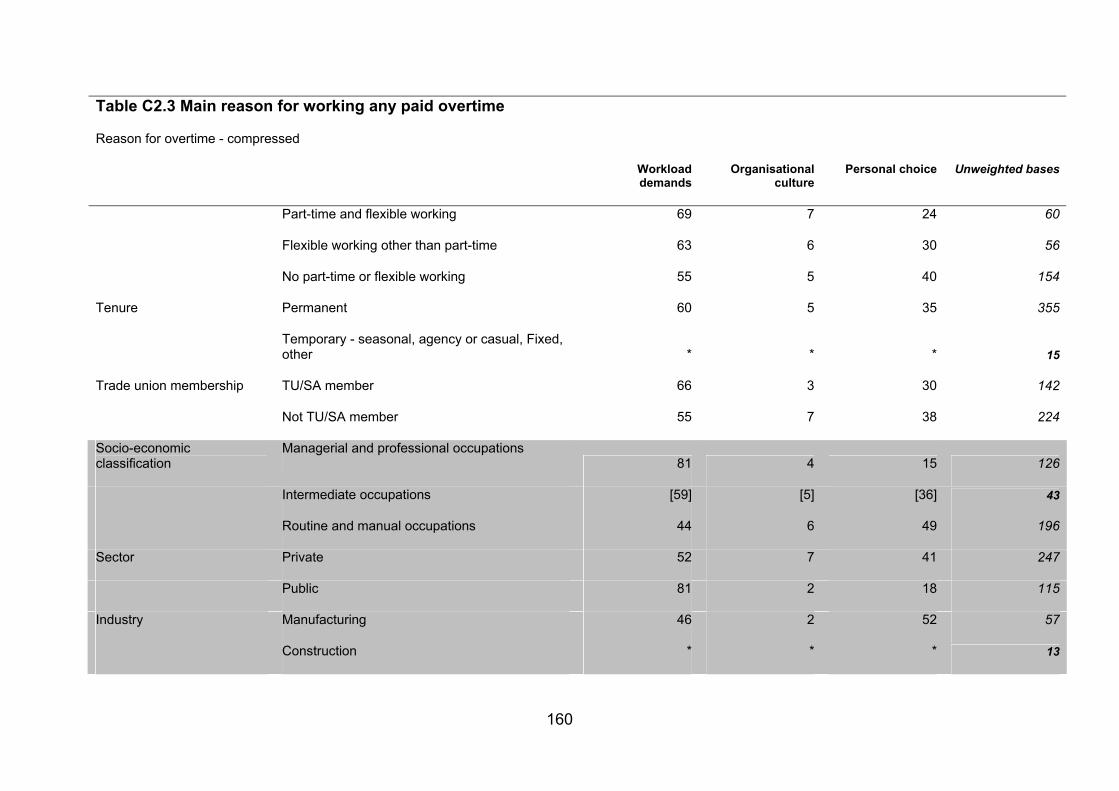
Table C2.3 Main reason for working any paid overtime
Reason for overtime - compressed
Workload demands
Organisational culture
Personal choice Unweighted bases
Part-time and flexible working 69 7 24 60
Flexible working other than part-time 63 6 30 56
No part-time or flexible working 55 5 40 154
Tenure Permanent 60 5 35 355
Temporary - seasonal, agency or casual, Fixed, other * * * 15
Trade union membership TU/SA member 66 3 30 142
Not TU/SA member 55 7 38 224
Socio-economic Managerial and professional occupations classification 81 4 15 126
Intermediate occupations [59] [5] [36] 43
Routine and manual occupations 44 6 49 196
Sector Private 52 7 41 247
Public 81 2 18 115
Industry Manufacturing 46 2 52 57
Construction * * * 13
160

Table C2.3 Main reason for working any paid overtime
Reason for overtime - compressed
Workload demands
Organisational culture
Personal choice Unweighted bases
Distribution, retail, hotels & restaurants 43 9 47 78
Transport, storage & communication 41 9 50 32
Banking, insurance, professional and support services [78] [8] [14] 38
Public Admin, Education, Health 77 2 21 126
Other activities * * * 19
Size of workplace 1-9 employees 57 9 34 40
10-49 employees 56 6 38 141
50-249 employees 63 4 33 103
250+ employees 58 6 36 79
Personal earned income Under £10,000 44 5 51 64
£10,000 - £14,999 44 5 51 59
£15,000 - £24,999 61 7 32 116
£25,000 or more 73 6 21 99
Base: All employees working paid overtime (Core sample).
Some categories collapsed due to small cell sizes
Missing values: don’t know / refusal. Row per cent.
161

Table C2.4 Main reason for working any unpaid overtime
Reason for overtime - compressed
Workload demands
Organisational culture
Personal choice Unweighted bases
All employees working unpaid overtime 86 5 9 565
Gender Female 88 4 8 327
Male 84 7 9 327
Age 16-39 81 6 14 152
40-49 88 5 6 198
50+ 90 4 6 206
Ethnicity White 85 5 10 518
Non-white [96] [3] [2] 39
Parental status Parent 89 6 6 246
Non-parent 84 5 11 319
Highest qualification level None * * 19
GCSEs/O Level/CSEs 78 8 14 67
A Levels 79 4 17 66
Degree/Professional qualifications 90 5 5 137
162

Table C2.4 Main reason for working any unpaid overtime
Reason for overtime - compressed
Workload demands
Organisational culture
Personal choice Unweighted bases
Postgraduate degree 89 6 5 147
Other vocational or academic qualifications, level not specified 87 4 9 91
Other [89] [5] [6] 28
Household income Under £25,000 80 8 12 87
£25,000 - £34,999 77 6 17 63
£35,000 - £44,999 88 5 7 55
£45,000 or more 89 5 7 253
Carer status Yes, child * 8
Yes, relative in any household or non-relative adult in this household 82 5 13 107
Yes, non-relative adult in another household * * 10
No 87 5 8 440
Disability status No 87 5 8 471
Yes 78 8 15 88
Religion or faith None 83 7 10 177
163

Table C2.4 Main reason for working any unpaid overtime
Reason for overtime - compressed
Workload demands
Organisational culture
Personal choice Unweighted bases
Christian 86 5 9 354
Other [100] 25
Region South 90 5 5 267
North 75 4 22 126
Midlands 87 7 6 91
Wales * * * 23
Scotland 91 6 3 58
Full-time or part-time worker Part-time 83 3 14 106
Full-time 86 6 8 456
Level of responsibility Manager/supervisor 90 4 6 323
Not manager/supervisor 81 6 13 237
Time with current employer Less than 5 years 85 5 10 185
5 to 9 years 85 5 10 150
10 years or more 88 5 6 230
Flexible worker status Part-time only [66] [4] [30] 41
164

Table C2.4 Main reason for working any unpaid overtime
Reason for overtime - compressed
Workload demands
Organisational culture
Personal choice Unweighted bases
Part-time and flexible working 91 7 2 88
Flexible working other than part-time 91 2 7 196
No part-time or flexible working 83 7 10 175
Tenure Permanent 88 5 7 531
Temporary - seasonal, agency or casual,
Fixed term, Other [67] [11] [22] 32
Trade union membership TU/SA member 87 5 8 229
Not TU/SA member 85 5 9 330
Socio-economic Managerial and professional occupations classification 90 5 6 402
Intermediate occupations [81] [7] [13] 49
Routine and manual occupations 73 6 20 101
Sector Private 83 7 10 292
Public 91 3 6 265
Industry Manufacturing [71] [3] [26] 34
Construction * * * 14
165

166
Table C2.4 Main reason for working any unpaid overtime
Reason for overtime - compressed
Workload demands
Organisational culture
Personal choice Unweighted bases
Distribution, retail, hotels & restaurants 75 15 10 55
Transport, storage & communication [78] [6] [16] 43
Banking, insurance, professional and support services 86 8 6 80
Public Admin, Education, Health 92 3 5 280
Other activities [88] [12] 39
Size of workplace 1-9 employees [83] [6] [11] 40
10-49 employees 86 2 12 103
50-249 employees 88 5 7 121
250+ employees 85 5 10 134
Personal earned income Under £15,000 78 5 17 92
£15,000 - £24,999 79 6 15 111
£25,000 - £39,999 86 6 8 147
£40,000 or more 93 5 2 151
Base: All employees working unpaid overtime (Core sample).
Some categories collapsed due to small cell sizes
Missing values: don’t know / refusal. Row per cent.

Table C2.5 On call working by employees
Are you required to do on-call working?
Yes No Unweighted bases
All employees 17 83 1870
Gender Female 13 87 1095
Male 21 79 775
Age 16-24 12 88 111
25-39 16 84 490
40-49 18 82 553
50-59 19 81 503
60+ 16 84 179
Ethnicity White 16 84 1691
Non-white 22 78 150
Parental status Parent 18 82 769
Non-parent 16 84 1101
Highest qualification level
None 20 80 153
GCSEs/O Level/CSEs 11 89 372
A Levels 21 79 292
Degree/Professional qualifications 15 85 358
Postgraduate degree 18 82 282
Other vocational or academic qualifications, level not specified
16 84 254
Other 19 81 119
Household income Under £15,000 17 83 160
£15,000 - £24,999 23 77 269
£25,000 - £34,999 13 87 246
£35,000 - £44,999 16 84 213
£45,000 or more 20 80 506
Carer status Yes, child [11] [89] 33
167

Table C2.5 On call working by employees
Are you required to do on-call working?
Yes No Unweighted bases
Yes, relative in any household or non-relative adult in this household
21 79 315
Yes, non-relative adult in another household
[14] [86] 33
No 16 84 1489
Disability status No 17 83 1591
Yes 12 88 253
Religion or faith None 15 85 563
Christian 17 83 1175
Other 19 81 99
Region South 16 84 850
North 14 86 412
Midlands 18 82 312
Wales 29 71 107
Scotland 17 83 189
Full-time or part-time worker
Part-time 11 89 536
Full-time 19 81 1316
Level of responsibility
Manager/supervisor 24 76 693
Not manager/supervisor 12 88 1159
Time with current employer
Less than 6 months 9 91 85
6 to 11 months 27 73 54
1 year to 4 years 13 87 537
5 to 9 years 16 84 473
10 years or more 22 78 721
Flexible worker status
Part-time only 6 94 250
168
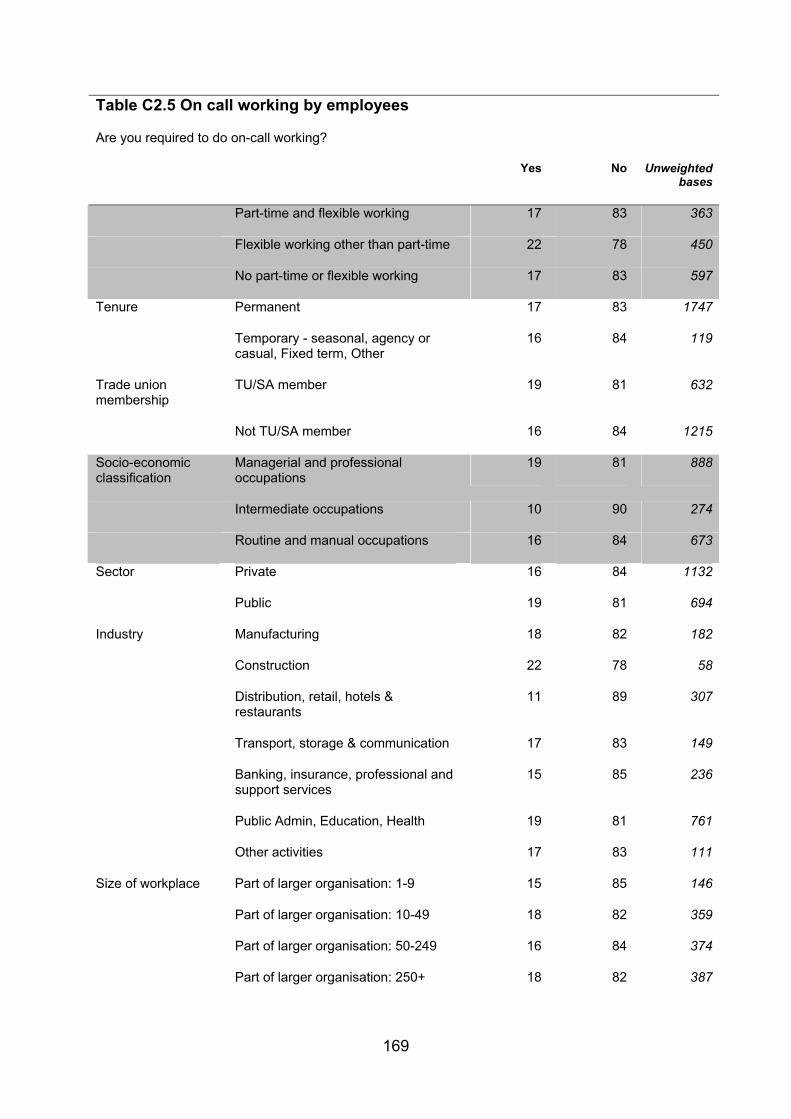
Table C2.5 On call working by employees
Are you required to do on-call working?
Yes No Unweighted bases
Part-time and flexible working 17 83 363
Flexible working other than part-time 22 78 450
No part-time or flexible working 17 83 597
Tenure Permanent 17 83 1747
Temporary - seasonal, agency or casual, Fixed term, Other
16 84 119
Trade union membership
TU/SA member 19 81 632
Not TU/SA member 16 84 1215
Socio-economic classification
Managerial and professional occupations
19 81 888
Intermediate occupations 10 90 274
Routine and manual occupations 16 84 673
Sector Private 16 84 1132
Public 19 81 694
Industry Manufacturing 18 82 182
Construction 22 78 58
Distribution, retail, hotels & restaurants
11 89 307
Transport, storage & communication 17 83 149
Banking, insurance, professional and support services
15 85 236
Public Admin, Education, Health 19 81 761
Other activities 17 83 111
Size of workplace Part of larger organisation: 1-9 15 85 146
Part of larger organisation: 10-49 18 82 359
Part of larger organisation: 50-249 16 84 374
Part of larger organisation: 250+ 18 82 387
169

170
Table C2.5 On call working by employees
Are you required to do on-call working?
Yes No Unweighted bases
Single site: 1-9 17 83 124
Single site: 10-49 16 84 211
Single site: 50-249 13 87 110
Single site: 250+ 13 87 78
Personal earned income
Under £10,000 9 91 324
£10,000 - £14,999 18 82 234
£15,000 - £24,999 17 83 418
£25,000 - £39,999 21 79 366
£40,000 or more 24 76 250
Contract of employment
Yes 18 82 1657
No 11 89 202
Base: All employees (Core sample).
Missing values: don’t know / refusal
Row per cent.

Table C2.6 Satisfaction with hours worked
Level of satisfaction with hours worked - reversed
Very dissatisfied
Dissatisfied Neither satisfied nor dissatisfied
Satisfied Very satisfied Unweighted bases
All employees 3 7 12 45 33 1873
Gender Female 2 8 10 44 36 1096
Male 3 7 13 46 31 777
Age 16-24 2 8 12 44 34 111
25-39 3 8 12 45 32 491
40-49 4 7 12 46 32 554
50-59 2 8 12 46 32 504
60+ 3 3 5 40 49 179
Ethnicity White 2 6 11 46 34 1694
Non-white 5 14 14 37 29 150
Parental status Parent 3 6 11 45 35 771
Non-parent 3 8 12 45 33 1102
Highest qualification level
None 2 4 6 53 35 153
GCSEs/O Level/CSEs 3 5 7 49 36 372
171

Table C2.6 Satisfaction with hours worked
Level of satisfaction with hours worked - reversed
Very dissatisfied
Dissatisfied Neither satisfied nor dissatisfied
Satisfied Very satisfied Unweighted bases
A Levels 2 4 11 47 37 293
Degree/Professional qualifications 2 10 14 40 35 359
Postgraduate degree 5 11 16 41 27 283
Other vocational or academic qualifications, level not specified
2 7 14 44 33 254
Other 1 12 12 49 26 119
Household income Under £15,000 7 6 5 53 29 160
£15,000 - £24,999 6 8 9 42 35 268
£25,000 - £34,999 2 4 12 47 36 246
£35,000 - £44,999 8 8 53 31 213
£45,000 or more 3 9 16 42 30 508
Carer status Yes, child [5] [9] [30] [57] 33
Yes, relative in any household or non-relative adult in this household
2 11 11 47 29 316
Yes, non-relative adult in another household
[3] [8] [59] [30] 33
172

Table C2.6 Satisfaction with hours worked
Level of satisfaction with hours worked - reversed
Very dissatisfied
Dissatisfied Neither satisfied nor dissatisfied
Satisfied Very satisfied Unweighted bases
No 3 7 12 45 34 1491
Disability status No 2 7 12 46 34 1594
Yes 5 11 10 41 33 253
Religion or faith None 3 7 13 43 34 566
Christian 3 7 11 47 33 1175
Other 1 14 12 37 36 99
Region South 3 9 13 43 33 849
North 4 5 13 46 32 414
Midlands 3 7 9 46 35 313
Wales 1 6 12 43 38 107
Scotland 2 5 8 51 35 190
Full-time or part-time worker
Part-time 3 6 7 42 41 537
Full-time 3 8 13 46 30 1317
Level of responsibility Manager/supervisor 3 9 13 45 30 696
173

Table C2.6 Satisfaction with hours worked
Level of satisfaction with hours worked - reversed
Very dissatisfied
Dissatisfied Neither satisfied nor dissatisfied
Satisfied Very satisfied Unweighted bases
Not manager/supervisor 3 6 10 45 36 1159
Time with current employer
Less than 6 months 6 8 18 45 23 85
6 to 11 months 1 9 10 44 36 54
1 year to 4 years 4 9 12 43 33 538
5 to 9 years 3 6 10 43 37 476
10 years or more 1 6 11 49 33 720
Flexible worker status Part-time only 3 6 11 44 37 251
Part-time and flexible working 3 8 6 43 40 364
Flexible working other than part-time
1 6 14 45 34 451
No part-time or flexible working 3 7 13 46 30 596
Tenure Permanent 3 7 11 45 34 1749
Temporary - seasonal, agency or casual, Fixed term, Other
4 15 12 43 26 120
Trade union membership
TU/SA member 2 8 10 46 34 633
174

Table C2.6 Satisfaction with hours worked
Level of satisfaction with hours worked - reversed
Very dissatisfied
Dissatisfied Neither satisfied nor dissatisfied
Satisfied Very satisfied Unweighted bases
Not TU/SA member 3 7 12 45 33 1216
Socio-economic classification
Managerial and professional occupations
2 9 14 42 32 891
Intermediate occupations 0 4 11 46 38 273
Routine and manual occupations 4 6 9 48 33 674
Sector Private 3 6 12 46 32 1134
Public 2 9 10 43 36 695
Industry Manufacturing 2 6 10 48 34 183
Construction 3 7 10 50 31 58
Distribution, retail, hotels & restaurants
4 5 13 49 30 307
Transport, storage & communication
2 7 16 45 30 149
Banking, insurance, professional and support services
4 7 12 44 33 236
Public Admin, Education, Health 2 7 11 42 37 763
Other activities 3 17 6 41 33 111
175

Table C2.6 Satisfaction with hours worked
Level of satisfaction with hours worked - reversed
Very dissatisfied
Dissatisfied Neither satisfied nor dissatisfied
Satisfied Very satisfied Unweighted bases
Size of workplace Part of larger organisation: 1-9 6 7 9 52 26 146
Part of larger organisation: 10-49 3 7 12 44 34 359
Part of larger organisation: 50-249 3 8 10 48 29 374
Part of larger organisation: 250+ 2 7 14 43 34 387
Single site: 1-9 2 6 11 41 41 124
Single site: 10-49 1 4 10 48 37 212
Single site: 5 0-249 1 13 12 39 34 111
Single site: 250+ 2 7 14 47 30 78
Usual hours worked Less than 30 hours 3 6 7 42 42 543
30 - 35 hours 1 10 9 47 33 292
>35 - 40 hours 2 5 10 46 36 773
>40 - 48 hours 4 11 21 51 12 146
>48 - 55 hours 4 14 37 40 5 75
>55 hours [13] [27] [24] [27] [9] 37
Whether worked paid or Both 2 10 13 42 33 121
176

Table C2.6 Satisfaction with hours worked
Level of satisfaction with hours worked - reversed
Very dissatisfied
Dissatisfied Neither satisfied nor dissatisfied
Satisfied Very satisfied Unweighted bases
unpaid overtime
paid only 3 8 9 45 35 258
unpaid only 5 12 20 40 23 457
In the last 12 months and with your current employer have you taken leave under these circumstances?
Yes 4 8 10 47 32 374
No 2 7 12 45 34 1496
Base: All employees (Core sample).
Missing values: don’t know / refusal
Row per cent.
177

Table C2.7 Annual leave entitlement (adjusted for bank holidays) of full-time employees
Number of days paid holiday – banded
Less than 20 days (or 28 if incl
bank hols)
20-24 days 25 days 26-30 days More than 30 days
Unweighted bases
All full-time employees 7 28 22 28 15 1244
Gender Female 5 26 21 28 20 593
Male 8 29 23 29 11 651
Age 16-24 10 43 18 25 4 58
25-39 9 29 23 29 10 344
40-49 4 24 24 28 20 383
50-59 6 21 22 30 22 346
60+ 2 32 22 25 18 91
Ethnicity White 7 28 22 28 15 1124
Non-white 9 20 27 31 14 102
178

Table C2.7 Annual leave entitlement (adjusted for bank holidays) of full-time employees
Number of days paid holiday – banded
Less than 20 days (or 28 if incl
bank hols)
20-24 days 25 days 26-30 days More than 30 days
Unweighted bases
Parental status Parent 9 25 22 30 14 484
Non-parent 6 29 22 28 15 760
Highest qualification None level 8 39 23 23 7 97
GCSEs/O Level/CSEs 9 35 21 25 10 217
A Levels 11 28 24 23 14 184
Degree/Professional qualifications 5 19 22 36 17 251
Postgraduate degree 5 19 25 28 24 207
Other vocational or academic qualifications, level not specified 5 30 20 32 14 189
Other 2 38 16 28 16 73
Household income Under £15,000 18 39 10 16 17 69
£15,000 - £24,999 7 37 19 25 12 173
£25,000 - £34,999 6 34 18 28 13 178
£35,000 - £44,999 6 26 26 27 16 154
£45,000 or more 5 19 25 32 20 402
179

Table C2.7 Annual leave entitlement (adjusted for bank holidays) of full-time employees
Number of days paid holiday – banded
Less than 20 days (or 28 if incl
bank hols)
20-24 days 25 days 26-30 days More than 30 days
Unweighted bases
Carer status Yes 7 25 16 31 22 235
No 7 28 23 28 13 1009
Disability status No 6 28 23 28 15 1061
Yes 13 21 20 31 15 166
Religion or faith None 7 28 26 28 11 394
Christian 7 27 21 28 17 761
Other 5 26 22 30 17 69
Region South 8 29 24 29 10 561
North 9 27 18 29 18 277
Midlands 4 32 20 24 20 203
Wales 2 20 20 28 29 72
Scotland 6 20 26 33 15 131
Level of Manager/supervisor responsibility 3 20 26 33 18 548
Not manager/supervisor 9 33 20 25 13 684
180

Table C2.7 Annual leave entitlement (adjusted for bank holidays) of full-time employees
Number of days paid holiday – banded
Less than 20 days (or 28 if incl
bank hols)
20-24 days 25 days 26-30 days More than 30 days
Unweighted bases
Time with current Less than 6 months employer 12 39 15 32 2 53
6 to 11 months [10] [39] [27] [18] [6] 33
1 year to 4 years 10 39 21 21 9 333
5 to 9 years 5 24 24 35 12 320
10 years or more 4 17 23 31 25 505
Flexible worker Part-time only status [34] [33] [16] [16] [1] 31
(part-time status Part-time and flexible working based on contracted hours) 14 30 24 21 12 61
Flexible working other than part-time 4 17 24 33 22 410
No part-time or flexible working 7 31 20 29 12 552
Tenure Permanent 6 27 23 28 15 1193
Temporary - seasonal, agency or casual, Fixed term or other [18] [37] [11] [30] [4] 49
Trade union TU/SA member 5 14 15 34 32 440
181

Table C2.7 Annual leave entitlement (adjusted for bank holidays) of full-time employees
Number of days paid holiday – banded
Less than 20 days (or 28 if incl
bank hols)
20-24 days 25 days 26-30 days More than 30 days
Unweighted bases
membership
Not TU/SA member 8 33 26 26 7 787
Socio-economic Managerial and professional classification occupations 4 20 25 31 20 680
Intermediate occupations 2 37 24 26 11 161
Routine and manual occupations 14 36 17 25 9 378
Sector Private 9 33 26 26 6 783
Public 2 12 12 34 39 438
Industry Manufacturing 14 33 30 17 6 156
Construction [4] [38] [17] [31] [10] 47
Distribution, retail, hotels & restaurants 13 38 24 18 8 161
Transport, storage & communication 3 32 27 31 8 117
Banking, insurance, professional and support services 5 31 19 38 6 185
Public Admin, Education, Health 5 16 13 32 33 462
182

Table C2.7 Annual leave entitlement (adjusted for bank holidays) of full-time employees
Number of days paid holiday – banded
Less than 20 days (or 28 if incl
bank hols)
20-24 days 25 days 26-30 days More than 30 days
Unweighted bases
Other activities 3 26 40 23 8 66
Size of workplace Part of larger organisation: 1-9 4 35 26 27 9 82
Part of larger organisation: 10-49 5 26 20 26 22 221
Part of larger organisation: 50-249 6 23 27 29 15 262
Part of larger organisation: 250+ 7 15 24 38 16 304
Single site: 1-9 17 43 22 14 5 60
Single site: 10-49 5 51 18 18 9 143
Single site: 50-249 11 21 18 28 22 77
Single site: 250+ 11 24 10 37 19 60
Personal earned Under £10,000 income 31 32 11 22 5 54
£10,000 - £14,999 11 41 17 22 9 135
£15,000 - £24,999 4 36 25 24 12 340
£25,000 - £39,999 6 23 22 27 22 324
£40,000 or more 6 11 22 41 20 229
183

Table C2.7 Annual leave entitlement (adjusted for bank holidays) of full-time employees
Number of days paid holiday – banded
Less than 20 days (or 28 if incl
bank hols)
20-24 days 25 days 26-30 days More than 30 days
Unweighted bases
Gender make-up of Mostly women workplace 5 24 18 27 25 393
Mostly men 7 34 27 25 7 416
About half women and half men 8 23 21 34 15 429
Employment Yes contract of terms
6 26 22 30 16and conditions 1143
No 16 39 25 16 5 97
Base: All full-time employees (Core sample).
Missing values: don’t know / refusal
Row per cent.
184

Table C2.8 Annual leave entitlement (adjusted for bank holidays) of part-time employees
Number of days paid holiday - banded
Less than 20 days (or 28 if incl
bank hols)
20-24 days 25 days 26-30 days More than 30 days
Unweighted bases
All part-time employees 41 27 10 15 7 431
Gender Female 39 29 11 14 7 362
Male 49 19 5 21 6 69
Age 16-24 [59] [19] [4] [15] [3] 29
25-39 46 29 7 12 6 102
40-49 34 29 17 13 8 122
50-59 32 25 7 21 15 109
60+ 37 27 15 18 4 64
Ethnicity White 40 27 10 16 7 395
Non-white [55] [21] [6] [14] [5] 31
Parental status Parent 37 27 11 15 9 202
Non-parent 44 26 9 15 6 229
Highest qualification level
None [47] [23] [9] [16] [3] 44
185

Table C2.8 Annual leave entitlement (adjusted for bank holidays) of part-time employees
Number of days paid holiday - banded
Less than 20 days (or 28 if incl
bank hols)
20-24 days 25 days 26-30 days More than 30 days
Unweighted bases
GCSEs/O Level/CSEs 38 31 12 13 6 119
A Levels 46 28 7 17 2 75
Degree/Professional qualifications 55 11 8 20 6 58
Postgraduate degree [43] [15] [7] [12] [22] 45
Other vocational or academic qualifications, level not specified 32 36 9 14 10 50
Other [22] [39] [18] [12] [9] 33
Household income Under £15,000 55 27 5 12 2 68
£15,000 - £24,999 33 31 15 17 5 77
£25,000 - £34,999 44 20 12 17 7 51
£35,000 - £44,999 [48] [27] [8] [12] [6] 41
£45,000 or more 28 26 11 21 14 69
Carer status Yes 40 27 9 18 7 95
No 41 27 10 15 7 336
Disability status No 42 25 10 16 8 362
186

Table C2.8 Annual leave entitlement (adjusted for bank holidays) of part-time employees
Number of days paid holiday - banded
Less than 20 days (or 28 if incl
bank hols)
20-24 days 25 days 26-30 days More than 30 days
Unweighted bases
Yes 40 38 8 11 4 65
Religion or faith None 49 22 12 11 5 111
Christian 36 30 10 16 8 295
Other * * * * 19
Region South 41 30 5 15 9 194
North 49 23 15 12 2 99
Midlands 36 27 12 15 9 77
Wales * * * * * 22
Scotland [39] [12] [15] [26] [7] 39
Level of responsibility
Manager/supervisor 38 21 5 27 10 88
Not manager/supervisor 42 28 11 12 6 341
Time with current employer
Less than 5 years 47 32 5 12 4 173
5 to 9 years 40 13 19 23 4 101
10 years or more 32 27 11 16 15 157
187
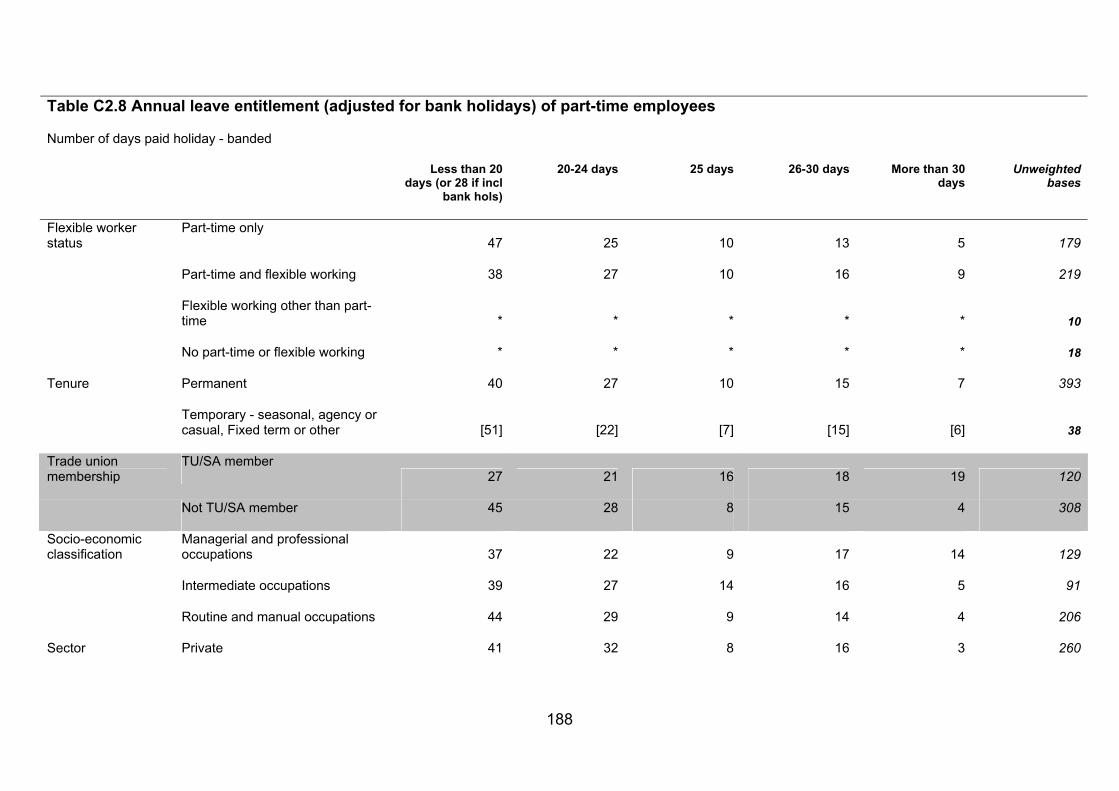
Table C2.8 Annual leave entitlement (adjusted for bank holidays) of part-time employees
Number of days paid holiday - banded
Less than 20 days (or 28 if incl
bank hols)
20-24 days 25 days 26-30 days More than 30 days
Unweighted bases
Flexible worker status
Part-time only 47 25 10 13 5 179
Part-time and flexible working 38 27 10 16 9 219
Flexible working other than part-time * * * * * 10
No part-time or flexible working * * * * * 18
Tenure Permanent 40 27 10 15 7 393
Temporary - seasonal, agency or casual, Fixed term or other [51] [22] [7] [15] [6] 38
Trade union TU/SA member membership 27 21 16 18 19 120
Not TU/SA member 45 28 8 15 4 308
Socio-economic classification
Managerial and professional occupations 37 22 9 17 14 129
Intermediate occupations 39 27 14 16 5 91
Routine and manual occupations 44 29 9 14 4 206
Sector Private 41 32 8 16 3 260
188
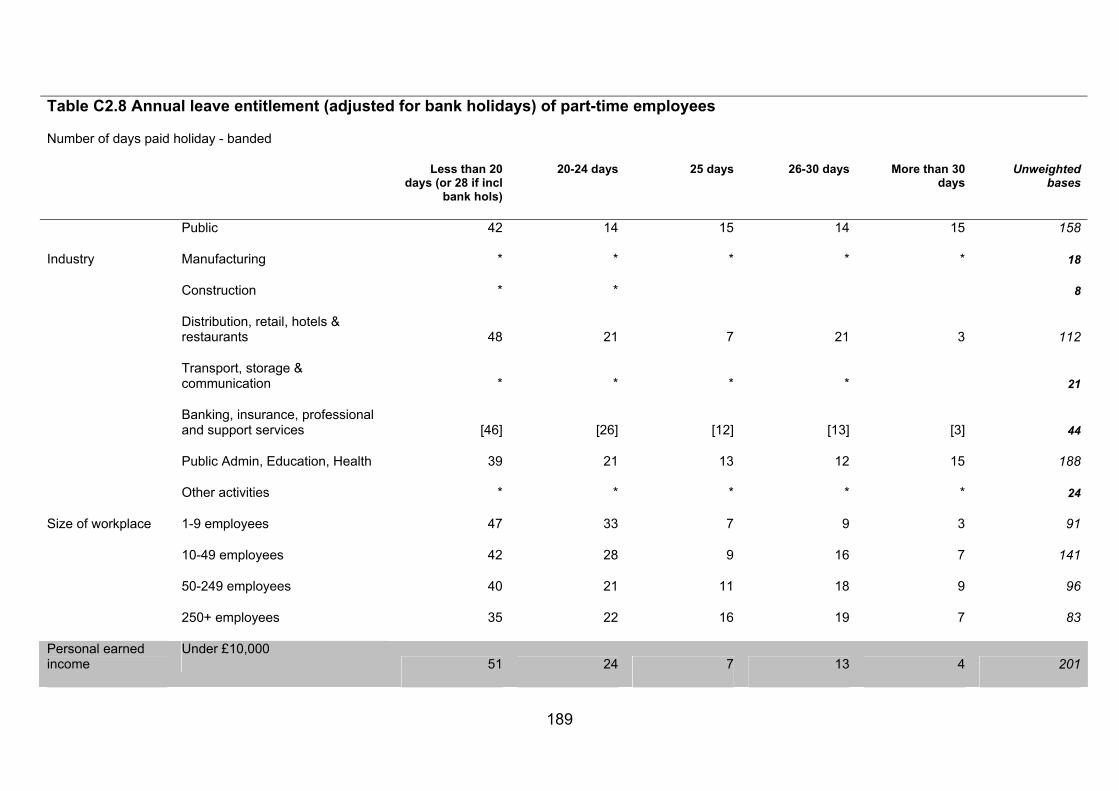
Table C2.8 Annual leave entitlement (adjusted for bank holidays) of part-time employees
Number of days paid holiday - banded
Less than 20 days (or 28 if incl
bank hols)
20-24 days 25 days 26-30 days More than 30 days
Unweighted bases
Public 42 14 15 14 15 158
Industry Manufacturing * * * * * 18
Construction * * 8
Distribution, retail, hotels & restaurants 48 21 7 21 3 112
Transport, storage & communication * * * * 21
Banking, insurance, professional and support services [46] [26] [12] [13] [3] 44
Public Admin, Education, Health 39 21 13 12 15 188
Other activities * * * * * 24
Size of workplace 1-9 employees 47 33 7 9 3 91
10-49 employees 42 28 9 16 7 141
50-249 employees 40 21 11 18 9 96
250+ employees 35 22 16 19 7 83
Personal earned Under £10,000 income 51 24 7 13 4 201
189

190
Table C2.8 Annual leave entitlement (adjusted for bank holidays) of part-time employees
Number of days paid holiday - banded
Less than 20 days (or 28 if incl
bank hols)
20-24 days 25 days 26-30 days More than 30 days
Unweighted bases
£10,000 - £14,999 33 38 12 14 4 71
£15,000 or more 30 20 15 22 14 73
Gender make-up of workplace
Mostly women 42 27 11 12 8 230
Mostly men 39 34 12 14 1 50
About half women and half men 40 23 8 21 8 150
Employment contract of terms and conditions
Yes
39 25 11 17 8 359
No 49 38 4 7 2 69
Base: All part-time employees (Core sample).
Some categories collapsed due to small cell sizes
Missing values: don’t know / refusal
Row per cent.

Table C2.9 Whether annual leave entitlement was taken
In your last holiday leave year did you take all the holiday that you were entitled to?
Yes No Unweighted bases
All employees 76 24 1817
Gender Female 80 20 1059
Male 73 27 758
Age 16-24 83 17 104
25-39 73 27 478
40-49 77 23 547
50-59 77 23 487
60+ 78 22 170
Ethnicity White 77 74 1646
Non-white 23 26 145
Parental status Parent 77 23 752
Non-parent 76 24 1065
Highest qualification level
None 83 17 147
GCSEs/O Level/CSEs 83 17 367
A Levels 73 27 286
Degree/Professional qualifications 73 27 345
Postgraduate degree 68 32 271
Other vocational or academic qualifications, level not specified
82 18 249
Other 81 19 114
Household income
Under £15,000 76 24 156
£15,000 - £24,999 78 22 255
£25,000 - £34,999 83 17 239
£35,000 - £44,999 80 20 210
£45,000 or more 69 31 500
191

Table C2.9 Whether annual leave entitlement was taken
In your last holiday leave year did you take all the holiday that you were entitled to?
Yes No Unweighted bases
Carer status Yes, child [66] [34] 33
Yes, relative in any household or non-relative adult in this household
82 18 306
Yes, non-relative adult in another household
[74] [26] 30
No 76 24 1448
Disability status No 76 24 1549
Yes 79 21 244
Religion or faith None 77 23 551
Christian 78 22 1140
Other 67 33 95
Region South 75 25 814
North 81 19 406
Midlands 76 24 307
Wales 75 25 104
Scotland 76 24 186
Full-time or part-time worker
Part-time 79 21 504
Full-time 75 25 1299
Level of responsibility
Manager/supervisor 72 28 683
Not manager/supervisor 79 21 1118
Time with current employer
Less than 6 months 69 31 67
6 to 11 months 66 34 49
1 year to 4 years 77 23 525
5 to 9 years 76 24 467
10 years or more 78 22 709
192

Table C2.9 Whether annual leave entitlement was taken
In your last holiday leave year did you take all the holiday that you were entitled to?
Yes No Unweighted bases
Flexible worker status
Part-time only 76 24 239
Part-time and flexible working 79 21 338
Flexible working other than part-time 69 31 444
No part-time or flexible working 78 22 589
Tenure Permanent 77 23 1718
Temporary - seasonal, agency or casual, Fixed term, Other
Trade union membership
TU/SA member 79 21 623
Not TU/SA member 75 25 1172
Socio-economic classification
Managerial and professional occupations
71 29 867
Intermediate occupations 79 21 264
Routine and manual occupations 81 19 653
Sector Private 78 22 1101
Public 75 25 674
Industry Manufacturing 83 17 179
Construction 72 28 55
Distribution, retail, hotels & restaurants
80 20 298
Transport, storage & communication 70 30 147
Banking, insurance, professional and support services
70 30 231
Public Admin, Education, Health 77 23 737
Other activities 78 22 106
Size of workplace Part of larger organisation: 1-9 71 29 142
Part of larger organisation: 10-49 80 20 351
Part of larger organisation: 50-249 78 22 369
193

194
Table C2.9 Whether annual leave entitlement was taken
In your last holiday leave year did you take all the holiday that you were entitled to?
Yes No Unweighted bases
Part of larger organisation: 250+ 68 32 383
Single site: 1-9 78 22 112
Single site: 10-49 81 19 204
Single site: 50-249 87 13 108
Single site: 250+ 78 22 74
Personal earned income
Under £10,000 79 21 300
£10,000 - £14,999 86 14 231
£15,000 - £24,999 82 18 410
£25,000 - £39,999 73 27 361
£40,000 or more 59 41 246
Gender make-up of workplace
Mostly women 80 20 693
Mostly men 75 25 485
About half women and half men 74 26 618
Employment contract of terms and conditions
Yes 76 24 1624
No 77 23 184
Base: All employees (core sample).
Missing values: don’t know / refusal
Row per cent.

Table C2.10 Reasons for not taking leave
Accumulating days or cash from leave/didn t want/not afford to take leave
Work reasons Health/maternity Other Unweighted bases
All employees 37 40 7 16 399
Gender Female 41 32 9 18 198
Male 34 45 5 15 201
Age 16-39 36 39 6 19 132
40-49 35 43 8 15 119
50+ 40 39 6 15 142
Ethnicity White 36 40 7 17 362
Non-white [47] [36] [2] [15] 31
Parental status Parent 32 43 9 16 162
Non-parent 40 38 6 17 237
Highest qualification level
None [30] [31] [16] [23] 25
GCSEs/O Level/CSEs 34 39 8 19 66
A Levels 42 32 11 15 68
Degree/Professional qualifications 35 43 3 18 83
195

Table C2.10 Reasons for not taking leave
Accumulating days or cash from leave/didn t want/not afford to take leave
Work reasons Health/maternity Other Unweighted bases
Postgraduate degree 38 51 3 8 79
Other vocational or academic qualifications, level not specified
[35] [41] [4] [20] 47
Other * * * * 21
Household income Under £25,000 41 35 12 13 80
£25,000 - £44,999 44 35 7 13 88
£45,000 or more 35 44 5 16 146
Carer status Yes, child * * * * 11
Yes, relative in any household or non-relative adult in this household
26 48 9 17 56
Yes, non-relative adult in another household
* * * 8
No 39 39 6 16 324
Disability status No 37 39 6 17 340
Yes 36 44 6 14 55
Religion or faith None 32 39 9 20 125
196
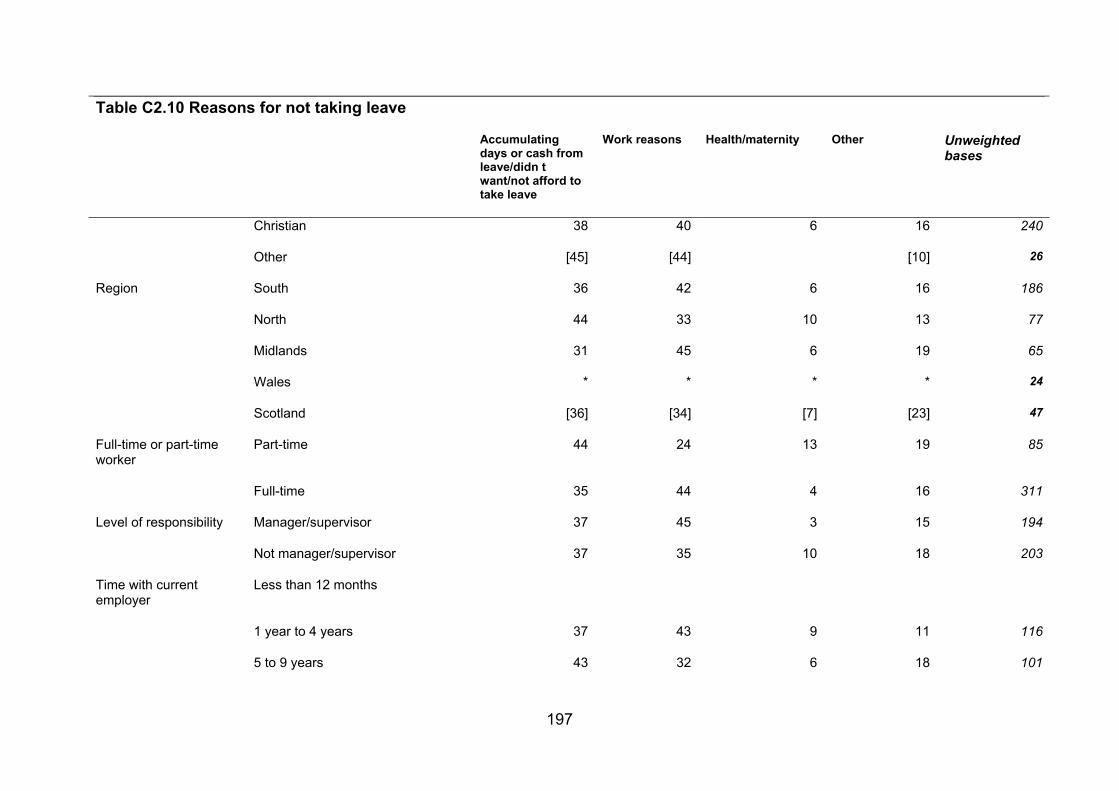
Table C2.10 Reasons for not taking leave
Accumulating days or cash from leave/didn t want/not afford to take leave
Work reasons Health/maternity Other Unweighted bases
Christian 38 40 6 16 240
Other [45] [44] [10] 26
Region South 36 42 6 16 186
North 44 33 10 13 77
Midlands 31 45 6 19 65
Wales * * * * 24
Scotland [36] [34] [7] [23] 47
Full-time or part-time worker
Part-time 44 24 13 19 85
Full-time 35 44 4 16 311
Level of responsibility Manager/supervisor 37 45 3 15 194
Not manager/supervisor 37 35 10 18 203
Time with current employer
Less than 12 months
1 year to 4 years 37 43 9 11 116
5 to 9 years 43 32 6 18 101
197

Table C2.10 Reasons for not taking leave
Accumulating days or cash from leave/didn t want/not afford to take leave
Work reasons Health/maternity Other Unweighted bases
10 years or more 35 46 6 13 154
Flexible worker status Part-time only [32] [41] [6] [21] 45
Part-time and flexible working 40 28 19 13 64
Flexible working other than part-time
43 45 3 9 125
No part-time or flexible working 35 41 2 22 126
Tenure Permanent 37 40 7 16 375
Temporary - seasonal, agency or casual, Fixed, Other
Trade union membership
TU/SA member 38 38 13 11 125
Not TU/SA member 37 40 4 18 271
Socio-economic classification
Managerial and professional occupations
39 44 4 13 244
Intermediate occupations 44 28 13 15 50
Routine and manual occupations 33 35 9 23 98
Sector Private 39 37 7 17 226
198

Table C2.10 Reasons for not taking leave
Accumulating days or cash from leave/didn t want/not afford to take leave
Work reasons Health/maternity Other Unweighted bases
Public 35 46 6 14 160
Industry Manufacturing [44] [34] [6] [16] 26
Construction * * * 14
Distribution, retail, hotels & restaurants
31 29 6 33 54
Transport, storage & communication
[36] [39] [12] [13] 38
Banking, insurance, professional and support services
43 36 6 15 64
Public Admin, Education, Health 35 47 7 11 164
Other activities [61] [16] [9] [14] 25
Size of workplace 1-9 employees 45 36 3 16 62
10-49 employees 38 33 8 20 105
50-249 employees 39 47 1 13 90
250+ employees 33 42 10 15 131
Personal earned income
Under £15,000 33 32 10 25 86
199
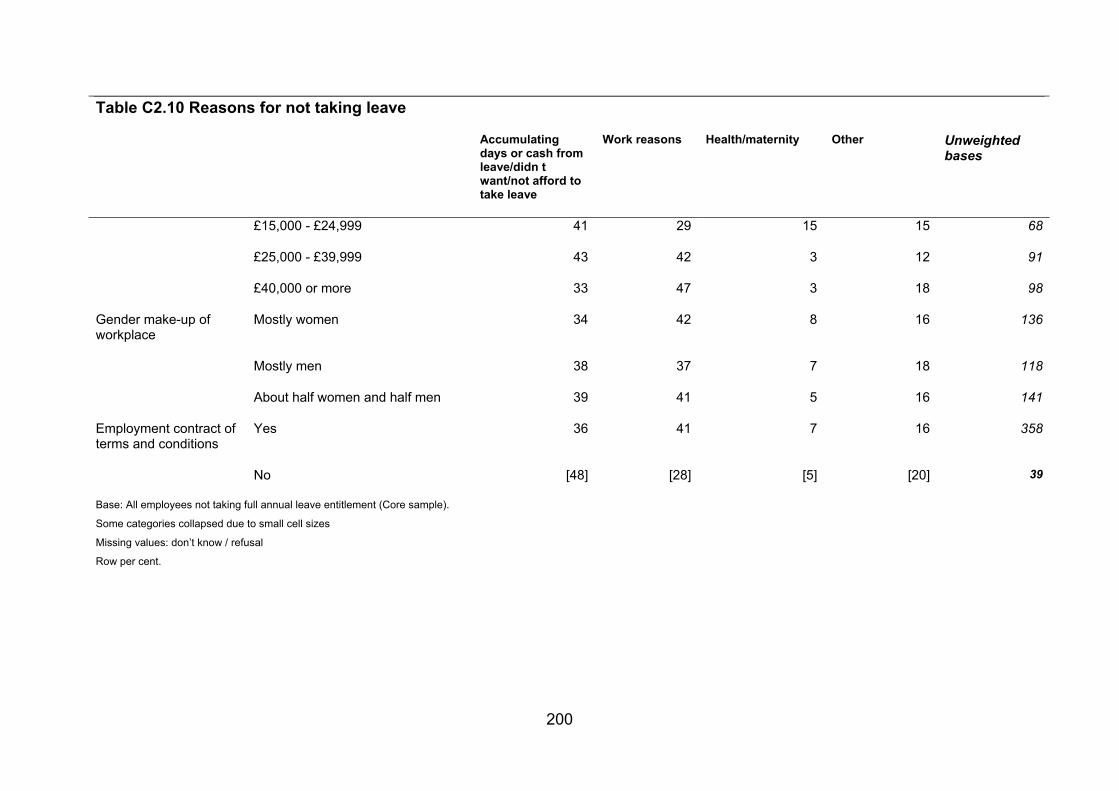
200
Table C2.10 Reasons for not taking leave
Accumulating days or cash from leave/didn t want/not afford to take leave
Work reasons Health/maternity Other Unweighted bases
£15,000 - £24,999 41 29 15 15 68
£25,000 - £39,999 43 42 3 12 91
£40,000 or more 33 47 3 18 98
Gender make-up of workplace
Mostly women 34 42 8 16 136
Mostly men 38 37 7 18 118
About half women and half men 39 41 5 16 141
Employment contract of terms and conditions
Yes 36 41 7 16 358
No [48] [28] [5] [20] 39
Base: All employees not taking full annual leave entitlement (Core sample).
Some categories collapsed due to small cell sizes
Missing values: don’t know / refusal
Row per cent.

Table C2.11 Whether compensated for annual leave entitlement not taken
Yes No Unweighted bases
All employees not taken full leave entitlement
70 30 407
Gender Female 69 71 204
Male 31 29 203
Age 16-39 71 29 136
40-49 71 29 121
50+ 66 34 144
Ethnicity White 70 30 368
Non-white [70] [30] 33
Parental status Parent 77 23 163
Non-parent 66 34 244
Highest qualification level
None [57] [43] 25
GCSEs/O Level/CSEs 75 25 67
A Levels 63 37 71
Degree/Professional qualifications 70 30 87
Postgraduate degree 73 27 77
Other vocational or academic qualifications, level not specified
[79] [21] 48
Other * * 22
Household income Under £25,000 70 30 82
£25,000 - £44,999 76 24 91
£45,000 or more 74 26 148
Carer status Yes, child * * 11
Yes, relative in any household or non-relative adult in this household
69 31 57
Yes, non-relative adult in another household
* * 8
No 69 31 331
201

Table C2.11 Whether compensated for annual leave entitlement not taken
Yes No Unweighted bases
Disability status No 72 28 347
Yes 57 43 347
Religion or faith None 68 32 125
Christian 71 29 247
Other 67 33 27
Region South 72 28 191
North 70 30 79
Midlands 70 30 66
Wales [67] [33] 25
Scotland [60] [40] 46
Full-time or part-time worker
Part-time 62 38 90
Full-time 73 27 314
Level of responsibility
Manager/supervisor 68 32 193
Not manager/supervisor 72 28 212
Time with current employer
Less than 12 months
1 year to 4 years 69 31 115
5 to 9 years 76 24 101
10 years or more 72 28 156
Flexible worker status
Part-time only [61] [39] 45
Part-time and flexible working 60 40 69
Flexible working other than part-time 78 22 125
No part-time or flexible working 68 32 127
Tenure Permanent 71 29 379
Temporary - seasonal, agency or casual, Fixed , Other
[56] [44] 27
202

Table C2.11 Whether compensated for annual leave entitlement not taken
Yes No Unweighted bases
Trade union membership
TU/SA member 75 25 127
Not TU/SA member 68 32 277
Socio-economic classification
Managerial and professional occupations
75 25 244
Intermediate occupations 64 36 52
Routine and manual occupations 64 36 104
Sector Private 69 31 229
Public 74 26 163
Industry Manufacturing [76] [24] 27
Construction * * 13
Distribution, retail, hotels & restaurants
54 46 55
Transport, storage & communication [78] [22] 41
Banking, insurance, professional and support services
77 23 63
Public Admin, Education, Health 70 30 169
Other activities [82] [18] 25
Size of workplace 1-9 employees 67 33 65
10-49 employees 66 34 107
50-249 employees 72 28 92
250+ employees 75 25 132
Personal earned income
Under £15,000 59 41 92
£15,000 - £24,999 75 25 68
£25,000 - £39,999 78 22 92
£40,000 or more 74 26 99
Gender make-up of workplace
Mostly women 67 33 140
Mostly men 72 28 119
203

Table C2.11 Whether compensated for annual leave entitlement not taken
Yes No Unweighted bases
About half women and half men 71 29 144
Employment contract of terms and conditions
Yes 72 28 361
No [58] [42] 44
Base: All employees not taking full annual leave entitlement (Core sample)
Some categories collapsed due to small cell sizes
Missing values: don’t know / refusal
Row per cent.
204

Table C3.1 Awareness of the right to request flexible working
Yes No Unweighted bases
All employees 75 25 1865
Gender Female 79 21 1091
Male 72 28 774
Age 16-24 58 42 111
25-39 77 23 488
40-49 79 21 553
50-59 78 22 503
60+ 81 19 178
Ethnicity White 76 24 1689
Non-white 72 28 149
Parental status Parent 79 21 771
Non-parent 73 27 1094
Highest qualification level None 67 33 152
GCSEs/O Level/CSEs 67 33 373
A Levels 80 20 293
Degree/Professional qualifications
81 19 358
Postgraduate degree 79 21 282
Other vocational or academic quals, level not specified
77 23 252
Other 67 33 119
Household income Under £15,000 74 26 159
£15,000 - £24,999 74 26 267
£25,000 - £34,999 75 25 245
£35,000 - £44,999 77 23 213
£45,000 or more 81 19 508
Carer status Yes, child [83] [17] 33
205

Table C3.1 Awareness of the right to request flexible working
Yes No Unweighted bases
Yes, relative in any household or non-relative adult in this household
78 22 315
Yes, non-relative adult in another household
[80] [20] 32
No 75 25 1485
Disability status No 75 25 1589
Yes 80 20 253
Religion or faith None 72 28 563
Christian 77 23 1173
Other 76 24 99
Region South 73 27 845
North 78 22 412
Midlands 83 17 311
Wales 71 29 107
Scotland 73 27 190
Full-time or part-time worker
Part-time 72 28 533
Full-time 76 24 1313
Work status and gender Male full-time 73 27 677
Female full-time 82 18 636
Male part-time 67 33 89
Female part-time 74 26 444
Level of responsibility Manager/supervisor 83 17 695
Not manager/supervisor 71 29 1154
Time with current employer
Less than 6 months 66 34 85
6 to 11 months 79 21 53
1 year to 4 years 70 30 532
206

Table C3.1 Awareness of the right to request flexible working
Yes No Unweighted bases
5 to 9 years 80 20 475
10 years or more 80 20 720
Flexible worker status Part-time only 69 31 250
Part-time and flexible working 79 21 358
Flexible working other than part-time
87 13 450
No part-time or flexible working 73 27 596
Tenure Permanent 76 24 1742
Temporary - seasonal, agency or casual, Fixed term, Other
72 28 119
Trade union membership TU/SA member 81 19 632
Not TU/SA member 73 27 1212
Socio-economic classification
Managerial and professional occupations
85 15 890
Intermediate occupations 76 24 273
Routine and manual occupations
64 36 669
Sector Private 72 28 1131
Public 83 17 692
Industry Manufacturing 68 32 183
Construction 69 31 58
Distribution, retail, hotels & restaurants
67 33 305
Transport, storage & communication
76 24 149
Banking, insurance, professional and support services
79 21 235
Public Admin, Education, Health
83 17 760
Other activities 69 31 112
207

Table C3.1 Awareness of the right to request flexible working
Yes No Unweighted bases
Size of workplace Part of larger organisation: 1-9 68 32 145
Part of larger organisation: 10-49
69 31 359
Part of larger organisation: 50-249
80 20 374
Part of larger organisation: 250+
81 19 387
Single site: 1-9 73 27 123
Single site: 10-49 69 31 210
Single site: 50-249 74 26 111
Single site: 250+ 89 11 77
Base: All employees (Core sample).
Missing values: don’t know / refusal
Row per cent
208

Table C3.2 Awareness of the right to request flexible working for parents
Yes No Unweighted bases
Employees aware of right to request 92 8 1429
Gender Female 94 6 849
Male 90 10 580
Age 16-24 91 9 65
25-39 95 5 382
40-49 93 7 440
50-59 90 10 379
60+ 87 13 141
Ethnicity White 93 7 1295
Non-white 91 9 112
Parental status Parent 94 6 609
Non-parent 91 9 820
Highest qualification level
None 84 16 98
GCSEs/O Level/CSEs 89 11 260
A Levels 91 9 233
Degree/Professional qualifications
95 5 301
Postgraduate degree 96 4 226
Other vocational or academic qualifications, level not specified
96 4 201
Other 88 12 82
Household income Under £15,000 85 15 115
£15,000 - £24,999 91 9 201
£25,000 - £34,999 93 7 186
£35,000 - £44,999 92 8 168
£45,000 or more 95 5 420
Carer status Yes, child [100] 27
209

Table C3.2 Awareness of the right to request flexible working for parents
Yes No Unweighted bases
Yes, relative in any household or non-relative adult in this household
94 6 249
Yes, non-relative adult in another household
[93] [7] 26
No 92 8 1127
Disability status No 93 7 1212
Yes 91 9 200
Religion or faith None 93 7 430
Christian 92 8 899
Other 89 11 76
Region South 93 7 636
North 93 7 319
Midlands 89 11 256
Wales 92 8 75
Scotland 93 7 143
Full-time or part-time worker
Part-time 90 10 400
Full-time 93 7 1013
Work status and gender
Male full-time 91 9 509
Female full-time 95 5 504
Male part-time 82 18 64
Female part-time 93 7 336
Level of responsibility Manager/supervisor 94 6 571
Not manager/supervisor 92 8 846
Time with current employer
Less than 12 months 87 13 99
1 year to 4 years 91 9 378
5 to 9 years 93 7 376
210

Table C3.2 Awareness of the right to request flexible working for parents
Yes No Unweighted bases
10 years or more 94 6 576
Flexible worker status Part-time only 90 10 186
Part-time and flexible working
92 8 285
Flexible working other than part-time
94 6 386
No part-time or flexible working
93 7 428
Tenure Permanent 93 7 1335
Temporary - seasonal, agency or casual, Fixed term, Other
88 12 93
Trade union membership
TU/SA member 96 4 516
Not TU/SA member 91 9 899
Socio-economic classification
Managerial and professional occupations
95 5 756
Intermediate occupations 92 8 213
Routine and manual occupations
89 11 435
Sector Private 91 9 823
Public 96 4 578
Industry Manufacturing 93 7 126
Construction [85] [15] 41
Distribution, retail, hotels & restaurants
91 9 207
Transport, storage & communication
99 1 116
Banking, insurance, professional and support services
91 9 191
Public Admin, Education, Health
95 5 613
211
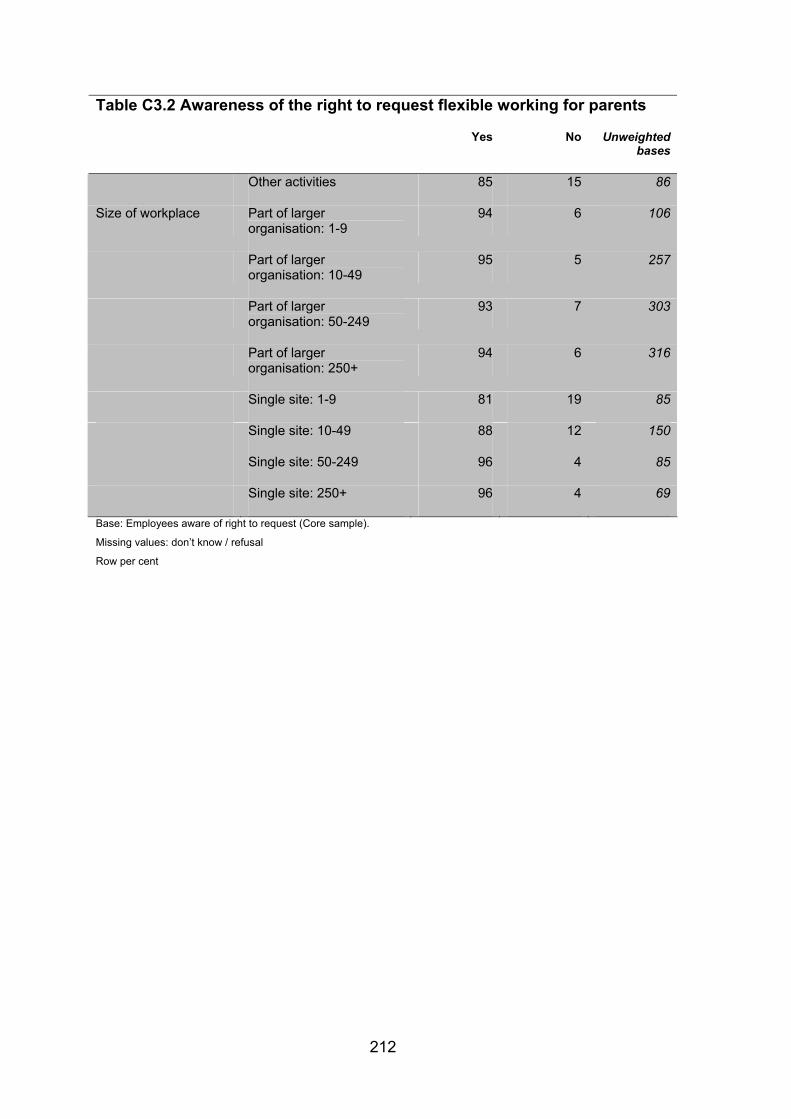
Table C3.2 Awareness of the right to request flexible working for parents
Yes No Unweighted bases
Other activities 85 15 86
Size of workplace Part of larger organisation: 1-9
94 6 106
Part of larger organisation: 10-49
95 5 257
Part of larger organisation: 50-249
93 7 303
Part of larger organisation: 250+
94 6 316
Single site: 1-9 81 19 85
Single site: 10-49 88 12 150
Single site: 50-249 96 4 85
Single site: 250+ 96 4 69
Base: Employees aware of right to request (Core sample).
Missing values: don’t know / refusal
Row per cent
212

Table C3.3 Awareness of the right to request flexible working for carers
Yes No Unweighted bases
Employees aware of right to request 74 26 1434
Gender Female 74 26 856
Male 74 26 578
Age 16-24 73 27 65
25-39 70 30 383
40-49 75 25 440
50-59 76 24 381
60+ 80 20 141
Ethnicity White 74 26 1299
Non-white 73 27 113
Parental status Parent 67 33 610
Non-parent 78 22 824
Highest qualification level None 71 29 99
GCSEs/O Level/CSEs 69 31 261
A Levels 65 35 233
Degree/Professional qualifications 78 22 299
Postgraduate degree 81 19 228
Other vocational or academic qualifications, level not specified
79 21 202
Other 73 27 84
Household income Under £15,000 78 22 113
£15,000 - £24,999 69 31 201
£25,000 - £34,999 70 30 187
£35,000 - £44,999 71 29 168
£45,000 or more 77 23 420
Carer status Yes, child [71] [29] 27
213
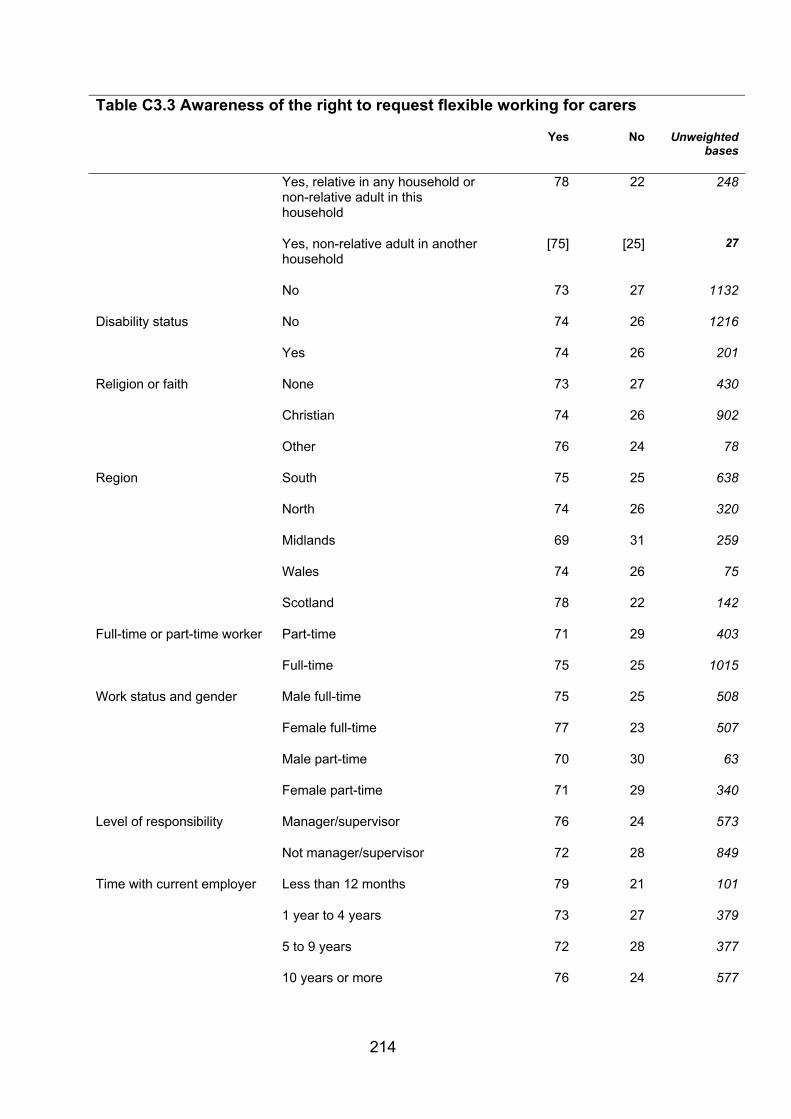
Table C3.3 Awareness of the right to request flexible working for carers
Yes No Unweighted bases
Yes, relative in any household or non-relative adult in this household
78 22 248
Yes, non-relative adult in another household
[75] [25] 27
No 73 27 1132
Disability status No 74 26 1216
Yes 74 26 201
Religion or faith None 73 27 430
Christian 74 26 902
Other 76 24 78
Region South 75 25 638
North 74 26 320
Midlands 69 31 259
Wales 74 26 75
Scotland 78 22 142
Full-time or part-time worker Part-time 71 29 403
Full-time 75 25 1015
Work status and gender Male full-time 75 25 508
Female full-time 77 23 507
Male part-time 70 30 63
Female part-time 71 29 340
Level of responsibility Manager/supervisor 76 24 573
Not manager/supervisor 72 28 849
Time with current employer Less than 12 months 79 21 101
1 year to 4 years 73 27 379
5 to 9 years 72 28 377
10 years or more 76 24 577
214

Table C3.3 Awareness of the right to request flexible working for carers
Yes No Unweighted bases
Flexible worker status Part-time only 69 31 187
Part-time and flexible working 74 26 287
Flexible working other than part-time
78 22 386
No part-time or flexible working 73 27 429
Tenure Permanent 74 26 1340
Temporary - seasonal, agency or casual, Fixed term, Other
75 25 93
Trade union membership TU/SA member 77 23 519
Not TU/SA member 73 27 901
Socio-economic classification
Managerial and professional occupations
78 22 756
Intermediate occupations 76 24 215
Routine and manual occupations 66 34 438
Sector Private 71 29 825
Public 79 21 581
Industry Manufacturing 69 31 127
Construction [64] [36] 41
Distribution, retail, hotels & restaurants
70 30 209
Transport, storage & communication
77 23 115
Banking, insurance, professional and support services
76 24 191
Public Admin, Education, Health 77 23 615
Other activities 73 27 86
Size of workplace Part of larger organisation: 1-9 71 29 105
Part of larger organisation: 10-49 77 23 256
Part of larger organisation: 50-249 75 25 305
Part of larger organisation: 250+ 79 21 318
215

Table C3.3 Awareness of the right to request flexible working for carers
Yes No Unweighted bases
Single site: 1-9 69 31 86
Single site: 10-49 63 37 150
Single site: 50-249 70 30 85
Single site: 250+ 83 17 69
Base: Employees aware of right to request (Core sample).
Missing values: don’t know / refusal
Row per cent
216

Table C3.4 Parents’ awareness of the right to request flexible working
Yes No Unweighted bases
Parent employees 79 21 1363
Gender and parent status Male with dependent children 73 27 551
Female with dependent children
84 16 812
Family status Lone parent 74 26 242
Couple parent 80 20 1109
Gender and partnership status
Coupled mother 87 13 597
Lone mother 74 26 209
Coupled father 73 27 512
Lone father [73] [27] 33
Family employment status
Lone parent earner with children
74 26 242
Single earner couple with children
78 22 271
Dual earner couple with children
80 20 835
Age of youngest child Dependent children under 6 82 18 580
Dependent children of 6 and over
76 24 780
Base: Parent employees (Core and Boost sample).
Missing values: don’t know / refusal
Row per cent
217

Table C3.5 Parents’ awareness of the right to request flexible working for parents
Yes No Unweighted bases
Parent employees 94 6 1075
Gender and parent status Male with dependent children 93 7 404
Female with dependent children
95 5 671
Family status Lone parent 92 8 177
Couple parent 94 6 891
Gender and partnership status
Coupled mother 96 4 513
Lone mother 91 9 154
Coupled father 93 7 378
Lone father * * 23
Family employment status Lone parent earner with children
92 8 177
Single earner couple with children
93 7 210
Dual earner couple with children
95 5 679
Age of youngest child Dependent children under 6 95 5 477
Dependent children of 6 and over
93 7 596
Base: Parent employees aware of the right to request (Core and Boost sample).
Missing values: don’t know / refusal
Row per cent
218

Table C3.6 Carers’ awareness of the right to request flexible working
Yes No Unweighted bases
Carer employees 73 27 825
Carer status Yes, child 76 24 85
Yes, relative in any household or non-relative adult in this household 72 28 671
Yes, non-relative adult in another household 80 20 69
Gender Female 73 27 538
Male 74 26 287
Age 16-24 [38] [62] 26
25-39 71 29 118
40-49 83 17 260
50-59 75 25 308
60+ 81 19 99
Base: Carer employees (Core and Boost sample).
Missing values: don’t know / refusal
Row per cent
219

Table C3.7 Carers’ awareness of the right to request flexible working for carers
Yes No Unweighted bases
Carer employees 77 23 615
Carer status Yes, child 67 33 66
Yes, relative in any household or non-relative adult in this household 79 21 494
Yes, non-relative adult in another household 77 23 55
Gender Female 74 26 398
Male 81 19 217
Age 16-39 72 28 93
40-49 74 26 205
50-59 81 19 231
60+ 92 8 77
Base: Carer employees aware of the right to request (Core and Boost sample).
Some categories collapsed due to small cell sizes
Missing values: don’t know / refusal
Row per cent
220

Table C3.8 Perceived flexible working practices available in the workplace – Part-time work Yes No Don't know Unweighted
bases
All employees 80 17 3 1874
Gender Female 91 8 1 1097
Male 69 26 5 777
Age 16-24 87 9 4 111
25-39 79 17 4 491
40-49 81 17 2 555
50-59 76 22 2 504
60+ 79 16 5 179
Ethnicity White 80 17 3 1695
Non-white 83 15 2 150
Parental status Parent 81 17 2 771
Non-parent 79 17 4 1103
Highest qualification level
None 66 31 3 153
GCSEs/O Level/CSEs 79 17 4 373
A Levels 84 13 3 293
Degree/Professional qualifications
82 14 4 359
Postgraduate degree 85 15 1 283
Other vocational or academic qualifications, level not specified
79 19 2 254
Other 72 25 4 119
Household income
Under £15,000 85 13 1 160
£15,000 - £24,999 82 15 4 269
£25,000 - £34,999 75 22 3 246
221

Table C3.8 Perceived flexible working practices available in the workplace – Part-time work Yes No Don't know Unweighted
bases
£35,000 - £44,999 74 25 1 213
£45,000 or more 82 15 3 508
Carer status Yes, child [97] [3] 33
Yes, relative in any household or non-relative adult in this household
84 14 2 316
Yes, non-relative adult in another household
[88] [12] 33
No 78 18 3 1492
Disability status No 79 17 3 1630
Yes 85 13 2 217
Religion or faith None 80 15 5 566
Christian 80 18 2 1176
Other 82 16 2 99
Region South 80 16 3 850
North 79 17 4 414
Midlands 82 15 2 313
Wales 73 22 5 107
Scotland 77 22 1 190
Level of responsibility
Manager/supervisor 81 17 2 696
Not manager/supervisor 79 17 4 1160
Time with current employer
Less than 6 months 77 11 12 85
6 to 11 months 76 23 1 54
1 year to 4 years 80 17 3 538
5 to 9 years 82 14 4 476
10 years or more 78 20 2 721
Flexible worker Part-time only 100 251
222

Table C3.8 Perceived flexible working practices available in the workplace – Part-time work Yes No Don't know Unweighted
bases
status
Part-time and flexible working
100 364
Flexible working other than part-time
100 451
No part-time or flexible working
77 21 2 597
Tenure Permanent 79 17 3 1750
Temporary - seasonal, agency or casual, Fixed term, Other
84 13 8 120
Trade union membership
TU/SA member 82 17 1 634
Not TU/SA member 79 17 4 1216
Are your pay and conditions of employment directly affected by agreements between your employer and any trade union(s) or staff association?
Yes 82 16 1 581
No 78 18 4 859
Socio-economic classification
Managerial and professional occupations
83 14 3 891
Intermediate occupations 86 12 2 274
Routine and manual occupations
75 21 3 674
Sector Private 76 20 4 1135
Public 91 9 1 695
Industry Manufacturing 55 38 7 183
Construction 53 38 9 58
Distribution, retail, hotels & restaurants
88 11 1 307
223

Table C3.8 Perceived flexible working practices available in the workplace – Part-time work Yes No Don't know Unweighted
bases
Transport, storage & communication
72 19 9 149
Banking, insurance, professional and support services
85 13 2 236
Public Admin, Education, Health
89 11 1 763
Other activities 78 15 6 112
Size of workplace Part of larger organisation: 1-9
75 22 3 146
Part of larger organisation: 10-49
80 17 3 359
Part of larger organisation: 50-249
79 18 3 374
Part of larger organisation: 250+
83 14 3 388
Single site: 1-9 78 21 1 124
Single site: 10-49 76 19 5 212
Single site: 50-249 86 12 2 111
Single site: 250+ 94 2 4 78
Gender make-up of workplace
Mostly women 91 8 1 727
Mostly men 57 36 7 494
About half women and half men
88 10 2 630
Base: All employees (Core sample).
Missing values: don’t know / refusal
Row per cent.
224

Table C3.9 Perceived flexible working practices available in the workplace - Work reduced hours for a limited period
Yes No Don't know Unweighted bases
All employees 56 29 15 1874
Gender Female 59 26 15 1097
Male 53 32 15 1097
Age 16-24 52 31 18 111
25-39 51 29 19 491
40-49 63 27 11 555
50-59 59 30 11 504
60+ 53 31 17 179
Ethnicity White 57 28 14 1695
Non-white 45 32 22 150
Parental status Parent 55 31 15 771
Non-parent 57 28 15 1103
Highest qualification level
None 46 39 15 153
GCSEs/O Level/CSEs 51 33 16 373
A Levels 57 30 12 293
Degree/Professional qualifications
59 21 20 359
Postgraduate degree 61 25 14 283
Other vocational or academic qualifications, level not specified
58 30 12 254
Other 56 32 13 119
Household income
Under £15,000 48 36 16 160
£15,000 - £24,999 60 27 13 269
£25,000 - £34,999 49 36 15 246
225

Table C3.9 Perceived flexible working practices available in the workplace - Work reduced hours for a limited period
Yes No Don't know Unweighted bases
£35,000 - £44,999 55 32 12 213
£45,000 or more 67 21 12 508
Carer status Yes, child [56] [32] [12] 33
Yes, relative in any household or non-relative adult in this household
61 27 12 316
Yes, non-relative adult in another household
[65] [24] [11] 33
No 55 30 16 1492
Disability status No 57 28 15 1595
Yes 52 34 14 253
Religion or faith None 57 26 17 566
Christian 57 31 13 1176
Other 45 32 22 99
Region South 55 29 16 850
North 56 31 13 414
Midlands 58 26 16 313
Wales 55 32 14 107
Scotland 59 29 11 190
Full-time or part-time worker
Part-time 53 27 20 537
Full-time 57 30 13 1318
Level of responsibility
Manager/supervisor 64 27 10 696
Not manager/supervisor 52 30 18 1160
Time with current employer
Less than 6 months 42 31 27 85
6 to 11 months 59 27 14 54
1 year to 4 years 51 31 18 538
226

Table C3.9 Perceived flexible working practices available in the workplace - Work reduced hours for a limited period
Yes No Don't know Unweighted bases
5 to 9 years 58 28 14 476
10 years or more 62 28 10 721
Flexible worker status
Part-time only 40 36 24 251
Part-time and flexible working
65 20 15 364
Flexible working other than part-time
75 14 11 451
No part-time or flexible working
45 43 12 597
Tenure Permanent 57 29 14 1750
Temporary - seasonal, agency or casual, Fixed term, Other
44 30 26 120
Trade union membership
TU/SA member 62 26 12 634
Not TU/SA member 54 30 16 1216
Are your pay and conditions of employment directly affected by agreements between your employer and any trade union(s) or staff association?
Yes 66 24 11 581
No 55 31 14 859
Socio-economic classification
Managerial and professional occupations
65 23 12 891
Intermediate occupations 53 26 22 274
Routine and manual occupations
48 36 16 674
Sector Private 54 30 15 1135
Public 62 25 14 695
Industry Manufacturing 50 35 15 183
227

Table C3.9 Perceived flexible working practices available in the workplace - Work reduced hours for a limited period
Yes No Don't know Unweighted bases
Construction 42 39 19 58
Distribution, retail, hotels & restaurants
51 33 16 307
Transport, storage & communication
66 23 11 149
Banking, insurance, professional and support services
63 25 12 236
Public Admin, Education, Health
60 26 14 763
Other activities 53 25 23 112
Size of workplace Part of larger organisation: 1-9
49 34 17 146
Part of larger organisation: 10-49
50 36 13 359
Part of larger organisation: 50-249
61 24 15 374
Part of larger organisation: 250+
65 22 13 388
Single site: 1-9 55 32 13 124
Single site: 10-49 52 30 18 212
Single site: 50-249 53 28 19 111
Single site: 250+ 60 25 16 78
Gender make-up of workplace
Mostly women 59 25 16 727
Mostly men 51 37 12 494
About half women and half men
58 26 16 630
Base: All employees (Core sample).
Missing values: don’t know / refusal
Row per cent.
228

Table C3.10 Perceived flexible working practices available in the workplace - Work flexitime
Yes No Don't know Unweighted bases
All employees 48 47 5 1874
Gender Female 46 48 6 1097
Male 49 46 5 1097
Age 16-24 49 44 7 111
25-39 51 44 5 491
40-49 48 48 3 555
50-59 43 53 4 504
60+ 46 45 9 179
Ethnicity White 46 49 5 1695
Non-white 60 35 5 150
Parental status Parent 47 49 4 771
Non-parent 48 46 6 1103
Highest qualification level
None 38 56 7 153
GCSEs/O Level/CSEs 45 50 5 373
A Levels 44 52 4 293
Degree/Professional qualifications
55 37 7 359
Postgraduate degree 55 40 5 283
Other vocational or academic qualifications, level not specified
46 49 5 254
Other 42 56 2 119
Household income
Under £15,000 48 46 6 160
£15,000 - £24,999 48 46 6 269
£25,000 - £34,999 45 51 4 246
229

Table C3.10 Perceived flexible working practices available in the workplace - Work flexitime
Yes No Don't know Unweighted bases
£35,000 - £44,999 42 54 4 213
£45,000 or more 55 43 2 508
Carer status Yes, child [50] [46] [4] 33
Yes, relative in any household or non-relative adult in this household
51 47 3 316
Yes, non-relative adult in another household
[53] [47] 33
No 47 47 6 1492
Disability status No 49 46 5 1595
Yes 43 51 5 253
Religion or faith None 48 46 6 566
Christian 46 49 5 1176
Other 57 39 4 99
Region South 51 44 5 850
North 46 50 4 414
Midlands 51 43 6 313
Wales 42 52 5 107
Scotland 36 58 6 190
Full-time or part-time worker
Part-time 47 45 7 537
Full-time 48 48 4 1318
Level of responsibility
Manager/supervisor 52 45 3 696
Not manager/supervisor 46 48 6 1160
Time with current employer
Less than 6 months 51 39 10 85
6 to 11 months 49 47 4 54
1 year to 4 years 47 46 7 538
230

Table C3.10 Perceived flexible working practices available in the workplace - Work flexitime
Yes No Don't know Unweighted bases
5 to 9 years 51 46 3 476
10 years or more 45 51 4 721
Flexible worker status
Part-time only 30 61 10 251
Part-time and flexible working
64 32 4 364
Flexible working other than part-time
71 27 2 451
No part-time or flexible working
30 64 6 597
Tenure Permanent 48 47 5 1750
Temporary - seasonal, agency or casual, Fixed term, Other
51 41 8 120
Trade union membership
TU/SA member 43 52 4 634
Not TU/SA member 50 45 5 1216
Are your pay and conditions of employment directly affected by agreements between your employer and any trade union(s) or staff association?
Yes 53 44 3 581
No 46 49 4 859
Socio-economic classification
Managerial and professional occupations
56 40 3 891
Intermediate occupations 42 53 5 274
Routine and manual occupations
40 53 7 674
Sector Private 46 48 5 1135
Public 53 44 4 695
231

Table C3.10 Perceived flexible working practices available in the workplace - Work flexitime
Yes No Don't know Unweighted bases
Industry Manufacturing 36 57 6 183
Construction 42 49 9 58
Distribution, retail, hotels & restaurants
44 49 7 307
Transport, storage & communication
54 41 5 149
Banking, insurance, professional and support services
58 38 4 236
Public Admin, Education, Health
46 50 4 763
Other activities 54 41 5 112
Size of workplace
Part of larger organisation: 1-9
47 48 5 146
Part of larger organisation: 10-49
45 52 3 359
Part of larger organisation: 50-249
44 50 6 374
Part of larger organisation: 250+
54 42 4 388
Single site: 1-9 56 37 7 124
Single site: 10-49 46 48 5 212
Single site: 50-249 36 58 5 111
Single site: 250+ 60 29 11 78
Gender make-up of workplace
Mostly women 43 54 4 727
Mostly men 44 51 4 494
About half women and half men
55 38 7 630
Base: All employees (Core sample).
Missing values: don’t know / refusal
Row per cent.
232

Table C3.11 Perceived flexible working practices available in the workplace - Job-share
Yes No Don't know Unweighted bases
43 44 12 All employees 1874
Gender Female 53 35 11 1097
Male 34 53 13 777
Age 16-24 32 50 18 111
25-39 43 44 13 491
40-49 48 42 10 555
50-59 47 44 9 504
60+ 40 48 12 179
Ethnicity White 43 45 12 1695
Non-white 42 43 15 1695
Parental status Parent 44 44 12 771
Non-parent 43 45 13 1103
Highest qualification level
None 34 56 11 153
GCSEs/O Level/CSEs 40 49 11 373
A Levels 39 47 14 293
Degree/Professional qualifications
51 36 13 359
Postgraduate degree 52 35 13 283
Other vocational or academic qualifications, level not specified
45 44 11 254
Other 27 62 11 119
Household income
Under £15,000 41 45 15 160
£15,000 - £24,999 43 45 12 269
£25,000 - £34,999 43 50 7 246
£35,000 - £44,999 44 47 9 213
233

Table C3.11 Perceived flexible working practices available in the workplace - Job-share
Yes No Don't know Unweighted bases
£45,000 or more 48 41 11 508
Carer status Yes, child [51] [40] [9] 33
Yes, relative in any household or non-relative adult in this household
46 47 7 316
Yes, non-relative adult in another household
[36] [52] [12] 33
No 43 44 13 1492
Disability status No 44 44 12 1595
Yes 41 46 12 253
Religion or faith None 39 49 12 566
Christian 46 43 11 1176
Other 38 44 18 99
Region South 41 45 14 850
North 42 45 14 414
Midlands 50 37 13 313
Wales 48 46 6 107
Scotland 43 51 5 190
Full-time or part-time worker
Part-time 48 38 14 537
Full-time 42 46 12 1318
Level of responsibility
Manager/supervisor 49 43 8 696
Not manager/supervisor 40 45 15 1160
Time with current employer
Less than 6 months 41 37 22 85
6 to 11 months 29 61 10 54
1 year to 4 years 37 49 14 538
5 to 9 years 45 43 13 476
234

Table C3.11 Perceived flexible working practices available in the workplace - Job-share
Yes No Don't know Unweighted bases
10 years or more 50 41 9 721
Flexible worker status
Part-time only 31 50 19 251
Part-time and flexible working
56 35 8 364
Flexible working other than part-time
62 26 12 451
No part-time or flexible working
36 52 11 597
Tenure Permanent 43 45 12 1750
Temporary - seasonal, agency or casual, Fixed term, Other
43 40 17 120
Trade union membership
TU/SA member 57 35 8 634
Not TU/SA member 38 48 14 1216
Are your pay and conditions of employment directly affected by agreements between your employer and any trade union(s) or staff association?
Yes 61 32 7 581
No 37 51 12 859
Socio-economic classification
Managerial and professional occupations
52 38 10 891
Intermediate occupations 43 39 17 274
Routine and manual occupations
34 54 13 674
Sector Private 34 52 14 1135
Public 66 27 7 695
Industry Manufacturing 20 65 16 183
Construction 31 58 10 58
235

Table C3.11 Perceived flexible working practices available in the workplace - Job-share
Yes No Don't know Unweighted bases
Distribution, retail, hotels & restaurants
34 51 14 307
Transport, storage & communication
40 43 17 149
Banking, insurance, professional and support services
45 43 12 236
Public Admin, Education, Health
61 31 8 763
Other activities 35 49 16 112
Size of workplace Part of larger organisation: 1-9
29 60 11 146
Part of larger organisation: 10-49
46 45 9 146
Part of larger organisation: 50-249
44 42 14 146
Part of larger organisation: 250+
50 35 15 146
Single site: 1-9 42 49 10 146
Single site: 10-49 36 53 11 146
Single site: 50-249 40 45 14 146
Single site: 250+ 55 28 18 146
Gender make-up of workplace
Mostly women 53 37 9 727
Mostly men 27 61 12 494
About half women and half men
48 37 15 630
Base: All employees (Core sample).
Missing values: don’t know / refusal
Row per cent.
236

Table C3.12 Perceived flexible working practices available in the workplace – Compressed working week
Yes No Don't know Unweighted bases
All employees 39 51 10 1874
Gender Female 42 49 9 1097
Male 36 54 10 777
Age 16-24 39 47 14 111
25-39 40 50 10 491
40-49 41 51 8 555
50-59 38 56 6 504
60+ 35 55 10 179
Ethnicity White 39 52 9 1695
Non-white 40 45 15 150
Parental status Parent 39 51 10 771
Non-parent 39 51 10 1103
Highest qualification level
None 31 60 9 153
GCSEs/O Level/CSEs 37 56 7 373
A Levels 39 54 8 293
Degree/Professional qualifications
45 42 14 359
Postgraduate degree 40 53 7 283
Other vocational or academic qualifications, level not specified
43 45 12 254
Other 31 58 11 119
Household income Under £15,000 43 52 5 160
£15,000 - £24,999 40 52 8 269
£25,000 - £34,999 38 58 4 246
£35,000 - £44,999 40 51 9 213
237

Table C3.12 Perceived flexible working practices available in the workplace – Compressed working week
Yes No Don't know Unweighted bases
£45,000 or more 40 51 9 508
Carer status Yes, child [44] [48] [9] 33
Yes, relative in any household or non-relative adult in this household
44 46 9 316
Yes, non-relative adult in another household
[43] [42] [15] 33
No 38 52 10 1492
Disability status No 40 51 10 1595
Yes 37 54 8 253
Religion or faith None 39 50 11 566
Christian 40 52 8 1176
Other 30 54 16 99
Region South 36 52 11 850
North 42 49 9 414
Midlands 40 51 9 313
Wales 46 51 3 107
Scotland 41 52 7 190
Full-time or part-time worker
Part-time 45 46 8 537
Full-time 37 53 10 1318
Level of responsibility
Manager/supervisor 44 48 9 696
Not manager/supervisor 37 53 10 1160
Time with current employer
Less than 6 months 40 51 10 85
6 to 11 months 40 50 10 54
1 year to 4 years 36 53 11 538
5 to 9 years 39 47 13 476
238

Table C3.12 Perceived flexible working practices available in the workplace – Compressed working week
Yes No Don't know Unweighted bases
10 years or more 42 52 6 721
Flexible worker status
Part-time only 37 51 12 251
Part-time and flexible working
53 40 8 364
Flexible working other than part-time
55 35 10 451
No part-time or flexible working
25 65 10 597
Tenure Permanent 38 52 10 1750
Temporary - seasonal, agency or casual, Fixed term, Other
54 43 3 120
Trade union membership
TU/SA member 40 54 6 634
Not TU/SA member 39 50 11 1216
Are your pay and conditions of employment directly affected by agreements between your employer and any trade union(s) or staff association? Yes
44 48 7 581
No 38 54 8 859
Socio-economic classification
Managerial and professional occupations
44 48 8 891
Intermediate occupations 42 47 11 274
Routine and manual occupations
33 56 11 674
Sector Private 37 53 11 1135
Public 45 47 8 695
Industry Manufacturing 27 64 9 183
Construction 26 61 13 58
239

Table C3.12 Perceived flexible working practices available in the workplace – Compressed working week
Yes No Don't know Unweighted bases
Distribution, retail, hotels & restaurants
40 49 11 307
Transport, storage & communication
37 52 11 149
Banking, insurance, professional and support services
46 43 11 236
Public Admin, Education, Health
41 52 7 763
Other activities 42 45 13 112
Size of workplace Part of larger organisation: 1-9
33 54 13 146
Part of larger organisation: 10-49
34 58 7 359
Part of larger organisation: 50-249
38 53 9 374
Part of larger organisation: 250+
46 41 13 388
Single site: 1-9 50 44 6 124
Single site: 10-49 35 55 10 212
Single site: 50-249 34 58 8 111
Single site: 250+ 48 41 10 78
Gender make-up of workplace
Mostly women 40 51 8 727
Mostly men 31 59 9 494
About half women and half men
44 44 11 630
Base: All employees (Core sample).
Missing values: don’t know / refusal
Row per cent.
240
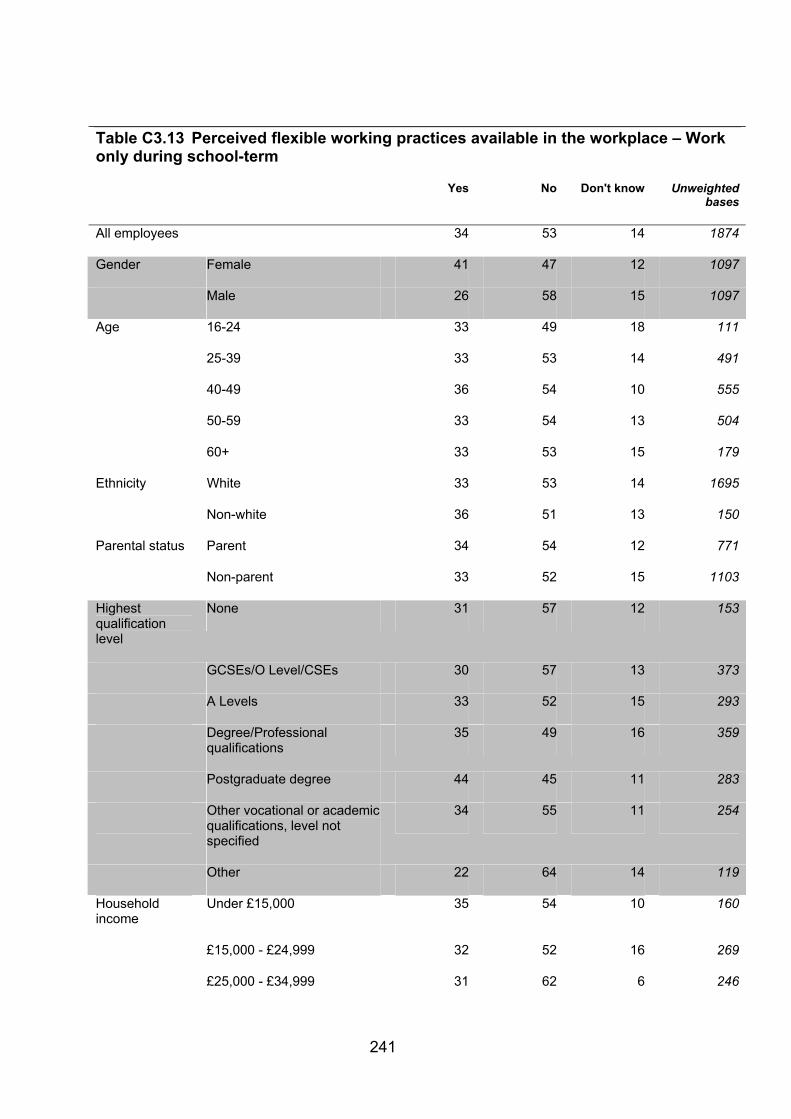
Table C3.13 Perceived flexible working practices available in the workplace – Work only during school-term
Yes No Don't know Unweighted bases
All employees 34 53 14 1874
Gender Female 41 47 12 1097
Male 26 58 15 1097
Age 16-24 33 49 18 111
25-39 33 53 14 491
40-49 36 54 10 555
50-59 33 54 13 504
60+ 33 53 15 179
Ethnicity White 33 53 14 1695
Non-white 36 51 13 150
Parental status Parent 34 54 12 771
Non-parent 33 52 15 1103
Highest qualification level
None 31 57 12 153
GCSEs/O Level/CSEs 30 57 13 373
A Levels 33 52 15 293
Degree/Professional qualifications
35 49 16 359
Postgraduate degree 44 45 11 283
Other vocational or academic qualifications, level not specified
34 55 11 254
Other 22 64 14 119
Household income
Under £15,000 35 54 10 160
£15,000 - £24,999 32 52 16 269
£25,000 - £34,999 31 62 6 246
241

Table C3.13 Perceived flexible working practices available in the workplace – Work only during school-term
Yes No Don't know Unweighted bases
£35,000 - £44,999 29 62 9 213
£45,000 or more 35 49 15 508
Carer status Yes, child [63] [31] [7] 33
Yes, relative in any household or non-relative adult in this household
35 55 11 316
Yes, non-relative adult in another household
[39] [46] [15] 33
No 33 53 14 1492
Disability status No 34 53 13 1595
Yes 35 49 16 253
Religion or faith None 31 52 16 566
Christian 34 54 12 1176
Other 39 46 15 99
Region South 35 50 15 850
North 33 54 13 414
Midlands 37 50 13 313
Wales 25 61 14 107
Scotland 28 63 9 190
Full-time or part-time worker
Part-time 41 47 12 537
Full-time 31 55 14 1318
Level of responsibility
Manager/supervisor 37 52 11 696
Not manager/supervisor 32 53 15 1160
Time with current employer
Less than 6 months 21 51 28 85
6 to 11 months 29 55 15 54
1 year to 4 years 34 52 14 538
242

Table C3.13 Perceived flexible working practices available in the workplace – Work only during school-term
Yes No Don't know Unweighted bases
5 to 9 years 34 51 15 476
10 years or more 36 55 10 721
Flexible worker status
Part-time only 26 54 20 251
Part-time and flexible working
54 35 11 364
Flexible working other than part-time
43 42 15 451
No part-time or flexible working
25 64 12 597
Tenure Permanent 33 53 14 1750
Temporary - seasonal, agency or casual, Fixed term, Other
39 47 14 120
Trade union membership
TU/SA member 44 48 9 634
Not TU/SA member 30 55 16 1216
Are your pay and conditions of employment directly affected by agreements between your employer and any trade union(s) or staff association?
Yes 43 48 9 581
No 29 56 15 859
Socio-economic classification
Managerial and professional occupations
37 49 14 891
Intermediate occupations 31 55 14 274
Routine and manual occupations
31 56 13 674
Sector Private 25 59 16 1135
Public 55 38 7 695
243

Table C3.13 Perceived flexible working practices available in the workplace – Work only during school-term
Yes No Don't know Unweighted bases
Industry Manufacturing 13 68 19 183
Construction 23 67 10 58
Distribution, retail, hotels & restaurants
34 53 13 307
Transport, storage & communication
20 58 22 149
Banking, insurance, professional and support services
28 56 16 236
Public Admin, Education, Health
52 40 8 763
Other activities 26 57 17 112
Size of workplace
Part of larger organisation: 1-9
29 57 14 146
Part of larger organisation: 10-49
34 55 10 359
Part of larger organisation: 50-249
32 51 17 374
Part of larger organisation: 250+
33 52 14 388
Single site: 1-9 37 51 12 124
Single site: 10-49 32 55 12 212
Single site: 50-249 43 44 13 111
Single site: 250+ 41 35 23 78
Gender make-up of workplace
Mostly women 44 46 10 727
Mostly men 15 70 15 494
About half women and half men
40 44 15 630
Base: All employees (Core sample).
Missing values: don’t know / refusal
Row per cent.
244

Table C3.14 Perceived flexible working practices available in the workplace – Work from home on a regular basis
Yes No Don't know Unweighted bases
All employees 30 68 2 1874
Gender Female 27 72 2 1097
Male 33 64 3 777
Age 16-24 13 85 2 111
25-39 34 64 2 491
40-49 32 66 2 555
50-59 35 63 2 504
60+ 23 73 3 179
Ethnicity White 30 68 2 1695
Non-white 31 66 4 150
Parental status Parent 33 65 2 771
Non-parent 28 69 2 1103
Highest qualification level
None 11 87 2 153
GCSEs/O Level/CSEs 16 81 3 373
A Levels 23 75 2 293
Degree/Professional qualifications
43 54 3 359
Postgraduate degree 49 50 1 283
Other vocational or academic qualifications, level not specified
36 63 1 254
Other 21 77 2 119
Household income
Under £15,000 12 86 2 160
£15,000 - £24,999 18 80 2 269
£25,000 - £34,999 23 74 3 246
245

Table C3.14 Perceived flexible working practices available in the workplace – Work from home on a regular basis
Yes No Don't know Unweighted bases
£35,000 - £44,999 31 67 2 213
£45,000 or more 50 49 2 508
Carer status Yes, child [30] [66] 4 33
Yes, relative in any household or non-relative adult in this household
32 67 1 316
Yes, non-relative adult in another household
[34] [65] 1 33
No 29 68 3 1492
Disability status No 31 67 2 1595
Yes 27 71 2 253
Religion or faith None 29 69 2 566
Christian 30 68 2 1176
Other 32 64 4 99
Region South 34 63 3 850
North 26 73 1 414
Midlands 30 67 3 313
Wales 23 76 0 107
Scotland 22 76 2 190
Full-time or part-time worker
Part-time 18 80 2 537
Full-time 34 63 3 1318
Level of responsibility
Manager/supervisor 42 56 2 696
Not manager/supervisor 23 75 2 1160
Time with current employer
Less than 6 months 25 69 5 85
6 to 11 months 29 71 0 54
1 year to 4 years 24 75 1 538
246
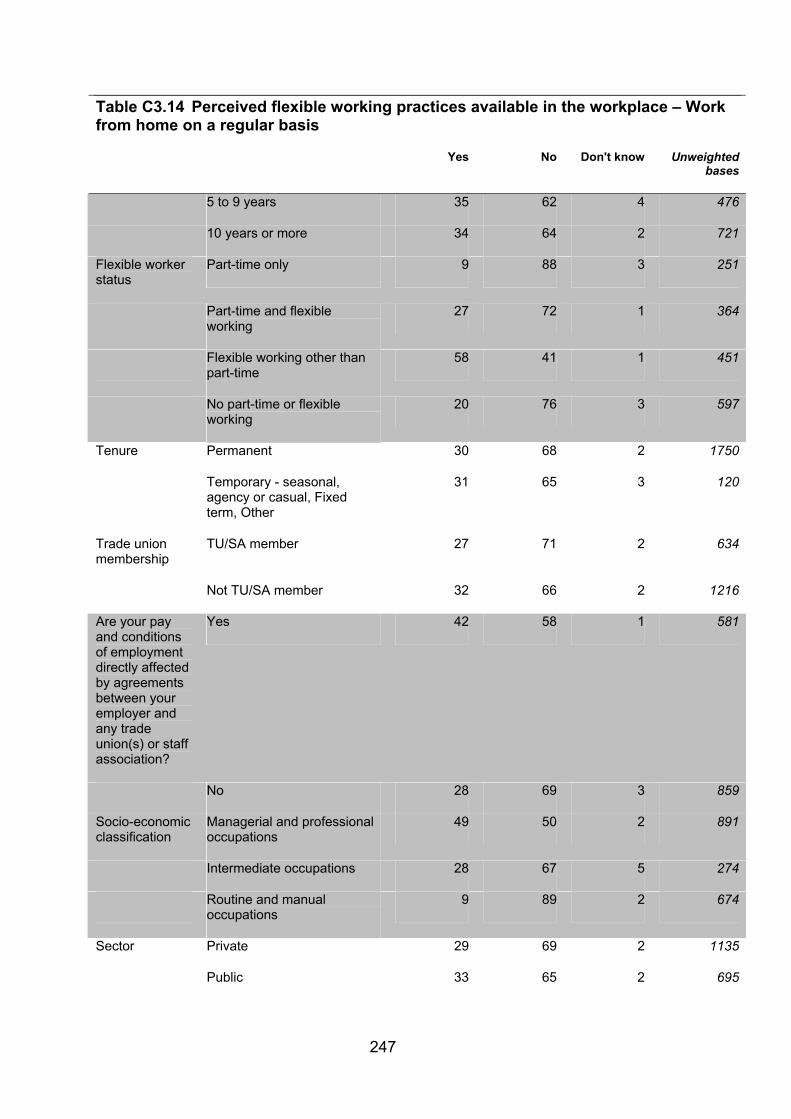
Table C3.14 Perceived flexible working practices available in the workplace – Work from home on a regular basis
Yes No Don't know Unweighted bases
5 to 9 years 35 62 4 476
10 years or more 34 64 2 721
Flexible worker status
Part-time only 9 88 3 251
Part-time and flexible working
27 72 1 364
Flexible working other than part-time
58 41 1 451
No part-time or flexible working
20 76 3 597
Tenure Permanent 30 68 2 1750
Temporary - seasonal, agency or casual, Fixed term, Other
31 65 3 120
Trade union membership
TU/SA member 27 71 2 634
Not TU/SA member 32 66 2 1216
Are your pay and conditions of employment directly affected by agreements between your employer and any trade union(s) or staff association?
Yes 42 58 1 581
No 28 69 3 859
Socio-economic classification
Managerial and professional occupations
49 50 2 891
Intermediate occupations 28 67 5 274
Routine and manual occupations
9 89 2 674
Sector Private 29 69 2 1135
Public 33 65 2 695
247
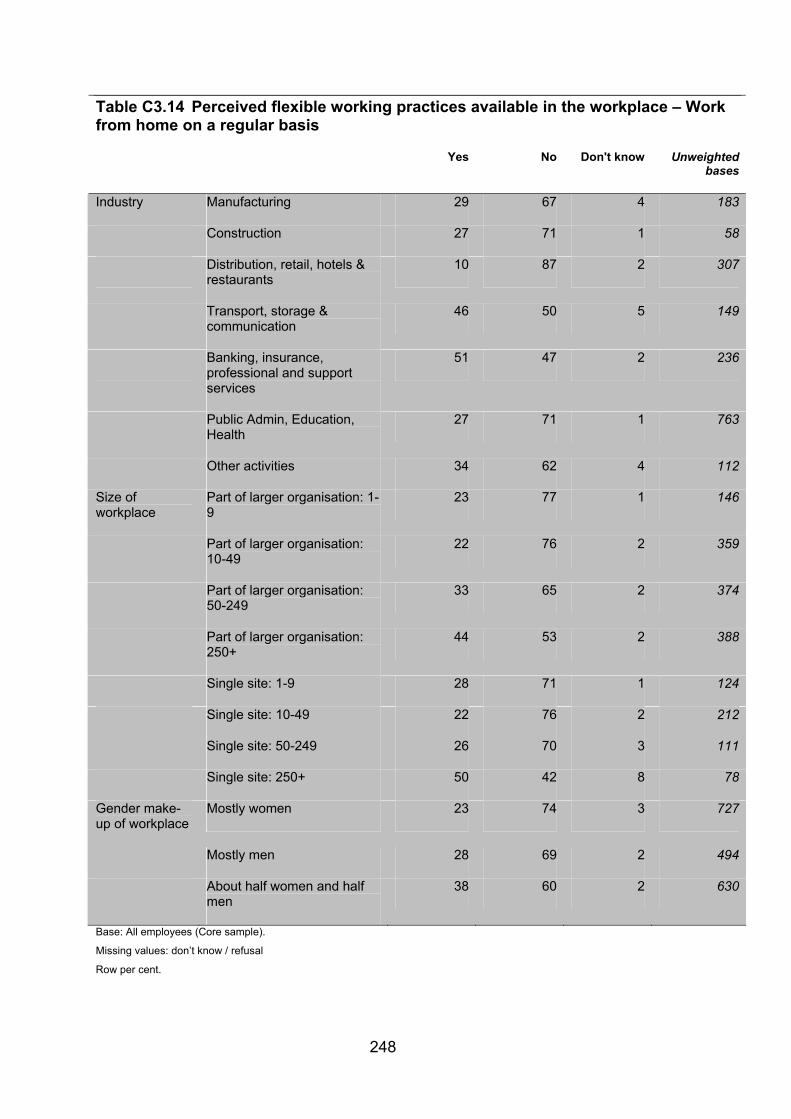
Table C3.14 Perceived flexible working practices available in the workplace – Work from home on a regular basis
Yes No Don't know Unweighted bases
Industry Manufacturing 29 67 4 183
Construction 27 71 1 58
Distribution, retail, hotels & restaurants
10 87 2 307
Transport, storage & communication
46 50 5 149
Banking, insurance, professional and support services
51 47 2 236
Public Admin, Education, Health
27 71 1 763
Other activities 34 62 4 112
Size of workplace
Part of larger organisation: 1-9
23 77 1 146
Part of larger organisation: 10-49
22 76 2 359
Part of larger organisation: 50-249
33 65 2 374
Part of larger organisation: 250+
44 53 2 388
Single site: 1-9 28 71 1 124
Single site: 10-49 22 76 2 212
Single site: 50-249 26 70 3 111
Single site: 250+ 50 42 8 78
Gender make-up of workplace
Mostly women 23 74 3 727
Mostly men 28 69 2 494
About half women and half men
38 60 2 630
Base: All employees (Core sample).
Missing values: don’t know / refusal
Row per cent.
248

Table C3.15 Perceived flexible working practices available in the workplace – Work annualised hours
Yes No Don't know Unweighted bases
All employees 17 64 19 1874
Gender Female 18 62 20 1097
Male 17 66 17 777
Age 16-24 15 59 26 111
25-39 17 63 20 491
40-49 19 65 16 555
50-59 20 66 14 504
60+ 15 67 19 179
Ethnicity White 17 64 18 1695
Non-white 19 58 23 150
Parental status Parent 16 65 19 771
Non-parent 18 64 18 1103
Highest qualification level
None 14 70 16 153
GCSEs/O Level/CSEs 18 65 17 373
A Levels 17 64 20 293
Degree/Professional qualifications
19 59 22 359
Postgraduate degree 19 66 15 283
Other vocational or academic qualifications, level not specified
18 64 18 254
Other 9 71 20 119
Household income
Under £15,000 23 56 22 160
£15,000 - £24,999 20 62 18 269
£25,000 - £34,999 15 73 12 246
249

Table C3.15 Perceived flexible working practices available in the workplace – Work annualised hours
Yes No Don't know Unweighted bases
£35,000 - £44,999 12 68 20 213
£45,000 or more 20 63 18 508
Carer status Yes, child [30] [46] [23] 33
Yes, relative in any household or non-relative adult in this household
22 63 15 316
Yes, non-relative adult in another household
[12] [61] [27] 33
No 16 65 19 1492
Disability status No 18 64 18 1595
Yes 15 64 20 253
Religion or faith None 15 66 19 566
Christian 19 63 18 1176
Other 17 59 24 99
Region South 17 63 20 850
North 16 64 20 414
Midlands 21 60 19 313
Wales 18 71 10 107
Scotland 15 73 12 190
Full-time or part-time worker
Part-time 20 59 21 537
Full-time 16 66 18 1318
Level of responsibility
Manager/supervisor 19 65 15 696
Not manager/supervisor 16 63 21 1160
Time with current employer
Less than 6 months 16 62 22 85
6 to 11 months 24 59 17 54
1 year to 4 years 15 64 21 538
250

Table C3.15 Perceived flexible working practices available in the workplace – Work annualised hours
Yes No Don't know Unweighted bases
5 to 9 years 16 65 19 476
10 years or more 20 64 15 721
Flexible worker status
Part-time only 13 61 26 251
Part-time and flexible working
24 58 18 364
Flexible working other than part-time
26 57 17 451
No part-time or flexible working
10 73 17 597
Tenure Permanent 17 64 19 1750
Temporary - seasonal, agency or casual, Fixed term, Other
17 66 17 120
Trade union membership
TU/SA member 21 63 16 634
Not TU/SA member 16 64 20 1216
Are your pay and conditions of employment directly affected by agreements between your employer and any trade union(s) or staff association?
Yes 23 61 16 581
No 16 68 16 859
Socio-economic classification
Managerial and professional occupations
20 64 16 891
Intermediate occupations 14 63 23 274
Routine and manual occupations
16 65 19 674
Sector Private 15 67 19 1135
Public 23 59 18 695
251

Table C3.15 Perceived flexible working practices available in the workplace – Work annualised hours
Yes No Don't know Unweighted bases
Industry Manufacturing 11 73 16 183
Construction 12 68 20 58
Distribution, retail, hotels & restaurants
14 65 21 307
Transport, storage & communication
17 60 22 149
Banking, insurance, professional and support services
19 61 20 236
Public Admin, Education, Health
22 61 17 763
Other activities 17 69 14 112
Size of workplace
Part of larger organisation: 1-9
14 59 27 146
Part of larger organisation: 10-49
19 66 14 359
Part of larger organisation: 50-249
19 64 17 374
Part of larger organisation: 250+
17 63 20 388
Single site: 1-9 23 66 10 124
Single site: 10-49 15 62 22 212
Single site: 50-249 14 64 22 111
Single site: 250+ 13 67 20 78
Gender make-up of workplace
Mostly women 19 63 18 727
Mostly men 15 69 15 494
About half women and half men
17 61 22 630
Base: All employees (Core sample).
Missing values: don’t know / refusal
Row per cent.
252

Table C3.16 Number of flexible working arrangements perceived to be available in the workplace – none, 1 or more
None 1 or more Unweighted bases
All employees 8 92 1871
Gender Female 3 97 1096
Male 12 88 775
Age 16-24 4 96 110
25-39 7 93 490
40-49 8 92 555
50-59 10 90 504
60+ 9 91 178
Ethnicity White 8 92 1692
Non-white 5 95 150
Parental status Parent 9 91 774
Non-parent 7 93 1097
Highest qualification level None 19 81 153
GCSEs/O Level/CSEs 8 92 372
A Levels 7 93 293
Degree/Professional qualifications 4 96 357
Postgraduate degree 4 96 283
Other vocational or academic qualifications, level not specified
6 94 254
Other 15 85 119
Household income Under £15,000 6 94 159
£15,000 - £24,999 6 94 269
£25,000 - £34,999 10 90 245
£35,000 - £44,999 12 88 213
£45,000 or more 6 94 508
Carer status Yes, child [3] [97] 33
253

Table C3.16 Number of flexible working arrangements perceived to be available in the workplace – none, 1 or more
None 1 or more Unweighted bases
Yes, relative in any household or non-relative adult in this household
4 96 316
Yes, non-relative adult in another household
[3] [97] 33
No 8 92 1489
Disability status No 8 92 1592
Yes 5 95 253
Religion or faith None 8 92 565
Christian 7 93 1174
Other 8 92 99
Region South 7 93 848
North 9 91 414
Midlands 3 97 312
Wales 14 86 107
Scotland 10 90 190
Full-time or part-time worker Part-time 1 99 537
Full-time 10 90 1315
Level of responsibility Manager/supervisor 6 94 695
Not manager/supervisor 8 92 1158
Time with current employer Less than 6 months 11 89 84
6 to 11 months 12 88 54
1 year to 4 years 6 94 537
5 to 9 years 6 94 475
10 years or more 10 90 721
Flexible worker status Part-time only 100 251
Part-time and flexible working 100 251
Flexible working other than part-time
100 251
254

Table C3.16 Number of flexible working arrangements perceived to be available in the workplace – none, 1 or more
None 1 or more Unweighted bases
No part-time or flexible working 23 77 251
Tenure Permanent 8 92 1747
Temporary - seasonal, agency or casual, Fixed term, Other
6 94 120
Trade union membership TU/SA member 5 95 633
Not TU/SA member 8 92 1214
Pay and conditions affected by employer and TU/SA agreements
Yes 5 95 581
No 9 91 857
Socio-economic classification
Managerial and professional occupations
4 96 890
Intermediate occupations 7 93 273
Routine and manual occupations 11 89 673
Sector Private 9 91 1132
Public 3 97 695
Industry Manufacturing 16 84 183
Construction 23 77 58
Distribution, retail, hotels & restaurants
7 93 307
Transport, storage & communication
8 92 147
Banking, insurance, professional and support services
3 97 236
Public Admin, Education, Health 4 96 763
Other activities 9 91 111
Size of workplace Part of larger organisation: 1-9 11 89 145
Part of larger organisation: 10-49 10 90 359
Part of larger organisation: 50-249 8 92 374
Part of larger organisation: 250+ 4 96 387
255

Table C3.16 Number of flexible working arrangements perceived to be available in the workplace – none, 1 or more
None 1 or more Unweighted bases
Single site: 1-9 10 90 124
Single site: 10-49 9 91 211
Single site: 50-249 3 97 111
Single site: 250+ 1 99 78
Gender make-up of workplace
Mostly women 3 97 727
Mostly men 18 82 492
About half women and half men 4 96 629
Base: All employees (Core sample).
Missing values: don’t know / refusal
Row per cent.
256

Table C3.17 Number of flexible working arrangements perceived to be available in the workplace – 0 to 2, 3 or more
0 to 2 3 or more Unweighted bases
All employees 34 66 1871
Gender Female 27 73 1096
Male 41 59 775
Age 16-24 39 61 110
25-39 33 67 490
40-49 31 69 555
50-59 35 65 504
60+ 38 62 178
Ethnicity White 34 66 1692
Non-white 37 63 150
Parental status Parent 34 66 774
Non-parent 34 66 774
Highest qualification level None 51 49 153
GCSEs/O Level/CSEs 44 56 372
A Levels 33 67 293
Degree/Professional qualifications 25 75 357
Postgraduate degree 21 79 283
Other vocational or academic qualifications, level not specified
35 65 254
Other 45 55 119
Household income Under £15,000 38 62 159
£15,000 - £24,999 38 62 269
£25,000 - £34,999 38 62 245
£35,000 - £44,999 38 62 213
£45,000 or more 25 75 508
Carer status Yes, child [28] [72] 33
257

Table C3.17 Number of flexible working arrangements perceived to be available in the workplace – 0 to 2, 3 or more
0 to 2 3 or more Unweighted bases
Yes, relative in any household or non-relative adult in this household
33 67 316
Yes, non-relative adult in another household
[20] [80] 33
No 35 65 1489
Disability status No 33 67 1592
Yes 40 60 253
Religion or faith None 35 65 565
Christian 34 66 1174
Other 38 62 99
Region South 32 68 848
North 38 62 414
Midlands 34 66 312
Wales 33 67 107
Scotland 37 63 190
Full-time or part-time worker Part-time 29 71 537
Full-time 37 63 1315
Level of responsibility Manager/supervisor 27 73 695
Not manager/supervisor 38 62 1158
Time with current employer Less than 6 months 45 55 84
6 to 11 months 38 62 54
1 year to 4 years 37 63 537
5 to 9 years 31 69 475
10 years or more 31 69 721
Flexible worker status Part-time only 50 50 251
Part-time and flexible working 10 90 364
Flexible working other than part-time
6 94 451
258

Table C3.17 Number of flexible working arrangements perceived to be available in the workplace – 0 to 2, 3 or more
0 to 2 3 or more Unweighted bases
No part-time or flexible working 50 50 597
Tenure Permanent 35 65 1747
Temporary - seasonal, agency or casual, Fixed term, Other
29 71 120
Trade union membership TU/SA member 27 73 633
Not TU/SA member 37 63 1214
Pay and conditions affected by employer and TU/SA agreements
Yes 25 75 581
No 37 63 857
Socio-economic classification
Managerial and professional occupations
23 77 890
Intermediate occupations 36 64 273
Routine and manual occupations 46 54 673
Sector Private 40 60 1132
Public 20 80 695
Industry Manufacturing 59 41 183
Construction 52 48 58
Distribution, retail, hotels & restaurants
39 61 307
Transport, storage & communication
34 66 147
Banking, insurance, professional and support services
25 75 236
Public Admin, Education, Health 24 76 763
Other activities 32 68 111
Size of workplace Part of larger organisation: 1-9 42 58 145
Part of larger organisation: 10-49 38 62 359
Part of larger organisation: 50-249 34 66 374
Part of larger organisation: 250+ 27 73 387
259

Table C3.17 Number of flexible working arrangements perceived to be available in the workplace – 0 to 2, 3 or more
0 to 2 3 or more Unweighted bases
Single site: 1-9 28 72 124
Single site: 10-49 40 60 211
Single site: 50-249 33 67 111
Single site: 250+ 21 79 78
Gender make-up of workplace
Mostly women 27 73 727
Mostly men 50 50 492
About half women and half men 27 73 629
Base: All employees (Core sample).
Missing values: don’t know / refusal
Row per cent.
260

Table C3.18 Take-up of flexitime working
Yes No Unweighted bases
All employees 49 51 877
Gender Female 51 49 496
Male 46 54 381
Age 16-24 43 57 53
25-39 48 52 245
40-49 50 50 270
50-59 51 49 218
60+ 52 48 79
Ethnicity White 49 46 773
Non-white 51 54 90
Parental status Parent 55 45 357
Non-parent 45 55 520
Highest qualification level None 35 65 56
GCSEs/O Level/CSEs 41 59 161
A Levels 44 56 132
Degree/Professional qualifications 63 37 193
Postgraduate degree 53 47 155
Other vocational or academic qualifications, level not specified
36 64 117
Other [65] [35] 47
Household income Under £15,000 48 52 66
£15,000 - £24,999 49 51 120
£25,000 - £34,999 53 47 112
£35,000 - £44,999 58 42 93
£45,000 or more 52 48 272
Carer status Yes, child * * 16
Yes, relative in any household or non-relative adult in this
56 44 141
261
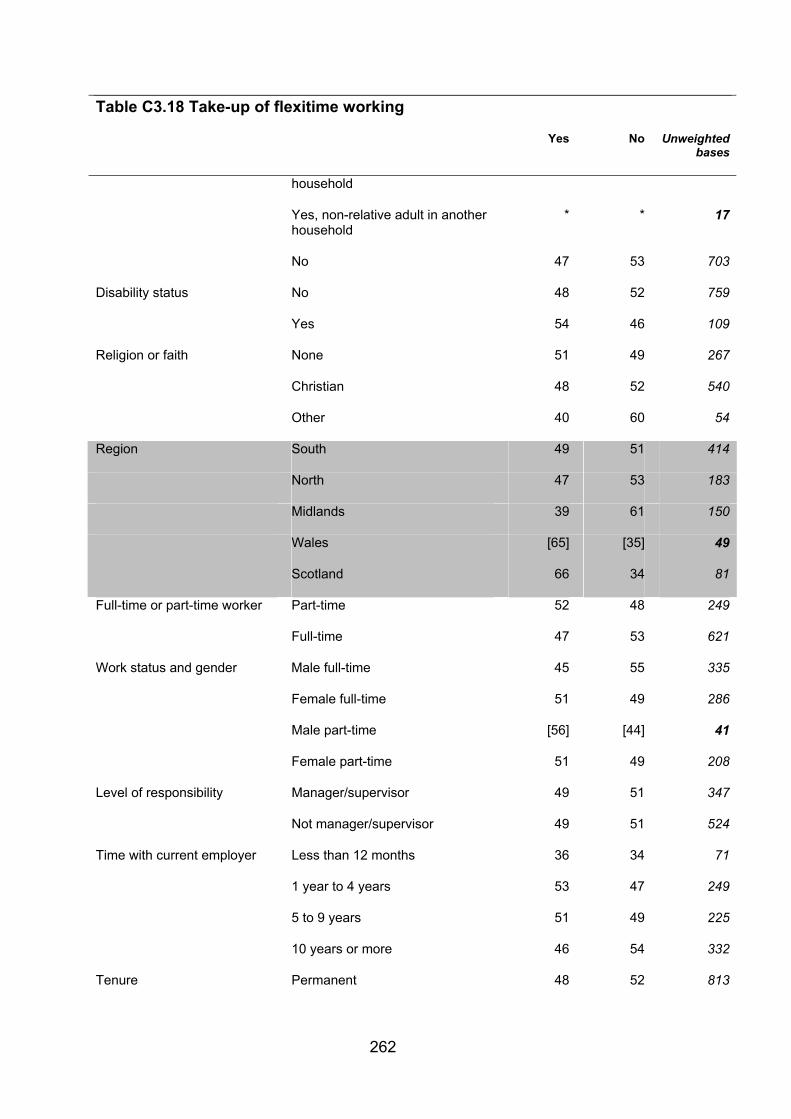
Table C3.18 Take-up of flexitime working
Yes No Unweighted bases
household
Yes, non-relative adult in another household
* * 17
No 47 53 703
Disability status No 48 52 759
Yes 54 46 109
Religion or faith None 51 49 267
Christian 48 52 540
Other 40 60 54
Region South 49 51 414
North 47 53 183
Midlands 39 61 150
Wales [65] [35] 49
Scotland 66 34 81
Full-time or part-time worker Part-time 52 48 249
Full-time 47 53 621
Work status and gender Male full-time 45 55 335
Female full-time 51 49 286
Male part-time [56] [44] 41
Female part-time 51 49 208
Level of responsibility Manager/supervisor 49 51 347
Not manager/supervisor 49 51 524
Time with current employer Less than 12 months 36 34 71
1 year to 4 years 53 47 249
5 to 9 years 51 49 225
10 years or more 46 54 332
Tenure Permanent 48 52 813
262

Table C3.18 Take-up of flexitime working
Yes No Unweighted bases
Temporary - seasonal, agency or casual, Fixed term, Other
53 47 62
Trade union membership TU/SA member 50 50 275
Not TU/SA member 48 52 592
Socio-economic classification Managerial and professional occupations
52 48 489
Intermediate occupations 51 49 124
Routine and manual occupations 43 57 250
Sector Private 45 55 503
Public 56 44 358
Industry Manufacturing 39 61 69
Construction* * * 24
Distribution, retail, hotels & restaurants
41 59 123
Transport, storage & communication
50 50 81
Banking, insurance, professional and support services
46 54 137
Public Admin, Education, Health 53 47 349
Other activities 58 42 57
Size of workplace Part of larger organisation: 1-9 53 47 69
Part of larger organisation: 10-49 46 54 150
Part of larger organisation: 50-249 47 53 156
Part of larger organisation: 250+ 47 53 222
Single site: 1-9 51 49 65
Single site: 10-49 49 51 88
Single site: 50-249 [40] [60] 38
Single site: 250+ 53 47 52
Base: Employees who reported flexitime working to be available to them (Core sample).
Some categories collapsed due to small cell sizes
Missing values: don’t know / refusal. Row per cent
263

Table C3.19 Take-up of flexitime working among parents
Yes No Unweighted bases
Parent employees 54 46 644
Gender and parent status Male with dependent children 48 52 110
Female with dependent children 59 41 532
Family status Lone parent 65 35 110
Couple parent 52 48 532
Gender and partnership status Coupled mother 57 43 275
Lone mother 67 33 91
Coupled father 48 52 257
Lone father * * 19
Family employment status Lone parent earner with children 65 35 110
Single earner couple with children 49 51 142
Dual earner couple with children 53 47 390
Age of youngest child Dependent children under 6 54 46 282
Dependent children of 6 and over 53 47 362
Base: Parent employees who reported flexitime working to be available to them (Core and Boost sample).
Missing values: don’t know / refusal
Row per cent
264

Table C3.20 Take-up of flexitime working among carers
Yes No Unweighted bases
Carer employees 52 48 391
Carer status Yes, child 58 42 38
Yes, relative in any household or non-relative adult in this household 53 47 316
Yes, non-relative adult in another household 44 56 37
Gender Female 57 43 236
Male 48 52 155
Age 16-39 51 49 73
40-49 57 43 126
50+ 51 49 188
Base: Carer employees who reported flexitime working to be available to them (Core and Boost sample).
Some categories collapsed due to small cell sizes
Missing values: don’t know / refusal
Row per cent
265

Table C3.21 Take-up of regularly working from home
Yes No Unweighted bases
All employees 44 56 571
Gender Female 45 55 298
Male 43 57 273
Age 16-39 36 64 180
40-49 48 52 173
50+ 49 51 211
Ethnicity White 44 56 515
Non-white [36] [64] 47
Parental status Parent 50 50 255
Non-parent 39 61 316
Highest qualification level None * * 18
GCSEs/O Level/CSEs 25 75 67
A Levels 42 58 76
Degree/Professional qualifications 46 54 155
Postgraduate degree 50 50 132
Other vocational or academic qualifications, level not specified
44 56 91
Other [53] [47] 25
Household income Under £25,000 29 71 71
£25,000 - £34,999 20 80 65
£35,000 - £44,999 37 63 76
£45,000 or more 54 46 247
Carer status Yes, child * * 11
Yes, relative in any household or non-relative adult in this household
41 59 100
Yes, non-relative adult in another household
* * 12
266

Table C3.21 Take-up of regularly working from home
Yes No Unweighted bases
No 43 57 448
Disability status No 42 58 491
Yes 54 46 76
Religion or faith None 43 57 176
Christian 44 56 356
Other 31 69 27
Region South 43 57 295
North 45 55 108
Midlands 43 57 91
Wales [50] [50] 26
Scotland 40 60 51
Full-time or part-time worker Part-time 40 60 103
Full-time 44 56 463
Work status and gender Male full-time 43 57 247
Female full-time 46 54 216
Male part-time * * 23
Female part-time 39 61 80
Level of responsibility Manager/supervisor 51 49 293
Not manager/supervisor 35 65 275
Time with current employer Less than 5 years 40 60 175
5 to 9 years 51 49 158
10 years or more 41 59 238
Tenure Permanent 44 56 530
Temporary - seasonal, agency or casual, Fixed term, Other
[42] [58] 41
Trade union membership TU/SA member 44 56 169
Not TU/SA member 43 57 398
267

Table C3.21 Take-up of regularly working from home
Yes No Unweighted bases
Socio-economic classification Managerial and professional occupations
50 50 421
Intermediate occupations 25 75 77
Routine and manual occupations 20 80 64
Sector Private 45 55 327
Public 43 57 237
Industry Manufacturing 27 73 52
Construction * * 17
Distribution, retail, hotels & restaurants
[28] [72] 33
Transport, storage & communication
60 40 71
Banking, insurance, professional and support services
41 59 115
Public Admin, Education, Health 49 51 221
Other activities [50] [50] 39
Size of workplace 1-9 employees 58 42 70
10-49 employees 42 58 129
50-249 employees 41 59 145
250+ employees 40 60 217
Base: Employees who reported regularly working from home to be available to them (Core sample).
Some categories collapsed due to small cell sizes
Missing values: don’t know / refusal
Row per cent
268

Table C3.22 Take-up of regularly working from home among parents
Yes No Unweighted bases
53 47 Parent employees 449
Gender and parent status Male with dependent children 55 45 218
Female with dependent children 49 51 231
Family status Lone parent 47 53 60
Couple parent 53 47 386
Gender and partnership status Coupled mother 50 50 179
Lone mother 43 57 51
Coupled father 55 45 207
Lone father * * 9
Family employment status Lone parent earner with children 47 53 60
Single earner couple with children 59 41 100
Dual earner couple with children 51 49 286
Age of youngest child Dependent children under 6 53 47 192
Dependent children of 6 and over 52 48 257
Base: Parent employees who reported regularly working from home to be available to them (Core and Boost sample).
Missing values: don’t know / refusal
Row per cent
269

Table C3.23 Take-up of regularly working from home among carers
Yes No Unweighted bases
42 58Carer employees 266
Carer status Yes, child * * 24
Yes, relative in any household or non-relative adult in this household 38 62 219
Yes, non-relative adult in another household * * 23
Gender Female 40 60 154
Male 43 57 112
Age 16-39 [36] [64] 41
40-49 41 59 92
50+ 44 56 131
Base: Carer employees who reported regularly working from home to be available to them (Core and Boost sample).
Some categories collapsed due to small cell sizes
Missing values: don’t know / refusal
Row per cent
270
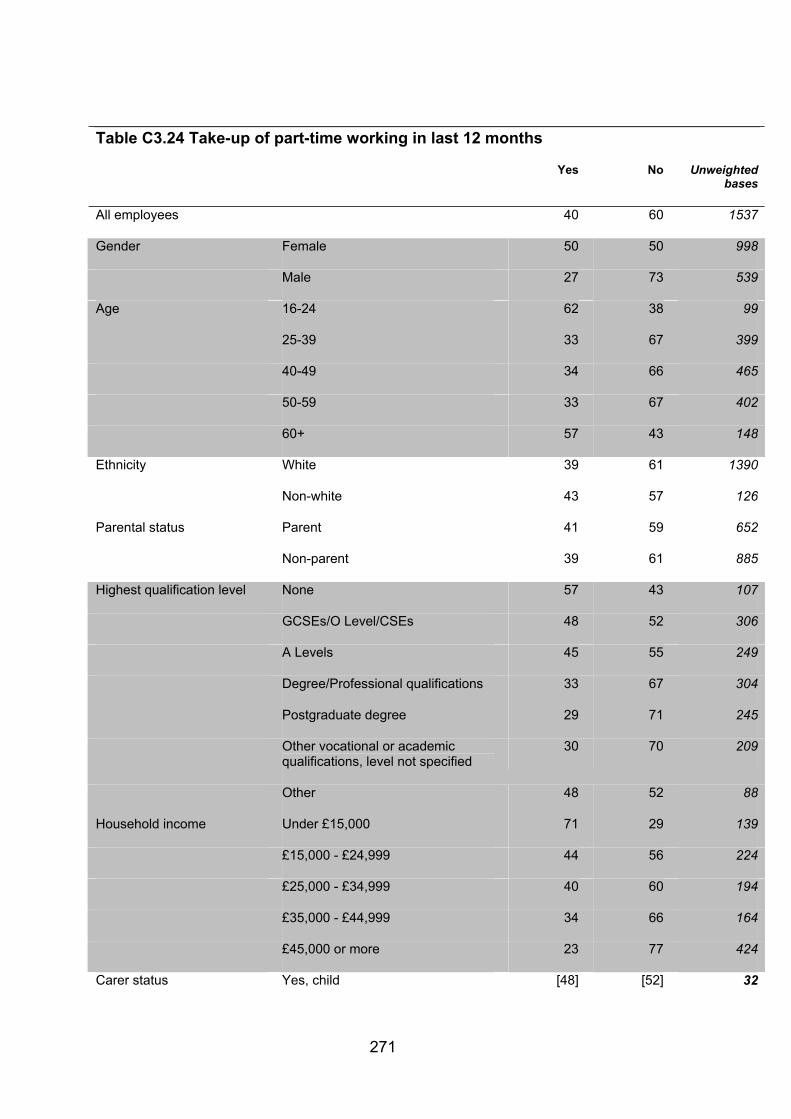
Table C3.24 Take-up of part-time working in last 12 months
Yes No Unweighted bases
All employees 40 60 1537
Gender Female 50 50 998
Male 27 73 539
Age 16-24 62 38 99
25-39 33 67 399
40-49 34 66 465
50-59 33 67 402
60+ 57 43 148
Ethnicity White 39 61 1390
Non-white 43 57 126
Parental status Parent 41 59 652
Non-parent 39 61 885
Highest qualification level None 57 43 107
GCSEs/O Level/CSEs 48 52 306
A Levels 45 55 249
Degree/Professional qualifications 33 67 304
Postgraduate degree 29 71 245
Other vocational or academic qualifications, level not specified
30 70 209
Other 48 52 88
Household income Under £15,000 71 29 139
£15,000 - £24,999 44 56 224
£25,000 - £34,999 40 60 194
£35,000 - £44,999 34 66 164
£45,000 or more 23 77 424
Carer status Yes, child [48] [52] 32
271

Table C3.24 Take-up of part-time working in last 12 months
Yes No Unweighted bases
Yes, relative in any household or non-relative adult in this household
43 57 272
Yes, non-relative adult in another household
[55] [45] 30
No 38 62 1203
Disability status No 39 61 1306
Yes 42 58 215
Religion or faith None 39 61 466
Christian 40 60 966
Other 39 61 81
Region South 40 60 706
North 39 61 344
Midlands 38 62 260
Wales 40 60 79
Scotland 41 59 148
Level of responsibility Manager/supervisor 23 77 579
Not manager/supervisor 50 50 948
Time with current employer Less than 6 months 53 47 67
6 to 11 months [55] [45] 44
1 year to 4 years 49 51 439
5 to 9 years 33 67 397
10 years or more 31 69 590
Tenure Permanent 38 62 1432
Temporary - seasonal, agency or casual, Fixed term, Other
65 35 101
Trade union membership TU/SA member 29 71 540
Not TU/SA member 44 56 981
Socio-economic classification
Managerial and professional occupations
23 77 756
272

Table C3.24 Take-up of part-time working in last 12 months
Yes No Unweighted bases
Intermediate occupations 46 54 240
Routine and manual occupations 58 42 520
Sector Private 41 59 867
Public 35 65 640
Industry Manufacturing 18 82 106
Construction [27] [73] 31
Distribution, retail, hotels & restaurants
61 39 265
Transport, storage & communication
22 78 107
Banking, insurance, professional and support services
28 72 199
Public Admin, Education, Health 39 61 700
Other activities 54 46 87
Size of workplace Part of larger organisation: 1-9 53 47 111
Part of larger organisation: 10-49 46 54 300
Part of larger organisation: 50-249 33 67 299
Part of larger organisation: 250+ 24 76 331
Single site: 1-9 67 33 97
Single site: 10-49 43 57 167
Single site: 50-249 35 65 96
Single site: 250+ 25 75 73
Base: Employees who reported part-time working to be available to them (Core sample).
Missing values: don’t know / refusal
Row per cent
273

Table C3.25 Take-up of part-time working among parents
Yes No Unweighted bases
41 59Parent employees 1136
Gender and parent status Male with dependent children 16 84 214
Female with dependent children 59 41 911
Family status Lone parent 54 46 214
Couple parent 39 61 911
Gender and partnership status
Coupled mother 59 41 554
Lone mother 56 44 191
Coupled father 15 85 357
Lone father * * 23
Family employment status Lone parent earner with children 54 46 214
Single earner couple with children 27 73 209
Dual earner couple with children 43 57 699
Age of youngest child Dependent children under 6 40 60 484
Dependent children of 6 and over 41 59 649
Base: Parent employees who reported part-time working to be available to them (Core and Boost sample).
Missing values: don’t know / refusal
Row per cent
274

Table C3.26 Take-up of part-time working among carers
Yes No Unweighted bases
Carer employees 44 66 705
Carer status Yes, child 47 53 81
Yes, relative in any household or non-relative adult in this household 42 58 562
Yes, non-relative adult in another household 60 40 62
Gender Female 50 50 484
Male 36 64 221
Age 16-39 52 48 122
40-49 40 60 222
50-59 37 63 260
60+ 55 45 91
Base: Carer employees who reported part-time working to be available to them (Core and Boost sample).
Some categories collapsed due to small cell sizes
Missing values: don’t know / refusal
Row per cent
275

Table C3.27 Take-up of annualised hours working
Yes No Unweighted bases
30 70All employees 335
Gender Female 28 72 207
Male 32 68 128
Age 16-39 23 77 100
40-49 35 65 111
50+ 34 66 122
Ethnicity White 29 71 300
Non-white [40] [60] 31
Parental status Parent 30 70 138
Non-parent 29 71 197
Highest qualification level None * * 21
GCSEs/O Level/CSEs 30 70 65
A Levels 25 75 50
Degree/Professional qualifications 26 74 74
Postgraduate degree 21 79 61
Other vocational or academic qualifications, level not specified
[48] [52] 47
Other * * 11
Household income Under £25,000 35 65 77
£25,000 - £44,999 38 62 68
£45,000 or more 23 77 108
Carer status Yes, child * * 10
Yes, relative in any household or non-relative adult in this household
30 70 71
Yes, non-relative adult in another household
* * 4
No 30 70 250
276

Table C3.27 Take-up of annualised hours working
Yes No Unweighted bases
Disability status No 30 70 297
Yes [26] [74] 36
Religion or faith None 28 72 90
Christian 32 68 222
Other * * 18
Region South 32 68 149
North 32 68 71
Midlands 21 79 64
Wales * * 16
Scotland [27] [73] 35
Full-time or part-time worker Part-time 30 70 97
Full-time 30 70 234
Work status and gender Male full-time 34 66 108
Female full-time 25 75 126
Male part-time * * 17
Female part-time 32 68 80
Level of responsibility Manager/supervisor 28 72 139
Not manager/supervisor 31 69 194
Time with current employer Less than 5 years 32 68 107
5 to 9 years 28 72 72
10 years or more 28 72 156
Tenure Permanent 30 70 314
Temporary - seasonal, agency or casual, Fixed term, Other
* * 21
Trade union membership TU/SA member 38 62 144
Not TU/SA member 25 75 189
Socio-economic classification Managerial and professional occupations
28 72 191
277

Table C3.27 Take-up of annualised hours working
Yes No Unweighted bases
Intermediate occupations [29] [71] 41
Routine and manual occupations 33 67 100
Sector Private 30 70 159
Public 31 69 167
Industry Manufacturing * * 22
Construction * * 6
Distribution, retail, hotels & restaurants
[28] [72] 37
Transport, storage & communication
[32] [68] 26
Banking, insurance, professional and support services
[21] [79] 42
Public Admin, Education, Health 32 68 174
Other activities * * 18
Size of workplace 1-9 employees [43] [57] 46
10-49 employees 24 76 102
50-249 employees 32 68 87
250+ employees 25 75 89
Base: Employees who reported annualised hours working to be available to them (Core sample).
Some categories collapsed due to small cell sizes
Missing values: don’t know / refusal
Row per cent
278
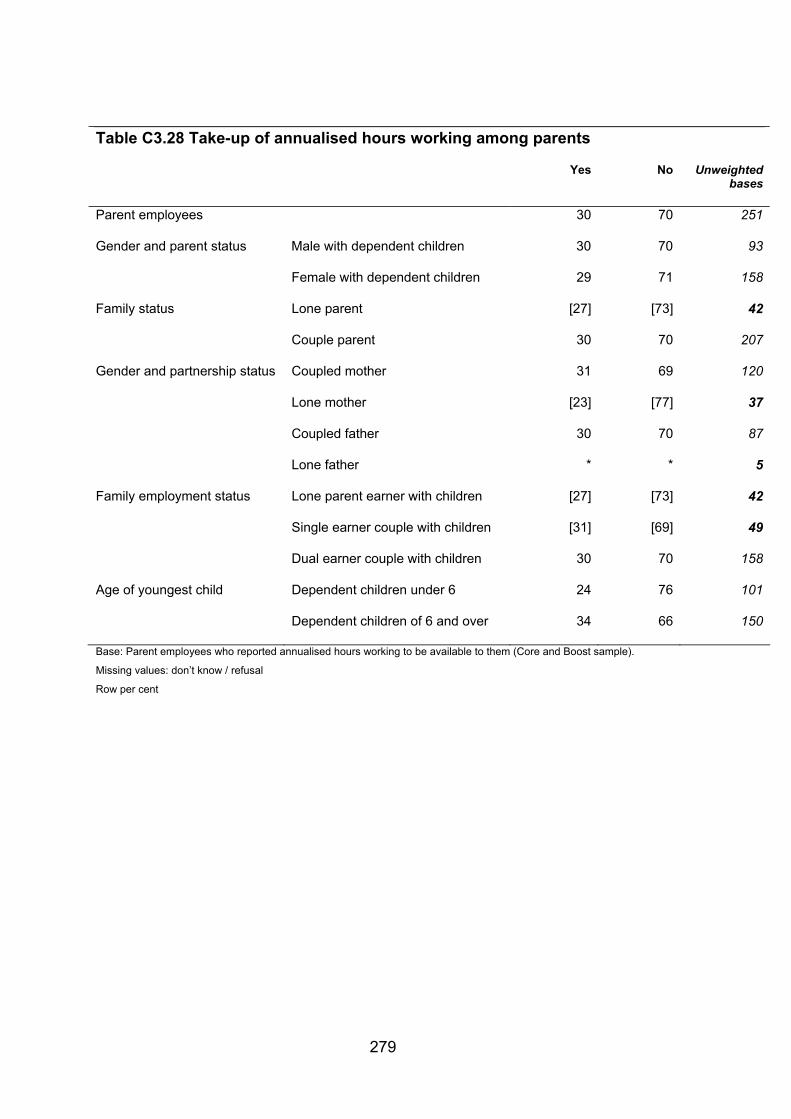
Table C3.28 Take-up of annualised hours working among parents
Yes No Unweighted bases
Parent employees 30 70 251
Gender and parent status Male with dependent children 30 70 93
Female with dependent children 29 71 158
Family status Lone parent [27] [73] 42
Couple parent 30 70 207
Gender and partnership status Coupled mother 31 69 120
Lone mother [23] [77] 37
Coupled father 30 70 87
Lone father * * 5
Family employment status Lone parent earner with children [27] [73] 42
Single earner couple with children [31] [69] 49
Dual earner couple with children 30 70 158
Age of youngest child Dependent children under 6 24 76 101
Dependent children of 6 and over 34 66 150
Base: Parent employees who reported annualised hours working to be available to them (Core and Boost sample).
Missing values: don’t know / refusal
Row per cent
279

Table C3.29 Take-up of annualised hours working among carers
Yes No Unweighted bases
Carer employees 25 75 165
Carer status Yes, child * * 16
Yes, relative in any household or non-relative adult in this household 25 75 134
Yes, non-relative adult in another household * * 15
Gender Female 24 76 107
Male 26 74 58
Age 16-39 [13] [87] 28
40-49 22 78 56
50+ 38 62 81
Base: Carer employees who reported annualised hours working to be available to them (Core and boost sample).
Some categories collapsed due to small cell sizes
Missing values: don’t know / refusal
Row per cent
280
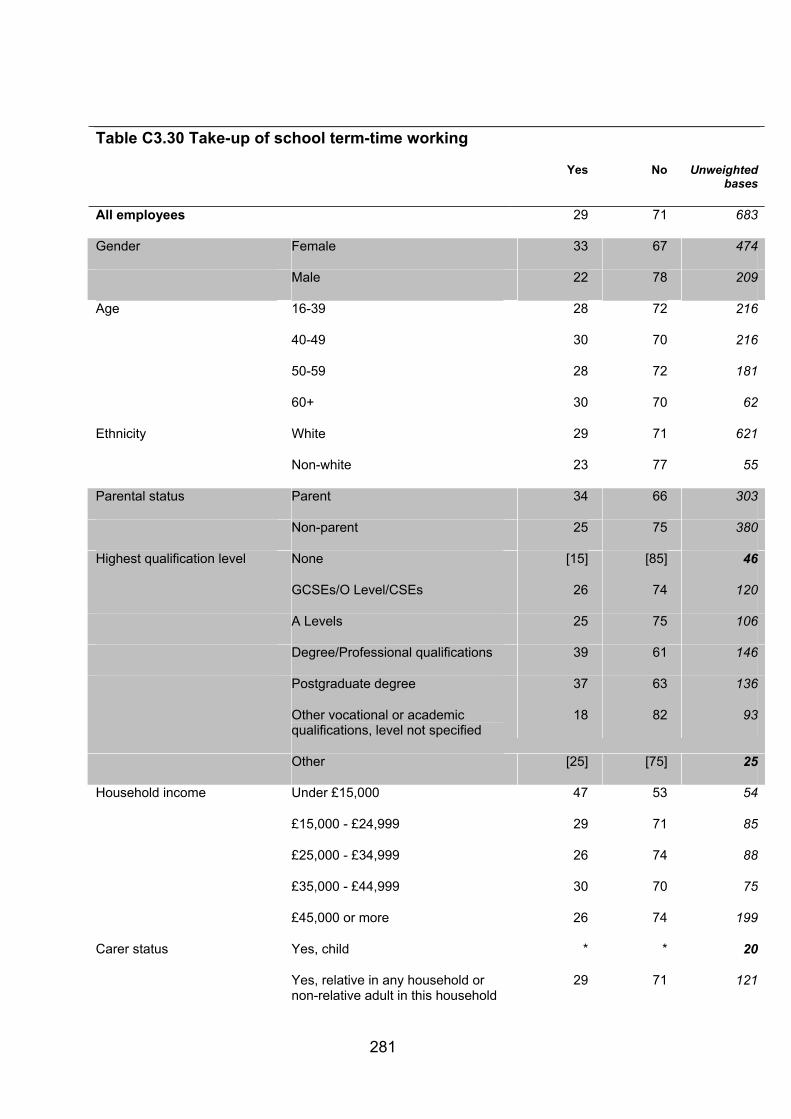
Table C3.30 Take-up of school term-time working
Yes No Unweighted bases
29 71All employees 683
Gender Female 33 67 474
Male 22 78 209
Age 16-39 28 72 216
40-49 30 70 216
50-59 28 72 181
60+ 30 70 62
Ethnicity White 29 71 621
Non-white 23 77 55
Parental status Parent 34 66 303
Non-parent 25 75 380
Highest qualification level None [15] [85] 46
GCSEs/O Level/CSEs 26 74 120
A Levels 25 75 106
Degree/Professional qualifications 39 61 146
Postgraduate degree 37 63 136
Other vocational or academic qualifications, level not specified
18 82 93
Other [25] [75] 25
Household income Under £15,000 47 53 54
£15,000 - £24,999 29 71 85
£25,000 - £34,999 26 74 88
£35,000 - £44,999 30 70 75
£45,000 or more 26 74 199
Carer status Yes, child * * 20
Yes, relative in any household or non-relative adult in this household
29 71 121
281

Table C3.30 Take-up of school term-time working
Yes No Unweighted bases
Yes, non-relative adult in another household
* * 11
No 27 73 531
Disability status No 28 72 594
Yes 30 70 85
Religion or faith None 29 71 197
Christian 28 72 441
Other [31] [69] 36
Region South 33 67 323
North 21 79 148
Midlands 22 78 116
Wales [29] [71] 34
Scotland 40 60 62
Full-time or part-time worker Part-time 43 57 227
Full-time 22 78 445
Work status and gender Male full-time 18 82 168
Female full-time 25 75 277
Male part-time [35] [65] 37
Female part-time 45 55 190
Level of responsibility Manager/supervisor 24 76 270
Not manager/supervisor 32 68 410
Time with current employer Less than 5 years 31 69 231
5 to 9 years 27 73 168
10 years or more 27 73 284
Tenure Permanent 29 71 628
Temporary - seasonal, agency or casual, Fixed term, Other
27 73 53
Trade union membership TU/SA member 39 61 294
282

Table C3.30 Take-up of school term-time working
Yes No Unweighted bases
Not TU/SA member 23 77 382
Socio-economic classification Managerial and professional occupations
30 70 372
Intermediate occupations 13 87 91
Routine and manual occupations 32 68 215
Sector Private 21 79 284
Public 37 63 384
Industry Manufacturing [13] [87] 27
Construction * * 14
Distribution, retail, hotels & restaurants
23 77 94
Transport, storage & communication
[15] [85] 31
Banking, insurance, professional and support services
4 96 68
Public Admin, Education, Health 43 57 412
Other activities [20] [80] 27
Size of workplace 1-9 employees 27 73 81
10-49 employees 37 63 215
50-249 employees 36 64 187
250+ employees 9 91 179
Base: Employees who reported term-time working to be available to them (Core sample).
Some categories collapsed due to small cell sizes
Missing values: don’t know / refusal
Row per cent
283
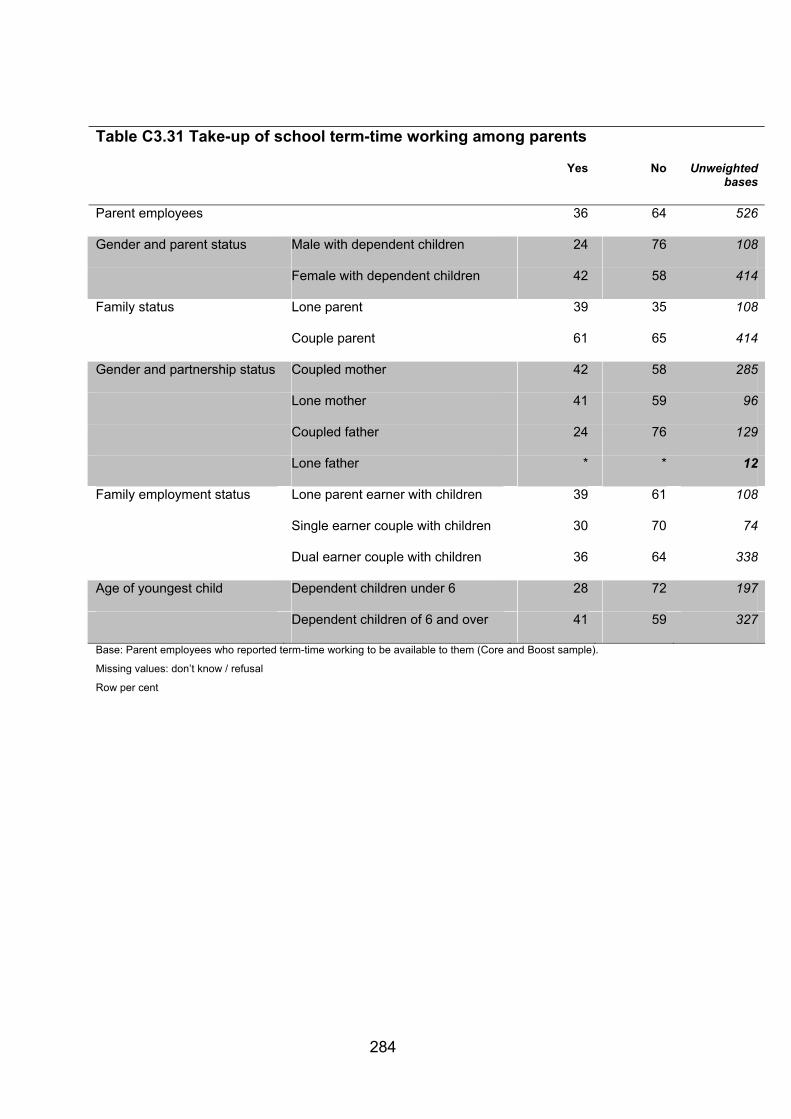
Table C3.31 Take-up of school term-time working among parents
Yes No Unweighted bases
Parent employees 36 64 526
Gender and parent status Male with dependent children 24 76 108
Female with dependent children 42 58 414
Family status Lone parent 39 35 108
Couple parent 61 65 414
Gender and partnership status Coupled mother 42 58 285
Lone mother 41 59 96
Coupled father 24 76 129
Lone father * * 12
Family employment status Lone parent earner with children 39 61 108
Single earner couple with children 30 70 74
Dual earner couple with children 36 64 338
Age of youngest child Dependent children under 6 28 72 197
Dependent children of 6 and over 41 59 327
Base: Parent employees who reported term-time working to be available to them (Core and Boost sample).
Missing values: don’t know / refusal
Row per cent
284

Table C3.32 Take-up of school term-time working among carers
Yes No Unweighted bases
Carer employees 30 70 330
Carer status Yes, child [40] [60] 41
Yes, relative in any household or non-relative adult in this household 27 73 262
Yes, non-relative adult in another household [47] [53] 27
Gender Female 33 67 233
Male 26 74 97
Age 16-39 36 64 58
40-49 30 70 110
50+ 25 75 156
Base: Carer employees who reported term-time working to be available to them (Core and Boost sample).
Some categories collapsed due to small cell sizes
Missing values: don’t know / refusal
Row per cent
285

Table C3.33 Take-up of compressed hours working
Yes No Unweighted bases
All employees 26 74 741
Gender Female 25 75 457
Male 27 73 284
Age 16-24 [29] [71] 43
25-39 28 72 202
40-49 23 77 234
50-59 25 75 188
60+ 18 82 63
Ethnicity White 24 76 667
Non-white 46 54 63
Parental status Parent 24 76 308
Non-parent 27 73 433
Highest qualification level None [31] [69] 44
GCSEs/O Level/CSEs 24 76 134
A Levels 17 83 120
Degree/Professional qualifications 30 70 164
Postgraduate degree 34 66 113
Other vocational or academic qualifications, level not specified
23 77 108
Other 25 75 43
Household income Under £15,000 18 82 64
£15,000 - £24,999 33 67 99
£25,000 - £34,999 25 75 101
£35,000 - £44,999 37 63 87
£45,000 or more 24 76 218
Carer status Yes, child * * 15
Yes, relative in any household or non-relative adult in this
24 76 139
286

Table C3.33 Take-up of compressed hours working
Yes No Unweighted bases
household
Yes, non-relative adult in another household
* * 16
No 26 74 571
Disability status No 26 74 629
Yes 27 73 104
Religion or faith None 27 73 218
Christian 23 77 483
Other 49 51 27
Region South 28 72 317
North 19 81 177
Midlands 24 76 121
Wales [34] [66] 46
Scotland 26 74 80
Full-time or part-time worker Part-time 29 71 224
Full-time 24 76 510
Work status and gender Male full-time 27 73 240
Female full-time 20 80 270
Male part-time [27] [73] 39
Female part-time 30 70 185
Level of responsibility Manager/supervisor 28 72 308
Not manager/supervisor 24 76 428
Time with current employer Less than 12 months 29 71 52
1 year to 4 years 30 70 195
5 to 9 years 25 75 190
10 years or more 22 78 304
Tenure Permanent 25 75 683
287
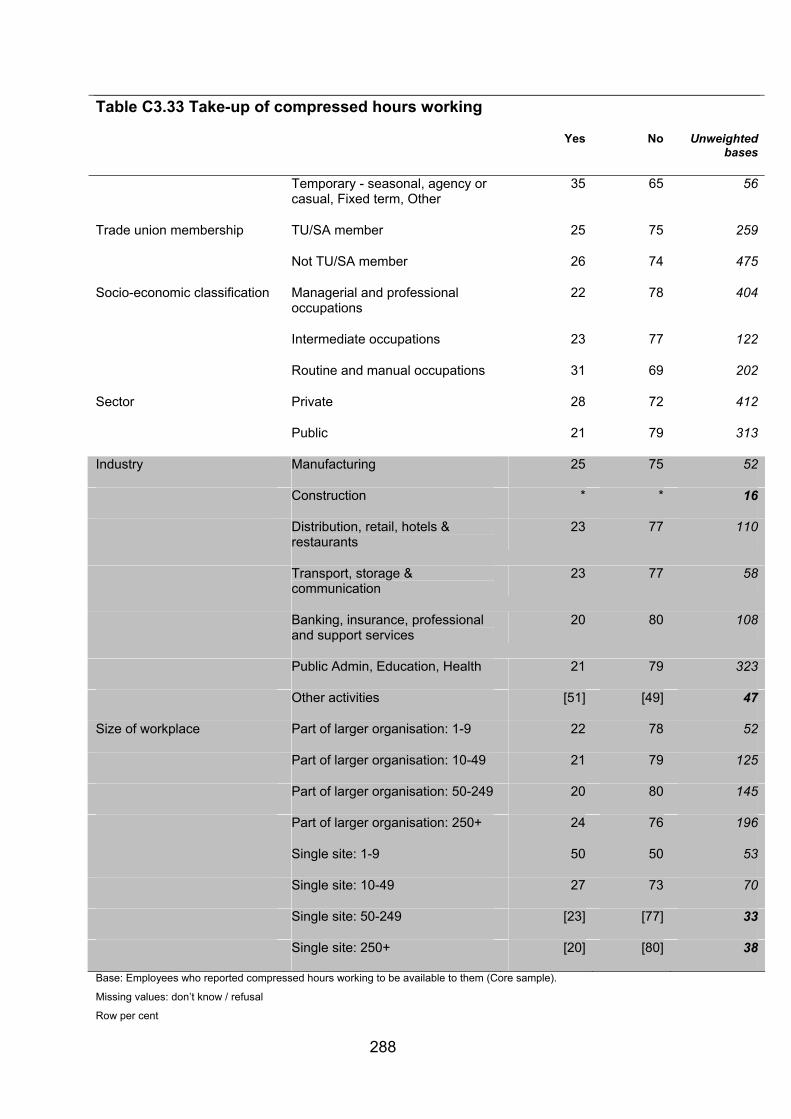
Table C3.33 Take-up of compressed hours working
Yes No Unweighted bases
Temporary - seasonal, agency or casual, Fixed term, Other
35 65 56
Trade union membership TU/SA member 25 75 259
Not TU/SA member 26 74 475
Socio-economic classification Managerial and professional occupations
22 78 404
Intermediate occupations 23 77 122
Routine and manual occupations 31 69 202
Sector Private 28 72 412
Public 21 79 313
Industry Manufacturing 25 75 52
Construction * * 16
Distribution, retail, hotels & restaurants
23 77 110
Transport, storage & communication
23 77 58
Banking, insurance, professional and support services
20 80 108
Public Admin, Education, Health 21 79 323
Other activities [51] [49] 47
Size of workplace Part of larger organisation: 1-9 22 78 52
Part of larger organisation: 10-49 21 79 125
Part of larger organisation: 50-249 20 80 145
Part of larger organisation: 250+ 24 76 196
Single site: 1-9 50 50 53
Single site: 10-49 27 73 70
Single site: 50-249 [23] [77] 33
Single site: 250+ [20] [80] 38
Base: Employees who reported compressed hours working to be available to them (Core sample).
Missing values: don’t know / refusal
Row per cent
288

Table C3.34 Take-up of compressed hours working among parents
Yes No Unweighted bases
Parent employees 24 76 530
Gender and parent status Male with dependent children 22 78 207
Female with dependent children 26 74 323
Family status Lone parent 15 85 93
Couple parent 25 75 434
Gender and partnership status Coupled mother 28 72 243
Lone mother 19 81 78
Coupled father 23 77 191
Lone father * * 15
Family employment status Lone parent earner with children 15 85 93
Single earner couple with children 23 77 96
Dual earner couple with children 26 74 338
Age of youngest child Dependent children under 6 29 71 233
Dependent children of 6 and over 20 80 297
Base: Parent employees who reported compressed hours working to be available to them (Core and Boost sample).
Missing values: don’t know / refusal
Row per cent
289

Table C3.35 Take-up of compressed hours working among carers
Yes No Unweighted bases
Carer employees 23 77 349
Carer status Yes, child [20] [80] 37
Yes, relative in any household or non-relative adult in this household 24 76 278
Yes, non-relative adult in another household [13] [87] 34
Gender Female 25 75 231
Male 19 81 118
Age 16-39 24 76 62
40-49 23 77 121
50+ 21 79 163
Base: Carer employees who reported compressed hours working to be available to them (Core and Boost sample).
Some categories collapsed due to small cell sizes
Missing values: don’t know / refusal
Row per cent
290

Table C3.36 Take-up of temporarily reduced hours working
Yes No Unweighted bases
All employees 14 86 1080
Gender Female 17 83 658
Male 12 88 422
Age 16-24 24 76 55
25-39 12 88 264
40-49 13 87 354
50-59 14 86 292
60+ 13 87 96
Ethnicity White 14 86 992
Non-white 21 79 76
Parental status Parent 15 85 438
Non-parent 14 86 642
Highest qualification level None 20 80 77
GCSEs/O Level/CSEs 17 83 193
A Levels 14 86 174
Degree/Professional qualifications 12 88 224
Postgraduate degree 13 87 180
Other vocational or academic qualifications, level not specified
15 85 148
Other 16 84 65
Household income Under £15,000 29 71 76
£15,000 - £24,999 16 84 156
£25,000 - £34,999 13 87 129
£35,000 - £44,999 11 89 127
£45,000 or more 13 87 342
Carer status Yes, child * * 17
291
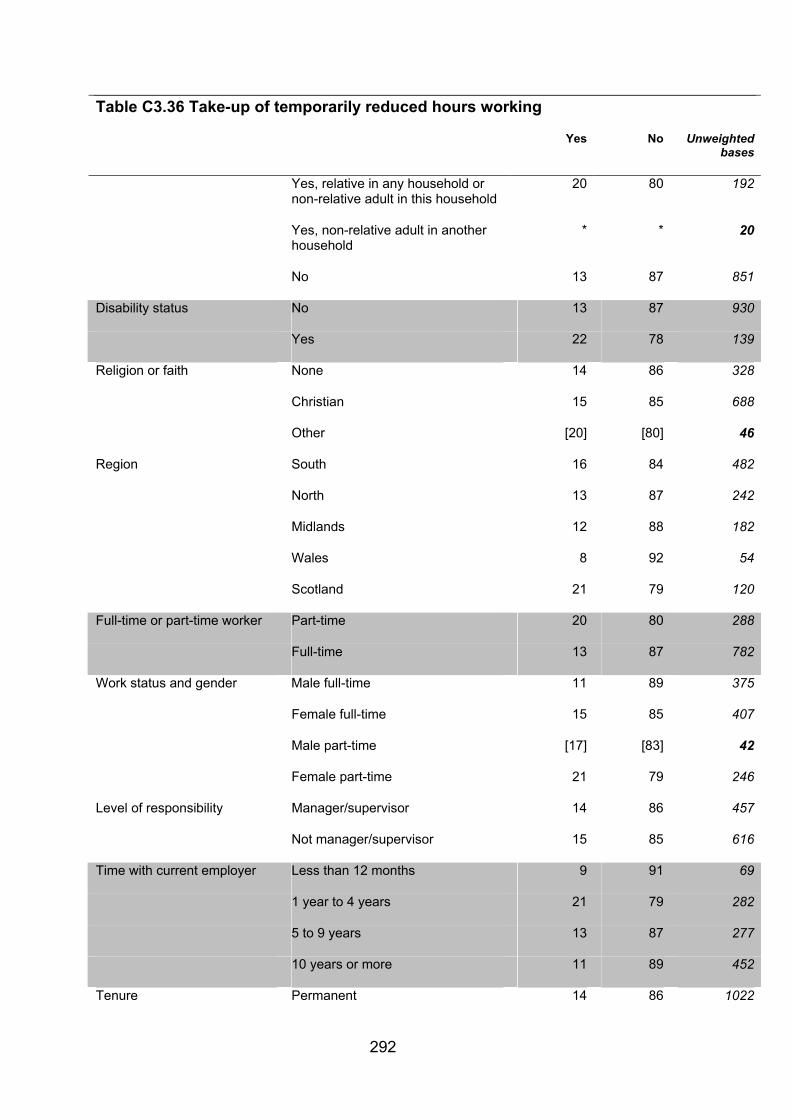
Table C3.36 Take-up of temporarily reduced hours working
Yes No Unweighted bases
Yes, relative in any household or non-relative adult in this household
20 80 192
Yes, non-relative adult in another household
* * 20
No 13 87 851
Disability status No 13 87 930
Yes 22 78 139
Religion or faith None 14 86 328
Christian 15 85 688
Other [20] [80] 46
Region South 16 84 482
North 13 87 242
Midlands 12 88 182
Wales 8 92 54
Scotland 21 79 120
Full-time or part-time worker Part-time 20 80 288
Full-time 13 87 782
Work status and gender Male full-time 11 89 375
Female full-time 15 85 407
Male part-time [17] [83] 42
Female part-time 21 79 246
Level of responsibility Manager/supervisor 14 86 457
Not manager/supervisor 15 85 616
Time with current employer Less than 12 months 9 91 69
1 year to 4 years 21 79 282
5 to 9 years 13 87 277
10 years or more 11 89 452
Tenure Permanent 14 86 1022
292

Table C3.36 Take-up of temporarily reduced hours working
Yes No Unweighted bases
Temporary - seasonal, agency or casual, Fixed term, Other
19 81 56
Trade union membership TU/SA member 10 90 399
Not TU/SA member 17 83 672
Socio-economic classification Managerial and professional occupations
9 91 583
Intermediate occupations 15 85 156
Routine and manual occupations 22 78 329
Sector Private 16 84 626
Public 11 89 438
Industry Manufacturing 12 88 98
Construction [7] [93] 26
Distribution, retail, hotels & restaurants
23 77 157
Transport, storage & communication
13 87 92
Banking, insurance, professional and support services
14 86 149
Public Admin, Education, Health 12 88 466
Other activities 20 80 65
Size of workplace Part of larger organisation: 1-9 12 88 77
Part of larger organisation: 10-49 17 83 187
Part of larger organisation: 50-249 9 91 230
Part of larger organisation: 250+ 9 91 259
Single site: 1-9 29 71 67
Single site: 10-49 25 75 117
Single site: 50-249 11 89 61
Single site: 250+ [12] [88] 49
Base: Employees who reported reduced hours working to be available to them (Core sample).
Missing values: don’t know / refusal
Row per cent
293

Table C3.37 Take-up of temporarily reduced hours working among parents
Yes No Unweighted bases
Parent employees 15 85 781
Gender and parent status Male with dependent children 14 86 297
Female with dependent children 16 84 484
Family status Lone parent 20 80 128
Couple parent 14 86 648
Gender and partnership status Coupled mother 15 85 369
Lone mother 20 80 112
Coupled father 14 86 279
Lone father * * 16
Family employment status Lone parent earner with children 20 80 128
Single earner couple with children 10 90 154
Age of youngest child Dependent children under 6 14 86 308
Dependent children of 6 and over 15 85 471
Base: Parent employees who reported reduced hours working to be available to them (Core and Boost sample).
Missing values: don’t know / refusal
Row per cent
294
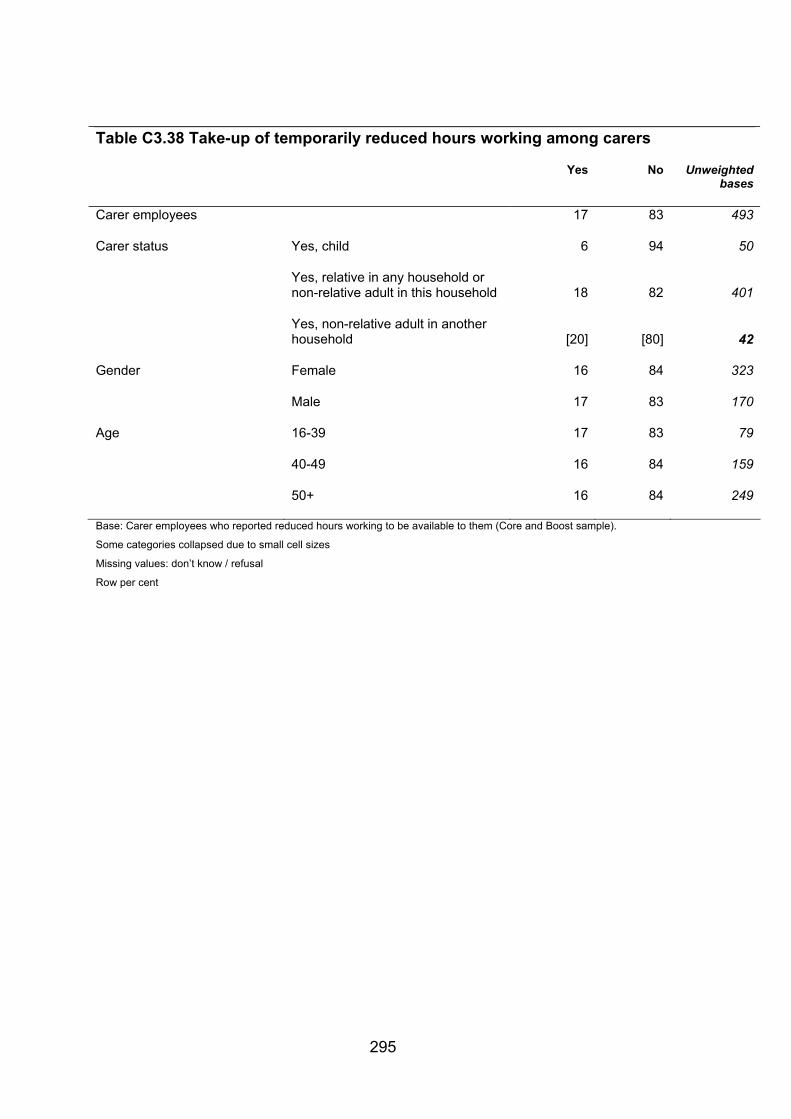
Table C3.38 Take-up of temporarily reduced hours working among carers
Yes No Unweighted bases
Carer employees 17 83 493
Carer status Yes, child 6 94 50
Yes, relative in any household or non-relative adult in this household 18 82 401
Yes, non-relative adult in another household [20] [80] 42
Gender Female 16 84 323
Male 17 83 170
Age 16-39 17 83 79
40-49 16 84 159
50+ 16 84 249
Base: Carer employees who reported reduced hours working to be available to them (Core and Boost sample).
Some categories collapsed due to small cell sizes
Missing values: don’t know / refusal
Row per cent
295

Table C3.39 Take-up of job-share working
Yes No Unweighted bases
All employees 9 91 885
Gender Female 10 90 599
Male 7 93 599
Age 16-39 11 89 269
40-49 7 93 276
50-59 6 94 248
60+ 12 88 77
Ethnicity White 9 91 800
Non-white 13 87 71
Parental status Parent 11 89 379
Non-parent 8 92 506
Highest qualification level None 13 87 54
GCSEs/O Level/CSEs 13 87 154
A Levels 12 88 132
Degree/Professional qualifications
5 95 202
Postgraduate degree 3 97 165
Other vocational or academic qualifications, level not specified
12 88 124
Other [9] [91] 37
Household income Under £15,000 15 85 67
£15,000 - £24,999 16 84 116
£25,000 - £34,999 6 94 115
£35,000 - £44,999 11 89 107
£45,000 or more 5 95 277
Disability status No 9 91 762
Yes 11 89 114
Religion or faith None 11 89 255
296
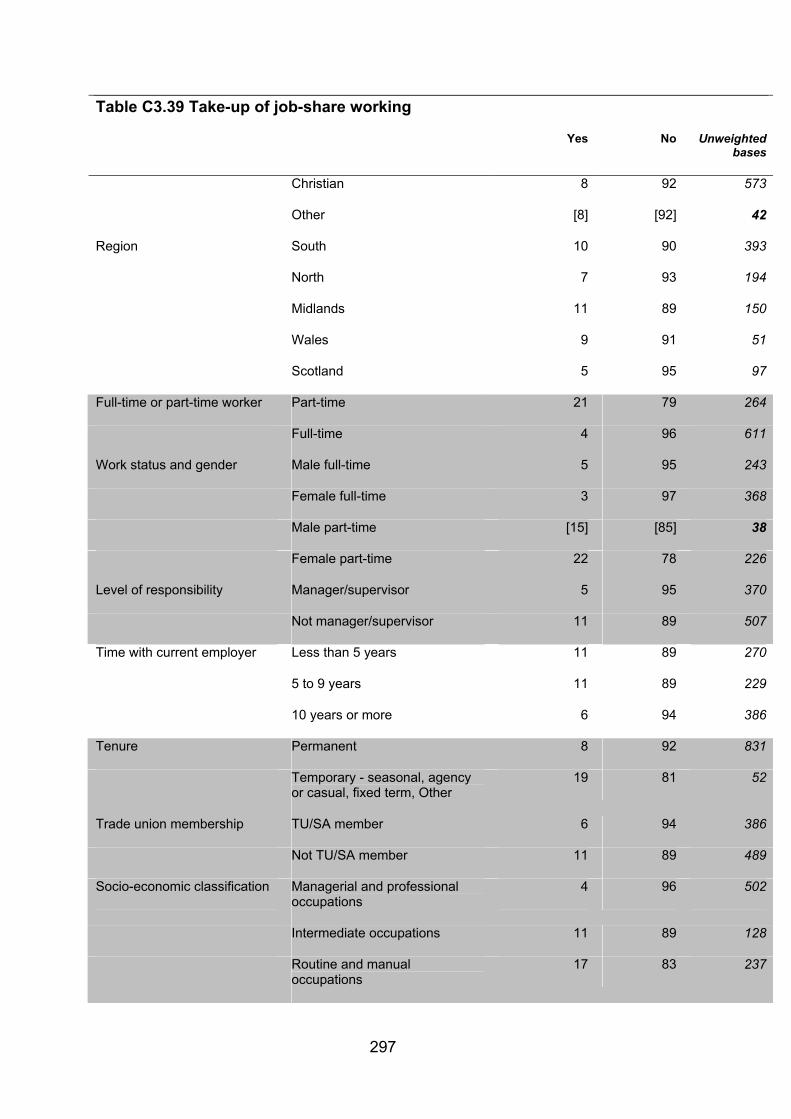
Table C3.39 Take-up of job-share working
Yes No Unweighted bases
Christian 8 92 573
Other [8] [92] 42
Region South 10 90 393
North 7 93 194
Midlands 11 89 150
Wales 9 91 51
Scotland 5 95 97
Full-time or part-time worker Part-time 21 79 264
Full-time 4 96 611
Work status and gender Male full-time 5 95 243
Female full-time 3 97 368
Male part-time [15] [85] 38
Female part-time 22 78 226
Level of responsibility Manager/supervisor 5 95 370
Not manager/supervisor 11 89 507
Time with current employer Less than 5 years 11 89 270
5 to 9 years 11 89 229
10 years or more 6 94 386
Tenure Permanent 8 92 831
Temporary - seasonal, agency or casual, fixed term, Other
19 81 52
Trade union membership TU/SA member 6 94 386
Not TU/SA member 11 89 489
Socio-economic classification Managerial and professional occupations
4 96 502
Intermediate occupations 11 89 128
Routine and manual occupations
17 83 237
297
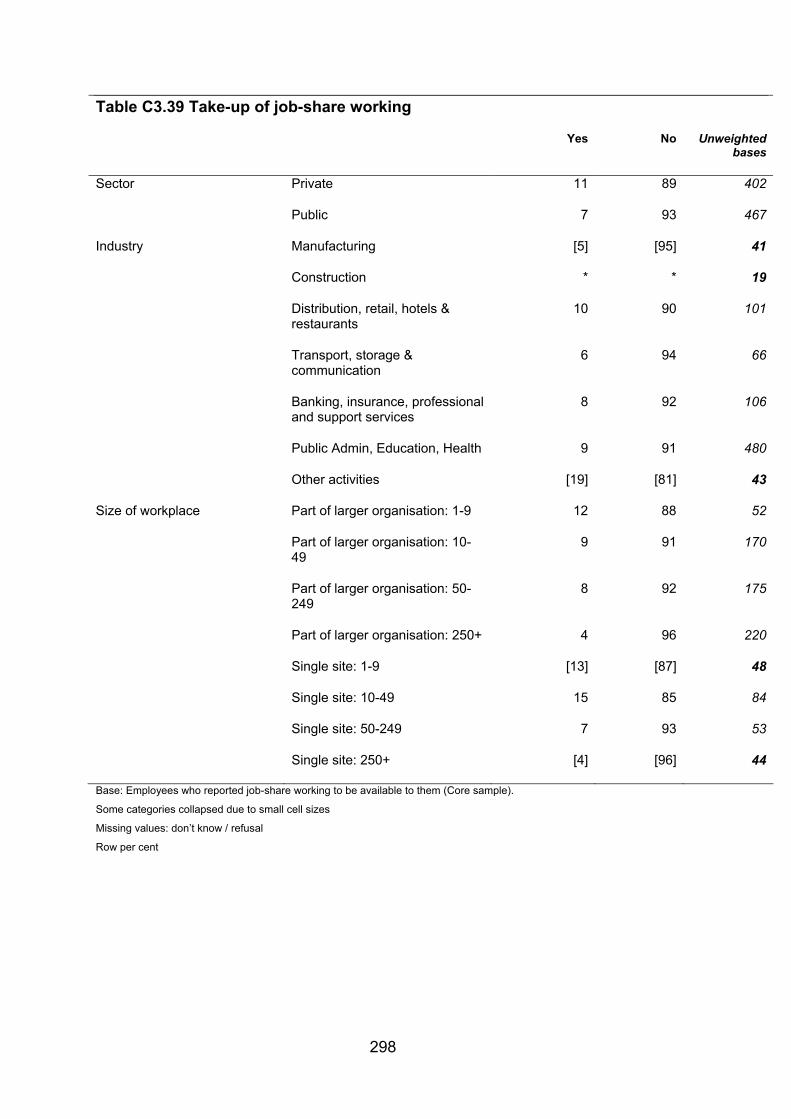
Table C3.39 Take-up of job-share working
Yes No Unweighted bases
Sector Private 11 89 402
Public 7 93 467
Industry Manufacturing [5] [95] 41
Construction * * 19
Distribution, retail, hotels & restaurants
10 90 101
Transport, storage & communication
6 94 66
Banking, insurance, professional and support services
8 92 106
Public Admin, Education, Health 9 91 480
Other activities [19] [81] 43
Size of workplace Part of larger organisation: 1-9 12 88 52
Part of larger organisation: 10-49
9 91 170
Part of larger organisation: 50-249
8 92 175
Part of larger organisation: 250+ 4 96 220
Single site: 1-9 [13] [87] 48
Single site: 10-49 15 85 84
Single site: 50-249 7 93 53
Single site: 250+ [4] [96] 44
Base: Employees who reported job-share working to be available to them (Core sample).
Some categories collapsed due to small cell sizes
Missing values: don’t know / refusal
Row per cent
298

Table C3.40 Take-up of job-share working among parents
Yes No Unweighted bases
10 90Parent employees 664
Gender and parent status Male with dependent children 4 96 216
Female with dependent children 14 86 448
Family status Lone parent 14 86 123
Couple parent 9 91 536
Gender and partnership status Coupled mother 14 86 332
Lone mother 12 88 112
Coupled father 4 96 204
Lone father * * 11
Family employment status Lone parent earner with children 14 86 123
Single earner couple with children
5 95 119
Dual earner couple with children 10 90 415
Age of youngest child Dependent children under 6 13 87 278
Dependent children of 6 and over 8 92 384
Base: Parent employees who reported job-share working to be available to them (Core and Boost sample).
Missing values: don’t know / refusal
Row per cent
299

Table C3.41 Take-up of job-share working among carers
Yes No Unweighted bases
Carer employees 9 91 414
Carer status Yes, child [17] [83] 39
Yes, relative in any household or non-relative adult in this household 7 93 337
Yes, non-relative adult in another household [15] [85] 38
Gender Female 9 91 292
Male 8 92 122
Age 16-39 14 86 58
40-49 5 95 140
50+ 8 92 209
Base: Carer employees who reported job-share working to be available to them (Core and Boost sample).
Some categories collapsed due to small cell sizes
Missing values: don’t know / refusal
Row per cent
300

Table C3.42 Made a request to change regular working arrangements in the past 2 years
Yes No Unweighted bases
All employees 22 78 1870
Gender Female 28 72 1095
Male 17 83 775
Age 16-24 21 79 111
25-39 26 74 491
40-49 21 79 554
50-59 18 82 501
60+ 21 79 179
Ethnicity White 22 78 1691
Non-white 24 76 150
Parental status Parent 27 73 773
Non-parent 19 81 1097
Highest qualification level None 17 83 152
GCSEs/O Level/CSEs 19 81 372
A Levels 23 77 293
Degree/Professional qualifications 24 76 358
Postgraduate degree 23 77 283
Other vocational or academic qualifications, level not specified
25 75 254
Other 23 77 119
Household income Under £15,000 31 69 160
£15,000 - £24,999 26 74 268
£25,000 - £34,999 21 79 245
£35,000 - £44,999 25 75 213
£45,000 or more 23 77 506
Carer status Yes, child [23] [77] 33
301

Table C3.42 Made a request to change regular working arrangements in the past 2 years
Yes No Unweighted bases
Yes, relative in any household or non-relative adult in this household
30 70 315
Yes, non-relative adult in another household
[15] [85] 33
No 21 79 1489
Disability status No 22 78 1593
Yes 26 74 251
Religion or faith None 26 74 565
Christian 20 80 1173
Other 17 83 99
Region South 25 75 848
North 20 80 414
Midlands 22 78 312
Wales 16 84 107
Scotland 17 83 189
Full-time or part-time worker Part-time 31 69 536
Full-time 19 81 1315
Level of responsibility Manager/supervisor 22 78 693
Not manager/supervisor 22 78 1159
Time with current employer Less than 6 months 17 83 85
6 to 11 months 19 81 54
1 year to 4 years 23 77 538
5 to 9 years 25 75 475
10 years or more 20 80 718
Flexible worker status Part-time only 32 68 251
Part-time and flexible working 38 62 363
Flexible working other than part-time
20 80 449
302

Table C3.42 Made a request to change regular working arrangements in the past 2 years
Yes No Unweighted bases
No part-time or flexible working 14 86 597
Tenure Permanent 22 78 1747
Temporary - seasonal, agency or casual, Fixed term, Other
19 81 119
Trade union membership TU/SA member 22 78 632
Not TU/SA member 22 78 1214
Socio-economic classification Managerial and professional occupations
22 78 889
Intermediate occupations 26 74 274
Routine and manual occupations 22 78 672
Sector Private 21 79 1133
Public 25 75 693
Industry Manufacturing 15 85 183
Construction 11 89 58
Distribution, retail, hotels & restaurants
23 77 306
Transport, storage & communication
24 76 147
Banking, insurance, professional and support services
19 81 236
Public Admin, Education, Health 26 74 762
Other activities 27 73 112
Size of workplace Part of larger organisation: 1-9 21 79 146
Part of larger organisation: 10-49 28 72 359
Part of larger organisation: 50-249 18 82 374
Part of larger organisation: 250+ 23 77 386
Single site: 1-9 14 86 122
Single site: 10-49 23 77 212
Single site: 50-249 18 82 111
303

Table C3.42 Made a request to change regular working arrangements in the past 2 years
Yes No Unweighted bases
Single site: 250+ 26 74 78
Gender make-up of workplace Mostly women 26 74 725
Mostly men 16 84 494
About half women and half men 24 76 628
Base: All employees (Core sample).
Missing values: don’t know / refusal
Row per cent.
304

Table C3.43 Outcome of request to change working arrangements in last two years
Accepted Accepted after
negotiation, compromise or appeal
Awaiting the
outcome or decision
Declined or declined
after appeal
Unweighted bases
All employees 61 18 8 13 435
Gender Female 62 19 9 10 310
Male 60 17 5 18 125
Age 16-39 62 19 7 12 161
40-49 58 20 4 18 130
50+ 61 17 11 11 138
Ethnicity White 63 18 7 12 393
Non-white [44] [21] [17] [18] 37
Parental status Parent 62 20 7 11 211
Non-parent 60 17 8 15 224
Highest qualification level
None [73] [7] [13] [6] 28
GCSEs/O Level/CSEs
67 15 5 13 82
A Levels 54 28 9 9 68
Degree/Professional qualifications
60 15 6 18 91
Postgraduate degree
55 18 8 19 70
Other vocational or academic qualifications, level not specified
65 20 6 8 65
Other [62] [16] [13] [9] 25
Household income Under £25,000 56 18 12 14 112
£25,000 - £44,999
60 22 5 14 106
305

Table C3.43 Outcome of request to change working arrangements in last two years
Accepted Accepted after
negotiation, compromise or appeal
Awaiting the
outcome or decision
Declined or declined
after appeal
Unweighted bases
£45,000 or more 61 21 7 11 124
Carer status Yes, child * * * * 8
Yes, relative in any household or non-relative adult in this household
66 17 6 11 102
Yes, non-relative adult in another household
* * 4
No 60 19 8 13 321
Disability status No 60 19 8 14 362
Yes 68 16 9 8 69
Religion or faith None 61 21 7 12 153
Christian 61 19 6 14 254
Other * * * * 20
Region South 62 17 7 14 212
North 58 24 2 16 96
Midlands 63 20 9 8 72
Wales * * * * 18
Scotland [58] [8] [23] [11] 37
Full-time or part-time worker
Part-time 68 20 5 8 166
Full-time 57 17 10 16 266
Level of responsibility
Manager/supervisor
62 21 5 12 160
Not manager/supervisor
60 17 9 14 271
Time with current Less than 5 61 16 10 12 153
306

Table C3.43 Outcome of request to change working arrangements in last two years
Accepted Accepted after
negotiation, compromise or appeal
Awaiting the
outcome or decision
Declined or declined
after appeal
Unweighted bases
employer years
5 to 9 years 58 24 5 13 125
10 years or more
63 16 7 13 157
Flexible worker status
Part-time only 53 25 8 13 83
Part-time and flexible working
78 14 4 5 132
Flexible working other than part-time
60 16 8 15 94
No part-time or flexible working
45 23 9 22 92
Trade union membership
TU/SA member 59 18 9 13 151
Not TU/SA member
61 19 7 13 276
Socio-economic classification
Managerial and professional occupations
58 19 6 17 212
Intermediate occupations
61 20 9 10 73
Routine and manual occupations
64 17 9 10 146
Sector Private 62 19 7 11 239
Public 58 16 9 17 186
Industry Manufacturing [62] [23] [9] [6] 28
Construction * * * 8
Distribution, retail, hotels & restaurants
62 20 7 12 69
Transport, storage &
[48] [27] [12] [12] 33
307
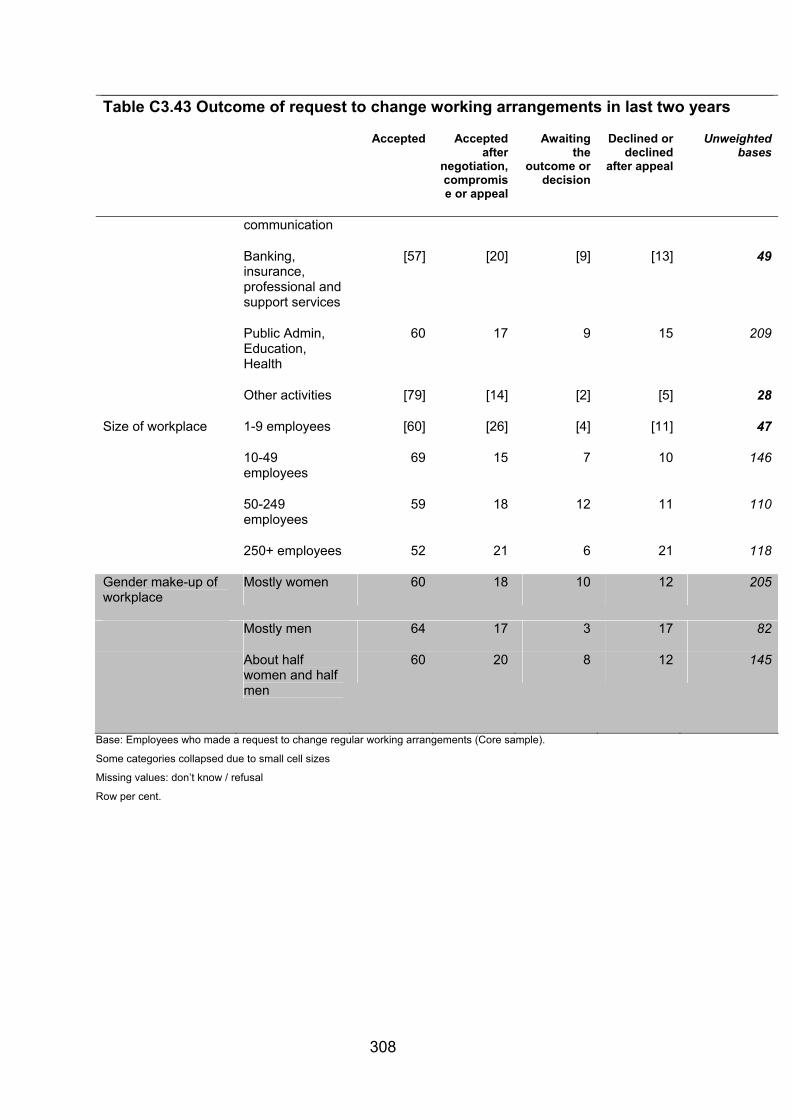
Table C3.43 Outcome of request to change working arrangements in last two years
Accepted Accepted after
negotiation, compromise or appeal
Awaiting the
outcome or decision
Declined or declined
after appeal
Unweighted bases
communication
Banking, insurance, professional and support services
[57] [20] [9] [13] 49
Public Admin, Education, Health
60 17 9 15 209
Other activities [79] [14] [2] [5] 28
Size of workplace 1-9 employees [60] [26] [4] [11] 47
10-49 employees
69 15 7 10 146
50-249 employees
59 18 12 11 110
250+ employees 52 21 6 21 118
Gender make-up of workplace
Mostly women 60 18 10 12 205
Mostly men 64 17 3 17 82
About half women and half men
60 20 8 12 145
Base: Employees who made a request to change regular working arrangements (Core sample).
Some categories collapsed due to small cell sizes
Missing values: don’t know / refusal
Row per cent.
308

Table C3.44 Communication of outcome of request
Formal (written) Informal (spoken)
Unweighted bases
All employees 30 70 395
Gender Female 38 62 280
Male 18 82 115
Age 16-39 33 67 149
40-49 29 71 121
50+ 25 75 120
Ethnicity White 29 71 359
Non-white [50] [50] 31
Parental status
Parent 36 64 194
Non-parent 25 75 201
Highest qualification level
None [19] [81] 25
GCSEs/O Level/CSEs 19 81 78
A Levels 34 66 60
Degree/Professional qualifications
32 68 83
Postgraduate degree 35 65 62
Other vocational or academic qualifications, level not specified
38 62 58
Other * * 24
Household income
Under £25,000 33 67 98
£25,000 - £44,999 35 65 98
£45,000 or more 32 68 115
Carer status Yes, child * * 6
Yes, relative in any household or non-relative adult in this
36 64 94
309

Table C3.44 Communication of outcome of request
Formal (written) Informal (spoken)
Unweighted bases
household
Yes, non-relative adult in another household
* 3
No 28 72 292
Disability status
No 30 70 330
Yes 34 66 61
Religion or faith
None 32 68 139
Christian 29 71 232
Other * * 16
Region South 29 71 199
North 33 67 91
Midlands 28 72 60
Wales * * 16
Scotland [35] [65] 29
Full-time or part-time worker
Part-time 31 69 156
Full-time 30 70 236
Level of responsibility
Manager/supervisor 29 71 147
Not manager/supervisor 31 69 244
Time with current employer
Less than 5 years 27 73 135
5 to 9 years 34 66 117
10 years or more 31 69 143
Flexible worker status
Part-time only 31 69 77
Part-time and flexible working
33 67 124
310

Table C3.44 Communication of outcome of request
Formal (written) Informal (spoken)
Unweighted bases
Flexible working other than part-time
29 71 82
No part-time or flexible working
27 73 83
Trade union membership
TU/SA member 41 59 136
Not TU/SA member 27 73 252
Socio-economic classification
Managerial and professional occupations
38 62 194
Intermediate occupations
35 65 66
Routine and manual occupations
20 80 131
Sector Private 25 75 218
Public 41 59 167
Industry Manufacturing [24] [76] 26
Construction * * 8
Distribution, retail, hotels & restaurants
14 86 63
Transport, storage & communication
[35] [65] 30
Banking, insurance, professional and support services
[39] [61] 43
Public Admin, Education, Health
37 63 187
Other activities [28] [72] 27
Size of workplace
1-9 employees [28] [72] 42
10-49 employees 21 79 132
50-249 employees 36 64 100
250+ employees 37 63 110
311

Table C3.44 Communication of outcome of request
Formal (written) Informal (spoken)
Unweighted bases
Gender make-up of workplace
Mostly women 36 64 181
Mostly men 24 76 77
About half women and half men
28 72 134
Base: Employees who made a request to change regular working arrangements (Core sample).
Some categories collapsed due to small cell sizes
Missing values: don’t know / refusal
Row per cent.
312

Table C3.45 Reason for not making request to work change working arrangements
Personal reasons
Business/ employer
reasons
Both personal
and business/ employer
reasons
Other Unweighted bases
All employees 84 12 3 1 1399
Gender Female 86 11 2 0 768
Male 82 13 4 1 768
Age 16-24 88 9 2 1 84
25-39 84 12 3 0 349
40-49 85 11 3 0 413
50-59 79 17 3 1 395
60+ 85 10 4 1 133
Ethnicity White 84 12 3 1 1267
Non-white 85 14 1 111
Parental status
Parent 85 12 3 1 543
Non-parent 84 13 3 0 856
Highest qualification level
None 82 8 8 2 121
GCSEs/O Level/CSEs
84 11 3 2 286
A Levels 91 7 1 1 221
Degree/Professional qualifications
83 15 1 260
Postgraduate degree
79 17 4 204
Other vocational or academic qualifications, level not specified
82 16 2 185
Other 79 14 6 0 91
313

Table C3.45 Reason for not making request to work change working arrangements
Personal reasons
Business/ employer
reasons
Both personal
and business/ employer
reasons
Other Unweighted bases
Household income
Under £15,000 80 17 3 113
£15,000 - £24,999 84 12 2 1 196
£25,000 - £34,999 81 14 4 1 190
£35,000 - £44,999 86 8 5 1 156
£45,000 or more 85 12 3 1 369
Carer status Yes, child [89] [1] [10] 25
Yes, relative in any household or non-relative adult in this household
81 14 5 209
Yes, non-relative adult in another household
[94] [2] [4] 27
No 84 13 3 1 1138
Disability status
No 85 12 3 1 1202
Yes 77 19 4 0 177
Religion or faith
None 81 14 4 1 402
Christian 85 12 3 0 898
Other 89 9 2 76
Region South 82 14 3 1 617
North 84 12 3 0 311
Midlands 87 9 3 0 236
Wales 83 9 6 1 88
Scotland 86 11 3 1 147
Full-time or part-time
Part-time 91 7 2 365
314

Table C3.45 Reason for not making request to work change working arrangements
Personal reasons
Business/ employer
reasons
Both personal
and business/ employer
reasons
Other Unweighted bases
worker
Full-time 82 14 3 1 1019
Level of responsibility
Manager/ 82 13 4 1 518
supervisor
Not manager 85 12 3 1 869
/supervisor
Time with current employer
Less than 12 months
86 10 3 105
1 year to 4 years 84 13 3 1 402
5 to 9 years 82 14 4 0 345
10 years or more 85 12 3 1 547
Flexible worker status
Part-time only 85 13 2 165
Part-time and flexible working
92 7 1 228
Flexible working other than part-time
90 8 1 0 344
No part-time or flexible working
80 15 5 1 491
Tenure Permanent 85 12 3 1 1299
Temporary - seasonal, agency or casual, Fixed term, Other
76 21 3 98
Trade union membership
TU/SA member 80 14 4 1 475
Not TU/SA member 85 12 2 1 910
Socio-economic
Managerial and professional
83 14 3 1 656
315

Table C3.45 Reason for not making request to work change working arrangements
Personal reasons
Business/ employer
reasons
Both personal
and business/ employer
reasons
Other Unweighted bases
classification occupations
Intermediate occupations
86 12 2 199
Routine and manual occupations
85 11 3 1 518
Sector Private 84 12 3 1 873
Public 83 14 3 0 498
Industry Manufacturing 80 12 7 1 152
Construction [83] [14] 3 48
Distribution, retail, hotels & restaurants
91 7 2 1 230
Transport, storage & communication
85 12 3 110
Banking, insurance, professional and support services
83 13 3 1 182
Public Admin, Education, Health
82 15 3 0 542
Other activities 82 13 3 2 84
Size of workplace
Part of larger organisation: 1-9
87 9 4 117
Part of larger organisation: 10-49
84 13 3 1 258
Part of larger organisation: 50-249
82 16 1 1 284
Part of larger organisation: 250+
80 15 5 0 277
Single site: 1-9 89 8 2 99
316

Table C3.45 Reason for not making request to work change working arrangements
Personal reasons
Business/ employer
reasons
Both personal
and business/ employer
reasons
Other Unweighted bases
Single site: 10-49 88 8 4 1 158
Single site: 50-249 76 18 6 86
Single site: 250+ 92 3 5 59
Gender make-up of workplace
Mostly women 87 11 2 0 505
Mostly men 81 13 4 2 404
About half women and half men
84 14 2 472
Base: Employees who did not make a request in past 2 years (Core sample).
Missing values: don’t know / refusal
Row per cent.
317

Table C4.1 Importance of availability of flexible working arrangements when initially deciding to work for employer
Very important
Quite important
Not important
Unweighted bases
All employees (core sample) 23 18 58 1858
Female 33 20 47 1089Gender
Male 14 17 70 769
Age 16-24 26 23 51 111
25-39 21 19 60 489
40-49 28 16 55 550
50-59 20 16 64 501
60+ 21 20 59 175
White 23 18 60 1681Ethnicity
Non-white 31 26 43 149
Parent 32 17 51 769Parental status
Non-parent 18 19 62 1089
Highest qualification level
None 21 20 59 150
GCSEs/O Level/CSEs 21 22 57 371
A Levels 23 19 58 290
Degree/Professional qualifications 26 15 58 355
Postgraduate degree 21 16 62 283
Other vocational or academic qualifications, level not specified
23 19 58 253
Other 32 15 53 117
Under £15,000 32 25 43 159
£15,000 - £24,999 29 18 53 266
£25,000 - £34,999 21 19 60 245
Household income
£35,000 - £44,999 27 15 58 213
£45,000 or more 18 14 68 503
318
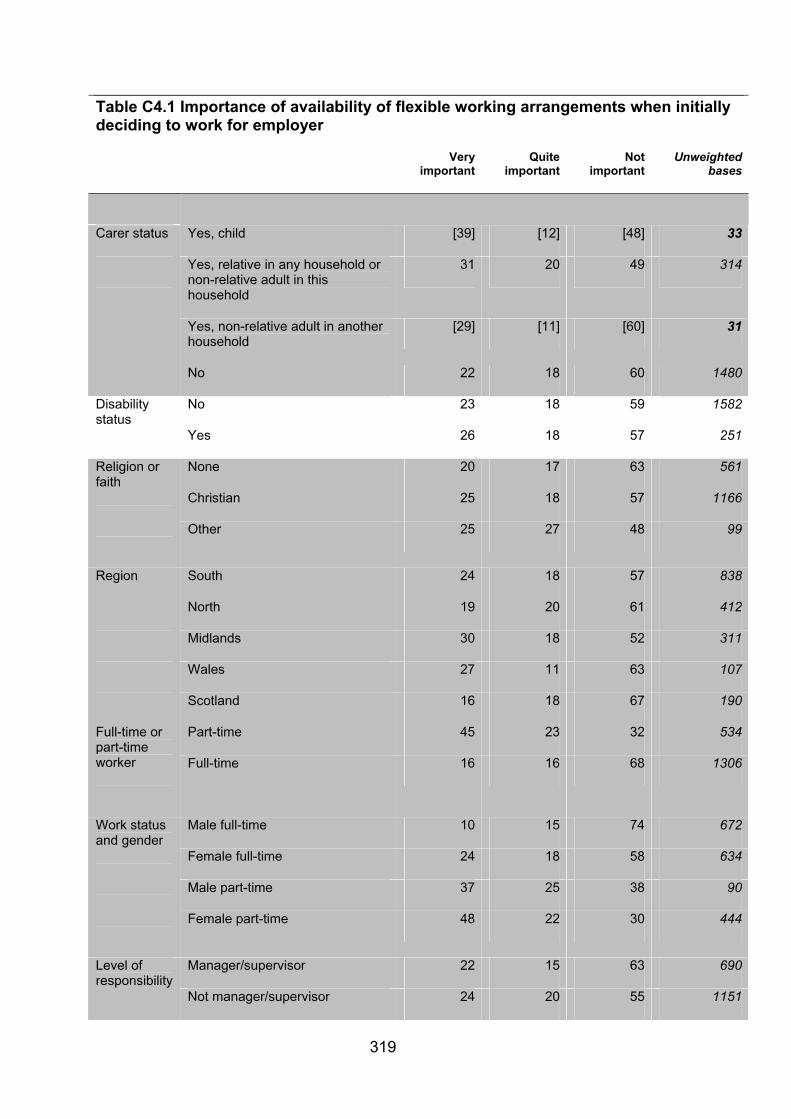
Table C4.1 Importance of availability of flexible working arrangements when initially deciding to work for employer
Very important
Quite important
Not important
Unweighted bases
Yes, child [39] [12] [48] 33
Yes, relative in any household or non-relative adult in this household
31 20 49 314
Carer status
Yes, non-relative adult in another household
[29] [11] [60] 31
No 22 18 60 1480
Disability status
No 23 18 59 1582
Yes 26 18 57 251
None 20 17 63 561Religion or faith
Christian 25 18 57 1166
Other 25 27 48 99
South 24 18 57 838
North 19 20 61 412
Midlands 30 18 52 311
Region
Wales 27 11 63 107
Scotland 16 18 67 190
Part-time 45 23 32 534Full-time or part-time worker
Full-time 16 16 68 1306
Male full-time 10 15 74 672
Female full-time 24 18 58 634
Work status and gender
Male part-time 37 25 38 90
Female part-time 48 22 30 444
Manager/supervisor 22 15 63 690Level of responsibility
Not manager/supervisor 24 20 55 1151
319

Table C4.1 Importance of availability of flexible working arrangements when initially deciding to work for employer
Very important
Quite important
Not important
Unweighted bases
Less than 6 months 27 16 58 84
6 to 11 months 31 6 63 54
1 year to 4 years 25 23 52 535
Time with current employer
5 to 9 years 23 19 58 470
10 years or more 20 14 66 715
Part-time only 39 26 35 250
Part-time and flexible working 45 17 39 361
Flexible worker status
Flexible working other than part-time
21 20 59 446
No part-time or flexible working 13 15 72 593
Tenure Permanent 24 18 59 1736
Temporary - seasonal, agency or casual
[24] [27] [50] 34
Fixed term 19 15 66 69
Other * * * 15
Trade union membership
TU/SA member 23 15 62 630
Not TU/SA member 24 19 57 1205
Managerial and professional occupations
22 14 63 885Socio-economic classification
Intermediate occupations 25 18 57 274
Routine and manual occupations 24 22 53 665
Sector Private 22 19 59 1128
Public 27 16 57 689
Manufacturing 14 12 74 181Industry
Construction 6 19 75 57
320

Table C4.1 Importance of availability of flexible working arrangements when initially deciding to work for employer
Very important
Quite important
Not important
Unweighted bases
Distribution, retail, hotels & restaurants
30 26 44 304
Transport, storage & communication
13 11 76 148
Banking, insurance, professional and support services
20 16 64 236
Public Admin, Education, Health 29 19 52 757
Other activities 25 18 57 111
Size of workplace
Part of larger organisation: 1-9 30 12 58 144
Part of larger organisation: 10-49 27 20 53 358
Part of larger organisation: 50-249 18 20 61 371
Part of larger organisation: 250+ 18 15 67 384
Single site: 1-9 33 18 48 122
Single site: 10-49 27 20 53 211
Single site: 50-249 20 17 64 111
Single site: 250+ 22 22 57 77
Base: All employees (Core sample)
Missing values: don’t know / refusal
Row per cent
321

Table C4.2 Importance of availability of flexible working arrangements when initially deciding to work for employer - parents
Very important
Quite important
Not important
Unweighted bases
All parent employees (boost sample) 32 16 52 1358
Male with dependent children 17 15 68 550Gender and parent status
Female with dependent children 47 17 36 808
Lone parent 46 20 34 243Family status
Couple parent 31 15 54 1102
Coupled mother 47 16 37 592
Lone mother 50 18 32 210
Gender and partnership status
Coupled father 16 14 69 510
Lone father [25] [31] [44] 33
Lone parent earner with children 46 20 34 243
Family employment status
Single earner couple with children 21 16 63 271
Dual earner couple with children 34 15 51 828
Age of youngest child
Dependent children under 6 32 14 54 578
Dependent children aged 6 to 11 35 18 47 391
Dependent children aged 12 and over 32 16 52 389
Base: All parent employees (Boost sample)
Missing values: don’t know / refusal
Row per cent
322

Table C4.3 Importance of availability of flexible working arrangements when initially deciding to work for employer - carers
Very important
Quite important
Not important
Unweighted bases
All carers (boost sample) 31 18 51 821
Carer status Child 38 14 48 85
Relative in any household or non-relative adult in this household 30 19 51 669
Non-relative adult in another household 34 18 48 67
Part-time 52 20 28 262Full-time or part-time worker
Full-time 22 18 60 551
Female 39 19 42 536Gender
Male 21 18 61 285
Parent 38 15 47 298Parental status
Non-parent 27 20 53 522
16-44 35 21 44 248
45-54 27 18 55 316
Age
55+ 28 14 59 243
Base: All carer employees (Boost sample)
Some categories collapsed due to small cell sizes
Missing values: don’t know / refusal
Row per cent
323
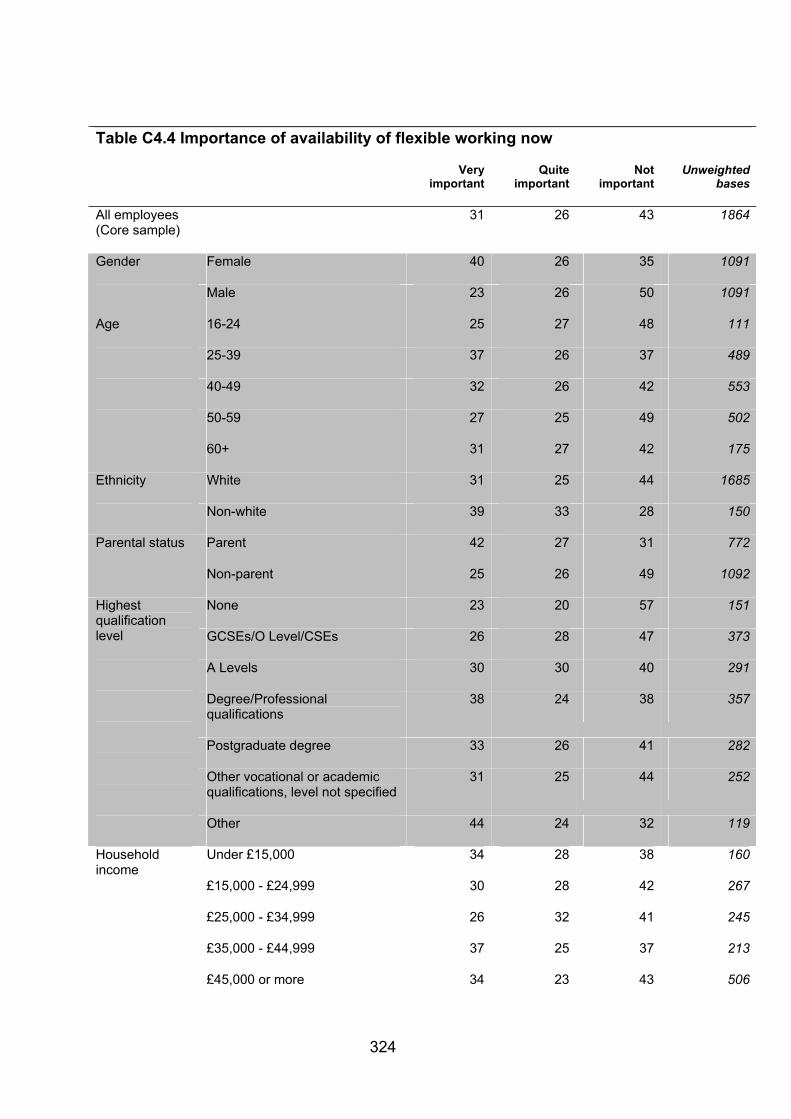
Table C4.4 Importance of availability of flexible working now
Very important
Quite important
Not important
Unweighted bases
All employees (Core sample)
31 26 43 1864
Female 40 26 35 1091Gender
Male 23 26 50 1091
16-24 25 27 48 111
25-39 37 26 37 489
40-49 32 26 42 553
Age
50-59 27 25 49 502
60+ 31 27 42 175
White 31 25 44 1685Ethnicity
Non-white 39 33 28 150
Parent 42 27 31 772Parental status
Non-parent 25 26 49 1092
None 23 20 57 151
GCSEs/O Level/CSEs 26 28 47 373
A Levels 30 30 40 291
Degree/Professional qualifications
38 24 38 357
Postgraduate degree 33 26 41 282
Highest qualification level
Other vocational or academic qualifications, level not specified
31 25 44 252
Other 44 24 32 119
Household income
Under £15,000 34 28 38 160
£15,000 - £24,999 30 28 42 267
£25,000 - £34,999 26 32 41 245
£35,000 - £44,999 37 25 37 213
£45,000 or more 34 23 43 506
324

Table C4.4 Importance of availability of flexible working now
Very important
Quite important
Not important
Unweighted bases
Yes, child [50] [19] [31] 33
Yes, relative in any household or non-relative adult in this household
40 27 33 315
Carer status
Yes, non-relative adult in another household
[38] [37] [25] 31
No 29 26 45 1485
Disability status No 31 26 43 1587
Yes 33 28 39 251
Religion or faith None 31 24 45 563
Christian 31 27 43 1170
Other 40 29 31 98
Region South 33 25 42 844
North 29 29 42 412
Midlands 34 24 43 312
Wales 27 30 43 107
Scotland 28 26 46 189
Part-time 50 28 22 534Full-time or part-time worker
Full-time 25 25 50 1312
Male full-time 21 26 54 676
Female full-time 31 24 44 636
Work status and gender
Male part-time 41 32 27 90
Female part-time 53 27 20 444
Level of responsibility
Manager/supervisor 33 25 43 694
Not manager/supervisor 31 27 42 1152
Time with current employer
Less than 6 months 30 17 53 84
6 to 11 months 37 13 50 54
325

Table C4.4 Importance of availability of flexible working now
Very important
Quite important
Not important
Unweighted bases
1 year to 4 years 32 26 42 536
5 to 9 years 33 27 39 474
10 years or more 29 28 44 716
Part-time only 41 30 29 250
Part-time and flexible working 53 25 22 361
Flexible worker status
Flexible working other than part-time
39 29 32 448
No part-time or flexible working 15 24 61 594
Tenure Permanent 31 26 43 1741
Temporary - seasonal, agency or casual
[31] [37] [32] 34
Fixed term 29 24 47 69
Other * * * 16
Trade union membership
TU/SA member 28 27 45 630
Not TU/SA member 33 25 42 1210
Socio-economic classification
Managerial and professional occupations
34 24 42 888
Intermediate occupations 37 23 40 274
Routine and manual occupations
27 29 44 667
Sector Private 29 27 44 1130
Public 37 24 39 691
Manufacturing 21 22 57 182
Construction 15 29 56 58
Distribution, retail, hotels & restaurants
35 29 36 305
Industry
Transport, storage & communication
27 26 47 149
Banking, insurance, professional and support services
30 28 42 235
326

Table C4.4 Importance of availability of flexible working now
Very important
Quite important
Not important
Unweighted bases
Public Admin, Education, Health 38 24 38 757
Other activities 31 25 44 112
Part of larger organisation: 1-9 27 30 42 144
Part of larger organisation: 10-49
33 27 41 357
Part of larger organisation: 50-249
28 26 46 373
Part of larger organisation: 250+ 33 26 42 387
Single site: 1-9 41 22 37 123
Single site: 10-49 32 25 43 210
Single site: 50-249 22 25 52 111
Size of workplace
Single site: 250+ 34 34 31 78
Base: All employees (Core sample)
Missing values: don’t know / refusal
Row per cent
327

Table C4.5 Importance of availability of flexible working now - parents
Very important
Quite important
Not important
Unweighted bases
All parent employees (boost sample) 43 27 30 1361
Male with dependent children 28 31 42 554Gender and parent status
Female with dependent children 58 23 19 807
Lone parent 50 26 23 243Family status
Couple parent 42 27 31 1105
Coupled mother 59 23 18 591
Lone mother 54 23 23 210
Gender and partnership status
Coupled father 27 31 42 514
Lone father [33] [41] [26] 33
Lone parent earner with children 50 26 23 243
Family employment status
Single earner couple with children 32 27 41 272
Dual earner couple with children 46 27 28 830
Dependent children under 6 50 25 25 579
Dependent children aged 6 to 11 44 27 29 392
Age of youngest child
Dependent children aged 12 and over 30 30 40 390
Base: All parent employees (boost sample)
Missing values: don’t know / refusal
Row per cent
328

Table C4.6 Importance of availability of flexible working arrangements now - carers
Very important
Quite important
Not important
Unweighted bases
All carers (boost sample) 40 27 33 824
Carer status Yes, child 44 21 35 85
Yes, relative in any household or non-relative adult in this household 38 28 34 671
Yes, non-relative adult in another household 51 26 23 68
Part-time 54 28 18 263Full-time or part-time worker
Full-time 34 26 40 553
Female 44 29 27 537Gender
Male 34 25 41 287
Parent 45 25 30 300Parental status
Non-parent 37 28 35 523
Age 16-24 44 28 29 248
45-54 35 30 36 318
55+ 37 23 41 244
Base: All carer employees (Boost sample)
Some categories collapsed due to small cell sizes
Missing values: don’t know / refusal
Row per cent
329

Table C4.7 Satisfaction with current working arrangements
Very satisfied
Satisfied Neither satisfied nor dis-
satisfied
Dis-satisfied
Very dis-satisfied
Unweighted bases
All employees (Core sample)
37 48 8 6 2 1873
Gender Female 40 46 6 6 2 1096
Male 34 50 9 6 2 777
Age 16-24 34 48 12 4 1 111
25-39 35 50 7 7 1 490
40-49 38 45 9 5 3 555
50-59 36 47 6 9 2 504
60+ 51 43 3 3 179
Ethnicity White 37 48 7 6 2 1694
Non-white 32 49 8 8 4 150
Parental status
Parent 39 49 6 5 1 773
Non-parent 36 47 8 7 2 773
Highest qualification level
None 35 52 6 5 2 153
GCSEs/O Level/CSEs
40 47 5 7 2 373
A Levels 35 54 6 4 0 293
Degree/Professional qualifications
38 44 10 7 2 358
Postgraduate degree
35 45 10 6 3 283
Other vocational or academic qualifications, level not specified
39 46 7 7 2 254
Other 32 45 10 10 3 119
330

Table C4.7 Satisfaction with current working arrangements
Very satisfied
Satisfied Neither satisfied nor dis-
satisfied
Dis-satisfied
Very dis-satisfied
Unweighted bases
Household income
Under £15,000 36 51 5 5 2 160
£15,000 - £24,999 38 45 6 7 4 269
£25,000 - £34,999 34 54 6 5 1 246
£35,000 - £44,999 38 47 7 7 1 213
£45,000 or more 37 45 10 5 3 507
Carer status Yes, child [46] [42] [2] [10] 33
Yes, relative in any household or non-relative adult in this household
35 47 6 10 1 316
Yes, non-relative adult in another household
[28] [49] [22] 33
No 37 48 8 6 2 1491
Disability status
No 37 48 8 6 1 1595
Yes 35 46 6 9 5 252
Religion or faith
None 36 47 9 6 2 566
Christian 38 47 6 7 1 1175
Other 31 51 10 5 4 99
Region South 36 47 8 7 2 849
North 35 49 8 7 1 414
Midlands 37 50 7 4 2 313
Wales 47 45 4 2 1 107
Scotland 37 47 10 4 1 190
Full-time or part-time worker
Part-time 45 44 8 3 1 537
Full-time 34 49 8 7 2 1317
331

Table C4.7 Satisfaction with current working arrangements
Very satisfied
Satisfied Neither satisfied nor dis-
satisfied
Dis-satisfied
Very dis-satisfied
Unweighted bases
Level of responsibility
Manager/supervisor
36 49 8 6 2 696
Not manager/supervisor
38 47 7 6 2 1159
Time with current employer
Less than 6 months
32 51 9 5 3 85
6 to 11 months 40 48 5 1 5 54
1 year to 4 years 35 47 8 8 1 537
5 to 9 years 39 46 8 4 2 476
10 years or more 37 49 6 7 1 721
Flexible worker status
Part-time only 37 46 8 8 2 251
Part-time and flexible working
46 45 7 1 2 364
Flexible working other than part-time
40 46 8 4 2 450
No part-time or flexible working
31 52 8 9 1 597
Tenure Permanent 37 49 7 6 1 1749
Temp, fixed or other 32 38 14 9 8 120
Trade union membership
TU/SA member 36 47 7 8 2 633
Not TU/SA member
37 48 8 5 2 1216
Socio-economic classification
Managerial and professional occupations
38 46 8 6 2 891
Intermediate occupations
40 43 11 5 1 273
Routine and manual
34 51 7 7 2 674
332

Table C4.7 Satisfaction with current working arrangements
Very satisfied
Satisfied Neither satisfied nor dis-
satisfied
Dis-satisfied
Very dis-satisfied
Unweighted bases
occupations
Sector Private 35 49 8 6 2 1135
Public 41 44 7 6 2 694
Industry Manufacturing 37 48 5 8 2 183
Construction 30 53 5 12 58
Distribution, retail, hotels & restaurants
31 54 9 5 1 307
Transport, storage & communication
41 39 8 9 3 149
Banking, insurance, professional and support services
35 47 10 4 4 236
Public Admin, Education, Health
41 47 6 6 1 762
Other activities 42 37 12 7 2 112
Size of workplace
Part of larger organisation: 1-9
40 40 14 3 3 146
Part of larger organisation: 10-49
39 47 6 6 2 359
Part of larger organisation: 50-249
26 56 8 8 1 373
Part of larger organisation: 250+
39 41 8 10 2 388
Single site: 1-9 43 47 6 3 1 124
Single site: 10-49 38 52 7 1 2 212
Single site: 50-249 34 52 6 6 1 111
Single site: 250+ 44 46 5 5 78
Base: All employees (Core sample)
Missing values: don’t know / refusal
Row per cent
333

Table C4.8 Attitudes towards work-life balance: It is not the employer's responsibility to help people balance their work and life
Strongly agree
Agree Neither agree nor disagree
Disagree Strongly disagree
Unweighted bases
All employees (Core sample)
4 22 20 39 15 1854
Gender Female 3 23 20 39 14 1087
Male 4 22 20 39 15 767
Age 16-24 2 27 34 31 7 111
25-39 4 20 18 43 14 488
40-49 2 22 17 41 18 554
50-59 3 24 15 39 19 503
60+ 10 22 19 40 9 176
Ethnicity White 4 22 20 40 13 1687
Non-white 3 23 12 35 26 149
Parental status Parent 3 20 17 42 18 771
Non-parent 4 24 22 38 13 1083
Highest qualification level
None 9 27 20 39 6 151
GCSEs/O Level/CSEs
5 26 24 34 11 373
A Levels 2 25 20 40 12 292
Degree/Professional qualifications
2 18 17 44 19 358
Postgraduate degree
5 16 14 42 24 281
Other vocational or academic qualifications, level not specified
1 25 24 37 13 252
Other 5 19 20 43 13 119
Household income
Under £15,000 6 25 19 40 11 159
334

Table C4.8 Attitudes towards work-life balance: It is not the employer's responsibility to help people balance their work and life
Strongly agree
Agree Neither agree nor disagree
Disagree Strongly disagree
Unweighted bases
£15,000 - £24,999
4 25 18 37 17 268
£25,000 - £34,999
3 25 21 39 12 244
£35,000 - £44,999
2 22 21 39 16 213
£45,000 or more 2 16 17 45 20 508
Carer status Yes, carer 3 21 19 38 18 381
No 4 23 20 40 14 1473
Disability status No 4 23 20 40 14 1587
Yes 4 20 20 35 21 252
Religion or faith None 4 19 26 39 12 564
Christian 3 24 17 40 15 1170
Other 3 29 7 38 22 99
Region South 4 23 20 38 15 840
North 2 21 19 40 17 413
Midlands 5 22 19 42 12 311
Wales 2 25 17 40 15 104
Scotland 3 23 21 40 13 186
Full-time or part-time worker
Part-time 5 23 25 35 12 534
Full-time 3 22 18 41 16 1303
Level of responsibility
Manager/supervisor
2 22 14 43 18 694
Not manager/supervisor
4 23 23 37 13 1153
Time with current employer
Less than 6 months
3 19 26 35 16 84
6 to 11 months 33 17 39 11 52
335

336
Table C4.8 Attitudes towards work-life balance: It is not the employer's responsibility to help people balance their work and life
Strongly agree
Agree Neither agree nor disagree
Disagree Strongly disagree
Unweighted bases
1 year to 4 years 4 24 20 39 13 536
5 to 9 years 2 19 20 44 14 468
10 years or more 5 23 18 37 17 714
Flexible worker status
Part-time only 4 20 30 34 12 250
Part-time and flexible working
5 23 22 35 14 360
Flexible working other than part-time
3 18 16 42 21 450
No part-time or flexible working
2 26 18 42 12 588
Tenure Permanent 3 22 20 39 15 1730
Temp, fixed or other 5 24 19 41 11 120
Trade union membership
TU/SA member 4 17 16 43 21 631
Not TU/SA member
4 25 21 38 12 1211
Socio-economic classification
Managerial and professional occupations
3 19 16 43 19 887
Intermediate occupations
3 18 24 41 14 273
Routine and manual occupations
4 29 22 34 10 670
Sector Private 3 24 20 38 13 1129
Public 4 18 19 42 17 692
Industry Manufacturing 3 27 18 38 14 181
Construction 11 31 14 33 11 58
Distribution, retail, hotels &
1 26 25 38 9 307

Table C4.8 Attitudes towards work-life balance: It is not the employer's responsibility to help people balance their work and life
Strongly agree
Agree Neither agree nor disagree
Disagree Strongly disagree
Unweighted bases
restaurants
Transport, storage & communication
5 22 27 32 14 147
Banking, insurance, professional and support services
3 18 18 44 17 234
Public Admin, Education, Health
4 19 16 43 18 760
Size of workplace Part of larger organisation: 1-9
4 28 29 28 12 145
Part of larger organisation: 10-49
5 23 18 39 14 358
Part of larger organisation: 50-249
3 23 19 40 15 372
Part of larger organisation: 250+
2 19 16 44 19 387
Single site: 1-9 6 22 26 37 9 123
Single site: 10-49 5 25 22 36 11 210
Single site: 50-249
4 17 21 45 13 111
Single site: 250+ 3 13 22 42 20 78
Base: All employees (Core sample)
Missing values: don’t know / refusal
Row per cent
337

Table C4.9 Parents' attitudes towards work-life balance: It is not the employer’s responsibility to help people balance their work and life
Strongly agree
Agree Neither agree nor disagree
Disagree Strongly disagree
Unweighted bases
All parents (boost sample)
4 22 16 41 17 1359
Gender and parent status
Male with dependent children
4 24 16 40 16 550
Female with dependent children
3 21 16 41 18 809
Family status Lone parent 5 26 19 33 17 244
Couple parent 3 22 16 42 17 1107
Gender and partnership status
Coupled mother 3 20 15 43 18 594
Lone mother 4 23 21 33 19 211
Coupled father 3 23 17 40 16 513
Lone father [15] [37] [5] [33] [10] 33
Family employment status
Lone parent earner with children
5 26 19 33 17 244
Single earner couple with children
4 23 18 38 17 271
Dual earner couple with children
3 21 15 43 17 833
Work status and gender
Male full-time 3 23 16 41 17 506
Female full-time 2 20 16 39 22 419
Male part-time [17] [36] [19] [23] [4] 40
Female part-time 4 22 17 42 15 385
Age of youngest Dependent children child under 6 4 18 14 45 18 244
Dependent children aged 6 to 11 3 25 17 38 16 271
Dependent children aged 12 and over 3 26 19 35 17 833
Base: All parent employees (Boost sample)
Missing values: don’t know / refusal
Row per cent
338

339
Table C4.10 Attitudes to work-life balance: Having more choice in working arrangements improves workplace morale
Strongly agree
Agree Neither agree
nor disagree
Disagree Strongly disagree
Unweighted bases
All employees (Core sample)
38 52 6 4 1 1857
Gender Female 40 51 6 3 1 1089
Male 37 53 5 5 1 768
Age 16-24 22 67 11 110
25-39 45 48 3 3 1 490
40-49 42 49 4 4 1 552
50-59 38 49 6 6 1 503
60+ 27 56 9 6 1 179
Ethnicity White 37 52 6 4 1 1691
Non-white 48 49 1 0 1 148
Parental status Parent 44 49 3 3 1 768
Non-parent 35 53 7 4 1 1089
Highest qualification level
None 19 63 7 11 153
GCSEs/O Level/CSEs
33 56 7 4 1 372
A Levels 37 52 9 2 0 292
Degree/Professional qualifications
47 49 3 1 0 358
Postgraduate degree
51 38 4 6 1 283
Other vocational or academic qualifications, level not specified
36 54 5 3 1 252
Other 33 58 6 2 1 119
Household Under £15,000 37 50 9 3 158

Table C4.10 Attitudes to work-life balance: Having more choice in working arrangements improves workplace morale
Strongly agree
Agree Neither agree
nor disagree
Disagree Strongly disagree
Unweighted bases
income
£15,000 - £24,999 38 50 6 3 2 268
£25,000 - £34,999 38 56 2 4 0 246
£35,000 - £44,999 37 54 4 5 0 213
£45,000 or more 49 42 5 3 1 507
Carer status Yes, child [43] [47] [5] [4] 33
Yes, relative in any household or non-relative adult in this household
44 46 5 4 1 314
Yes, non-relative adult in another household
[46] [52] [2] 33
No 37 53 6 4 1 1477
Disability status No 38 52 6 4 1 1591
Yes 39 49 6 4 2 252
Religion or faith None 38 52 6 3 0 564
Christian 38 51 6 4 1 1174
Other 39 56 3 2 97
Region South 39 51 7 3 1 839
North 39 50 6 4 0 414
Midlands 30 59 6 3 1 311
Wales 41 52 1 7 105
Scotland 44 46 3 6 1 188
Full-time or part-time worker
Part-time 36 55 6 2 0 532
Full-time 39 50 6 4 1 1307
Level of responsibility
Manager/supervisor 42 48 5 4 1 695
340

Table C4.10 Attitudes to work-life balance: Having more choice in working arrangements improves workplace morale
Strongly agree
Agree Neither agree
nor disagree
Disagree Strongly disagree
Unweighted bases
Not manager/supervisor
36 54 6 4 0 1155
Time with current employer
Less than 6 months 26 65 8 0 1 84
6 to 11 months 46 43 2 10 52
1 year to 4 years 36 53 7 4 1 534
5 to 9 years 40 52 5 3 0 472
10 years or more 41 49 5 5 1 715
Flexible worker status
Part-time only 32 57 8 3 1 250
Part-time and flexible working
42 50 5 2 0 359
Flexible working other than part-time
50 43 4 2 1 451
No part-time or flexible working
33 55 6 5 0 589
Tenure Permanent 38 52 6 3 1 1733
Temporary - seasonal, agency or casual
[29] [59] [5] [8] 34
Fixed term 34 55 2 6 3 70
Other * * 16
Trade union membership
TU/SA member 46 46 4 3 0 633
Not TU/SA member 35 54 6 4 1 1211
Socio-economic classification
Managerial and professional occupations
47 43 5 4 1 888
Intermediate occupations
34 60 4 1 1 274
Routine and manual
29 59 7 4 0 671
341

Table C4.10 Attitudes to work-life balance: Having more choice in working arrangements improves workplace morale
Strongly agree
Agree Neither agree
nor disagree
Disagree Strongly disagree
Unweighted bases
occupations
Sector Private 37 53 5 4 1 1130
Public 43 47 7 3 1 694
Industry Manufacturing 34 56 6 4 1 182
Construction 20 60 12 7 1 58
Distribution, retail, hotels & restaurants
32 57 7 3 1 306
Transport, storage & communication
39 50 7 3 1 149
Banking, insurance, professional and support services
46 44 3 6 1 236
Public Admin, Education, Health
42 49 5 3 0 760
Other activities 42 49 7 2 111
Size of workplace
Part of larger organisation: 1-9
35 55 7 2 1 146
Part of larger organisation: 10-49
35 54 7 3 1 358
Part of larger organisation: 50-249
40 49 4 6 1 372
Part of larger organisation: 250+
44 49 4 3 388
Single site: 1-9 34 52 10 3 1 124
Single site: 10-49 29 62 6 3 210
Single site: 50-249 44 42 10 5 111
Single site: 250+ 53 43 1 1 2 78
Base: All employees (Core sample)
Missing values: don’t know / refusal
Row per cent
342

Table C4.11 Parents' attitudes towards work-life balance: Having more choice in working arrangements improves workplace morale
Strongly agree
Agree Neither agree nor disagree
Disagree Strongly disagree
Unweighted bases
All parents (boost sample)
41 51 4 3 1 1357
Gender and parent status
Male with dependent children
37 54 4 4 1 549
Female with dependent children
46 48 4 2 808
Family status Lone parent 44 46 6 3 1 243
Couple parent 41 52 4 3 1 1106
Gender and partnership status
Coupled mother 45 49 3 2 1 594
Lone mother 46 45 5 3 210
Coupled father 37 54 4 4 1 512
Lone father [34] [48] [11] [4] [2] 33
Family employment status
Lone parent earner with children
44 46 6 3 1 243
Single earner couple with children
39 53 4 3 1 273
Dual earner couple with children
41 51 3 3 1 830
Work status and gender
Male full-time 38 53 4 4 1 506
Female full-time 48 46 3 3 1 419
Male part-time [32] [57] [6] [3] [2] 39
Female part-time 44 51 4 1 384
Base: All parent employees (Boost sample)
Missing values: don’t know / refusal
Row per cent
343

Table C4.12 Attitudes to work-life balance: People who work flexibly create more work for others.
Strongly agree
Agree Neither agree nor disagree
Disagree Strongly disagree
Unweighted bases
All employees (Core sample)
7 28 22 35 9 1830
Gender Female 6 24 22 37 10 1073
Male 7 33 22 32 7 757
Age 16-24 9 27 27 35 4 111
25-39 5 28 22 34 11 486
40-49 8 26 21 35 11 542
50-59 7 29 21 34 8 494
60+ 5 38 21 32 3 175
Ethnicity White 7 27 23 36 8 1666
Non-white 7 42 19 21 12 147
Parental status Parent 5 28 20 36 12 758
Non-parent 7 28 23 34 7 1072
Highest qualification level
None 7 41 18 28 6 149
GCSEs/O Level/CSEs
7 31 27 27 7 367
A Levels 6 28 19 38 8 288
Degree/Professional qualifications
5 28 21 37 9 353
Postgraduate degree
6 20 20 41 14 280
Other vocational or academic qualifications, level not specified
8 25 22 37 8 252
Other 9 30 31 23 7 114
Household income
Under £15,000 9 39 19 29 5 154
344

Table C4.12 Attitudes to work-life balance: People who work flexibly create more work for others.
Strongly agree
Agree Neither agree nor disagree
Disagree Strongly disagree
Unweighted bases
£15,000 - £24,999 9 32 19 33 7 265
£25,000 - £34,999 7 26 25 32 10 244
£35,000 - £44,999 9 34 16 30 10 207
£45,000 or more 5 21 24 39 12 505
Carer status Yes, child [3] [51] [14] [26] [7] 32
Yes, relative in any household or non-relative adult in this household
10 30 24 27 10 309
Yes, non-relative adult in another household
[13] [44] [8] [25] [10] 33
No 6 27 22 36 8 1456
Disability status No 7 28 22 35 8 1569
Yes 5 32 23 28 12 247
Religion or faith None 6 27 20 36 10 560
Christian 7 28 23 34 8 1152
Other 8 41 21 23 8 97
Region South 6 29 21 34 9 829
North 7 29 22 36 7 406
Midlands 9 27 23 33 8 307
Wales 4 30 19 38 8 102
Scotland 4 24 25 36 11 186
Full-time or part-time worker
Part-time 9 30 22 30 9 524
Full-time 5 28 22 36 9 1288
Level of responsibility
Manager/supervisor
7 25 22 36 11 688
Not manager/superviso
6 30 22 33 8 1136
345

Table C4.12 Attitudes to work-life balance: People who work flexibly create more work for others.
Strongly agree
Agree Neither agree nor disagree
Disagree Strongly disagree
Unweighted bases
r
Time with current employer
Less than 6 months 2 34 21 33 10 83
6 to 11 months 14 21 18 40 8 52
1 year to 4 years 6 30 23 33 8 528
5 to 9 years 6 25 23 36 10 463
10 years or more 8 28 21 35 8 704
Flexible worker status
Part-time only 7 31 26 30 6 244
Part-time and flexible working
9 30 15 37 9 359
Flexible working other than part-time
5 19 22 41 14 444
No part-time or flexible working
6 32 23 31 7 580
Tenure Permanent 7 28 22 35 8 1706
Temporary - seasonal, agency or casual
[54] [15] [26] [5] 34
Fixed term 7 23 23 36 11 70
Other * * * * * 16
Trade union membership
TU/SA member 6 27 23 34 10 624
Not TU/SA member 7 29 22 35 8 1194
Socio-economic classification
Managerial and professional occupations
5 24 22 38 11 880
Intermediate occupations
4 18 25 44 9 270
Routine and manual occupations
9 36 21 27 6 657
346

347
Table C4.12 Attitudes to work-life balance: People who work flexibly create more work for others.
Strongly agree
Agree Neither agree nor disagree
Disagree Strongly disagree
Unweighted bases
Sector Private 7 29 22 35 7 1115
Public 5 26 22 34 12 685
Industry Manufacturing 6 27 27 33 6 180
Construction 8 46 11 27 7 54
Distribution, retail, hotels & restaurants
10 35 21 28 6 303
Transport, storage & communication
7 24 22 36 11 147
Banking, insurance, professional and support services
2 24 21 45 8 232
Public Admin, Education, Health
6 26 22 35 11 750
Other activities 5 26 24 36 9 111
Size of workplace
Part of larger organisation: 1-9
6 31 19 37 7 144
Part of larger organisation: 10-49
10 28 23 26 13 354
Part of larger organisation: 50-249
6 29 26 34 5 369
Part of larger organisation: 250+
5 23 20 41 10 382
Single site: 1-9 8 33 17 37 5 122
Single site: 10-49 8 33 20 31 7 205
Single site: 50-249 4 19 33 36 8 110
Single site: 250+ 4 20 14 46 15 78
Base: All employees (Core sample).
Missing values: don’t know / refusal
Row per cent
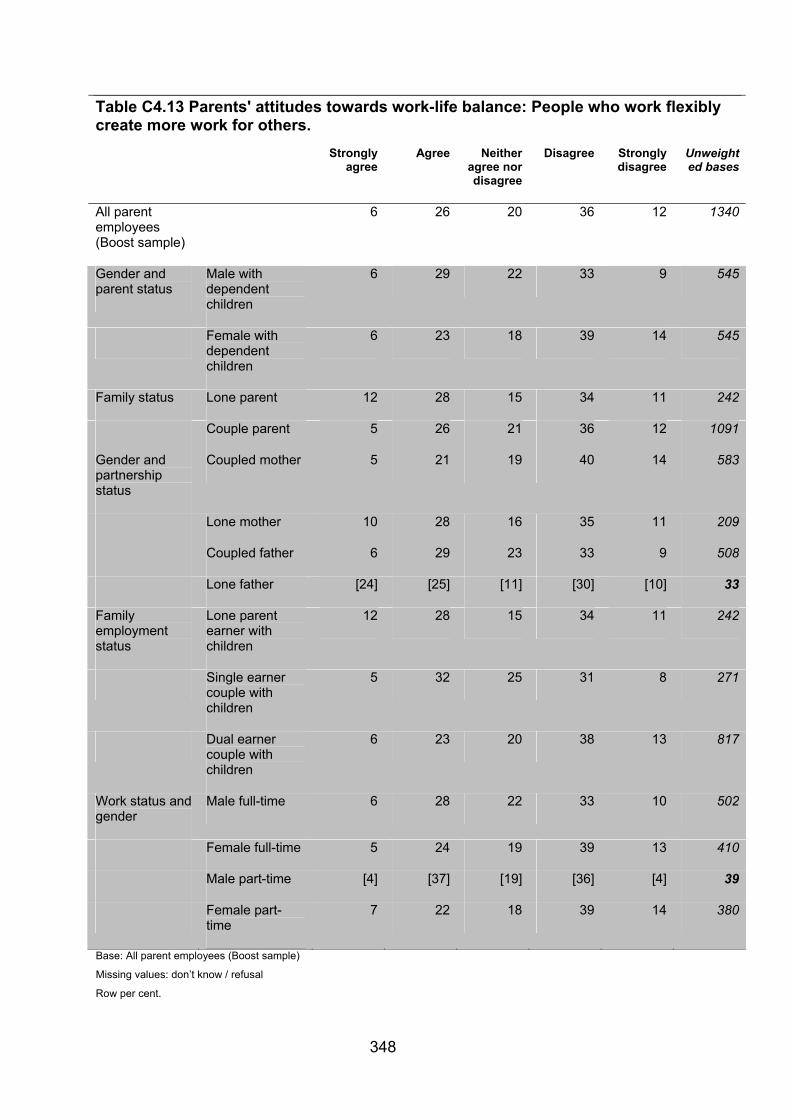
Table C4.13 Parents' attitudes towards work-life balance: People who work flexibly create more work for others.
Strongly agree
Agree Neither agree nor disagree
Disagree Strongly disagree
Unweighted bases
All parent employees (Boost sample)
6 26 20 36 12 1340
Gender and parent status
Male with dependent children
6 29 22 33 9 545
Female with dependent children
6 23 18 39 14 545
Family status Lone parent 12 28 15 34 11 242
Couple parent 5 26 21 36 12 1091
Gender and partnership status
Coupled mother 5 21 19 40 14 583
Lone mother 10 28 16 35 11 209
Coupled father 6 29 23 33 9 508
Lone father [24] [25] [11] [30] [10] 33
Family employment status
Lone parent earner with children
12 28 15 34 11 242
Single earner couple with children
5 32 25 31 8 271
Dual earner couple with children
6 23 20 38 13 817
Work status and gender
Male full-time 6 28 22 33 10 502
Female full-time 5 24 19 39 13 410
Male part-time [4] [37] [19] [36] [4] 39
Female part-time
7 22 18 39 14 380
Base: All parent employees (Boost sample)
Missing values: don’t know / refusal
Row per cent.
348

Table C4.14 Attitudes to work-life balance: People who work flexibly are less likely to get promoted.
Strongly agree
Agree Neither agree nor disagree
Disagree Strongly disagree
Unweighted bases
All employees (Core sample)
6 26 24 37 7 1812
Gender Female 6 22 25 40 7 1060
Male 7 30 22 34 7 752
Age 16-24 3 28 24 40 5 110
25-39 7 24 24 37 8 485
40-49 8 26 23 36 7 537
50-59 6 29 21 37 7 485
60+ 6 25 26 34 9 174
Ethnicity White 5 26 24 38 7 1647
Non-white 17 27 21 32 3 149
Parental status Parent 8 27 21 37 7 754
Non-parent 5 26 25 37 7 1058
Highest qualification level
None 7 32 18 38 5 148
GCSEs/O Level/CSEs
5 20 29 41 6 361
A Levels 6 29 21 36 7 290
Degree/Professional qualifications
9 24 25 36 6 348
Postgraduate degree
6 27 22 35 10 279
Other vocational or academic qualifications, level not specified
7 28 21 36 8 246
Other 7 28 22 35 7 115
349

Table C4.14 Attitudes to work-life balance: People who work flexibly are less likely to get promoted.
Strongly agree
Agree Neither agree nor disagree
Disagree Strongly disagree
Unweighted bases
Household income
Under £15,000 13 19 21 42 6 156
£15,000 - £24,999
9 23 23 35 10 264
£25,000 - £34,999
5 24 23 44 4 241
£35,000 - £44,999
4 36 20 33 8 205
£45,000 or more 6 29 22 34 9 496
Carer status Yes, child [4] [39] [16] [39] [2] 31
Yes, relative in any household or non-relative adult in this household
7 27 22 34 9 305
Yes, non-relative adult in another household
[11] [13] [23] [45] [8] 32
No 6 26 24 37 7 1444
Disability status No 6 26 23 38 7 1554
Yes 9 27 27 29 9 246
Religion or faith None 6 27 26 34 7 546
Christian 5 27 22 39 7 1148
Other 20 22 19 33 5 98
Region South 8 28 23 35 6 819
North 4 27 21 41 7 403
Midlands 7 20 26 36 11 306
Wales 5 21 19 45 9 101
Scotland 6 27 30 33 4 183
Full-time or part-time worker
Part-time 8 24 26 34 8 516
350

Table C4.14 Attitudes to work-life balance: People who work flexibly are less likely to get promoted.
Strongly agree
Agree Neither agree nor disagree
Disagree Strongly disagree
Unweighted bases
Full-time 6 27 23 38 7 1278
Level of responsibility
Manager/supervisor
7 25 20 39 9 681
Not manager/supervisor
6 27 25 36 6 1126
Time with current employer
Less than 6 months
0 30 25 35 10 81
6 to 11 months 8 31 14 36 11 52
1 year to 4 years 6 30 24 34 6 524
5 to 9 years 9 22 22 41 6 456
10 years or more
6 24 25 38 8 699
Flexible worker status
Part-time only 9 29 32 25 6 245
Part-time and flexible working
7 20 24 42 7 347
Flexible working other than part-time
3 21 17 45 13 437
No part-time or flexible working
6 32 23 35 4 580
Tenure Permanent 6 26 23 37 7 1691
Temporary - seasonal, agency or casual
[9] [26] [35] [30] 34
Fixed term 5 34 20 40 2 67
Other * * * * * 16
Trade union membership
TU/SA member 6 27 23 35 9 617
Not TU/SA member
6 26 24 38 7 1184
351

Table C4.14 Attitudes to work-life balance: People who work flexibly are less likely to get promoted.
Strongly agree
Agree Neither agree nor disagree
Disagree Strongly disagree
Unweighted bases
Socio-economic classification
Managerial and professional occupations
6 26 23 37 8 866
Intermediate occupations
3 22 27 42 6 268
Routine and manual occupations
8 28 23 34 6 658
Sector Private 8 27 23 36 6 1106
Public 4 24 25 38 9 675
Industry Manufacturing 10 28 26 30 6 178
Construction 9 23 20 40 8 55
Distribution, retail, hotels & restaurants
7 26 21 39 8 305
Transport, storage & communication
8 28 19 36 9 148
Banking, insurance, professional and support services
5 27 24 38 6 228
Public Admin, Education, Health
5 26 25 37 7 738
Other activities 8 25 28 34 6 108
Size of workplace
Part of larger organisation: 1-9
6 22 32 35 5 143
Part of larger organisation: 10-49
7 26 22 37 8 350
Part of larger organisation: 50-249
7 28 22 36 6 362
Part of larger organisation:
5 24 22 41 8 384
352

Table C4.14 Attitudes to work-life balance: People who work flexibly are less likely to get promoted.
Strongly agree
Agree Neither agree nor disagree
Disagree Strongly disagree
Unweighted bases
250+
Single site: 1-9 5 29 23 36 7 120
Single site: 10-49
5 31 24 33 7 203
Single site: 50-249
7 20 30 34 10 105
Single site: 250+ 6 20 23 44 7 78
Base: All employees (Core sample)
Missing values: don’t know / refusal
Row per cent.
353

Table C4.15 Parents' attitudes towards work-life balance: People who work flexibly are less likely to get promoted
Strongly agree
Agree Neither agree nor disagree
Disagree Strongly disagree
Unweighted bases
All parent employees
7 28 21 37 7 1332
Gender and parent status
Male with dependent children
7 26 23 37 8 538
Female with dependent children
7 30 19 37 6 794
Family status Lone parent 7 28 20 36 10 238
Couple parent 7 28 21 37 6 1087
Gender and partnership status
Coupled mother 6 31 20 38 5 586
Lone mother 8 29 19 33 11 205
Coupled father 7 26 23 36 8 501
Lone father [20] [24] [49] [8] 33
Family employment status
Lone parent earner with children
7 28 20 36 10 238
Single earner couple with children
6 26 22 37 8 268
Dual earner couple with children
7 29 21 37 6 816
Work status and gender
Male full-time 7 27 24 36 7 498
Female full-time 6 28 20 39 7 410
Male part-time [11] [18] [17] [42] [13] 36
Female part-time
8 33 19 36 5 379
Base: All parent employees (Boost sample)
Missing values: don’t know / refusal
Row per cent.
354
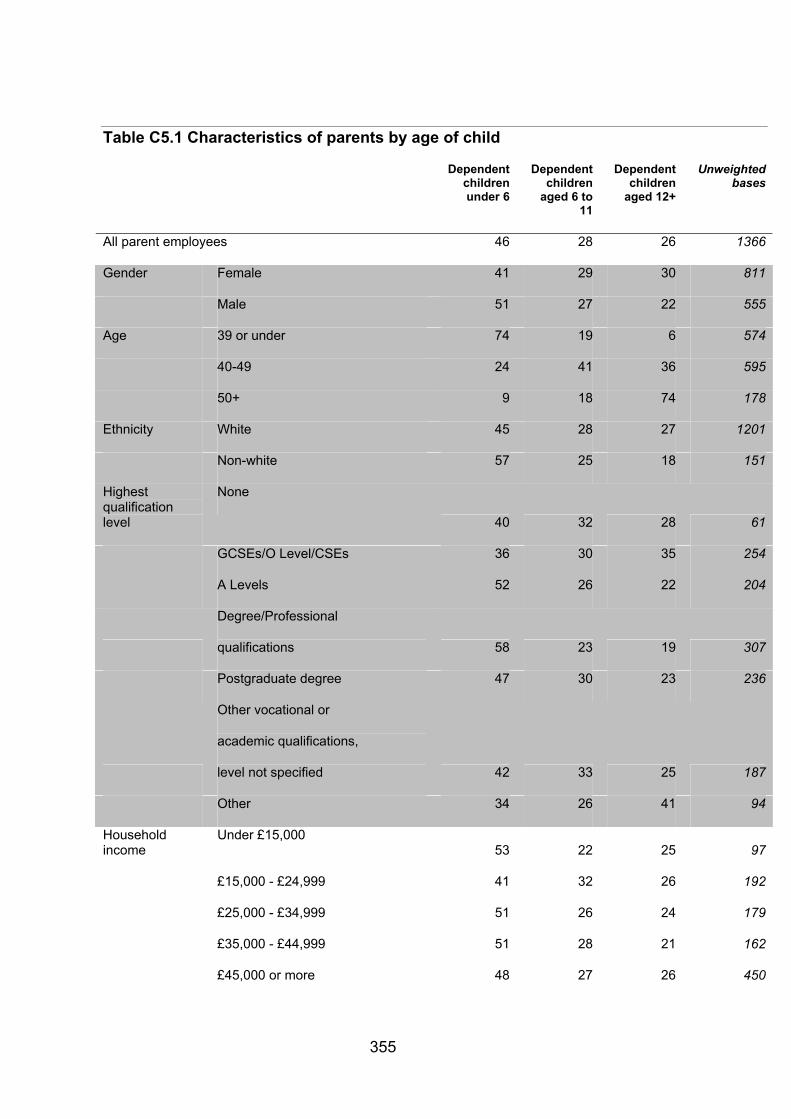
Table C5.1 Characteristics of parents by age of child
Dependent children under 6
Dependent children
aged 6 to 11
Dependent children
aged 12+
Unweighted bases
All parent employees 46 28 26 1366
Gender Female 41 29 30 811
Male 51 27 22 555
Age 39 or under 74 19 6 574
40-49 24 41 36 595
50+ 9 18 74 178
Ethnicity White 45 28 27 1201
Non-white 57 25 18 151
Highest None qualification level 40 32 28 61
GCSEs/O Level/CSEs 36 30 35 254
A Levels 52 26 22 204
Degree/Professional
qualifications 58 23 19 307
Postgraduate degree 47 30 23 236
Other vocational or
academic qualifications,
level not specified 42 33 25 187
Other 34 26 41 94
Household income
Under £15,000 53 22 25 97
£15,000 - £24,999 41 32 26 192
£25,000 - £34,999 51 26 24 179
£35,000 - £44,999 51 28 21 162
£45,000 or more 48 27 26 450
355

Table C5.1 Characteristics of parents by age of child
Dependent children under 6
Dependent children
aged 6 to 11
Dependent children
aged 12+
Unweighted bases
Disability status No 47 28 25 1210
Yes 33 25 42 142
Religion or faith None 58 21 21 431
Christian 39 32 29 836
Other 55 24 20 84
Region South 48 28 24 612
North 46 30 24 336
Midlands 44 26 30 225
Wales 43 23 34 75
Scotland 44 28 28 118
Full-time or part-time worker
Part-time 45 31 23 428
Full-time 46 27 27 930
Level of responsibility
Manager/supervisor 45 29 26 577
Not manager/supervisor 47 27 26 778
Time with Less than 6 months current employer 49 29 22 53
6 to 11 months 52 28 19 50
1 year to 4 years 50 27 23 403
5 to 9 years 49 26 25 388
10 years or more 38 31 31 471
Flexible worker status
Part-time only 45 28 27 175
Part-time and flexible working 45 31 23 316
Flexible working
other than part-time 44 27 29 346
No part-time or flexible working 49 24 26 377
356

Table C5.1 Characteristics of parents by age of child
Dependent children under 6
Dependent children
aged 6 to 11
Dependent children
aged 12+
Unweighted bases
Tenure Permanent 47 27 26 1297
temp, fixed or other 37 38 25 66
Trade union membership
TU/SA member 40 29 31 459
Not TU/SA member 49 27 24 893
Managerial and 47 28 25 734 Socio-economic classification professional occupations
Intermediate occupations 52 26 22 200
Routine and manual occupations 42 29 29 415
Sector Private 49 27 24 786
Public 40 30 30 547
Industry Manufacturing 47 29 24 113
Construction [50] [32] [18] 36
Distribution, retail, 50 22 28 193
hotels & restaurants
Transport, storage 50 34 16 112
& communication
Banking, insurance, 51 27 22 192
professional and support services
Public Admin, 40 29 30 614
Education, Health
Other activities 50 25 25 69
Size of workplace
Part of larger organisation: 1-9 40 28 32 87
Part of larger organisation: 10-49 43 27 30 296
Part of larger organisation: 50-249 47 26 27 276
Part of larger organisation: 250+ 48 30 23 302
357

Table C5.1 Characteristics of parents by age of child
Dependent children under 6
Dependent children
aged 6 to 11
Dependent children
aged 12+
Unweighted bases
Single site: 1-9 40 31 29 85
Single site: 10-49 51 30 20 138
Single site: 50-249 41 31 29 77
Single site: 250+ 53 26 20 56
Base: Parent employees (Boost sample)
Missing values: don’t know / refusal,
Row per cent
358

Table C5.2 Characteristics of carers by type of responsibility
Yes, child Yes, relative in any
household or non-relative adult in this household
Both Unweighted bases
All carer employees
10 83 8 829
Gender Female 10 83 7 540
Male 9 83 8 289
Age 39 years or under 10 82 8 147
40-49 15 77 8 261
50+ 5 88 7 407
Ethnicity White 10 83 7 758
Non-white 7 80 14 58
Highest qualification level
None 11 82 7 80
GCSEs/O Level/CSEs 12 84 4 147
A Levels 8 86 6 112
Degree/Professional 10 82 9 155 qualifications
Postgraduate degree 10 78 12 103
Other vocational or 10 85 4 124 academic qualifications,
level not specified Other 6 81 14 89
Household income
Under £15,000 3 85 12 68
£15,000 - £24,999 12 76 13 138
£25,000 - £34,999 12 86 2 122
£35,000 - £44,999 15 78 7 95
£45,000 or more 5 88 6 218
Disability status No 11 82 8 662
Yes 7 87 7 156
359
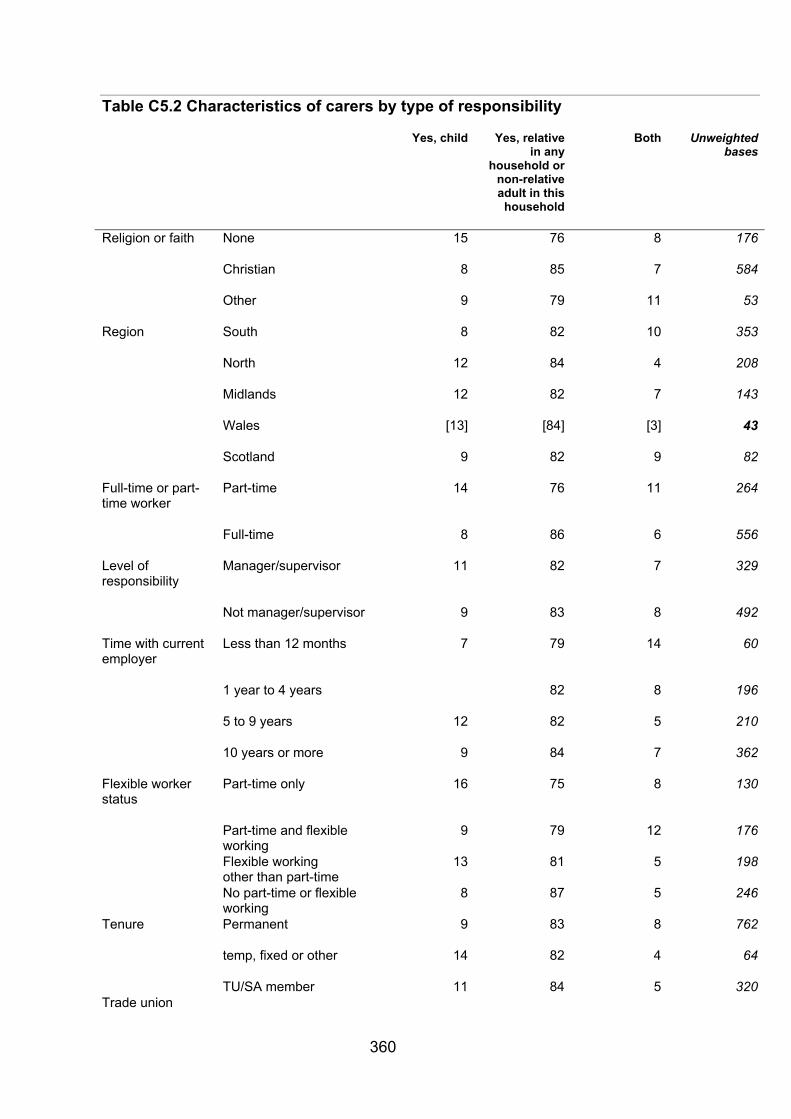
Table C5.2 Characteristics of carers by type of responsibility
Yes, child Yes, relative in any
household or non-relative adult in this household
Both Unweighted bases
Religion or faith None 15 76 8 176
Christian 8 85 7 584
Other 9 79 11 53
Region South 8 82 10 353
North 12 84 4 208
Midlands 12 82 7 143
Wales [13] [84] [3] 43
Scotland 9 82 9 82
Full-time or part-time worker
Part-time 14 76 11 264
Full-time 8 86 6 556
Level of responsibility
Manager/supervisor 11 82 7 329
Not manager/supervisor 9 83 8 492
Time with current employer
Less than 12 months 7 79 14 60
1 year to 4 years 82 8 196
5 to 9 years 12 82 5 210
10 years or more 9 84 7 362
Flexible worker status
Part-time only 16 75 8 130
Part-time and flexible working
9 79 12 176
Flexible working 13 81 5 198 other than part-time
No part-time or flexible working
8 87 5 246
Tenure Permanent 9 83 8 762
temp, fixed or other 14 82 4 64
TU/SA member 11 84 5 320 Trade union
360

Table C5.2 Characteristics of carers by type of responsibility
Yes, child Yes, relative in any
household or non-relative adult in this household
Both Unweighted bases
membership
Not TU/SA member 9 82 9 502
Socio-economic classification
Managerial and 9 84 7 419 professional occupations
Intermediate occupations
9 86 5 121
Routine and manual occupations
11 80 9 275
Sector Private 7 84 9 436
Public 14 80 6 373
Industry Manufacturing 7 84 9 71
Construction [5] [83] [12] 26
Distribution, retail, 6 80 14 108 hotels & restaurants
Transport, storage 10 84 6 50 & communication Banking, insurance, 7 90 3 96
professional and support services
Public Admin, 12 81 6 414 Education, Health
Other activities [17] [76] [7] 42
Size of workplace Part of larger organisation: 1-9
5 78 17 65
Part of larger organisation: 10-49
13 82 5 165
Part of larger organisation: 50-249
15 77 8 165
Part of larger organisation: 250+
6 86 8 191
Single site: 1-9 11 79 11 59
Single site: 10-49 8 87 5 74
Single site: 50-249 [8] [88] [4] 45
Single site: 250+ [5] [94] [1] 28
Base: Carer employees (Boost sample)
Some categories collapsed due to small cell sizes
Missing values: don’t know / refusal
Row per cent
361

Table C5.3 Whether working time disrupted by child's illness in past 3 months
Yes No Unweighted bases
All parent employees 29 71 1362
Gender Female 31 69 809
Male 27 73 553
Age 39 or under 32 68 573
40-49 30 70 593
50+ 13 87 178
Ethnicity White 29 71 1199
Non-white 31 69 150
Highest qualification level
None 19 81 61
GCSEs/O Level/CSEs 23 77 253
A Levels 26 74 204
Degree/Professional qualifications
34 66 307
Postgraduate degree 38 62 234
Other vocational or academic qualifications, level not specified
28 72 187
Other 21 79 94
Household income
Under £15,000 34 66 97
£15,000 - £24,999 28 72 191
£25,000 - £34,999 30 70 178
£35,000 - £44,999 26 74 162
£45,000 or more 30 70 449
Carer status Carer 33 67 301
No 28 72 1061
Disability status No 29 71 1207
Yes 28 72 142
362

Table C5.3 Whether working time disrupted by child's illness in past 3 months
Yes No Unweighted bases
Religion or faith None 29 71 430
Christian 29 71 836
Other 30 70 82
Family status Lone parent 35 65 244
Couple parent 28 72 1106
Gender and partnership status
Coupled mother 30 70 592
Lone mother 36 64 211
Coupled father 27 73 514
Lone father [26] [74] 33
Family employment status
Lone parent earner with children
35 65 244
Single earner couple with children
22 78 272
Dual earner couple with children
30 70 831
Region South 29 71 609
North 34 66 336
Midlands 23 77 224
Wales 33 67 75
Scotland 22 78 118
Full-time or part-time worker
Part-time 29 71 426
Full-time 29 71 928
Work status and gender
Male full-time 27 73 510
Female full-time 32 68 418
Male part-time [23] [77] 39
Female part-time 30 70 387
Level of responsibility
Manager/supervisor 32 68 574
363

Table C5.3 Whether working time disrupted by child's illness in past 3 months
Yes No Unweighted bases
Not manager/supervisor 27 73 778
Length of service Less than 12 months 25 75 103
1 year to 4 years 31 69 402
5 to 9 years 30 70 385
10 years or more 27 73 471
Flexible worker status
Part-time only 26 74 174
Part-time and flexible working 32 68 315
Flexible working 34 66 346 other than part-time
No part-time or flexible working 25 75 375
Tenure Permanent 29 71 1293
Temp, fixed or other 28 72 66
Trade union membership
TU/SA member 29 71 457
Not TU/SA member 29 71 892
Socio-economic classification
Managerial and professional occupations
33 67 731
Intermediate occupations 31 69 200
Routine and manual occupations 22 78 415
Sector Private 27 73 784
Public 33 67 546
Industry Manufacturing 33 67 113
Construction [20] [80] 36
Distribution, retail, 21 79 192 hotels & restaurants
Transport, storage 29 71 112 & communication
Banking, insurance, 28 72 192 professional and support services
Public Admin, 33 67 613 Education, Health
Other activities 26 74 68
364

Table C5.3 Whether working time disrupted by child's illness in past 3 months
Yes No Unweighted bases
Size of workplace Part of larger organisation: 1-9 32 68 86
Part of larger organisation: 10-49 26 74 294
Part of larger organisation: 50-249 28 72 276
Part of larger organisation: 250+ 29 71 302
Single site: 1-9 36 64 85
Single site: 10-49 30 70 138
Single site: 50-249 33 67 77
Single site: 250+ 23 77 56
Age of youngest child
Dependent children under 6 34 66 581
Dependent children aged 6 to 11 31 69 389
Dependent children aged 12 and over
17 83 392
Base: Parent employees (Boost sample)
Missing values: don’t know / refusal
Row per cent
365

Table C5.4 Arrangements when working time disrupted due to child’s illness in past 3 months
Worked flexibly,
including from home
Arranged care,
including child's
other parent and
formal or informal
childcare
Took paid or unpaid
leave
A combinatio
n of arranging care and
taking leave
Other Unweighted base
All parent employees who had working time disrupted (boost sample)
30 19 31 16 5 412
Gender Female 25 18 35 17 5 258
Male 35 21 26 14 4 152
Age under 39 30 18 29 18 5 195
40+ 30 21 33 12 4 213
Age of child
Dependent children under 6 26 20 29 20 5 209
Dependent children aged 6 to 11 34 21 27 13 5 128
Dependent children aged 12 and over 33 14 44 7 2 73
Ethnicity White 31 15 33 16 5 358
Non-white [18] [48] [15] [15] [4] 49
Highest qualification level
None * * * * 10
GCSEs/O Level/CSEs
30 16 33 14 7 59
A Levels 27 19 32 16 6 55
Degree/Professional qualifications
27 19 33 17 4 113
Postgraduate degree
39 17 21 17 6 91
Other vocational or academic qualifications, level not specified
27 20 38 13 1 54
366

Table C5.4 Arrangements when working time disrupted due to child’s illness in past 3 months
Worked flexibly,
including from home
Arranged care,
including child's
other parent and
formal or informal
childcare
Took paid or unpaid
leave
A combinatio
n of arranging care and
taking leave
Other Unweighted base
Other * * * * * 22
Household income Under £24,999 28 23 34 13 2 94
£25,000 - £44,999 25 15 34 18 8 101
£45,000 or more 36 18 23 19 3 140
Carer status Carer 27 21 36 15 1 104
No 31 19 29 16 6 306
Disability status
No 30 19 31 15 5 362
Yes [24] [20] [34] [19] [3] 45
Religion or faith
None 32 16 32 16 4 136
Christian 31 19 31 14 5 246
Other [11] [39] [24] [23] [3] 26
Family status
Lone parent 30 11 39 15 5 94
Couple parent 30 21 30 16 5 315
Gender and partnership status
Coupled mother 24 20 33 17 5 173
Lone mother 27 13 40 15 5 84
Coupled father 35 22 26 14 4 142
Lone father * * * * 10
Family employment status
Lone parent earner with children
30 11 39 15 5 94
367
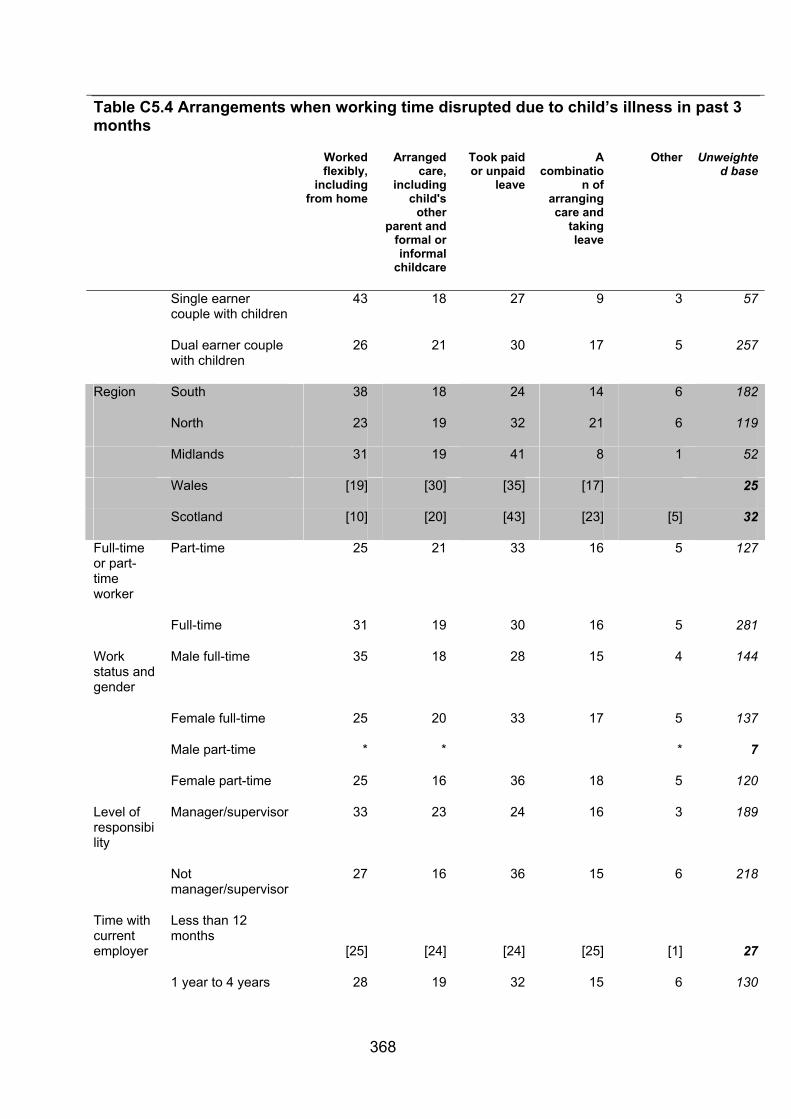
Table C5.4 Arrangements when working time disrupted due to child’s illness in past 3 months
Worked flexibly,
including from home
Arranged care,
including child's
other parent and
formal or informal
childcare
Took paid or unpaid
leave
A combinatio
n of arranging care and
taking leave
Other Unweighted base
Single earner couple with children
43 18 27 9 3 57
Dual earner couple with children
26 21 30 17 5 257
Region South 38 18 24 14 6 182
North 23 19 32 21 6 119
Midlands 31 19 41 8 1 52
Wales [19] [30] [35] [17] 25
Scotland [10] [20] [43] [23] [5] 32
Full-time or part-time worker
Part-time 25 21 33 16 5 127
Full-time 31 19 30 16 5 281
Work status and gender
Male full-time 35 18 28 15 4 144
Female full-time 25 20 33 17 5 137
Male part-time * * * 7
Female part-time 25 16 36 18 5 120
Level of responsibility
Manager/supervisor 33 23 24 16 3 189
Not manager/supervisor
27 16 36 15 6 218
Time with current employer
Less than 12 months
[25] [24] [24] [25] [1] 27
1 year to 4 years 28 19 32 15 6 130
368

Table C5.4 Arrangements when working time disrupted due to child’s illness in past 3 months
Worked flexibly,
including from home
Arranged care,
including child's
other parent and
formal or informal
childcare
Took paid or unpaid
leave
A combinatio
n of arranging care and
taking leave
Other Unweighted base
5 to 9 years 26 25 31 11 7 124
10 years or more 35 14 31 19 2 129
Flexible worker status
Part-time only [20] [14] [38] [19] [9] 44
Part-time and flexible working
27 22 31 18 2 104
Flexible working other than part-time
42 16 23 18 1 119
No part-time or flexible working
17 23 40 15 6 101
Tenure Permanent 29 20 31 16 4 386
temp, fixed or other * * * * * 23
Trade union membership
TU/SA member 17 20 42 19 2 137
Not TU/SA member 35 19 26 14 6 271
Socio-economic classification
Managerial and professional occupations
35 19 25 18 4 252
Intermediate occupations
12 22 47 14 5 63
Routine and manual occupations
27 19 36 11 6 92
Sector Private 36 20 28 10 5 214
Public 20 18 34 24 4 188
Industry Manufacturing [34] [17] [36] [10] [5] 37
Construction * * * * * 7
369

Table C5.4 Arrangements when working time disrupted due to child’s illness in past 3 months
Worked flexibly,
including from home
Arranged care,
including child's
other parent and
formal or informal
childcare
Took paid or unpaid
leave
A combinatio
n of arranging care and
taking leave
Other Unweighted base
Distribution, retail, hotels & restaurants
[31] [30] [28] [9] [1] 43
Transport, storage & communication
[44] [15] [30] [9] [3] 30
Banking, insurance, professional and support services
47 7 24 16 5 56
Public Admin, Education, Health
17 21 35 22 6 207
Other activities * * * * 20
Size of Part of larger workplace organisation: 1-49 20 16 37 24 4 109
Part of larger organisation: 50+ 30 20 29 16 5 174
Single site: 1-49 36 24 25 9 5 72
Single site: 50+ [43] [18] [27] [5] [7] 43
Base: Parent employees who had working time disrupted (Boost sample)
Some categories collapsed due to small cell sizes
Missing values: don’t know / refusal
Row per cent
370

Table C5.5 Whether father took time off for antenatal appointments
Yes No Unweighted bases
All parent employees with child aged under 6 (boost sample) 54 46 577
Household income Under £24,999 41 59 110
£25,000 - £44,999 56 44 158
£45,000 or more 65 35 207
Carer in household
Yes 40 60 78
No 56 44 494
Disabled adult in household
No 55 45 524
Yes [45] [55] 42
Family status Lone parent 21 79 56
Couple parent 57 43 512
Family employment status
Lone parent earner with children 21 79 56
Single earner couple with children 49 51 149
Dual earner couple with children 60 40 362
Region South 53 47 265
North 55 45 140
Midlands 60 40 93
Wales [47] [53] 30
Scotland [51] [49] 44
Base: Male employees with child under 6, or female employees with child under 6 asked about their partners’ time off (Parent employees - Boost sample)
Some categories collapsed due to small cell sizes
Missing values: don’t know / refusal
Row per cent
371

Table C5.6 How many antenatal appointments were attended and how time off was taken (fathers)
How many appointments father attended %
1 6
2 29
3 21
4 10
5 8
6 10
7 1
8 3
10 6
12 1
Don't know 6
How father took time off %
Paid time off in additional to annual leave 39
Annual leave 29
Time off in lieu 24
Unpaid leave 9
Sick leave 2
Other 6
Unweighted base 155
Base: Male employees with child under 6 who had time off for antenatal appointment (Parents Boost sample)
Missing values: don’t know / refusal
Row per cent
372

Table C5.7 Parental leave in past 12 months In the last 12 months and with your current employer, have you taken any parental leave?
Yes No Unweighted bases
Parent employees with children aged under 6 11 89 579
Gender Female 10 90 298
Male 12 88 281
Age under 40 11 89 403
40+ 10 90 170
Ethnicity White 11 89 495
Non-white 13 87 80
None or other, inc voc/acad level not specified Highest qualification 6 94 125
GCSEs/O Level/CSEs 18 82 82
A Levels 11 89 95
Degree/Professional qualifications 10 90 164
Postgraduate degree 11 89 107
Annual household income
Under £24,999 15 85 110
£25,000 - £44,999 13 87 161
£45,000 or more 7 93 210
Caring responsibilities Yes 14 86 79
No 10 90 500
Disability status No 11 89 530
Yes [11] [89] 43
Religion or faith None 11 89 223
Christian 10 90 311
Other [15] [85] 41
Family status Lone parent 20 80 58
Couple parent 10 90 517
373
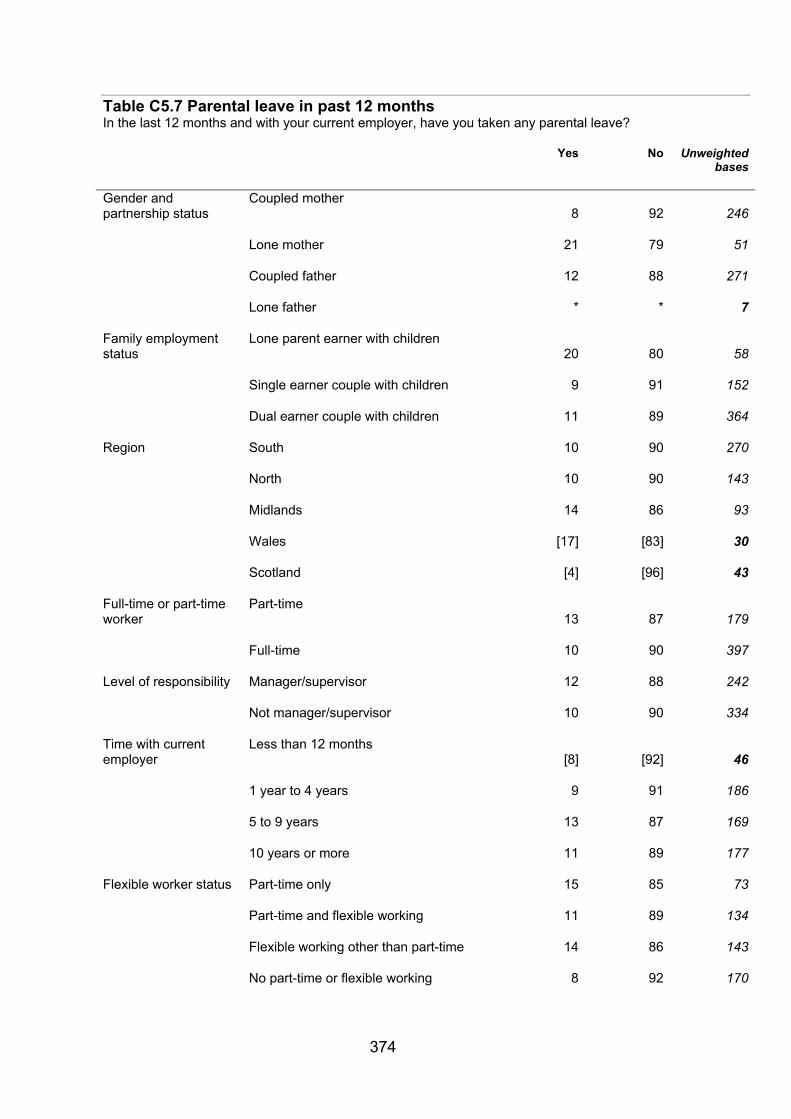
Table C5.7 Parental leave in past 12 months In the last 12 months and with your current employer, have you taken any parental leave?
Yes No Unweighted bases
Gender and partnership status
Coupled mother 8 92 246
Lone mother 21 79 51
Coupled father 12 88 271
Lone father * * 7
Family employment status
Lone parent earner with children 20 80 58
Single earner couple with children 9 91 152
Dual earner couple with children 11 89 364
Region South 10 90 270
North 10 90 143
Midlands 14 86 93
Wales [17] [83] 30
Scotland [4] [96] 43
Full-time or part-time worker
Part-time 13 87 179
Full-time 10 90 397
Level of responsibility Manager/supervisor 12 88 242
Not manager/supervisor 10 90 334
Time with current employer
Less than 12 months [8] [92] 46
1 year to 4 years 9 91 186
5 to 9 years 13 87 169
10 years or more 11 89 177
Flexible worker status Part-time only 15 85 73
Part-time and flexible working 11 89 134
Flexible working other than part-time 14 86 143
No part-time or flexible working 8 92 170
374

Table C5.7 Parental leave in past 12 months In the last 12 months and with your current employer, have you taken any parental leave?
Yes No Unweighted bases
Permanent 11 89 556
Temp, fixed or other * * 23
Trade union membership
TU/SA member 11 89 172
Not TU/SA member 11 89 403
Socio-economic classification
Managerial and professional occupations 11 89 326
Intermediate occupations 6 94 91
Routine and manual occupations 12 88 158
Sector Private 11 89 363
Public 11 89 205
Industry Manufacturing 6 94 56
Construction * * 15
Distribution, retail, hotels & restaurants 14 86 91
Transport, storage & communication [10] [90] 49
Banking, insurance, professional and support services 10 90 98
Public Admin, Education, Health 10 90 229
Other activities [12] [88] 28
Size of workplace Single site: 1-49 11 89 155
Single site: 50+ 11 89 253
Part of larger organisation: 1-49 10 90 94
Part of larger organsiation:50+ 11 89 58
Base: Parent employees with children aged under 6 (Parents Boost sample)
Some categories collapsed due to small cell sizes
Missing values: don’t know / refusal
Row per cent
375

Table C5.8 Time off to care for dependants in past 12 months In the last 12 months and with your current employer have you taken leave under these circumstances?
Yes No Unweighted bases
All employees (core sample) 19 81 1871
Gender Female 20 80 1095
Male 18 82 776
Age 16-24 15 85 111
25-39 21 79 490
40-49 21 79 555
50+ 18 82 682
Ethnicity White 20 80 1694
Non-white 12 88 149
Parental status Parent 23 77 773
Non-parent 17 83 1098
Highest qualification level
None 15 85 153
GCSEs/O Level/CSEs 22 78 373
A Levels 20 80 292
Degree/Professional qualifications
19 81 358
Postgraduate degree 14 86 283
Other vocational or academic qualifications, level not specified
19 81 254
Other 27 73 119
Household income
Under £15,000 22 78 159
£15,000 - £24,999 19 81 268
£25,000 - £34,999 18 82 246
£35,000 - £44,999 27 73 213
£45,000 or more 18 82 508
376

Table C5.8 Time off to care for dependants in past 12 months In the last 12 months and with your current employer have you taken leave under these circumstances?
Yes No Unweighted bases
Carer status Yes 29 71 381
No 17 83 1490
Disability status No 19 81 1593
Yes 20 80 253
Religion or faith None 21 79 566
Christian 19 81 1174
Other 8 92 99
Region South 21 79 849
North 17 83 414
Midlands 16 84 312
Wales 15 85 106
Scotland 22 78 190
Full-time or part-time worker
Part-time 19 81 536
Full-time 19 81 1316
Work status and gender
Male full-time 19 81 678
Female full-time 19 81 638
Male part-time 9 91 90
Female part-time 22 78 446
Level of responsibility
Manager/supervisor 19 81 695
Not manager/supervisor 19 81 1159
Time with current employer
Less than 12 months 7 93 139
1 year to 4 years 19 81 537
5 to 9 years 23 77 475
10 years or more 20 80 720
377

Table C5.8 Time off to care for dependants in past 12 months In the last 12 months and with your current employer have you taken leave under these circumstances?
Yes No Unweighted bases
Flexible worker status
Part-time only 16 84 250
Part-time and flexible working 23 77 364
Flexible working other than part-time
21 79 450
No part-time or flexible working 18 82 597
Tenure Permanent 20 80 1747
Temp, fixed or other 12 88 120
Trade union membership
TU/SA member 18 82 634
Not TU/SA member 20 80 1214
Socio-economic classification
Managerial and professional occupations
18 82 891
Intermediate occupations 18 82 274
Routine and manual occupations 21 79 672
Sector Private 20 80 1133
Public 18 82 695
Industry Manufacturing 19 81 183
Construction 20 80 58
Distribution, retail, hotels & restaurants
17 83 307
Transport, storage & communication
18 82 149
Banking, insurance, professional and support services
21 79 236
Public Admin, Education, Health 18 82 761
Other activities 26 74 112
Size of workplace
Part of larger organisation: 1-9 19 81 146
Part of larger organisation: 10-49 20 80 358
378

379
Table C5.8 Time off to care for dependants in past 12 months In the last 12 months and with your current employer have you taken leave under these circumstances?
Yes No Unweighted bases
Part of larger organisation: 50-249
19 81 374
Part of larger organisation: 250+ 17 83 388
Single site: 1-9 21 79 124
Single site: 10-49 22 78 211
Single site: 50-249 23 77 111
Single site: 250+ 20 80 78
Base: All employees (Core sample)
Some categories collapsed due to small cell sizes
Missing values: don’t know / refusal
Row per cent

Table C5.9 Type of childcare support provided by employer
Childcare facility
Financial help
Help with Information Other None Unweighted bases arrangements
during holidays
All parent employees 10 28 2 3 1 57 1286
Gender Female 12 28 2 4 1 54 778
Male 8 27 2 3 0 60 508
Age 16-24 [13] [22] [2] [3] [60] 30
25-39 8 34 1 3 0 54 513
40-49 11 25 2 5 1 56 569
50+ 10 15 3 2 70 161
Ethnicity White 10 27 2 3 0 57 1134
Non-white 12 27 1 3 2 55 145
Highest Qualification Level None 1 14 3 81 54
GCSEs/O Level/CSEs 9 15 1 4 0 70 237
A Levels 7 30 2 2 1 57 194
Degree/Professional
qualifications
12 36 2 4 0 45
292
380

Table C5.9 Type of childcare support provided by employer
Childcare facility
Financial help
Help with Information Other None Unweighted bases arrangements
during holidays
Postgraduate degree 16 35 1 4 1 43 230
Other vocational or
academic qualifications
, level not specified
8 30 0 2 1 59
175
Other 5 18 5 5 67 88
Annual household income Under £15,000 6 15 1 4 74 90
£15,000 - £24,999 9 17 2 4 68 183
£25,000 - £34,999 7 22 1 5 65 167
£35,000 - £44,999 13 25 5 3 55 153
£45,000 or more 10 40 1 4 1 44 428
Carer status Yes, child 13 24 1 3 58 64
Yes, relative in any household or non-relative adult in this household
8 26 2 5 58 200
Yes, non-relative adult in another household
* * * ** 18
No 10 28 2 3 1 57 1004
381

Table C5.9 Type of childcare support provided by employer
Childcare facility
Financial help
Help with Information Other None Unweighted bases arrangements
during holidays
Disability status No 10 28 2 4 1 56 1145
Yes 9 24 3 2 61 134
Religion/faith None 9 29 2 4 0 56 408
Christian 11 27 1 3 1 57 790
Other 5 27 4 2 62 80
Family status Lone parent 12 23 2 4 1 58 228
Couple parent 10 28 2 3 1 57 1051
Gender and partnership status
11 29 2 4 1 53 Coupled mother 574
Lone mother 13 23 2 3 1 58 200
Coupled father 8 27 2 3 0 60 477
Lone father [6] [23] [3] [4] [2] [61] 28
Family employment status Lone parent earner with children 12 23 2 4 1 58 228
Single earner couple with children 10 27 2 3 1 58 228
Dual earner couple with children 10 29 2 4 1 56 228
382

Table C5.9 Type of childcare support provided by employer
Childcare facility
Financial help
Help with Information Other None Unweighted bases arrangements
during holidays
Region South 9 31 3 3 1 53 581
North 10 25 1 3 61 316
Midlands 11 24 1 4 59 208
Wales 14 25 3 57 69
Scotland 8 26 1 5 61 112
Full-time or part-time worker Part-time
9 22 2 5 1 62 410
Full-time 10 30 2 3 1 54 868
Work status and gender Male full-time 8 28 2 3 1 58 467
Female full-time 14 33 2 2 1 48 401
Male part-time [3] [15] [3] [2] [76] 37
Female part-time 10 23 2 5 1 60 373
Level of responsibility Manager/supervisor 10 32 2 3 1 51 549
Not manager/supervisor 9 24 1 4 0 61 732
Length of service Less than 12 months 6 19 1 74 93
383

Table C5.9 Type of childcare support provided by employer
Childcare facility
Financial help
Help with Information Other None Unweighted bases arrangements
during holidays
1 year to 4 years 8 25 2 4 1 60 381
5 to 9 years 10 32 2 3 1 52 369
10 years or more 12 28 2 4 0 54 442
Flexible worker status Part-time only 10 22 1 67 168
Part-time and flexible working 9 25 2 6 2 56 300
Flexible working
other than part-time
13 37 2 4 1 42
322
No part-time or flexible working 9 25 1 2 0 62 353
Tenure Permanent 10 28 2 3 1 56 1222
Temporary - seasonal, 11 15 2 4 68
agency or casual 61
Trade union membership TU/SA member 15 28 2 4 1 50 427
Not TU/SA member 8 27 2 3 1 60 851
Socio-Economic Group
Managerial and professional
occupations
12 36 2 4 1 45
704
384

Table C5.9 Type of childcare support provided by employer
Childcare facility
Financial help
Help with Information Other None Unweighted bases arrangements
during holidays
Intermediate occupations 13 30 2 3 52 188
Routine and manual occupations 5 14 2 2 1 77 383
Sector Private 5 27 2 2 1 64 751
Public 20 29 2 6 0 41 511
SIC Manufacturing 3 20 2 3 72 108
Construction [8] [16] [5] [70] 33
Distribution, retail,
hotels & restaurants
2 15 3 2 1 77
183
Transport, storage & communication 2 49 1 1 48 104
Banking, insurance,
professional and support
services
9 47 1 1 42
184
Public Admin, Education, Health 19 25 2 6 1 47 579
Other activities 3 24 1 1 4 66 66
Size Part of larger organisation: 1-9 1 20 6 2 2 70 82
385

386
Table C5.9 Type of childcare support provided by employer
Childcare facility
Financial help
Help with arrangements
during holidays
Information Other None Unweighted bases
Part of larger organisation: 10-49 10 24 1 4 0 61 277
Part of larger organisation: 50-249 9 33 1 5 1 50 264
Part of larger organisation: 250+ 19 41 1 3 37 280
Single site: 1-9 6 3 5 1 84 84
Single site: 10-49 7 13 1 0 1 78 132
Single site: 50-249 5 32 2 5 56 73
Single site: 250+ 23 41 2 1 34 53
Base: Parent employees (core + boost sample)
Missing values: don’t know / refusal
Row per cent

Table C6.1 Flexible working by full-time employees
Full-time flexible working
Full-time, no flexible working
Unweighted bases
All full-time employees 40 60 1048
Gender Female 42 58 539
Male 39 61 509
Age 16-24 [12] [88] 43
25-39 43 57 282
40-49 48 52 324
50-59 39 61 305
60+ 35 65 76
Ethnicity White 42 58 946
Non-white 31 69 87
Parental status Parent 45 55 415
Non-parent 38 62 633
Highest None qualification level 18 82 72
GCSEs/O Level/CSEs 25 75 190
A Levels 32 68 152
Degree/Professional qualifications
57 43 215
Postgraduate degree 61 39 184
Other vocational or academic 38 62 157qualifications, level not
specified Other 32 68 58
Household income Under £15,000 21 79 55
£15,000 - £24,999 37 63 142
£25,000 - £34,999 35 65 139
£35,000 - £44,999 43 57 135
£45,000 or more 52 48 344
Carer status Yes, any 48 52 198
No 39 850
387

Table C6.1 Flexible working by full-time employees
Full-time flexible working
Full-time, no flexible working
Unweighted bases
Disability status No 41 59 893
Yes 40 60 893
Religion or faith None 43 57 333
Christian 41 59 638
Other 26 74 60
Region South 41 59 474
North 41 59 240
Midlands 37 63 165
Wales 45 55 57
Scotland 37 63 112
Level of Manager/supervisor responsibility 48 52 476
Not manager/supervisor 34 66 562
Time with current employer
Less than 12 months 24 76 71
1 year to 4 years 39 61 259
5 to 9 years 45 55 277
10 years or more 41 59 441
Trade union TU/SA member membership 48 52 393
Not TU/SA member 37 63 641
Socio-economic Managerial and professional classification occupations 53 47 582
Intermediate occupations 34 66 146
Routine and manual occupations
20 80 300
Sector Private 34 66 614
Public 55 45 417
Industry Manufacturing 22 78 111
Construction [41] [59] 35
388

Table C6.1 Flexible working by full-time employees
Full-time flexible working
Full-time, no flexible working
Unweighted bases
Distribution, retail, hotels & restaurants
18 82 135
Transport, storage & communication
45 55 92
Banking, insurance, 43 57 147professional and support
services Public Admin, Education,
Health 52 48 441
Other activities 48 52 50
Size of workplace Part of larger organisation: 1-9
28 72 68
Part of larger organisation: 10-49
32 68 197
Part of larger organisation: 50-249
44 56 219
Part of larger organisation: 250+
49 51 255
Single site: 1-9 [41] [59] 42
Single site: 10-49 32 68 112
Single site: 50-249 49 51 69
Single site: 250+ 58 42 54
Personal earned Under £10,000 income [21] [79] 47
£10,000 - £14,999 22 78 106
£15,000 - £24,999 35 65 275
£25,000 - £39,999 47 53 280
£40,000 or more 59 41 198
Gender make-up of Mostly women workplace 46 54 353
Mostly men 28 72 301
About half women and half men
46 54 386
Employment Yes contract of terms
42 58 and conditions 966
No 24 76 80
Usual hours worked Up to 35 hours - banded 40 60 225
389

Table C6.1 Flexible working by full-time employees
Full-time flexible working
Full-time, no flexible working
Unweighted bases
>35 - 40 hours 41 59 617
>40 - 48 hours 29 71 122
More than 48 hours 53 47 80
Family employment No children status 38 62 618
Lone parent earner with children
55 45 57
Single earner couple with children
37 63 106
Dual earner couple with children
48 52 249
Base: All full-time employees (Core sample)
Some categories collapsed due to small cell sizes
Missing values: don’t know / refusal
Row per cent
390
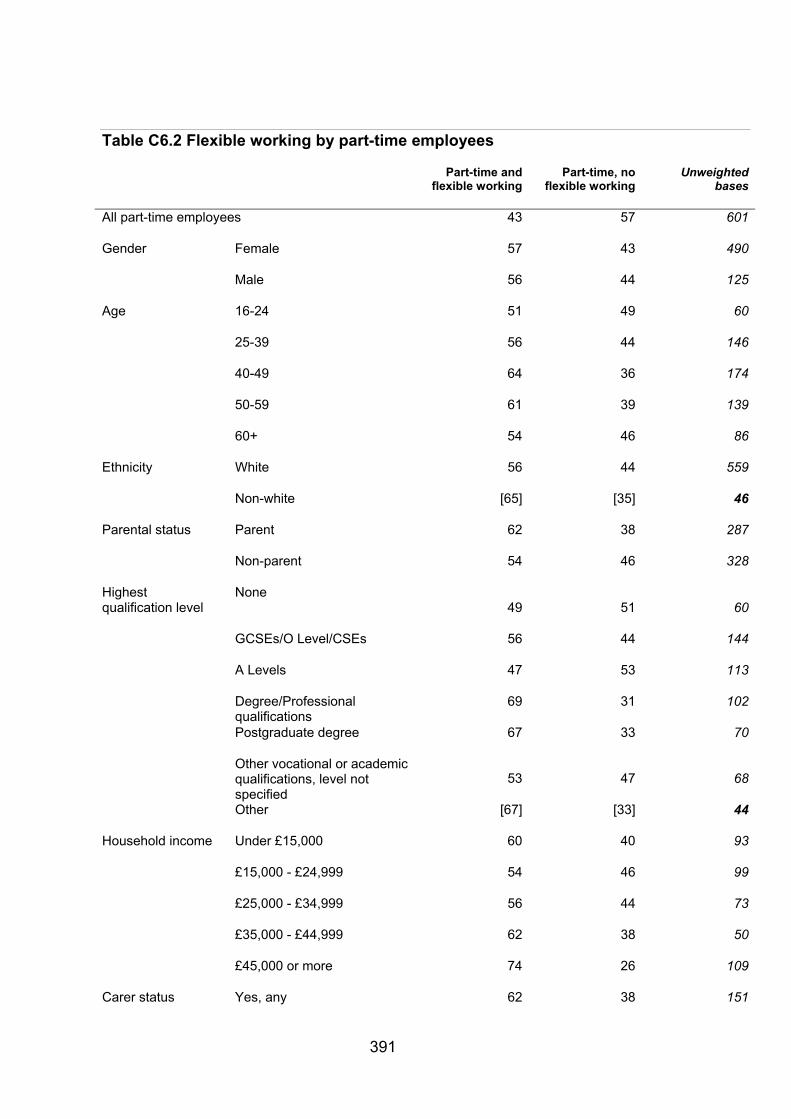
Table C6.2 Flexible working by part-time employees
Part-time and flexible working
Part-time, no flexible working
Unweighted bases
All part-time employees 43 57 601
Gender Female 57 43 490
Male 56 44 125
Age 16-24 51 49 60
25-39 56 44 146
40-49 64 36 174
50-59 61 39 139
60+ 54 46 86
Ethnicity White 56 44 559
Non-white [65] [35] 46
Parental status Parent 62 38 287
Non-parent 54 46 328
Highest qualification level
None 49 51 60
GCSEs/O Level/CSEs 56 44 144
A Levels 47 53 113
Degree/Professional qualifications
69 31 102
Postgraduate degree 67 33 70
Other vocational or academic qualifications, level not specified
53 47 68
Other [67] [33] 44
Household income Under £15,000 60 40 93
£15,000 - £24,999 54 46 99
£25,000 - £34,999 56 44 73
£35,000 - £44,999 62 38 50
£45,000 or more 74 26 109
Carer status Yes, any 62 38 151
391

Table C6.2 Flexible working by part-time employees
Part-time and flexible working
Part-time, no flexible working
Unweighted bases
No 56 44 464
Disability status No 57 43 521
Yes 54 46 521
Religion or faith None 58 42 177
Christian 56 44 398
Other [67] [33] 29
Region South 63 37 286
North 49 51 134
Midlands 46 54 106
Wales [52] [48] 35
Scotland 63 37 54
Level of Manager/supervisor responsibility 67 33 140
Not manager/supervisor 54 46 471
Time with current employer
Less than12 months 40 60 54
1 year to 4 years 59 41 213
5 to 9 years 58 42 146
10 years or more 60 40 202
Trade union TU/SA member membership 66 34 174
Not TU/SA member 54 46 435
Socio-economic Managerial and professional classification occupations 70 30 208
Intermediate occupations 48 52 109
Routine and manual occupations
53 47 290
Sector Private 51 49 356
Public 72 28 239
Industry Manufacturing * * 24
392

Table C6.2 Flexible working by part-time employees
Part-time and flexible working
Part-time, no flexible working
Unweighted bases
Construction * * 9
Distribution, retail, hotels & restaurants
47 53 154
Transport, storage & communication
[72] [28] 28
Banking, insurance, professional and support services
57 43 61
Public Admin, Education, Health
65 35 280
Other activities [64] [36] 45
Size of workplace Part of larger organisation: 1-9
56 44 57
Part of larger organisation: 10-49
57 43 133
Part of larger organisation: 50-249
48 52 106
Part of larger organisation: 250+
49 51 90
Single site: 1-9 61 39 67
Single site: 10-49 67 33 72
Single site: 50-249 [56] [44] 31
Single site: 250+ * * 20
Personal earned Under £10,000 income 47 53 266
£10,000 - £14,999 67 33 114
>£15,000 74 26 78
Gender make-up of Mostly women workplace 52 48 333
Mostly men 71 29 76
About half women and half men
56 44 195
Employment contract of terms and conditions
Yes
58 42 506
No 52 48 102
Usual hours worked Less than 30 hours - banded 54 46 503
More than 30 hours 68 32 109
393

Table C6.2 Flexible working by part-time employees
Part-time and flexible working
Part-time, no flexible working
Unweighted bases
Family employment status
No children 54 46 321
Lone parent earner with children
57 43 65
Single earner couple with children
[79] [21] 27
Dual earner couple with children
60 40 194
Base: All part-time employees (Core sample)
Some categories collapsed due to small cell sizes
Missing values: don’t know / refusal
Row per cent
394

Table C6.3 Flexible working by full-time employees who do not have the legal right to flexible working
Full-time flexible working
Full-time, no flexible working
Unweighted bases
All full-time employees
35 65 510
Gender Female 34 66 281
Male 36 64 229
Age 16-24 * * 34
25-39 41 59 121
40-49 46 54 113
50-59 38 62 181
60+ 34 66 51
Ethnicity White 35 65 472
Non-white [41] [59] 28
Highest qualification level
None [18] [82] 46
GCSEs/O Level/CSEs 22 78 103
A Levels 24 76 82
Degree/Professional qualifications
58 42 99
Postgraduate degree 62 38 77
Other vocational or academic qualifications, level not specified
27 73 72
Other * * 19
Household income Under £25,000 29 71 100
£25,000 - £34,999 39 61 74
£35,000 - £44,999 45 55 55
£45,000 or more 44 56 142
Disability status No 35 65 432
Yes 40 60 432
Religion or faith None 37 63 179
395

Table C6.3 Flexible working by full-time employees who do not have the legal right to flexible working
Full-time flexible working
Full-time, no flexible working
Unweighted bases
Christian 34 66 302
Region South 38 62 244
North 35 65 106
Midlands 37 63 64
Wales [33] [67] 33
Scotland 25 75 63
Level of responsibility
Manager/supervisor 41 59 202
Not manager/supervisor 32 68 301
Time with current employer
Less than 12 months [15] [85] 36
1 year to 4 years 38 62 129
5 to 9 years 42 58 123
10 years or more 34 66 222
Trade union membership
TU/SA member 44 56 185
Not TU/SA member 32 68 316
Socio-economic classification
Managerial and professional occupations
48 52 264
Intermediate occupations 27 73 82
Routine and manual occupations
19 81 150
Sector Private 28 72 303
Public 52 48 194
Industry Manufacturing 21 79 59
Construction * * 15
Distribution, retail, hotels & restaurants
14 86 74
Transport, storage & communication
[34] [66] 42
396

Table C6.3 Flexible working by full-time employees who do not have the legal right to flexible working
Full-time flexible working
Full-time, no flexible working
Unweighted bases
Banking, insurance, professional and support services
36 64 68
Public Admin, Education, Health
50 50 201
Other activities [46] [54] 26
Size of workplace 1-9 19 81 55
10-49 28 72 149
50-249 43 57 146
250+ 44 56 142
Personal earned income
Under £15,000 14 86 88
£15,000 - £24,999 33 67 138
£25,000 - £39,999 45 55 134
£40,000 or more 60 40 68
Gender make-up of workplace
Mostly women 38 62 171
Mostly men 21 79 145
About half women and half men
44 56 189
Employment contract of terms and conditions
Yes 37 63 467
No [18] [82] 41
Usual hours worked - banded
Up to 35 hours 32 68 107
>35 - 40 hours 37 63 310
More than 40 hours 35 65 91
Base: All full-time employees (Core sample)
Some categories collapsed due to small cell sizes
Missing values: don’t know / refusal
Row per cent
397

Annex D: Multivariate
output
Tables D1.1 to D1.3 show the output from logistic regression models. Regression analysis was used to identify the individual, job and employer characteristics associated with flexible working for all full-time employees, all part-time employees and full-time employees without the right to flexible working. The same methods were used for each analysis. All variables that were found to be significantly related to the outcome (flexible worker status) in the bivariate analysis were included in a stepwise regression model. Variables that were significantly associated with the outcome in the stepwise model were included in a final model. The final models are presented below; only those variables significantly related to the outcome are included. More details on the analysis methods are given in Annex A.
Table D1.1 Results of logistic regression - characteristics associated with full-time flexible working
Odds ratio 95 % confidence interval
Lower Upper
Industry Manufacturing 0.44 0.20 0.99
Construction 1.02 0.35 2.97
Distribution, retail, hotels & restaurants 0.32 0.14 0.74
Transport, storage & communication 0.87 0.40 1.89
Banking, insurance, professional and support services 0.56 0.26 1.21
Public Admin, Education, Health 0.76 0.38 1.52
Other activities 1.00
Gender make-up of workplace Mostly women 1.86 1.18 2.93
About half women and half men 1.79 1.18 2.73
Mostly men 1.00
Socio-economic classification
Managerial and professional occupations 2.19 1.40 3.42
398

Table D1.1 Results of logistic regression - characteristics associated with full-time flexible working
Odds ratio 95 % confidence interval
Lower Upper
Intermediate occupations 1.24 0.71 2.19
Routine and manual occupations 1.00
Age 16-24 1.00
25-39 4.01 1.35 11.87
40-49 5.47 1.85 16.19
50-59 4.15 1.39 12.38
60+ 4.40 1.32 14.67
Highest qualification level None 0.92 0.39 2.17
A Levels 1.65 0.92 2.96
Degree/Professional qualifications 2.52 1.49 4.27
Postgraduate degree 2.45 1.40 4.30
Other vocational or academic qualifications, level not specified 1.52 0.89 2.59
Other 1.27 0.58 2.82
GCSE/O level/CSEs 1.00
Constant 0.06 0.02 0.23
Response is: 1 = flexible worker, 0 = not flexible worker
Rows with blank confidence intervals signify the reference categories
Figures in bold vary significantly from the baseline (95% level)
399

Table D1.2 Results of logistic regression - characteristics associated with part-time flexible working
Odds ratio 95 % confidence interval
Lower Upper
Gender make-up of workplace
Mostly women 0.39 0.20 0.76
About half women and half men 0.50 0.25 1.00
Mostly men 1.00
Sector Public 2.40 1.51 3.80
Private 1.00
Personal earned income Missing 1.52 0.83 2.80
£10,000 - £14,999 1.89 1.07 3.34
£15,000 - £24,999 2.08 1.03 4.21
£25,000 or more 3.40 1.49 7.76
Less than £10,000 1.00
Constant 1.53 0.82 2.88
Response is: 1 = flexible worker, 0 = not flexible worker
Rows with blank confidence intervals signify the reference categories
Figures in bold vary significantly from the baseline (95% level)
400

Table D1.3 Results of logistic regression - characteristics associated with flexible working of full-time employees without the legal right to flexible working
Odds ratio 95 % confidence interval
Lower Upper
Personal earned income Missing 2.36 0.88 6.31
£15,000 - £24,999 3.03 1.26 7.26
£25,000 - £39,999 3.44 1.39 8.53
£40,000 or more 6.45 2.47 16.85
Less than £15,000 1.00
Gender make-up of workplace Mostly women 2.66 1.36 5.19
About half women and half men 2.70 1.47 4.95
Mostly men 1.00
Sector Public 1.73 1.06 2.83
Private 1.00
Highest qualification level None 1.24 0.41 3.79
A Levels 1.03 0.44 2.41
Degree/Professional qualifications 2.91 1.31 6.44
Postgraduate degree 2.77 1.19 6.45
Other 1.01 0.42 2.42
GCSE/O level/CSEs 1.00
Constant 0.05 0.02 0.15
Response is: 1 = flexible worker, 0 = not flexible worker
Rows with blank confidence intervals signify the reference categories
Figures in bold vary significantly from the baseline (95% level)
401

Annex E: Correlations of
take-up
Tables E1.1 to E1.3 show the correlation between different forms of flexible working arrangements for employees who had taken up more than one form of flexible working. Pearson’s correlation coefficients, p-values from two-tailed significance tests and unweighted bases are given for all pairs of flexible working arrangements. The results are presented as a matrix. Those wishing to find the correlation between take up of working temporarily reduced hours and take up of flexitime would find the point at which these two measures crossed. Table E1.1 shows the correlation of these two measures to be -.143, a negative correlation that is statistically significant at the five per cent level (p-value <0.05). This means flexitime is negatively and significantly correlated with temporarily reduced hours; an employee is unlikely to work this particular combination of arrangements.
Table E1.1 Correlation of take up of flexible working arrangements
Worked part-
time in past year
Worked school
term-time
only in past year
Worked a job
share in past year
Worked flexitime
in past year
Worked tempora
rily reduce
hours in past year
Worked from
home in past year
Worked compre
ssed hours in
past year
Worked annualis
ed hours in
past year
Pearson Correlation
1 .221 .264 -.157 .155 -.287 -.074 -.018Worked part-time in past year
P-value .000 .000 .004 .005 .000 .218 .842
N 475 247 285 334 331 179 280 131
Pearson Correlation
1 .050 -.253 -.105 -.189 -.023 .307Worked school term-time only in past year
P-value .509 .001 .169 .069 .788 .004
N 257 173 170 173 93 140 86
Pearson Correlation
1 -.165 -.047 -.259 .005 .091Worked a job share in past year
P-value .018 .497 .003 .953 .364
N 296 207 213 126 171 100
402

Table E1.1 Correlation of take up of flexible working arrangements
Worked part-
time in past year
Worked school
term-time
only in past year
Worked a job
share in past year
Worked flexitime
in past year
Worked tempora
rily reduce
hours in past year
Worked from
home in past year
Worked compre
ssed hours in
past year
Worked annualis
ed hours in
past year
Pearson Correlation
1 -.143 .077 -.104 -.030Worked flexitime in past year
P-value .021 .310 .096 .762
N 367 260 176 258 107
Pearson Correlation
1 .013 .131 .012Worked temporarily reduce hours in past year
P-value .875 .048 .902
N 354 144 229 110
Worked from home in past year
Pearson Correlation
1 -.092 .092
P-value .280 .482
N 202 139 61
Worked compressed hours in past year
Pearson Correlation
1 .112
P-value .243
N 304 110
Worked annualised hours in past year
Pearson Correlation
1
P-value
N 144
Notes: Significant correlations are highlighted. Green shading highlights a positive correlation, blue shading highlights a negative correlation.
Base: Employees who took up more than one flexible working arrangement
403

Table E1.2 Correlation of take up of flexible working arrangements by parents
Worked part-
time in past year
Worked school
term-time
only in past year
Worked a job
share in past year
Worked flexitime
in past year
Worked tempora
rily reduce
hours in past year
Worked from
home in past year
Worked compre
ssed hours in
past year
Worked annualis
ed hours in
past year
Pearson Correlation
1 .295 .292 -.219 .067 -.302 -.079 -.053Worked part-time in past year
P-value .000 .000 .000 .276 .000 .242 .585
N 396 218 240 262 265 166 223 109
Pearson Correlation
1 .058 -.462 .006 -.080 .006 .291Worked school term-time only in past year
P-value .467 .000 .944 .458 .947 .008
N 228 158 139 152 89 114 81
Pearson Correlation
1 -.121 .073 -.387 -.021 .175Worked a job share in past year
P-value .112 .325 .000 .798 .123
N 257 173 183 115 148 79
Worked flexitime in past year
Pearson Correlation
1 -.043 .075 .086 -.119
P-value .516 .346 .218 .261
N 296 226 161 206 91
Pearson Correlation
1 .059 .138 .006Worked temporarily reduce hours in past year
P-value .485 .050 .957
N 295 144 201 96
Worked from home in past year
Pearson Correlation
1 -.122 .155
P-value .164 .237
N 196 131 60
Pearson Correlation
1Worked compressed hours in past year
.241
P-value .024
404

Table E1.2 Correlation of take up of flexible working arrangements by parents
Worked part-
time in past year
Worked school
term-time
only in past year
Worked a job
share in past year
Worked flexitime
in past year
Worked tempora
rily reduce
hours in past year
Worked from
home in past year
Worked compre
ssed hours in
past year
Worked annualis
ed hours in
past year
N 245 88
Worked annualised hours in past year
Pearson Correlation
1
P-value
N 121
Notes: Significant correlations are highlighted. Green shading highlights a positive correlation, blue shading highlights a negative correlation.
Base: Parents who took up more than one flexible working arrangement
405

Table E1.3 Correlation of take up of flexible working arrangements by carers
Worked part-
time in past year
Worked school
term-time
only in past year
Worked a job
share in past year
Worked flexitime
in past year
Worked tempora
rily reduce
hours in past year
Worked from
home in past year
Worked compre
ssed hours in
past year
Worked annualis
ed hours in
past year
Pearson Correlation
1 .240 .319 -.175 .111 -.041 .022 -.114Worked part-time in past year P-value .004 .000 .020 .140 .673 .793 .334
N 249 142 155 178 178 106 146 74
Pearson Correlation
1 .107 -.336 -.081 -.335 -.089 .280Worked school term-time only in past year
P-value .289 .001 .424 .015 .431 .043
N 142 101 93 100 52 81 53
Pearson Correlation
1 -.203 -.012 -.041 -.150 -.090Worked a job share in past year P-value .030 .889 .735 .140 .489
N 157 115 129 71 98 61
Pearson Correlation
1 -.150 .203 -.206 .115Worked flexitime in past year P-value .073 .041 .017 .375
N 190 145 102 133 62
Worked temporarily reduce hours in past year
Pearson Correlation
1 -.172 .145 -.099
P-value .108 .112 .424
N 184 89 122 67
Pearson Correlation
1 -.218 .246Worked from home in past year P-value .045 .111
N 114 85 43
Worked compressed hours in past
Pearson Correlation
1 -.043
P-value .733
406

407
Table E1.3 Correlation of take up of flexible working arrangements by carers
Worked part-
time in past year
Worked school
term-time
only in past year
Worked a job
share in past year
Worked flexitime
in past year
Worked tempora
rily reduce
hours in past year
Worked from
home in past year
Worked compre
ssed hours in
past year
Worked annualis
ed hours in
past year
year N 155 65
Pearson Correlation
1
P-value
Worked annualised hours in past year
N 76
Notes: Significant correlations are highlighted. Green shading highlights a positive correlation, blue shading highlights a negative correlation.
Base: Carers who took up more than one flexible working arrangement

© Crown copyright 2012
You may re-use this information (not including logos) free of charge in any format or medium, under the terms of the Open Government Licence. Visit www.nationalarchives.gov.uk/doc/open-government-licence, write to the Information Policy Team, The National Archives, Kew, London TW9 4DU, or email: [email protected].
This publication is also available on our website at www.bis.gov.uk
Any enquiries regarding this publication should be sent to:
Department for Business, Innovation and Skills 1 Victoria Street London SW1H 0ET Tel: 020 7215 5000 If you require this publication in an alternative format, email [email protected], or call 020 7215 5000. URN 12/P151 ISBN 978-0-85605-769-4