Embed Size (px)
Citation preview

The free license codes as Decision Support System (DSS) for the
emergency planning to simulate radioactive releases in case of accidents
in the new generation energy plants
Andrea Malizia1,2, Mariachiara Carestia1,2 , Claudio Cafarelli2, Laura Milanese2, Simona Pagannone2,
Amedeo Pappalardo2, Massimo Pedemonte2, Gianna Latini2, Oscar Barlascini2, Eugenio Fiorini2,
Paolo Maurizio Soave2, Daniele Di Giovanni1,2, Orlando Cenciarelli1,2, Luca Antonelli1,2, Fabrizio
D’Amico1,2 and Leonardo Palombi2,3, Carlo Bellecci1,2, Pasqualino Gaudio1,2
1. ASSOCIAZIONE ENEA-EURATOM per la FUSIONE, Department of Industrial Engineering, University of Rome
“Tor Vergata”, Via del Politecnico 1, 00133 Rome, (Italy)
2. International Master Courses in Protection Against CBRNe events, Department of Industrial Engineering and School of
Medicine and Surgery, University of Rome Tor Vergata ( www.mastercbrn.com )
3. Department of Biomedicine and Prevention, School of Medicine and Surgery, University of Rome Tor Vergata, Via
di MontPellier 1, 00133 Rome, (Italy)
Corresponding author: Andrea Malizia, PhD – [email protected]
Abstract: - The radiological risk is related to a wide range of activities, beginning with the medical and
military ones and including those connected to the industrial and research activities such as nuclear fusion. A
valid tool to predict the consequences of the accidents and reduce the risk is represented by computing systems
that allow modeling the evolution of a possible release of radioactive materials over time and space. In
addition to proprietary codes there are free license codes, like Hot-Spot, that allow providing a set of tools to
simulate diffusion in case of accidents involving radioactive materials and analyze the safety and security of the
facilities in which the radioactive material is manipulated. The case studies scenario’s consists in two
simulations accidents scenario the first to biomass plant and the second at nuclear fission plant.
The simulation of the radioactive contamination have been conducted with the code HOT SPOT, a free license
code. The results of the simulation and data discussion will be presented in this work by the authors.
Key-Words: - Biomass, Nuclear Fission, Accident, Radioactive, Contamination, Cesium, Energy, Safety,
Security, DSS
1 Introduction
Nowadays the Decision Support Systems (like
software) to support experts during the emergency
planning operations in case of an unconventional
events (like a radioactive diffusion) are one of the
key safety and security issue of the new millennium.
The accidents, (either intentional or natural) that
cause a negative impact on environment and human
health, are increasing proportionally to the needs of
energy of human society. Chernobyl and Fukushima
are just two examples of contaminations that have
provoked short term and long term negative
consequences. The DSS are necessary not only to
guarantee the correct chose of safety way out that
increase the safety of operators and population in
case of accident but also to improve the prevention
phase that is essential in an emergency planning
system. The work has been developed in the context
of the activities of the International Master Courses
in Protection Against CBRNe events and realized by
experts (the students of the Master) coming from
Academic Entities and also from Minister of Interior
and Ministry of Defence. According to the high cost
of the DSS officially used by these Ministers, the
authors decide to test free license tools to
demonstrate their functionality in case of
emergency. The free license code used in this work
is HOT SPOT code, it was used to simulate different
type of radioactive accident scenarios and the
diffusion of contamination in open field. The
authors decide to simulate two different types of
accidental events: 1) a biomass plant from energy
production that use combustible taken in the
neighborhood of Chernobyl and contaminated with 137Cs due to the radioactive fallout [1-3].The
geographical area considered to simulate this
scenario has been an industrial area of Piemonte
(Italy region) full of biomass plants. 2) The
WSEAS TRANSACTIONS on ENVIRONMENT and DEVELOPMENT Andrea Malizia et al.
E-ISSN: 2224-3496 453 Volume 10, 2014

radiological accident in the reprocessing plant at
Tomsk, which occurred on 6th April 1993 during
the reprocessing of irradiated reactor fuel at the
Siberian Chemical Enterprise (SCE) in the Radio
Chemicals Work (RCW) facility at Tomsk-7 that is
has been widely described in the International
Atomic Energy Agency publication “Radiological
accident in the reprocessing plant at Tomsk in 1993.
The HOT SPOT code has been used in the present
paper to simulate the radioactive diffusion due to at
two case studies accident. In this paper, the scenario
together with the main results of the simulations will
be presented, analyzed and discussed to understand
the real possibility to use HOT SPOT as DSS during
the prevention and/or intervention emergency
phases.
2 Problem Formulation 2.1 Case study 1 Large parts of north-eastern Europe have been
subject to fallout of radioactive nuclides “fallout"
after the Chernobyl accident. These radioactive
nuclides have been deposited on the ground at
concentrations highly variable from area to area
depending on the weather conditions and orography
[1-3].
Many years after the event, the Cs-137 remains the
dominant radionuclide contamination, since it has a
medium half-life (30 years) and it is characterized
by a high mobility in the environment.
The cesium is "moving" in ecosystems
contaminated by passing from an array to another:
from the atmosphere to the water and from the water
back to the plants, soils, animals, humans and so on.
If the radionuclides deposited on the ground, as a
consequences of rain events, pass from the surface
layers to the deeper ones becomes chemically
available for roots uptake by trees. It happened after
the nuclear disaster at Chernobyl, cesium has
reached the deeper layers of the ground and has
been “uptake” from the roots of forest trees thanks
to competition mechanisms with the potassium ion,
and the roots metabolize it [4].
The degree of contamination is different depending
on whether and if the lands are cultivated or not. In
farmlands, the continuous mixing causes the cesium
homogenous distribution in various ground layers; if
the land is not cultivated, the cesium has time to
sink from the surface layers to the deep ones. The
factors that make the ground a potential source of
release are manifold: the composition of the soil in
the percentage of clay and organic components, the
pH, etc. .
Between the ground and the roots is established a
balance of trade, maintained by the so-called "ionic
labile pool" of ground which serves to provide bio-
available elements for the roots.
For those that are its chemical characteristics, the
cesium in the ground is available only in a soluble
form. It is absorbed by the roots of the plants that,
with a delay of a few years, achieve a certain
amount of cesium in the wood of trees grown on the
contaminated ground.
Since of the half-life of cesium-137 about 30 years,
it is still possible to detect the presence of
radioactive material in the timber from areas
affected by the Chernobyl disaster.
It has been decided to simulate the consequences of
an accident in a biomass plant for energy production
using combustible coming from areas situated in the
neighborhood of Chernobyl. It has been choose the
Piemonte a region north Italy of because of its high
density of biomass plants (see Figure 1).
Fig.1. Map of thermic plants in Piemonte. The red box represent the
selected point in which the accidents has been simulated
The biomass plant selected for the simulation has an
estimated medium annual consume of 3680 m3 of
wood combustible (“cippato”). The plant is active
130 days per year and the estimated daily medium
consume of wood combustible is 28 m3 (almost
8400 Kg considering that a combustible with a
medium weight of 300 Kg/m3 and a humidity of
40%).
The height of emission point of the plant has been
estimated at 15m with a diameter of 60cm in
agreements with the real data of the plants.
The accident scenarios simulated are dispersion of 137CS from chimney in different conditions
WSEAS TRANSACTIONS on ENVIRONMENT and DEVELOPMENT Andrea Malizia et al.
E-ISSN: 2224-3496 454 Volume 10, 2014

2.2 Case study 2
The reprocessing procedure for spent nuclear fuel in
the RCW (Recirculated Cooling Water) facility
requires subsequent steps in which irradiated
standard uranium blocks were loaded into vessels
and dissolved in concentrated nitric acid [28]. The
resulting solution transferred to other vessels where
it was prepared for extraction by adjusting the
acidity and temperature. The stainless steel vessels,
which had a volume of 34 m3 and incorporate a
steam heating and cooling sleeve, were located in a
series of cells below the ground level, with 2m thick
concrete walls and a concrete roof. During this
process, an essential step represented by the
insufflation of compressed air in the vessel, which is
necessary to ensure the mixing of the different
solutions in order to avoid:
The separation of the solutions;
The exergonic reaction between the nitric
acid solution and the organic solvent,
mainly TBP (tributylphosphate).
This is a very critical step because a lack of
compressed is one of the main causes of the
accident and it is not possible to determine if it due
to a human error or a plant failure. This
phenomenon was the cause at Tomsk-7 of the
energetic reaction between nitric acid and the
organic substances that provoked an increase of
temperature and increase of gas production. The
operators endeavors to depressurize the vessel
trough adjacent installations were unsuccessful
because the amount of gas was higher than the one
that could be vented through the stack so under
these conditions the pressure rose up to 18 atm
leading to the rupture of the vessel. The resulting
shock wave was sufficiently intense to raise and
displace the concrete slabs forming the roof of the
cell causing a structural damage to the equipment
room above. A schematic representation of the
installation involved in the accident is showed in
Figure 2. [28]
According to the technical documentation, during
the accident the solutions in the vessel involved in
the explosion was supposed to contain a total of:
449 ± 120 g of Plutonium (specific
activity of 2,3 TBq/kg) ;
8757 ± 286 kg of Uranium (specific
activity of 12.4 MBq)
Fig. 2 : Schematic diagram of the installation which shows the location
of the vessel and the rooms above involved in the accident[28]
Corresponding to total activities of 1.0 TBq and
0.11TBq respectively [29].
These data are in contrast with those obtained from
the cleanup operations conducted after the accident
where:
577± 117 g of Plutonium
8707 ± 350 kg of Uranium
and were collected from the installation and the cell
in which they were located. The authors of the
IAEA report [28] state that this discrepancy may be
due to the fact that part of the material recovered
after the accident originated by previous extraction
cycles.
A month after the accident, soil samples were
collected for the assessment of the ground
contamination on the SCE site and its proximity.
The total beta and gamma activity detected was 4.3
TBq whose main contribution was due to the
following radionuclides: 0.04TBq of 103Ru, 0.92
TBq of 106Ru, 0.80 TBq of 95Zr and 2.54 TBq of 95Nb
In order to estimate the total activity released during
the accident two models, based on the extrapolations
derived from the levels of contamination, have been
used. Both these models based on the Risø PUFF
diffusion model, a three-dimensional model which
simulates the release of Gaussian pollutant puffs
predicting their concentration as they diffused and
affected downwind by a horizontally homogeneous
time-dependent wind, taking into account
atmospheric characteristics such as turbulence
intensity, potential temperature gradient, buoyant
WSEAS TRANSACTIONS on ENVIRONMENT and DEVELOPMENT Andrea Malizia et al.
E-ISSN: 2224-3496 455 Volume 10, 2014
heat flux and maximum mixing depth [30]. The first
model (Model 1) makes the assumption of a release
time of 15min and incorporated measurements of
the radionuclide content taken from 11 snow
samples
[31], while the second (Model 2) makes the
assumption of an instant time release and
incorporated measurement from 120 samples of
snow and soil taken from 16 profiles across the
area[32]. Estimates of the amount of different
radionuclides evaluated from these two models are
shown in table 1.
Tab. 1 : Estimated activity (TBq) released during the accident [28].
The releases due to the accident started in two
different places:
1. through breaches in the walls at a height of
15-30 m which accounted for 50-60% of the
activity released,
2. the roof at a height of 100-150 m.
Furthermore, the measurement of the ground
contamination showed a singularity consisting in the
presence of two maxima in the deposited activity
across the contaminated area at right angles to the
direction of the release at distances up to 12km from
the Radio Chemical Works (RCW).
The authors of the report state that this pattern could
be explained assuming that the release originating
from the roof and the walls of the RCW are
combined together with the wind directions which,
for the different heights are considered different
(190 degrees at ground level and 210 degrees at
100-200m height) [28].
3 Materials and methods 3.1 HOTSPOT code The HotSpot Health Physics code and HotSpot
codes are aimed at providing emergency response
personnel and emergency planners with a fast, field-
portable set of software tools for evaluating
incidents involving radioactive materials [5]. The
software is also used for safety analysis of facilities
handling radioactive materials.. It is designed for
near-surface releases, short-range (less than 10 km)
dispersion, and short-term (less than 24 hours)
release duration. The HotSpot codes are
continuously updated to incorporate the most
current and approved radiological dose conversion
data and methodologies. These codes are based on
the well-established Gaussian Plume Model (GPM).
Main advantages of the Gaussian plume models are:
1) short computation time, 2)extensive validation
and broad acceptance worldwide. For the evaluation
of radiological scenarios, HotSpot uses the methods
of radiation dosimetry recommended by the
International Commission on Radiological
Protection (ICRP) [6] and the US Environmental
Protection Agency’s (EPA) Federal Guidance
Reports No. 11, 12 and 13 [7-9]. In order to
simulate different meteorological conditions HOT
SPOT allows the selection of the Pasquill classes.
3.1.1 Pasquill Classes used in HOT SPOT
Meteorologists distinguish several states of the local
atmosphere: A, B, C, D, E, F. These states can be
tabulated as a function of weather conditions, wind
speed and time of day. According to the stability
class, the attack can result in a wide spectrum of
lethal effects. Therefore, the potential terrorist will
certainly consider those, just as it happens by war-
planners, so that the lethal effects are maximized.
The stability of the atmosphere depends on the
temperature difference between an air parcel and the
air surrounding it. Therefore, different levels of
stability may depend on the temperature difference
between the air Parcel and the surrounding air. [10-
11].
The stability classes used for this work are referred
to Pasquill – Gifford stability [10]. Stability classes
A, B, and C refer to daytime hours with unstable
conditions. Stability D is representative of overcast
days or nights with neutral conditions. Stabilities E
and F refer to night time, stable conditions and are
based on the amount of cloud cover. Thus,
classification A represents conditions of the greatest
instability, and classification F reflects conditions of
the greatest stability.
Radionuclide
Model 1
activity
(Tbq)
Model 2
activity (TBq)
106Ru 11.1 7.9
103Ru 0.37 0.34
95Nb 17.4 11.2
95Zr 7.8 5.1
14Ce - 0.37
144Ce - 0.24
125Sb - 0.10
239Pu 7.4 10-3 5.2 10-3
Total 36.7 25.3
WSEAS TRANSACTIONS on ENVIRONMENT and DEVELOPMENT Andrea Malizia et al.
E-ISSN: 2224-3496 456 Volume 10, 2014
3.2 SELECTION OF BUONDARY
CONDITIONS 3.2.1 Case study 1
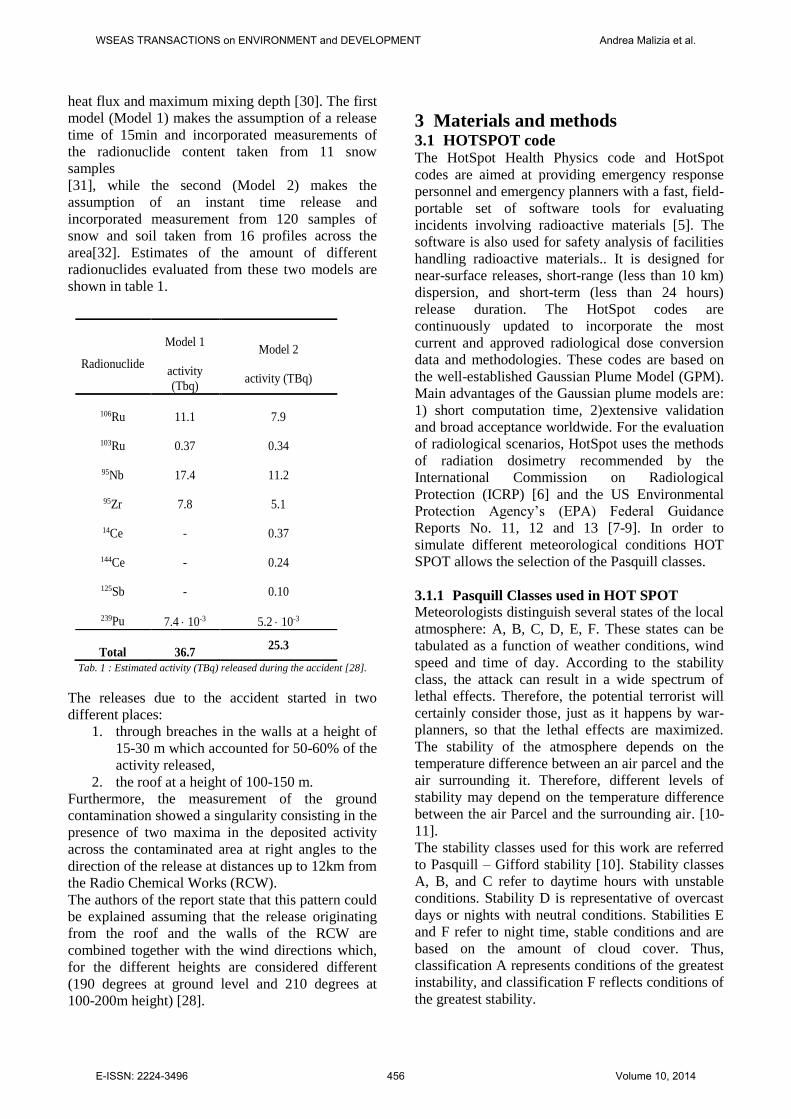
The authors, expert in simulation of unconventional
events [12-19, 24-27], choose the model “General
Plume” to simulate the accident that is ideal for the
radioactive release from a chimney [17,19,23]. After
that the principal boundary conditions has been
uploaded in the GUI (Graphical User Interface) of
the software (see Figure 3).
Fig.3. Source term condition uploaded in HOT SPOT GUI
In order to estimate the contamination values of 137Cs in the wood has been considered the data from
a technical report by University of Pavia [20]. The
maximum level of contamination detected have
been 320 Bq/Kg for combustible wood (“cippato”)
and 40000 Bq/Kg for ashes. The combustion of
wood generates 85% of volatile substances, the 14%
of carbon and the 1% of ashes so in the simulation
the authors consider only the activity of combustible
wood as value of contamination. The reality, as
reported in [21], the use of ashes is considered the
worst for human health, but it is not considered in
this work.
The accident scenarios simulated have been two. In
table 2 are reported the two different meteorological
conditions:
Scenario Wind speed
(at 15 m)
Stability
Class
Wind
Direction
1 3 m/s C 225
(from SW)
2 0,5 m/s D 225
(from SW) Tab. 2. Meteorological conditions
For both the scenarios, the height of the emission
point is 15 meters and the sampling times has been
fixed at 30 minutes. The DFC library used is the
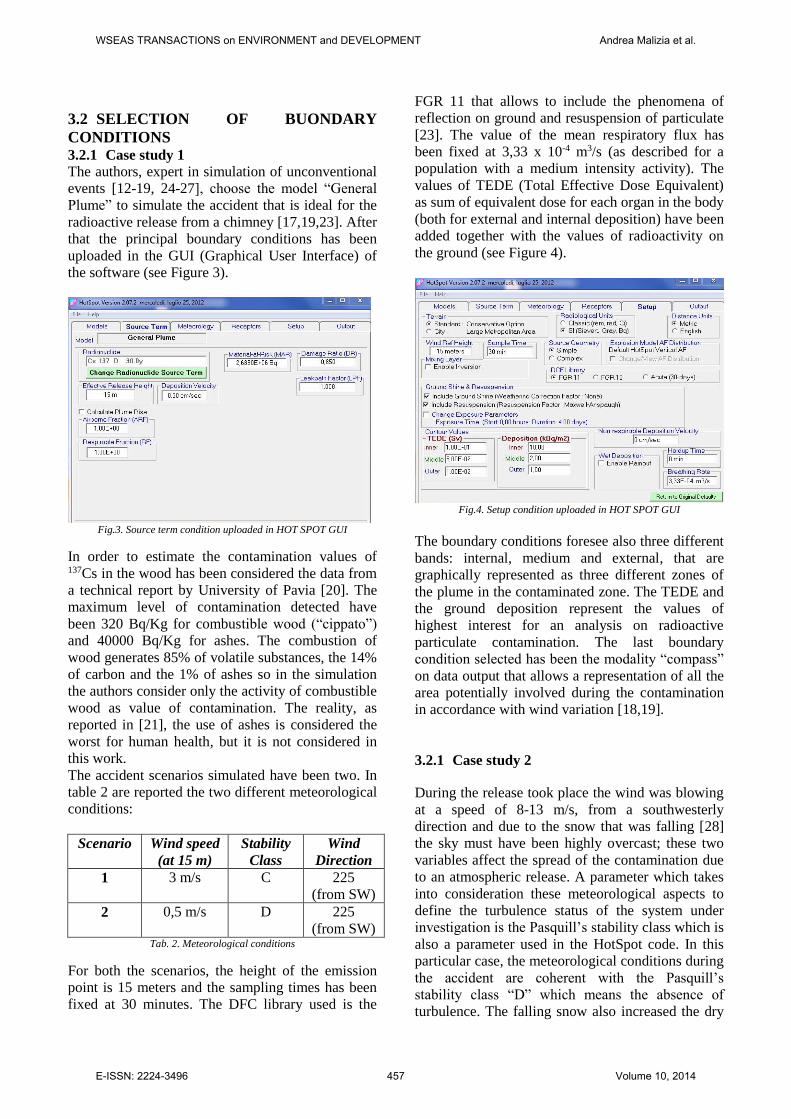
FGR 11 that allows to include the phenomena of
reflection on ground and resuspension of particulate
[23]. The value of the mean respiratory flux has
been fixed at 3,33 x 10⁻⁴ m3/s (as described for a
population with a medium intensity activity). The
values of TEDE (Total Effective Dose Equivalent)
as sum of equivalent dose for each organ in the body
(both for external and internal deposition) have been
added together with the values of radioactivity on
the ground (see Figure 4).
Fig.4. Setup condition uploaded in HOT SPOT GUI
The boundary conditions foresee also three different
bands: internal, medium and external, that are
graphically represented as three different zones of
the plume in the contaminated zone. The TEDE and
the ground deposition represent the values of
highest interest for an analysis on radioactive
particulate contamination. The last boundary
condition selected has been the modality “compass”
on data output that allows a representation of all the
area potentially involved during the contamination
in accordance with wind variation [18,19].
3.2.1 Case study 2
During the release took place the wind was blowing
at a speed of 8-13 m/s, from a southwesterly
direction and due to the snow that was falling [28]
the sky must have been highly overcast; these two
variables affect the spread of the contamination due
to an atmospheric release. A parameter which takes
into consideration these meteorological aspects to
define the turbulence status of the system under
investigation is the Pasquill’s stability class which is
also a parameter used in the HotSpot code. In this
particular case, the meteorological conditions during
the accident are coherent with the Pasquill’s
stability class “D” which means the absence of
turbulence. The falling snow also increased the dry
WSEAS TRANSACTIONS on ENVIRONMENT and DEVELOPMENT Andrea Malizia et al.
E-ISSN: 2224-3496 457 Volume 10, 2014

deposition velocity of the particles released of a
factor of ten taking into account also the dry
deposition velocity estimated to be 1,0x10⁻³ ms-1, in
fact the estimated deposition velocity for all the
gamma and beta emitters varied between 0.15 and
0.20ms-1 . The HotSpot model chosen for the
benchmark was “General Explosion”. This model
allows the user to specify the quantity of high
explosive (TNT equivalent) which caused the
explosion; the default value of the code is 1 lb (a
conservative estimate of the TNT equivalent of an
exploding vehicle gas tank [33] which resulted
appropriate also for simulating the rupture of the
vessel due to the high pressure). The IAEA report
did not provide sufficient data regarding the initial
content of 106Ru. It did provide the estimated
activity released during the accident according to
two different dispersion models which ranged
between 7.9 and 11.1 TBq. Starting from this
experimental evidence, the authors selected the
mean value of 9.5 TBq supposed to be an
appropriate value for the “Source Term”.
Furthermore, since this was an estimate of the 106Ru
already deposited on the ground, the default value of
1.0 for the Damage Ratio (the fraction of the MAR
actually impacted in the release scenario) has been
chosen, meaning that all the MAR was released.
Since the explosion created a breach in the roof and
side walls of the installation, no filtration
mechanism could have mitigated the release of the
MAR. The software evaluates this feature in terms
of “Leakpath Factor” ( i.e. the fraction of the MAR
that passes through some confinement or filtration
mechanism: a value of 1.0, chosen for the
benchmark, is representative of the absence of such
mechanisms). The Deposition Velocity estimated
for the deposition of the beta-gamma emitters was
of about 0.20ms-1 [34] and this was the value
chosen for the benchmark. As mentioned above, the
simulations were divided in two distinct groups of
scenario named “Simulations 190°” and
“Simulations 210°” with regard to the different wind
directions assuming the release of the 65% of the
total 106Ru activity and the release of 35% of the
total 106Ru activity (6,175 TBq and 3,325 TBq
respectively). The “General Explosion” one does
not allow the user to set the release height. The only
parameters introduced to “simulate” different
meteorological conditions at different height were
the wind speed (5 ms-1 and 10 ms-1) and the stability
Pasquill classes D and C, which are the first and
second more probable stability classes for the height
of 20 and 125 m [35] (used in the simulations as
mean value for the release height). Furthermore, for
each scenario, different sample times have been
considered. Finally, since the duration of the release
could not be assessed during the accident, two
different sample times have been chosen for each
simulation in order to evaluate both: an
instantaneous (1min sample time) and time
protracted release (10min sample time). Options and
values for the simulations are shown in Table 3 and
Table 4.
Tab. 3: Options and values for: a) Simulations 190°(unmodified
HotSpot default values are not shown).
Tab. 4: Options and values for: a) Simulations 210°(unmodified
HotSpot default values are not shown).
Simulations 190°
Model General Explosion
Source Term
Radionuclide Ru-106 W 368.2 d
Material-at-
Risk 6,175 TBq
Deposition
Velocity 20 cms-1
Simulation 190° D Simulation 190° C
190° D WS 5 ms-1 190° D WS 10
ms-1
190° C WS 5 ms-
1
190 C WS 10 ms-
1
Meteorology
10-meter-
wind-speed 5 ms-1 10 ms-1 5 ms-1 10 ms-1
Wind
Direction 190° 190° 190° 190°
Stability Class D D C C
ST 10
min ST 1 min
ST 10
min
ST 1
min
ST 10
min
ST 1
min
ST 10
min
ST 1
min
Setup
Sample time 10 min 1 min 10 min 1 min 10 min 1 min 10 min 1 min
Non-respirable
Deposition
Velocity
20
cms-1 20 cms-1
20 cms-
1
20
cms-1
20 cms-
1
20
cms-1
20 cms-
1
20
cms-1
Simulations 210°
Model General Explosion
Source Term
Radionuclide Ru-106 W 368.2 d
Material-at-
Risk 3,325 TBq
Deposition
Velocity 20 cms-1
Simulation 210° D Simulation 210° C
210° D WS 5 ms-1 210° D WS 10
ms-1
210° C WS 5 ms-
1
210 C WS 10 ms-
1
Meteorology
10-meter-
wind-speed 5 ms-1 10 ms-1 5 ms-1 10 ms-1
Wind
Direction 210° 210° 210° 210°
Stability Class D D C C
ST 10
min ST 1 min
ST 10
min
ST 1
min
ST 10
min
ST 1
min
ST 10
min
ST 1
min
Setup
Sample time 10 min 1 min 10 min 1 min 10 min 1 min 10 min 1 min
Non-respirable
Deposition
Velocity
20
cms-1 20 cms-1
20 cms-
1
20
cms-1
20 cms-
1
20
cms-1
20 cms-
1
20
cms-1
WSEAS TRANSACTIONS on ENVIRONMENT and DEVELOPMENT Andrea Malizia et al.
E-ISSN: 2224-3496 458 Volume 10, 2014

The ground contamination data available for 106Ru
have been detected at the distance of 4.5km, 7.0km
and 12.0km in a northwesterly direction from the
point of the release. For this reason, the default
values for the “Receptors” were modified in order to
obtain the x and y coordinates which corresponded
to those downwind distances for both wind
directions (190° and 210°): their values are shown
in Table 1. The z coordinate, which identifies the
receptor’s height from the ground has a default
value of 1.5m, this value has not been modified
since it is irrelevant when analyzing the ground
deposition. Values of x and y coordinates for
downwind distances of 4.5km, 7.0km and 12.0km
for the two wind directions 190° and 210° are
shown in Table 5.
Table 4 : Spatial coordinates for downwind distance of 4.5 km, 7.0 km
and 12.0 km.
4 Problem Solution
4.1 Case study 1
4.1.1 Results of Accident Scenario 1
The first result analyzed (figure 5) is the general
plume graph (represented in a polar coordinate
system the release point located at axes origin). It is
a picture of the plume at the end of the observation
period (30 minutes).
Fig.5. Plume at 30 minutes (Scenario 1)
In the figure 6 it is represented the variation of
equivalent dose (in Sievert) with the distance from
the release point. The “receptor height” has been
fixed at 1,5 meter (the breathable zone of a medium
height zone) and so it is evident that the maximum
of dose value is calculated at 100 meters from the
release point.
Fig.6. (Scenario 1) TEDE (in Sv) variation from the release point
(height of 1,5 meters)
In the figure 7 the variation with the distance of the
ground deposition values is showed.
Fig.7. (Scenario 1) TEDE (in Sv) variation from the release point
(ground level)
Downwind
distance
Simulations
190°
Simulations
210°
Km x (km) y
(km)
x
(km) y (km)
4.5 0,718 4,432 2,250 3,897
7.0 1,216 6,894 3,500 6,062
12.0 2,084 11,818 6,000 10,392
WSEAS TRANSACTIONS on ENVIRONMENT and DEVELOPMENT Andrea Malizia et al.
E-ISSN: 2224-3496 459 Volume 10, 2014

The table 5 shows all the output values from HOT
SPOT.
Tab.5. (Scenario 1) Output value from HOT SPOT
4.1.2 Results of Accident Scenario 2
The Accident Scenario 2 presents a variation in
meteorological conditions (the stability class D has
been uploaded in this case). It has been selected to
analyze variation between 2 stability classes
different in terms of wind speed [10]. In the figure 8
the general plume is showed.
Fig.8. Plume at 30 minutes (Scenario 2)
Moreover, the figure 9 and 10 show, respectively,
the ground deposition with a receptor height of 1,5
meters (breathable area) and at ground level.
Fig.9. (Scenario 2) TEDE (in Sv) variation from the release point
(height of 1,5 meters)
Fig.10. (Scenario 2) TEDE (in Sv) variation from the release point
(ground level)
4.3 Results and Analysis
The comparison between the two different scenarios
shows that the plume area of Scenario 2 are wider
than the one in Scenario 1 and the plume is extended
in a larger surface but the contamination values are
negligible for this second scenario.
The results of the case study 1 simulations show that
the maximum value of contamination is detected at
a distance of 130 meters from the release point (and
is 9,61 x 10⁻⁶ mSv). The maximum value of ground
contamination is lower than 1 Bq/m2 (Scenario 1)
and 10 Bq/m2 (Scenario 2).
The figure 11 shows a projection of the possible
fallout in case of accident (in the worst scenario in
absence of wind). Taking into account the prevalent
wind in the considered area, the fallout zone can
been delimited by two red lines (see figure 10).
Fig.11. Delimitation of the possible fallout zone
The cumulative dose obtained is 6x10⁻² Sv/year, that
is a value lowest than the one imposed by Italian
Law [22,23].
WSEAS TRANSACTIONS on ENVIRONMENT and DEVELOPMENT Andrea Malizia et al.
E-ISSN: 2224-3496 460 Volume 10, 2014

4.1 Case study 2
The outputs generated by HotSpot with the sixteen
combinations of values and options (Table 6) have
been analyzed in order to find which combination
was the more appropriate to describe the pattern and
the amount of ground contamination with 106Ru. As
shown in Table 6 a wind speed of 5 ms-1 associated
to the Pasquill stability class “D” and a sample time
of 1 min give a good match with the experimental
data (Figure 12). Figure 12 showed the values of
activity (kBq∙m-2) for ground deposition of106Ru at
distance of : 4.5 km; 7.0 km; 12.0 km, computed
by the HotSpot code with the options and values for
the 5ms-1 wind speed (left) showed the best match
with the experimental data for the ground
contamination with 106Ru across the path of the
fallout at different distances from the RCW (right)
Tab. 6: Option and values of the benchmark showing the best
correlation with the experimental values for the ground contamination with 106Ru.
Figure 12 Values of activity (kBq∙m-2) for ground deposition of106Ru
at distance of 4.5 km, 7.0 km and 12.0 km.
The HotSpot software also allows the user to visualize
both the TEDE contour plots and Ground Deposition
Contour Plots which show the downwind and crosswind
contours for dose levels and for the extent of the
deposition respectively, and the TEDE Graph and Ground
Deposition graph which display the relative values as a
function of plume centerline downwind distance. The
Ground Deposition contour plots for the two scenarios
described in table 6 are shown in figure 13.
Benchmark for ground contamination with 106Ru
Wind speed 5 m∙s-1 Wind speed 10 m∙s-1
Model General Explosion General Explosion
Source
Term
Radionuclide Ru-106 W 368.2 Ru-106 W 368.2
Meteorology
10-meter-
wind-speed
5 m∙s-1 10 m∙s-1
Stability
Class
D D
Setup
Sample time 1 min 1 min
Downwind
distance
190° 190°
Km x
(km)
y
(km)
kBq∙m-
2
x
(km)
y
(km)
kBq∙m-
2
4.5 0,718 4,432 690 0,718 4,432 700
7.0 1,216 6,894 240 1,216 6,894 310
12.0 2,084 11,818 55 2,084 11,818 110
210° 210°
Km x
(km)
y
(km)
kBq∙m-
2
x
(km)
y
(km)
kBq∙m-
2
4.5 2,250 3,897 380 2,250 3,897 380
7.0 3,500 6,062 130 3,500 6,062 150
12.0 6,000 10,392 30 6,000 10,392 57
a) 1)
b) 2)
c) 3)
Figure 3 Values of activity (kBq∙m-2) for ground deposition of106Ru at distance of4.5 km, 7.0 km and 12.0 km, computed by the HotSpot code with
the options and values for the 5ms-1 wind speed (left) which showed the best match with the experimental data for the ground contamination with 106Ru across the path of the fallout at different distances from the RCW (right)
WSEAS TRANSACTIONS on ENVIRONMENT and DEVELOPMENT Andrea Malizia et al.
E-ISSN: 2224-3496 461 Volume 10, 2014

Fig. 13: Ground Deposition contour Plot for the two scenarios described in table 5 for wind direction 190° (a) and 210° (b). The
contour values for the plume are 7.0E+02 (inner), 2,5E+02 (middle)
and 5E+01(outer) for direction 190° and 4.0E+2 (inner) 1.0E+02 (middle) and 2.0E+01 (outer) for direction 210
5 Conclusion
The simulation of the events and the evolution of
the plume were realized through the hotspot
software. This software takes into account the
weather conditions, the wind direction, the stack
height, respiration, but does not take into account
the topography of the area, the presence of buildings
and / or obstacles to the advancement of the plume
and the presence any updrafts.
In the case studies that we have examined the area is
flat and free of large buildings. Furthermore, the
area is near the sea and it is not characterized by
abnormal turbulences. According to that, the
simulations improved should be closer to the reality.
It should be said that the simulations performed with
the software do not always consider all the
parameters and variables that could affect the
evolution of the plume. This code needs very little
time for calculations (less than 1minute) and very
conservative estimations can be obtaining starting
from very few initial information. The authors can
affirm that the software can be used as a useful DSS
to assist the decision maker, but cannot fully replace
it. In case of an accident, however, the real
measurements should be carried out to verify the
goodness of the simulated data.
Considering an event as the accident described,
since the dose values calculated are very low
(around an order of magnitude lower than the LAW
limit), the approximations and the margin of error
due to the simulation should not significantly alter
the final results. At the conclusion of this study, we
can say, with a good degree of reliability, that
scenarios as the one proposed would constitute
events without any radiological significance for the
population and for the workers.
The Hot Spot code could certainly be used also in
the processes of:
Prevention;
Risk planning;
Support the decision-making process
during the accidental events.
References:
[1] United Nations Scientific Committee on the
Effect of Atomic Radiation (UNSCEAR). Report
sources and effects of ionizing radiation.
UNSCEAR Report to the General Assembly
Volume II, Annex J, 2000.
[2] International Atomic Energy Agency (IAEA).
Summary Report on the Post-Accident Review
Meeting on the Chernobyl Accident. Safety Series
75, Vienna, 1986.
[3] International Atomic Energy Agency (IAEA).
Generic Models for use in assessing the impact of
discharges of radioactive substances to the
environment. Safety Reports Series 19, Vienna,
2001.
[4] Voigt, G. and Fesenko, S. Radioactivity in the
environment. Remediation of contaminated
environments. Elsevier editor, 2009.
[5] Homann S.G. and Aluzzi F. HotSpot Health
Physics Codes Version 3.0 User’s Guide. National
Atmospheric Release Advisory Center Lawrence
Livermore. National Laboratory Livermore, CA
94550, 2013.
[6] International Commission on Radiological
a)
b)
WSEAS TRANSACTIONS on ENVIRONMENT and DEVELOPMENT Andrea Malizia et al.
E-ISSN: 2224-3496 462 Volume 10, 2014

Protection (ICRP). Basis for Dosimetric Quantities
Used in Radiological Protection. ICRP, Ottawa,
Canada, 2005.
[7] Environmental Protection Agency (EPA).
Limiting Values Radionuclide Intake and Air
Concentration, and Dose Conversion Factors for
Inhalation, Submersion, and Ingestion. EPA,
Federal Guidance Report 11, Washington DC, 1988.
[8] Environmental Protection Agency (EPA).
External Exposure to Radionuclides in Air, Water,
and Soil. EPA, Federal Guidance Report 12,
Washington DC, 1993.
[9] Environmental Protection Agency (EPA).
Cancer Risk Coefficients for Environmental
Exposure to Radionuclides. EPA, Federal Guidance
Report 13, Washington DC, 1999.
[10] Rentai, Y. Atmospheric dispersion of
radioactive material in radiological risk assessment
and emergency response. Progress in Nuclear
Science and Technology, Vol. 1, 2011, pp. 7-13.
[11] Bellecci, C., Gaudio, P., Gelfusa, M., Malizia
A., M. Richetta, C., et al. Planetary boundary layer
(PBL) monitoring by means of two laser radar
systems: experimental results and comparison. In
Lidar technologies, techniques, and measurements
for atmospheric remote sensing VI SPIE
Conference. Vol. 7832, 2010.
[12] Cenciarelli, O., Malizia, A., Marinelli, M.,
Pietropaoli, S., Gallo, R., et al. Evaluation of
biohazard management of the Italian national fire
brigade. Defence S&T Technical Bullettin Vol. 6,
pp. 33-41, 2013
[13] Gallo, R., De Angelis, P., Malizia, A., Conetta,
F., Di Giovanni, D., et al. Development of a
georeferencing software for radiological diffusion in
order to improve the safety and security of first
responders. Defence S&T Technical Bullettin Vol. 6,
pp. 21-32, 2013.
[14] Malizia, A., Lupelli, I., D'Amico, F., Sassolini,
A., Fiduccia, A., et al. Comparison of software for
rescue operation planning during an accident in a
nuclear power plant. Defence S&T Technical
Bullettin Vol. 5, pp. 36-45, 2012.
[15] Malizia, A., Quaranta, R., Mugavero, R.,
Carcano, R., Franceschi, G. Proposal of the
prototype RoSyD-CBRN, a robotic system for
remote detection of CBRN agents. Defence S&T
Technical Bullettin Vol. 4, pp. 64-76, 2011.
[16-20] Malizia, A., Quaranta, R., Mugavero, R.
CBRN events in the subway system of Rome:
Technical-managerial solutions for risk reduction.
Defence S&T Technical Bullettin Vol. 2, pp. 140-
157, 2010.
[17] Pazienza, M., Britti, MS., Carestia, M.,
Cenciarelli, O., D'Amico, F., et al. Use of Particle
Counter System for the Optimization of Sampling,
Identification and Decontamination Procedures for
Biological Aerosols Dispersion in Confined
Environment. J Microb Biochem Technol Vol. 6, pp.
43-48, 2013.
[18] Cacciotti, I., Aspetti, PC., Cenciarelli, O.,
Carestia, M., Di Giovanni, D., et al. Simulation of
Caesium-137 (137Cs) Local Diffusion as a
Consequence of the Chernobyl Accident Using
Hotspot. Defence S&T Technical Bullettin Vol. 7,
pp. 18-26, 2014.
[19] Sassolini, A., Malizia, A., D’Amico, F.,
Carestia, M., Di Giovanni, D., et al. Evaluation of
the Effectiveness of Titanium Dioxide (TiO2) Self-
Cleaning Coating for Increased Protection Against
CBRN Incidents in Critical Infrastructures. Defence
S&T Technical Bullettin Vol. 7, pp. 9-17, 2014.
[20] Manera, S., and Milani, D. Pellet radioattivo –
indagine radiometrica e considerazioni di
radioprotezione. Università degli Studi di Pavia,
2009, http://www-3.unipv.it/safety/radio/pellet.pdf.
[21] International Atomic Energy Agency (IAEA).
Assessing radiation doses to the public from
radionuclides in timber and wood products. IAEA,
Vienna, Austria, 2003.
[22] Decreto Legislativo 17 marzo 1995, n. 230.
Attuazione delle direttive 89/618/Euratom,
90/641/Euratom, 96/29/Euratom,
2006/117/Euratom in materia di radiazioni
ionizzanti e 2009/71/Euratom, in materia di
sicurezza nucleare degli impianti nucleari. Gazzetta
Ufficiale n.136 del 13-6-1995 - Suppl. Ordinario n.
74.
[23] Decreto Legislativo 26 maggio 2000, n. 241.
Attuazione della direttiva 96/29/EURATOM in
materia di protezione sanitaria della popolazione e
dei lavoratori contro i rischi derivanti dalle
radiazioni ionizzanti. Gazzetta Ufficiale n.203 del
31-8-2000 - Suppl. Ordinario n. 140.
[24] Malizia, A., Lupelli, I., Richetta, M., Gelfusa,
M., Bellecci, C., Gaudio, P., "Safety analysis in
large volume vacuum systems like tokamak:
Experiments and numerical simulation to analyze
vacuum ruptures consequences", Advances in
Materials Science and Engineering, doi:
10.1155/2014/201831, 2014.
[25] Di Giovanni, D., Luttazzi, E., Marchi, F.,
Latini, G., Carestia, M., Malizia, A., Gelfusa, M.,
Fiorito, R., D'Amico, F., Cenciarelli, O.,
Gucciardino, A., Bellecci, C., Gaudio, P., "Two
realistic scenarios of intentional release of
radionuclides (Cs-137, Sr-90) - the use of the
HotSpot code to forecast contamination extent",,
WSEAS Transactions on Environment and
Development, 10, 106-122, 2014.
WSEAS TRANSACTIONS on ENVIRONMENT and DEVELOPMENT Andrea Malizia et al.
E-ISSN: 2224-3496 463 Volume 10, 2014

[26] Gaudio, P., Gelfusa, M., Malizia, A., Richetta,
M., Antonucci, A., Ventura, P., Murari, A., Vega,
J.,"Design and development of a compact Lidar/Dial
system for aerial surveillance of urban areas",,
Proceedings of SPIE - The International Society for
Optical Engineering, 8894,, 88940D, 2013.
[27] Gaudio, P., Malizia, A., Lupelli, I.,
"Experimental and numerical analysis of dust
resuspension for supporting chemical and
radiological risk assessment in a nuclear fusion
device", ,International Conference on Mathematical
Models for Engineering Science - Proceedings, 134-
147, 2010.
[28] “The Radiological Accident in the
Reprocessing Plant at Tomsk”. International Atomic
Energy Agency. October 1998.
[29] INTER-DEPARTMENT (INTER-AGENCY)
COMMISSION, Inquiry of Causes and Elaboration
of Measures on Mitigation of the Accident
Consequences at the Radiochemical Enterprise of
Siberian Chemical Enterprises (SCE), Statement of
Inter-Agency Commission No. 02-07/329, 14 April
1993, Moscow and Tomsk (1993) (in Russian).
[30] Mikkelsen, T., Larsen, S.E., Description of the
Risø PUFF diffusion model, Nucl. Technol. 6 7 .
56–65, 1984
[31] Andreev, G.S., Malyshkin, A.I., “Calculation of
Radioactive Activity Contained in the Area outside
the Industrial Zone Contaminated as a Result of
Release after Destruction of the Processing
Installation at the RCW on 06/04/93”, Tech. Rep.
SCE No. 26/1364, Tomsk-7 12 pp. (in Russian),
1993.
[32] Savkin, M.N., Titov, A.V., “Analysis of the
Radiation Situation in the Aftermath of the
Accidental Release from the Radiochemical
Enterprise of Siberian Chemical Enterprises,
Moscow” (1995) (in Russian).
[33] International Energy Agency, “Key World
energy statistics”, 2012.
[34] Vakulovsky, S.M., Shershakov, V.M., Borodin,
R.V., et al., “Analysis and prognosis of the radiation
situation at the area of the accident at Siberian
Chemical Enterprises”, Radiation and Risk, Issue 3,
Supplement 2, Moscow and Obninsk (1993) 48 pp.
(in Russian).
[35] De Marrais G. A. “Atmospheric stability class
determinations on a 481-meter tower in Oklahoma”.
Atmospheric Environment Volume 12, Issue 10,
1978, Pages 1957-1964, 1967.
WSEAS TRANSACTIONS on ENVIRONMENT and DEVELOPMENT Andrea Malizia et al.
E-ISSN: 2224-3496 464 Volume 10, 2014