Embed Size (px)
Citation preview
Studies elsewhere of the frog's eye and optic ne1-ve network have semed to suggest the possibility
of designing mdar S1l bsystems that simulate th e fTog's highly developed mechanism fOT distinguishing
moving objects f1-om a stationary background_
We discuss on e such design, and an expeTimental evaluation of one aspect of this design) in which phosphor pm-ticles on the light-sensitive surfaces of television camems we1-e used to simulate the
frog'S nerve fibres.
the frog and
the RADAR DISPLAY
A most challenging area of current r.esearch 1-\.. has to do with development of machines whose methods of operation are patterned after those used in various biological systems. Such machines might well be the key to big gains in operational reliability as well as in a more sophisticated performance of modern weapon systems. These two goals seem, however, to be incompatible in man-made systems. It is no surprise, therefore, that the radar designer is looking with envy at the lowly bat. This creature's echo-location system operates reliably in a jamming environment even though it is a compact package of unreliable parts. Other examples of such sophisticated behavior can be found throughout nature; the subject of this paper is only one. We shall describe an attempt to solve a radar subsystem design problem by using data-processing techniques suggested by measured properties of a frog's optic nerve fibre.
8
Encouragement as well as practical suggestions and effort were freely contributed by M. Davidson and F. Nathanson during the course of this work. The latter was most helpful in implementing the television simulation described.
The Radar Display Problem
Figure I presents a B-scan radar display on which spots of light are at the present range and bearing of each of three targets. For our reference, each spot is numbered and its direction of motion is indicated. The radar operator's task is to watch these spots and continually evaluate which target is apt to be the first to reach a critical area on the display-zero range, for example. To do so he must take into account the present position, recent speed, and heading of the target. In our problem, then (Fig. I), the radarman will drop target 2 from con-
APL Technical Digest
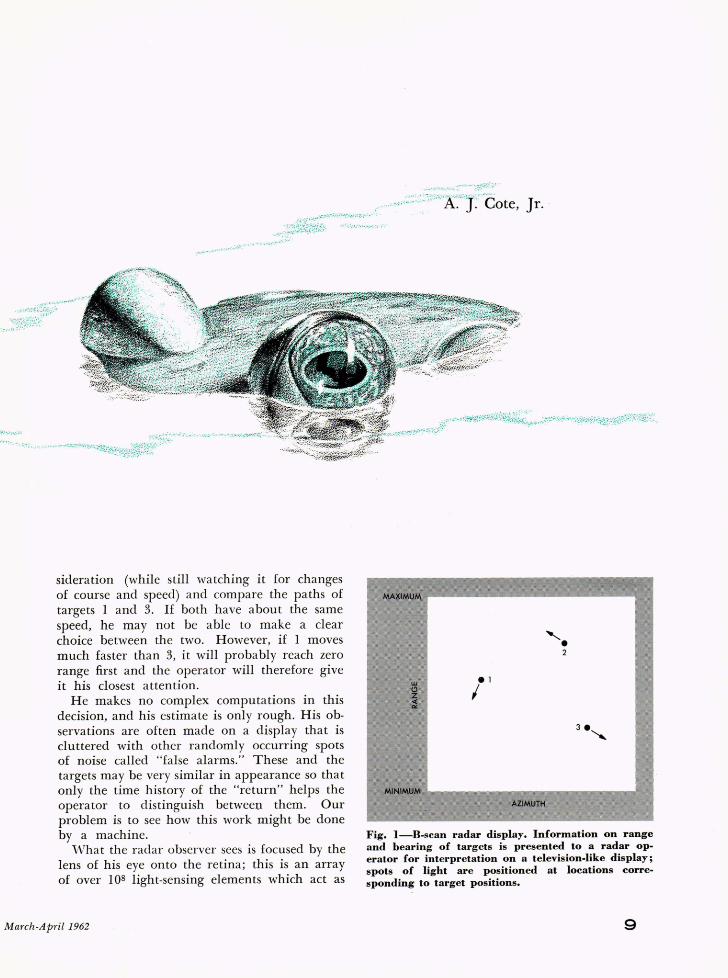
sideration (while still watching it for changes of course and speed) and compare the paths of targets I and 3. If both have about the same speed, he may not be able to make a clear choice between the two. However, if I moves much faster than 3, it will probably reach zero range first and the operator will therefore give it his closest attention.
He makes no complex computations in this decision, and his estimate is only rough. His observations are often made on a display that is cluttered with other randomly occurring spots of noise called "false alarms." These and the targets may be very similar in appearance so that only the time history of the "return" helps the operator to distinguish between them. Our problem is to see how this work might be done by a machine.
What the radar observer sees is focused by the lens of his eye onto the retina; this is an array of over 108 light-sensing elements which act as
March-April 1962
Fig. I-B-scan radar display. Information on range and bearing of targets is presented to a radar operator for interpretation on a television-like display; spots of light are positioned at locations corresponding to target positions.
9
environment monitors. They in turn drive several layers of nerve cells whose structures, like trees, have many branches extending outward toward ad j acen t cells; we believe these branches are paths by which a cell can watch the actions of its neighbors and perhaps even transmit signals to them. In short, the anatomy of a cell seems to be important in the processing of incoming data. It is also possible that much filtering is carried out in these peripheral structures. Hence, if we are to build a machine to reproduce man's performance, such a structure should be copied. But, since we have little information about this part of man, we must use our knowledge of the retinal networks in lower animal forms as the basis for a proposed system.
Fortunately, data taken at M.LT. have suggested a solution to the display interpretation problem. They have reported 1,2 experimentallydetermined properties of a frog's optic nerve; these suggest that the frog eye, with its associated optic nerve network, is highly adapted to seeing moving objects the size of a fly. To be a successful flycatcher, however, he must be able to distinguish a moving fly against a diverse and stationary background; he must then learn its present position, speed, and heading, and its estimated time of arrival within range of his tongue. Now, with a little imagination, we can
8
~I~[J~Y LENS E~V/ , po- ...
_ ---- -- ...... ';, DEFOCUSED
~""G, [1 '~"'~:aNS -- , LENS " , ~_ ...... --..
_-"\JI C .,.- -- FOCUSED ELEMENT
LENS ARRAY A
ELEMENT ARRA .... Y ____ ~ ____ ....
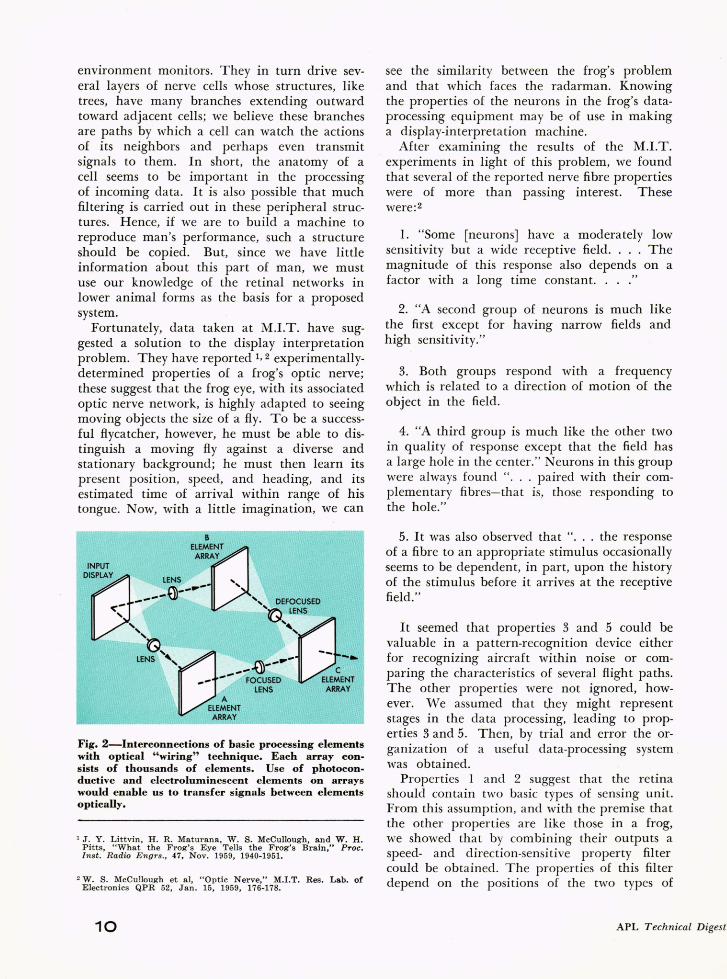
Fig. 2-Interconnections of basic processing elements with optical "wiring" technique. Each array consists of thousands of elements. Use of photoconductive and electroluminescent elements on arrays would enable us to transfer signals between elements optically.
1 J. Y. Littvin, H. R. Maturana, W. S. McCullough, and W. H. Pitts, "What the Frog's Eye Tells the Frog's Brain," Proc. Inst. Radio Engrs., 47, Nov. 1959, 1940-1951.
2 W. S. McCullough et aI, "Optic Nerve," M.LT. Res. Lab. of Electronics QPR 52, Jan. 15, 1959, 176-178.
10
see the similarity between the frog's problem and that which faces the radarman. Knowing the properties of the neurons in the frog's dataprocessing equipment may be of use in making a display-interpretation machine.
After examining the results of the M.LT . . experiments in light of this problem, we found
tha t several of the reported nerve fibre properties were of more than passing interest. These were: 2
1. "Some [neurons] have a moderately low sensitivity but a wide receptive field .... The magnitude of this response also depends on a factor with a long time constant. . . ."
2. "A second group of neurons is much like the first except for having narrow fields and high sensitivity."
3. Both groups respond with a frequency which is related to a direction of motion of the object in the field.
4. "A third group is much like the other two in quality of response except that the field has a large hole in the center." Neurons in this group were always found " ... paired with their complementary fibres-that is, those responding to the hole."
5. It was also observed that " ... the response of a fibre to an appropriate stimulus occasionally seems to be dependent, in part, upon the history of the stimulus before it arrives at the receptive field."
It seemed that properties 3 and 5 could be valuable in a pattern-recognition device either for recognizing aircraft within noise or comparing the characteristics of several flight paths . The other properties were not ignored, however. We assumed that they might represent stages in the data processing, leading to properties 3 and 5. Then, by trial and error the organization of a useful data-processing system . was obtained.
Properties 1 and 2 suggest that the retina should contain two basic types of sensing unit. From this assumption, and with the premise that the other properties are like those in a frog, we showed that by combining their outputs a speed- and direction-sensitive property filter could be obtained. The properties of this filter depend on the positions of the two types of
APL Technical Digest
RECEIVER ARRAY
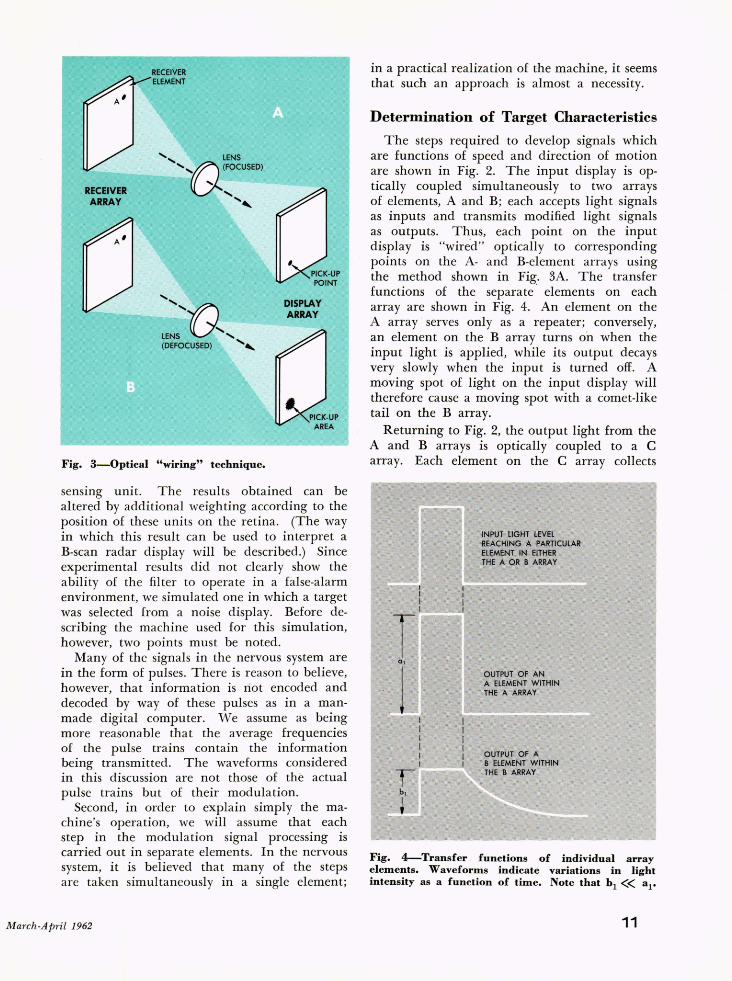
Fig. 3-0ptical "wiring" technique.
DISPLAY ARRAY
sensing unit. The results obtained can be altered by additional weighting according to the position of these units on the retina. (The way in which this result can be used to interpret a B-scan radar display will be described.) Since experimental results did not clearly show the ability of the filter to operate in a false-alarm environment, we simulated one in which a target was selected from a noise display. Before describing the machine used for this simulation, however, two points must be noted.
Many of the signals in the nervous system are in the form of pulses. There is reason to believe, however, that information is riot encoded and decoded by way of these pulses as in a manmade digital computer. We assume as being more reasonable that the average frequencies of the pulse trains contain the information being transmitted. The waveforms considered in this discussion are not those of the actual pulse trains but of their modulation.
Second, in order to explain simply the machine's operation, we will assume that each step in the modulation signal processing is carried out in separate elements. In the nervous system, it is believed that many of the steps are taken simultaneously in a single element;
March-April 1962
in a practical realization of the machine, it seems that such an approach is almost a necessity.
Determination of Target Characteristics
The steps required to develop signals which are functions of speed and direction of motion are shown in Fig. 2. The input display is optically coupled simultaneously to two arrays of elements, A and B; each accepts light signals as inputs and transmits modified light signals as outputs. Thus, each point on the input display is "wire"d" optically to corresponding points on the A- and B-element arrays using the method shown in Fig. 3A. The transfer functions of the separate " elements on each array are shown in Fig. 4. An element on the A array " serves only as a repeater; conversely, an element on the B array turns on when the input light is applied, whiie its output decays very slowly when the input is turned off. A moving spot of light on the input display will therefore cause a moving spot with a comet-like tail on the B array.
Returning to Fig. 2, the output light from the A and B arrays is optically coupled to a C array. Each element on the C array collects
Fig. 4-Transfer functions of individual array elements. Waveforms indicate variations in light intensity as a function of time. Note that hI « a 1"
11

the light received from corresponding elements on the' A and B arrays. If both coupling lenses were sharply focused, the outputs from corresponding points on the A and B arrays would be received at one point on .the C array. But, if the lens between Band C is defocused, light received at the C point will come from a circular group of B points (Fig. 3B). ''''ith proper alignment of the arrays, the C elemehts will receive light from B elements concentric about A elements; the response of a C element to a moving spot of light will then be as shown in Fig. 5. Under these conditions, the peak value of the total signal received by the C unit occurs at the time the input light passes across the location of the corresponding A unit. The amplitude is independent of the direction of motion.
However, if the A and B arrays are not aligned, the peak output becomes a function of the direction of motion, as shown in Fig. 6; this occurs because the total signal contributed by the B units (at the time the spot passes the A unit) will be greater in one case than in the other. This peak signal level is also a function of the speed of the moving spot, the diameter
Fig. 5-Signal processing by A, B, and C units for concentric positioning.
12
DIRECTION OF MOTION OF INPUT tiGHT SPOT
Fig. 6-Signal processing by A, Band C units for eccentric positioning.
of the circle, and the time constant of a B unit's decay. The directional characteristic for one particular amount of off-centering is shown in the polar coordinate plot of Fig. 7, where the parameter p v'T / d) where v is speed, T is the time constant, and d is the diameter of the circle. Maximum output will occur for a 12 o'clock approach and minimum at 6 o'clock, with intermediate values at other angles.3
We now have a property-filtering mechanism which gives outputs related to speed and heading. Position can be added by weighting the contributions of each A unit so that maximum outputs occur at minimum range and decrease for those units at increasing ranges. Then, if the input display of Fig. 1 is applied to this machine, the greatest output signal will occur at the C unit whose location is the same as that of target 1. If this array of C units is then monitored by a network which selects the peak signal, the only output of that network will be at the location of target 1; the complete machine
3 A. J. Cote, Jr., "Machine Interpretation of Radar Displays," 2nd Annual Bionics Symposium, Cornell University, Aug. 1961.
APL Technical Digest

will then be predicting which of the three aircraft will be most likely to reach zero range first.
Now, compare the signals in this system with those found in the frog and noted earlier. Frog property 1 is exhibited by the output of the B unit. Property 2 is found in both the A unit and in the output of the maximum-amplitude filter monitoring the C units. This latter element also exhibits frog property 3. The frog's fibre with the hole is similar to the circular array of B units. (Within the B-unit circle, that particular B unit which is complementary to the circle's A unit could he deleted without significantly changing the level of the corresponding C-unit output.) The complementary fibre is the A unit. Finally, the output of the maximum-amplitude filter also exhibits frog property 5; that is, its output depends on the behavior of the stimulus before it gets to the receptive field. Therefore, with the proper interpretation, we can see the similarity between the signals in the frog's eye and those in the proposed machine.
Machine Simulation
We have not yet considered the case in which the input display is also cluttered with those
Fig. 7-Peak value of a C unit output as a function of direction of motion of the input light spot; v = speed; T = B-unit decay time constant, d = diameter of the circle of B units. For a given machine, T and d will be fixed; hence, output is also a function of speed.
March-April 1962
DEFOCUSED LENS ~ () FOCUSED LENS
PULSE STANDARDIZER
SUMMATION
PEAK DETECTOR
MAXIMUM AMPLITUDE FILTER
TO TV MONITOR
Fig. 8-Implementation to demonstrate system's ability to operate in a false-alarm environment.
randomly occurring spots of light referred to as "false alarms." The randomness of these spots gives us a means for discriminating between them and the target spots. The build-up of signals in the B unit occurs because a spot corresponding to an aircraft will energize successively the sensors within the circle corresponding to the B sensors for that B unit. Because of the decaying action of each B sensor, many successive and / or simultaneous false alarms must occur within the circular array of B units to cause the same level of C-unit output as that caused by an aircraft. It would seem that the random nature of the false alarms would make such events unlikely. However, confirmation of this theory is formidable because the B-unit groups overlap. Therefore, we undertook to simulate the proposed system in order to prove this aspect of the machine's performance (Fig. 8).
The array of A units in Fig. 2 was simulated by the planar light-sensitive input surface of a vidicon TV camera; i.e., the individual A units were simulated by the individual photosensitive
13
particles on the camera's light-sensitive element. (This array of sensors is referred to as the
receiver array in Fig. 3.) The "wiring" between the radar display and the A-sensor array was carried out optically with a sharply-focused lens; this duplicates the way in which the radar display is coupled to the radar observer's retina.
To obtain the "wiring" needed between the Band C units, a second TV camera Was used; the radar image was then simultaneously coupled to the sensitive surface of this camera via a defocused lens. The second camera was a Permachon 3 rather than a vidicon, both similar except that the Permachon stores the input optical image. This capability simulated roughly the slow decay required by the B sensors. The combination of the Permachon and defocused lens served to approximate the B units and their coupling to the C units.
The two cameras were run with synchronized sweep circuits, and their outputs were combined in a resistive summing network (Fig. 8). In a TV camera, each point on the photosensitive input surface is sequentially sampled by the moving electron beam. Therefore, if the lens systems are well aligned on the input display, at each instant of time as the camera electron beams sweep the camera sensing surfaces the vidicon is sampling an A unit and the Perm achon is sampling the corresponding B unit. The summation block thus acts as a C unit. The circuitry that follows this block operates as a maximum-amplitude filter, and its output is displayed on a monitor. Thus, the system in Fig. 8 worked as a partly sequential, rather than parallel, system.
This system differed from the ideal in two respects, however. First, because of properties of the Permachon, especially those of its long storage time and integration, the B units were not accurately simulated. (The latter eliminates the ability to choose between fixed and moving targets.) Second, it was difficult to hold raster alignment on the two cameras. With perfect alignment, the first defect could be overcome by sharply focusing the Permachon and by inserting, between the Permachon and the summing block, a limiter, monitor, and defocused vidicon in that order. Then, if the Permachon could also erase automatically, the proposed system would be realized.
The behavior that was obtained, however, was enough to show the ability of the proposed system to choose between aircraft light spots and false alarms. An aircraft simulator was
14
used to illuminate the input display, and random noise was inserted. The total input display was then so heavily cluttered with false alarms that it was not clear to human observers which spot of light was from the simulated aircraft.
When the display was presented to the system shown in Fig. 8, the output monitor initially held both false alarms arid the aircraft. Then, after several seconds the false alarms faded and only the moving aircraft spot remained. Thus, the proposed machine was able to discriminate between aircraft and false alarms.
The inability to insure raster alignment also discouraged any attempt to use the simulation as a means of proving the property-filtering aspects of the proposed machine. However, the appropriate direction sensitivity obviously existed in those areas of the display where we could establish the misalignment direction, thus partially proving the property-filtering mechanism qualitatively.
The high performance level of the machine just described belies the simplicity of the noncritical analog mechanisms that are used to process the data. In a much longer discussion, it could also be shown that such mechanisms are potentially practical from an engineering standpoint. Further, the strong similarity in nature of the signals found at various points in this machine and in the frog suggests that the biological data-processing methods might be very similar to those we have used. Our approach, which is compatible with and includes some of the ideas of other researchers4
-7
, may, therefore, have long-range merits.
We believe, however, that the major obstacle to construction of systems based on these concepts is our present inability to build networks of artificial nerve fibres. Before continuing our system study we will have to develop the basic components of the system so that their quirks may be properly taken into account. With this objective, current work on this problem is being directed toward the design of a distributed semiconductor nerve cell.
4 N. Tinbergen, "The Study of Instinct," Oxford University Press, London, 1951.
5 o. G. Selfridge, "Pandemonium: A Paradigm for Learning;" Proc. Symposium on M echanization of Thought Processes, Her Majesty's Stationery Office, London, 1959.
6 U. Neisser, "A Theory of Cognitive Processes," Lincoln Lab. Gp. Rept. 54-19, Feb. 23, 1960.
7 W. K. Taylor, "Pattern Recognition by Means of Automatic Analog Apparatus," Proc. Inst. Elec. Engrs. , part B, V, 106, Mar. 1959, 198-209.
APL Technical Digest