Embed Size (px)
Citation preview

Journal of Human Kinetics volume 46/2015, 219-230 DOI: 10.1515/hukin-2015-0050 219
Section IV – Behavioural Sciences in Sport
1 - Department of Physiology. Faculty of Medicine and Dentistry. University of the Basque Country (UPV/EHU). 2 - Department of Physical Education and Sport. Faculty of Physical Activity and Sport Sciences. University of the Basque Country
(UPV/EHU). 3 - Adapted Sport Federation of Gipuzkoa, Donostia-San Sebastian, Spain. .
Authors submitted their contribution to the article to the editorial board.
Accepted for printing in the Journal of Human Kinetics vol. 46/2015 in June 2015.
The Functional Classification and Field Test Performance
in Wheelchair Basketball Players
by
Susana María Gil1, Javier Yanci2, Montserrat Otero2, Jurgi Olasagasti3,
Aduna Badiola2, Iraia Bidaurrazaga-Letona1, Aitor Iturricastillo2,
Cristina Granados2
Wheelchair basketball players are classified in four classes based on the International Wheelchair Basketball
Federation (IWBF) system of competition. Thus, the aim of the study was to ascertain if the IWBF classification, the
type of injury and the wheelchair experience were related to different performance field-based tests. Thirteen basketball
players undertook anthropometric measurements and performance tests (hand dynamometry, 5 m and 20 m sprints, 5
m and 20 m sprints with a ball, a T-test, a Pick-up test, a modified 10 m Yo-Yo intermittent recovery test, a maximal
pass and a medicine ball throw). The IWBF class was correlated (p<0.05) to the hand dynamometry (r= 0.84), the
maximal pass (r=0.67) and the medicine ball throw (r= 0.67). Whereas the years of dependence on the wheelchair were
correlated to the velocity (p<0.01): 5 m (r= -0.80) and 20 m (r= -0.77) and agility tests (r= -0.77, p<0.01). Also, the 20
m sprint with a ball (r= 0.68) and the T-test (r= -0.57) correlated (p<0.05) with the experience in playing wheelchair
basketball. Therefore, in this team the correlations of the performance variables differed when they were related to the
disability class, the years of dependence on the wheelchair and the experience in playing wheelchair basketball. These
results should be taken into account by the technical staff and coaches of the teams when assessing performance of
wheelchair basketball players.
Key words: disability, spinal cord injury, speed, agility, endurance, strength.
Introduction Wheelchair basketball players must have an
optimal speed, agility, strength, power,
endurance, technical and tactical skills to display
good performance during the games. However,
these athletes may have been affected by a wide
range of injuries and diseases; thereby, they
encompass different levels of disability leading to
considerable differences in the capacity to
perform. In order to balance the large variety in
the functional capabilities of the players and to
ensure that all eligible players have an equal right
and opportunity to play, the International
Wheelchair Basketball Federation (IWBF)
designed a classification system based on the
player’s physical capacity to execute fundamental
basketball movements; pushing the wheelchair,
dribbling, shooting, passing and catching,
rebounding and reacting to contact (IWBF, 2010).
Thus, this classification reflects the degree of
the disability of athletes, and as such, it is a
central aspect in wheelchair sports (Goosey-
Tolfrey and Leicht, 2013). Consequently it is
UnauthenticatedDownload Date | 7/2/17 11:28 PM

220 The functional classification and field test performance in wheelchair basketball players
Journal of Human Kinetics - volume 46/2015 http://www.johk.pl
interesting to know if the aforementioned
classification also reflects the functional
performance of the wheelchair athletes while they
are practicing their sport. In this respect, to our
knowledge, only a few studies have attempted to
identify the relationship between the functional
IWBF classification and performance. Moreover,
most of these studies were laboratory-based tests
and they analysed incremental cardiopulmonary
exercise testing to measure the ventilatory
threshold, peak oxygen uptake, and the Wingate
test to measure anaerobic power and capacity (De
Lira et al., 2010; Molik et al., 2010a; Morgulek-
Adamowiccz et al., 2011). Laboratory tests allow
the development of physical tests on strictly
monitored participants and under particularly
well controlled external conditions. On the
contrary, field-based tests are easier to execute
and interpret; and they also mimic more closely
the actions and the movements (i.e. side cutting
manoeuvres) of the training sessions and games,
representing performance of the athletes in a
more exact way.
Since the classification of the IWBF reflects
the functional capacity of disabled athletes, we
hypothesized that there would be a correlation
between the different levels of the classification
and the performance in a wide range of field-
based tests. Thus, the aim of the present study
was to ascertain if the IWBF classification, the
type of injury (spinal cord injury vs. non-spinal
cord injury) and the wheelchair experience (both
for training and everyday activities) were related
to performance in short- (strength, power, agility,
speed and technical skills) and long-duration
(endurance) field tests.
Material and Methods
Participants
Thirteen male wheelchair basketball
players, belonging to the Spanish national WB
third division league participated in this study.
All of them conducted two training sessions and
played one game per week. Written informed
consent was received from all players after verbal
and written explanation of the experimental
design and potential risks of the study were
presented. The Ethics committee of the University
of Basque Country for Research on Human
Subjects approved the study. The measurements
were performed according to the ethical standards
of the Helsinki Declaration.
Classification
In order to define the disability of each
player, the International Wheelchair Basketball
Federation (IWBF) designed a classification
system based on the player’s physical capacity to
execute fundamental basketball movements;
pushing the wheelchair, dribbling, shooting,
passing and catching, rebounding and reacting to
contact. In this sense, the classification of the
players is made to describe different variables
such as the volume of action (the limit to which a
player can move voluntarily in the vertical plane,
the forward plane and the sideways plane), the
sitting position and the pelvic stability (IWBF,
2010). Thus, players are grouped into categories
(classes) from 1.0 (being the player with least
physical function) to 4.5 (being the player with
most physical function). This classification is the
players’ “playing points” and at any given time in
a game the five players on court must not exceed
a total of 14 playing points (IWBF, 2010).
In order to be allowed to play each player
must pass a medical examination to determine his
or her class. This examination is undertaken by
the classifiers. There are three levels of classifiers
in wheelchair basketball: national, regional and
international. Briefly, these classifiers must be
involved in wheelchair basketball and they must
attend a classification course for the purpose of
training classifiers. Classification is based on the
function of the trunk, the upper extremities, the
lower extremities and the hands. Thus, it relies on
the movement and the stability of the trunk of the
player.
In the present study, the participants were
classified according to the Classification
Committee of the IWBF as: Class 1 (n=1), class 1.5
(n=1), class 2 (n=3), class 2.5 (n=1), class 3 (n=2),
class 3.5 (n=2), class 4 (n=2) and class 4.5 (n=1).
Measures
Anthropometric measurements
Height and sitting height (cm) were
measured to the nearest 0.1 cm using a
stadiometer (Holtain Ltd®, Crymych, United
Kingdom). Body mass was obtained to the nearest
0.1 kg using an electronic scale (Seca Instruments
Ltd®, Hamburg, Germany). Sitting height and
body mass were measured as described by
Vanlandewijck et al. (2011). Skinfold thicknesses
UnauthenticatedDownload Date | 7/2/17 11:28 PM
by Susana María Gil et al. 221
© Editorial Committee of Journal of Human Kinetics
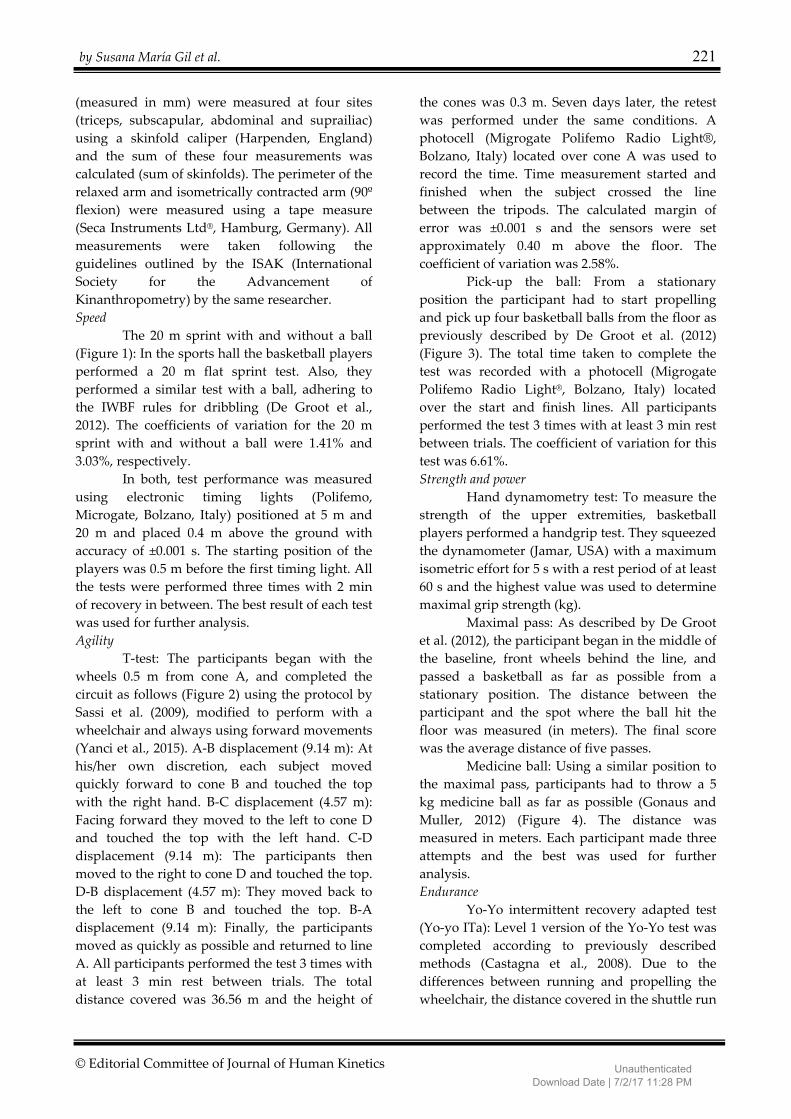
(measured in mm) were measured at four sites
(triceps, subscapular, abdominal and suprailiac)
using a skinfold caliper (Harpenden, England)
and the sum of these four measurements was
calculated (sum of skinfolds). The perimeter of the
relaxed arm and isometrically contracted arm (90º
flexion) were measured using a tape measure
(Seca Instruments Ltd®, Hamburg, Germany). All
measurements were taken following the
guidelines outlined by the ISAK (International
Society for the Advancement of
Kinanthropometry) by the same researcher.
Speed
The 20 m sprint with and without a ball
(Figure 1): In the sports hall the basketball players
performed a 20 m flat sprint test. Also, they
performed a similar test with a ball, adhering to
the IWBF rules for dribbling (De Groot et al.,
2012). The coefficients of variation for the 20 m
sprint with and without a ball were 1.41% and
3.03%, respectively.
In both, test performance was measured
using electronic timing lights (Polifemo,
Microgate, Bolzano, Italy) positioned at 5 m and
20 m and placed 0.4 m above the ground with
accuracy of ±0.001 s. The starting position of the
players was 0.5 m before the first timing light. All
the tests were performed three times with 2 min
of recovery in between. The best result of each test
was used for further analysis.
Agility
T-test: The participants began with the
wheels 0.5 m from cone A, and completed the
circuit as follows (Figure 2) using the protocol by
Sassi et al. (2009), modified to perform with a
wheelchair and always using forward movements
(Yanci et al., 2015). A-B displacement (9.14 m): At
his/her own discretion, each subject moved
quickly forward to cone B and touched the top
with the right hand. B-C displacement (4.57 m):
Facing forward they moved to the left to cone D
and touched the top with the left hand. C-D
displacement (9.14 m): The participants then
moved to the right to cone D and touched the top.
D-B displacement (4.57 m): They moved back to
the left to cone B and touched the top. B-A
displacement (9.14 m): Finally, the participants
moved as quickly as possible and returned to line
A. All participants performed the test 3 times with
at least 3 min rest between trials. The total
distance covered was 36.56 m and the height of
the cones was 0.3 m. Seven days later, the retest
was performed under the same conditions. A
photocell (Migrogate Polifemo Radio Light®,
Bolzano, Italy) located over cone A was used to
record the time. Time measurement started and
finished when the subject crossed the line
between the tripods. The calculated margin of
error was ±0.001 s and the sensors were set
approximately 0.40 m above the floor. The
coefficient of variation was 2.58%.
Pick-up the ball: From a stationary
position the participant had to start propelling
and pick up four basketball balls from the floor as
previously described by De Groot et al. (2012)
(Figure 3). The total time taken to complete the
test was recorded with a photocell (Migrogate
Polifemo Radio Light®, Bolzano, Italy) located
over the start and finish lines. All participants
performed the test 3 times with at least 3 min rest
between trials. The coefficient of variation for this
test was 6.61%.
Strength and power
Hand dynamometry test: To measure the
strength of the upper extremities, basketball
players performed a handgrip test. They squeezed
the dynamometer (Jamar, USA) with a maximum
isometric effort for 5 s with a rest period of at least
60 s and the highest value was used to determine
maximal grip strength (kg).
Maximal pass: As described by De Groot
et al. (2012), the participant began in the middle of
the baseline, front wheels behind the line, and
passed a basketball as far as possible from a
stationary position. The distance between the
participant and the spot where the ball hit the
floor was measured (in meters). The final score
was the average distance of five passes.
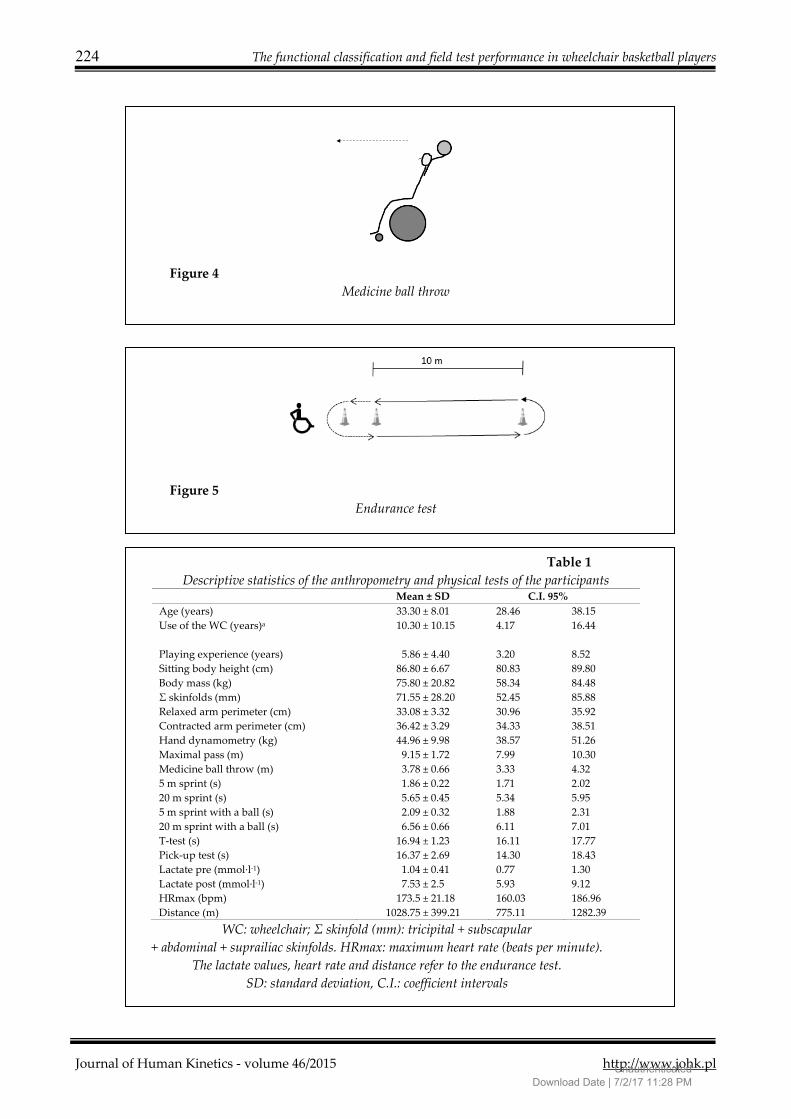
Medicine ball: Using a similar position to
the maximal pass, participants had to throw a 5
kg medicine ball as far as possible (Gonaus and
Muller, 2012) (Figure 4). The distance was
measured in meters. Each participant made three
attempts and the best was used for further
analysis.
Endurance
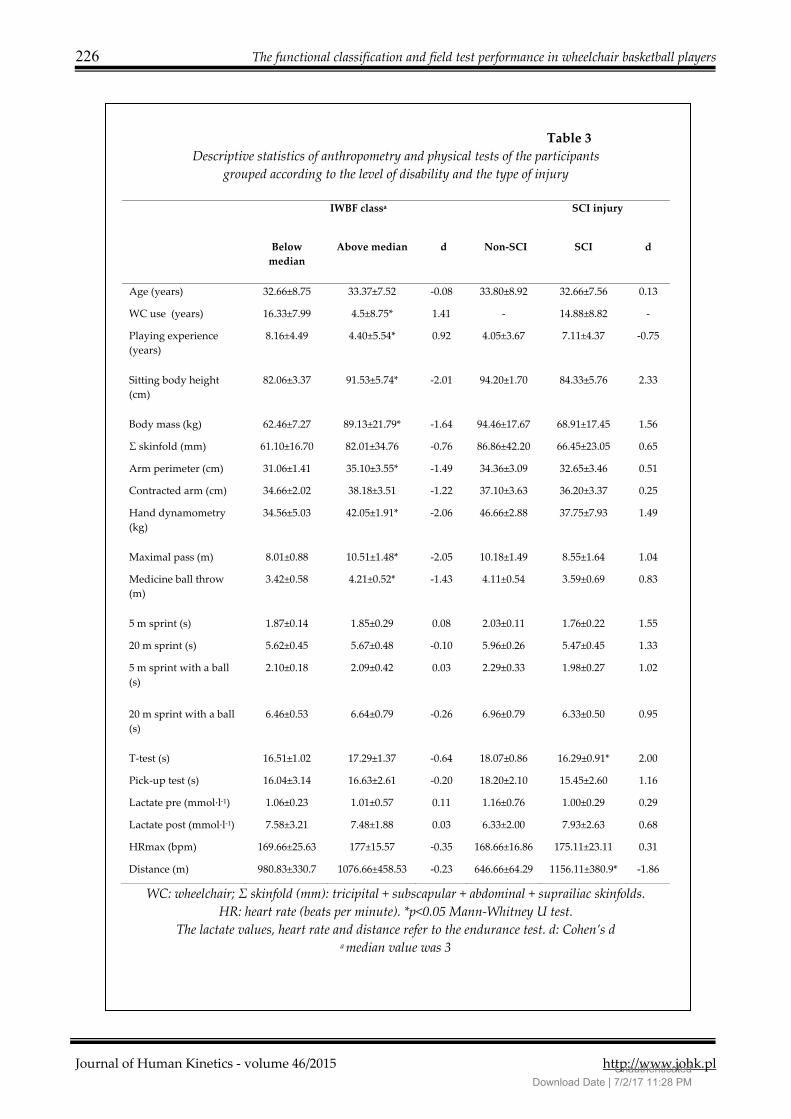
Yo-Yo intermittent recovery adapted test
(Yo-yo ITa): Level 1 version of the Yo-Yo test was
completed according to previously described
methods (Castagna et al., 2008). Due to the
differences between running and propelling the
wheelchair, the distance covered in the shuttle run
UnauthenticatedDownload Date | 7/2/17 11:28 PM

222 The functional classification and field test performance in wheelchair basketball players
Journal of Human Kinetics - volume 46/2015 http://www.johk.pl
was reduced to 10 m (Yanci et al., 2015) (Figure 5).
The total distance covered during the test was
measured (meters). The heart rate (HR) was
recorded at 5 s intervals by telemetry (Polar Team
Sport System®, Polar Electro Oy, Finland) during
the entire test. Within a week, participants
repeated this tests and the ICC for the distance in
the test was 0.94.
Before (pre-test) and immediately after
the endurance test (post-test) earlobe capillary
blood-samples were obtained for the
determination of lactate concentrations (Lactate
Pro LT-1710®, ArkRay Inc Ltd, Kyoto, Japan).
Experimental Design
The tests were performed on a synthetic
indoor court in the beginning of the season. The
players were instructed to perform all tests at
maximum intensity. Players did not perform
strenuous exercise within 48 h prior to testing.
Testing was conducted over two different
sessions separated by one week. During the first
testing session anthropometric measurements, the
handgrip, sprint and agility tests were performed;
and during the second one, the strength and
endurance performance were evaluated. Before
each testing session a standardized warm-up was
undertaken by the participants.
Participants age (years), type of injury:
spinal cord injury (SCI) and non-SCI, IWBF class,
the use of the wheelchair for everyday activities
(in years) and experience in wheelchair basketball
(in years) were recorded.
Statistical analysis
Mean ± standard deviation and coefficient
intervals at 95% (CI 95%) were used to describe
the sample of participants. Skinfold thickness and
the results of the Pick-up test were transformed
into logarithms. Normality of the data was proved
using the Kolmogorov-Smirnov and Saphiro-Wilk
tests to verify the need of parametric or non-
parametric tests to be applied. To analyse the
correlation between different variables Pearson’s
correlations or Spearman’s Rank Order were
performed. The median value of the IWBF
classification was calculated and two groups of
players were created: players with a class above
the median and players below the median. Also,
participants were divided according to their
injury into players with a spinal cord injury (SCI)
and players with other type of injuries (non-SCI).
To identify significant differences in the variables
among two groups of players a Mann-Whitney U
test was performed. To measure the effect size,
Cohen’s d was evaluated. Threshold values for
effect size statistics were 0.2, 0.5 and 0.8 for small,
medium and large effect sizes, respectively
(Cohen, 1988).
Statistical analyses of data were
performed using the Statistical Package for the
Social Sciences 17.0 software package (SPSS). The
level of significance was set at p<0.05.
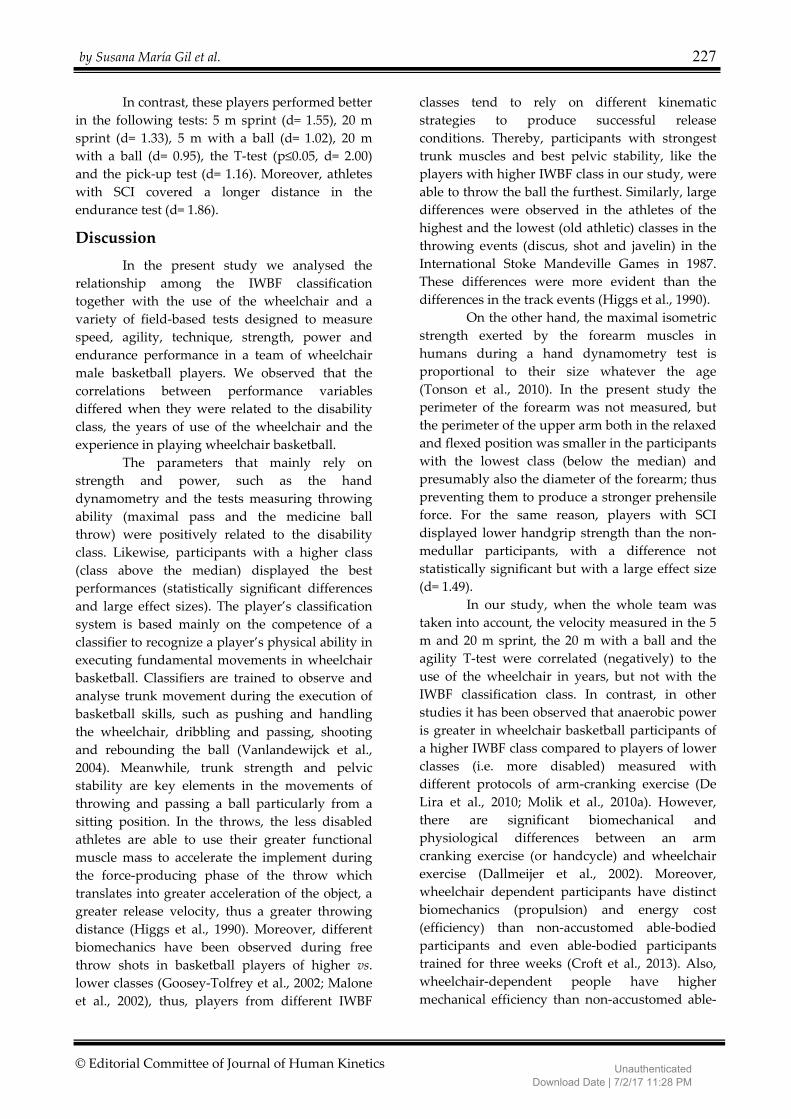
Results
The descriptive statistics of the
participants are shown in Table 1.
The class of the participants positively
correlated (p= 0.01-0.05) with the body mass (r=
0.68), height (r= 0.77), contracted arm perimeter
(r= 0.68), hand dynamometry (r= 0.84), maximal
pass test (r= 0.67) and the medicine ball throw (r=
0.67) in both the total group and also the SCI
players (Table 2). However, there was a
statistically significant negative correlation
(p≤0.01) only in the SCI players between the IWBF
classification and the 5 m sprint test (r= -0,92), the
20 m sprint test (r= -0,92), the 5 m with a ball (r= -
0,89), the 20 m with a ball (r= -0,82), the T-test (r= -
0,81) and also the distance covered in the
modified Yo-yo ITa test (r= 0,82). Meaning that the
players with a higher class in the classification of
the disability performed better.
The years of experience using a
wheelchair were negatively correlated (p≤0.01)
with the 5 and 20 m sprint test as well as the T-
test, but only when the whole group was taken
into account. Thus, players who used the
wheelchair for everyday activities performed
better in the aforementioned tests. On the other
hand, the experience in basketball playing only
correlated negatively (p≤0.05) with the 20 m test
with a ball (r= -0.68) and the T-test (r= -0.57).
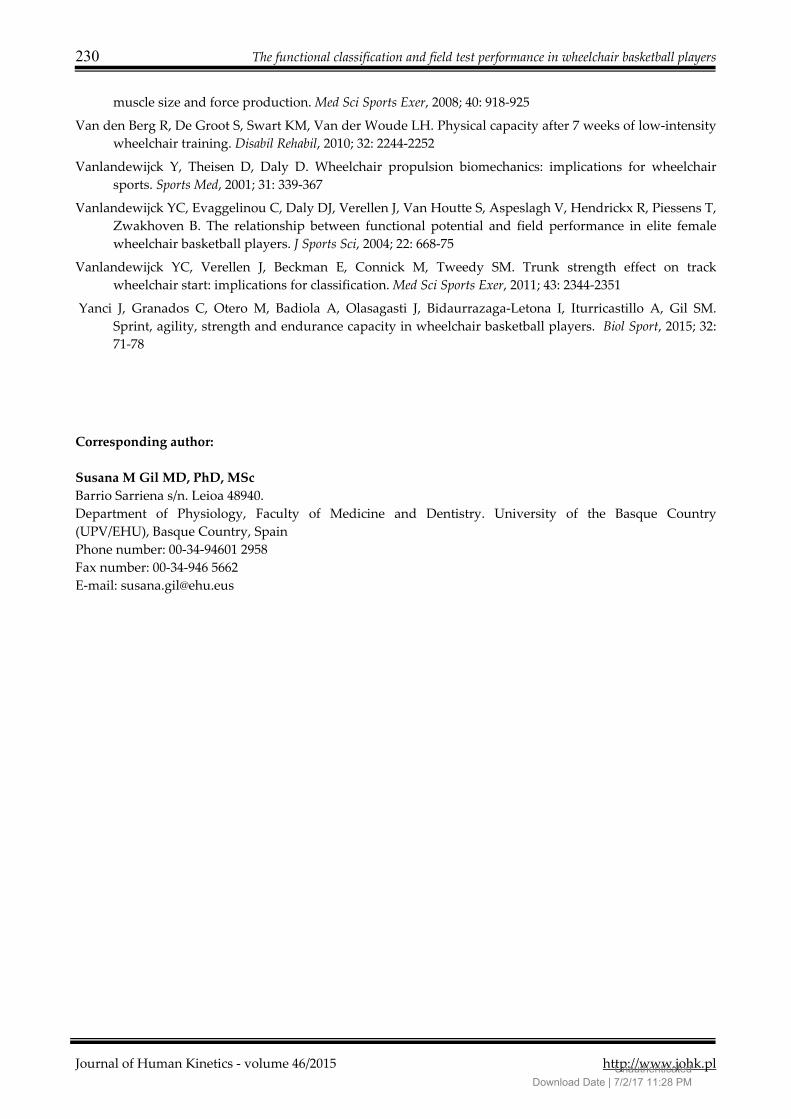
Players with a disability class below the
median value had more experience (p≤0.05) using
a wheelchair (d= 1.41) and playing wheelchair
basketball (d= 0.92). They also had lower body
height (p≤0.05, d= 2.01), body mass (p≤0.05, d=
1.64) and smaller arm perimeter (p≤0.05) in both,
the relaxed (d= 1.49) and the contracted (d= 1.22)
positions. Moreover, players with the class above
the median value displayed a larger hand-grip
strength (p≤0.05, d= 2.06), maximal pass (p≤0.05,
d= 2.05) and medicine ball throw (p<0.05, d= 1.43)
UnauthenticatedDownload Date | 7/2/17 11:28 PM

by Susana María Gil et al. 223
© Editorial Committee of Journal of Human Kinetics
(Table 3).
On the other hand, players with a SCI had
lower body height (d= 2.33) and mass (d= 1.56).
They also had a lower hand-grip strength (d=
1.49), maximal pass (d= 1.04) and medicine ball
throw (d= 0.83).
Figure 1
Speed test
Figure 2
Agility T-test
Figure 3
Pick-up test (De Groot et al., 2012)
UnauthenticatedDownload Date | 7/2/17 11:28 PM
224 The functional classification and field test performance in wheelchair basketball players
Journal of Human Kinetics - volume 46/2015 http://www.johk.pl
Figure 4
Medicine ball throw
Figure 5
Endurance test
Table 1
Descriptive statistics of the anthropometry and physical tests of the participants Mean ± SD C.I. 95%
Age (years) 33.30 ± 8.01 28.46 38.15
Use of the WC (years)a 10.30 ± 10.15 4.17 16.44
Playing experience (years) 5.86 ± 4.40 3.20 8.52
Sitting body height (cm) 86.80 ± 6.67 80.83 89.80
Body mass (kg) 75.80 ± 20.82 58.34 84.48
Σ skinfolds (mm) 71.55 ± 28.20 52.45 85.88
Relaxed arm perimeter (cm) 33.08 ± 3.32 30.96 35.92
Contracted arm perimeter (cm) 36.42 ± 3.29 34.33 38.51
Hand dynamometry (kg) 44.96 ± 9.98 38.57 51.26
Maximal pass (m) 9.15 ± 1.72 7.99 10.30
Medicine ball throw (m) 3.78 ± 0.66 3.33 4.32
5 m sprint (s) 1.86 ± 0.22 1.71 2.02
20 m sprint (s) 5.65 ± 0.45 5.34 5.95
5 m sprint with a ball (s) 2.09 ± 0.32 1.88 2.31
20 m sprint with a ball (s) 6.56 ± 0.66 6.11 7.01
T-test (s) 16.94 ± 1.23 16.11 17.77
Pick-up test (s) 16.37 ± 2.69 14.30 18.43
Lactate pre (mmol·l-1) 1.04 ± 0.41 0.77 1.30
Lactate post (mmol·l-1) 7.53 ± 2.5 5.93 9.12
HRmax (bpm) 173.5 ± 21.18 160.03 186.96
Distance (m) 1028.75 ± 399.21 775.11 1282.39
WC: wheelchair; Σ skinfold (mm): tricipital + subscapular
+ abdominal + suprailiac skinfolds. HRmax: maximum heart rate (beats per minute).
The lactate values, heart rate and distance refer to the endurance test.
SD: standard deviation, C.I.: coefficient intervals
UnauthenticatedDownload Date | 7/2/17 11:28 PM

by Susana María Gil et al. 225
© Editorial Committee of Journal of Human Kinetics
Table 2
Correlations amongst an IWBF class, wheelchair use for everyday activities (number
of years), and anthropometric and performance parameters.
Values are shown for the total group and the spinal cord injury (SCI) sub-group
IWBF Classification Wheelchair use
Body mass Total
SCI
0.68*
0.25
-0.85***
-0.75**
Height Total
SCI
0.77**
0.68*
-0.84**
-0.75*
Σ skinfold Total
SCI
0.48
0.45
-0.28
-0.16
Contracted arm perimeter Total
SCI
0.68*
0.85**
-0.33
-0.15
Hand dynamometry Total
SCI
0.84*
0.77**
-0.36
-0.42
Maximal pass Total
SCI
0.67*
0.88**
-0.30
0.14
Medicine ball throw Total
SCI
0.67*
0.86**
-0.24
0.23
5 m sprint Total
SCI
0.11
-0.92**
-0.80**
-0.54
20 m sprint Total
SCI
0.02
-0.92**
-0.77**
-0.54
5 m sprint with a ball Total
SCI
-0.07
-0.89**
-0.53
-0.49
20 m sprint with a ball Total
SCI
0.02
-0.82*
-0.65*
-0.41
T-test Total
SCI
0.33
-0.81**
-0.78**
-0.45
Pick-up test Total
SCI
0.51
0.09
-0.20
-0.46
Lactate pre Total
SCI
0.10
0.76
-0.24
-0.39
Lactate post Total
SCI
0.07
0.34
-0.56
-0.60
HRmax Total
SCI
0.20
0.54
0.33
0.41
Distance Total
SCI
0.04
0.82**
0.36
-0.20
IWBF = International wheelchair basketball federation; Σ skinfold (mm): tricipital + subscapular
+ abdominal + suprailiac skinfolds. HRmax: maximum heart rate (beats per minute).
HRmax: maximum heart rate. The lactate values, heart rate
and distance refer to the endurance test.
*p<0.05, **p<0.01, ***p<0.001
UnauthenticatedDownload Date | 7/2/17 11:28 PM
226 The functional classification and field test performance in wheelchair basketball players
Journal of Human Kinetics - volume 46/2015 http://www.johk.pl
Table 3
Descriptive statistics of anthropometry and physical tests of the participants
grouped according to the level of disability and the type of injury
IWBF classa SCI injury
Below
median
Above median d Non-SCI SCI d
Age (years) 32.66±8.75 33.37±7.52 -0.08 33.80±8.92 32.66±7.56 0.13
WC use (years) 16.33±7.99 4.5±8.75* 1.41 - 14.88±8.82 -
Playing experience
(years)
8.16±4.49 4.40±5.54* 0.92 4.05±3.67 7.11±4.37 -0.75
Sitting body height
(cm)
82.06±3.37 91.53±5.74* -2.01 94.20±1.70 84.33±5.76 2.33
Body mass (kg) 62.46±7.27 89.13±21.79* -1.64 94.46±17.67 68.91±17.45 1.56
Σ skinfold (mm) 61.10±16.70 82.01±34.76 -0.76 86.86±42.20 66.45±23.05 0.65
Arm perimeter (cm) 31.06±1.41 35.10±3.55* -1.49 34.36±3.09 32.65±3.46 0.51
Contracted arm (cm) 34.66±2.02 38.18±3.51 -1.22 37.10±3.63 36.20±3.37 0.25
Hand dynamometry
(kg)
34.56±5.03 42.05±1.91* -2.06 46.66±2.88 37.75±7.93 1.49
Maximal pass (m) 8.01±0.88 10.51±1.48* -2.05 10.18±1.49 8.55±1.64 1.04
Medicine ball throw
(m)
3.42±0.58 4.21±0.52* -1.43 4.11±0.54 3.59±0.69 0.83
5 m sprint (s) 1.87±0.14 1.85±0.29 0.08 2.03±0.11 1.76±0.22 1.55
20 m sprint (s) 5.62±0.45 5.67±0.48 -0.10 5.96±0.26 5.47±0.45 1.33
5 m sprint with a ball
(s)
2.10±0.18 2.09±0.42 0.03 2.29±0.33 1.98±0.27 1.02
20 m sprint with a ball
(s)
6.46±0.53 6.64±0.79 -0.26 6.96±0.79 6.33±0.50 0.95
T-test (s) 16.51±1.02 17.29±1.37 -0.64 18.07±0.86 16.29±0.91* 2.00
Pick-up test (s) 16.04±3.14 16.63±2.61 -0.20 18.20±2.10 15.45±2.60 1.16
Lactate pre (mmol·l-1) 1.06±0.23 1.01±0.57 0.11 1.16±0.76 1.00±0.29 0.29
Lactate post (mmol·l-1) 7.58±3.21 7.48±1.88 0.03 6.33±2.00 7.93±2.63 0.68
HRmax (bpm) 169.66±25.63 177±15.57 -0.35 168.66±16.86 175.11±23.11 0.31
Distance (m) 980.83±330.7 1076.66±458.53 -0.23 646.66±64.29 1156.11±380.9* -1.86
WC: wheelchair; Σ skinfold (mm): tricipital + subscapular + abdominal + suprailiac skinfolds.
HR: heart rate (beats per minute). *p<0.05 Mann-Whitney U test.
The lactate values, heart rate and distance refer to the endurance test. d: Cohen’s d a median value was 3
UnauthenticatedDownload Date | 7/2/17 11:28 PM
by Susana María Gil et al. 227
© Editorial Committee of Journal of Human Kinetics
In contrast, these players performed better
in the following tests: 5 m sprint (d= 1.55), 20 m
sprint (d= 1.33), 5 m with a ball (d= 1.02), 20 m
with a ball (d= 0.95), the T-test (p≤0.05, d= 2.00)
and the pick-up test (d= 1.16). Moreover, athletes
with SCI covered a longer distance in the
endurance test (d= 1.86).
Discussion
In the present study we analysed the
relationship among the IWBF classification
together with the use of the wheelchair and a
variety of field-based tests designed to measure
speed, agility, technique, strength, power and
endurance performance in a team of wheelchair
male basketball players. We observed that the
correlations between performance variables
differed when they were related to the disability
class, the years of use of the wheelchair and the
experience in playing wheelchair basketball.
The parameters that mainly rely on
strength and power, such as the hand
dynamometry and the tests measuring throwing
ability (maximal pass and the medicine ball
throw) were positively related to the disability
class. Likewise, participants with a higher class
(class above the median) displayed the best
performances (statistically significant differences
and large effect sizes). The player’s classification
system is based mainly on the competence of a
classifier to recognize a player’s physical ability in
executing fundamental movements in wheelchair
basketball. Classifiers are trained to observe and
analyse trunk movement during the execution of
basketball skills, such as pushing and handling
the wheelchair, dribbling and passing, shooting
and rebounding the ball (Vanlandewijck et al.,
2004). Meanwhile, trunk strength and pelvic
stability are key elements in the movements of
throwing and passing a ball particularly from a
sitting position. In the throws, the less disabled
athletes are able to use their greater functional
muscle mass to accelerate the implement during
the force-producing phase of the throw which
translates into greater acceleration of the object, a
greater release velocity, thus a greater throwing
distance (Higgs et al., 1990). Moreover, different
biomechanics have been observed during free
throw shots in basketball players of higher vs.
lower classes (Goosey-Tolfrey et al., 2002; Malone
et al., 2002), thus, players from different IWBF
classes tend to rely on different kinematic
strategies to produce successful release
conditions. Thereby, participants with strongest
trunk muscles and best pelvic stability, like the
players with higher IWBF class in our study, were
able to throw the ball the furthest. Similarly, large
differences were observed in the athletes of the
highest and the lowest (old athletic) classes in the
throwing events (discus, shot and javelin) in the
International Stoke Mandeville Games in 1987.
These differences were more evident than the
differences in the track events (Higgs et al., 1990).
On the other hand, the maximal isometric
strength exerted by the forearm muscles in
humans during a hand dynamometry test is
proportional to their size whatever the age
(Tonson et al., 2010). In the present study the
perimeter of the forearm was not measured, but
the perimeter of the upper arm both in the relaxed
and flexed position was smaller in the participants
with the lowest class (below the median) and
presumably also the diameter of the forearm; thus
preventing them to produce a stronger prehensile
force. For the same reason, players with SCI
displayed lower handgrip strength than the non-
medullar participants, with a difference not
statistically significant but with a large effect size
(d= 1.49).
In our study, when the whole team was
taken into account, the velocity measured in the 5
m and 20 m sprint, the 20 m with a ball and the
agility T-test were correlated (negatively) to the
use of the wheelchair in years, but not with the
IWBF classification class. In contrast, in other
studies it has been observed that anaerobic power
is greater in wheelchair basketball participants of
a higher IWBF class compared to players of lower
classes (i.e. more disabled) measured with
different protocols of arm-cranking exercise (De
Lira et al., 2010; Molik et al., 2010a). However,
there are significant biomechanical and
physiological differences between an arm
cranking exercise (or handcycle) and wheelchair
exercise (Dallmeijer et al., 2002). Moreover,
wheelchair dependent participants have distinct
biomechanics (propulsion) and energy cost
(efficiency) than non-accustomed able-bodied
participants and even able-bodied participants
trained for three weeks (Croft et al., 2013). Also,
wheelchair-dependent people have higher
mechanical efficiency than non-accustomed able-
UnauthenticatedDownload Date | 7/2/17 11:28 PM

228 The functional classification and field test performance in wheelchair basketball players
Journal of Human Kinetics - volume 46/2015 http://www.johk.pl
bodied participants during manual wheelchair
ergometry (Brown et al., 1990). Thus, it is not
surprising that in our study players with SCI, that
use their wheelchair for everyday activities,
performed better in the velocity and agility tests
(T-test and Pick-up test) compared to the players
that only use the wheelchair for training and
playing the games.
To our knowledge only few studies have
aimed to determine the relationship between the
functional classification level and sport specific
skill tests, for instance wheelchair basketball (De
Groot et al., 2012; Hutzler, 1993; Molik et al.,
2010b) and wheelchair rugby (Morgulek-
Adamowicz et al., 2011). Similarly to our study,
De Groot et al. (2012) did not find any differences
between the players of a low (<4) and high (>4)
IWBF classification level in short-term
performance field-based tests. While the rest of
the authors observed that the participants with a
higher classification class performed better; these
differences were particularly significant amongst
the participants of both ends of the classification.
The difference with our study may come from the
group of participants. In our study players
belonged to one team, they trained and played
together and in the same conditions. Whereas the
participants of Molik et al.’s study (2010b) where
more heterogeneous, and belonged to different
teams; additionally they included other different
pathologies such as cerebral palsy. On the other
hand, Hutzler (1993) observed a moderate
correlation (r= -0.64, p=0.031) between the class
and 428 m racing trails (lasting for about 2-3 min),
but not the 6 min test nor the slalom test.
In the present study the tests that required
the best agility and technical aspect (T-test and 20
m with a ball) were related to the years of
experience in playing basketball. Thus, not only
everyday use of the wheelchair but also training
seems to be important to have a good
performance in the most complex and technically
difficult tests (Vanlandewijck et al., 2011). It has
been observed that even seven weeks of a low
intensity training program can improve peak
aerobic and sprint power output, efficiency and
physical strain in untrained able-bodied male
individuals (Van den Berg et al., 2010),
demonstrating the importance of training
particular skills to excel in wheelchair basketball.
Besides, a better propulsion technique,
mechanical efficiency and agility to turn may be
the cause for the SCI players to outperform the
non-SCI players in the endurance test which is
important due to the fact that 64% of the game
consists of propulsion activation and 36% of the
time braking activity (Coutts, 1992).
One of the limitations of our study is the
small number of participants, particularly the
players with non-SCI. However it is worth
noticing that all of the players belonged to the
same competitive team and therefore they trained
and played together and the results may not be
related to different training status. In any case, it
would be very interesting to repeat the study in
different teams of wheelchair basketball of the
same level to reassure the results.
In summary, this set of easy-to-implement
performance tests may be used by coaches.
However, caution should be taken when relating
the results to the disability because the
relationship between the IWBF class and
performance may vary, and we could only
confirm our hypothesis partially. In fact, in this
team of wheelchair basketball players, significant
correlations were observed between the IWBF
classification class and the power and strength of
the arms and the body. In contrast, velocity and
agility were related to the years of wheelchair use,
whereas agility and technique were related to the
years of wheelchair basketball training.
Acknowledgements The authors would like to thank the players of the Salto Bera-Bera for participating in this study.
This work was supported by a grant from the Hegalak Zabalik Fundazioa. IBL was supported by a grant
from the Basque Government [BFI2010-35]. All other co-authors received no funding for this work from any
organization, other than salary support for the authors from their respective institutions.
Part of this research was presented in the 18th Annual Congress of the European College of Sport
Science 2013.
UnauthenticatedDownload Date | 7/2/17 11:28 PM

by Susana María Gil et al. 229
© Editorial Committee of Journal of Human Kinetics
References
Brown DD, Knowlton RG, Hamill J, Schneider TL, Hetzler RK. Physiological and biomechanical differences
between wheelchair-dependent and able-bodied subjects during wheelchair ergometry. Eur J Appl
Physiol Occup Physiol, 1990; 60: 179-182
Castagna C, Impellizzeri FM, RampininiE, D'OttavioS, Manzi V. The Yo-Yo intermittent recovery test in
basketball players. J Sci Med Sport, 2008; 11: 202-208
Cohen J. Statistical Power Analysis for the behavioural sciences. Lawrence Earlbaum Associates, Hillsdale, NJ;
1988
Coutts KD. Dynamics of wheelchair basketball. Med Sci Sports Exer, 1992; 24: 231-234
Croft L, Lenton J, Tolfrey K, Goosey-Tolfrey V. The effects of experience on the energy cost of wheelchair
propulsion. Eur J Phys Rehab Med, 2013; 49: 865-873
Dallmeijer AJ, Zentgraaff ID, Zijp NI, Van der Woude LH. Submaximal physical strain and peak
performance in handcycling versus handrim wheelchair propulsion. Spinal Cord, 2004; 42: 91-98
De Groot S, Balvers IJ, Kouwenhoven SM, Janssen TW. Validity and reliability of tests determining
performance-related components of wheelchair basketball. J Sports Sci, 2012; 30: 879-887
De Lira CA, Vancini RL, Minozzo FC, Sousa BS, Dubas JP, Andrade MS, Steinberg LL, Da Silva AC.
Relationship between aerobic and anaerobic parameters and functional classification in wheelchair
basketball players. Scand J Med Sci Sports, 2010; 20: 638-643
Gonaus C, Müller E. Using physiological data to predict future career progression in 14- to 17-year-old
Austrian soccer academy players. J Sports Sci, 2012; 30: 1673-1682
Goosey-Tolfrey VL, Leicht CA. Field-based physiological testing of wheelchair athletes. Sports Med, 2013; 43:
77-91
Goosey-Tolfrey V, Butterworth D, Morriss C. Free Throw Shooting Technique of Male Wheelchair Basketball
Players. Adapt Phys Act Q, 2002; 19: 238-250
Higgs C, Babstock P, Buck J, Parsons C, Brewer J. Wheelchair Classification for Track and Field Events: A
Performance Approach. Adapt Phys Act Q, 1990; 7: 22-40
Hintzy F, Tordi N, Perrey S. Muscular efficiency during arm cranking and wheelchair exercise: a
comparison. Int J Sports Med, 2002; 23: 408-414
Hutzler Y. Physical performance of elite wheelchair basketball players in armcranking ergometry and in
selected wheeling tasks. Paraplegia, 1993; 31: 255-261
International Wheelchair Basketball Federation IWBF classification for wheelchair basketball 2010; (available
online at: www.iwbf.org; accessed on 18.04.2014)
Malone LA, Gervais PL, Steadward RD. Shooting mechanics related to player classification and free throw
success in wheelchair basketball. J Rehab Res Dev, 2002; 39: 701-709
Molik B, Laskin JJ, Kosmol A, Skucas K, Bida U. Relationship between functional classification levels and
anaerobic performance of wheelchair basketball athletes. Res Q Exer Sport, 2010a; 81: 69-73
Molik B, Kosmol A, Laskin JJ, Morgulec-Adamowicz N, Skucas K, Dabrowska A, Ergun N. Wheelchair
basketball skill tests: differences between athletes’ functional classification level and disability type.
Fizyoterapi Rehabilitasyon, 2010b; 21: 11-19
Morgulec-Adamowicz N, Kosmol A, Molik B, Yilla AB, Laskin JJ. Aerobic, anaerobic, and skill performance
with regard to classification in wheelchair rugby athletes. Res Q Exer Sport, 2011; 82: 61-69
Sassi RH, Dardouri W, Yahmed MH, Gmada N, Mahfoudhi ME, Gharbi Z. Relative and absolute reliability
of a Modified Agility T-Test and its relationship with vertical jump and straight sprint. J Strength Cond
Res, 2009; 23: 1644-1651
TonsonA, Ratel S, Le Fur Y, Cozzone P, Bendahan D. Effect of maturation on the relationship between
UnauthenticatedDownload Date | 7/2/17 11:28 PM
230 The functional classification and field test performance in wheelchair basketball players
Journal of Human Kinetics - volume 46/2015 http://www.johk.pl
muscle size and force production. Med Sci Sports Exer, 2008; 40: 918-925
Van den Berg R, De Groot S, Swart KM, Van der Woude LH. Physical capacity after 7 weeks of low-intensity
wheelchair training. Disabil Rehabil, 2010; 32: 2244-2252
Vanlandewijck Y, Theisen D, Daly D. Wheelchair propulsion biomechanics: implications for wheelchair
sports. Sports Med, 2001; 31: 339-367
Vanlandewijck YC, Evaggelinou C, Daly DJ, Verellen J, Van Houtte S, Aspeslagh V, Hendrickx R, Piessens T,
Zwakhoven B. The relationship between functional potential and field performance in elite female
wheelchair basketball players. J Sports Sci, 2004; 22: 668-75
Vanlandewijck YC, Verellen J, Beckman E, Connick M, Tweedy SM. Trunk strength effect on track
wheelchair start: implications for classification. Med Sci Sports Exer, 2011; 43: 2344-2351
Yanci J, Granados C, Otero M, Badiola A, Olasagasti J, Bidaurrazaga-Letona I, Iturricastillo A, Gil SM.
Sprint, agility, strength and endurance capacity in wheelchair basketball players. Biol Sport, 2015; 32:
71-78
Corresponding author:
Susana M Gil MD, PhD, MSc
Barrio Sarriena s/n. Leioa 48940.
Department of Physiology, Faculty of Medicine and Dentistry. University of the Basque Country
(UPV/EHU), Basque Country, Spain
Phone number: 00-34-94601 2958
Fax number: 00-34-946 5662
E-mail: [email protected]
UnauthenticatedDownload Date | 7/2/17 11:28 PM