Embed Size (px)
Citation preview

The Functional Design of a Project
Management Information System: Case
Study with South African Breweries Ltd
By
Anna Ju-Marié Bester
15379167
Final year project presented in partial fulfilment of the requirements for
the degree of Bachelors of Industrial Engineering
at Stellenbosch University.
Study leader: Prof. Corné Schutte
October 2011

Acknowledgements i
Acknowledgements
I would like to thank to following people:
Prof. Corné Schutte for support and guidance with expert knowledge during my final
year project.
Mnr. James Bekker for support and guidance with regard to the analyzing of the
questionnaire data.
Prof. Daan Nel from the Centre of Statistical Consultation for his time and guidance with
expert knowledge, in the statistical field, with regard to analyzing the questionnaire
data.
South African Breweries Limited for support and guidance with the Case Study.
Declaration ii
Declaration
I, the undersigned, hereby declare that the work contained in this final year project is my own
original work and that I have not previously in its entirety or in part submitted it at any
university for a degree.
Ek, die ondergetekende verklaar hiermee dat die werk in hierdie finalejaar projek vervat, my eie
oorspronklike werk is en dat ek dit nog nie vantevore in die geheel of gedeeltelik by enige
universiteit ter verkryging van 'n graad voorgelê het nie.
Sign on the dotted line:
………………………................. ………………………
Anna Ju-Maré Bester Date
ECSA Exit level outcomes reference iii
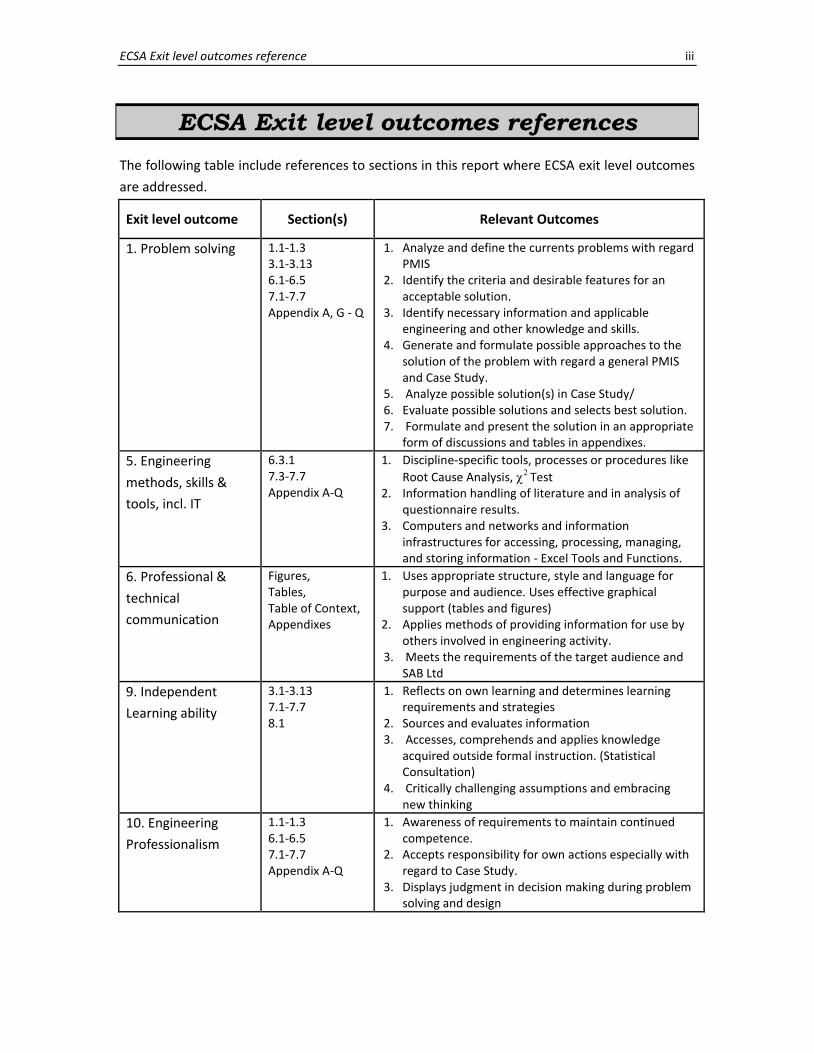
ECSA Exit level outcomes references
The following table include references to sections in this report where ECSA exit level outcomes
are addressed.
Exit level outcome Section(s) Relevant Outcomes
1. Problem solving 1.1-1.3 3.1-3.13 6.1-6.5 7.1-7.7 Appendix A, G - Q
1. Analyze and define the currents problems with regard PMIS
2. Identify the criteria and desirable features for an acceptable solution.
3. Identify necessary information and applicable engineering and other knowledge and skills.
4. Generate and formulate possible approaches to the solution of the problem with regard a general PMIS and Case Study.
5. Analyze possible solution(s) in Case Study/ 6. Evaluate possible solutions and selects best solution. 7. Formulate and present the solution in an appropriate
form of discussions and tables in appendixes.
5. Engineering
methods, skills &
tools, incl. IT
6.3.1 7.3-7.7 Appendix A-Q
1. Discipline-specific tools, processes or procedures like
Root Cause Analysis, Test 2. Information handling of literature and in analysis of
questionnaire results. 3. Computers and networks and information
infrastructures for accessing, processing, managing, and storing information - Excel Tools and Functions.
6. Professional &
technical
communication
Figures, Tables, Table of Context, Appendixes
1. Uses appropriate structure, style and language for purpose and audience. Uses effective graphical support (tables and figures)
2. Applies methods of providing information for use by others involved in engineering activity.
3. Meets the requirements of the target audience and SAB Ltd
9. Independent
Learning ability
3.1-3.13 7.1-7.7 8.1
1. Reflects on own learning and determines learning requirements and strategies
2. Sources and evaluates information 3. Accesses, comprehends and applies knowledge
acquired outside formal instruction. (Statistical Consultation)
4. Critically challenging assumptions and embracing new thinking
10. Engineering
Professionalism
1.1-1.3 6.1-6.5 7.1-7.7 Appendix A-Q
1. Awareness of requirements to maintain continued competence.
2. Accepts responsibility for own actions especially with regard to Case Study.
3. Displays judgment in decision making during problem solving and design
Abstract iv
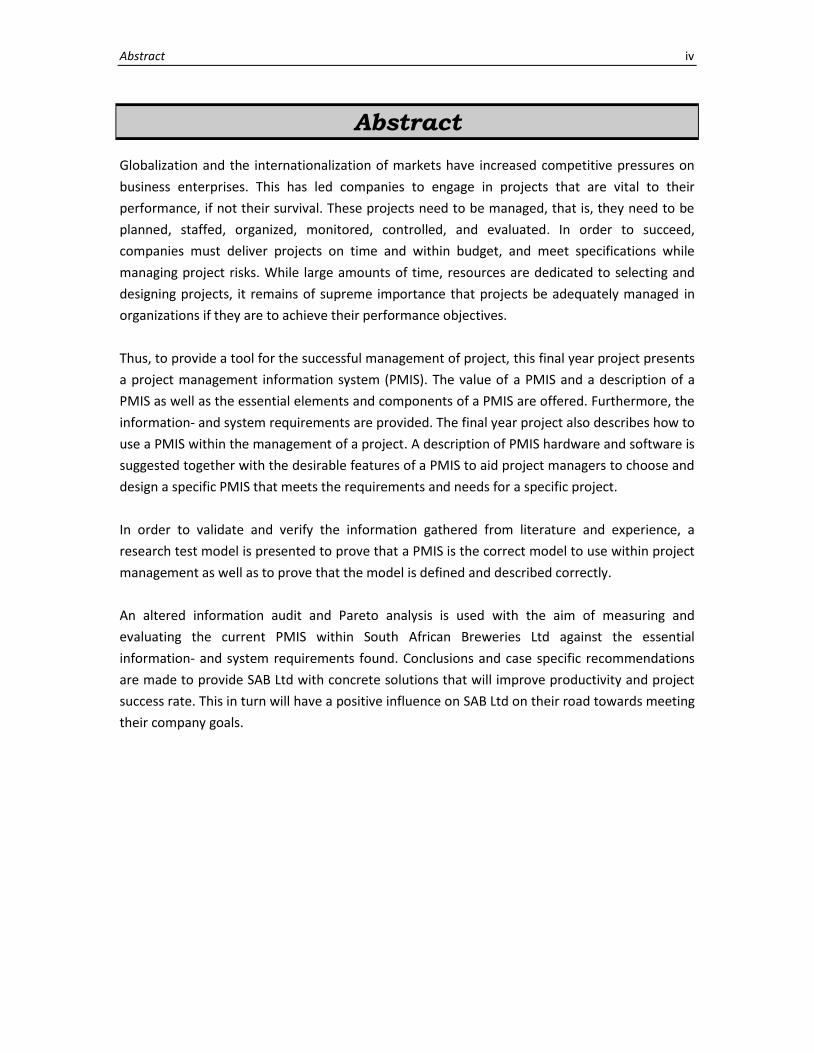
Abstract
Globalization and the internationalization of markets have increased competitive pressures on
business enterprises. This has led companies to engage in projects that are vital to their
performance, if not their survival. These projects need to be managed, that is, they need to be
planned, staffed, organized, monitored, controlled, and evaluated. In order to succeed,
companies must deliver projects on time and within budget, and meet specifications while
managing project risks. While large amounts of time, resources are dedicated to selecting and
designing projects, it remains of supreme importance that projects be adequately managed in
organizations if they are to achieve their performance objectives.
Thus, to provide a tool for the successful management of project, this final year project presents
a project management information system (PMIS). The value of a PMIS and a description of a
PMIS as well as the essential elements and components of a PMIS are offered. Furthermore, the
information- and system requirements are provided. The final year project also describes how to
use a PMIS within the management of a project. A description of PMIS hardware and software is
suggested together with the desirable features of a PMIS to aid project managers to choose and
design a specific PMIS that meets the requirements and needs for a specific project.
In order to validate and verify the information gathered from literature and experience, a
research test model is presented to prove that a PMIS is the correct model to use within project
management as well as to prove that the model is defined and described correctly.
An altered information audit and Pareto analysis is used with the aim of measuring and
evaluating the current PMIS within South African Breweries Ltd against the essential
information- and system requirements found. Conclusions and case specific recommendations
are made to provide SAB Ltd with concrete solutions that will improve productivity and project
success rate. This in turn will have a positive influence on SAB Ltd on their road towards meeting
their company goals.
Opsomming v
Opsomming
Globalisering en die internasionalisering van markte is tans besig om drasties toe te neem en
plaas mededingende druk op sake-ondernemings. Gevolglik raak maatskappye betrokke in
projekte wat noodsaaklik is vir hul prestasie, indien nie vir hul oorlewing nie. Hierdie projekte
moet bestuur word, dit wil sê hulle moet beplan, beman, georganiseer, gemonitor, beheer, en
geëvalueer word. Om suksesvol te wees, moet maatskappye projekte binne tyd en begroting
lewer. Hierdie projekte moet voldoen aan gestelde spesifikasies en moet risiko bestuur ook in ag
neem. Terwyl baie tyd en hulpbronne toegewy word aan die selektering en ontwerp van
projekte, bly dit van uiterste belang dat die projekte genoegsaam bestuur moet word as
organisasies hul prestasie doelwitte wil bereik.
Die finale jaar projek bied ʼn projek bestuur inligting stelsel (PBIS) aan. ʼn PBIS is ʼn hulpmiddel vir
die suksesvolle bestuur van projekte. Die waarde van die PBIS en 'n beskrywing van ʼn PBIS asook
die noodsaaklike elemente en komponente van 'n PBIS word aangebied. Verder word die
inligting- en stelsel vereistes voorsien. Die finale jaar projek beskryf ook hoe om die PBIS te
gebruik in die bestuur van 'n projek en dui aan hoe projek inligting gedeel kan word met behulp
van 'n PBIS. 'n Beskrywing van die PBIS hardeware en sagteware is saam met die gewenste
eienskappe van 'n PBIS voorsien. Dit sal projek bestuurders help om 'n spesifieke PBIS te
selekteer en te ontwerp wat aan die vereistes en behoeftes vir ʼn spesifieke projek voldoen.
Om te valideer en te verifieer dat die inligting wat versamel is uit literatuur en ervaring korrek is,
is 'n navorsings-toets model aangebied om te bewys dat die PBIS die korrekte model is om te
gebruik in die bestuur van ʼn projek sowel as om te bewys dat die model wat gedefinieer is,
korrek beskryf word.
'n Informasie oudit en Pareto analise word gebruik om die huidige PBIS binne die Suid-
Afrikaanse Brouerye Bpk., te meet en te evalueer teen die noodsaaklike inligting en stelsel wat
gevind is. Sodoende kan die huidige inligting en stelsel gapings geïdentifiseer word.
Gevolgtrekkings en spesifieke aanbevelings word gemaak om SAB Bpk. te voorsien met konkrete
oplossings wat produktiwiteit en projek sukseskoers sal verbeter. Dit is voordelig vir SAB Bpk. en
kan help om die maatskappy se doelwitte te bereik.
Table of Contents vi
Table of Contents
Acknowledgements i
Declaration ii
ECSA Exit level outcomes references iii
Abstract iv
Opsomming v
Table of Contents vi
List of Figures x
List of Tables xi
Glossary xii
1. Introduction 1
1.1 Problem Statement 1
1.2 Project Objectives 2
1.3 Project Methodology 2
2. Defining a PMIS 4
2.1 Description of a PMIS 4
2.2 Purpose of a PMIS 5
2.2.1 Monitoring 5
2.2.2 Evaluation 6
3. The Need for a PMIS 7
3.1 Project Success 7
3.2 The Value of Information in Project 9
3.2.1 Technical Data Management and Documentation 10
3.2.2 The Quantity and Quality of the Information in a Project 10
3.2.3 Integration and Synchronization of the Project Systems 10
3.2.4 Stakeholders Need Information on the Project 11
3.2.5 Information is a Prerequisite for Collaboration 11
3.3 Affordable and Most Reliable means to Document and Communicate Information 11
3.4 Armour for Defence against Political or Legal Attack 12
3.5 A Window into the Project 12
3.5.1 Centralized, Web-Accessible Management of Information 12
3.5.2 Standard Formats and Definitions 12
Table of Contents vii
3.5.3 Security levels 13
3.6 PMIS Improves Performance 13
3.7 Knowledge and Experience 13
3.8 PMIS Flow Diagram 14
4. Requirement Analysis of a PMIS 15
4.1 Research Methodology of Requirement Analysis of a PMIS 15
4.2 Information Requirements 15
4.2.1 Timely and Accurate 16
4.2.2 Precise 16
4.2.3 Reliable 16
4.2.4 Accountable 16
4.2.5 Integrity 17
4.3 Project Management Information System Requirements 17
4.3.1 Project Planning 17
4.3.2 Resources Management 18
4.3.3 Tracking and/or Monitoring 18
4.3.4 Report Generation 18
4.3.5 Decision Aiding 19
4.3.6 Capacity 19
4.3.7 User Friendly 19
4.3.8 Integration with other Systems 19
4.3.9 Internet Features 19
4.3.10 Security 20
4.4 Summary of the Characteristics of a PMIS 20
5. Functional Design of a PMIS 21
5.1 Desirable Features and Functions of a PMIS 21
5.1.1 Budgeting and Cost Control Features 21
5.1.2 Calendars 21
5.1.3 Internet Capabilities 22
5.1.4 Graphics 22
5.1.5 Importing/Exporting Data 22
5.1.6 Handling of Multiple Projects and Subprojects 23
5.1.7 Report Generation 23
5.1.8 Resource Management 23
Table of Contents viii
5.1.9 Planning 24
5.1.10 Project Monitoring and Tracking 24
5.1.11 Scheduling 24
5.1.12 Security 24
5.1.13 Sorting and Filtering 24
5.1.14 PERT Analysis 25
5.2 Information Architecture 25
5.3 Conceptual Design of a PMIS 26
5.4 PMIS Levels of Technology 26
6. Validation and Verification 30
6.1 Research Background and Model 30
6.2 Research Methodology of the Study done by Raymond and Bergeron 32
6.3 Results and Discussions of the Study done by Raymond and Bergeron 34
6.3.1 Test of the Measurement Model 34
6.3.2 Test of the Theoretical Model 36
6.4 Final Discussion of the Study done by Raymond and Bergeron 37
6.5 Conclusion of Empirical Study done by Raymond and Bergeron 39
7. Case Study: South African Breweries Ltd 40
7.1 Introduction 40
7.2 Overview of South African Breweries Limited 40
7.3 Research Methodology of Case Study with SAB Ltd 41
7.4 Focus Groups and Observations 42
7.5 Questionnaire 42
7.5.1 Questionnaire Methodology 42
7.5.2 Questionnaire Analysis 42
7.6 Results and Discussions 43
7.6.1 Quality of the PMIS 43
7.6.2 Quality of the Information 44
7.6.3 Use of the PMIS 46
7.6.3.1 Planning Function Tools 46
7.6.3.2 Monitoring Function Tools 47
7.6.3.3 Controlling Function Tools 48
7.6.3.4 Evaluating Function Tools 50
7.6.3.5 Reporting Function Tools 51
Table of Contents ix
7.6.3.6 Impacts on the Project Manager 52
7.6.4 Impact on Project Success 53
7.7 Recommendations 54
8. Conclusion 56
8.1 Reflection on Process Followed 56
8.2 Experience Gained from the Final Year Project 56
8.3 General Conclusion 57
Bibliography 58
Appendix A: Validation of Success Dimensions against Literature 61
Appendix B: Stakeholder Information Needs 62
Appendix C: Validating the Information- and System Requirements against Literature 63
Appendix D: Information System Success Model (ISSM) and Technology Acceptance Model
(TAM) 64
Appendix E: Characterization of Respondents of the Raymond and Bergeron Study 65
Appendix F: Measurement Codes of the Raymond and Bergeron- and South African Breweries
Ltd Case Study 66
Appendix G: Focus and Discussion Group Quick Wins for Possible Causes of Problems 68
Appendix H: South African Breweries Limited Questionnaire Template 70
Appendix I: Quality of the PMIS Data Analysis 72
Appendix J: Quality of the Information Data Analysis 73
Appendix K: Usage of Planning Function Tools Data Analysis 74
Appendix L: Usage of Monitoring Function Tools Data Analysis 75
Appendix M: Usage of Controlling Function Tools Data Analysis 76
Appendix N: Usage of Evaluating Function Tools Data Analysis 77
Appendix O: Usage of Reporting Function Tools Data Analysis 78
Appendix P: Data Analysis of the Impacts on the project manager 79
Appendix Q: Data Analysis of the Indicators of Project Success 80
List of Figures x
List of Figures
Figure 1: Project Methodology ......................................................................................................... 3
Figure 2: The PMIS within the Project Mananagemnet System (Raymond 1987) ........................... 4
Figure 3: Adding project management success to the DeLone and McLean success model
(DeLone, McLean 2003) ............................................................................................................ 8
Figure 4: Adapted Common dimensions in project management success and project product
success with PMIS overlap (van der Westhuizen, Fitzgerald 2004) .......................................... 9
Figure 5: PMIS Flow Chart .............................................................................................................. 14
Figure 6: Information Requirements of a PMIS .............................................................................. 15
Figure 7: PMIS Requirements ......................................................................................................... 17
Figure 8: Concept model of PMIS used within a construction project ........................................... 26
Figure 9: PMIS Levels of Technology (Caldwell 2004) .................................................................... 27
Figure 10: Efficiency of PMIS (Caldwell 2004) ................................................................................ 28
Figure 11: Research model on project management information system success (Raymond,
Bergeron 2007)........................................................................................................................ 31
Figure 12: Results of evaluating research model with PLS (n = 39) (Raymond, Bergeron 2007) ... 34
Figure 13: Methodology of the Case Study with SAB Ltd ............................................................... 41
Figure 14: Expected vs. Observed Quality Level of the PMIS ......................................................... 43
Figure 15: Pareto Analysis of the items influencing the quality level of the PMIS most ............... 44
Figure 16: Expected vs. Observed Quality Level of the Information within the PMIS ................... 45
Figure 17: Pareto Analysis of the Items Influencing the Quality Level of the Information Most ... 45
Figure 18: Use of Expected vs. Observed Planning Function Tools ................................................ 46
Figure 19: Pareto Analysis of the Planning Function Tools not used as expected ......................... 47
Figure 20: Use of Expected vs. Observed Monitoring Function Tools............................................ 48
Figure 21: Pareto Analysis of Monitoring Function Tools not used as expected ........................... 48
Figure 22: Use of Expected vs. Observed Controlling Function Tools ............................................ 49
Figure 23: Pareto Analysis of Controlling Function Tools not used as expected ........................... 49
Figure 24: Use of Expected vs. Observed Evaluating Function Tools ............................................. 50
Figure 25: Pareto Analysis of Evaluating Function Tools not used as expected ............................ 50
Figure 26: Use of Expected vs. Observed Reporting Function Tools .............................................. 51
Figure 27: Pareto Analysis of Reporting Function Tools not used as expected ............................. 51
Figure 28: Expected vs. Observed perceived impacts on the project manager ............................. 52
Figure 29: Pareto Analysis of Impacts on the Project Manager that doesn’t meet expectations . 53
Figure 30: Expected vs. Observed impacts of the PMIS that contributes to project success ........ 53
Figure 31: Pareto Analysis of Indicators Contributing to Underachieved Project Success ............ 54
Figure 32: Reflection and Execution of the Methodology followed .............................................. 56
List of Tables xi
List of Tables
Table 1: Complexity, Requirements and outcomes of the four levels of technology (Caldwell
2004) ....................................................................................................................................... 29
Table 2: Hypotheses of Research on PMIS Success ........................................................................ 32
Table 3: Reliability, convergent validity, and discriminant validity of the research constructs
(Raymond, Bergeron 2007) ..................................................................................................... 35
Glossary xii
Glossary
PMIS
SAB Ltd
Project Management Information System
South African Breweries Limited
PMI The Project Management Institute
HR
ERP
EKP
WBS
M&E
CO
PERT
CPM
ISSM
TAM
IS
PLS
Test
Human Resources
Enterprise Resource Planning
Enterprise Knowledge Portal
Work Breakdown Structure
Monitoring and Evaluating
Central Office
Programme Evaluation Review Technique
Critical Path Method
Information System Success Model
Technology Acceptance Model
Information System
Partial Least Square Method
Chi-Square Test
Introduction Page 1
University of Stellenbosch Department of Industrial Engineering
1. Introduction
This report presents the functional design of a Project Management Information System (PMIS)
with a case study a South African Breweries Limited. The project forms part of a research area of
Industrial Engineering applied in the project management field and the information
requirements within project management. The background of these fields and the motivation
for the problem statement is discussed in this section. The reader is provided with a brief
discussion regarding the problem identified along with a roadmap to the rest of the document.
The need of a Project Management Information System (PMIS) together with the reasons for
existence is firstly identified. After this a thorough investigation of the system is conducted, the
informational needs of the system are analysed and the essential requirements and elements of
a PMIS are provided. A validation and verification ensures that the PMIS is the correct model to
use within project management as well as to ensure that the model is defined correctly. An
information audit and Pareto analysis is used with the aim of measuring and evaluating the
current PMIS within South African Breweries Ltd against is the essential information- and system
requirements found with the aim of identifying the information- and system gaps.
1.1 Problem Statement
Globalization and the internationalization of markets have increased competitive pressures on
business enterprises. This has led companies to engage in projects that are vital to their
performance, if not their survival. These projects need to be managed, that is, they need to be
planned, staffed, organized, monitored, controlled, and evaluated (Liberatore, Pollack-Johnson
2004). In order to succeed, companies must deliver projects on time, within budget and meet
specifications while managing project risks. While large amounts of time and resources are
dedicated to selecting and designing projects, it remains of supreme importance that projects be
adequately managed in organizations if they are to achieve their performance objectives.
Even in the 1980’s, Peters identified that project management has long been considered an
important characteristic of successful companies (Peters, Waterman 1982) and is more than
ever necessary to efficiently and effectively manage these projects and to support project
managers in their decision-making.
Cleland states that project managers necessitate accurate and timely information for the
management of a project. Project planning, organizational design, motivation of project
stakeholders, and meaningful project reviews simply cannot be carried out without information on
the project together with how it relates to the larger organizational context in which the project is
found. (Cleland 2004b)
Introduction Page 2
University of Stellenbosch Department of Industrial Engineering
An accurate and complete project management information system (PMIS) must exist to provide
the basis for performance of the project. The project manager simply cannot make and execute
meaningful decisions without relevant and timely information (Cleland 2004b).
1.2 Project Objectives
In this report, a project management information system (PMIS) is presented. The value of the
PMIS and a description of a PMIS as well the essential elements and components of a PMIS are
offered. How to use the PMIS in the management of a project is described, along with how
project information can be shared. A description of PMIS hardware and software is suggested,
that aids project managers to choose and design a specific PMIS that meets the requirements
and needs for a specific project.
The goal of the report is to investigate and validate the functional design of a project
management information system (PMIS). The goal of the case study is to measure and evaluate
the current PMIS within South African Breweries Ltd against the essential information- and
system requirements found to identify the information- and system gaps present. Conclusions
and case specific recommendations can provide SAB Ltd with concrete solutions that will
improve productivity and their project success rate.
1.3 Project Methodology
During June/July 2010 and June/July 2011, South African Breweries Limited offered vacation
work with the aim to explore the business processes. The student seized this opportunity and
during the 2010 working period, it could be confirmed that a sufficient opportunity for a final
year project existed. This was clarified with Prof. C. Schutte in the Department of Industrial
Engineering, who agreed to provide guidance.
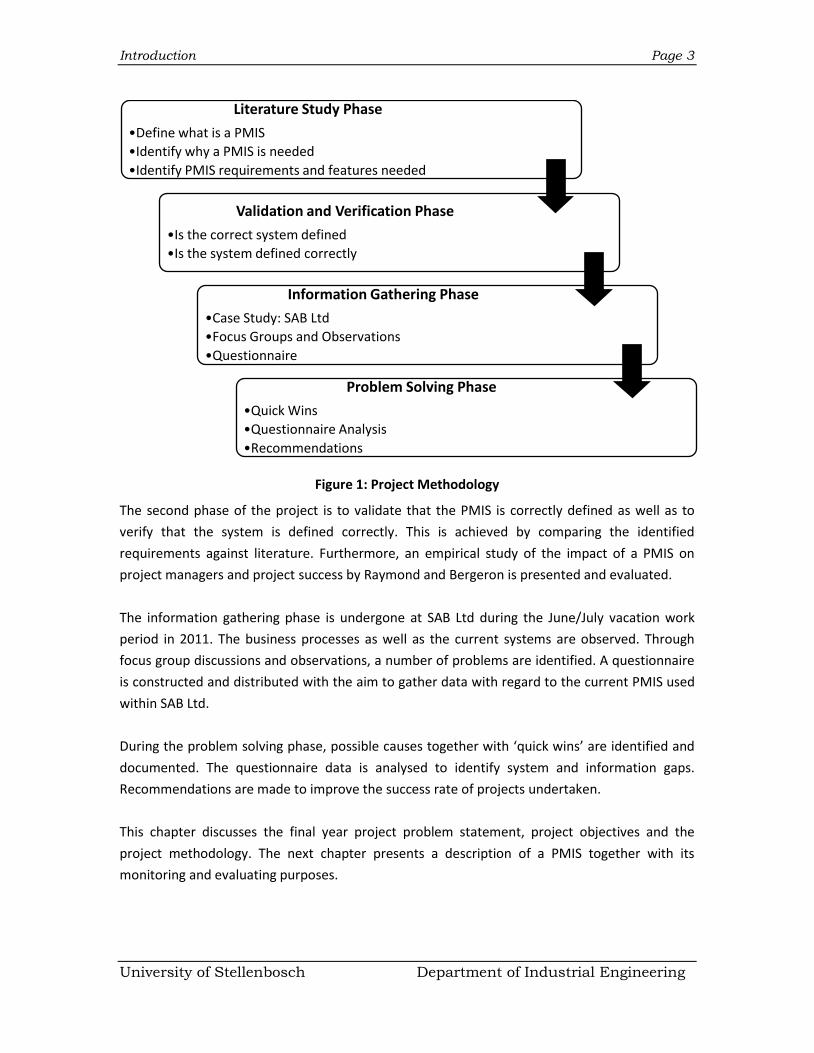
Figure 1 illustrates the methodology process approached to complete the final year project. This
project can broadly be divided into four phases namely the Literature Study Phase, the
Validation and Verification Phase, the Information Gathering Phase and the Problem Solving
Phase.
The first step of the project consists of a literature study in order to obtain the background
needed to complete this project. In this phase a PMIS is defined. The reasons why a PMIS is
needed is identified together with the appropriate information and system requirements is
identified. To ensure that the PMIS meets the specified requirements, the desirable features and
functions of a PMIS is identified.
Introduction Page 3
University of Stellenbosch Department of Industrial Engineering
Figure 1: Project Methodology
The second phase of the project is to validate that the PMIS is correctly defined as well as to
verify that the system is defined correctly. This is achieved by comparing the identified
requirements against literature. Furthermore, an empirical study of the impact of a PMIS on
project managers and project success by Raymond and Bergeron is presented and evaluated.
The information gathering phase is undergone at SAB Ltd during the June/July vacation work
period in 2011. The business processes as well as the current systems are observed. Through
focus group discussions and observations, a number of problems are identified. A questionnaire
is constructed and distributed with the aim to gather data with regard to the current PMIS used
within SAB Ltd.
During the problem solving phase, possible causes together with ‘quick wins’ are identified and
documented. The questionnaire data is analysed to identify system and information gaps.
Recommendations are made to improve the success rate of projects undertaken.
This chapter discusses the final year project problem statement, project objectives and the
project methodology. The next chapter presents a description of a PMIS together with its
monitoring and evaluating purposes.
Literature Study Phase
•Define what is a PMIS
•Identify why a PMIS is needed
•Identify PMIS requirements and features needed
Validation and Verification Phase
•Is the correct system defined
•Is the system defined correctly
Information Gathering Phase
•Case Study: SAB Ltd
•Focus Groups and Observations
•Questionnaire
Problem Solving Phase
•Quick Wins
•Questionnaire Analysis
•Recommendations
Defining a PMIS Page 4
University of Stellenbosch Department of Industrial Engineering
2. Defining a PMIS
The previous chapter discussed the final year project problem statement, project objectives and
project methodology. This chapter presents a description of a PMIS together with its monitoring
and evaluating purposes.
2.1 Description of a PMIS
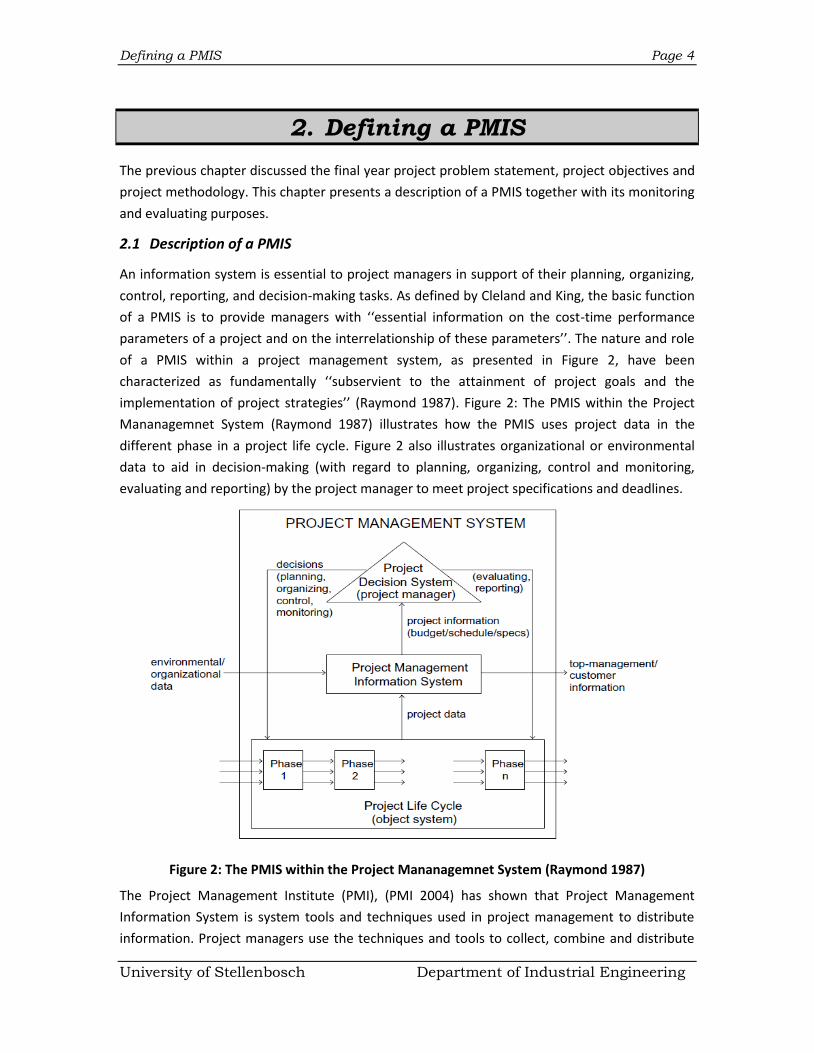
An information system is essential to project managers in support of their planning, organizing,
control, reporting, and decision-making tasks. As defined by Cleland and King, the basic function
of a PMIS is to provide managers with ‘‘essential information on the cost-time performance
parameters of a project and on the interrelationship of these parameters’’. The nature and role
of a PMIS within a project management system, as presented in Figure 2, have been
characterized as fundamentally ‘‘subservient to the attainment of project goals and the
implementation of project strategies’’ (Raymond 1987). Figure 2: The PMIS within the Project
Mananagemnet System (Raymond 1987) illustrates how the PMIS uses project data in the
different phase in a project life cycle. Figure 2 also illustrates organizational or environmental
data to aid in decision-making (with regard to planning, organizing, control and monitoring,
evaluating and reporting) by the project manager to meet project specifications and deadlines.
Figure 2: The PMIS within the Project Mananagemnet System (Raymond 1987)
The Project Management Institute (PMI), (PMI 2004) has shown that Project Management
Information System is system tools and techniques used in project management to distribute
information. Project managers use the techniques and tools to collect, combine and distribute
Defining a PMIS Page 5
University of Stellenbosch Department of Industrial Engineering
information through electronic and manual means. Project Management Information System is
used by upper and lower management to communicate with each other. The PMIS help plan,
execute and close project management goals. During the planning process, project managers
use PMIS for budget framework such as estimating costs. The PMIS is also used to create a
specific schedule and define the scope baseline. At the execution of the project management
goals, the project management team collects information into one database. The PMIS is used
to compare the baseline with the actual accomplishment of each activity, manage materials,
collect financial data, and keep a record for reporting purposes. During the close of the project,
the Project Management Information System is used to re-evaluate the goals to ensure that the
tasks were accomplished. Then, it is used to create a final report of the project close.
2.2 Purpose of a PMIS
A PMIS is mainly a monitoring and evaluating tool used throughout the progress of a project. A
PMIS is used for collecting data from across various functions analysing and presenting those
data in a form suitable for all parties involved in a project using monitoring and evaluation
functions (Turner 1999).
2.2.1 Monitoring
Monitoring is the process of regularly collecting, storing, analysing and reporting project
information that is utilized to make decisions for project management. Monitoring supply
project management and project stakeholders the information necessary to evaluate the
progress of the project, identify trends, patterns or deviations, keep project schedule and
measure progress towards the expected goals. Monitoring information permits decisions
regarding the use of project resources (human, material and financial) to enhance its
effectiveness. Meridith and Mantel argues that when the right information is available at the
right time and to the right people it can support decisions, like changes in the implementation
strategies, that can help the project reduce costs and increase its outputs (Meridith, Mantel
2008).
Project monitoring is the continuous assessment of project implementation in relation to the
agreed plans and the agreed prerequisite of services to project beneficiaries. As such, project
monitoring supplies priceless information to managers and other project stakeholders with
regard to the progress of the project. Further, it fortunately identifies potential successes or
problems to assist timely adjustments to project operations (Meridith, Mantel 2008).
Defining a PMIS Page 6
University of Stellenbosch Department of Industrial Engineering
2.2.2 Evaluation
Evaluation is the periodic assessment of a project's relevance, performance, efficiency, and
impact (both expected and unexpected) in relation to the stated project objectives and
specifications. Evaluation profits from the process of information gathering to facilitate the
assessment of the extend at which the project is achieving or has achieved its expected goals. Its
results permit project managers, beneficiaries, partners, donors and all project stakeholders to
learn from the experience and improve future interventions. Meredith and Mantel states that
qualitative and quantitative information are critical components of an evaluation. Without it, it
is almost impossible to identify how project interventions are contributing (or not) to the project
goals (Meridith, Mantel 2008).
This chapter presented a description of a PMIS together with its monitoring and evaluating
purposes. The next chapter discusses the need for a PMIS.
The Need for a PMIS Page 7
University of Stellenbosch Department of Industrial Engineering
3. The Need for a PMIS
The previous chapter presented a description of a PMIS together with its monitoring and
evaluating tools. This chapter discusses the need for a PMIS with regard to project success, the
value of information, data management, system integration and taking stakeholders into
consideration. A flow chart is presented to indicate how quality information is shared via a PMIS
and how it has a direct correlation on improved performance.
Information is a valuable resource for project managers. Information costs money and needs to be
acquired, secured, retrieved, stored, maintained and managed. Despite the fact that we know this,
project managers often fail to deliver the types of information needed to ensure project success.
Consequently, this chapter discusses the reasons why a system for collecting, formatting,
monitoring, evaluation and distributing information is needed for the organization and each
project to address critical project information needs (Sifri 2002).
3.1 Project Success
According to Baccarini, project success consists of two separate components, namely project
management success and project product success (Baccarini 1999). He distinguishes between
them as follows:
Project management success focuses on the project management process and in
particular on the successful accomplishment of the project with regards to cost, time and
quality. These three dimensions indicate the degree of the ‘efficiency of project execution’
(Pinkerton 2003).
Project product success focuses on the effects of the project’s end-product. Even though
project product success is distinguishable from project management success, the
successful outcomes both of them are inseparably linked. ‘If the venture is not a success,
neither is the project’ (Pinkerton 2003).
According to Baccarini, project success can be summarized as:
Project success = Project Management Success + Project Product Success
Furthermore, Danie van der Westhuizen and Edmond P Fitzgerald investigated the related
concepts of software project success, software project management success and software project
product success and proposed a set of dimensions for defining and measuring software project
success (van der Westhuizen, Fitzgerald 2004). An extension of the DeLone and Mclean model is
proposed as a base model for software project success (DeLone, McLean 2003).
The Need for a PMIS Page 8
University of Stellenbosch Department of Industrial Engineering
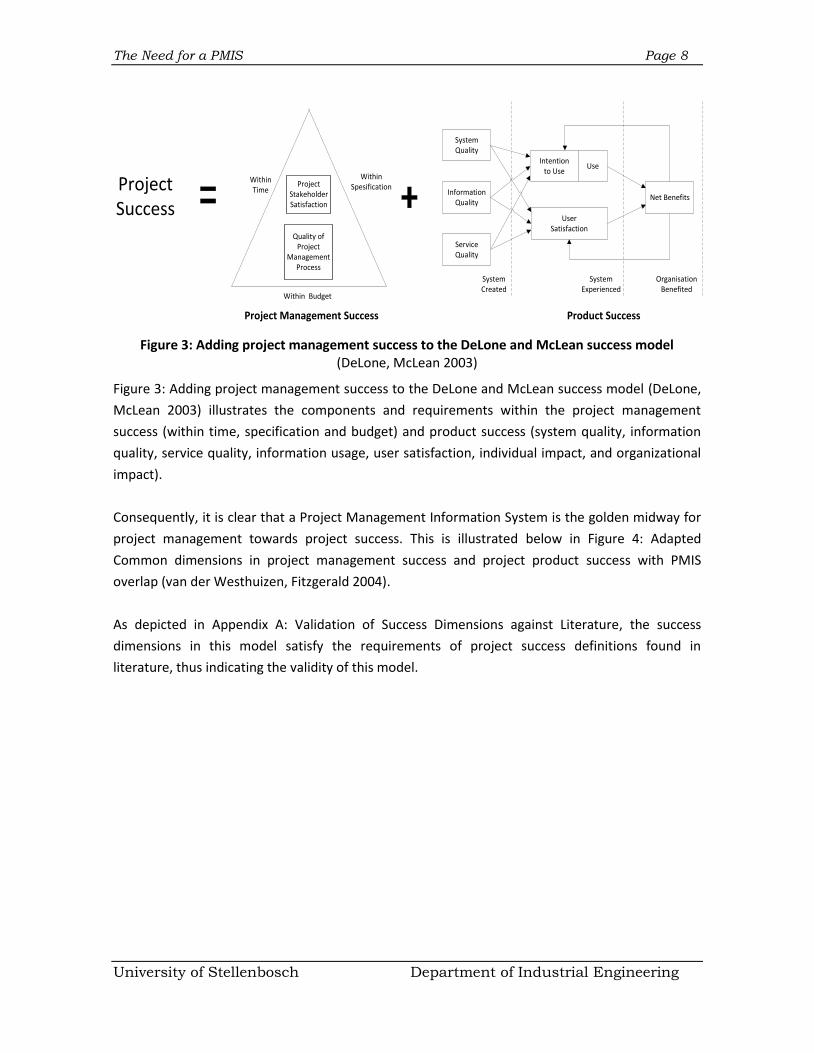
Figure 3: Adding project management success to the DeLone and McLean success model (DeLone, McLean 2003)
Figure 3: Adding project management success to the DeLone and McLean success model (DeLone,
McLean 2003) illustrates the components and requirements within the project management
success (within time, specification and budget) and product success (system quality, information
quality, service quality, information usage, user satisfaction, individual impact, and organizational
impact).
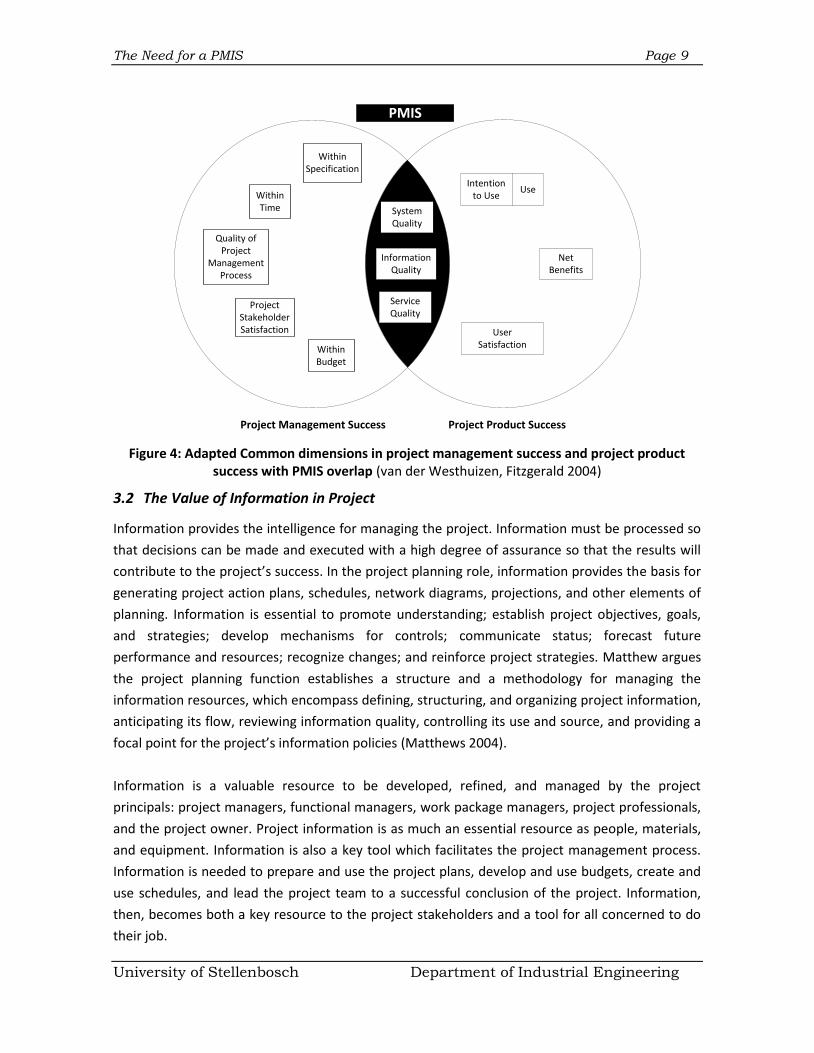
Consequently, it is clear that a Project Management Information System is the golden midway for
project management towards project success. This is illustrated below in Figure 4: Adapted
Common dimensions in project management success and project product success with PMIS
overlap (van der Westhuizen, Fitzgerald 2004).
As depicted in Appendix A: Validation of Success Dimensions against Literature, the success
dimensions in this model satisfy the requirements of project success definitions found in
literature, thus indicating the validity of this model.
SystemQuality
Information Quality
ServiceQuality
Intention to Use
Use
Net Benefits
UserSatisfaction
System Created
System Experienced
Organisation Benefited
Within Time
Within Spesification
Within Budget
ProjectStakeholderSatisfaction
Quality ofProject
ManagementProcess
Project Success
Project Management Success Product Success
The Need for a PMIS Page 9
University of Stellenbosch Department of Industrial Engineering
Figure 4: Adapted Common dimensions in project management success and project product success with PMIS overlap (van der Westhuizen, Fitzgerald 2004)
3.2 The Value of Information in Project
Information provides the intelligence for managing the project. Information must be processed so
that decisions can be made and executed with a high degree of assurance so that the results will
contribute to the project’s success. In the project planning role, information provides the basis for
generating project action plans, schedules, network diagrams, projections, and other elements of
planning. Information is essential to promote understanding; establish project objectives, goals,
and strategies; develop mechanisms for controls; communicate status; forecast future
performance and resources; recognize changes; and reinforce project strategies. Matthew argues
the project planning function establishes a structure and a methodology for managing the
information resources, which encompass defining, structuring, and organizing project information,
anticipating its flow, reviewing information quality, controlling its use and source, and providing a
focal point for the project’s information policies (Matthews 2004).
Information is a valuable resource to be developed, refined, and managed by the project
principals: project managers, functional managers, work package managers, project professionals,
and the project owner. Project information is as much an essential resource as people, materials,
and equipment. Information is also a key tool which facilitates the project management process.
Information is needed to prepare and use the project plans, develop and use budgets, create and
use schedules, and lead the project team to a successful conclusion of the project. Information,
then, becomes both a key resource to the project stakeholders and a tool for all concerned to do
their job.
SystemQuality
Information Quality
Intention to Use
Use
Net Benefits
UserSatisfaction
Within Time
Within Specification
Within Budget
ProjectStakeholderSatisfaction
Quality ofProject
ManagementProcess
ServiceQuality
PMIS
Project Management Success Project Product Success
The Need for a PMIS Page 10
University of Stellenbosch Department of Industrial Engineering
3.2.1 Technical Data Management and Documentation
A complex project generates a large amount of technical information. These data can be
overwhelming and come in many forms such as text, graphics, large-scale drawings,
correspondence, requirements and specifications, and others. If these data are not organized and
managed, the project team will soon be lost in mounds of paper and information that are not
readily retrievable (Eisner 2002).
3.2.2 The Quantity and Quality of the Information in a Project
Tuman agrees that analysed information provides the project team with the knowledge of where
it has been in preceding periods, where it is today, and the direction the project is heading in. The
proper amount of project information will support these goals, whereas too little information will
not give the clear picture. To overcome the shortage of information, managers can create
organizations within the corporate organization that leads to duplication and waste of time,
money, and effort. Too much information has the tendency to overload the project team with
information that must be filtered to properly view the past, present, and future situations. Senior
managers also need the proper amount of pertinent information with which to make sound
decisions on the project’s future (Tuman 1988). Therefore the quality of the project relates to the
quantity and quality of the information.
3.2.3 Integration and Synchronization of the Project Systems
Tuman argues that information is needed to design, produce, market, and provide after-sales
support to the products and services that are offered to customers. In large organizations the flow
of information can be incomplete and sequential. Traditionally, engineers and project managers
do not communicate the project status adequately with upper managements and functional
departments. They believe that projects are their responsibility and they have the authority to
deliver them. Furthermore, functional departments are often reluctant or do not have time to
provide information to project engineers (Tuman 1988).
Consequently this causes that information does not arrive at the people who need the information
for their work in time to make the best decisions. Information may be found “lying” around in
organizations waiting for someone who has the authority to make a decision. Cleland agrees that
the best information loses its value if it is not available to people who need it to make decisions
and direct actions (Cleland 2004b). These circumstances often lead to late, over budget, and low
quality projects. Subsequently, information enables integration and synchronization of the project
systems.
The Need for a PMIS Page 11
University of Stellenbosch Department of Industrial Engineering
3.2.4 Stakeholders Need Information on the Project
In addition to the immediate participants to a project, there is a need to consider all stakeholders.
A project manager might characterize the PMIS as being able to provide information that he or she
needs to do the job and information that the bosses need. Typically, stakeholders have various
information needs that can often be satisfied through the information stored in the PMIS.
Appendix B: Stakeholder Information Needs provides some of the stakeholders’ information needs
on a routine basis. Those individuals with real or perceived information needs about the project
soon become disenchanted when inadequate or inaccurate information is provided. No
stakeholder likes surprises that reflect a change to the project plan or anticipated progress.
Surprises quickly erode confidence in the project manager’s capability to manage the work and
keep key stakeholders fully informed on progress (Cleland 2004a).
3.2.5 Information is a Prerequisite for Collaboration
Collaboration requires a common understanding of purpose and the relevant fundamentals like
budget, schedules and scope. Providing the same information to everyone involved, brings
cohesion to the team. Information’s real value is when it is used effectively in the management of
the project. Information does not automatically lead to effective management of project but lack
of information can contribute to project failure. Information may be in varying degrees of
completeness when the PMIS is not properly populated; both on a timely basis and an accuracy
basis. Partial information can be misleading and inaccurate information can lead to the wrong
decision (Cleland 2004a).
3.3 Affordable and Most Reliable means to Document and Communicate Information
A PMIS reduces the costs of data collection. The data that is collected is usually repeated by
several organizations. With a PMIS, the collection job is shared by the project manager, the
corporate managers, etc., and then shared by all.
Without a standardized PMIS, the same data will be recorded multiple times by multiple people in
multiple cabinets and computers. Thomsen agrees that this leads to inefficient and costly
collection of data that is inconsistent and unreliable (Thomsen 2011). With the aid of a PMIS, only
one on-line filing cabinet is presented. Responsibility for data entry is assigned to the appropriate
people and those who need and use that information may access it, review it or download it. The
PMIS presents a very efficient approach that helps save money because the project
documentation process is clearly defined and there is less duplication of effort in implementation.
The Need for a PMIS Page 12
University of Stellenbosch Department of Industrial Engineering
3.4 Armour for Defence against Political or Legal Attack
Projects can experience conflicts from stakeholders. For example, a lawyer may be searching for
evidence to support a claim, a user can be mad or upset with the director of facilities or the media
could want information for a story. An abundance of uncontrolled and conflicting documentation
provides a target-rich environment for those searching for evidence to support a biases point of
view (Thomsen 2011).
Gido advises that hard project facts are the arsenal of defence. Defined project goals that are
consistently maintained with current data, provides owners and the facilities team with good and
enough ammunition for support. In the case of a legal challenge, a PMIS provides the owner with
centralized electronic documents that also results in lower discovery costs and reduces the time
required for executives to assemble exhibits (Clements, Gido 2006).
3.5 A Window into the Project
According to Thomsen, it is difficult to understand progress toward a goal, to know what caused
problems and what contributed to success. A PMIS informs leaders about current progress so they
can operate the levers of control. A PMIS is a management tool for control and collaboration.
Control systems require feedback to measure progress so adjustments can be made to stay on
track (Thomsen 2011).
Before computers existed, managers had to work with human layers of reporting. A layered
reporting structure has common flaws: reports may be slow, idiosyncratic, filtered, inconsistent or
biased. When a program-wide roll-up report is needed, the data needs to be reviewed for
consistency at each layer and then consolidated and perplexing formats for each new report is
invented.
3.5.1 Centralized, Web-Accessible Management of Information
A PMIS makes layers of management more transparent. Managers can open their laptop and view
the reports desired. According to Thomsen, the PMIS increases the velocity of information flow. As
information passes through layers in the organization, it gets distorted (Thomsen 2011). The one-
step process of storing information in a central database reduces the chance for it to be corrupted.
3.5.2 Standard Formats and Definitions
Individually designed reports on design and construction projects can create inefficiency and
misunderstanding. A spreadsheet will have cryptic column headings understood only by the
originator. Thomsen advises to use a PMIS which standardizes formats and definitions that
everyone learns to understand at a glance which increases understanding and simultaneously
saves time (Thomsen 2011).
The Need for a PMIS Page 13
University of Stellenbosch Department of Industrial Engineering
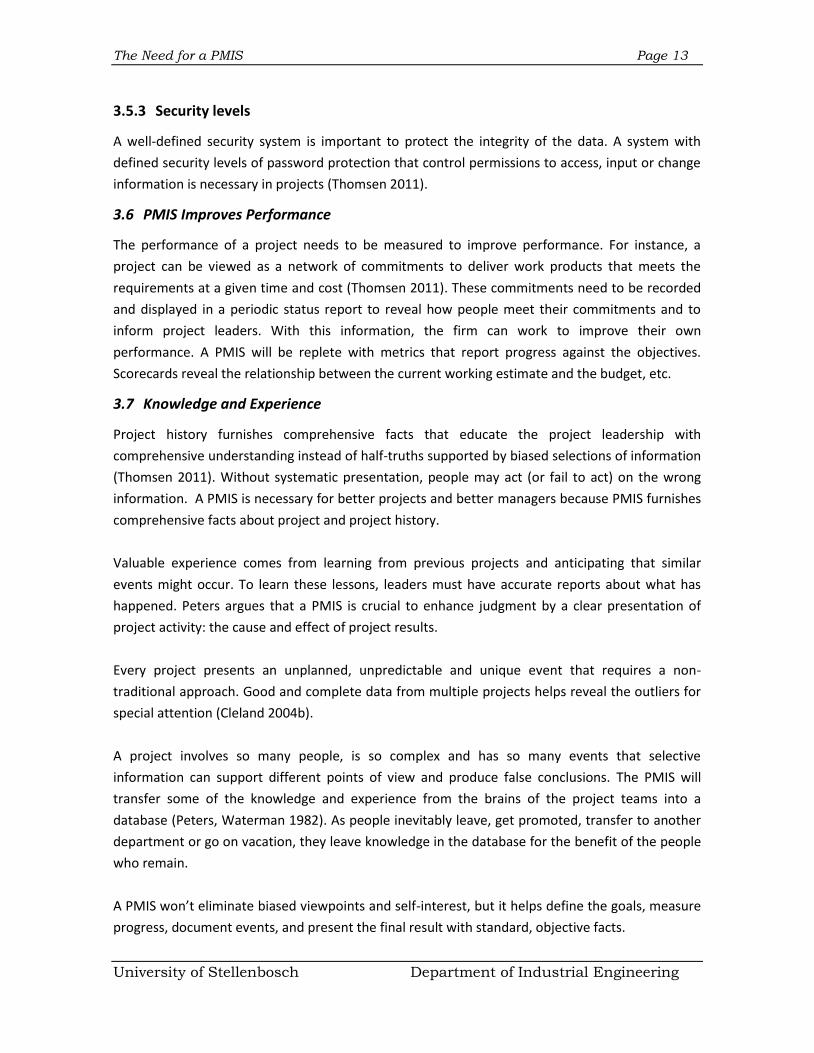
3.5.3 Security levels
A well-defined security system is important to protect the integrity of the data. A system with
defined security levels of password protection that control permissions to access, input or change
information is necessary in projects (Thomsen 2011).
3.6 PMIS Improves Performance
The performance of a project needs to be measured to improve performance. For instance, a
project can be viewed as a network of commitments to deliver work products that meets the
requirements at a given time and cost (Thomsen 2011). These commitments need to be recorded
and displayed in a periodic status report to reveal how people meet their commitments and to
inform project leaders. With this information, the firm can work to improve their own
performance. A PMIS will be replete with metrics that report progress against the objectives.
Scorecards reveal the relationship between the current working estimate and the budget, etc.
3.7 Knowledge and Experience
Project history furnishes comprehensive facts that educate the project leadership with
comprehensive understanding instead of half-truths supported by biased selections of information
(Thomsen 2011). Without systematic presentation, people may act (or fail to act) on the wrong
information. A PMIS is necessary for better projects and better managers because PMIS furnishes
comprehensive facts about project and project history.
Valuable experience comes from learning from previous projects and anticipating that similar
events might occur. To learn these lessons, leaders must have accurate reports about what has
happened. Peters argues that a PMIS is crucial to enhance judgment by a clear presentation of
project activity: the cause and effect of project results.
Every project presents an unplanned, unpredictable and unique event that requires a non-
traditional approach. Good and complete data from multiple projects helps reveal the outliers for
special attention (Cleland 2004b).
A project involves so many people, is so complex and has so many events that selective
information can support different points of view and produce false conclusions. The PMIS will
transfer some of the knowledge and experience from the brains of the project teams into a
database (Peters, Waterman 1982). As people inevitably leave, get promoted, transfer to another
department or go on vacation, they leave knowledge in the database for the benefit of the people
who remain.
A PMIS won’t eliminate biased viewpoints and self-interest, but it helps define the goals, measure
progress, document events, and present the final result with standard, objective facts.
The Need for a PMIS Page 14
University of Stellenbosch Department of Industrial Engineering
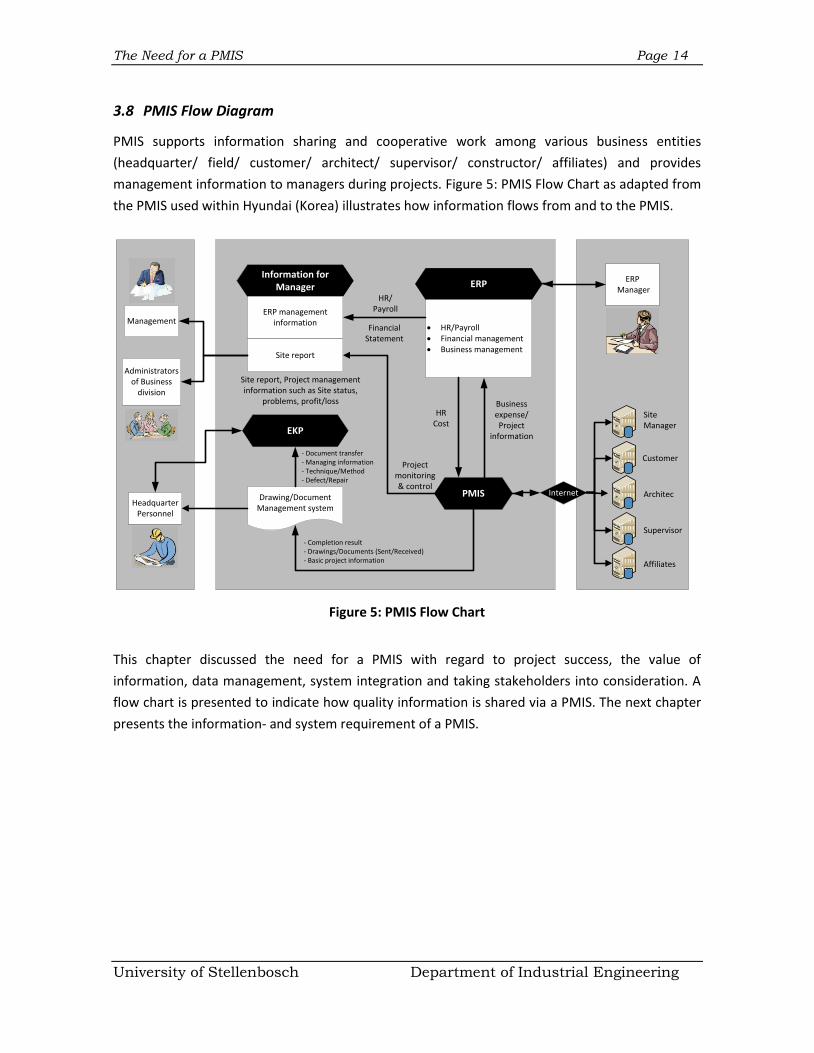
3.8 PMIS Flow Diagram
PMIS supports information sharing and cooperative work among various business entities
(headquarter/ field/ customer/ architect/ supervisor/ constructor/ affiliates) and provides
management information to managers during projects. Figure 5: PMIS Flow Chart as adapted from
the PMIS used within Hyundai (Korea) illustrates how information flows from and to the PMIS.
Figure 5: PMIS Flow Chart
This chapter discussed the need for a PMIS with regard to project success, the value of
information, data management, system integration and taking stakeholders into consideration. A
flow chart is presented to indicate how quality information is shared via a PMIS. The next chapter
presents the information- and system requirement of a PMIS.
Management
Administratorsof Business
division
HeadquarterPersonnel
Information for Manager ERP
EKP
PMIS
ERP Manager
ERP managementinformation
Site report
HR/Payroll Financial management Business management
Drawing/DocumentManagement system
Site Manager
Customer
Architec
Supervisor
Affiliates
- Completion result - Drawings/Documents (Sent/Received) - Basic project information
- Document transfer - Managing information - Technique/Method - Defect/Repair
HR Cost
Business expense/Project
information
Project monitoring& control
Site report, Project managementinformation such as Site status,
problems, profit/loss
HR/Payroll
FinancialStatement
Internet
Requirements Analysis of a PMIS Page 15
University of Stellenbosch Department of Industrial Engineering
4. Requirement Analysis of a PMIS
The previous chapter discussed the need for a PMIS. This chapter presents the information and system
requirement of a PMIS together with the proposed characteristics of an effective PMIS.
Requirements analysis is the process of analysing the information needs of the end users, the
organizational environment, and any system presently being used, developing the functional
requirements of a system that can meet the needs of the users. The requirements documentation
should be referred to throughout the rest of the system development process to ensure the
developing project aligns with user needs and requirements.
4.1 Research Methodology of Requirement Analysis of a PMIS
Literature is evaluated to indicate the validity the of the various information- and system
requirements of a PMIS and is depicted in Appendix C: Validating the Information- and System
Requirements against Literature.
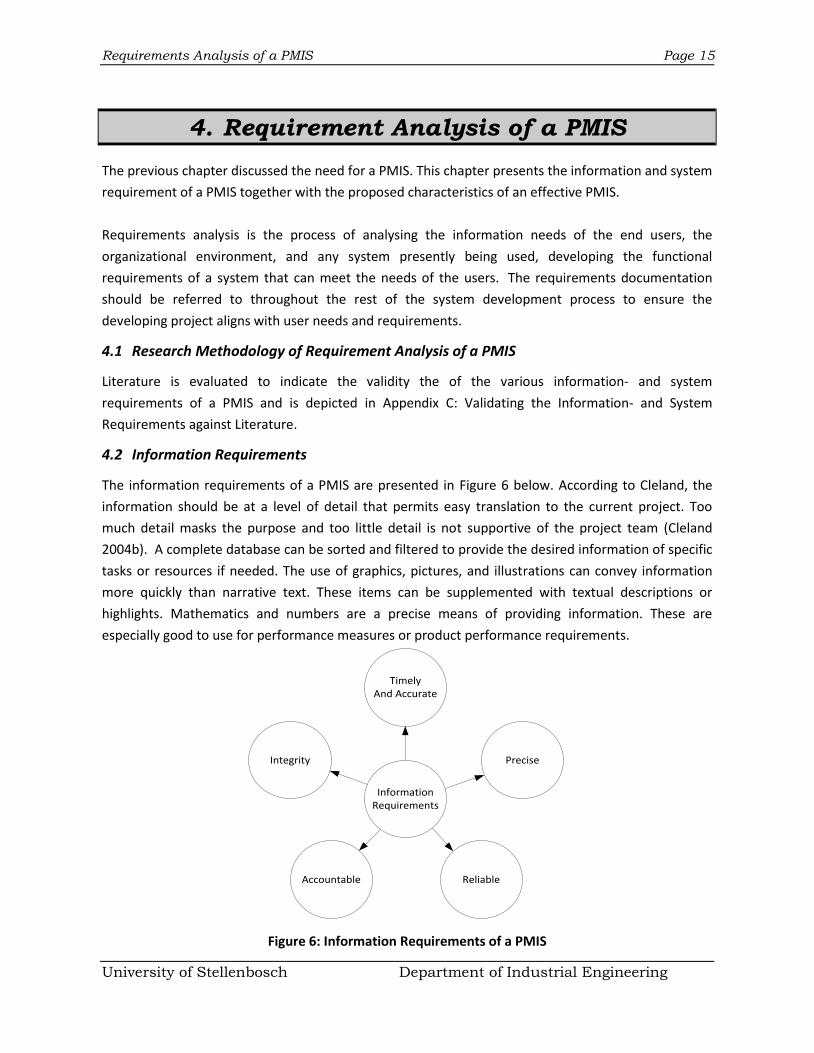
4.2 Information Requirements
The information requirements of a PMIS are presented in Figure 6 below. According to Cleland, the
information should be at a level of detail that permits easy translation to the current project. Too
much detail masks the purpose and too little detail is not supportive of the project team (Cleland
2004b). A complete database can be sorted and filtered to provide the desired information of specific
tasks or resources if needed. The use of graphics, pictures, and illustrations can convey information
more quickly than narrative text. These items can be supplemented with textual descriptions or
highlights. Mathematics and numbers are a precise means of providing information. These are
especially good to use for performance measures or product performance requirements.
Figure 6: Information Requirements of a PMIS
InformationRequirements
TimelyAnd Accurate
Precise
Reliable
Integrity
Accountable
Requirements Analysis of a PMIS Page 16
University of Stellenbosch Department of Industrial Engineering
4.2.1 Timely and Accurate
Information in the PMIS should be timely and accurate and represent the situation. Erroneous
information can lead to wrong decisions and failed projects. Accurate information provides the best
chance for managing by fact (Cleland 2004b). Furthermore, a project is responsible to meet the needs
of management, donors and other projects stakeholders who need the right information at the right
time.
4.2.2 Precise
Information can be perishable. Managing a project requires planning, organizing, and controlling of
resources on a moving target as the project evolves through its life cycle. Information on a project at a
particular point in that life cycle can change quickly as new project problems and opportunities
emerge. Aged information will provide a distorted picture for the decision maker as well as give undue
confidence in the decision. Only current and precise information gives the best picture of the situation
and allows decisions based on facts (Cleland 2004a).
The precision of the information needs to be only to the level of granularity dictated by the project
decisions. For example, there is typically no need to estimate project labour-hours to less than an
hour. It is a special case where labour estimates are to the nearest minute or nearest 10 minutes
(Eisner 2002).
4.2.3 Reliable
The information must be derived from a source that gives confidence that it is real and representative
of the situation. Information from an unknown source or stated in terms that permit more than one
interpretation should be labelled “questionable.” Information with a detail structure adds to the
project’s value as well as that of the parent organization. Analysed and structured project
management data become information that is summarized for ease of reading and understanding.
This analysed information is disseminated up to senior managers of the organization and used within
the project for measuring results. Reliable information has an audit trail from its source through the
analysis process to the dissemination points (Gilbreath 1986).
4.2.4 Accountable
A project is responsible for safeguarding and controlling the information entrusted to its care and is
answerable to proper authority for the loss or misuse of that information. The project has to inform
donors and project stakeholders of the manner in which project information is used and the
information provided should be traceable back to the original data collected (Caldwell 2004).
Requirements Analysis of a PMIS Page 17
University of Stellenbosch Department of Industrial Engineering
4.2.5 Integrity
The primary purpose for the collection and use of project information is to benefit beneficiaries by
improving the project interventions. Integrity provides verification that the original contents of
information have not been altered or corrupted and that managers can be confident on the quality of
the information to make decisions on the project. A project will make reasonable effort to ensure that
all information is accurate and up-to-date and that procedures are in place to dispose of records once
they are of no further use (Caldwell 2004).
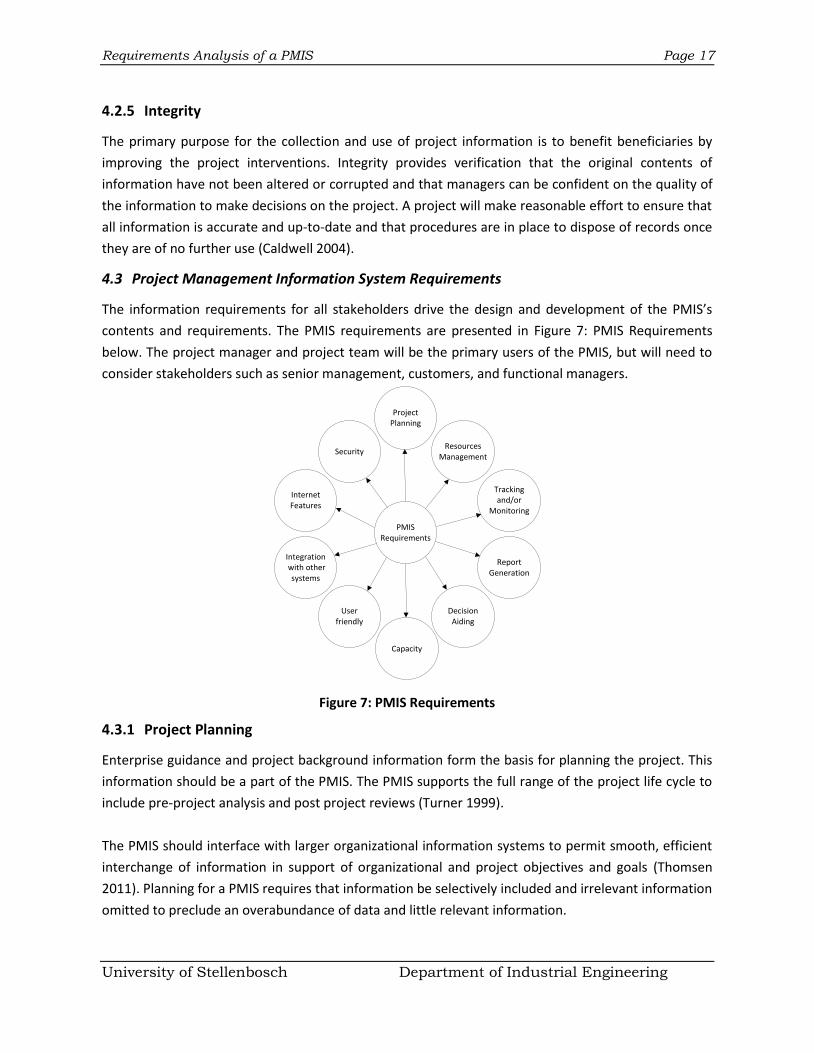
4.3 Project Management Information System Requirements
The information requirements for all stakeholders drive the design and development of the PMIS’s
contents and requirements. The PMIS requirements are presented in Figure 7: PMIS Requirements
below. The project manager and project team will be the primary users of the PMIS, but will need to
consider stakeholders such as senior management, customers, and functional managers.
Figure 7: PMIS Requirements
4.3.1 Project Planning
Enterprise guidance and project background information form the basis for planning the project. This
information should be a part of the PMIS. The PMIS supports the full range of the project life cycle to
include pre-project analysis and post project reviews (Turner 1999).
The PMIS should interface with larger organizational information systems to permit smooth, efficient
interchange of information in support of organizational and project objectives and goals (Thomsen
2011). Planning for a PMIS requires that information be selectively included and irrelevant information
omitted to preclude an overabundance of data and little relevant information.
PMISRequirements
Project Planning
Resources Management
Decision Aiding
User friendly
Integration with other
systems
Internet Features
Security
Capacity
Report Generation
Tracking and/or
Monitoring
Requirements Analysis of a PMIS Page 18
University of Stellenbosch Department of Industrial Engineering
4.3.2 Resources Management
Information is needed to manage the project, which is to plan, organize, evaluate, and control the use
of resources on the project. The PMIS should be able to apply algorithms such as resources levelling
and smoothing to manage the project. The PMIS should be able to check for and help resolve over
allocation of resources (Clements, Gido 2006).
4.3.3 Tracking and/or Monitoring
An important purpose served by a PMIS is that it can track at the work package level for early
identification of schedule slippage or significant cost overruns on detailed work areas. Early
identification of small problems permits the attention to detail before there are major impacts on
higher-order work. This is especially important on large projects or projects that have a very rigorous
schedule to meet the enterprise’s or customer’s goals. The PMIS should be prospective and capable of
providing intelligence on both the current and probable future progress and status of the project
(Thomsen 2011).
Information provides the basis for continuation of the project in the absence of the project manager.
The project team can monitor the progress of the project and compare it to the project plan to assure
that work is progressing satisfactorily. An effective PMIS provides the information that demonstrates
when the project is on track or when it has exceeded the allowable limits of performance.
A PMIS should be able to track the progress of:
1. Tasks,
2. Durations,
3. Costs, committed or spend, and
4. Resources
4.3.4 Report Generation
Information to manage a project comes from a wide variety of sources, including formal reports,
informal sources, observation, project review meetings, and questioning which is aided by formal
evaluation and analysis as to what the information says about the status of the project (Thomsen
2011).
Reporting capabilities are given a high priority, because the ability to produce extensive and power
reports is a feature that most users and stakeholders rate very highly (Clements, Gido 2006). The PMIS
should be able to provide reports on the following:
1. The project’s status and progress.
2. Planning
3. Scheduling
4. Individual tasks
5. Resources
Requirements Analysis of a PMIS Page 19
University of Stellenbosch Department of Industrial Engineering
6. Actual costs
7. Committed costs
4.3.5 Decision Aiding
The quality of management decisions in the project is related to the accuracy, currency, and reliability
of the information on the project. According to Cleland, information establishes the basis for all
project decisions and commitment of resources (Cleland 2004b). The PMIS is the repository of much
of this information and reflects the user’s needs for making and executing decisions in the managing
of project resources.
PERT analysis allows the user to see the effects of various scenarios in a project to aid project
managers in their decision making process. Clements states that conducting a PERT analysis without
the PMIS software is extremely time-consuming. The PMIS helps the project manager to prepare and
plan for certain contingencies and to assess consequences (Clements, Gido 2006).
4.3.6 Capacity
Gido argues that a PMIS should be able to handle the number of tasks expect to be performed, the
number of resources possibly needed, and the number expected projects to be managed
simultaneously (Clements, Gido 2006).
4.3.7 User Friendly
The system should have a good and user friendly “look” and “feel” considering the menu structure,
available short-cut keys, colour displays, the amount of information in each display, the ease with
which data can be modified, the ease with which reports can be generated, the quality of the
printouts that are produced, the consistency among the screens, and the amount of learning required
to become proficient with the system (Liberatore, Pollack-Johnson 2004).
4.3.8 Integration with other Systems
The PMIS should provide integration with distributed databases, spread sheets, and even object-
orientated databases. Furthermore, the system should be able to import and export information to
and from word processing and graphics packages (Clements, Gido 2006). The system should also do
this through e-mail.
4.3.9 Internet Features
Depending on the type of project undertaken, it might be necessary and important that the project
team communicate via e-mail regarding numerous tasks. In addition, the PMIS should allow project
information to be posted directly to the Web (Tuman 1988).
Requirements Analysis of a PMIS Page 20
University of Stellenbosch Department of Industrial Engineering
4.3.10 Security
A project must ensure that information is not disclosed to unauthorized persons, processes, or
agencies. The PMIS is responsible for the protection of sensitive information from unauthorized
disclosure to third parties. Information should be seen as private and not for distribution beyond
specifically identified individuals or organizations as defined by the project stakeholders. Personal
beneficiary information must be treated with respect and only used within the objectives of the
project (Caldwell 2004).
4.4 Summary of the Characteristics of a PMIS
Each PMIS is tailored to project situations to meet specific requirements for managing the project
(Cleland 2004b). General characteristics that should be in a PMIS include the following:
1. Must be adaptable to differing customer requirements.
2. Must be consistent with organizational and project policies, procedures, and guidelines.
3. Should minimize the chances that managers will be surprised by project developments.
4. Should provide essential information on the cost-time-performance parameters of a project and
on the interrelationships of these parameters, as well as the strategic fit of the project.
5. Should provide information in standardized form to enhance its usefulness to all managers.
6. Must be decision oriented, in that information reported should be focused towards the decisions
required of the managers.
7. Must be exception oriented, in that it focuses the manager’s attention on those critical areas
requiring attention rather than simply reporting on all areas and requiring the managers to devote
attention to each.
8. Must be a collaborative effort between users and analysts. The PMIS should be executed by a
multidisciplinary team that views the design, development, and implementation of the
information system as a project itself, amenable to project management approaches.
This chapter presents the information- and system requirement of a PMIS. The next chapter presents
the functional design of a PMIS.
Functional Design of a PMIS Page 21
University of Stellenbosch Department of Industrial Engineering
5. Functional Design of a PMIS
The previous chapter presents the information- and system requirement of a PMIS together
with the proposed characteristics of an effective PMIS. This chapter discusses the functional
design of a PMIS by presenting the desired features of a PMIS. A concept model together with
an information architecture procedure is presented together with the different levels of
technology of a PMIS.
The design of the PMIS must be sound, and it must at least satisfy all the requirements for the
system as set forth by the user or customer. By following a systematic and repeatable “systems”
process of developing goals into more specific functions and operations of the system, the
developer maximizes the chances that this will be the case.
In this chapter, specific desirable features and functions are discussed to ensure that the system
is designed in such a way to meet all the system and information requirements discussed in the
previous chapter (4.2 Information Requirements and 4.3 Project Management Information
System Requirements )
5.1 Desirable Features and Functions of a PMIS
5.1.1 Budgeting and Cost Control Features
In every project it is necessary to associate cost information with each activity and each resource
in a project. An individual’s pay can be defined in hourly rates, overtime rates, or one-time only
rates. Dates when payments are due can also be specified (Clements, Gido 2006). On-time-only
or on-going costs for materials can be defined, and accounting and budgeting codes can be set
up that are associated with each type of material. In addition, user-defined formulas can be
developed to manage cost functions.
This information is used to calculate projected costs of the project and track actual costs during
the project. At any time during the project, actual costs can be compared with budgeted costs
for individual resources, for groups of resources, or for the entire project. Cleland agrees that
this information can be used not only for planning purposes but also for reporting purposes. The
PMIS allows the user to display and print the costs for each task, for each resource (person,
machine, etc.), or for the entire project, at any time during the project (Cleland 2004b).
5.1.2 Calendars
Base calendars can be used to define working days and hours for each individual resource or
group of resources on a project. These calendars are used in calculating the schedule for the
project. The system provides a default for the standard working period such as Monday through
Friday from 8.00 a.m. to 17.00 p.m., with an hour for lunch. These calendars can be modified for
Functional Design of a PMIS Page 22
University of Stellenbosch Department of Industrial Engineering
each individual resource or group of resources (Clements, Gido 2006). For example, work hours
can be modified, company hours can be modified, company holidays can be entered as
nonworking days, various shifts (daytime, night-time) can be entered, and vacation days can
included, as well as variable scales (hour, day, week).
The calendars can be used for reporting purposes and can be printed by day, week, or month for
each individual resource or in the form of a full, possibly wall-size, and complete project plan in
calendar form.
5.1.3 Internet Capabilities
Project information can be directly posted to a web site to facilitate communication with team
members and customers. In addition, project information can be shared through e-mail instead
of to the screen or printer. Project team members can be notified of important changes through
email such as updated project plans or schedules. Team members can be informed about the
current project status, can be sent various charts, and can even be notified of upcoming
deadlines, all through e-mail (Liberatore, Pollack-Johnson 2004).
5.1.4 Graphics
A PMIS has the ability to generate easily and quickly a variety of charts, including Gantt charts
and network diagrams, based on current data. Once the baseline plan has been created, any
modifications to the plan can easily be entered into the system, and the charts will automatically
reflect those changes. A PMIS allows tasks in Gantt charts to be linked together so that the
precedence activities can be shown. The user is allowed to jump back and forth between the
Gantt chart and network diagrams displays with a single command. According to Liberatore
(Liberatore, Pollack-Johnson 2004), graphic and charting capabilities allow the user to:
1. Perform interactive manipulations of tasks and relationships, such as changing activity
durations by stretching out the activity duration display or changing precedence
relationships by graphically linking tasks together.
2. Customization of the displayed format, such as headings, column sizes, colours, fonts,
and placements of text.
3. Show baseline-versus-actual charts for tasks or costs.
4. Highlight the critical path and show the slack of each activity.
5. Reduce or magnify (zoom in and zoom out) displays.
5.1.5 Importing/Exporting Data
A PMIS allow the user to import from other applications, such as word processing, spread sheet,
and database applications. For example, instead of retyping cost related information on
resources (people or machines) from a spread sheet into the system, the user can simply import
that spread sheet information as desired. Similarly, it is possible to export information from the
system to those applications (Clements, Gido 2006). For example, a schedule report for a
Functional Design of a PMIS Page 23
University of Stellenbosch Department of Industrial Engineering
specific contractor can be exported to a word processing memo. The PMIS should allow the
transfer of information in standard ASCII text, from the MS Windows Clipboard, and to SQL
databases, Lotus, MS Excel, MS Project Exchange, etc.
Importing and exporting information avoids possible entering conflicting and erroneous data.
This feature satisfies the requirements discussed in 4.2 and 4.3
5.1.6 Handling of Multiple Projects and Subprojects
A PMIS can store multiple projects in separate files with connecting links between the files,
store multiple projects in the same file. Furthermore, it can handle several projects at the same
time, and create Gantt charts and network diagrams for multiple projects (Clements, Gido
2006).
5.1.7 Report Generation
A PMIS has extensive reporting capabilities. Among the reports a PMIS can generate are the
following:
1. Reports on the project as a whole.
2. Reports on the milestones of the project.
3. Reports that provide a variety of information with respect to a date range, such as tasks
that have been completed within that range, tasks that are in progress, and tasks that
will start within that range (Clements, Gido 2006).
4. Financial reports including budgets for all tasks as well as the entire project, tasks and
resources that are over budget, cumulative budgeted costs, actual costs, and committed
costs.
5. Resources allocation reports for each resource or group of resources involved in a
project.
6. Customizable standard reports, cross-tabs, and baseline-to-actual variance reports.
The PMIS should provide page setup settings that allow the user to choose a page size and a
page preview before printing reports.
5.1.8 Resource Management
A PMIS can maintain a resource list consisting of resource names, the maximum amount of time
available, standard and overtime rates for resources are available, accrual methods, and textual
descriptions of the resources. A unique code can be assigned to each resource, as well as an
individual personalized calendar. Constraints can be assigned to each resource, such as the
amount of time they are available for work (Liberatore, Pollack-Johnson 2004). The user of the
system can also keep memos and notes on each resource, assign resources to a percentage of a
task, set priority levels for resource assignments, assign more than one resource to the same
task. The system will highlight and help correct over allocation and perform resource levelling
and resource smoothing (Clements, Gido 2006).
Functional Design of a PMIS Page 24
University of Stellenbosch Department of Industrial Engineering
5.1.9 Planning
The PMIS allows the user to define the activities that need to be performed. The system allows
an activity or task list to be maintained. For each task, the user can provide a title, a start date, a
finish date, comments, and estimated durations (including optimistic, most likely and pessimistic
estimates in various time scales). The PMIS can also specify any precedential relationships with
other tasks as well as the person(s) responsible. In addition, the system allows the user to create
a work breakdown structure (WBS) to aid in the planning process (Clements, Gido 2006).
5.1.10 Project Monitoring and Tracking
Tracking progress, actual costs, and actual resources used is one of the fundamental
components of the PMIS. The user is allowed to define a baseline plan and compare actual
progress and costs with those in the baseline plan (Clements, Gido 2006). The PMIS can track
tasks in progress, completed tasks, associated costs, time expected, start and finish dates, actual
costs committed or spend and resources used, as well as remaining duration, resources, and
expenses. There are numerous report formats associated with these monitoring and tracking
features. (See 4.3.3)
5.1.11 Scheduling
A PMIS builds Gantt charts and network diagrams based on the task and resource list and all of
their associated information. Any modifications to these lists will automatically be reflected in
the schedules. In addition, users can schedule recurring tasks, set priorities for scheduled tasks,
perform reverse scheduling (from the end date backward to the beginning), define work shifts,
schedule tasks to start as late as possible or as soon as possible, and specify a must-start-by or
must-finish-by date or a no-earlier-than or no-later-than date (Clements, Gido 2006).
5.1.12 Security
A PMIS provides password access to individual project files, and password access to specific
data. Some people have access to information on their project only, others have input and read-
only privileges, others may modify documents, etc. (Clements, Gido 2006).
5.1.13 Sorting and Filtering
Sorting allows the user to view information in a desired order, such as pay rates from highest to
lowest, resource names in alphabetic order, or task names in alphabetic order. A PMIS allow
multiple levels of sorting (for example, by last name and then by first name). Filtering enables
the user to select only certain data that meet some specified criteria (Clements, Gido 2006). For
example, if the user wants information on just the tasks that require a certain resource, a simple
request tells the software to ignore tasks that don’t use that resource and display only tasks that
do use that resource.
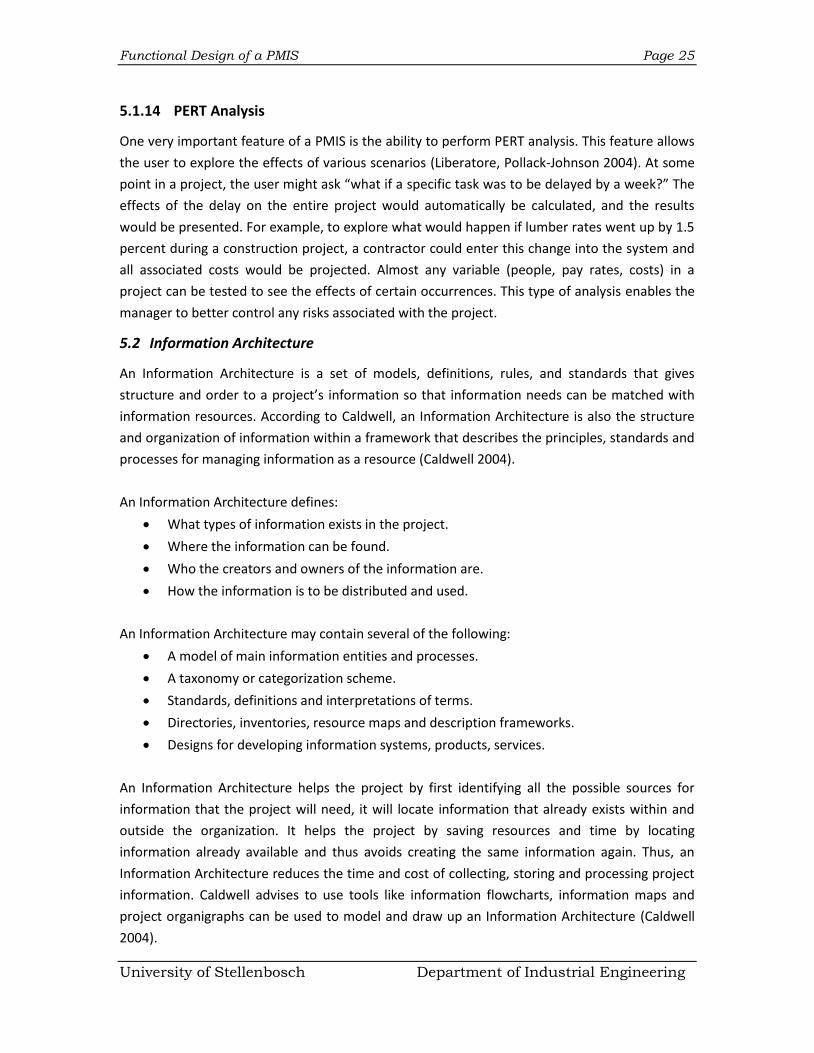
Functional Design of a PMIS Page 25
University of Stellenbosch Department of Industrial Engineering
5.1.14 PERT Analysis
One very important feature of a PMIS is the ability to perform PERT analysis. This feature allows
the user to explore the effects of various scenarios (Liberatore, Pollack-Johnson 2004). At some
point in a project, the user might ask “what if a specific task was to be delayed by a week?” The
effects of the delay on the entire project would automatically be calculated, and the results
would be presented. For example, to explore what would happen if lumber rates went up by 1.5
percent during a construction project, a contractor could enter this change into the system and
all associated costs would be projected. Almost any variable (people, pay rates, costs) in a
project can be tested to see the effects of certain occurrences. This type of analysis enables the
manager to better control any risks associated with the project.
5.2 Information Architecture
An Information Architecture is a set of models, definitions, rules, and standards that gives
structure and order to a project’s information so that information needs can be matched with
information resources. According to Caldwell, an Information Architecture is also the structure
and organization of information within a framework that describes the principles, standards and
processes for managing information as a resource (Caldwell 2004).
An Information Architecture defines:
What types of information exists in the project.
Where the information can be found.
Who the creators and owners of the information are.
How the information is to be distributed and used.
An Information Architecture may contain several of the following:
A model of main information entities and processes.
A taxonomy or categorization scheme.
Standards, definitions and interpretations of terms.
Directories, inventories, resource maps and description frameworks.
Designs for developing information systems, products, services.
An Information Architecture helps the project by first identifying all the possible sources for
information that the project will need, it will locate information that already exists within and
outside the organization. It helps the project by saving resources and time by locating
information already available and thus avoids creating the same information again. Thus, an
Information Architecture reduces the time and cost of collecting, storing and processing project
information. Caldwell advises to use tools like information flowcharts, information maps and
project organigraphs can be used to model and draw up an Information Architecture (Caldwell
2004).
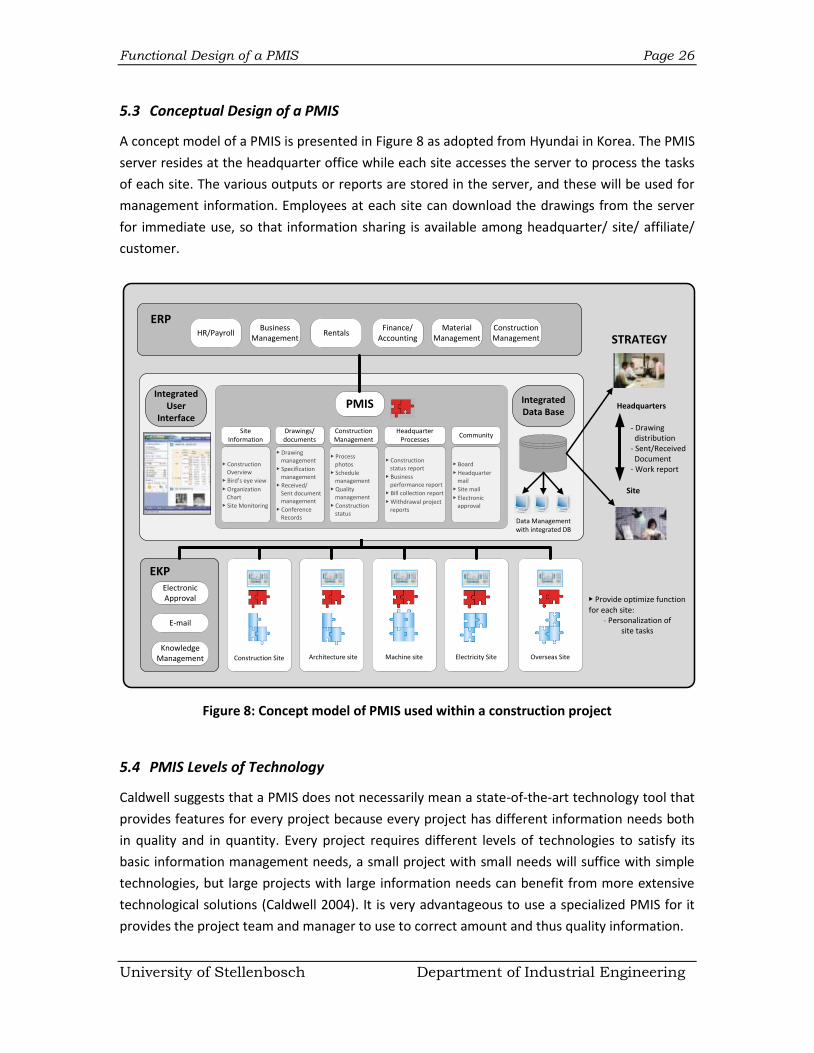
Functional Design of a PMIS Page 26
University of Stellenbosch Department of Industrial Engineering
5.3 Conceptual Design of a PMIS
A concept model of a PMIS is presented in Figure 8 as adopted from Hyundai in Korea. The PMIS
server resides at the headquarter office while each site accesses the server to process the tasks
of each site. The various outputs or reports are stored in the server, and these will be used for
management information. Employees at each site can download the drawings from the server
for immediate use, so that information sharing is available among headquarter/ site/ affiliate/
customer.
Figure 8: Concept model of PMIS used within a construction project
5.4 PMIS Levels of Technology
Caldwell suggests that a PMIS does not necessarily mean a state-of-the-art technology tool that
provides features for every project because every project has different information needs both
in quality and in quantity. Every project requires different levels of technologies to satisfy its
basic information management needs, a small project with small needs will suffice with simple
technologies, but large projects with large information needs can benefit from more extensive
technological solutions (Caldwell 2004). It is very advantageous to use a specialized PMIS for it
provides the project team and manager to use to correct amount and thus quality information.
ERPBusiness
ManagementRentals
Finance/ Accounting
Material Management
Construction Management
HR/Payroll
PMIS
Site Information
Drawings/ documents
Construction Management
Headquarter Processes
Community
Integrated User
Interface
Integrated Data Base
Data Management with integrated DB
▶ Construction Overview
▶ Bird’s eye view
▶ Organization Chart
▶ Site Monitoring
▶ Drawing management
▶ Specification management
▶ Received/ Sent document management
▶ Conference Records
▶ Process photos
▶ Schedule management
▶ Quality management
▶ Construction status
▶ Construction status report
▶ Business performance report
▶ Bill collection report
▶ Withdrawal project reports
▶ Board
▶ Headquarter mail
▶ Site mail
▶ Electronic approval
EKP
Knowledge Management
Electronic Approval
Construction Site Architecture site Machine site Electricity Site Overseas Site
STRATEGY
Headquarters
Site
- Drawing distribution- Sent/Received Document- Work report
▶ Provide optimize function for each site:
- Personalization of site tasks
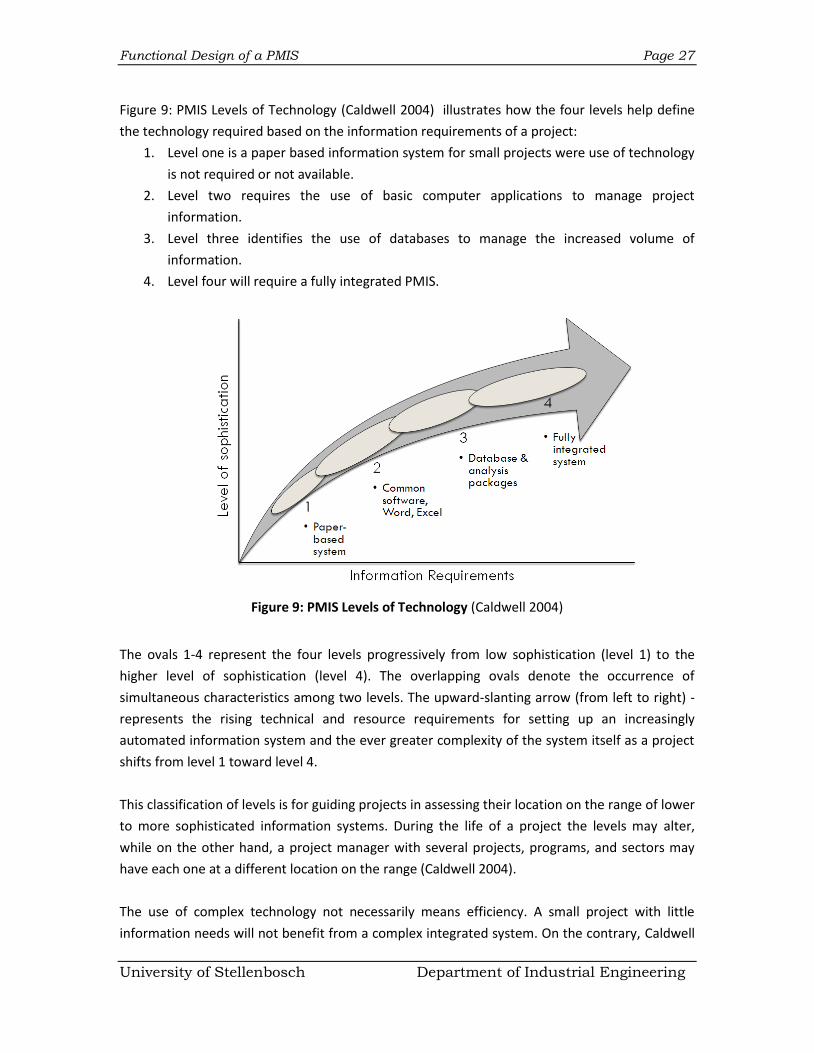
Functional Design of a PMIS Page 27
University of Stellenbosch Department of Industrial Engineering
Figure 9: PMIS Levels of Technology (Caldwell 2004) illustrates how the four levels help define
the technology required based on the information requirements of a project:
1. Level one is a paper based information system for small projects were use of technology
is not required or not available.
2. Level two requires the use of basic computer applications to manage project
information.
3. Level three identifies the use of databases to manage the increased volume of
information.
4. Level four will require a fully integrated PMIS.
Figure 9: PMIS Levels of Technology (Caldwell 2004)
The ovals 1-4 represent the four levels progressively from low sophistication (level 1) to the
higher level of sophistication (level 4). The overlapping ovals denote the occurrence of
simultaneous characteristics among two levels. The upward-slanting arrow (from left to right) -
represents the rising technical and resource requirements for setting up an increasingly
automated information system and the ever greater complexity of the system itself as a project
shifts from level 1 toward level 4.
This classification of levels is for guiding projects in assessing their location on the range of lower
to more sophisticated information systems. During the life of a project the levels may alter,
while on the other hand, a project manager with several projects, programs, and sectors may
have each one at a different location on the range (Caldwell 2004).
The use of complex technology not necessarily means efficiency. A small project with little
information needs will not benefit from a complex integrated system. On the contrary, Caldwell
Functional Design of a PMIS Page 28
University of Stellenbosch Department of Industrial Engineering
argues that managing the system can even be less efficient than a simple manual solution
(Caldwell 2004). A project needs to determine its information requirements and match it with
the appropriate technology. Figure 10: Efficiency of PMIS (Caldwell 2004) below shows the
relationship between the volume of information and the quality of a PMIS comparing the four
different levels shown in Figure 9: PMIS Levels of Technology (Caldwell 2004). Each level drops in
its efficiency as the volume of information grows thus projects need to identify when to move to
the next level.
Figure 10: Efficiency of PMIS (Caldwell 2004)
Figure 10: Efficiency of PMIS (Caldwell 2004) illustrates how the amount of information
increases for a given level, the efficiency in the use of a PMIS tends to decrease due to the time
it takes to process, analyse and report the additional information. For example a level two
system decreases in efficiency as the volume of information increases. This does not necessarily
indicate that a level 4 is the principle, quite the opposite, a level 4 demonstrates a low efficiency
when the volume of information is small (Caldwell 2004).
This can be seen when using a complex system to track small amounts of information, the effort
to setup, manage and use the system, and all its associated costs, make a level 4 system less
efficient compared with simpler solutions.
Meridith indicates that the selection process of a PMIS should be based on the following list
(Meridith, Mantel 2008):
1. Establish a comprehensive set of selection criteria (what activities/ processes should it
undertake?)
2. Prioritize the criteria (separate the needs from the musts)
3. Conduct a preliminary evaluation (pre-qualify tenders)
4. Evaluate the packages individually
5. Negotiate on price and aspects of value adding
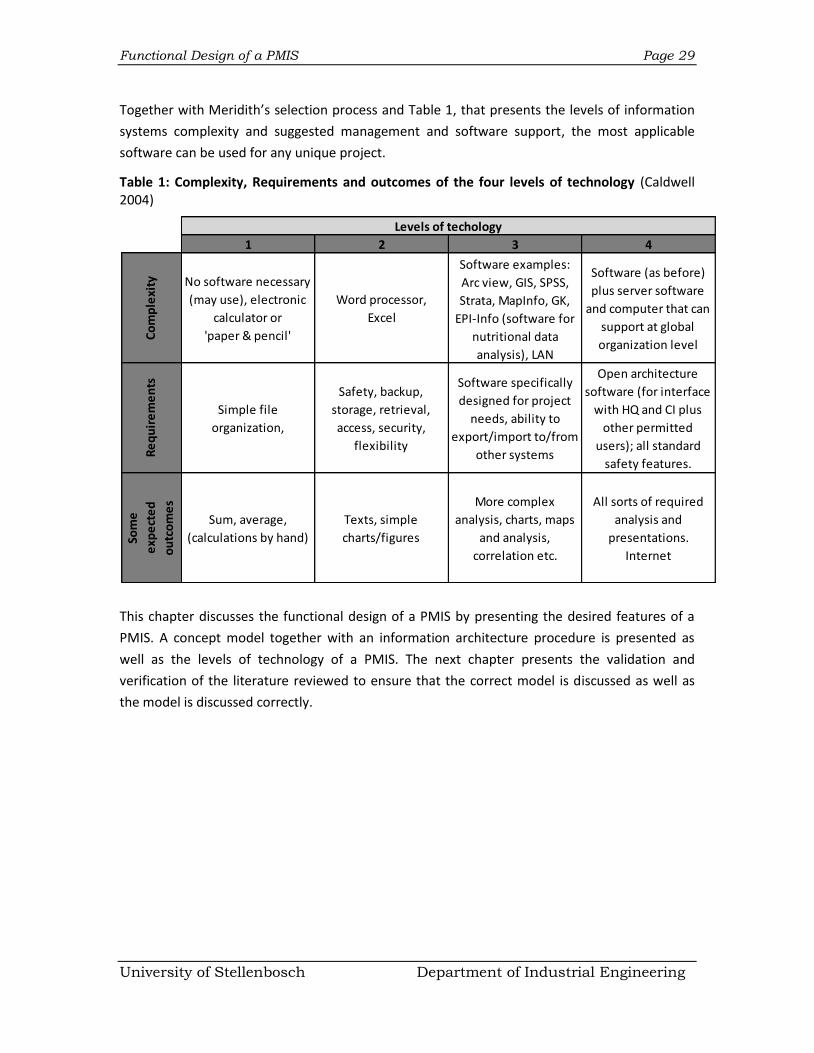
Functional Design of a PMIS Page 29
University of Stellenbosch Department of Industrial Engineering
Together with Meridith’s selection process and Table 1, that presents the levels of information
systems complexity and suggested management and software support, the most applicable
software can be used for any unique project.
Table 1: Complexity, Requirements and outcomes of the four levels of technology (Caldwell 2004)
This chapter discusses the functional design of a PMIS by presenting the desired features of a
PMIS. A concept model together with an information architecture procedure is presented as
well as the levels of technology of a PMIS. The next chapter presents the validation and
verification of the literature reviewed to ensure that the correct model is discussed as well as
the model is discussed correctly.
1 2 3 4
Co
mp
lexi
ty No software necessary
(may use), electronic
calculator or
'paper & pencil'
Word processor,
Excel
Software examples:
Arc view, GIS, SPSS,
Strata, MapInfo, GK,
EPI-Info (software for
nutritional data
analysis), LAN
Software (as before)
plus server software
and computer that can
support at global
organization level
Re
qu
ire
me
nts
Simple file
organization,
Safety, backup,
storage, retrieval,
access, security,
flexibility
Software specifically
designed for project
needs, ability to
export/import to/from
other systems
Open architecture
software (for interface
with HQ and CI plus
other permitted
users); all standard
safety features.
Som
e
exp
ect
ed
ou
tco
me
s
Sum, average,
(calculations by hand)
Texts, simple
charts/figures
More complex
analysis, charts, maps
and analysis,
correlation etc.
All sorts of required
analysis and
presentations.
Internet
Levels of techology
Validation and Verification Page 30
University of Stellenbosch Department of Industrial Engineering
6. Validation and Verification
The previous chapter discussed the functional design of a PMIS while this chapter presents the
validation and verification of the literature reviewed to ensure that the correct model is
discussed as well as the model is discussed correctly.
To prove the validity and to verify the requirements and desired features of a PMIS discussed
and presented in Chapter 4.1, Chapter 4.2 and Chapter 5; an empirical study by Raymond and
Bergeron in 2007 (Raymond, Bergeron 2007) is presented in this chapter. The purpose of this
study is to assess the quality of the PMIS presently used in organizations and to examine their
impact on project managers and project performance, based on a PMIS success model.
This model is composed of five constructs: the quality of the PMIS, the quality of the PMIS
information output, the use of the PMIS, the individual impacts of the PMIS and the impacts of
the PMIS on project success. Analysis of questionnaire data obtained from 39 project managers
confirms the significant contribution of PMIS to successful project management. Improvements
in effectiveness and efficiency in managerial tasks were examined here in terms of improved
project planning, scheduling, monitoring, and control. Improvements were also observed in
terms of decision-making duration time. Advantages gained from PMIS use are not restricted to
individual performance but also include project performance. These systems were establish to
have direct impacts on project success, as they contribute to improving budget control and
meeting project deadlines as well as satisfying technical specifications.
6.1 Research Background and Model
According to Raymond, (Raymond, Bergeron 2007) an IS-based conceptualisation and definition
of project management software facilitates the import of knowledge from the IS field or
discipline, knowledge that can provide a deeper understanding of the PMIS usage phenomenon
and help in answering questions on the factors that explain the use and non-use of PMIS, and on
the actual impacts of these systems on project managers and project performance. This study is
thus established on the recurrent constructs of antecedents and consequences of IS use
developed in DeLone and McLean’s (DeLone, McLean 2003) Information System Success Model
(ISSM) and in Davis (Davis, Bagozzi & Warshaw 1989) Technology Acceptance Model (TAM).
Schematics of the ISSM and TAM are presented in Appendix D: Information System Success
Model (ISSM) and Technology Acceptance Model (TAM). These models is notable by the
continuance of their constructs, after a review of theories and models of IS use that focused on
their chronological examination and their cross-influences and convergences. The ISSM
incorporates information quality and system quality as antecedents of IS use, leading to
individual IS impacts, that is, on users and their work (e.g., in regard to their effectiveness), and
in turn to organizational impacts (e.g., in regard to business strategy and performance)
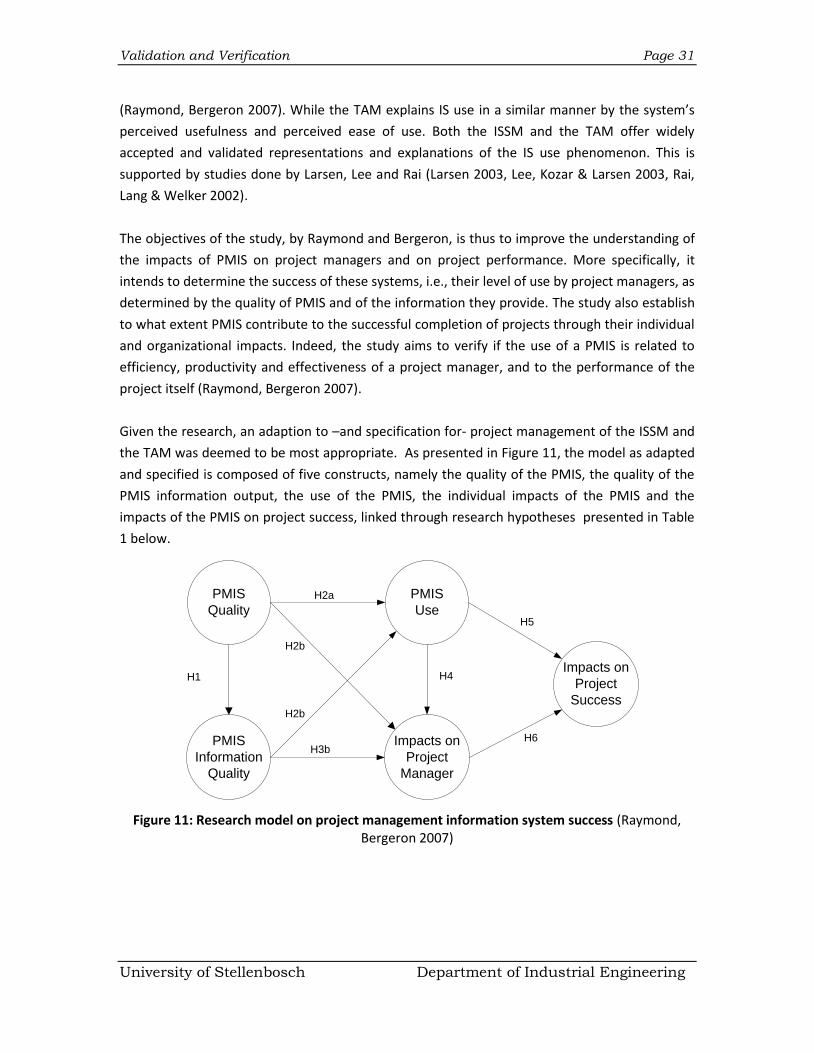
Validation and Verification Page 31
University of Stellenbosch Department of Industrial Engineering
(Raymond, Bergeron 2007). While the TAM explains IS use in a similar manner by the system’s
perceived usefulness and perceived ease of use. Both the ISSM and the TAM offer widely
accepted and validated representations and explanations of the IS use phenomenon. This is
supported by studies done by Larsen, Lee and Rai (Larsen 2003, Lee, Kozar & Larsen 2003, Rai,
Lang & Welker 2002).
The objectives of the study, by Raymond and Bergeron, is thus to improve the understanding of
the impacts of PMIS on project managers and on project performance. More specifically, it
intends to determine the success of these systems, i.e., their level of use by project managers, as
determined by the quality of PMIS and of the information they provide. The study also establish
to what extent PMIS contribute to the successful completion of projects through their individual
and organizational impacts. Indeed, the study aims to verify if the use of a PMIS is related to
efficiency, productivity and effectiveness of a project manager, and to the performance of the
project itself (Raymond, Bergeron 2007).
Given the research, an adaption to –and specification for- project management of the ISSM and
the TAM was deemed to be most appropriate. As presented in Figure 11, the model as adapted
and specified is composed of five constructs, namely the quality of the PMIS, the quality of the
PMIS information output, the use of the PMIS, the individual impacts of the PMIS and the
impacts of the PMIS on project success, linked through research hypotheses presented in Table
1 below.
PMIS
Quality
PMIS
Information
Quality
PMIS
Use
Impacts on
Project
Manager
Impacts on
Project
Success
H1
H2a
H2b
H2b
H3b
H4
H5
H6
Figure 11: Research model on project management information system success (Raymond, Bergeron 2007)
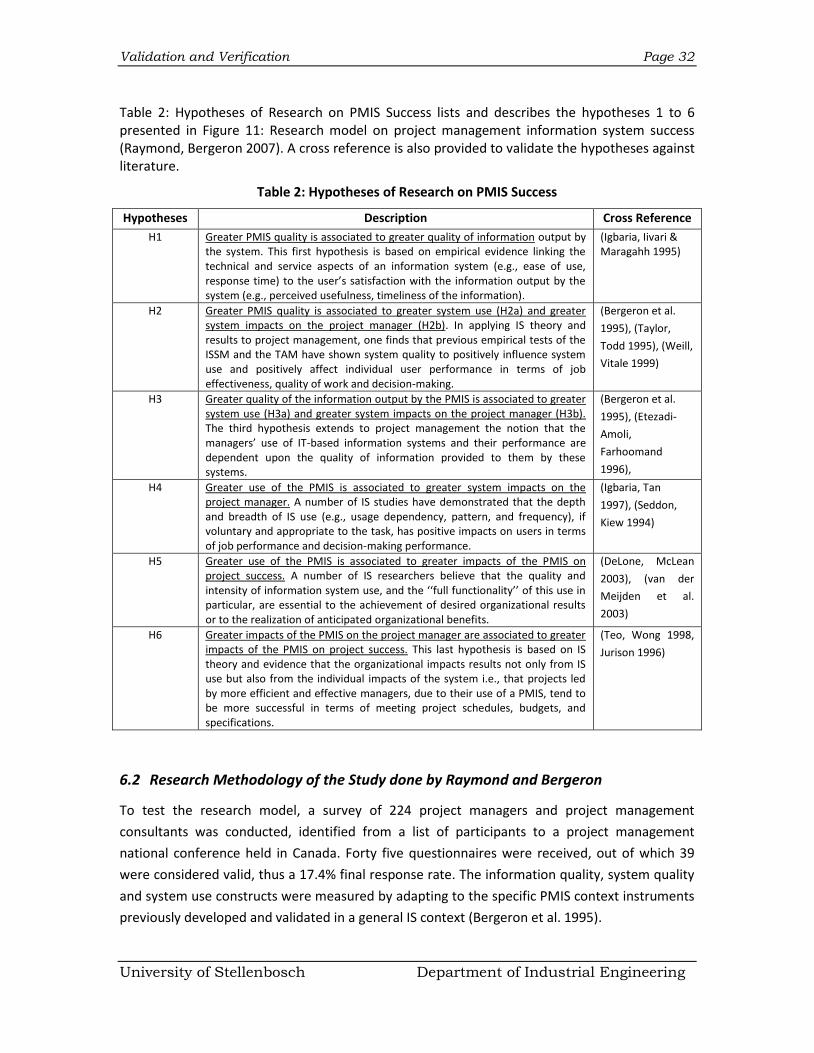
Validation and Verification Page 32
University of Stellenbosch Department of Industrial Engineering
Table 2: Hypotheses of Research on PMIS Success lists and describes the hypotheses 1 to 6 presented in Figure 11: Research model on project management information system success (Raymond, Bergeron 2007). A cross reference is also provided to validate the hypotheses against literature.
Table 2: Hypotheses of Research on PMIS Success
Hypotheses Description Cross Reference
H1 Greater PMIS quality is associated to greater quality of information output by the system. This first hypothesis is based on empirical evidence linking the technical and service aspects of an information system (e.g., ease of use, response time) to the user’s satisfaction with the information output by the system (e.g., perceived usefulness, timeliness of the information).
(Igbaria, Iivari & Maragahh 1995)
H2 Greater PMIS quality is associated to greater system use (H2a) and greater system impacts on the project manager (H2b). In applying IS theory and results to project management, one finds that previous empirical tests of the ISSM and the TAM have shown system quality to positively influence system use and positively affect individual user performance in terms of job effectiveness, quality of work and decision-making.
(Bergeron et al.
1995), (Taylor,
Todd 1995), (Weill,
Vitale 1999)
H3 Greater quality of the information output by the PMIS is associated to greater system use (H3a) and greater system impacts on the project manager (H3b). The third hypothesis extends to project management the notion that the managers’ use of IT-based information systems and their performance are dependent upon the quality of information provided to them by these systems.
(Bergeron et al.
1995), (Etezadi-
Amoli,
Farhoomand
1996),
H4 Greater use of the PMIS is associated to greater system impacts on the project manager. A number of IS studies have demonstrated that the depth and breadth of IS use (e.g., usage dependency, pattern, and frequency), if voluntary and appropriate to the task, has positive impacts on users in terms of job performance and decision-making performance.
(Igbaria, Tan
1997), (Seddon,
Kiew 1994)
H5 Greater use of the PMIS is associated to greater impacts of the PMIS on project success. A number of IS researchers believe that the quality and intensity of information system use, and the ‘‘full functionality’’ of this use in particular, are essential to the achievement of desired organizational results or to the realization of anticipated organizational benefits.
(DeLone, McLean
2003), (van der
Meijden et al.
2003)
H6 Greater impacts of the PMIS on the project manager are associated to greater impacts of the PMIS on project success. This last hypothesis is based on IS theory and evidence that the organizational impacts results not only from IS use but also from the individual impacts of the system i.e., that projects led by more efficient and effective managers, due to their use of a PMIS, tend to be more successful in terms of meeting project schedules, budgets, and specifications.
(Teo, Wong 1998,
Jurison 1996)
6.2 Research Methodology of the Study done by Raymond and Bergeron
To test the research model, a survey of 224 project managers and project management
consultants was conducted, identified from a list of participants to a project management
national conference held in Canada. Forty five questionnaires were received, out of which 39
were considered valid, thus a 17.4% final response rate. The information quality, system quality
and system use constructs were measured by adapting to the specific PMIS context instruments
previously developed and validated in a general IS context (Bergeron et al. 1995).
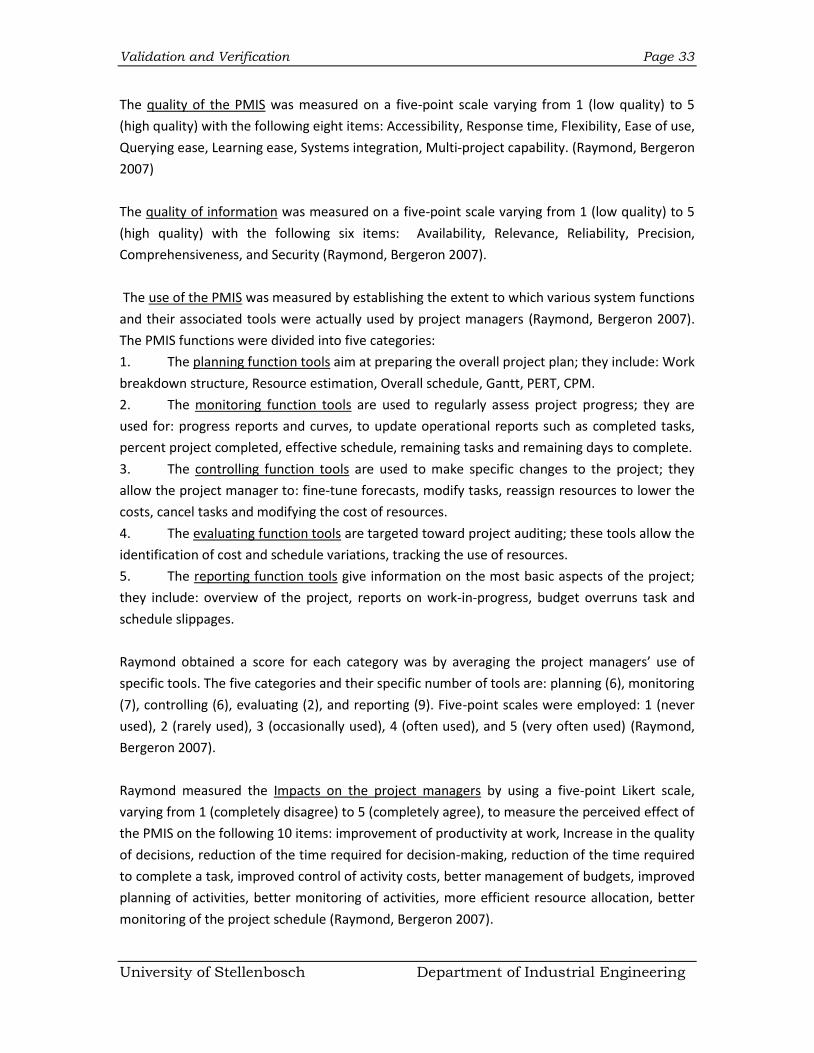
Validation and Verification Page 33
University of Stellenbosch Department of Industrial Engineering
The quality of the PMIS was measured on a five-point scale varying from 1 (low quality) to 5
(high quality) with the following eight items: Accessibility, Response time, Flexibility, Ease of use,
Querying ease, Learning ease, Systems integration, Multi-project capability. (Raymond, Bergeron
2007)
The quality of information was measured on a five-point scale varying from 1 (low quality) to 5
(high quality) with the following six items: Availability, Relevance, Reliability, Precision,
Comprehensiveness, and Security (Raymond, Bergeron 2007).
The use of the PMIS was measured by establishing the extent to which various system functions
and their associated tools were actually used by project managers (Raymond, Bergeron 2007).
The PMIS functions were divided into five categories:
1. The planning function tools aim at preparing the overall project plan; they include: Work
breakdown structure, Resource estimation, Overall schedule, Gantt, PERT, CPM.
2. The monitoring function tools are used to regularly assess project progress; they are
used for: progress reports and curves, to update operational reports such as completed tasks,
percent project completed, effective schedule, remaining tasks and remaining days to complete.
3. The controlling function tools are used to make specific changes to the project; they
allow the project manager to: fine-tune forecasts, modify tasks, reassign resources to lower the
costs, cancel tasks and modifying the cost of resources.
4. The evaluating function tools are targeted toward project auditing; these tools allow the
identification of cost and schedule variations, tracking the use of resources.
5. The reporting function tools give information on the most basic aspects of the project;
they include: overview of the project, reports on work-in-progress, budget overruns task and
schedule slippages.
Raymond obtained a score for each category was by averaging the project managers’ use of
specific tools. The five categories and their specific number of tools are: planning (6), monitoring
(7), controlling (6), evaluating (2), and reporting (9). Five-point scales were employed: 1 (never
used), 2 (rarely used), 3 (occasionally used), 4 (often used), and 5 (very often used) (Raymond,
Bergeron 2007).
Raymond measured the Impacts on the project managers by using a five-point Likert scale,
varying from 1 (completely disagree) to 5 (completely agree), to measure the perceived effect of
the PMIS on the following 10 items: improvement of productivity at work, Increase in the quality
of decisions, reduction of the time required for decision-making, reduction of the time required
to complete a task, improved control of activity costs, better management of budgets, improved
planning of activities, better monitoring of activities, more efficient resource allocation, better
monitoring of the project schedule (Raymond, Bergeron 2007).
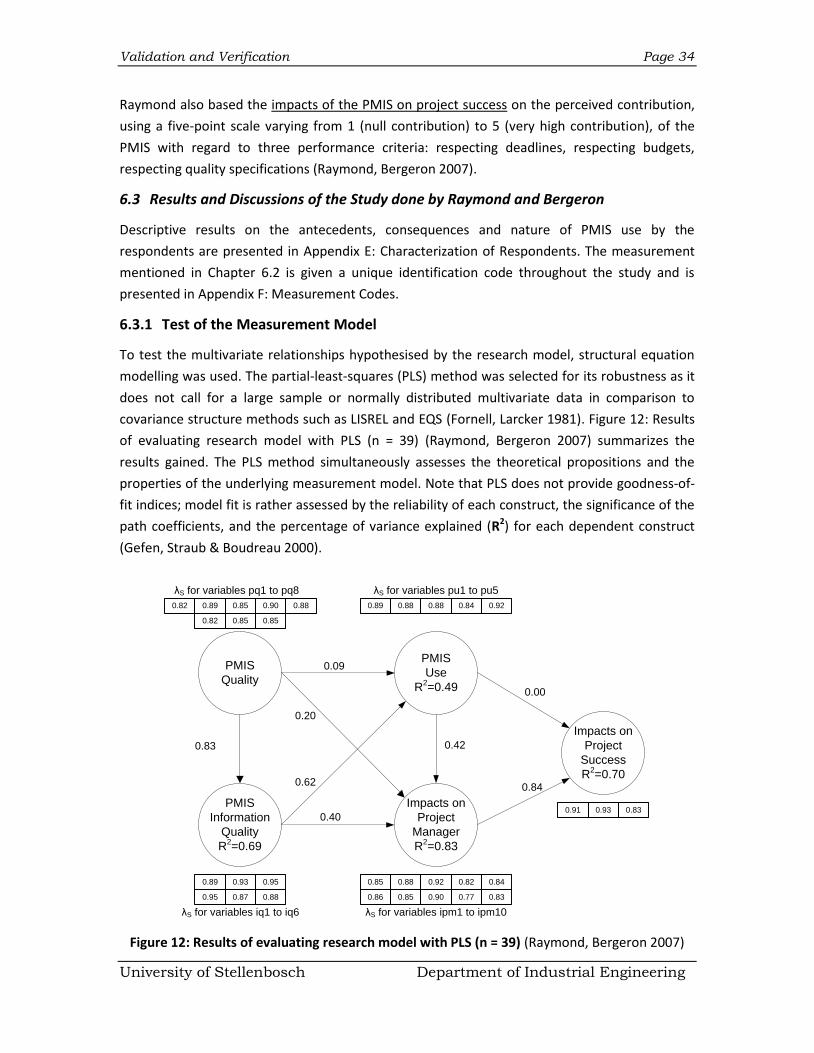
Validation and Verification Page 34
University of Stellenbosch Department of Industrial Engineering
Raymond also based the impacts of the PMIS on project success on the perceived contribution,
using a five-point scale varying from 1 (null contribution) to 5 (very high contribution), of the
PMIS with regard to three performance criteria: respecting deadlines, respecting budgets,
respecting quality specifications (Raymond, Bergeron 2007).
6.3 Results and Discussions of the Study done by Raymond and Bergeron
Descriptive results on the antecedents, consequences and nature of PMIS use by the
respondents are presented in Appendix E: Characterization of Respondents. The measurement
mentioned in Chapter 6.2 is given a unique identification code throughout the study and is
presented in Appendix F: Measurement Codes.
6.3.1 Test of the Measurement Model
To test the multivariate relationships hypothesised by the research model, structural equation
modelling was used. The partial-least-squares (PLS) method was selected for its robustness as it
does not call for a large sample or normally distributed multivariate data in comparison to
covariance structure methods such as LISREL and EQS (Fornell, Larcker 1981). Figure 12: Results
of evaluating research model with PLS (n = 39) (Raymond, Bergeron 2007) summarizes the
results gained. The PLS method simultaneously assesses the theoretical propositions and the
properties of the underlying measurement model. Note that PLS does not provide goodness-of-
fit indices; model fit is rather assessed by the reliability of each construct, the significance of the
path coefficients, and the percentage of variance explained (R2) for each dependent construct
(Gefen, Straub & Boudreau 2000).
Figure 12: Results of evaluating research model with PLS (n = 39) (Raymond, Bergeron 2007)
PMIS
Quality
PMIS
Information
Quality
R2=0.69
PMIS
Use
R2=0.49
Impacts on
Project
Manager
R2=0.83
Impacts on
Project
Success
R2=0.70
0.83
0.09
0.20
0.62
0.40
0.42
0.00
0.84
0.82 0.89 0.85 0.90
0.82 0.85 0.85
0.88 0.89 0.88 0.88 0.84 0.92
0.85 0.88 0.92 0.82 0.84
0.86 0.85 0.90 0.77 0.830.95
0.89 0.93
0.87
0.95
0.88
0.91 0.93 0.83
λS for variables pq1 to pq8 λS for variables pu1 to pu5
λS for variables iq1 to iq6 λS for variables ipm1 to ipm10
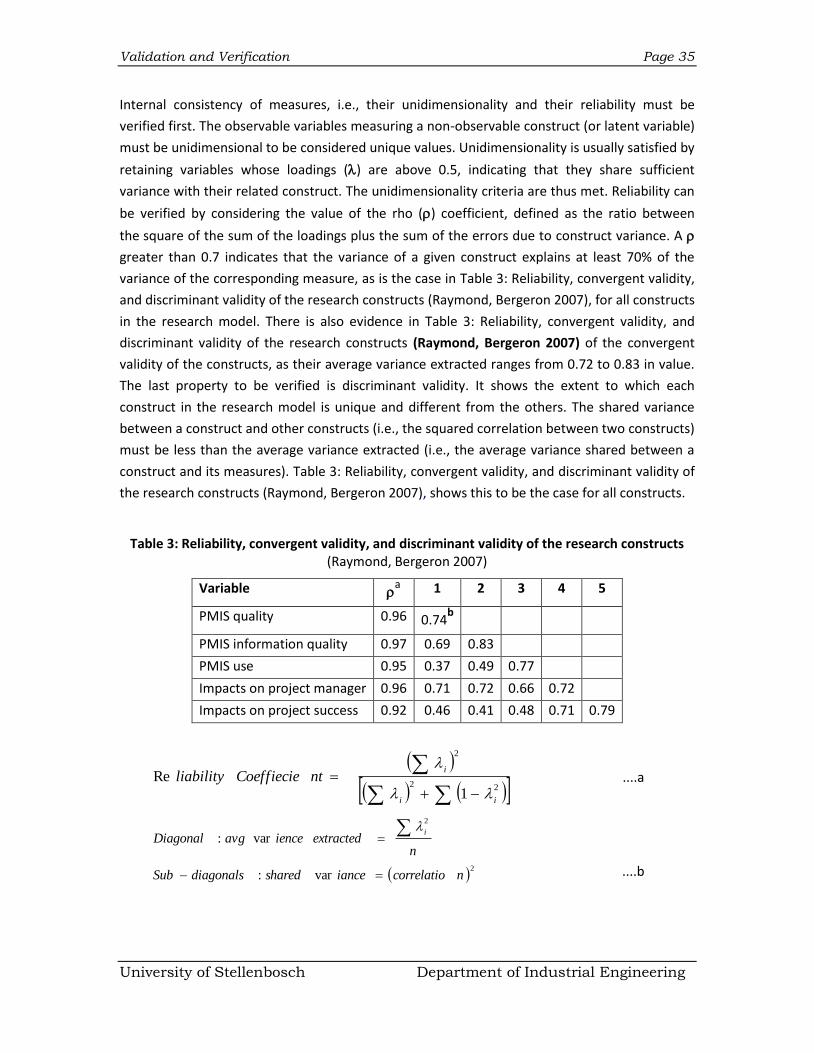
Validation and Verification Page 35
University of Stellenbosch Department of Industrial Engineering
Internal consistency of measures, i.e., their unidimensionality and their reliability must be
verified first. The observable variables measuring a non-observable construct (or latent variable)
must be unidimensional to be considered unique values. Unidimensionality is usually satisfied by
retaining variables whose loadings () are above 0.5, indicating that they share sufficient
variance with their related construct. The unidimensionality criteria are thus met. Reliability can
be verified by considering the value of the rho () coefficient, defined as the ratio between
thesquare of the sum of the loadings plus the sum of the errors due to construct variance. A
greater than 0.7 indicates that the variance of a given construct explains at least 70% of the
variance of the corresponding measure, as is the case in Table 3: Reliability, convergent validity,
and discriminant validity of the research constructs (Raymond, Bergeron 2007), for all constructs
in the research model. There is also evidence in Table 3: Reliability, convergent validity, and
discriminant validity of the research constructs (Raymond, Bergeron 2007) of the convergent
validity of the constructs, as their average variance extracted ranges from 0.72 to 0.83 in value.
The last property to be verified is discriminant validity. It shows the extent to which each
construct in the research model is unique and different from the others. The shared variance
between a construct and other constructs (i.e., the squared correlation between two constructs)
must be less than the average variance extracted (i.e., the average variance shared between a
construct and its measures). Table 3: Reliability, convergent validity, and discriminant validity of
the research constructs (Raymond, Bergeron 2007), shows this to be the case for all constructs.
Table 3: Reliability, convergent validity, and discriminant validity of the research constructs (Raymond, Bergeron 2007)
Variable a 1 2 3 4 5
PMIS quality 0.96 0.74b
PMIS information quality 0.97 0.69 0.83
PMIS use 0.95 0.37 0.49 0.77
Impacts on project manager 0.96 0.71 0.72 0.66 0.72
Impacts on project success 0.92 0.46 0.41 0.48 0.71 0.79
22
2
1Re
ii
intCoeffiecieliability
....a
2
2
var:
var:
ncorrelatioianceshareddiagonalsSub
nextractedienceavgDiagonal
i
....b
Validation and Verification Page 36
University of Stellenbosch Department of Industrial Engineering
6.3.2 Test of the Theoretical Model
The research hypotheses are tested by analysing the direction, the value and the level of
significance of the path coefficients () estimated by the PLS method, as presented in Figure 12:
Results of evaluating research model with PLS (n = 39) (Raymond, Bergeron 2007). The high
percentage of variance explained in each dependent construct, varying from 0.49 to 0.83, is
indicative of model fit.
H1– A positive and highly significant path coefficient ( = 0.83) confirms that the quality of
information output by a PMIS is strongly associated to the technical and service aspects
of the system, that is, to system quality. From the project manager’s point of view, the
PMIS cannot be deemed merely as a ‘‘black box’’ but must be assessed for its level of
sophistication and support provided by the organization’s IS function and by the system
providers, whether they are inside or outside the organization.
H2 – The second hypothesis could not be confirmed. PMIS quality was not found to directly
influence the use of the system ( = 0.09), nor its impacts on the project manager ( =
0.20). There are however a significant indirect effect of system quality on system use
(equal to 0.83 x 0.62 = 0.51) and on impacts on the project manager (equal to 0.83 x
0.40 = 0.12), that is, through the mediating influence of information quality.
H3 – The third hypothesis, presuming a positive influence of the quality of information
provided by the PMIS upon the use of the system and its impacts on the project
manager is confirmed. Indeed, the quality of information output is significantly related
to the use of the PMIS by project managers (H3a, = 0.62). Path analysis also confirms
the existence of a significant relation between the quality of information output and the
system’s impacts on project managers (H3b, = 0.40). Hence a PMIS must provide
information on project costs, resources and milestones that is perceived to be relevant,
reliable and accurate by project managers if they are to use these systems in their
planning, controlling, monitoring and reporting tasks and if they are to be more efficient
and effective in accomplishing these tasks.
H4 – Testing the fourth hypothesis confirmed that the use of a PMIS is positively related to its
impacts on the project manager ( = 0.42). In other words, the use of a PMIS by project
managers increases their productivity, effectiveness and efficiency in decision-making
due to the quality of the information output by the PMIS. Therefore, using project
management software tools that enhance their capacity to plan, control, monitor, audit,
and report provides tangible benefits to project managers and improves the quality of
their work.
H5 – The fifth hypothesis could not be confirmed as no direct relationship was found
between PMIS use and the system’s impacts on project success ( = 0.00). Significant
improvements in project performance in terms of meeting deadlines, respecting
Validation and Verification Page 37
University of Stellenbosch Department of Industrial Engineering
budgets and meeting specifications can be obtained indirectly however, through the
system’s impacts on project managers.
H6 – Results confirmed the positive association between the impact of PMIS on the project
manager and the impact of PMIS on project success ( = 0.84).
Hence, the more project managers perceive their task to be positively impacted by their use of
project management software, greater is their belief in the positive contribution of this software
to the attainment of their projects’ performance objectives.
6.4 Final Discussion of the Study done by Raymond and Bergeron
The objective of this research is to have a better understanding of the elements that contribute
to the impact of a PMIS on project success. The study results are discussed in terms of direct and
indirect effects on PMIS project success. To ease the discussion, the elements are grouped in
three dimensions: technical (PMIS quality and quality of information), managerial (PMIS use and
impact on project manager), and organizational (PMIS impact on project success).
At the technical level, the first element indirectly influencing the impact of a PMIS on project
success is PMIS quality. The system’s ease of use, flexibility, response time, learning ease and
system integration play an important role in producing quality information, as perceived by the
project manager. Indeed, PMIS quality is a strong predictor of the quality of information to be
obtained from the system. In the case of a higher-quality PMIS, the information output is more
available, reliable, precise, comprehensive, and secure. Conversely, a PMIS that produces
information of poor quality would be a system that is more difficult to use, less flexible, and less
integrated to other organizational information systems used by the project manager and other
managers or employees. This means that project information quality requires sophisticated,
well-serviced information systems.
The quality of information is directly and strongly related to PMIS use and to the system’s
impacts on the project manager. Information quality is not an end by itself however, as it leads
only indirectly to project success. At the managerial level, it is only through the actual use of the
PMIS by – and the system’s impacts on – the project manager that the quality of information can
influence project success. Better quality of information output increases the opportunity of the
PMIS being used, which in turn allows the system to have a positive impact on the project
manager. As such, the quality of information output by the PMIS leverages the project
manager’s work as a professional. The latter will feel more professional at work if he or she has
access to project information of high quality and uses the system more intensively and more
extensively for the planning, control, monitoring, and reporting activities. This combination of
quality information and extensive use of the system allows the project manager to feel more
productive at work and provides improved support for decision-making.
Validation and Verification Page 38
University of Stellenbosch Department of Industrial Engineering
This leads Raymond to the final relationship, at the organizational level, specifically the impacts
of the PMIS on project success. First, the PMIS itself has no direct influence upon project
success; it is only through higher-quality information, extensive use of the system, and individual
impacts on the project manager that the system has an effect on project success. While a
positive impact on managerial work is essential to project success, greater use of a PMIS does
not lead per se to greater impacts on project performance. It is only indirectly, through its
contribution to managerial work that this use contributes to project success. In summary, if it is
to make a significant contribution to the attainment of project objectives, i.e., to make an
impact in terms of project budget, schedule, and specifications, a PMIS must first be sufficiently
sophisticated and serviced and produce information of sufficient quality. It must then be used
with sufficient depth and breadth by project managers and it must have a sufficiently beneficial
impact on their work.
Raymond noted that among the managers who participated in the study, a number indicated
strong impacts of the PMIS upon the successful completion of their projects, while others did
not (Raymond, Bergeron 2007). The results indicate that, in general, the latter depended upon a
PMIS of lower quality that produced lower quality information; hence they used their system
less and were less supported in their project management task. Whereas generally speaking, the
former were those for whom the sufficient conditions were met, that is, PMIS quality,
information output quality, PMIS use and positive impacts on managerial work (Raymond,
Bergeron 2007).
Raymond made additional comments in explaining these relationships. First, it is worth noting
that a reverse or ‘‘feedback’’ relationship is possible between individual impacts of a PMIS and
its use (DeLone, McLean 2003). As project managers perceive the PMIS to be beneficial to them,
it is likely that they will increase their use of the system. Second, other dimensions of project
management, related to the organizational environment, evidently play a role in explaining
project performance; thus the managers’ authority on project activities, their involvement in
project design, and their accountability in meeting project objectives are potential success
factors other than the PMIS (Bergeron 1986). Third, another interesting aspect to consider is the
possible reluctance of project managers to report ‘‘bad news’’ on a project, and the subsequent
effect it could have on the accuracy of project reports and on the assessment of project success.
Finally, as suggested by Shenhar et al. ,future studies of PMIS success could evaluate project
success or performance from the client’s perspective, that is, evaluate if the impacts of the PMIS
on project outcomes provide an adequate solution to the client’s problem, bring true
advantages to the organization in terms of quality of product/services offered, greater output
volume, quicker delivery, and better strategic positioning, and provide tangible benefits such as
increased sales and revenues (Shenhar, Levy & Dvir 1997).
Validation and Verification Page 39
University of Stellenbosch Department of Industrial Engineering
6.5 Conclusion of Empirical Study done by Raymond and Bergeron
The research aim of this study done by Raymond and Bergeron was to determine the actual
impacts of IT-based project management information systems upon project managers and
project performance. More specifically, one objective was to identify the main determinants of
PMIS and determine the extent to which these systems assist project managers in terms of
increased efficiency, productivity and efficiency. Another objective was to get a better
understanding of the contribution of these systems to the success of projects.
Following the conclusions of previous research that PMIS success models should continue to be
validated and challenged, the results of this research show that the use of a project
management information system is in fact advantageous to project managers. Improvements in
effectiveness and efficiency in managerial tasks were observed here in terms of better project
planning, scheduling, monitoring, and control. Improvements in productivity were also observed
in terms of timelier decision-making. Advantages obtained from PMIS use are not limited to
individual performance but also include project performance. These systems were found to have
direct impacts on project success, as they contribute to improving budget control and meeting
project deadlines as well as fulfilling technical specifications. One can therefore conclude that
PMIS make a significant contribution to project success and should continue to be the object of
project management research.
This chapter presents the validation and verification of the literature reviewed to ensure that
the correct model is discussed as well as the model is discussed correctly. The next chapter
presents the case study with South African Breweries Limited that measures and evaluates the
current PMIS used within the company as a whole.
Case Study: South African Breweries Ltd Page 40
University of Stellenbosch Department of Industrial Engineering
7. Case Study: South African Breweries Ltd
In the previous chapter presented the validation and verification of the literature reviewed to
ensure that the correct model is discussed as well as the model is discussed correctly. This
chapter introduces the case study with South African Breweries Limited (SAB Ltd) that measures
and evaluates the current PMIS used within the company as a whole.
7.1 Introduction
With knowledge obtained from Chapter 2, through to Chapter 6, a case study is executed with
South African Breweries Limited to investigate their current project management policy and
procedures. To fully understand or depict SAB Ltd experiences with a PMIS, a comprehensive
examination is achieved by conducting a furrow information audit which includes focus group
discussions and a questionnaire. The questionnaire is based on the requirements and constructs
evaluated in Chapter 6 by Raymond and Bergeron. The fundamentals of an information audit
approach guide the investigation process. Through this investigation, the current system
features are determined, as well as which is missing and what features can be improved. With
the results of the altered information audit, recommendations are made regarding the desired
system requirements in order to meet the organizations needs and how it can be successfully
implemented by presenting quick wins for the possible causes of problems.
7.2 Overview of South African Breweries Limited
South African Breweries Limited is South Africa’s leading producer and distributor of alcoholic
and non-alcoholic beverages and one of the nation’s largest manufacturing firms. The company
operates seven breweries and 40 depots in South Africa with an annual brewing capacity of 3.1
billion litres. Its portfolio of beer brands meets the needs of a wide range of consumers and
includes five of the country’s top six most popular beer brands – namely Carling Black Label,
Hansa Pilsener, Castle Lager, Castle Lite and Castle Milk Stout.
Through its various corporate social responsibility programs, SAB Ltd actively invests in
community partnerships, socio-economic and enterprise development initiatives to build a
stronger South Africa. To strive towards their vision to be the most admired company in South
Africa, a partner of choice, an investment of choice and an employer of choice, they conduct a
large range on projects.
SAB Ltd has 5 strategic thrusts which include: Ensure Key Brands Resonate, Shape Superior
Route to Market, Engage the Competitor, Stabilize the Foundation and lastly Restore Societal
Leadership. Each strategic thrust has an influence on various departments that work together.
This calls for a good integrated project management information system.
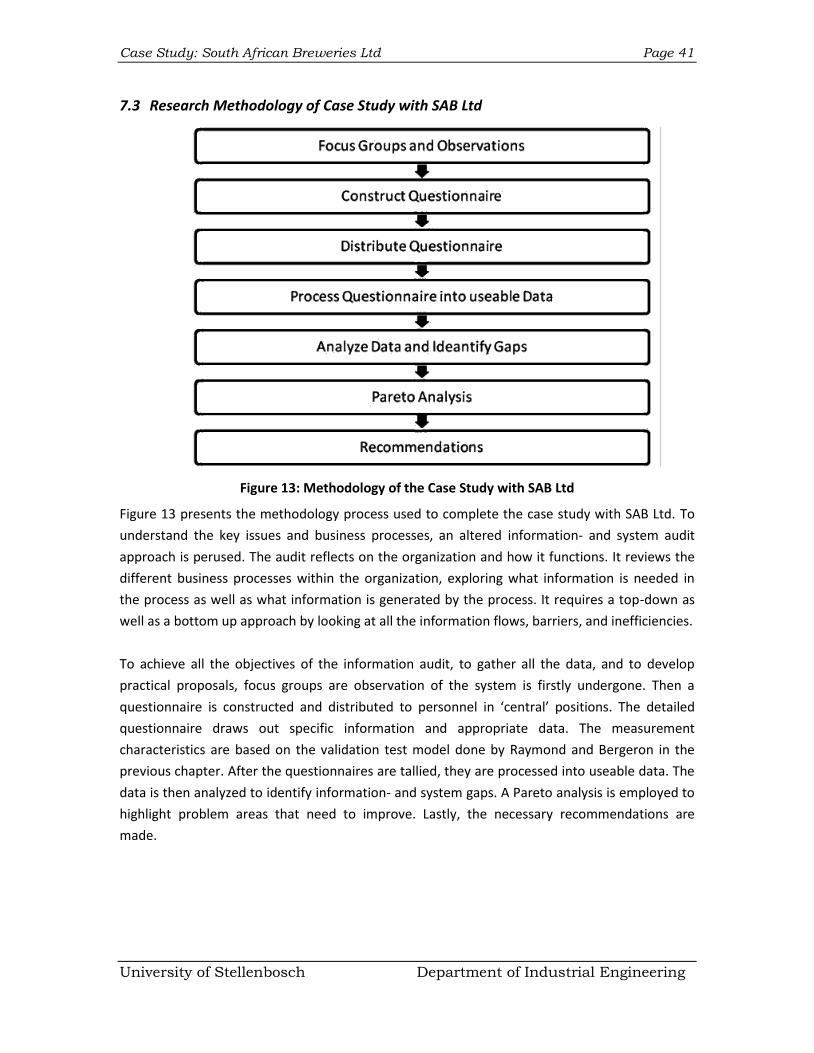
Case Study: South African Breweries Ltd Page 41
University of Stellenbosch Department of Industrial Engineering
7.3 Research Methodology of Case Study with SAB Ltd
Figure 13: Methodology of the Case Study with SAB Ltd
Figure 13 presents the methodology process used to complete the case study with SAB Ltd. To
understand the key issues and business processes, an altered information- and system audit
approach is perused. The audit reflects on the organization and how it functions. It reviews the
different business processes within the organization, exploring what information is needed in
the process as well as what information is generated by the process. It requires a top-down as
well as a bottom up approach by looking at all the information flows, barriers, and inefficiencies.
To achieve all the objectives of the information audit, to gather all the data, and to develop
practical proposals, focus groups are observation of the system is firstly undergone. Then a
questionnaire is constructed and distributed to personnel in ‘central’ positions. The detailed
questionnaire draws out specific information and appropriate data. The measurement
characteristics are based on the validation test model done by Raymond and Bergeron in the
previous chapter. After the questionnaires are tallied, they are processed into useable data. The
data is then analyzed to identify information- and system gaps. A Pareto analysis is employed to
highlight problem areas that need to improve. Lastly, the necessary recommendations are
made.
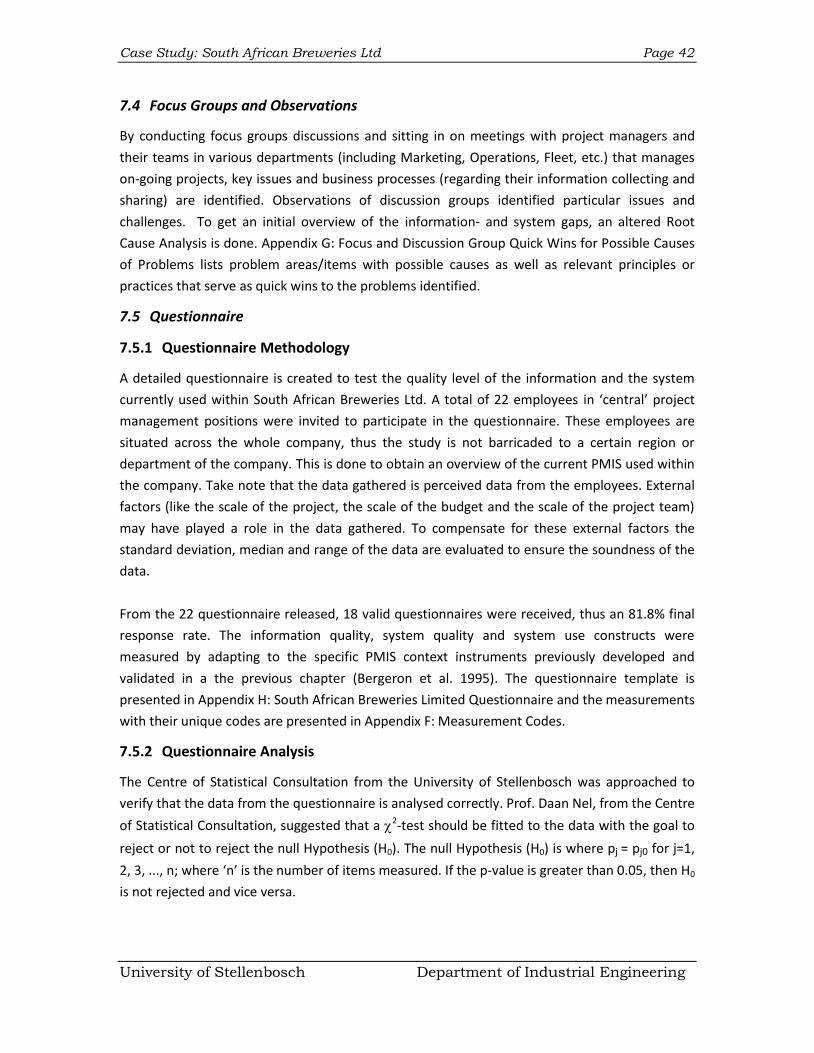
Case Study: South African Breweries Ltd Page 42
University of Stellenbosch Department of Industrial Engineering
7.4 Focus Groups and Observations
By conducting focus groups discussions and sitting in on meetings with project managers and
their teams in various departments (including Marketing, Operations, Fleet, etc.) that manages
on-going projects, key issues and business processes (regarding their information collecting and
sharing) are identified. Observations of discussion groups identified particular issues and
challenges. To get an initial overview of the information- and system gaps, an altered Root
Cause Analysis is done. Appendix G: Focus and Discussion Group Quick Wins for Possible Causes
of Problems lists problem areas/items with possible causes as well as relevant principles or
practices that serve as quick wins to the problems identified.
7.5 Questionnaire
7.5.1 Questionnaire Methodology
A detailed questionnaire is created to test the quality level of the information and the system
currently used within South African Breweries Ltd. A total of 22 employees in ‘central’ project
management positions were invited to participate in the questionnaire. These employees are
situated across the whole company, thus the study is not barricaded to a certain region or
department of the company. This is done to obtain an overview of the current PMIS used within
the company. Take note that the data gathered is perceived data from the employees. External
factors (like the scale of the project, the scale of the budget and the scale of the project team)
may have played a role in the data gathered. To compensate for these external factors the
standard deviation, median and range of the data are evaluated to ensure the soundness of the
data.
From the 22 questionnaire released, 18 valid questionnaires were received, thus an 81.8% final
response rate. The information quality, system quality and system use constructs were
measured by adapting to the specific PMIS context instruments previously developed and
validated in a the previous chapter (Bergeron et al. 1995). The questionnaire template is
presented in Appendix H: South African Breweries Limited Questionnaire and the measurements
with their unique codes are presented in Appendix F: Measurement Codes.
7.5.2 Questionnaire Analysis
The Centre of Statistical Consultation from the University of Stellenbosch was approached to
verify that the data from the questionnaire is analysed correctly. Prof. Daan Nel, from the Centre
of Statistical Consultation, suggested that a 2-test should be fitted to the data with the goal to
reject or not to reject the null Hypothesis (H0). The null Hypothesis (H0) is where pj = pj0 for j=1,
2, 3, ..., n; where ‘n’ is the number of items measured. If the p-value is greater than 0.05, then H0
is not rejected and vice versa.
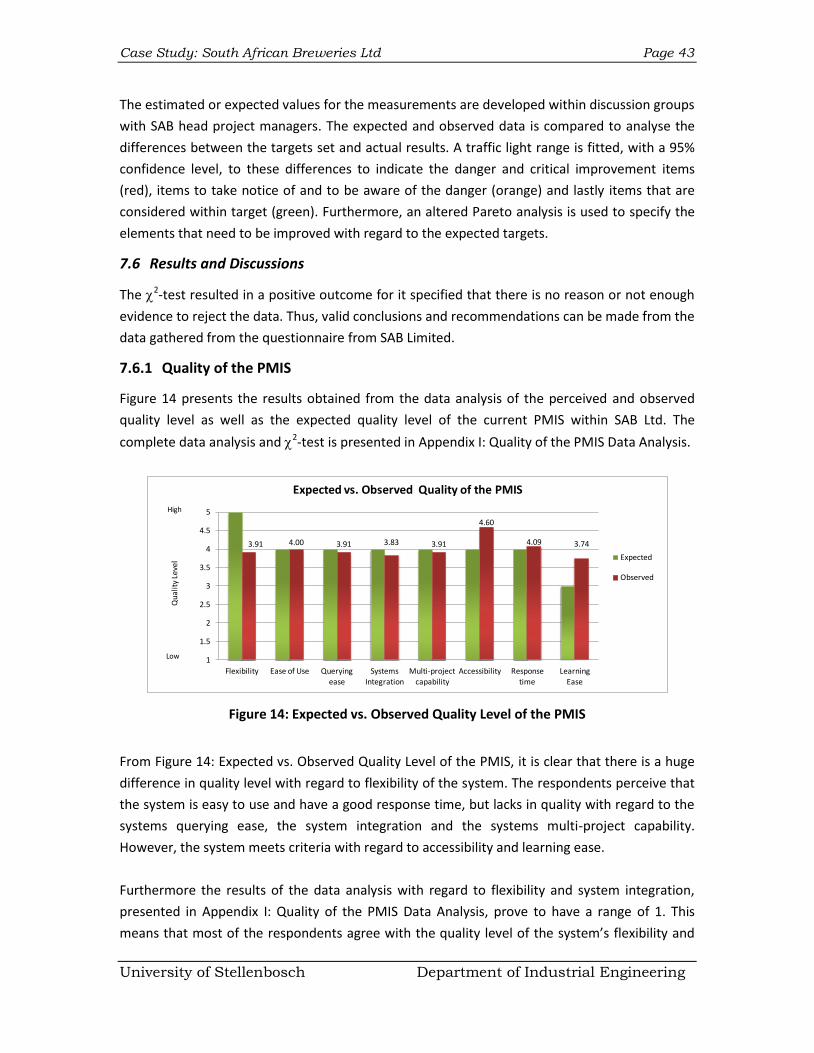
Case Study: South African Breweries Ltd Page 43
University of Stellenbosch Department of Industrial Engineering
The estimated or expected values for the measurements are developed within discussion groups
with SAB head project managers. The expected and observed data is compared to analyse the
differences between the targets set and actual results. A traffic light range is fitted, with a 95%
confidence level, to these differences to indicate the danger and critical improvement items
(red), items to take notice of and to be aware of the danger (orange) and lastly items that are
considered within target (green). Furthermore, an altered Pareto analysis is used to specify the
elements that need to be improved with regard to the expected targets.
7.6 Results and Discussions
The 2-test resulted in a positive outcome for it specified that there is no reason or not enough
evidence to reject the data. Thus, valid conclusions and recommendations can be made from the
data gathered from the questionnaire from SAB Limited.
7.6.1 Quality of the PMIS
Figure 14 presents the results obtained from the data analysis of the perceived and observed
quality level as well as the expected quality level of the current PMIS within SAB Ltd. The
complete data analysis and 2-test is presented in Appendix I: Quality of the PMIS Data Analysis.
Figure 14: Expected vs. Observed Quality Level of the PMIS
From Figure 14: Expected vs. Observed Quality Level of the PMIS, it is clear that there is a huge
difference in quality level with regard to flexibility of the system. The respondents perceive that
the system is easy to use and have a good response time, but lacks in quality with regard to the
systems querying ease, the system integration and the systems multi-project capability.
However, the system meets criteria with regard to accessibility and learning ease.
Furthermore the results of the data analysis with regard to flexibility and system integration,
presented in Appendix I: Quality of the PMIS Data Analysis, prove to have a range of 1. This
means that most of the respondents agree with the quality level of the system’s flexibility and
3.91 4.00 3.91 3.83 3.91
4.60
4.09 3.74
1
1.5
2
2.5
3
3.5
4
4.5
5
Flexibility Ease of Use Querying ease
Systems Integration
Multi-project capability
Accessibility Response time
Learning Ease
Qu
alit
y Le
vel
Expected vs. Observed Quality of the PMIS
Expected
Observed
Low
High
Case Study: South African Breweries Ltd Page 44
University of Stellenbosch Department of Industrial Engineering
integration functions. Moreover, the results with regard to the systems multi-project capability
and querying ease, proves to have a range of 2. This means that there is a larger standard
deviation perceived from the respondents, but according to Prof. Daan Nel, from the Centre of
Statistical Consultation, this range value of two is small enough to accept that the respondents
are still in agreement.
Figure 15: Pareto Analysis of the items influencing the quality level of the PMIS most
After identifying the elements that does not meet the expected quality level, a Pareto analysis is
performed. The results are presented in Appendix I and in Figure 15 above. Consequently, the
results from the Pareto analysis clearly indicate that the systems flexibility needs the most
improvement. Thereafter the system integration functions, as well as the systems multi-project
capability and querying ease.
7.6.2 Quality of the Information
Figure 16 presents the results obtained from the data analysis of the perceived and observed
quality level within SAB Ltd as well as the expected quality level of the information within the
PMIS. The complete data analysis and 2-test is presented in Appendix J: Quality of the
Information Data Analysis
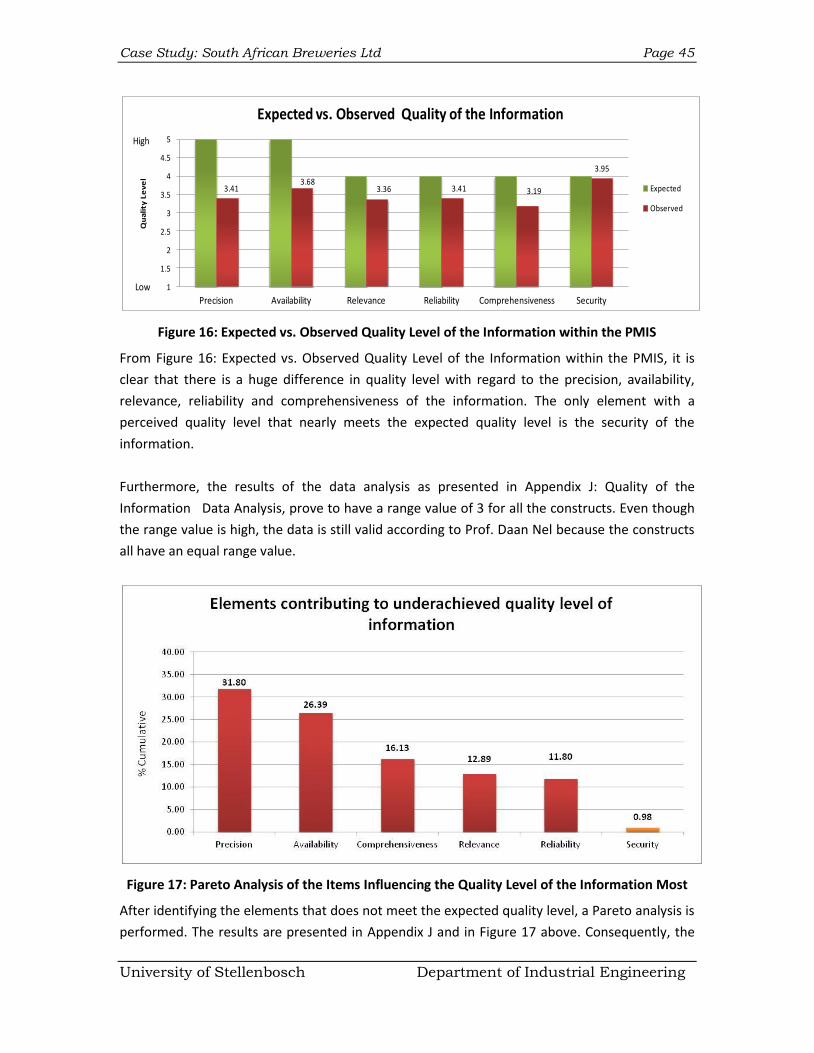
Case Study: South African Breweries Ltd Page 45
University of Stellenbosch Department of Industrial Engineering
Figure 16: Expected vs. Observed Quality Level of the Information within the PMIS
From Figure 16: Expected vs. Observed Quality Level of the Information within the PMIS, it is
clear that there is a huge difference in quality level with regard to the precision, availability,
relevance, reliability and comprehensiveness of the information. The only element with a
perceived quality level that nearly meets the expected quality level is the security of the
information.
Furthermore, the results of the data analysis as presented in Appendix J: Quality of the
Information Data Analysis, prove to have a range value of 3 for all the constructs. Even though
the range value is high, the data is still valid according to Prof. Daan Nel because the constructs
all have an equal range value.
Figure 17: Pareto Analysis of the Items Influencing the Quality Level of the Information Most
After identifying the elements that does not meet the expected quality level, a Pareto analysis is
performed. The results are presented in Appendix J and in Figure 17 above. Consequently, the
3.413.68
3.36 3.41 3.19
3.95
1
1.5
2
2.5
3
3.5
4
4.5
5
Precision Availability Relevance Reliability Comprehensiveness Security
Qu
ali
ty L
ev
el
Expected vs. Observed Quality of the Information
Expected
Observed
Low
High
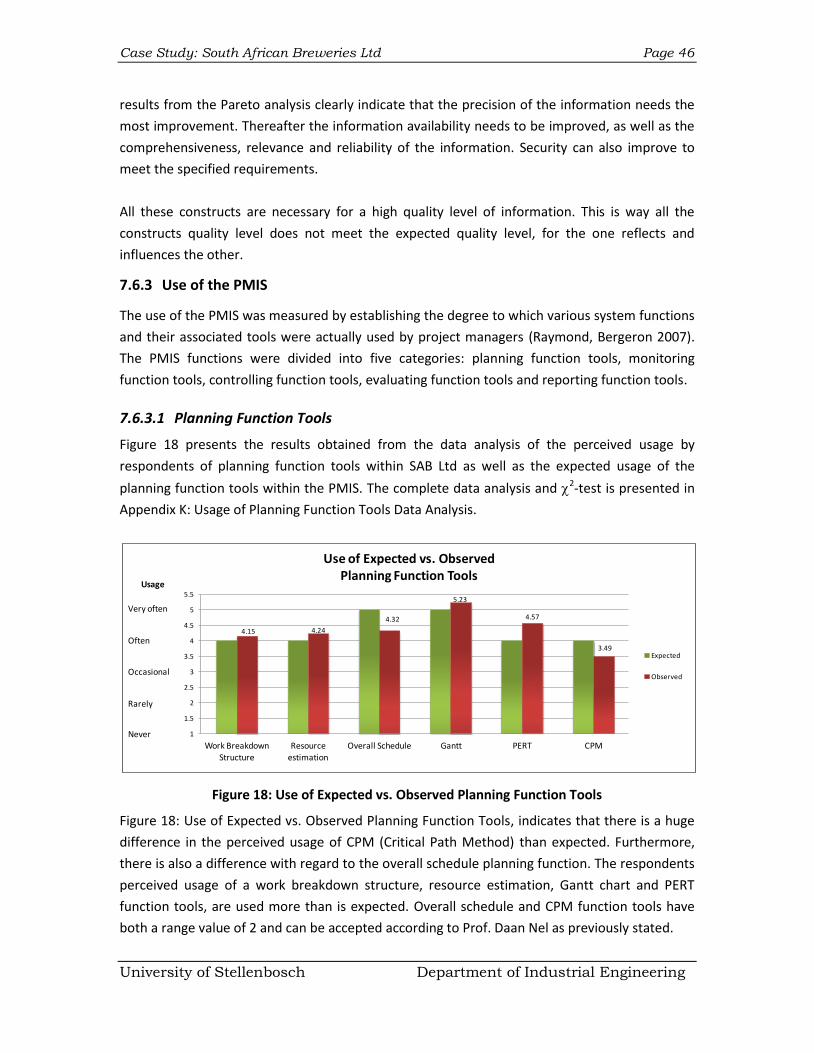
Case Study: South African Breweries Ltd Page 46
University of Stellenbosch Department of Industrial Engineering
results from the Pareto analysis clearly indicate that the precision of the information needs the
most improvement. Thereafter the information availability needs to be improved, as well as the
comprehensiveness, relevance and reliability of the information. Security can also improve to
meet the specified requirements.
All these constructs are necessary for a high quality level of information. This is way all the
constructs quality level does not meet the expected quality level, for the one reflects and
influences the other.
7.6.3 Use of the PMIS
The use of the PMIS was measured by establishing the degree to which various system functions
and their associated tools were actually used by project managers (Raymond, Bergeron 2007).
The PMIS functions were divided into five categories: planning function tools, monitoring
function tools, controlling function tools, evaluating function tools and reporting function tools.
7.6.3.1 Planning Function Tools
Figure 18 presents the results obtained from the data analysis of the perceived usage by
respondents of planning function tools within SAB Ltd as well as the expected usage of the
planning function tools within the PMIS. The complete data analysis and 2-test is presented in
Appendix K: Usage of Planning Function Tools Data Analysis.
Figure 18: Use of Expected vs. Observed Planning Function Tools
Figure 18: Use of Expected vs. Observed Planning Function Tools, indicates that there is a huge
difference in the perceived usage of CPM (Critical Path Method) than expected. Furthermore,
there is also a difference with regard to the overall schedule planning function. The respondents
perceived usage of a work breakdown structure, resource estimation, Gantt chart and PERT
function tools, are used more than is expected. Overall schedule and CPM function tools have
both a range value of 2 and can be accepted according to Prof. Daan Nel as previously stated.
4.15 4.24
4.32
5.23
4.57
3.49
1
1.5
2
2.5
3
3.5
4
4.5
5
5.5
Work Breakdown
Structure
Resource
estimation
Overall Schedule Gantt PERT CPM
Usage
Use of Expected vs. Observed Planning Function Tools
Expected
Observed
Very often
Occasional
Rarely
Never
Often
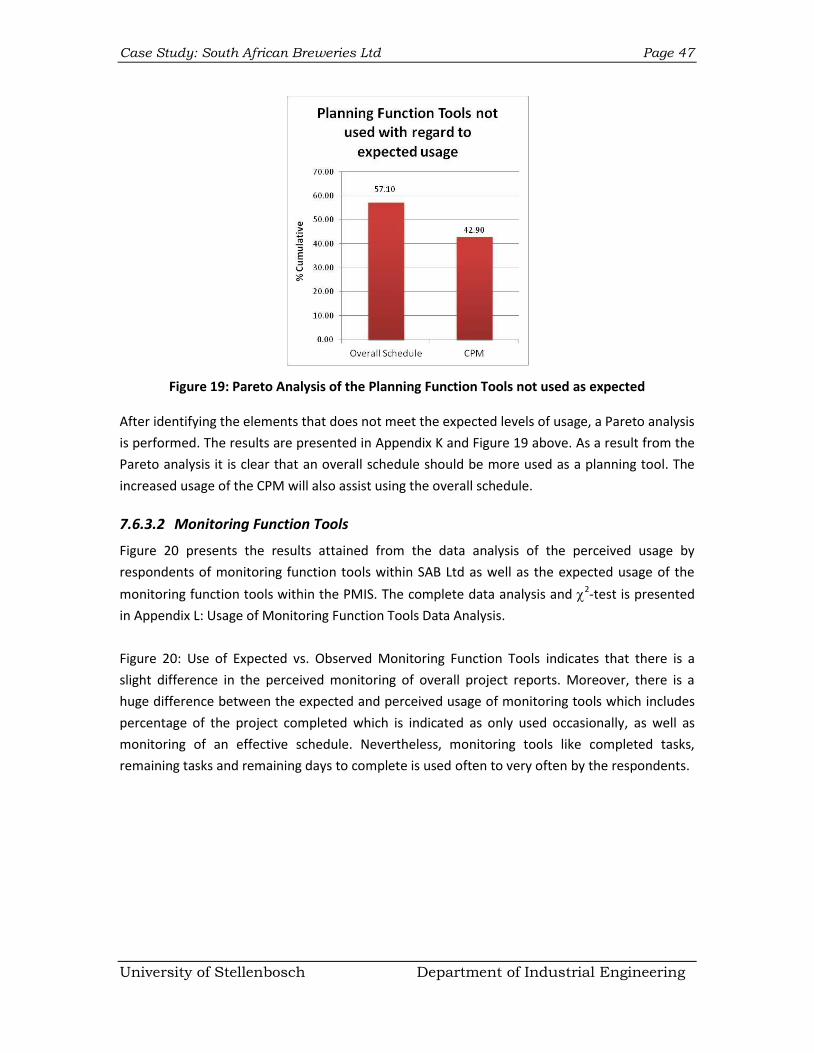
Case Study: South African Breweries Ltd Page 47
University of Stellenbosch Department of Industrial Engineering
Figure 19: Pareto Analysis of the Planning Function Tools not used as expected
After identifying the elements that does not meet the expected levels of usage, a Pareto analysis
is performed. The results are presented in Appendix K and Figure 19 above. As a result from the
Pareto analysis it is clear that an overall schedule should be more used as a planning tool. The
increased usage of the CPM will also assist using the overall schedule.
7.6.3.2 Monitoring Function Tools
Figure 20 presents the results attained from the data analysis of the perceived usage by
respondents of monitoring function tools within SAB Ltd as well as the expected usage of the
monitoring function tools within the PMIS. The complete data analysis and 2-test is presented
in Appendix L: Usage of Monitoring Function Tools Data Analysis.
Figure 20: Use of Expected vs. Observed Monitoring Function Tools indicates that there is a
slight difference in the perceived monitoring of overall project reports. Moreover, there is a
huge difference between the expected and perceived usage of monitoring tools which includes
percentage of the project completed which is indicated as only used occasionally, as well as
monitoring of an effective schedule. Nevertheless, monitoring tools like completed tasks,
remaining tasks and remaining days to complete is used often to very often by the respondents.
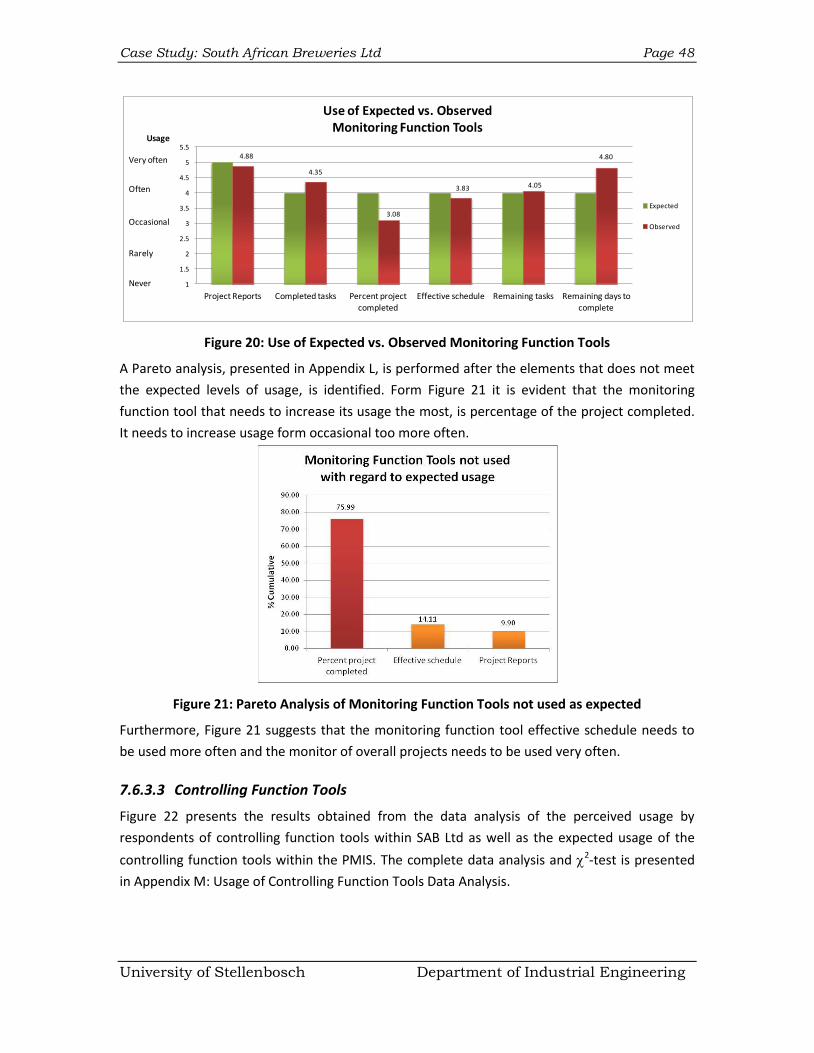
Case Study: South African Breweries Ltd Page 48
University of Stellenbosch Department of Industrial Engineering
Figure 20: Use of Expected vs. Observed Monitoring Function Tools
A Pareto analysis, presented in Appendix L, is performed after the elements that does not meet
the expected levels of usage, is identified. Form Figure 21 it is evident that the monitoring
function tool that needs to increase its usage the most, is percentage of the project completed.
It needs to increase usage form occasional too more often.
Figure 21: Pareto Analysis of Monitoring Function Tools not used as expected
Furthermore, Figure 21 suggests that the monitoring function tool effective schedule needs to
be used more often and the monitor of overall projects needs to be used very often.
7.6.3.3 Controlling Function Tools
Figure 22 presents the results obtained from the data analysis of the perceived usage by
respondents of controlling function tools within SAB Ltd as well as the expected usage of the
controlling function tools within the PMIS. The complete data analysis and 2-test is presented
in Appendix M: Usage of Controlling Function Tools Data Analysis.
4.88
4.35
3.08
3.83 4.05
4.80
1
1.5
2
2.5
3
3.5
4
4.5
5
5.5
Project Reports Completed tasks Percent project completed
Effective schedule Remaining tasks Remaining days to complete
Usage
Use of Expected vs. Observed Monitoring Function Tools
Expected
Observed
Very often
Occasional
Rarely
Never
Often
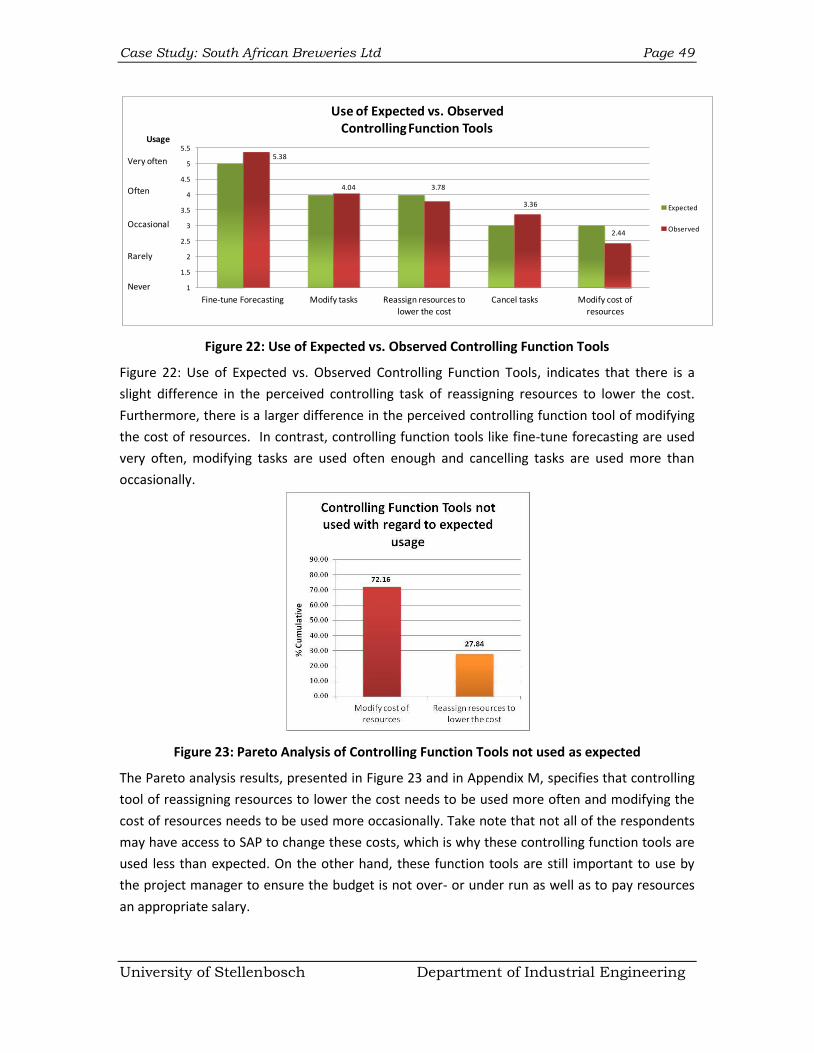
Case Study: South African Breweries Ltd Page 49
University of Stellenbosch Department of Industrial Engineering
Figure 22: Use of Expected vs. Observed Controlling Function Tools
Figure 22: Use of Expected vs. Observed Controlling Function Tools, indicates that there is a
slight difference in the perceived controlling task of reassigning resources to lower the cost.
Furthermore, there is a larger difference in the perceived controlling function tool of modifying
the cost of resources. In contrast, controlling function tools like fine-tune forecasting are used
very often, modifying tasks are used often enough and cancelling tasks are used more than
occasionally.
Figure 23: Pareto Analysis of Controlling Function Tools not used as expected
The Pareto analysis results, presented in Figure 23 and in Appendix M, specifies that controlling
tool of reassigning resources to lower the cost needs to be used more often and modifying the
cost of resources needs to be used more occasionally. Take note that not all of the respondents
may have access to SAP to change these costs, which is why these controlling function tools are
used less than expected. On the other hand, these function tools are still important to use by
the project manager to ensure the budget is not over- or under run as well as to pay resources
an appropriate salary.
5.38
4.04 3.78
3.36
2.44
1
1.5
2
2.5
3
3.5
4
4.5
5
5.5
Fine-tune Forecasting Modify tasks Reassign resources to
lower the cost
Cancel tasks Modify cost of
resources
Usage
Use of Expected vs. Observed Controlling Function Tools
Expected
Observed
Very often
Occasional
Rarely
Never
Often
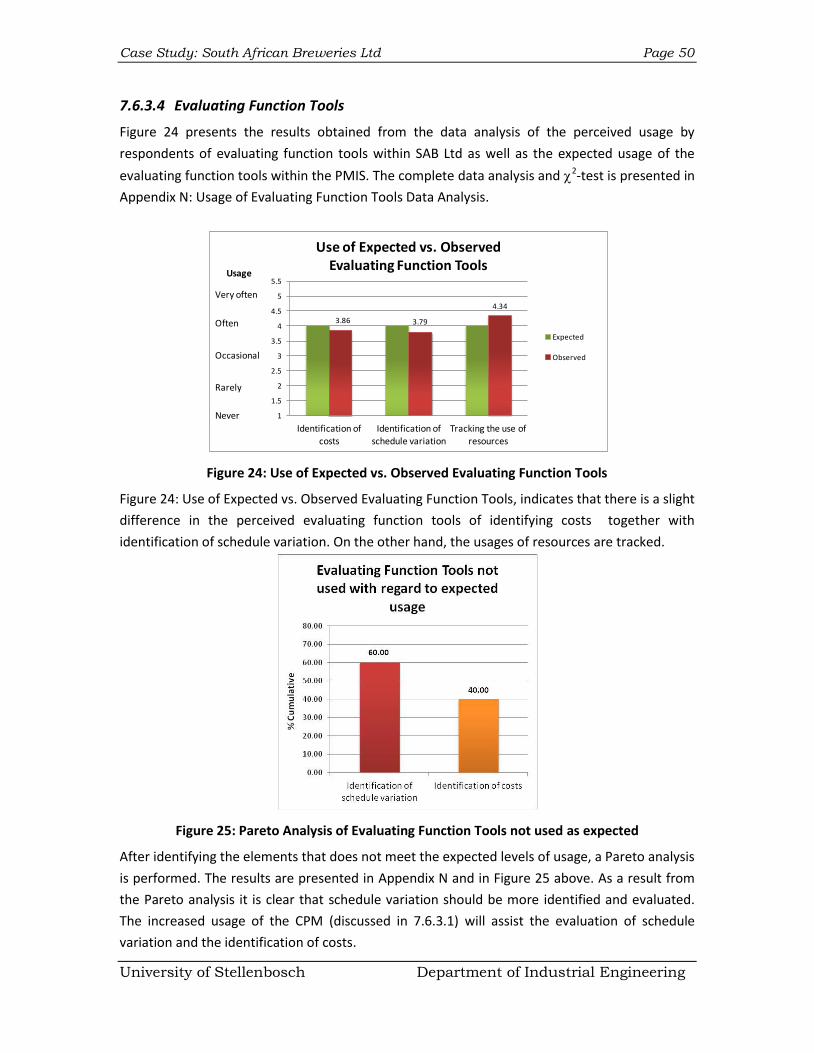
Case Study: South African Breweries Ltd Page 50
University of Stellenbosch Department of Industrial Engineering
7.6.3.4 Evaluating Function Tools
Figure 24 presents the results obtained from the data analysis of the perceived usage by
respondents of evaluating function tools within SAB Ltd as well as the expected usage of the
evaluating function tools within the PMIS. The complete data analysis and 2-test is presented in
Appendix N: Usage of Evaluating Function Tools Data Analysis.
Figure 24: Use of Expected vs. Observed Evaluating Function Tools
Figure 24: Use of Expected vs. Observed Evaluating Function Tools, indicates that there is a slight
difference in the perceived evaluating function tools of identifying costs together with
identification of schedule variation. On the other hand, the usages of resources are tracked.
Figure 25: Pareto Analysis of Evaluating Function Tools not used as expected
After identifying the elements that does not meet the expected levels of usage, a Pareto analysis
is performed. The results are presented in Appendix N and in Figure 25 above. As a result from
the Pareto analysis it is clear that schedule variation should be more identified and evaluated.
The increased usage of the CPM (discussed in 7.6.3.1) will assist the evaluation of schedule
variation and the identification of costs.
3.86 3.79
4.34
1
1.5
2
2.5
3
3.5
4
4.5
5
5.5
Identification of
costsIdentification of
schedule variationTracking the use of
resources
Usage
Use of Expected vs. Observed Evaluating Function Tools
Expected
Observed
Very often
Rarely
Never
Often
Occasional
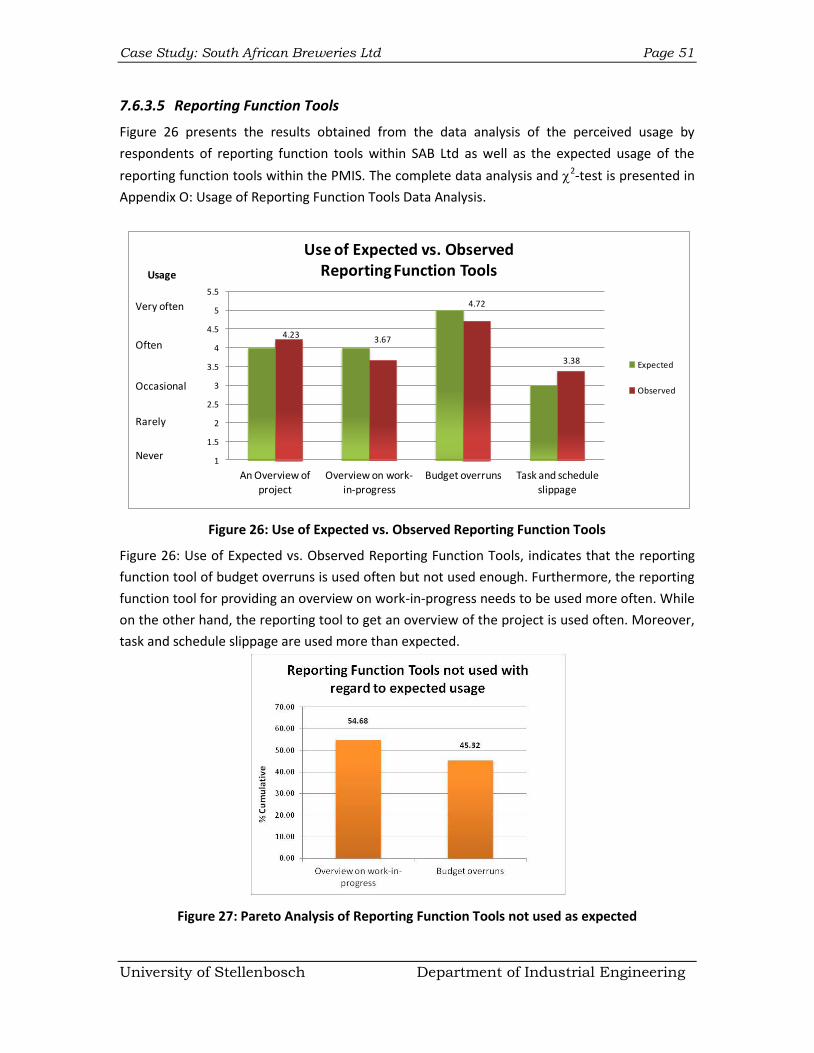
Case Study: South African Breweries Ltd Page 51
University of Stellenbosch Department of Industrial Engineering
7.6.3.5 Reporting Function Tools
Figure 26 presents the results obtained from the data analysis of the perceived usage by
respondents of reporting function tools within SAB Ltd as well as the expected usage of the
reporting function tools within the PMIS. The complete data analysis and 2-test is presented in
Appendix O: Usage of Reporting Function Tools Data Analysis.
Figure 26: Use of Expected vs. Observed Reporting Function Tools
Figure 26: Use of Expected vs. Observed Reporting Function Tools, indicates that the reporting
function tool of budget overruns is used often but not used enough. Furthermore, the reporting
function tool for providing an overview on work-in-progress needs to be used more often. While
on the other hand, the reporting tool to get an overview of the project is used often. Moreover,
task and schedule slippage are used more than expected.
Figure 27: Pareto Analysis of Reporting Function Tools not used as expected
4.233.67
4.72
3.38
1
1.5
2
2.5
3
3.5
4
4.5
5
5.5
An Overview of
project
Overview on work-
in-progress
Budget overruns Task and schedule
slippage
Usage
Use of Expected vs. Observed Reporting Function Tools
Expected
Observed
Very often
Occasional
Rarely
Never
Often
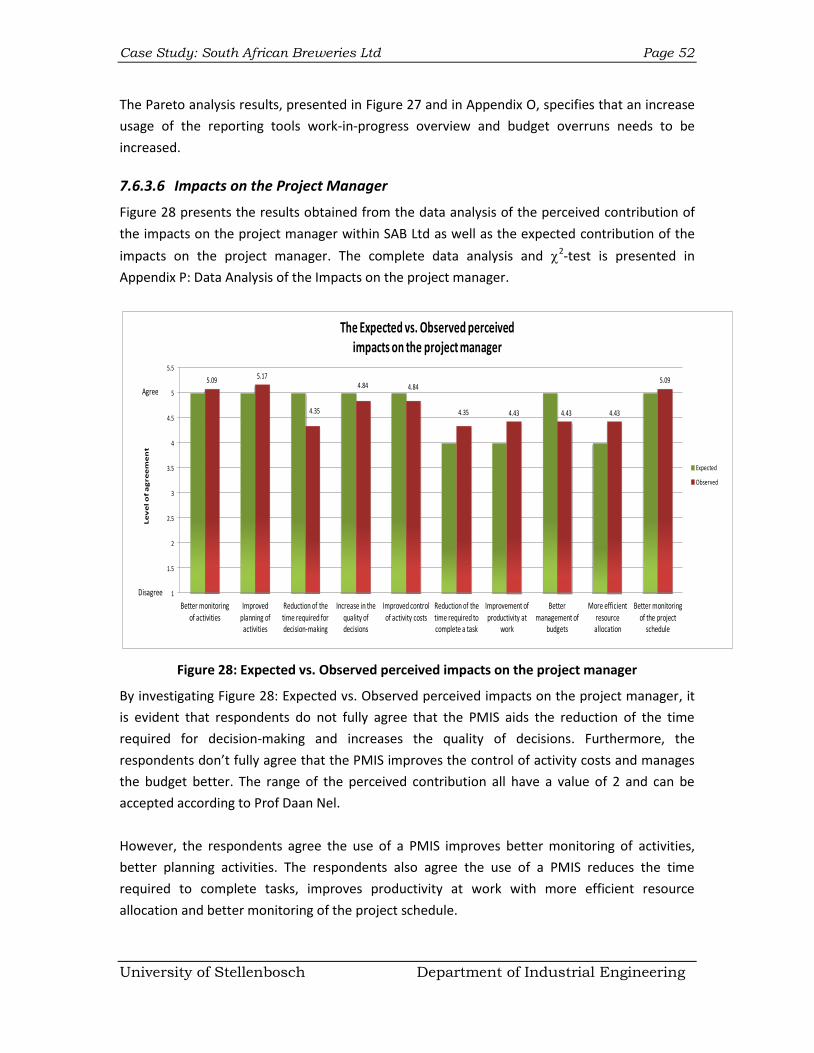
Case Study: South African Breweries Ltd Page 52
University of Stellenbosch Department of Industrial Engineering
The Pareto analysis results, presented in Figure 27 and in Appendix O, specifies that an increase
usage of the reporting tools work-in-progress overview and budget overruns needs to be
increased.
7.6.3.6 Impacts on the Project Manager
Figure 28 presents the results obtained from the data analysis of the perceived contribution of
the impacts on the project manager within SAB Ltd as well as the expected contribution of the
impacts on the project manager. The complete data analysis and 2-test is presented in
Appendix P: Data Analysis of the Impacts on the project manager.
Figure 28: Expected vs. Observed perceived impacts on the project manager
By investigating Figure 28: Expected vs. Observed perceived impacts on the project manager, it
is evident that respondents do not fully agree that the PMIS aids the reduction of the time
required for decision-making and increases the quality of decisions. Furthermore, the
respondents don’t fully agree that the PMIS improves the control of activity costs and manages
the budget better. The range of the perceived contribution all have a value of 2 and can be
accepted according to Prof Daan Nel.
However, the respondents agree the use of a PMIS improves better monitoring of activities,
better planning activities. The respondents also agree the use of a PMIS reduces the time
required to complete tasks, improves productivity at work with more efficient resource
allocation and better monitoring of the project schedule.
5.09 5.17
4.35
4.84 4.84
4.35 4.43 4.43 4.43
5.09
1
1.5
2
2.5
3
3.5
4
4.5
5
5.5
Better monitoring
of activitiesImproved
planning of activities
Reduction of the
time required for decision-making
Increase in the
quality of decisions
Improved control
of activity costsReduction of the
time required to complete a task
Improvement of
productivity at work
Better
management of budgets
More efficient
resource allocation
Better monitoring
of the project schedule
Le
ve
l o
f a
gre
em
en
t
The Expected vs. Observed perceivedimpacts on the project manager
Expected
Observed
Agree
Disagree
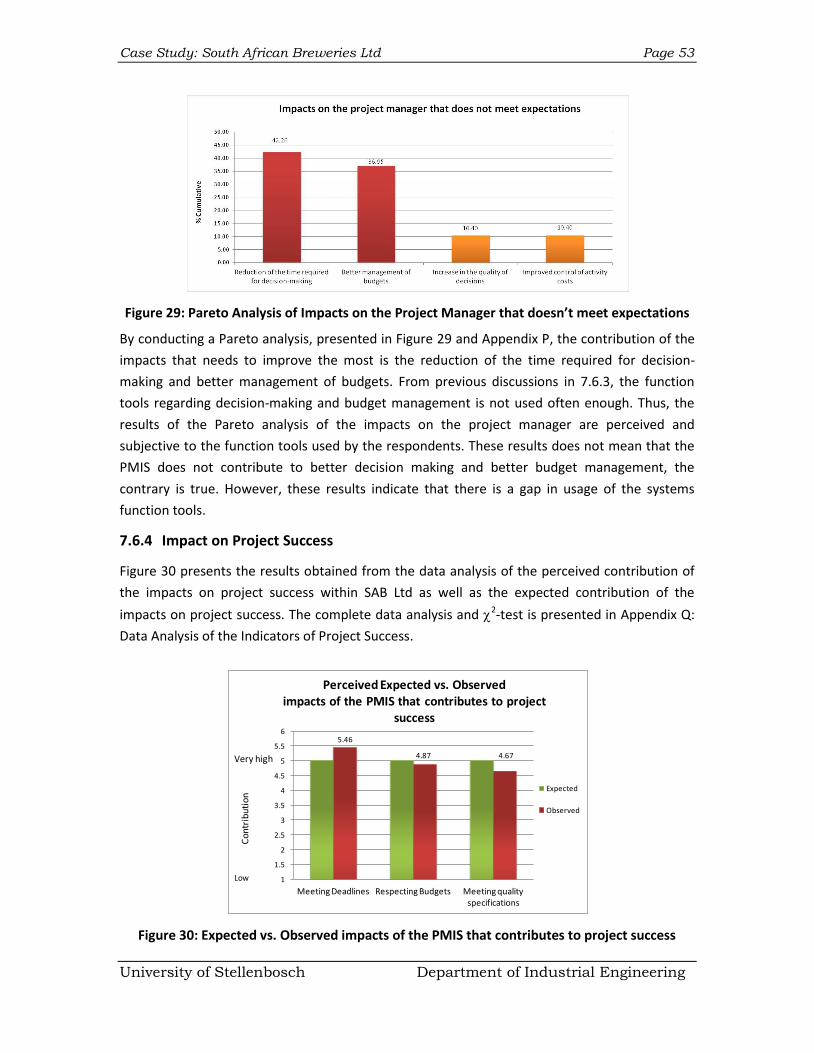
Case Study: South African Breweries Ltd Page 53
University of Stellenbosch Department of Industrial Engineering
Figure 29: Pareto Analysis of Impacts on the Project Manager that doesn’t meet expectations
By conducting a Pareto analysis, presented in Figure 29 and Appendix P, the contribution of the
impacts that needs to improve the most is the reduction of the time required for decision-
making and better management of budgets. From previous discussions in 7.6.3, the function
tools regarding decision-making and budget management is not used often enough. Thus, the
results of the Pareto analysis of the impacts on the project manager are perceived and
subjective to the function tools used by the respondents. These results does not mean that the
PMIS does not contribute to better decision making and better budget management, the
contrary is true. However, these results indicate that there is a gap in usage of the systems
function tools.
7.6.4 Impact on Project Success
Figure 30 presents the results obtained from the data analysis of the perceived contribution of
the impacts on project success within SAB Ltd as well as the expected contribution of the
impacts on project success. The complete data analysis and 2-test is presented in Appendix Q:
Data Analysis of the Indicators of Project Success.
Figure 30: Expected vs. Observed impacts of the PMIS that contributes to project success
5.46
4.87 4.67
1
1.5
2
2.5
3
3.5
4
4.5
5
5.5
6
Meeting Deadlines Respecting Budgets Meeting quality specifications
Co
ntr
ibu
tio
n
Perceived Expected vs. Observed impacts of the PMIS that contributes to project
success
Expected
Observed
Very high
Low
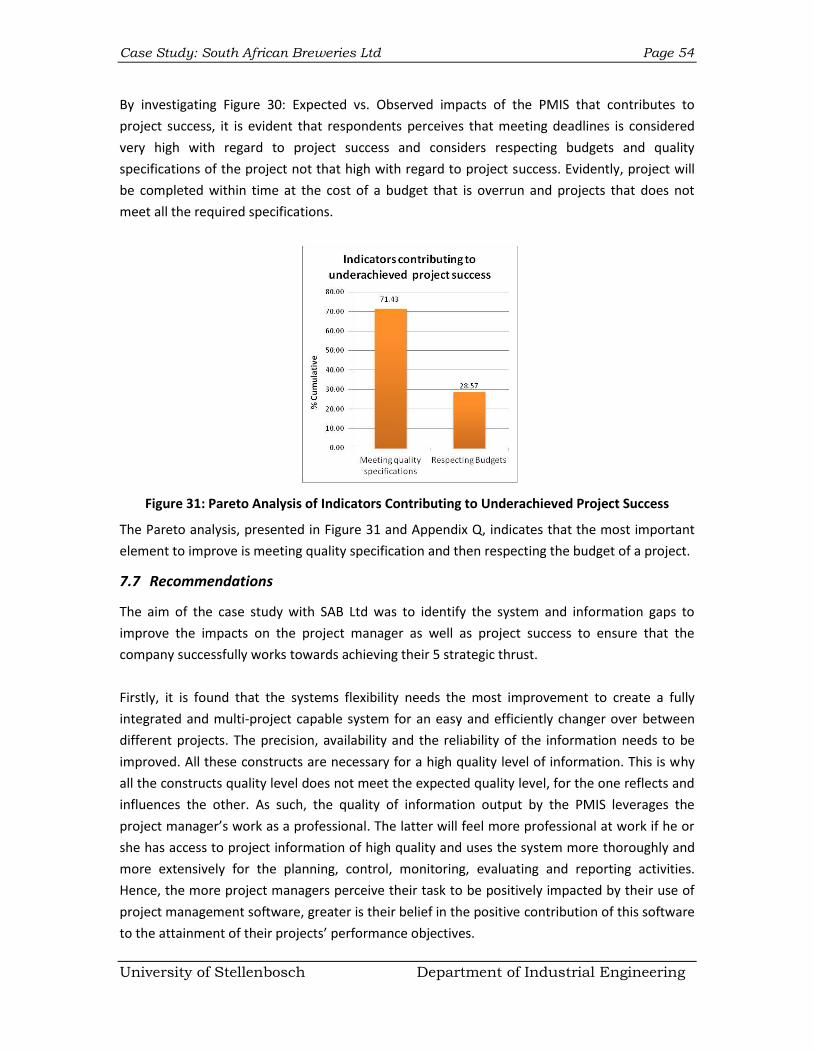
Case Study: South African Breweries Ltd Page 54
University of Stellenbosch Department of Industrial Engineering
By investigating Figure 30: Expected vs. Observed impacts of the PMIS that contributes to
project success, it is evident that respondents perceives that meeting deadlines is considered
very high with regard to project success and considers respecting budgets and quality
specifications of the project not that high with regard to project success. Evidently, project will
be completed within time at the cost of a budget that is overrun and projects that does not
meet all the required specifications.
Figure 31: Pareto Analysis of Indicators Contributing to Underachieved Project Success
The Pareto analysis, presented in Figure 31 and Appendix Q, indicates that the most important
element to improve is meeting quality specification and then respecting the budget of a project.
7.7 Recommendations
The aim of the case study with SAB Ltd was to identify the system and information gaps to
improve the impacts on the project manager as well as project success to ensure that the
company successfully works towards achieving their 5 strategic thrust.
Firstly, it is found that the systems flexibility needs the most improvement to create a fully
integrated and multi-project capable system for an easy and efficiently changer over between
different projects. The precision, availability and the reliability of the information needs to be
improved. All these constructs are necessary for a high quality level of information. This is why
all the constructs quality level does not meet the expected quality level, for the one reflects and
influences the other. As such, the quality of information output by the PMIS leverages the
project manager’s work as a professional. The latter will feel more professional at work if he or
she has access to project information of high quality and uses the system more thoroughly and
more extensively for the planning, control, monitoring, evaluating and reporting activities.
Hence, the more project managers perceive their task to be positively impacted by their use of
project management software, greater is their belief in the positive contribution of this software
to the attainment of their projects’ performance objectives.
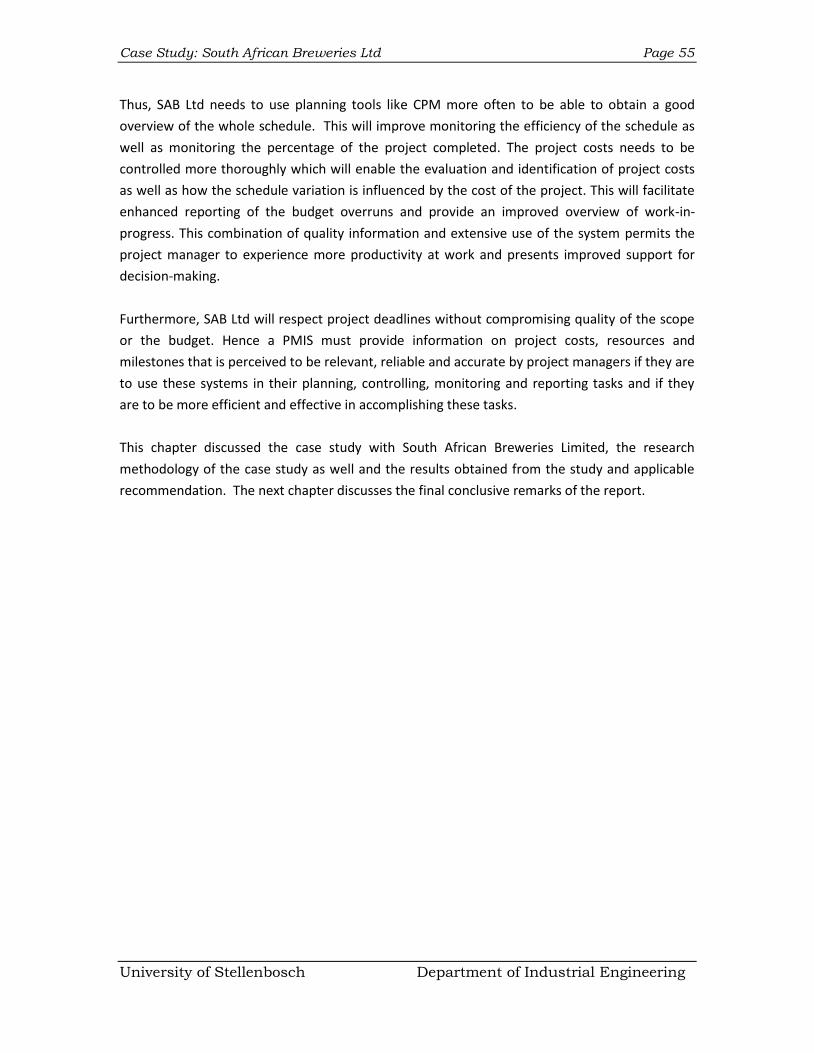
Case Study: South African Breweries Ltd Page 55
University of Stellenbosch Department of Industrial Engineering
Thus, SAB Ltd needs to use planning tools like CPM more often to be able to obtain a good
overview of the whole schedule. This will improve monitoring the efficiency of the schedule as
well as monitoring the percentage of the project completed. The project costs needs to be
controlled more thoroughly which will enable the evaluation and identification of project costs
as well as how the schedule variation is influenced by the cost of the project. This will facilitate
enhanced reporting of the budget overruns and provide an improved overview of work-in-
progress. This combination of quality information and extensive use of the system permits the
project manager to experience more productivity at work and presents improved support for
decision-making.
Furthermore, SAB Ltd will respect project deadlines without compromising quality of the scope
or the budget. Hence a PMIS must provide information on project costs, resources and
milestones that is perceived to be relevant, reliable and accurate by project managers if they are
to use these systems in their planning, controlling, monitoring and reporting tasks and if they
are to be more efficient and effective in accomplishing these tasks.
This chapter discussed the case study with South African Breweries Limited, the research
methodology of the case study as well and the results obtained from the study and applicable
recommendation. The next chapter discusses the final conclusive remarks of the report.
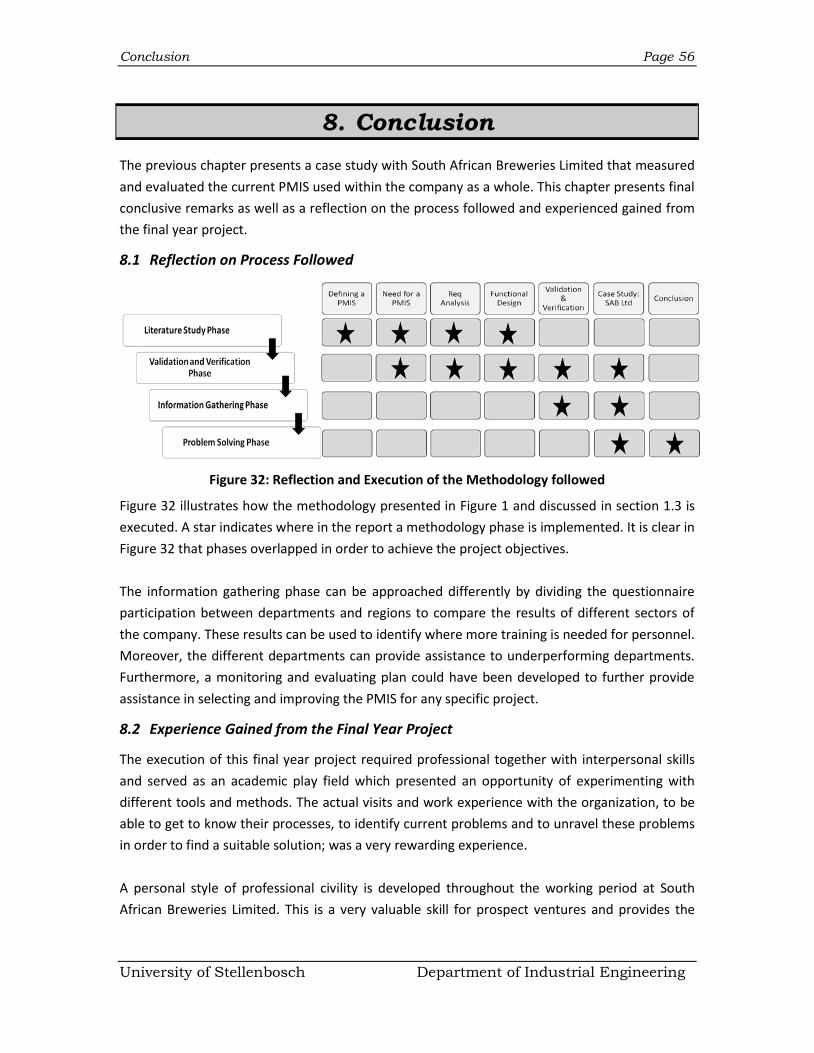
Conclusion Page 56
University of Stellenbosch Department of Industrial Engineering
8. Conclusion
The previous chapter presents a case study with South African Breweries Limited that measured
and evaluated the current PMIS used within the company as a whole. This chapter presents final
conclusive remarks as well as a reflection on the process followed and experienced gained from
the final year project.
8.1 Reflection on Process Followed
Figure 32: Reflection and Execution of the Methodology followed
Figure 32 illustrates how the methodology presented in Figure 1 and discussed in section 1.3 is
executed. A star indicates where in the report a methodology phase is implemented. It is clear in
Figure 32 that phases overlapped in order to achieve the project objectives.
The information gathering phase can be approached differently by dividing the questionnaire
participation between departments and regions to compare the results of different sectors of
the company. These results can be used to identify where more training is needed for personnel.
Moreover, the different departments can provide assistance to underperforming departments.
Furthermore, a monitoring and evaluating plan could have been developed to further provide
assistance in selecting and improving the PMIS for any specific project.
8.2 Experience Gained from the Final Year Project
The execution of this final year project required professional together with interpersonal skills
and served as an academic play field which presented an opportunity of experimenting with
different tools and methods. The actual visits and work experience with the organization, to be
able to get to know their processes, to identify current problems and to unravel these problems
in order to find a suitable solution; was a very rewarding experience.
A personal style of professional civility is developed throughout the working period at South
African Breweries Limited. This is a very valuable skill for prospect ventures and provides the
Conclusion Page 57
University of Stellenbosch Department of Industrial Engineering
student with the benefit to be independent on a professional level. Through the writing of this
report, professionalism in written communication is gained as well.
Time management played a huge role throughout this project. To deal with other modules, tests
as well as other group projects management of time was fundamental to reserve the required
time for this individual project. The importance of consistent documentation of work completed
is also grasped. Documentation eased the phases of the project and guaranteed that repetition
is avoided. Furthermore, the significance of careful planning was grasped. Planning saved a lot of
time throughout the project.
As an industrial engineering student, the student is attentive that the implementation of this
project may have a positive and constructive impact on the organization by improving the usage
of a PMIS. By the use of a Root Cause Analysis approach for effective problem solving identifies
the root causes of the information- and system problems, not just the symptoms. Although it is
a small contribution, every small change contributes towards a bigger result.
One of the most important lessons learnt is to take ownership of a project that is entirely one's
own, to be autonomous and independent and to embrace the uncertainties as a challenge
rather than a threat. Furthermore, to be focus orientated on the result in order to deliver an
accurate solution in a professional and satisfied manner.
8.3 General Conclusion
The research aim of this study was to investigate the functional design of a project management
information system. More specifically, one objective was to identify the main determinants of
PMIS.
Following the conclusions of previous research that PMIS success models should continue to be
validated and challenged, the results of this research show that the use of a project
management information system is in fact advantageous to project managers. Improvements in
effectiveness and efficiency in managerial tasks were observed here in terms of better project
planning, scheduling, monitoring, and control. Improvements in productivity were also observed
in terms of timelier decision-making. Advantages obtained from PMIS use are not limited to
individual performance but also include project performance. These systems were found to have
direct impacts on project success, as they contribute to improving budget control and meeting
project deadlines as well as fulfilling technical specifications. One can therefore conclude that
PMIS make a significant contribution to project success and should continue to be the object of
project management research.
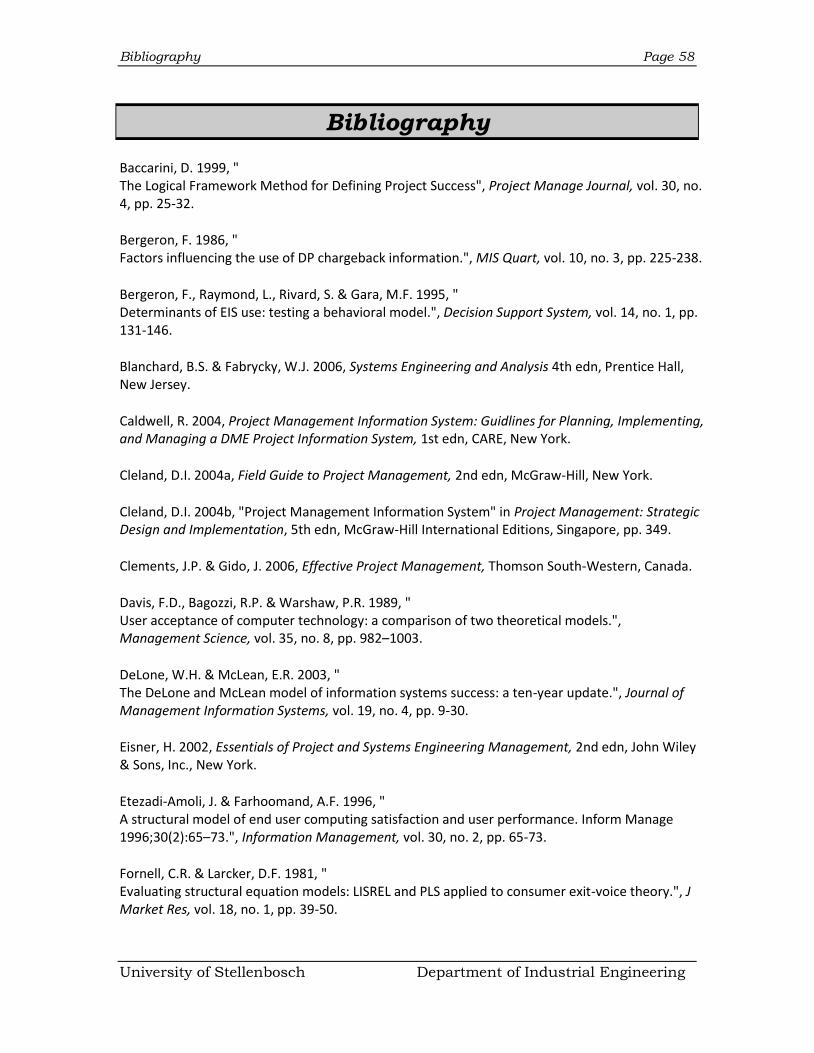
Bibliography Page 58
University of Stellenbosch Department of Industrial Engineering
Bibliography
Baccarini, D. 1999, " The Logical Framework Method for Defining Project Success", Project Manage Journal, vol. 30, no. 4, pp. 25-32.
Bergeron, F. 1986, " Factors influencing the use of DP chargeback information.", MIS Quart, vol. 10, no. 3, pp. 225-238.
Bergeron, F., Raymond, L., Rivard, S. & Gara, M.F. 1995, " Determinants of EIS use: testing a behavioral model.", Decision Support System, vol. 14, no. 1, pp. 131-146.
Blanchard, B.S. & Fabrycky, W.J. 2006, Systems Engineering and Analysis 4th edn, Prentice Hall, New Jersey.
Caldwell, R. 2004, Project Management Information System: Guidlines for Planning, Implementing, and Managing a DME Project Information System, 1st edn, CARE, New York.
Cleland, D.I. 2004a, Field Guide to Project Management, 2nd edn, McGraw-Hill, New York.
Cleland, D.I. 2004b, "Project Management Information System" in Project Management: Strategic Design and Implementation, 5th edn, McGraw-Hill International Editions, Singapore, pp. 349.
Clements, J.P. & Gido, J. 2006, Effective Project Management, Thomson South-Western, Canada.
Davis, F.D., Bagozzi, R.P. & Warshaw, P.R. 1989, " User acceptance of computer technology: a comparison of two theoretical models.", Management Science, vol. 35, no. 8, pp. 982–1003.
DeLone, W.H. & McLean, E.R. 2003, " The DeLone and McLean model of information systems success: a ten-year update.", Journal of Management Information Systems, vol. 19, no. 4, pp. 9-30.
Eisner, H. 2002, Essentials of Project and Systems Engineering Management, 2nd edn, John Wiley & Sons, Inc., New York.
Etezadi-Amoli, J. & Farhoomand, A.F. 1996, " A structural model of end user computing satisfaction and user performance. Inform Manage 1996;30(2):65–73.", Information Management, vol. 30, no. 2, pp. 65-73.
Fornell, C.R. & Larcker, D.F. 1981, " Evaluating structural equation models: LISREL and PLS applied to consumer exit-voice theory.", J Market Res, vol. 18, no. 1, pp. 39-50.
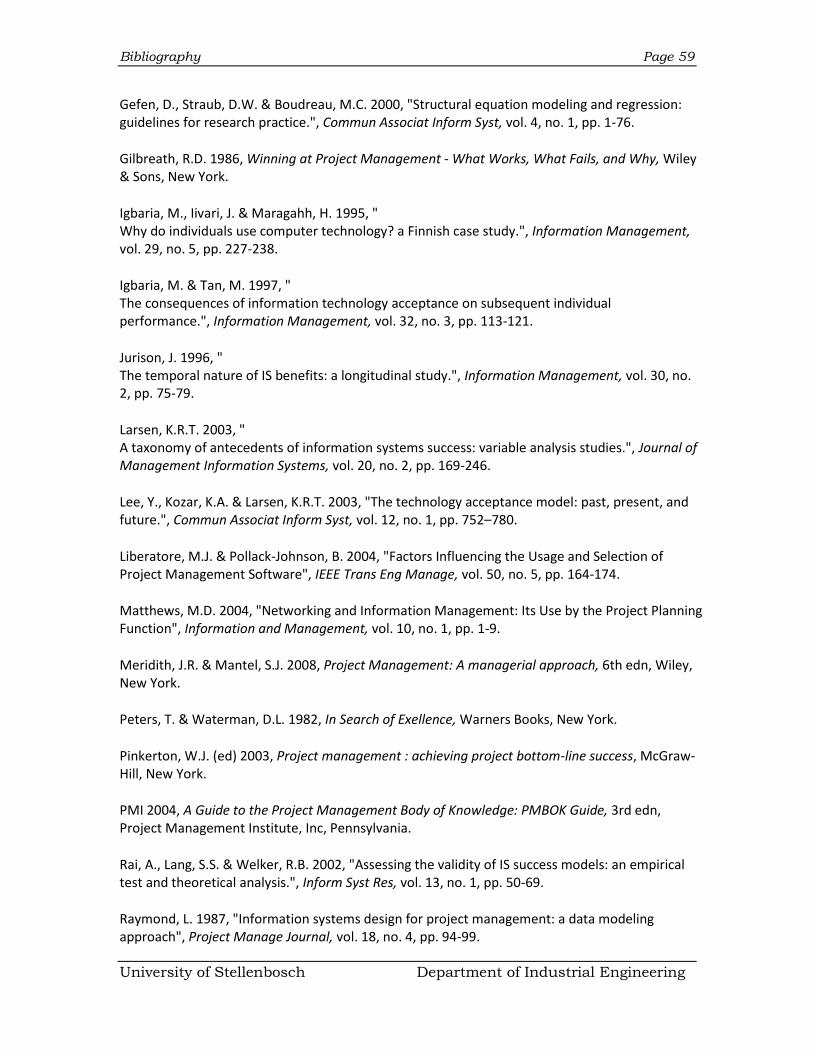
Bibliography Page 59
University of Stellenbosch Department of Industrial Engineering
Gefen, D., Straub, D.W. & Boudreau, M.C. 2000, "Structural equation modeling and regression: guidelines for research practice.", Commun Associat Inform Syst, vol. 4, no. 1, pp. 1-76.
Gilbreath, R.D. 1986, Winning at Project Management - What Works, What Fails, and Why, Wiley & Sons, New York.
Igbaria, M., Iivari, J. & Maragahh, H. 1995, " Why do individuals use computer technology? a Finnish case study.", Information Management, vol. 29, no. 5, pp. 227-238.
Igbaria, M. & Tan, M. 1997, " The consequences of information technology acceptance on subsequent individual performance.", Information Management, vol. 32, no. 3, pp. 113-121.
Jurison, J. 1996, " The temporal nature of IS benefits: a longitudinal study.", Information Management, vol. 30, no. 2, pp. 75-79.
Larsen, K.R.T. 2003, " A taxonomy of antecedents of information systems success: variable analysis studies.", Journal of Management Information Systems, vol. 20, no. 2, pp. 169-246.
Lee, Y., Kozar, K.A. & Larsen, K.R.T. 2003, "The technology acceptance model: past, present, and future.", Commun Associat Inform Syst, vol. 12, no. 1, pp. 752–780.
Liberatore, M.J. & Pollack-Johnson, B. 2004, "Factors Influencing the Usage and Selection of Project Management Software", IEEE Trans Eng Manage, vol. 50, no. 5, pp. 164-174.
Matthews, M.D. 2004, "Networking and Information Management: Its Use by the Project Planning Function", Information and Management, vol. 10, no. 1, pp. 1-9.
Meridith, J.R. & Mantel, S.J. 2008, Project Management: A managerial approach, 6th edn, Wiley, New York.
Peters, T. & Waterman, D.L. 1982, In Search of Exellence, Warners Books, New York.
Pinkerton, W.J. (ed) 2003, Project management : achieving project bottom-line success, McGraw-Hill, New York.
PMI 2004, A Guide to the Project Management Body of Knowledge: PMBOK Guide, 3rd edn, Project Management Institute, Inc, Pennsylvania.
Rai, A., Lang, S.S. & Welker, R.B. 2002, "Assessing the validity of IS success models: an empirical test and theoretical analysis.", Inform Syst Res, vol. 13, no. 1, pp. 50-69.
Raymond, L. 1987, "Information systems design for project management: a data modeling approach", Project Manage Journal, vol. 18, no. 4, pp. 94-99.
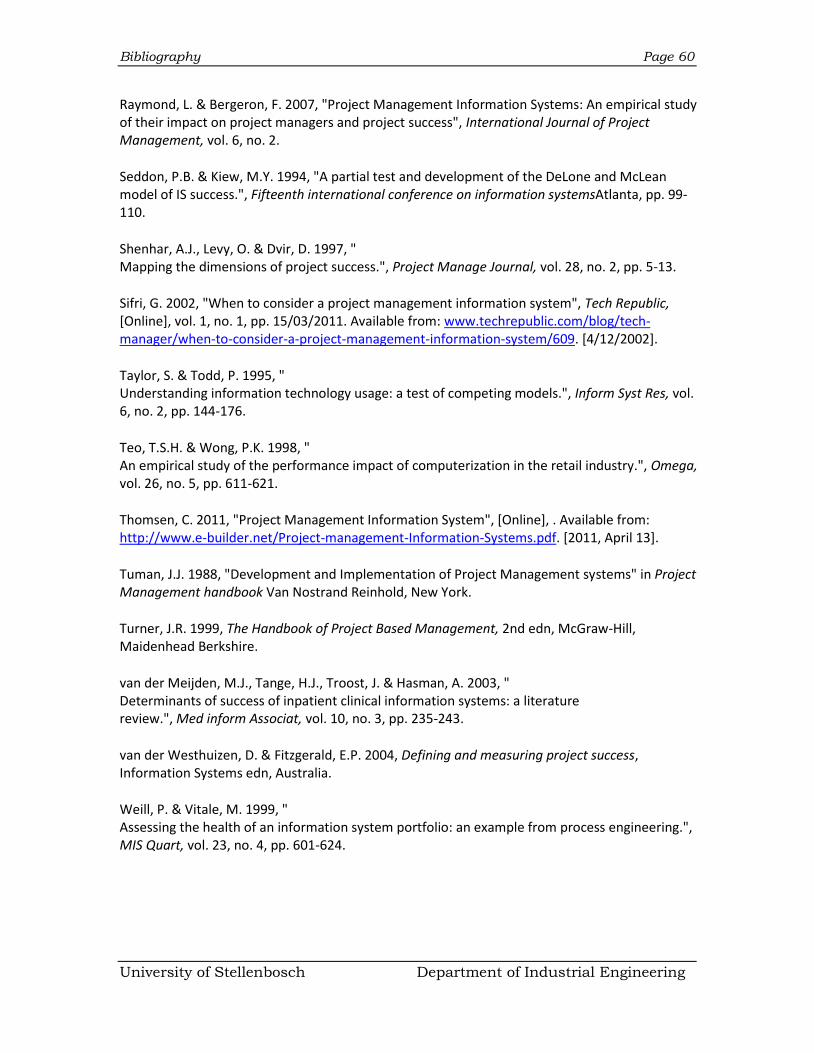
Bibliography Page 60
University of Stellenbosch Department of Industrial Engineering
Raymond, L. & Bergeron, F. 2007, "Project Management Information Systems: An empirical study of their impact on project managers and project success", International Journal of Project Management, vol. 6, no. 2.
Seddon, P.B. & Kiew, M.Y. 1994, "A partial test and development of the DeLone and McLean model of IS success.", Fifteenth international conference on information systemsAtlanta, pp. 99-110.
Shenhar, A.J., Levy, O. & Dvir, D. 1997, " Mapping the dimensions of project success.", Project Manage Journal, vol. 28, no. 2, pp. 5-13.
Sifri, G. 2002, "When to consider a project management information system", Tech Republic, [Online], vol. 1, no. 1, pp. 15/03/2011. Available from: www.techrepublic.com/blog/tech-manager/when-to-consider-a-project-management-information-system/609. [4/12/2002].
Taylor, S. & Todd, P. 1995, " Understanding information technology usage: a test of competing models.", Inform Syst Res, vol. 6, no. 2, pp. 144-176.
Teo, T.S.H. & Wong, P.K. 1998, " An empirical study of the performance impact of computerization in the retail industry.", Omega, vol. 26, no. 5, pp. 611-621.
Thomsen, C. 2011, "Project Management Information System", [Online], . Available from: http://www.e-builder.net/Project-management-Information-Systems.pdf. [2011, April 13].
Tuman, J.J. 1988, "Development and Implementation of Project Management systems" in Project Management handbook Van Nostrand Reinhold, New York.
Turner, J.R. 1999, The Handbook of Project Based Management, 2nd edn, McGraw-Hill, Maidenhead Berkshire.
van der Meijden, M.J., Tange, H.J., Troost, J. & Hasman, A. 2003, " Determinants of success of inpatient clinical information systems: a literature review.", Med inform Associat, vol. 10, no. 3, pp. 235-243.
van der Westhuizen, D. & Fitzgerald, E.P. 2004, Defining and measuring project success, Information Systems edn, Australia.
Weill, P. & Vitale, M. 1999, " Assessing the health of an information system portfolio: an example from process engineering.", MIS Quart, vol. 23, no. 4, pp. 601-624.
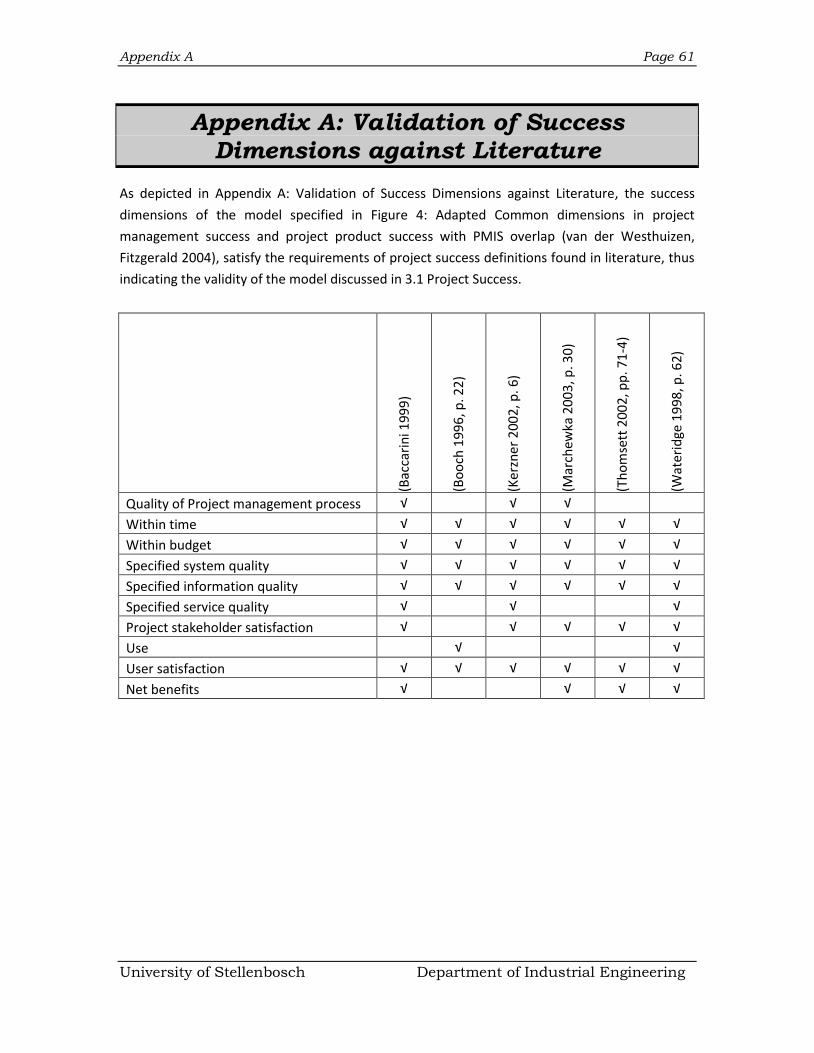
Appendix A Page 61
University of Stellenbosch Department of Industrial Engineering
Appendix A: Validation of Success
Dimensions against Literature
As depicted in Appendix A: Validation of Success Dimensions against Literature, the success
dimensions of the model specified in Figure 4: Adapted Common dimensions in project
management success and project product success with PMIS overlap (van der Westhuizen,
Fitzgerald 2004), satisfy the requirements of project success definitions found in literature, thus
indicating the validity of the model discussed in 3.1 Project Success.
(Bac
cari
ni 1
99
9)
(Bo
och
19
96
, p. 2
2)
(Ker
zner
20
02
, p. 6
)
(Mar
chew
ka 2
00
3, p
. 30
)
(Th
om
sett
20
02
, pp
. 71
-4)
(Wat
erid
ge 1
99
8, p
. 62
)
Quality of Project management process √ √ √
Within time √ √ √ √ √ √
Within budget √ √ √ √ √ √
Specified system quality √ √ √ √ √ √
Specified information quality √ √ √ √ √ √
Specified service quality √ √ √
Project stakeholder satisfaction √ √ √ √ √
Use √ √
User satisfaction √ √ √ √ √ √
Net benefits √ √ √ √
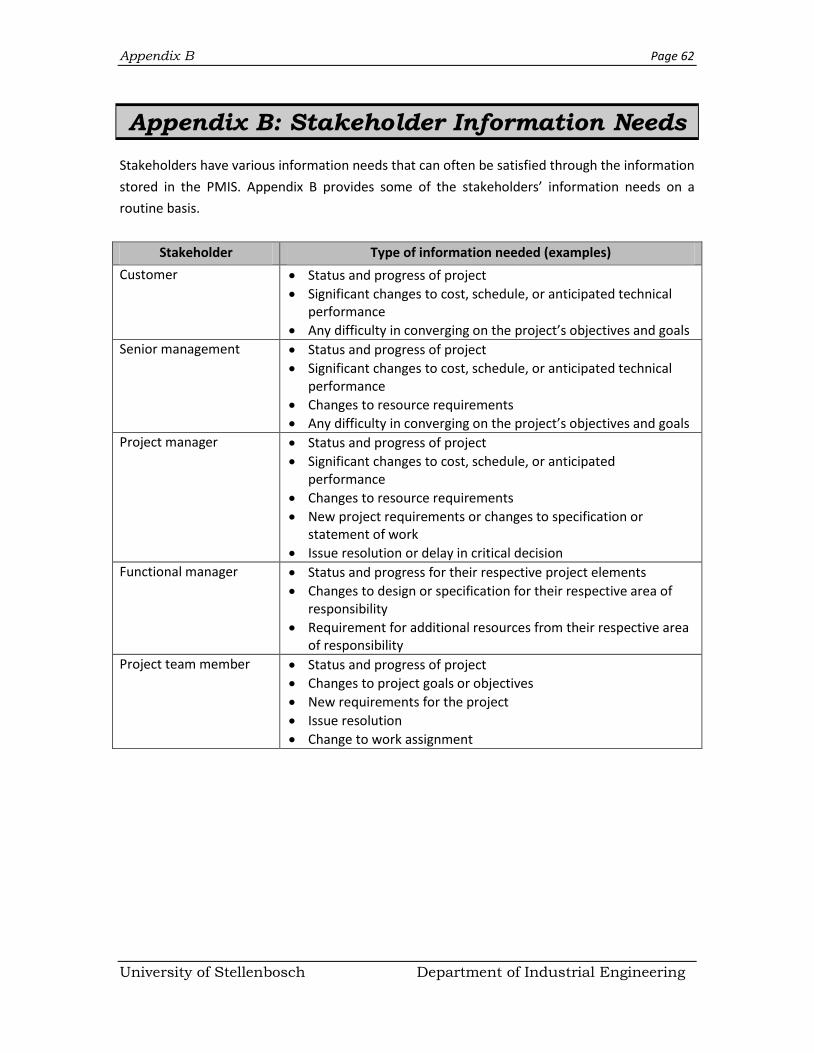
Appendix B Page 62
University of Stellenbosch Department of Industrial Engineering
Appendix B: Stakeholder Information Needs
Stakeholders have various information needs that can often be satisfied through the information
stored in the PMIS. Appendix B provides some of the stakeholders’ information needs on a
routine basis.
Stakeholder Type of information needed (examples)
Customer Status and progress of project
Significant changes to cost, schedule, or anticipated technical performance
Any difficulty in converging on the project’s objectives and goals
Senior management Status and progress of project
Significant changes to cost, schedule, or anticipated technical performance
Changes to resource requirements
Any difficulty in converging on the project’s objectives and goals
Project manager Status and progress of project
Significant changes to cost, schedule, or anticipated performance
Changes to resource requirements
New project requirements or changes to specification or statement of work
Issue resolution or delay in critical decision
Functional manager Status and progress for their respective project elements
Changes to design or specification for their respective area of responsibility
Requirement for additional resources from their respective area of responsibility
Project team member Status and progress of project
Changes to project goals or objectives
New requirements for the project
Issue resolution
Change to work assignment
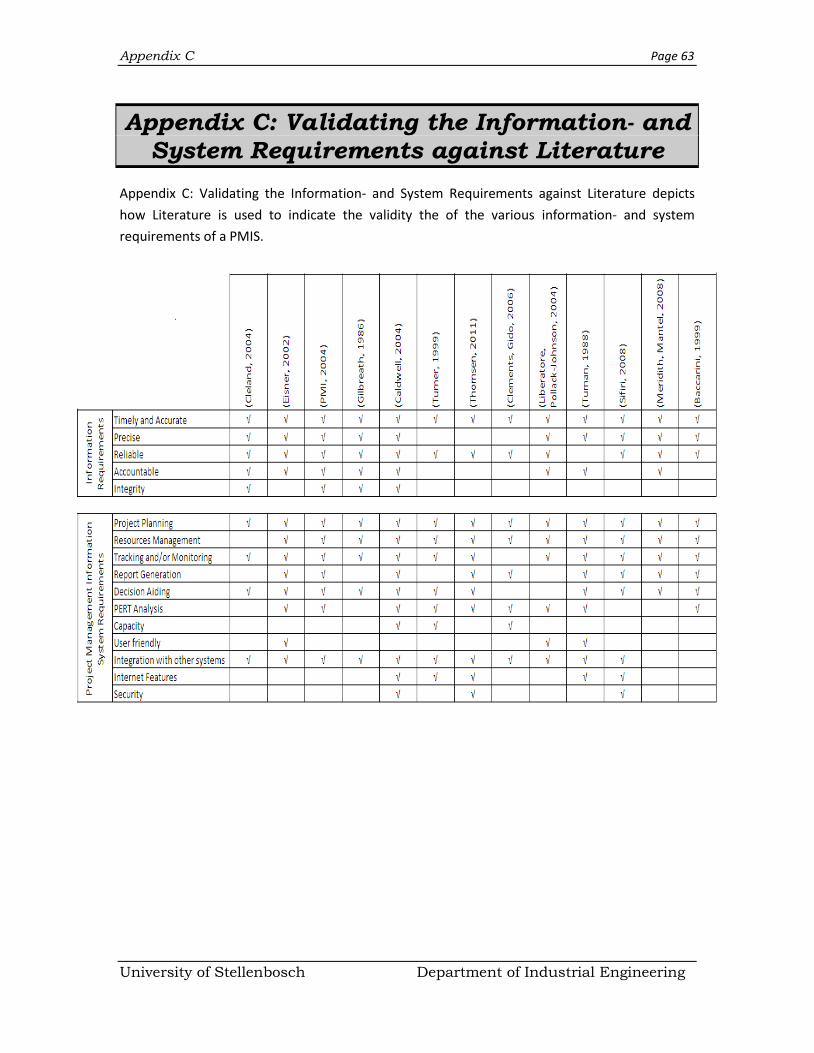
Appendix C Page 63
University of Stellenbosch Department of Industrial Engineering
Appendix C: Validating the Information- and
System Requirements against Literature
Appendix C: Validating the Information- and System Requirements against Literature depicts
how Literature is used to indicate the validity the of the various information- and system
requirements of a PMIS.
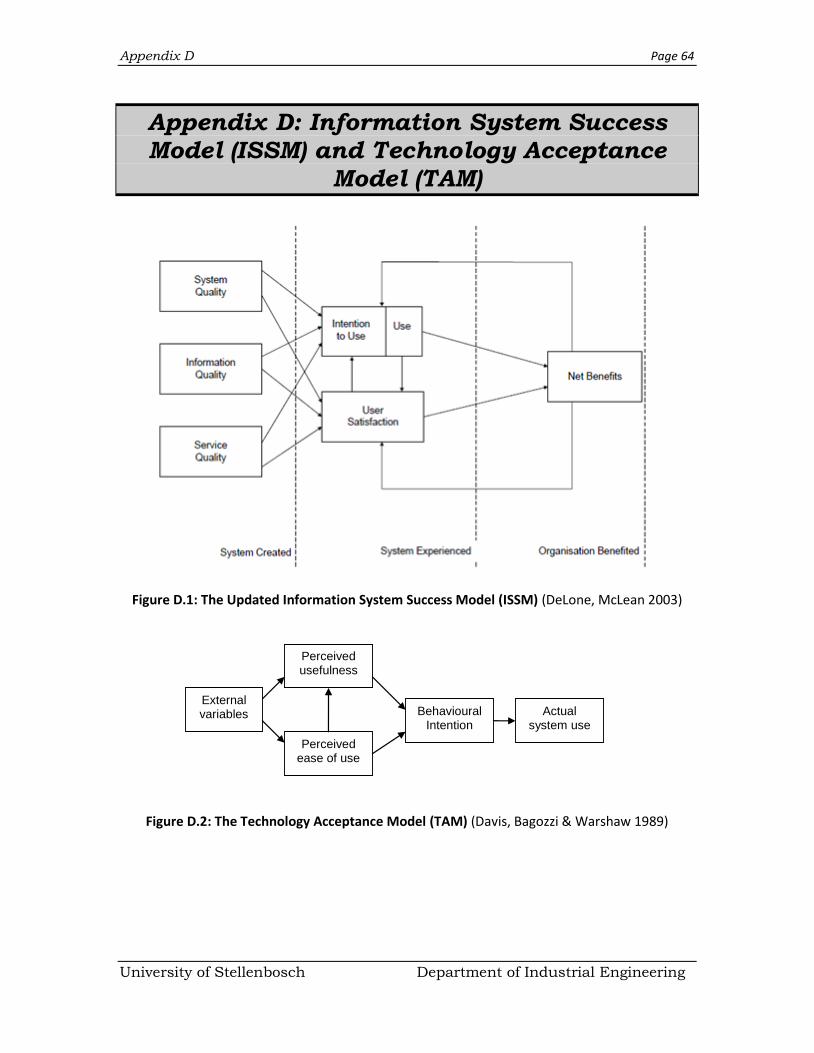
Appendix D Page 64
University of Stellenbosch Department of Industrial Engineering
Appendix D: Information System Success Model (ISSM) and Technology Acceptance
Model (TAM)
Figure D.1: The Updated Information System Success Model (ISSM) (DeLone, McLean 2003)
Figure D.2: The Technology Acceptance Model (TAM) (Davis, Bagozzi & Warshaw 1989)
External variables
Perceived usefulness
Perceived ease of use
Behavioural Intention
Actual system use
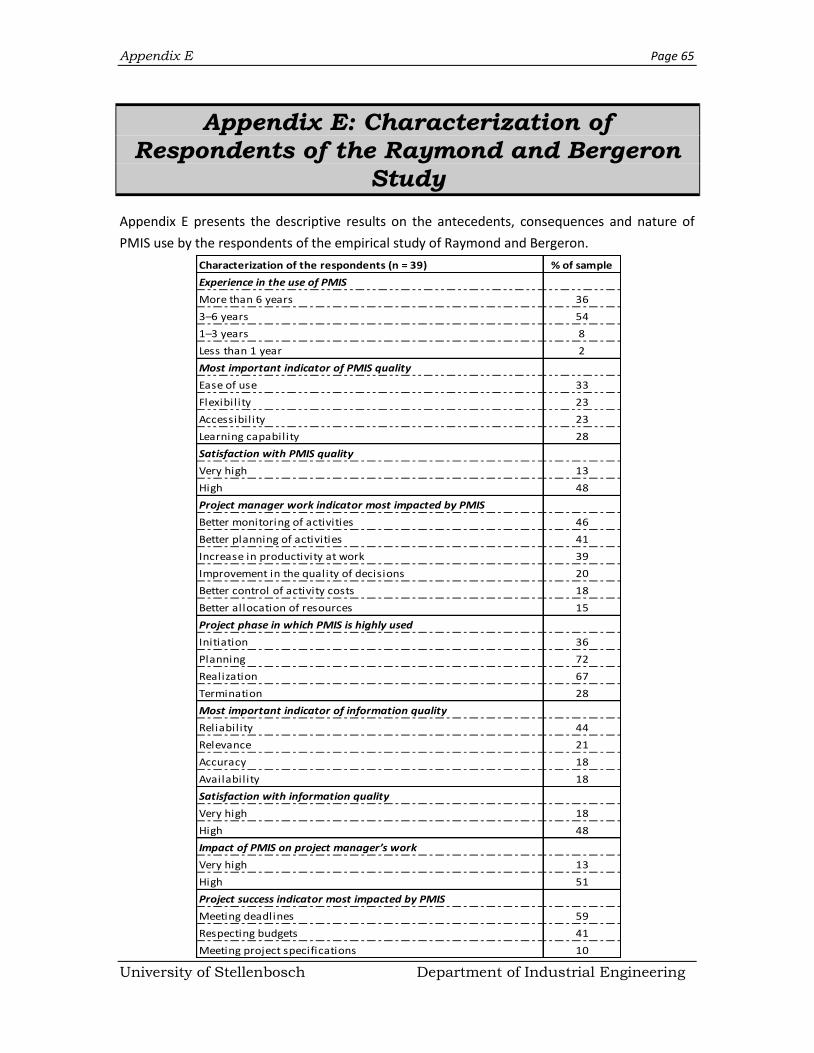
Appendix E Page 65
University of Stellenbosch Department of Industrial Engineering
Appendix E: Characterization of Respondents of the Raymond and Bergeron
Study
Appendix E presents the descriptive results on the antecedents, consequences and nature of
PMIS use by the respondents of the empirical study of Raymond and Bergeron.
Characterization of the respondents (n = 39) % of sample
Experience in the use of PMIS
More than 6 years 36
3–6 years 54
1–3 years 8
Less than 1 year 2
Most important indicator of PMIS quality
Ease of use 33
Flexibil ity 23
Accessibil ity 23
Learning capability 28
Satisfaction with PMIS quality
Very high 13
High 48
Project manager work indicator most impacted by PMIS
Better monitoring of activities 46
Better planning of activities 41
Increase in productivity at work 39
Improvement in the quality of decisions 20
Better control of activity costs 18
Better allocation of resources 15
Project phase in which PMIS is highly used
Initiation 36
Planning 72
Realization 67
Termination 28
Most important indicator of information quality
Reliability 44
Relevance 21
Accuracy 18
Availability 18
Satisfaction with information quality
Very high 18
High 48
Impact of PMIS on project manager’s work
Very high 13
High 51
Project success indicator most impacted by PMIS
Meeting deadlines 59
Respecting budgets 41
Meeting project specifications 10
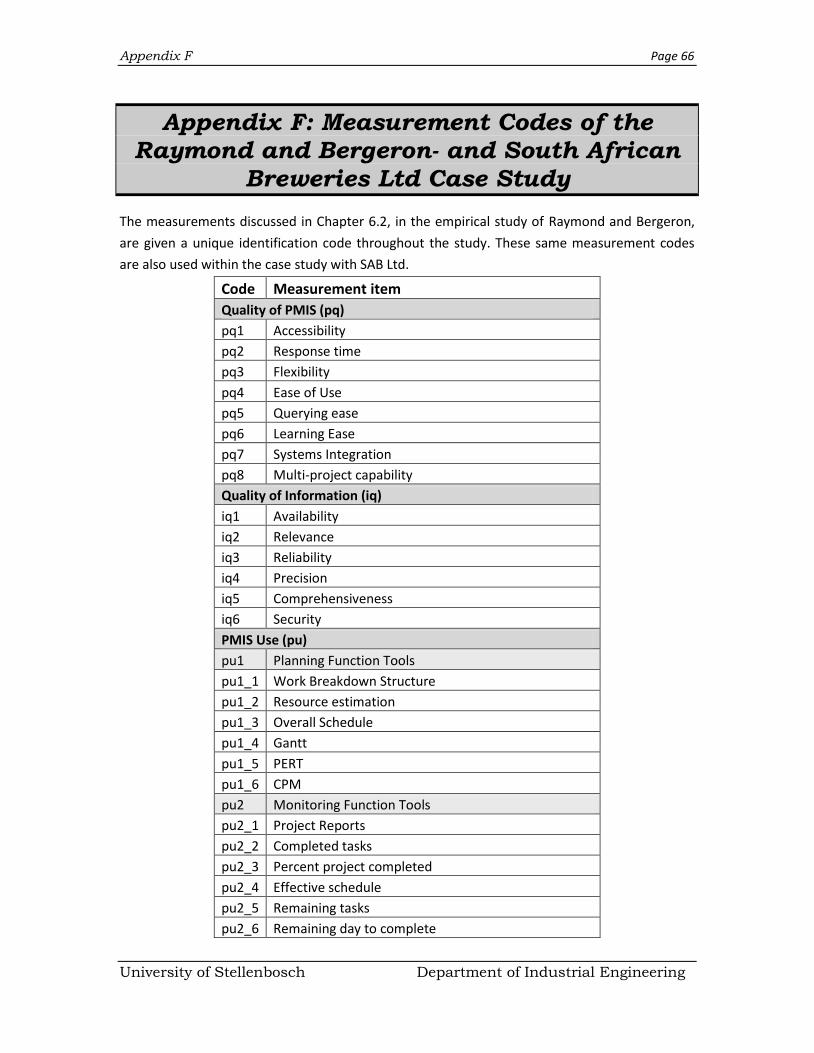
Appendix F Page 66
University of Stellenbosch Department of Industrial Engineering
Appendix F: Measurement Codes of the Raymond and Bergeron- and South African
Breweries Ltd Case Study
The measurements discussed in Chapter 6.2, in the empirical study of Raymond and Bergeron,
are given a unique identification code throughout the study. These same measurement codes
are also used within the case study with SAB Ltd.
Code Measurement item
Quality of PMIS (pq)
pq1 Accessibility
pq2 Response time
pq3 Flexibility
pq4 Ease of Use
pq5 Querying ease
pq6 Learning Ease
pq7 Systems Integration
pq8 Multi-project capability
Quality of Information (iq)
iq1 Availability
iq2 Relevance
iq3 Reliability
iq4 Precision
iq5 Comprehensiveness
iq6 Security
PMIS Use (pu)
pu1 Planning Function Tools
pu1_1 Work Breakdown Structure
pu1_2 Resource estimation
pu1_3 Overall Schedule
pu1_4 Gantt
pu1_5 PERT
pu1_6 CPM
pu2 Monitoring Function Tools
pu2_1 Project Reports
pu2_2 Completed tasks
pu2_3 Percent project completed
pu2_4 Effective schedule
pu2_5 Remaining tasks
pu2_6 Remaining day to complete
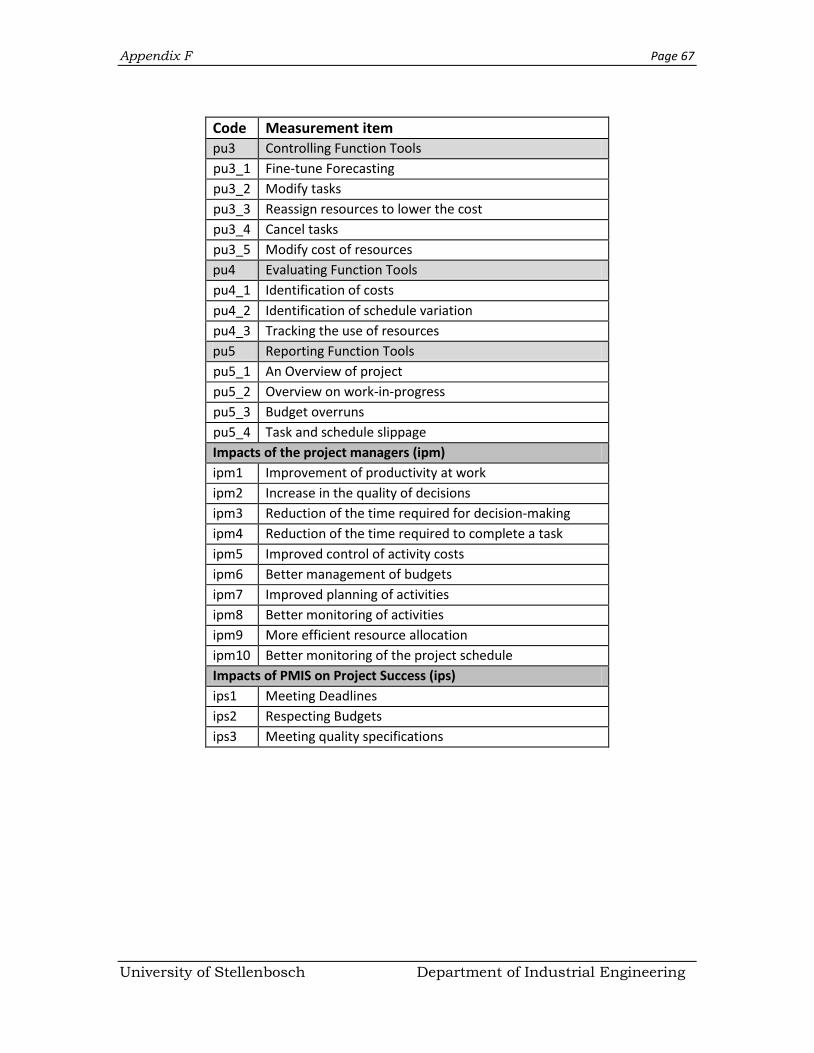
Appendix F Page 67
University of Stellenbosch Department of Industrial Engineering
Code Measurement item pu3 Controlling Function Tools
pu3_1 Fine-tune Forecasting
pu3_2 Modify tasks
pu3_3 Reassign resources to lower the cost
pu3_4 Cancel tasks
pu3_5 Modify cost of resources
pu4 Evaluating Function Tools
pu4_1 Identification of costs
pu4_2 Identification of schedule variation
pu4_3 Tracking the use of resources
pu5 Reporting Function Tools
pu5_1 An Overview of project
pu5_2 Overview on work-in-progress
pu5_3 Budget overruns
pu5_4 Task and schedule slippage
Impacts of the project managers (ipm)
ipm1 Improvement of productivity at work
ipm2 Increase in the quality of decisions
ipm3 Reduction of the time required for decision-making
ipm4 Reduction of the time required to complete a task
ipm5 Improved control of activity costs
ipm6 Better management of budgets
ipm7 Improved planning of activities
ipm8 Better monitoring of activities
ipm9 More efficient resource allocation
ipm10 Better monitoring of the project schedule
Impacts of PMIS on Project Success (ips)
ips1 Meeting Deadlines
ips2 Respecting Budgets
ips3 Meeting quality specifications
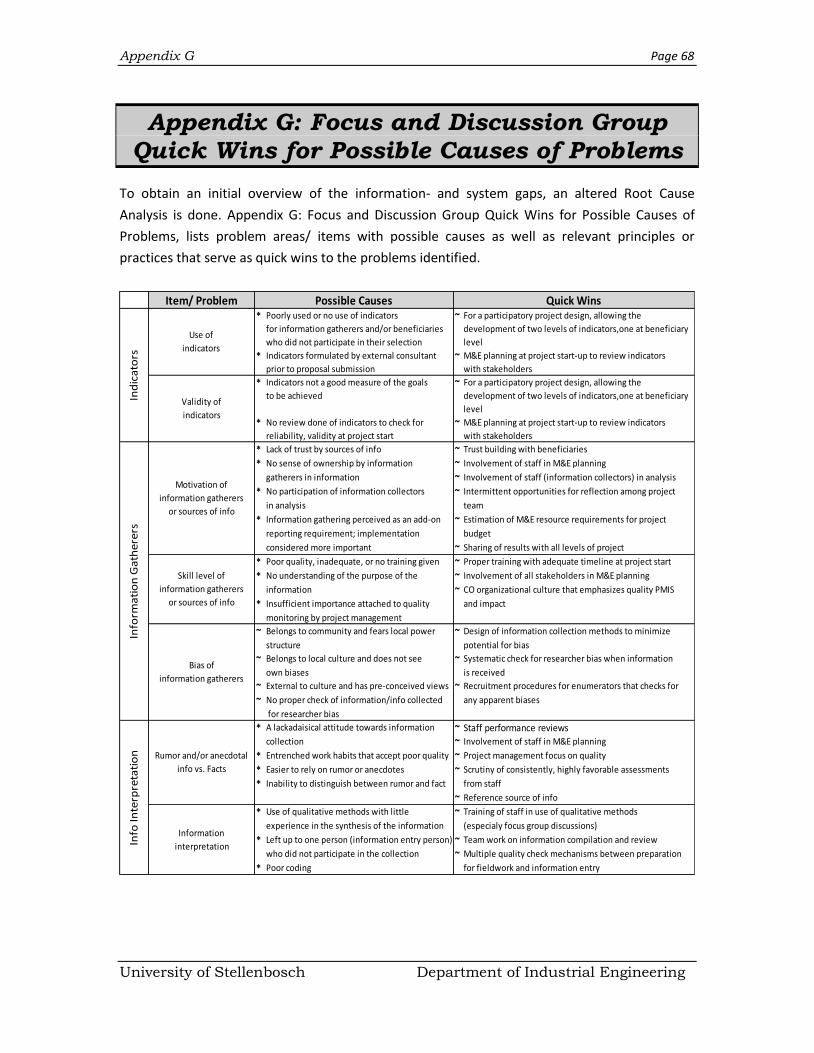
Appendix G Page 68
University of Stellenbosch Department of Industrial Engineering
Appendix G: Focus and Discussion Group
Quick Wins for Possible Causes of Problems
To obtain an initial overview of the information- and system gaps, an altered Root Cause
Analysis is done. Appendix G: Focus and Discussion Group Quick Wins for Possible Causes of
Problems, lists problem areas/ items with possible causes as well as relevant principles or
practices that serve as quick wins to the problems identified.
Item/ Problem* Poorly used or no use of indicators
for information gatherers and/or beneficiaries
who did not participate in their selection
~ For a participatory project design, allowing the
development of two levels of indicators,one at beneficiary
level
* Indicators formulated by external consultant
prior to proposal submission
~ M&E planning at project start-up to review indicators
with stakeholders
* Indicators not a good measure of the goals
to be achieved
~ For a participatory project design, allowing the
development of two levels of indicators,one at beneficiary
level
* No review done of indicators to check for
reliability, validity at project start
~ M&E planning at project start-up to review indicators
with stakeholders
* Lack of trust by sources of info ~ Trust building with beneficiaries
* No sense of ownership by information ~ Involvement of staff in M&E planning
gatherers in information ~ Involvement of staff (information collectors) in analysis
* No participation of information collectors ~ Intermittent opportunities for reflection among project
in analysis team
* Information gathering perceived as an add-on ~ Estimation of M&E resource requirements for project
reporting requirement; implementation budget
considered more important ~ Sharing of results with all levels of project
* Poor quality, inadequate, or no training given ~ Proper training with adequate timeline at project start
* No understanding of the purpose of the ~ Involvement of all stakeholders in M&E planning
information ~ CO organizational culture that emphasizes quality PMIS
* Insufficient importance attached to quality and impact
monitoring by project management
~ Belongs to community and fears local power ~ Design of information collection methods to minimize
structure potential for bias
~ Belongs to local culture and does not see ~ Systematic check for researcher bias when information
own biases is received
~ External to culture and has pre-conceived views ~ Recruitment procedures for enumerators that checks for
~ No proper check of information/info collected any apparent biases
for researcher bias
* A lackadaisical attitude towards information ~ Staff performance reviewscollection ~ Involvement of staff in M&E planning
* Entrenched work habits that accept poor quality ~ Project management focus on quality
* Easier to rely on rumor or anecdotes ~ Scrutiny of consistently, highly favorable assessments
* Inability to distinguish between rumor and fact from staff
~ Reference source of info
* Use of qualitative methods with little ~ Training of staff in use of qualitative methods
experience in the synthesis of the information (especialy focus group discussions)
* Left up to one person (information entry person) ~ Team work on information compilation and review
who did not participate in the collection ~ Multiple quality check mechanisms between preparation
* Poor coding for fieldwork and information entry
Possible Causes Quick Wins
Use of
indicators
Info
In
terp
reta
tio
n Rumor and/or anecdotal
info vs. Facts
Information
interpretation
Ind
ica
tors
Info
rma
tio
n G
ath
ere
rs
Motivation of
information gatherers
or sources of info
Skill level of
information gatherers
or sources of info
Bias of
information gatherers
Validity of
indicators
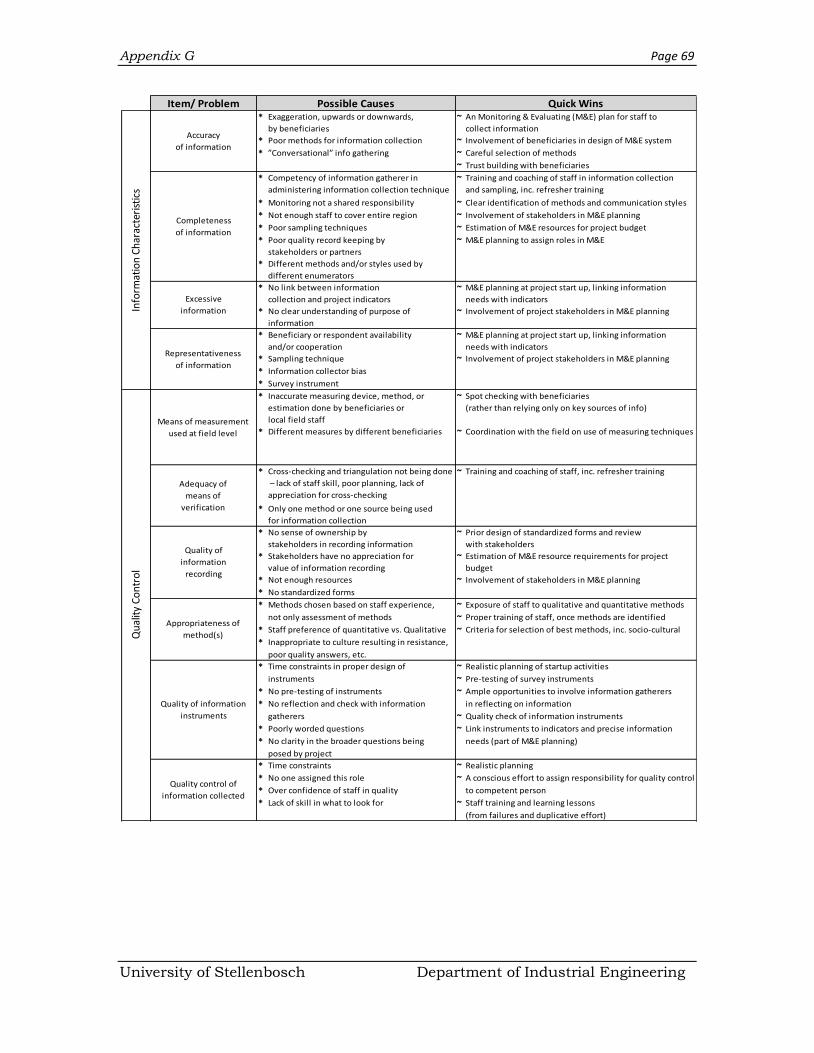
Appendix G Page 69
University of Stellenbosch Department of Industrial Engineering
Item/ Problem* Exaggeration, upwards or downwards,
by beneficiaries
~ An Monitoring & Evaluating (M&E) plan for staff to
collect information
* Poor methods for information collection ~ Involvement of beneficiaries in design of M&E system
* ”Conversational” info gathering ~ Careful selection of methods
~ Trust building with beneficiaries
* Competency of information gatherer in
administering information collection technique
~ Training and coaching of staff in information collection
and sampling, inc. refresher training
* Monitoring not a shared responsibility ~ Clear identification of methods and communication styles
* Not enough staff to cover entire region ~ Involvement of stakeholders in M&E planning
* Poor sampling techniques ~ Estimation of M&E resources for project budget
* Poor quality record keeping by
stakeholders or partners
~ M&E planning to assign roles in M&E
* Different methods and/or styles used by
different enumerators
* No link between information
collection and project indicators
~ M&E planning at project start up, linking information
needs with indicators
* No clear understanding of purpose of
information
~ Involvement of project stakeholders in M&E planning
* Beneficiary or respondent availability
and/or cooperation
~ M&E planning at project start up, linking information
needs with indicators
* Sampling technique ~ Involvement of project stakeholders in M&E planning
* Information collector bias
* Survey instrument
* Inaccurate measuring device, method, or
estimation done by beneficiaries or
local field staff
~ Spot checking with beneficiaries
(rather than relying only on key sources of info)
* Different measures by different beneficiaries ~ Coordination with the field on use of measuring techniques
* Cross-checking and triangulation not being done
– lack of staff skill, poor planning, lack of
appreciation for cross-checking
~ Training and coaching of staff, inc. refresher training
* Only one method or one source being used
for information collection
* No sense of ownership by
stakeholders in recording information
~ Prior design of standardized forms and review
with stakeholders
* Stakeholders have no appreciation for
value of information recording
~ Estimation of M&E resource requirements for project
budget
* Not enough resources ~ Involvement of stakeholders in M&E planning
* No standardized forms
* Methods chosen based on staff experience, ~ Exposure of staff to qualitative and quantitative methods
not only assessment of methods ~ Proper training of staff, once methods are identified
* Staff preference of quantitative vs. Qualitative ~ Criteria for selection of best methods, inc. socio-cultural
* Inappropriate to culture resulting in resistance,
poor quality answers, etc.
* Time constraints in proper design of ~ Realistic planning of startup activities
instruments ~ Pre-testing of survey instruments
* No pre-testing of instruments ~ Ample opportunities to involve information gatherers
* No reflection and check with information in reflecting on information
gatherers ~ Quality check of information instruments
* Poorly worded questions ~ Link instruments to indicators and precise information
* No clarity in the broader questions being needs (part of M&E planning)
posed by project
* Time constraints ~ Realistic planning
* No one assigned this role ~ A conscious effort to assign responsibility for quality control
* Over confidence of staff in quality to competent person
* Lack of skill in what to look for ~ Staff training and learning lessons
(from failures and duplicative effort)
Possible Causes Quick Wins
Accuracy
of information
Completeness
of information
Representativeness
of information
Excessive
informationInfo
rmat
ion
Ch
arac
teri
stic
s
Appropriateness of
method(s)
Means of measurement
used at field level
Quality of
information
recording
Adequacy of
means of
verification
Quality of information
instruments
Quality control of
information collected
Qu
alit
y C
on
tro
l
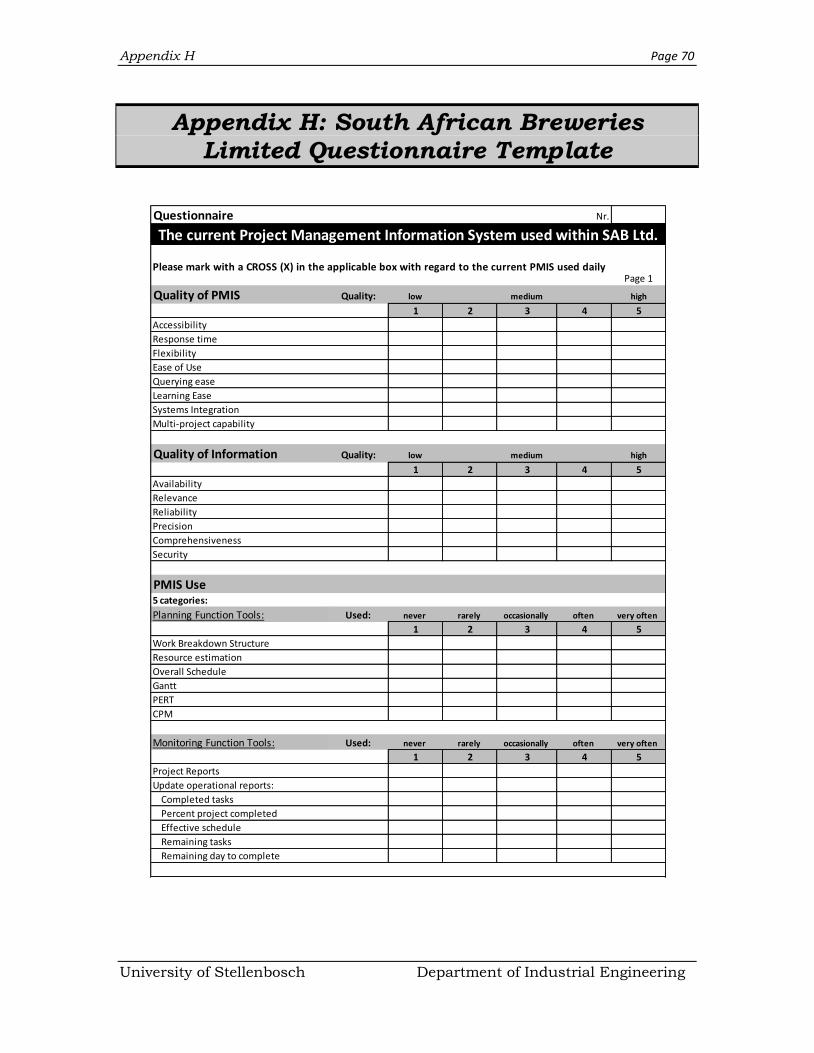
Appendix H Page 70
University of Stellenbosch Department of Industrial Engineering
Appendix H: South African Breweries
Limited Questionnaire Template
Questionnaire Nr.
Please mark with a CROSS (X) in the applicable box with regard to the current PMIS used dailyPage 1
Quality of PMIS Quality: low medium high
1 2 3 4 5
Accessibility
Response time
Flexibility
Ease of Use
Querying ease
Learning Ease
Systems Integration
Multi-project capability
Quality of Information Quality: low medium high
1 2 3 4 5
Reliability
Precision
Comprehensiveness
Security
PMIS Use5 categories:
Planning Function Tools: Used: never rarely occasionally often very often
1 2 3 4 5
Work Breakdown Structure
Resource estimation
Overall Schedule
Gantt
PERT
CPM
Monitoring Function Tools: Used: never rarely occasionally often very often
1 2 3 4 5
Project Reports
Update operational reports:
Completed tasks
Percent project completed
Effective schedule
Remaining tasks
Remaining day to complete
The current Project Management Information System used within SAB Ltd.
Availability
Relevance
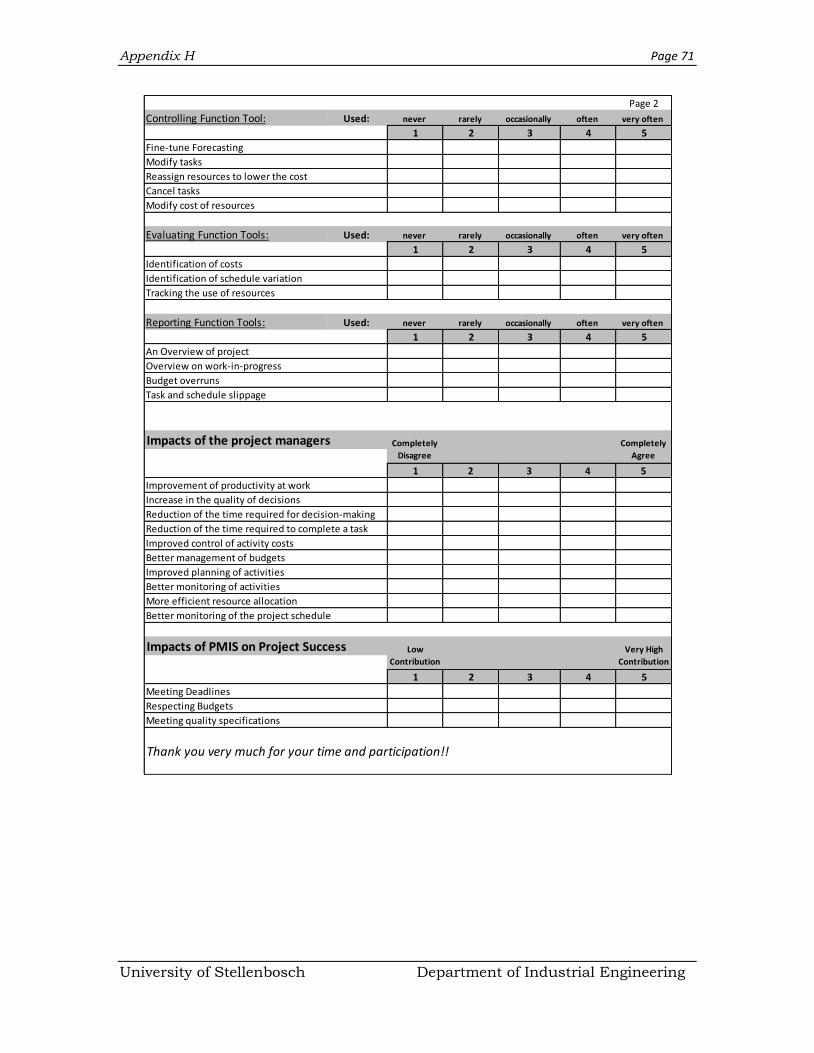
Appendix H Page 71
University of Stellenbosch Department of Industrial Engineering
Page 2
Controlling Function Tool: Used: never rarely occasionally often very often
1 2 3 4 5
Fine-tune Forecasting
Modify tasks
Reassign resources to lower the cost
Cancel tasks
Modify cost of resources
Evaluating Function Tools: Used: never rarely occasionally often very often
1 2 3 4 5
Identification of costs
Identification of schedule variation
Tracking the use of resources
Reporting Function Tools: Used: never rarely occasionally often very often
1 2 3 4 5
An Overview of project
Overview on work-in-progress
Budget overruns
Task and schedule slippage
Impacts of the project managers
1 2 3 4 5
Improvement of productivity at work
Increase in the quality of decisions
Reduction of the time required for decision-making
Reduction of the time required to complete a task
Improved control of activity costs
Better management of budgets
Improved planning of activities
Better monitoring of activities
More efficient resource allocation
Better monitoring of the project schedule
Impacts of PMIS on Project Success
1 2 3 4 5
Meeting Deadlines
Respecting Budgets
Meeting quality specifications
Thank you very much for your time and participation!!
Low
Contribution
Very High
Contribution
Completely
Disagree
Completely
Agree
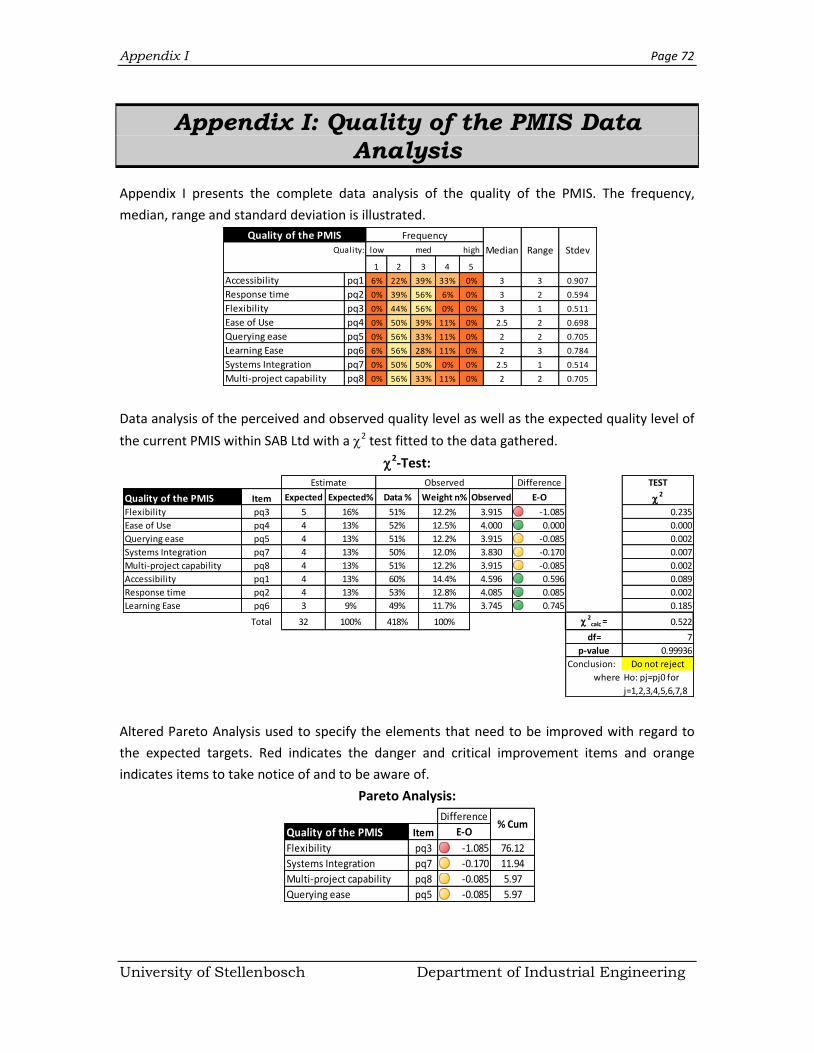
Appendix I Page 72
University of Stellenbosch Department of Industrial Engineering
Appendix I: Quality of the PMIS Data
Analysis
Appendix I presents the complete data analysis of the quality of the PMIS. The frequency,
median, range and standard deviation is illustrated.
Data analysis of the perceived and observed quality level as well as the expected quality level of
the current PMIS within SAB Ltd with a 2 test fitted to the data gathered.
2-Test:
Altered Pareto Analysis used to specify the elements that need to be improved with regard to
the expected targets. Red indicates the danger and critical improvement items and orange
indicates items to take notice of and to be aware of.
Pareto Analysis:
Quality: low med high
1 2 3 4 5
Accessibility pq1 6% 22% 39% 33% 0% 3 3 0.907
Response time pq2 0% 39% 56% 6% 0% 3 2 0.594
Flexibility pq3 0% 44% 56% 0% 0% 3 1 0.511
Ease of Use pq4 0% 50% 39% 11% 0% 2.5 2 0.698
Querying ease pq5 0% 56% 33% 11% 0% 2 2 0.705
Learning Ease pq6 6% 56% 28% 11% 0% 2 3 0.784
Systems Integration pq7 0% 50% 50% 0% 0% 2.5 1 0.514
Multi-project capability pq8 0% 56% 33% 11% 0% 2 2 0.705
Quality of the PMIS Frequency
Median Range Stdev
Difference TEST
Quality of the PMIS Item Expected Expected% Data % Weight n% Observed E-O 2
Flexibility pq3 5 16% 51% 12.2% 3.915 -1.085 0.235
Ease of Use pq4 4 13% 52% 12.5% 4.000 0.000 0.000
Querying ease pq5 4 13% 51% 12.2% 3.915 -0.085 0.002
Systems Integration pq7 4 13% 50% 12.0% 3.830 -0.170 0.007
Multi-project capability pq8 4 13% 51% 12.2% 3.915 -0.085 0.002
Accessibility pq1 4 13% 60% 14.4% 4.596 0.596 0.089
Response time pq2 4 13% 53% 12.8% 4.085 0.085 0.002
Learning Ease pq6 3 9% 49% 11.7% 3.745 0.745 0.185
Total 32 100% 418% 100% 2
calc = 0.522
df= 7
p-value 0.99936
Conclusion: Do not reject
where Ho: pj=pj0 for
j=1,2,3,4,5,6,7,8
Estimate Observed
Difference
Quality of the PMIS Item E-O
Flexibility pq3 -1.085 76.12
Systems Integration pq7 -0.170 11.94
Multi-project capability pq8 -0.085 5.97
Querying ease pq5 -0.085 5.97
% Cum
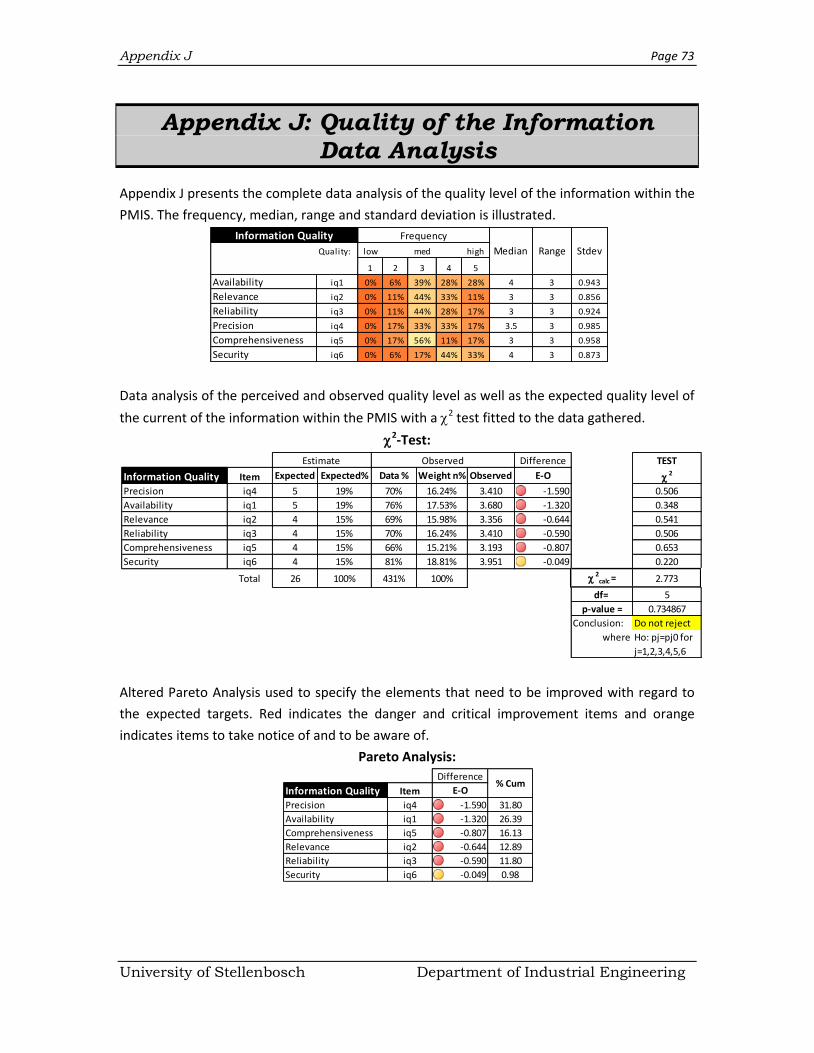
Appendix J Page 73
University of Stellenbosch Department of Industrial Engineering
Appendix J: Quality of the Information
Data Analysis
Appendix J presents the complete data analysis of the quality level of the information within the
PMIS. The frequency, median, range and standard deviation is illustrated.
Data analysis of the perceived and observed quality level as well as the expected quality level of
the current of the information within the PMIS with a 2 test fitted to the data gathered.
2-Test:
Altered Pareto Analysis used to specify the elements that need to be improved with regard to
the expected targets. Red indicates the danger and critical improvement items and orange
indicates items to take notice of and to be aware of.
Pareto Analysis:
Quality: low med high Range Stdev
1 2 3 4 5
Availability iq1 0% 6% 39% 28% 28% 4 3 0.943
Relevance iq2 0% 11% 44% 33% 11% 3 3 0.856
Reliability iq3 0% 11% 44% 28% 17% 3 3 0.924
Precision iq4 0% 17% 33% 33% 17% 3.5 3 0.985
Comprehensiveness iq5 0% 17% 56% 11% 17% 3 3 0.958
Security iq6 0% 6% 17% 44% 33% 4 3 0.873
Information Quality Frequency
Median
Difference TEST
Information Quality Item Expected Expected% Data % Weight n% Observed E-O 2
Precision iq4 5 19% 70% 16.24% 3.410 -1.590 0.506
Availability iq1 5 19% 76% 17.53% 3.680 -1.320 0.348
Relevance iq2 4 15% 69% 15.98% 3.356 -0.644 0.541
Reliability iq3 4 15% 70% 16.24% 3.410 -0.590 0.506
Comprehensiveness iq5 4 15% 66% 15.21% 3.193 -0.807 0.653
Security iq6 4 15% 81% 18.81% 3.951 -0.049 0.220
Total 26 100% 431% 100% 2
calc = 2.773
df= 5
p-value = 0.734867
Conclusion: Do not reject
where Ho: pj=pj0 for
j=1,2,3,4,5,6
Estimate Observed
Difference
Information Quality Item E-O
Precision iq4 -1.590 31.80
Availability iq1 -1.320 26.39
Comprehensiveness iq5 -0.807 16.13
Relevance iq2 -0.644 12.89
Reliability iq3 -0.590 11.80
Security iq6 -0.049 0.98
% Cum
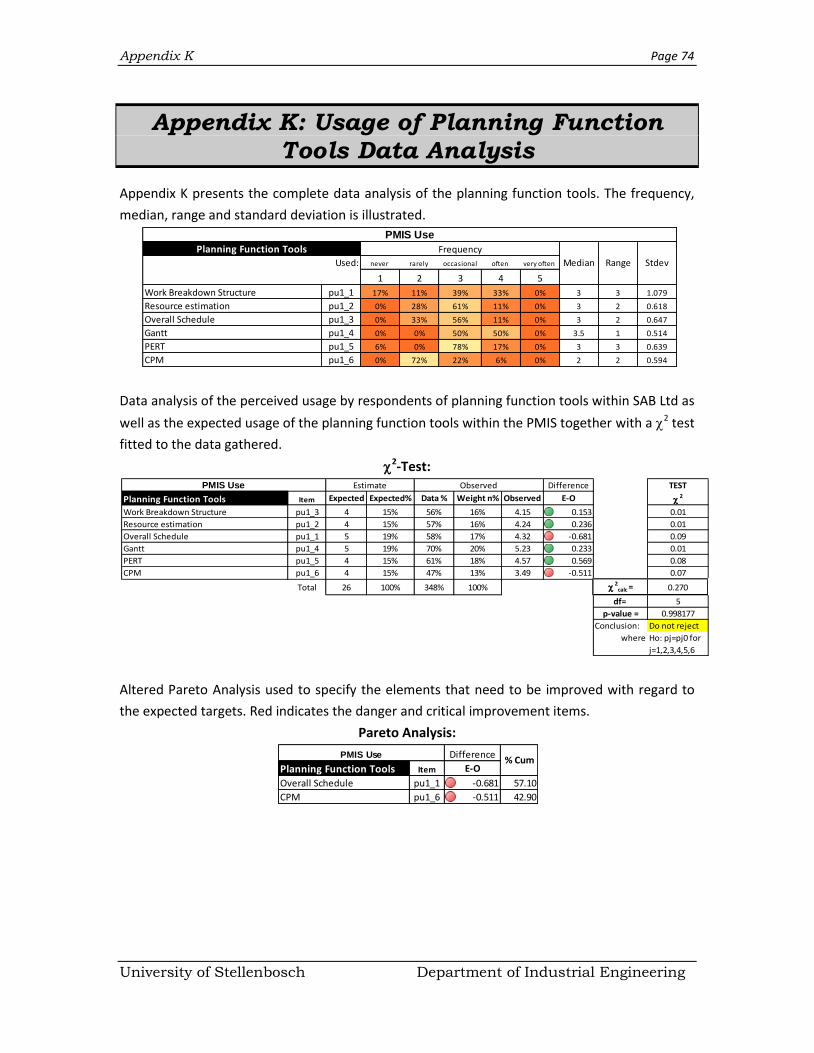
Appendix K Page 74
University of Stellenbosch Department of Industrial Engineering
Appendix K: Usage of Planning Function
Tools Data Analysis
Appendix K presents the complete data analysis of the planning function tools. The frequency,
median, range and standard deviation is illustrated.
Data analysis of the perceived usage by respondents of planning function tools within SAB Ltd as
well as the expected usage of the planning function tools within the PMIS together with a 2 test
fitted to the data gathered.
2-Test:
Altered Pareto Analysis used to specify the elements that need to be improved with regard to
the expected targets. Red indicates the danger and critical improvement items.
Pareto Analysis:
Used: never rarely occasional often very often
1 2 3 4 5
Work Breakdown Structure pu1_1 17% 11% 39% 33% 0% 3 3 1.079
Resource estimation pu1_2 0% 28% 61% 11% 0% 3 2 0.618
Overall Schedule pu1_3 0% 33% 56% 11% 0% 3 2 0.647
Gantt pu1_4 0% 0% 50% 50% 0% 3.5 1 0.514
PERT pu1_5 6% 0% 78% 17% 0% 3 3 0.639
CPM pu1_6 0% 72% 22% 6% 0% 2 2 0.594
PMIS Use
FrequencyPlanning Function Tools
Median Range Stdev
Difference TEST
Planning Function Tools Item Expected Expected% Data % Weight n% Observed E-O 2
Work Breakdown Structure pu1_3 4 15% 56% 16% 4.15 0.153 0.01
Resource estimation pu1_2 4 15% 57% 16% 4.24 0.236 0.01
Overall Schedule pu1_1 5 19% 58% 17% 4.32 -0.681 0.09
Gantt pu1_4 5 19% 70% 20% 5.23 0.233 0.01
PERT pu1_5 4 15% 61% 18% 4.57 0.569 0.08
CPM pu1_6 4 15% 47% 13% 3.49 -0.511 0.07
Total 26 100% 348% 100% 2
calc = 0.270
df= 5
p-value = 0.998177
Conclusion: Do not reject
where Ho: pj=pj0 for
j=1,2,3,4,5,6
Estimate ObservedPMIS Use
Difference
Planning Function Tools Item E-O
Overall Schedule pu1_1 -0.681 57.10
CPM pu1_6 -0.511 42.90
% CumPMIS Use
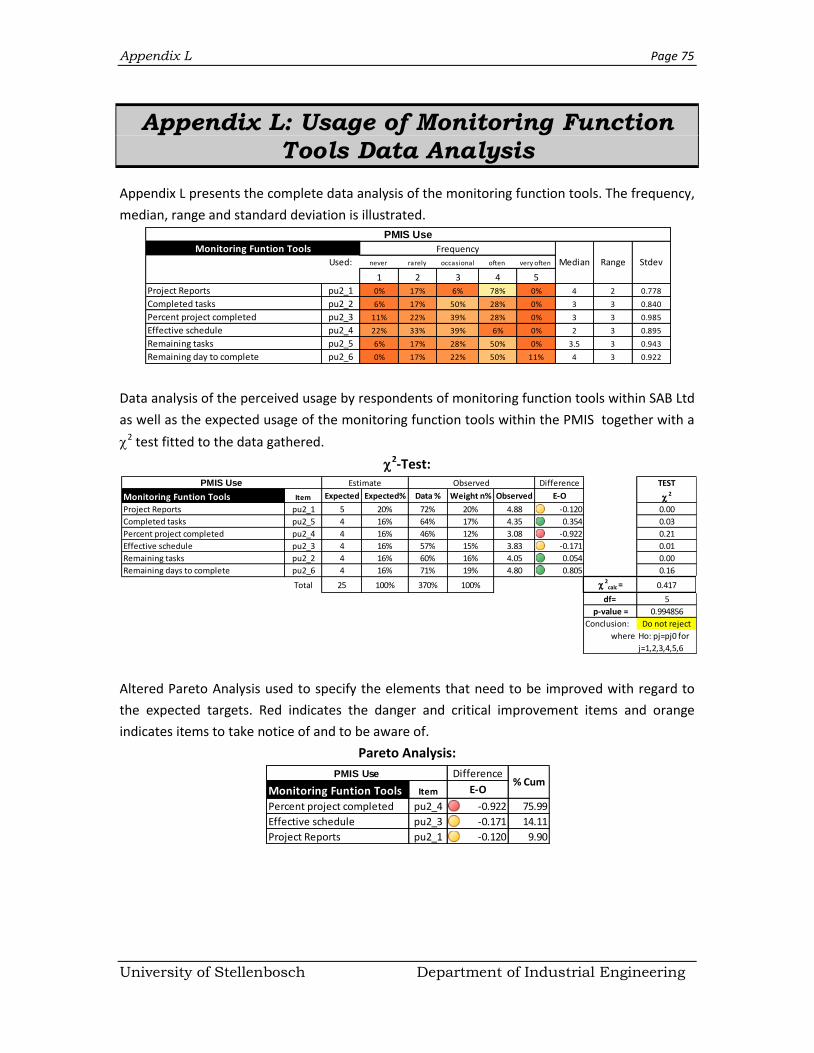
Appendix L Page 75
University of Stellenbosch Department of Industrial Engineering
Appendix L: Usage of Monitoring Function
Tools Data Analysis
Appendix L presents the complete data analysis of the monitoring function tools. The frequency,
median, range and standard deviation is illustrated.
Data analysis of the perceived usage by respondents of monitoring function tools within SAB Ltd
as well as the expected usage of the monitoring function tools within the PMIS together with a
2 test fitted to the data gathered.
2-Test:
Altered Pareto Analysis used to specify the elements that need to be improved with regard to
the expected targets. Red indicates the danger and critical improvement items and orange
indicates items to take notice of and to be aware of.
Pareto Analysis:
Used: never rarely occasional often very often
1 2 3 4 5
Project Reports pu2_1 0% 17% 6% 78% 0% 4 2 0.778
Completed tasks pu2_2 6% 17% 50% 28% 0% 3 3 0.840
Percent project completed pu2_3 11% 22% 39% 28% 0% 3 3 0.985
Effective schedule pu2_4 22% 33% 39% 6% 0% 2 3 0.895
Remaining tasks pu2_5 6% 17% 28% 50% 0% 3.5 3 0.943
Remaining day to complete pu2_6 0% 17% 22% 50% 11% 4 3 0.922
PMIS Use
Monitoring Funtion ToolsMedian Range Stdev
Frequency
Difference TEST
Monitoring Funtion Tools Item Expected Expected% Data % Weight n% Observed E-O 2
Project Reports pu2_1 5 20% 72% 20% 4.88 -0.120 0.00
Completed tasks pu2_5 4 16% 64% 17% 4.35 0.354 0.03
Percent project completed pu2_4 4 16% 46% 12% 3.08 -0.922 0.21
Effective schedule pu2_3 4 16% 57% 15% 3.83 -0.171 0.01
Remaining tasks pu2_2 4 16% 60% 16% 4.05 0.054 0.00
Remaining days to complete pu2_6 4 16% 71% 19% 4.80 0.805 0.16
Total 25 100% 370% 100% 2
calc = 0.417
df= 5
p-value = 0.994856
Conclusion: Do not reject
where Ho: pj=pj0 for
j=1,2,3,4,5,6
PMIS Use Estimate Observed
Difference
Monitoring Funtion Tools Item E-O
Percent project completed pu2_4 -0.922 75.99
Effective schedule pu2_3 -0.171 14.11
Project Reports pu2_1 -0.120 9.90
PMIS Use% Cum
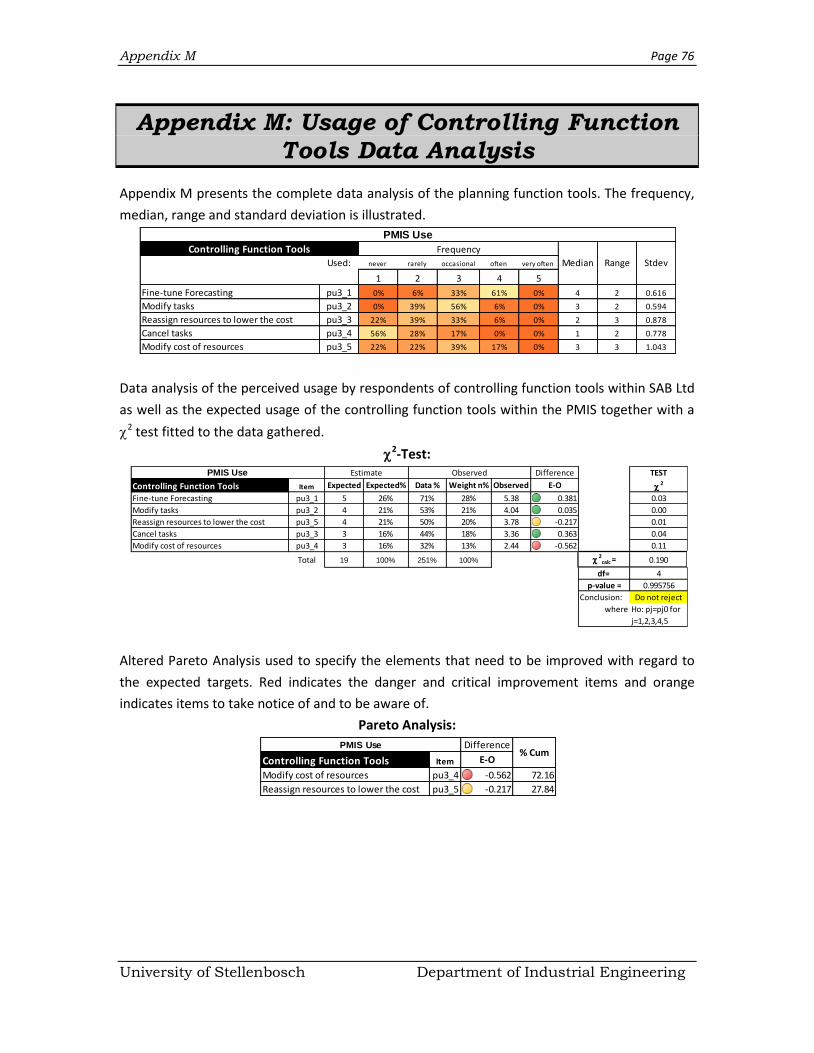
Appendix M Page 76
University of Stellenbosch Department of Industrial Engineering
Appendix M: Usage of Controlling Function
Tools Data Analysis
Appendix M presents the complete data analysis of the planning function tools. The frequency,
median, range and standard deviation is illustrated.
Data analysis of the perceived usage by respondents of controlling function tools within SAB Ltd
as well as the expected usage of the controlling function tools within the PMIS together with a
2 test fitted to the data gathered.
2-Test:
Altered Pareto Analysis used to specify the elements that need to be improved with regard to
the expected targets. Red indicates the danger and critical improvement items and orange
indicates items to take notice of and to be aware of.
Pareto Analysis:
Used: never rarely occasional often very often
1 2 3 4 5
Fine-tune Forecasting pu3_1 0% 6% 33% 61% 0% 4 2 0.616
Modify tasks pu3_2 0% 39% 56% 6% 0% 3 2 0.594
Reassign resources to lower the cost pu3_3 22% 39% 33% 6% 0% 2 3 0.878
Cancel tasks pu3_4 56% 28% 17% 0% 0% 1 2 0.778
Modify cost of resources pu3_5 22% 22% 39% 17% 0% 3 3 1.043
Frequency
PMIS Use
Controlling Function ToolsMedian Range Stdev
Difference TEST
Controlling Function Tools Item Expected Expected% Data % Weight n% Observed E-O 2
Fine-tune Forecasting pu3_1 5 26% 71% 28% 5.38 0.381 0.03
Modify tasks pu3_2 4 21% 53% 21% 4.04 0.035 0.00
Reassign resources to lower the cost pu3_5 4 21% 50% 20% 3.78 -0.217 0.01
Cancel tasks pu3_3 3 16% 44% 18% 3.36 0.363 0.04
Modify cost of resources pu3_4 3 16% 32% 13% 2.44 -0.562 0.11
Total 19 100% 251% 100% 2
calc = 0.190
df= 4
p-value = 0.995756
Conclusion: Do not reject
where Ho: pj=pj0 for
j=1,2,3,4,5
PMIS Use Estimate Observed
Difference
Controlling Function Tools Item E-O
Modify cost of resources pu3_4 -0.562 72.16
Reassign resources to lower the cost pu3_5 -0.217 27.84
PMIS Use% Cum
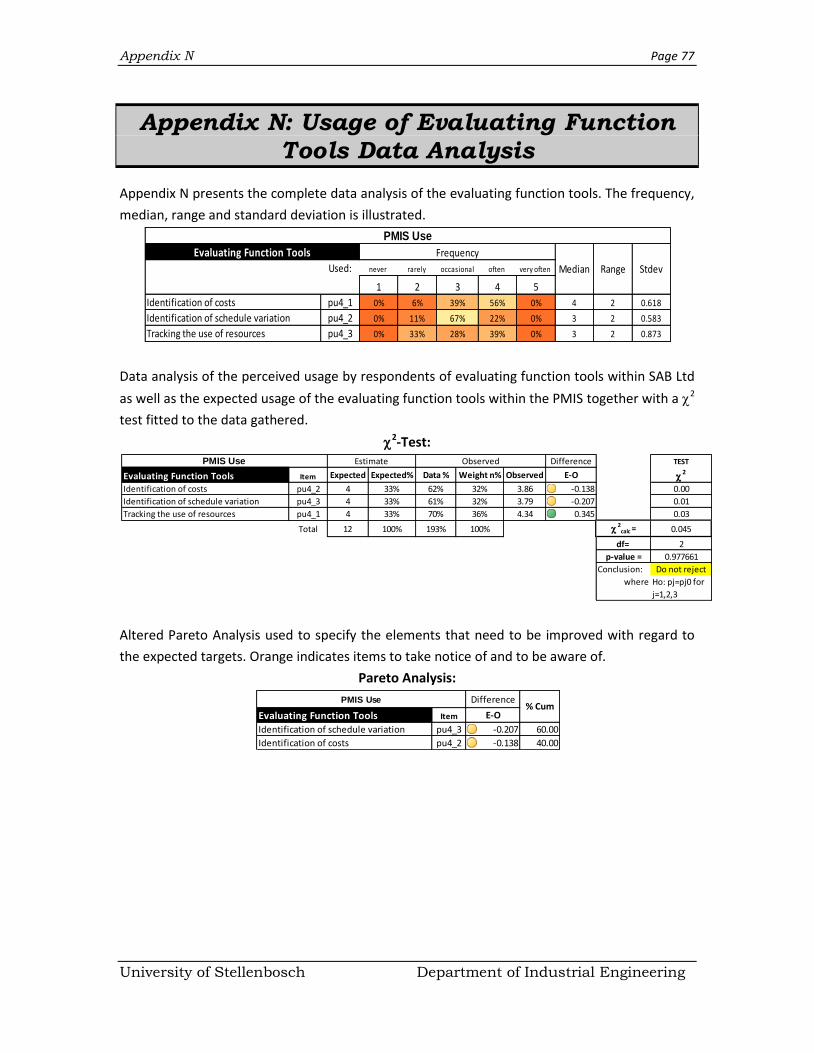
Appendix N Page 77
University of Stellenbosch Department of Industrial Engineering
Appendix N: Usage of Evaluating Function
Tools Data Analysis
Appendix N presents the complete data analysis of the evaluating function tools. The frequency,
median, range and standard deviation is illustrated.
Data analysis of the perceived usage by respondents of evaluating function tools within SAB Ltd
as well as the expected usage of the evaluating function tools within the PMIS together with a 2
test fitted to the data gathered.
2-Test:
Altered Pareto Analysis used to specify the elements that need to be improved with regard to
the expected targets. Orange indicates items to take notice of and to be aware of.
Pareto Analysis:
Used: never rarely occasional often very often
1 2 3 4 5
Identification of costs pu4_1 0% 6% 39% 56% 0% 4 2 0.618
Identification of schedule variation pu4_2 0% 11% 67% 22% 0% 3 2 0.583
Tracking the use of resources pu4_3 0% 33% 28% 39% 0% 3 2 0.873
Evaluating Function Tools Frequency
PMIS Use
Median Range Stdev
Difference TEST
Evaluating Function Tools Item Expected Expected% Data % Weight n% Observed E-O 2
Identification of costs pu4_2 4 33% 62% 32% 3.86 -0.138 0.00
Identification of schedule variation pu4_3 4 33% 61% 32% 3.79 -0.207 0.01
Tracking the use of resources pu4_1 4 33% 70% 36% 4.34 0.345 0.03
Total 12 100% 193% 100% 2
calc = 0.045
df= 2
p-value = 0.977661
Conclusion: Do not reject
where Ho: pj=pj0 for
j=1,2,3
PMIS Use Estimate Observed
Difference
Evaluating Function Tools Item E-O
Identification of schedule variation pu4_3 -0.207 60.00
Identification of costs pu4_2 -0.138 40.00
PMIS Use% Cum
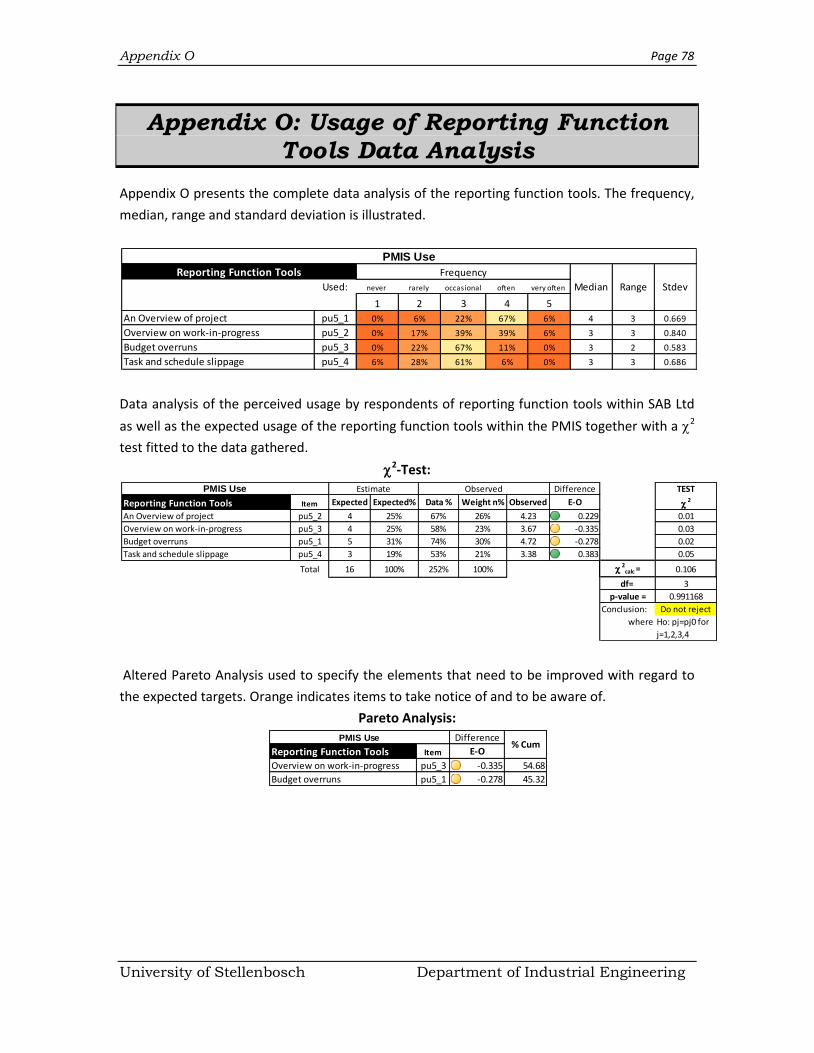
Appendix O Page 78
University of Stellenbosch Department of Industrial Engineering
Appendix O: Usage of Reporting Function
Tools Data Analysis
Appendix O presents the complete data analysis of the reporting function tools. The frequency,
median, range and standard deviation is illustrated.
Data analysis of the perceived usage by respondents of reporting function tools within SAB Ltd
as well as the expected usage of the reporting function tools within the PMIS together with a 2
test fitted to the data gathered.
2-Test:
Altered Pareto Analysis used to specify the elements that need to be improved with regard to
the expected targets. Orange indicates items to take notice of and to be aware of.
Pareto Analysis:
Used: never rarely occasional often very often
1 2 3 4 5
An Overview of project pu5_1 0% 6% 22% 67% 6% 4 3 0.669
Overview on work-in-progress pu5_2 0% 17% 39% 39% 6% 3 3 0.840
Budget overruns pu5_3 0% 22% 67% 11% 0% 3 2 0.583
Task and schedule slippage pu5_4 6% 28% 61% 6% 0% 3 3 0.686
Reporting Function Tools Frequency
PMIS Use
Median Range Stdev
Difference TEST
Reporting Function Tools Item Expected Expected% Data % Weight n% Observed E-O 2
An Overview of project pu5_2 4 25% 67% 26% 4.23 0.229 0.01
Overview on work-in-progress pu5_3 4 25% 58% 23% 3.67 -0.335 0.03
Budget overruns pu5_1 5 31% 74% 30% 4.72 -0.278 0.02
Task and schedule slippage pu5_4 3 19% 53% 21% 3.38 0.383 0.05
Total 16 100% 252% 100% 2
calc = 0.106
df= 3
p-value = 0.991168
Conclusion: Do not reject
where Ho: pj=pj0 for
j=1,2,3,4
PMIS Use Estimate Observed
Difference
Reporting Function Tools Item E-O
Overview on work-in-progress pu5_3 -0.335 54.68
Budget overruns pu5_1 -0.278 45.32
% CumPMIS Use
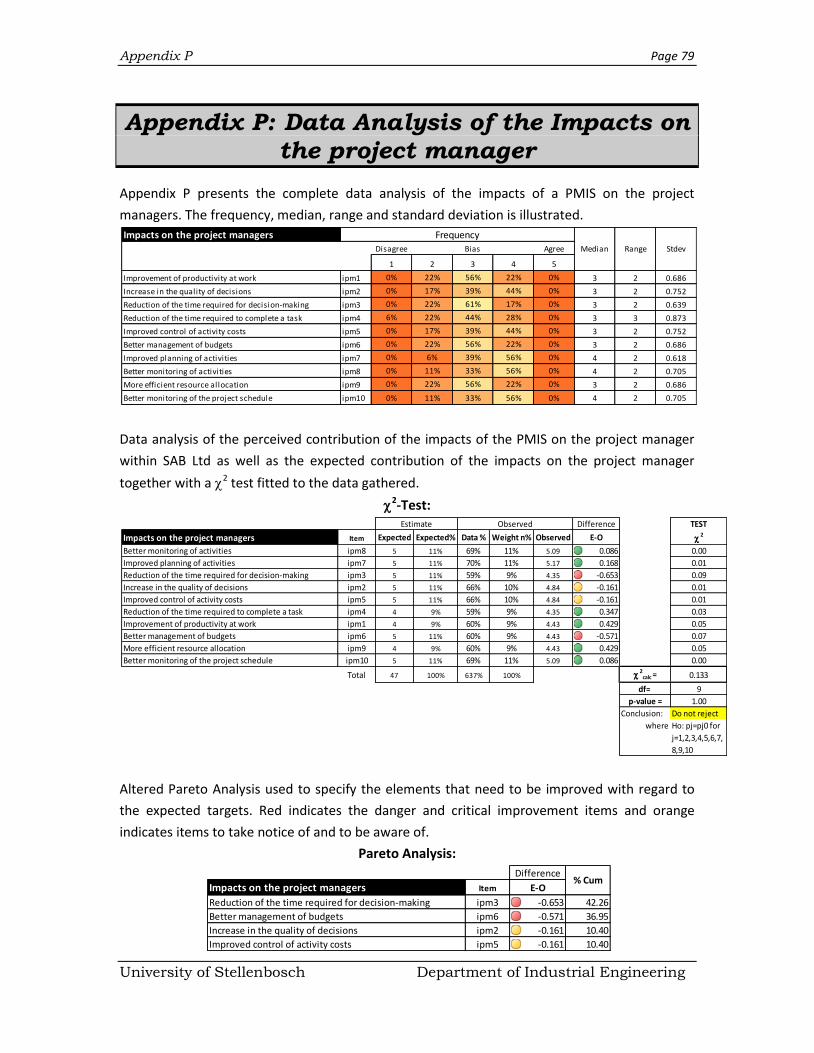
Appendix P Page 79
University of Stellenbosch Department of Industrial Engineering
Appendix P: Data Analysis of the Impacts on
the project manager
Appendix P presents the complete data analysis of the impacts of a PMIS on the project
managers. The frequency, median, range and standard deviation is illustrated.
Data analysis of the perceived contribution of the impacts of the PMIS on the project manager
within SAB Ltd as well as the expected contribution of the impacts on the project manager
together with a 2 test fitted to the data gathered.
2-Test:
Altered Pareto Analysis used to specify the elements that need to be improved with regard to
the expected targets. Red indicates the danger and critical improvement items and orange
indicates items to take notice of and to be aware of.
Pareto Analysis:
Impacts on the project managersDisagree Bias Agree
1 2 3 4 5
Improvement of productivity at work ipm1 0% 22% 56% 22% 0% 3 2 0.686
Increase in the quality of decisions ipm2 0% 17% 39% 44% 0% 3 2 0.752
Reduction of the time required for decision-making ipm3 0% 22% 61% 17% 0% 3 2 0.639
Reduction of the time required to complete a task ipm4 6% 22% 44% 28% 0% 3 3 0.873
Improved control of activity costs ipm5 0% 17% 39% 44% 0% 3 2 0.752
Better management of budgets ipm6 0% 22% 56% 22% 0% 3 2 0.686
Improved planning of activities ipm7 0% 6% 39% 56% 0% 4 2 0.618
Better monitoring of activities ipm8 0% 11% 33% 56% 0% 4 2 0.705
More efficient resource allocation ipm9 0% 22% 56% 22% 0% 3 2 0.686
Better monitoring of the project schedule ipm10 0% 11% 33% 56% 0% 4 2 0.705
FrequencyMedian Range Stdev
Difference TEST
Impacts on the project managers Item Expected Expected% Data % Weight n% Observed E-O 2
Better monitoring of activities ipm8 5 11% 69% 11% 5.09 0.086 0.00
Improved planning of activities ipm7 5 11% 70% 11% 5.17 0.168 0.01
Reduction of the time required for decision-making ipm3 5 11% 59% 9% 4.35 -0.653 0.09
Increase in the quality of decisions ipm2 5 11% 66% 10% 4.84 -0.161 0.01
Improved control of activity costs ipm5 5 11% 66% 10% 4.84 -0.161 0.01
Reduction of the time required to complete a task ipm4 4 9% 59% 9% 4.35 0.347 0.03
Improvement of productivity at work ipm1 4 9% 60% 9% 4.43 0.429 0.05
Better management of budgets ipm6 5 11% 60% 9% 4.43 -0.571 0.07
More efficient resource allocation ipm9 4 9% 60% 9% 4.43 0.429 0.05
Better monitoring of the project schedule ipm10 5 11% 69% 11% 5.09 0.086 0.00
Total 47 100% 637% 100% 2
calc = 0.133
df= 9
p-value = 1.00
Conclusion: Do not reject
where Ho: pj=pj0 for
j=1,2,3,4,5,6,7,
8,9,10
Estimate Observed
Difference
Impacts on the project managers Item E-O
Reduction of the time required for decision-making ipm3 -0.653 42.26
Better management of budgets ipm6 -0.571 36.95
Increase in the quality of decisions ipm2 -0.161 10.40
Improved control of activity costs ipm5 -0.161 10.40
% Cum
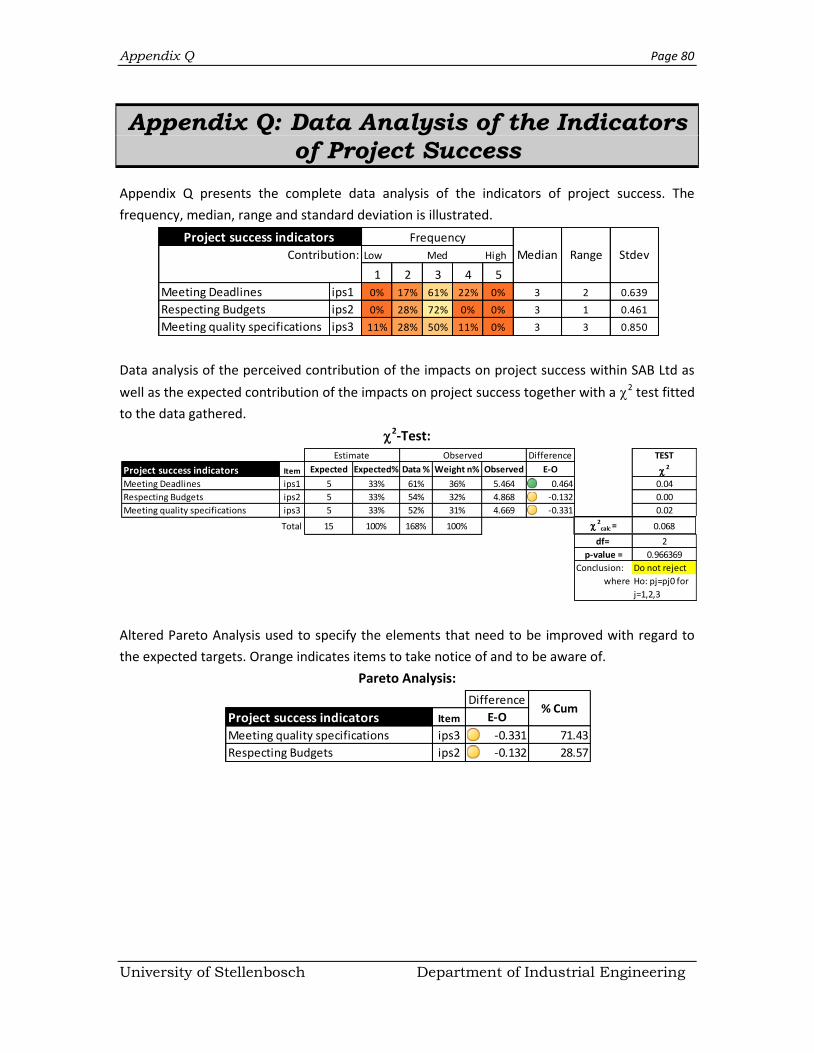
Appendix Q Page 80
University of Stellenbosch Department of Industrial Engineering
Appendix Q: Data Analysis of the Indicators
of Project Success
Appendix Q presents the complete data analysis of the indicators of project success. The
frequency, median, range and standard deviation is illustrated.
Data analysis of the perceived contribution of the impacts on project success within SAB Ltd as
well as the expected contribution of the impacts on project success together with a 2 test fitted
to the data gathered.
2-Test:
Altered Pareto Analysis used to specify the elements that need to be improved with regard to
the expected targets. Orange indicates items to take notice of and to be aware of.
Pareto Analysis:
Contribution: Low Med High
1 2 3 4 5
Meeting Deadlines ips1 0% 17% 61% 22% 0% 3 2 0.639
Respecting Budgets ips2 0% 28% 72% 0% 0% 3 1 0.461
Meeting quality specifications ips3 11% 28% 50% 11% 0% 3 3 0.850
Median Range Stdev
Project success indicators Frequency
Difference TEST
Project success indicators Item Expected Expected% Data % Weight n% Observed E-O 2
Meeting Deadlines ips1 5 33% 61% 36% 5.464 0.464 0.04
Respecting Budgets ips2 5 33% 54% 32% 4.868 -0.132 0.00
Meeting quality specifications ips3 5 33% 52% 31% 4.669 -0.331 0.02
Total 15 100% 168% 100% 2
calc = 0.068
df= 2
p-value = 0.966369
Conclusion: Do not reject
where Ho: pj=pj0 for
j=1,2,3
Estimate Observed
Difference
Project success indicators Item E-O
Meeting quality specifications ips3 -0.331 71.43
Respecting Budgets ips2 -0.132 28.57
% Cum


![Functional Gage Design[1]](https://img.pdfslide.net/doc/110x75/55cf9197550346f57b8ecfbc/functional-gage-design1.jpg)