Embed Size (px)
Citation preview

THE FUNDAMENTALS OF
PFAS ANALYSIS
&
THE ANALYTICAL
LABORATORY
Peter Philbrook
U.S. Environmental Protection Agency
Laboratory Services and Applied Science Division
11 Technology Drive
North Chelmsford, MA

SAMPLE CONTAINER SIZE
250 mL – There is a reason!
❖Specific requirements for
sample containers
❖Extraction technique
requires bottle rinsing (2
steps)
❖Preservation integrity

• Polypropylene or HDPE - PFAS stick to glass!
• Entire water sample is extracted
• Container is rinsed – 2X Water then Methanol
• Sample Preservative Anti-bacterial & Dechlorination
• Trizma (EPA 537) or Ammonium Acetate (EPA 533)
• Multiple bottles required for QC (3) Spike / Dup
• Field Reagent Blanks (FRBs)
• Field contamination can be a real issue
• 14 Day Hold Time (Chilled 40C)
• Most often – the lab is going to supply containers
Aqueous Sampling Requirement Drill Down

SOLID PHASE EXTRACTION (SPE)
Sample preparation technology
Solid particles in a cartridge
Chemically separates different components of a sample
Mobile phase (liquid) Stationary phase (solid)

SAMPLE EXTRACTION
• Vacuum assisted manifold
• Water sample passes through SPE cartridge
• Target compounds are adsorbed
• Target compounds are eluted with methanol
KOOL-AID CHROMATOGRAPHY
Red 40 (Allura Red AC)
MW = 496
Blue 1 (Brilliant Blue FCF)
MW= 793
The Color Purple

ANALYTICAL CHEMISTRY
Chemical Analysis is used on many fields of science
Critical in many aspects of life - medical, pharmacology, geology, oceanography, air and water pollution
QUALITATIVE
ANALYSIS
WHAT?
QUANTITATIVE
ANALYSIS
HOW MUCH?

CHROMATOGRAPHY
The science of
separation
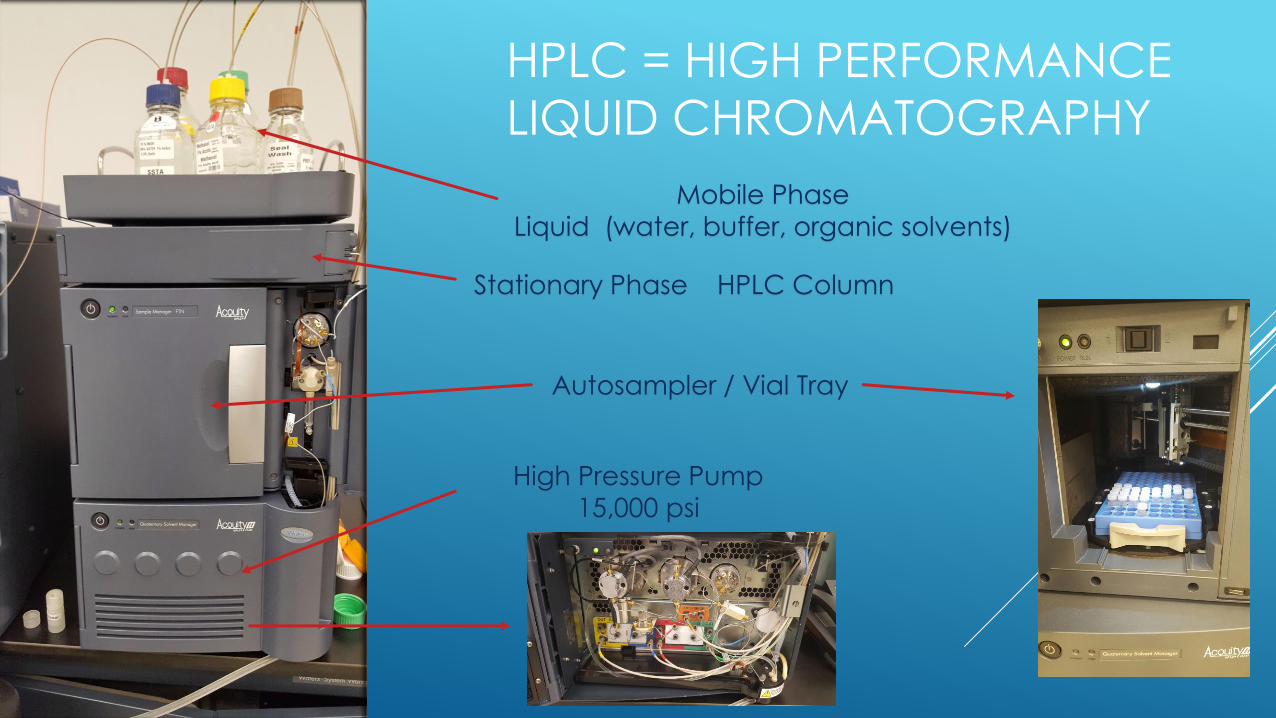
Mobile Phase
Liquid (water, buffer, organic solvents)
HPLC = HIGH PERFORMANCE
LIQUID CHROMATOGRAPHY
Stationary Phase HPLC Column
Autosampler / Vial Tray
High Pressure Pump
15,000 psi

min6.700 6.800 6.900 7.000 7.100 7.200 7.300
%
0
F5:MRM of 1 channel,ES-
413 > 368.8
15OCT2019A008 Smooth(Mn,2x4)
Sigma 1 ng/mL
2.383e+004
PFOA
7.13
1427
COLUMN
CHROMATOGRAPHY
min6.700 6.800 6.900 7.000 7.100 7.200 7.300
%
0
F5:MRM of 1 channel,ES-
413 > 368.8
15OCT2019A008 Smooth(Mn,2x4)
Sigma 1 ng/mL
2.383e+004
PFOA
7.13
1427
min6.700 6.800 6.900 7.000 7.100 7.200 7.300
%
0
F5:MRM of 1 channel,ES-
413 > 368.8
15OCT2019A008 Smooth(Mn,2x4)
Sigma 1 ng/mL
2.383e+004
PFOA
7.13
1427
FLOW
Inject
sample
extractHPLC column separates
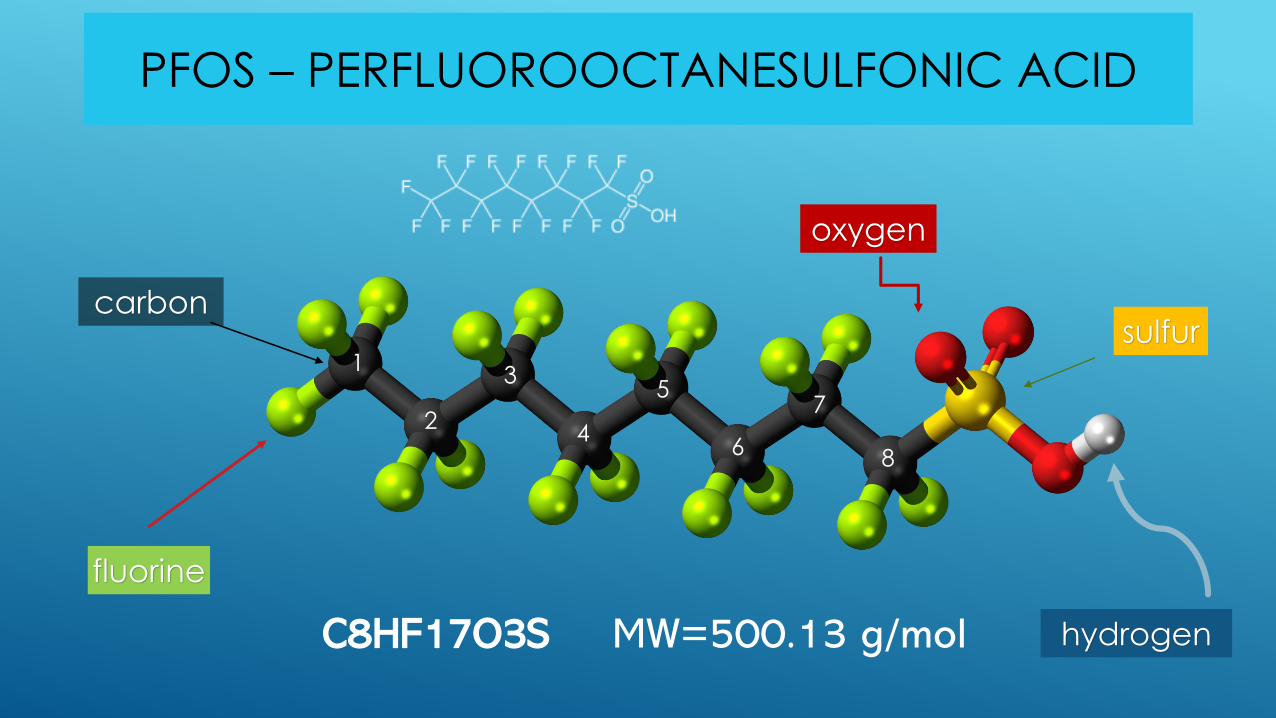
PFOS – PERFLUOROOCTANESULFONIC ACID
carbon
fluorine
sulfur
hydrogen
oxygen
C8HF17O3S MW=500.13 g/mol
4
31
27
6
5
8

Peak Target RT Peak
Asymmetry
A PFBA 3.29 0.98
B PFPeA 4.68 1.19
C PFBS 5.10 1.21
D PFHxA 5.67 1.08
E PFHpA 6.41 1.55
F PFHXS 6.58 1.53
G PFOA 6.95 1.67
H PFNA 7.42 1.77
I PFOS 7.54 1.44
J PFDA 7.82 1.38
K PFuNA 8.14 1.33
L PFDS 8.23 1.30
M PFDoA 8.45 1.53
N PFTrDA 8.70 1.62
O PFTeDA 8.89 1.82
HPLC – chromatography
of 15 PFAS compounds
1 drop = 50 uL
Injecting 1/10th of a drop

Mass Spectrometer
Electrospray
Ionization
ESI +/-
Probe
Ion Plume
3-4 K Volts !

LC-MS/MS
Precursor Ion Product Ion
Collision Cell
PFOS 500 g/mol
Precursor = 499
Product = 80
electrospray
negative
--
--
-
-
-
--
--
-
--
-
--

MASS SPECTROMETRY
SPE - LC/MS/MS
Collision CellQuadrupole

CALIBRATION
AND
QUANTITATION
Compound name: PFOA
Correlation coefficient: r = 0.999863, r^2 = 0.999726
Calibration curve: 0.0327837 * x + 0.00290069
Response type: Internal Std ( Ref 6 ), Area * ( IS Conc. / IS Area )
Curve type: Linear, Origin: Include, Weighting: 1/x, Axis trans: None
ng/mL-0.0 5.0 10.0 15.0 20.0 25.0 30.0 35.0 40.0 45.0 50.0
Re
sp
on
se
-0.00
0.20
0.40
0.60
0.80
1.00
1.20
1.40
1.60
min6.700 6.800 6.900 7.000 7.100 7.200 7.300
%
0
F5:MRM of 1 channel,ES-
413 > 368.8
15OCT2019A008 Smooth(Mn,2x4)
Sigma 1 ng/mL
2.383e+004
PFOA
7.13
1427
min6.700 6.800 6.900 7.000 7.100 7.200 7.300
%
0
F5:MRM of 1 channel,ES-
413 > 368.8
15OCT2019A008 Smooth(Mn,2x4)
Sigma 1 ng/mL
2.383e+004
PFOA
7.13
1427

BACKGROUND
&
FIELD
CONTAMINATION
Teflon Solvent Line / Reagent Water
Teflon cap liners on solvent bottles
Teflon tipped syringes
Teflon frits
SPE apparatus – lines, solvents, frits, transfer tubing
Weatherproof Anything – Books,jackets
Autosampler Vials

PFAS ANALYSIS – WHY SO MUCH?

BREAKDOWN OF ANALYSIS COST
1. Triple Quad Mass Spectrometer $400K
2. HPLC System $100K
3. Software/Hardware $ 50K
4. Annual Support Plan $ 23K
5. Manual Labor – 2 hours per 10 samples
6. Training
7. Consumables SPE, HPLC Columns, Sampling Containers, Solvents/Reagents
8. Analytical Standards – Isotopically Labeled –Isotope Dilution
9. Throughput – More = Less Cost per Sample

$$$$$$$$ Isotope dilution $$$$$$$$
ISO
TO
PE
DIL
UTIO
N
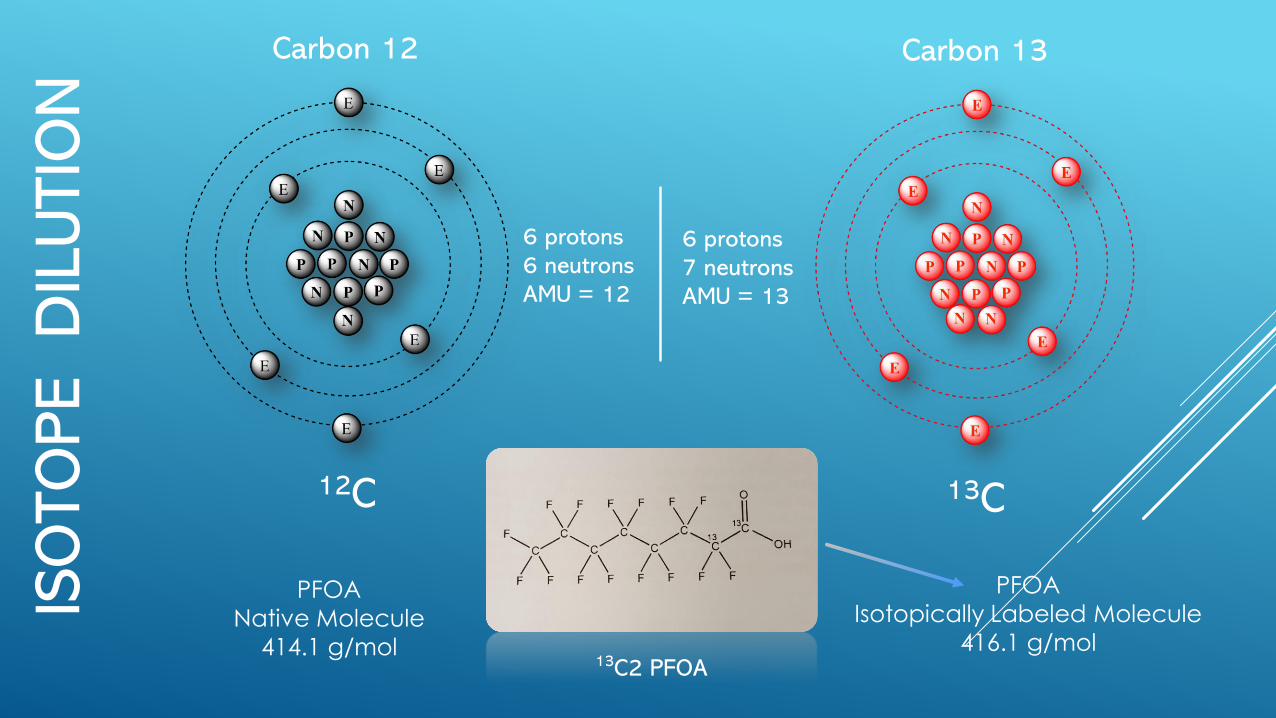
12C 13C
Carbon 12 Carbon 13
6 protons
6 neutrons
AMU = 12
6 protons
7 neutrons
AMU = 13
13C2 PFOA
PFOA
Native Molecule
414.1 g/mol
PFOA
Isotopically Labeled Molecule
416.1 g/mol

DAILY SODIUM INTAKE = 2,300 MG (~A TEASPOON)
Home Recipe for: 70 ng/L batch of sodium
• Turn shower on full blast (2 gallons per minute)
• Add a level tsp of table salt (NaCl)• Come back in 8 years and 3 months and
turn water off
• Or add tsp salt to 8,674,286 gallons
That’s equivalent to 3 miles of above ground pools!
638 of them * 24’ Diameter @13,594 gallons each

Questions?
THANK YOU!