Embed Size (px)
Citation preview

The Future of Chinese Travel The Global Chinese Travel Market
A report by Oxford Economics for InterContinental® Hotels Group (IHG®)

1
Contents
Executive Summary
Introduction
1 Background
2 Global destinations for Chinese travel
3 Chinese Traveller Spending
4 Additional Opportunities
5 Conclusion And Recommendations
Annex: Global City Travel Data Tables – breakdown by country
Annex: City Calculation Methodology
2
6
8
16
28
38
46
50
66
2 3
Executive Summary
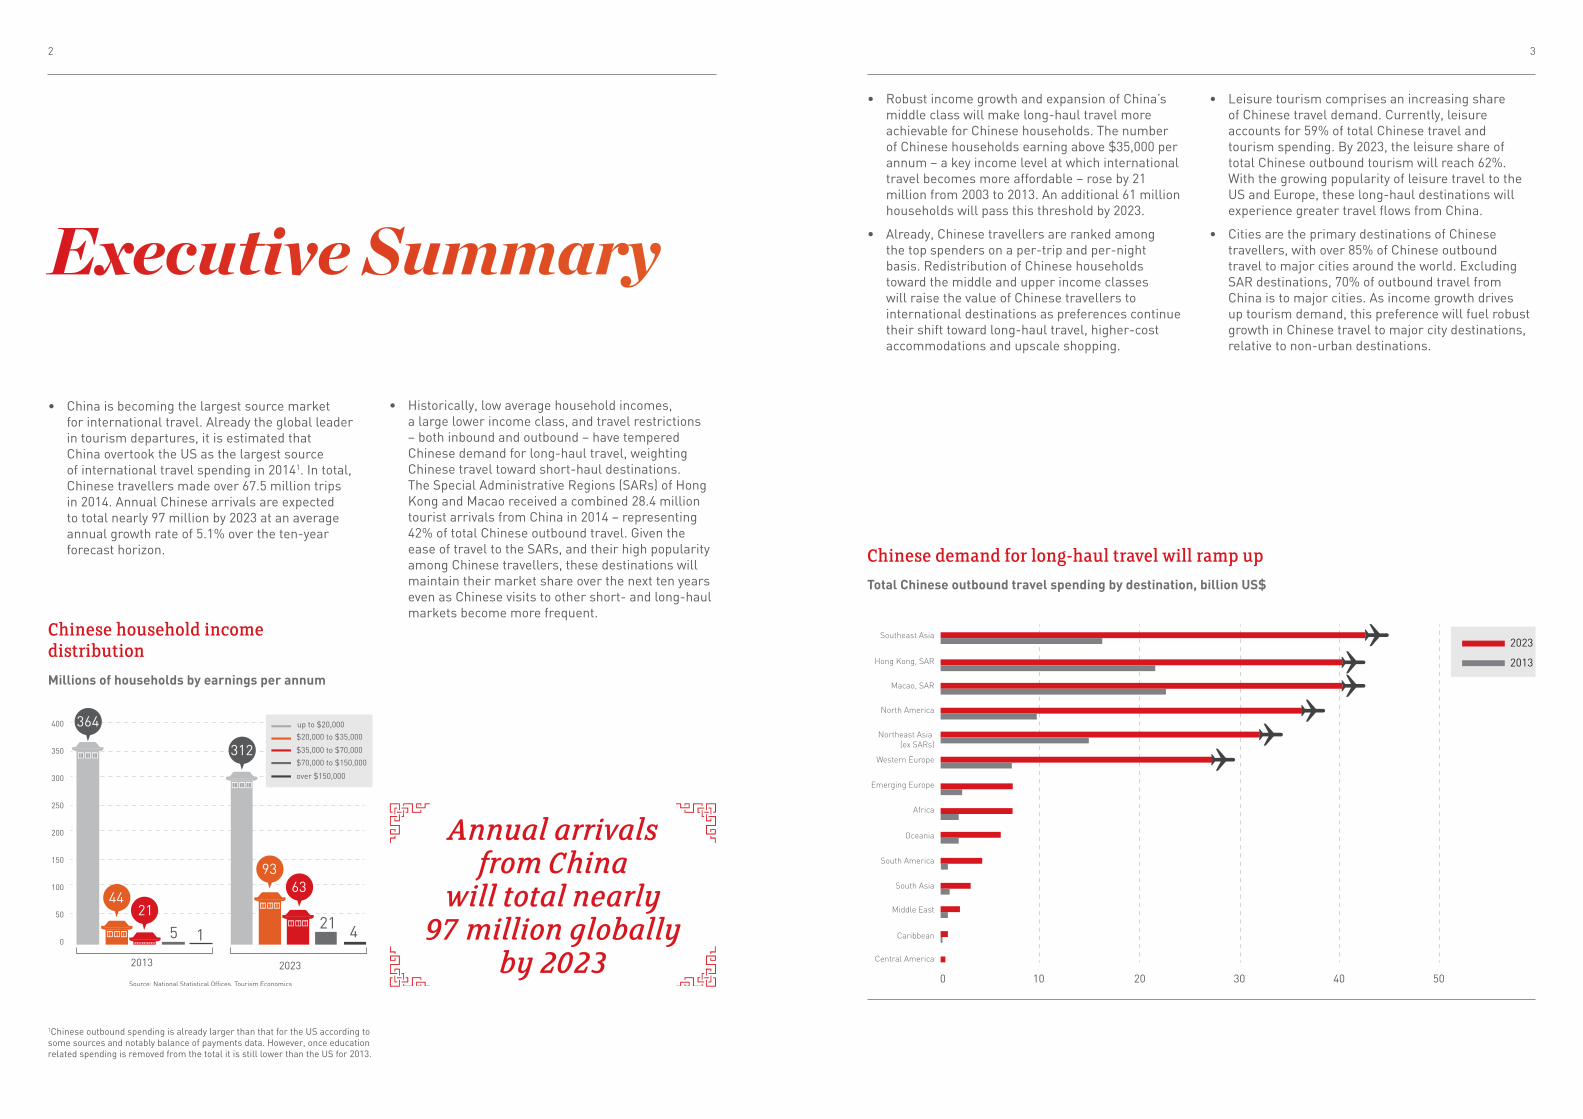
• China is becoming the largest source market for international travel. Already the global leader in tourism departures, it is estimated that China overtook the US as the largest source of international travel spending in 20141. In total, Chinese travellers made over 67.5 million trips in 2014. Annual Chinese arrivals are expected to total nearly 97 million by 2023 at an average annual growth rate of 5.1% over the ten-year forecast horizon.
• Robust income growth and expansion of China’s middle class will make long-haul travel more achievable for Chinese households. The number of Chinese households earning above $35,000 per annum – a key income level at which international travel becomes more affordable – rose by 21 million from 2003 to 2013. An additional 61 million households will pass this threshold by 2023.
• Already, Chinese travellers are ranked among the top spenders on a per-trip and per-night basis. Redistribution of Chinese households toward the middle and upper income classes will raise the value of Chinese travellers to international destinations as preferences continue their shift toward long-haul travel, higher-cost accommodations and upscale shopping.
1Chinese outbound spending is already larger than that for the US according to some sources and notably balance of payments data. However, once education related spending is removed from the total it is still lower than the US for 2013.
400
521 41
350
300
250
200
150
100
2013
Source: National Statistical Offices, Tourism Economics
2023
50
0
364
312
4421
6393
up to $20,000
$20,000 to $35,000
$35,000 to $70,000
$70,000 to $150,000
over $150,000
Southeast Asia2023
2013Hong Kong, SAR
Macao, SAR
North America
Northeast Asia (ex SARs)
Western Europe
Emerging Europe
Africa
Oceania
South America
South Asia
Middle East
Caribbean
Central America
100 20 30 40 50
• Leisure tourism comprises an increasing share of Chinese travel demand. Currently, leisure accounts for 59% of total Chinese travel and tourism spending. By 2023, the leisure share of total Chinese outbound tourism will reach 62%. With the growing popularity of leisure travel to the US and Europe, these long-haul destinations will experience greater travel flows from China.
• Cities are the primary destinations of Chinese travellers, with over 85% of Chinese outbound travel to major cities around the world. Excluding SAR destinations, 70% of outbound travel from China is to major cities. As income growth drives up tourism demand, this preference will fuel robust growth in Chinese travel to major city destinations, relative to non-urban destinations.
• Historically, low average household incomes, a large lower income class, and travel restrictions – both inbound and outbound – have tempered Chinese demand for long-haul travel, weighting Chinese travel toward short-haul destinations. The Special Administrative Regions (SARs) of Hong Kong and Macao received a combined 28.4 million tourist arrivals from China in 2014 – representing 42% of total Chinese outbound travel. Given the ease of travel to the SARs, and their high popularity among Chinese travellers, these destinations will maintain their market share over the next ten years even as Chinese visits to other short- and long-haul markets become more frequent.
Chinese demand for long-haul travel will ramp up
Chinese household income distribution
Total Chinese outbound travel spending by destination, billion US$
Millions of households by earnings per annum
Annual arrivals from China
will total nearly 97 million globally
by 2023

4 5
• Whereas the volume of arrivals from China to global destinations varies considerably, average length of stay is a more meaningful measure for comparing the value of Chinese tourists across global cities. Sydney and Melbourne enjoy the highest trip lengths among long-haul markets in the Asia-Pacific region. While New York City, Los Angeles, and Tokyo represent the top three destinations for Chinese travellers in terms of visits, they enjoy a somewhat lower length of stay than Bangkok and Pattaya in Thailand. Among
• Destinations with easier access, including simpler visa policies, are set to gain the most. Additional measures to improve visitor visa access present even greater opportunities for tourism growth to these destination countries. Analysis of historical travel facilitation reforms affecting Chinese nationals shows that these reforms yielded an average growth premium of 19.9 percentage points in Chinese arrivals above historical trend. This implies that destinations which adopt facilitative policies could see a substantial growth premium in Chinese arrivals over a three-year forecast horizon. Examples of these reforms include extending visas on arrival (VoA) and visa waivers to Chinese nationals, as well as the addition of destination countries to China’s Approved Destination Status (ADS) scheme.
European cities, London enjoys the highest average trip length for Chinese travellers, topping several other leading long-haul destinations.
• Nearly 92.5% of total Chinese outbound travel spending is received by major global cities – 44% excluding Hong Kong and Macao. The largest city markets for Chinese travel spending are mostly found in the Asia-Pacific and the US. However, spending growth over the next decade will see more long-haul cities rise to the top.
Source: Tourism Economics
400
600
800
200
0
New
York
City
Los
Ange
les
Toky
oBa
ngko
kPa
ttaya
San
Fran
cisc
oKu
ala
Lum
pur
Seou
lW
ashi
ngto
n, D
CLa
s Ve
gas
Veni
ceM
ilan
Rom
eFl
oren
ceBa
li
(Jim
aran
, Tub
an)
Source: Tourism Economics
1,000
1,500
2,000
2,500
500
0
Bang
kok
Patta
yaN
ew Yo
rk C
ityLo
s An
gele
sTo
kyo
San
Fran
cisc
oW
ashi
ngto
n, D
CM
iam
iYe
llow
ston
e (N
P)Sy
dney
Phuk
etLo
ndon
Mila
nOs
aka
Kual
a Lu
mpu
r
5
10
15
20
0
Unite
d St
ates
Thai
land
Taiw
anSo
uth
Kore
a
Japa
n
Thailand
Taiw
an
South Korea
Japan
Sing
apor
eAu
stra
lia
Mal
aysi
a
Italy
Cana
da
Viet
nam
Germ
any
Fran
ceSw
itzer
land
Russ
iaUn
ited
King
dom
Sout
h Af
rica
Indo
nesi
aN
ethe
rland
s
Braz
ilAg
entin
a
Spai
n
Indi
a
United States
Baseline
Incremental gain from travel facilitation
Improving access to travel for the Chinese yields a nearly 20%
growth premium in arrivals
Chinese traveller arrivals to top city destinations
Chinese traveller hotel nights in top city destinations
Growth premium from travel facilitation
Absolute growth in thousands, 2013 - 2023 Absolute growth in thousands, 2013 - 2023
Chinese Traveller Spending, billion US$ 2017
Source: Tourism Economics Source: Tourism Economics
Source: Tourism Economics Note: Hong Kong and Macao growth premiums excluded to improve scale

6 7
Introduction
This report examines trends in Chinese outbound travel in the context of economic and demographic developments and projects how Chinese travel demand will evolve over the coming decade. The research provides a unique perspective of which destinations - both cities and countries - are set to benefit most from this growth in Chinese travel demand. Modelling has linked expected growth in income and spending to total tourism demand. The potential benefit for different worldwide destinations has also been identified in comparison to overall growth in Chinese outbound travel.
In particular, global city destinations are identified as key growth markets for Chinese outbound tourism. Given that cities are the primary loci of growth in China’s mid- to upper-class households, global city destinations are expected to receive a greater share of additional Chinese outbound tourism relative to non-urban destinations. The increasing preference for long-haul leisure travel, higher-cost accommodations,
and high-end shopping are also explored as drivers of the increasing value of Chinese travellers to these city destinations over the forecast horizon.
As countries globally look for new sources of income and job creation, the potential benefits from improved travel policies in terms of boosting visitor numbers are also explored, offering recommendations and best practices for global destinations. Historical case studies of travel-related reforms affecting Chinese travel provide the basis for an alternative scenario which addresses the potential impacts on Chinese tourist arrivals and travel spending within destination markets pursuing such reforms.

8 9
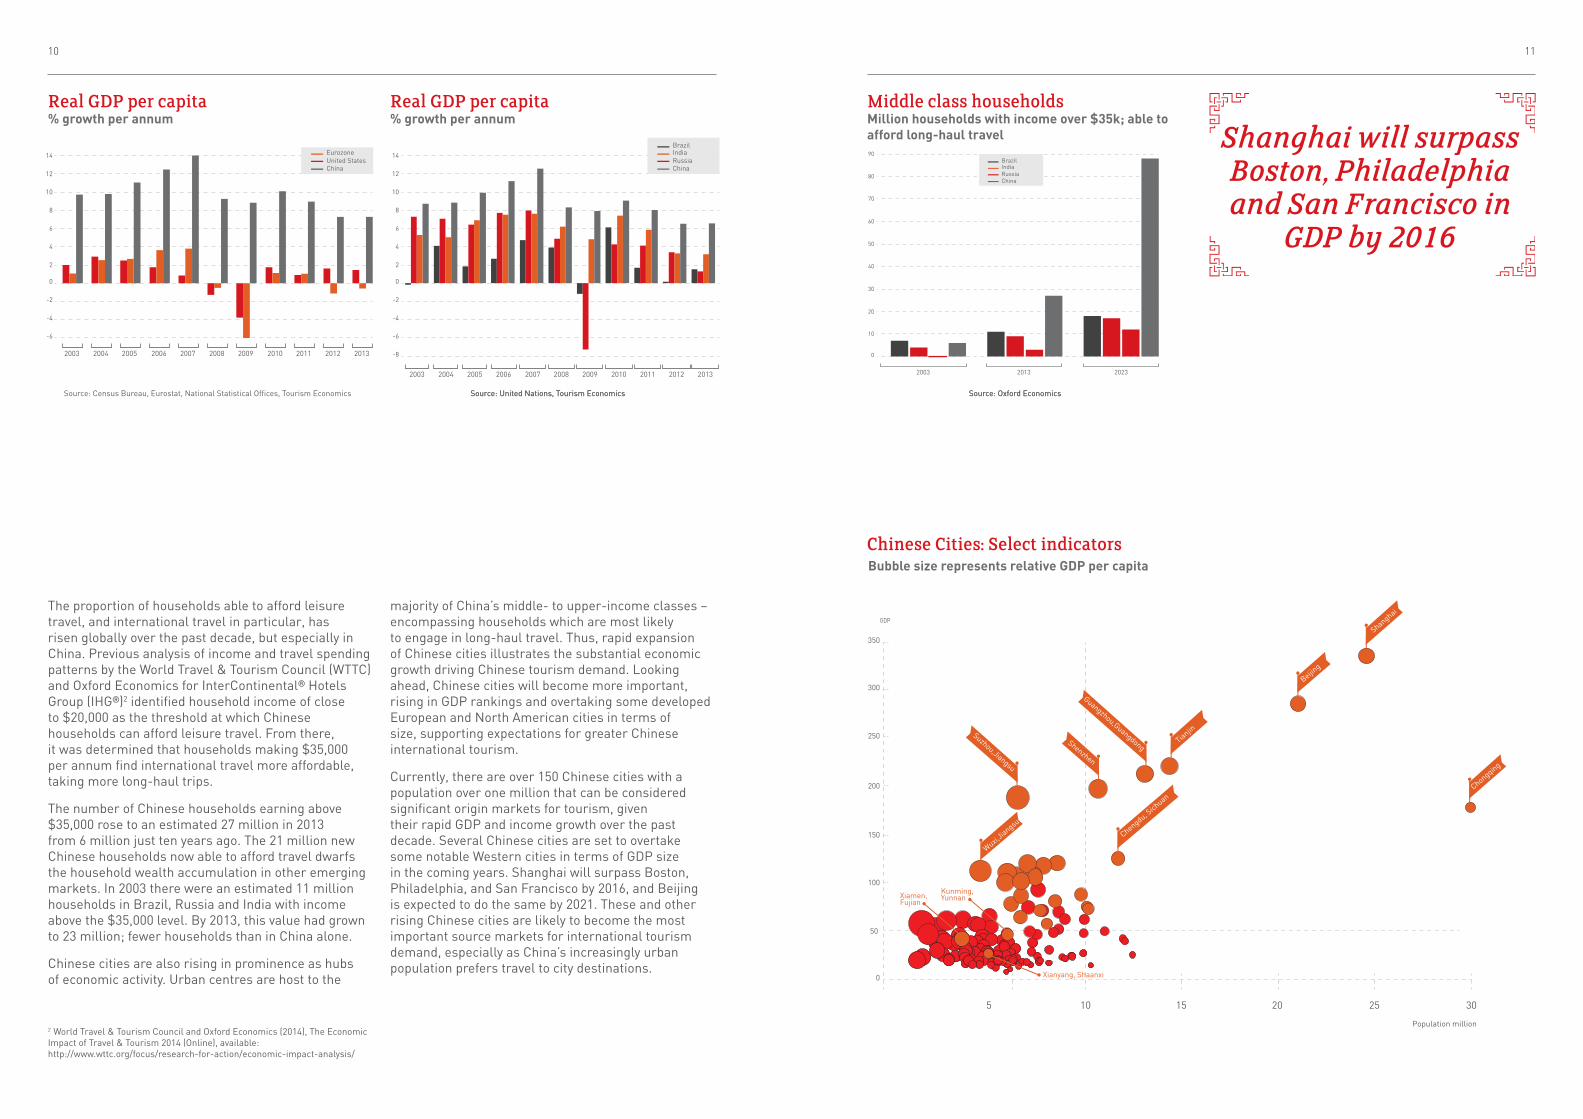
1.1 Favourable economic and demographic trendsChina has experienced phenomenal economic growth over the past decade with GDP per capita outperforming other large emerging markets. Growth has exceeded that of the other BRIC economies which represent the largest emerging markets experiencing rapid growth.
The size of the Chinese middle class has expanded massively as average income has risen. GDP per capita has increased in real terms to close the gap on developed countries with growth of 148% over the past ten years. Between 2003 and 2013, GDP per capita grew at an average annual rate of 5.5% in the BRIC economies, dwarfing rates of 0.7% and 0.9% across the Eurozone and in the US, respectively. Growth in Chinese GDP per capita led that of both key emerging markets and developed economies over this period, and average incomes are expected to rise further as the economy continues to develop.
1. Background
China has experienced phenomenal economic
growth over the past decade
10 11
The proportion of households able to afford leisure travel, and international travel in particular, has risen globally over the past decade, but especially in China. Previous analysis of income and travel spending patterns by the World Travel & Tourism Council (WTTC) and Oxford Economics for InterContinental® Hotels Group (IHG®)2 identified household income of close to $20,000 as the threshold at which Chinese households can afford leisure travel. From there, it was determined that households making $35,000 per annum find international travel more affordable, taking more long-haul trips.
The number of Chinese households earning above $35,000 rose to an estimated 27 million in 2013 from 6 million just ten years ago. The 21 million new Chinese households now able to afford travel dwarfs the household wealth accumulation in other emerging markets. In 2003 there were an estimated 11 million households in Brazil, Russia and India with income above the $35,000 level. By 2013, this value had grown to 23 million; fewer households than in China alone.
Chinese cities are also rising in prominence as hubs of economic activity. Urban centres are host to the
majority of China’s middle- to upper-income classes – encompassing households which are most likely to engage in long-haul travel. Thus, rapid expansion of Chinese cities illustrates the substantial economic growth driving Chinese tourism demand. Looking ahead, Chinese cities will become more important, rising in GDP rankings and overtaking some developed European and North American cities in terms of size, supporting expectations for greater Chinese international tourism.
Currently, there are over 150 Chinese cities with a population over one million that can be considered significant origin markets for tourism, given their rapid GDP and income growth over the past decade. Several Chinese cities are set to overtake some notable Western cities in terms of GDP size in the coming years. Shanghai will surpass Boston, Philadelphia, and San Francisco by 2016, and Beijing is expected to do the same by 2021. These and other rising Chinese cities are likely to become the most important source markets for international tourism demand, especially as China’s increasingly urban population prefers travel to city destinations.
Shanghai will surpass Boston, Philadelphia and San Francisco in
GDP by 2016
2 World Travel & Tourism Council and Oxford Economics (2014), The Economic Impact of Travel & Tourism 2014 (Online), available: http://www.wttc.org/focus/research-for-action/economic-impact-analysis/
Source: Census Bureau, Eurostat, National Statistical Offices, Tourism Economics Source: United Nations, Tourism Economics Source: Oxford Economics
Real GDP per capita Real GDP per capita Middle class households % growth per annum % growth per annum Million households with income over $35k; able to
afford long-haul travel
10 15 20 25 305
50
0
100
150
200
250
300
350
GDP
Population million
Shanghai
Chongqing
Beijing
Tianjin
Guangzhou,GuangdongShenzhen
Suzhou,Jiangsu
Wuxi,Jiangsu
Kunming,Yunnan
Xianyang, Shaanxi
Xiamen,Fujian
Chengdu, Sich
uan
Chinese Cities: Select indicatorsBubble size represents relative GDP per capita
2
14
4
6
8
10
12
0
-2
-4
-6
2003 2004 2005 2006 2007 2008 2009 2010 2011 2012 2013
EurozoneUnited StatesChina
2
14
4
6
8
10
12
0
-2
-4
-6
-8
2003 20052004 2006 20082007 2009 2010 2011 2012 2013
IndiaRussia
Brazil
China
50
20
30
10
40
60
80
0
70
90
2003 2013 2023
IndiaRussia
Brazil
China
Source: United Nations, Tourism Economics Source: Oxford Economics
Population million

12 13
1.2 Demand for international travel will grow further Chinese incomes are set to grow further over the coming decade and beyond, catching up further with developed countries in terms of average income. Oxford Economics predicts that 61 million more households will be able to afford international travel by 2023, cementing China’s place as the top origin market. China is currently on par with the US as a source market and is set to become the largest long-haul source market, surpassing the UK, US, and Germany, by 2020.
The countries with the greatest opportunities for growth in coming years are those that currently represent smaller shares of outbound Chinese travel. The United States stands out as a destination which receives a relatively low share of Chinese travel – about 3% in 2013 – but will experience strong growth, as a result of increasing efforts to boost inbound travel via improvements to visitor visas and marketing efforts. Similarly, the United Kingdom will see Chinese arrivals more than double over the next decade – due, in part, to ongoing visa improvements.
Expected changes in China’s income distribution suggest that Chinese travellers will become more valuable to foreign destination markets in the next eight years. According to the World Travel Organization (UNWTO) and European Travel Commission (ETC)5,
Chinese – even those at lower income levels – spend around 53% of their disposable income on travel – excluding spending on necessities.
The number of low-income households with high propensity for booking short-haul trips and low-cost accommodations – those earning between $20,000 to $35,000 per annum – will more than double by 2023 to 92.6 million. The number of Chinese households earning between $35,000 and $70,000 – the income bracket where demand gravitates toward long-haul trips and higher-cost accommodations – will nearly triple to 63 million. Most promising is the expected quadrupling in the number of Chinese households making $70,000 to $150,000 by 2023 to 21.3 million. Travellers in the highest income bracket are most likely to opt for luxury accommodations and tend to spend more while on long-haul trips.
As Chinese tourism demand matures we expect preferences to shift toward more expensive, longer-haul experiences. Tourism demand by origin market tends to evolve from domestic to short-haul to long-haul travel as growth in the proportion of middle class households causes average incomes to rise. Rapid growth in the number of middle to upper class households in China will fuel the transition toward long-haul travel and raise the average value of Chinese travellers to destinations markets.
0
50
100
150
200
250
300 80
70
60
50
40
30
20
10
0
%
Forecast
2003 2004 2005 2006 2007 2008 2009 2010 2011 2012 2013 2014 2015 2016 2017 2018 2019 2020 2021 2022 2023
Business share of total T&T spending (R)Business (L)Leisure (L)
Leisure travel has begun to represent a greater share of total Chinese travel demand. Historically, outbound travel demand has been dominated by business travel; less than ten years ago business travel spending comprised over three-quarters of total Chinese international travel spending. Business travel now accounts for less than half of Chinese demand and could fall further as household income and leisure demand continue to mature. By 2023, leisure trips are expected to account for 62% of total Chinese outbound travel.
Long-haul leisure travel destinations are set to benefit the most from evolving demand. There is potential for even stronger growth in some destinations as further moves can be made to ease access or to attract Chinese tourists. The top long-haul destination countries for Chinese travellers – namely the United States, France, and Germany – will likely remain the most popular, but outbound volumes and spending from China to these and other long-haul destinations are set for considerable growth.
5 European Travel Commission and World Tourism Organization (2013), The Chinese Outbound Travel Market– 2012 Update, UNWTO, Madrid.
China travel and tourism spending by purpose of tripChinese household income distribution Chinese household income distributionShare of Chinese households by income class Share of Chinese households by income class Billion US$
Source: IMF, UNWTO/ Ministry of Tourism, Tourism EconomicsSource: National Statistical Offices, Tourism Economics
20232013
Source: National Statistical Offices, Tourism Economics
Top long-haul country arrivals, 2013-2023
Rank Market
Absolute growth
(‘000 arrivals)
1 United States 3,431
2 France 1,221
3 Germany 909
4 Russia 541
5 Switzerland 474
6 Austria 377
7 Italy 359
8 Belgium 343
9 Netherlands 322
10 United Kingdom 299
Up to $20k83.7%
$20k to $35k10.1%
$35k to $70k4.9%
$70k to $150k1.1% Over $150k
0.2%
Up to $20k63.4%
$20k to $35k18.8%
$35k to $70k12.8%
$70k to $150k4.3%
Over $150k0.8%

14 15
1.3 Domestic vs outbound tourism demand Chinese tourism has largely remained within domestic borders to date, although outbound travel has grown strongly. Today, over 90% of Chinese travellers stay at domestic hotels. Fewer than 15% of all trips made by Chinese citizens are outbound, albeit a higher proportion than in previous years.
Domestic tourism demand within China is five times larger than it was ten years ago. In the latest estimates by Tourism Economics, there were almost one billion visitor arrivals at accommodation establishments in 2013, generating 1.6 billion room nights. This is equivalent to around 1.2 room nights per capita, up from a ratio of 0.3 ten years ago. By comparison, US domestic room demand per capita is around 4.3 room nights.
Domestic tourism demand will continue to grow despite some loss of market share to international destinations.
Domestic Chinese travel demand is highly concentrated within cities. We calculate that in 2013 around two-thirds of Chinese domestic travel was concentrated within the largest 30 cities in China, in terms of population. This proportion has remained relatively stable over the last ten years.
20 percent of domestic travel is currently located in the Tier 1 Chinese cities of Shanghai, Beijing, Guangzhou and Shenzhen6. As business and administrative centres, these major cities are unsurprisingly significant destinations for both leisure and business tourism. They are also key gateways for foreign tourism. Increased length of stay for major cities has been especially evident in Tier 1 cities as tourism has evolved to include leisure visits.
The strongest domestic tourism growth over the past ten years has been within Tier 2 cities7, helped by large scale supply-side developments – including improvements to tourism facilities, hotels, and infrastructure.
0
400
200
600
800
1200
1000
1400
1600
86
87
88
89
90
91
92
93
94
95
85
%
Forecast
2003 2004 2005 2006 2007 2008 2009 2010 2011 2012 2013 2014 2015 2016 2017 2018 2019 2020 2021 2022 2023
Domestic hotel guests share of total resident travel* (R)Outbound travel (L)Domestic guests (L)
0
400
200
600
800
1200
1000
1400
1600
1800
0
2
4
6
8
10
12
14
16
%
Forecast
2003 2004 2005 2006 2007 2008 2009 2010 2011 2012 2013 2014 2015 2016 2017 2018 2019 2020 2021 2022 2023
Outbound share of total travel spending (R)Outbound (L)Domestic (L)
6 Cities with 16 million households and $1 trillion in total household income – according to Nielsen
7 Cities with 38 million households and $2 trillion in total household income – according to Nielsen
Chinese guests in foreign and domestic hotels
China travel spending by destination
Thousands
Billion US$
Source: IMF, UNWTO/ Ministry of Tourism, Tourism Economics* Resident travel = domestic hotel guests+ outbound travel
Source: UNWTO/ Ministry of Tourism, Tourism Economics
* Resident travel = domestic hotel guests+ outbound travel
Domestic demand for visitor
accommodation within China
hit 1.6bn room nights in 2013

2.1 CitiesarekeydestinationsOver 85% of Chinese international travel is to major city destinations, including travel to Hong Kong and Macao. Excluding these Greater China or SARs destinations, the proportion falls to around 70%, but it is clear that cities represent a large proportion of Chinese travel demand.8 By comparison, total international travel to major cities from all origin markets represents around 45.1% of all travel demand. Identifying where Chinese travellers go to within destination countries is essential to understanding this rapidly expanding origin market.
Chinese travel preference has been influenced in the past by a high proportion of business travel, skewing volumes towards cities as business centres. However, business travel currently accounts for less than half of all Chinese international travel demand. The proportion of total Chinese travel to cities remains high, indicating a preference for leisure travel to cities as well.
This fits with the key travel modes of Chinese tourists, who tend to travel as part of a package trip involving group tours with multiple destination stops. This type
of travel is well suited to overnight city visits allowing major sights to be seen in close proximity to the hotel.
Among the top destination countries, major cities alone receive almost half of each country’s total Chinese visitors. For example, Bangkok accounts for over 40% of Chinese room demand in Thailand while Seoul generates just below 50% of room demand in Korea.
At the extremes, London accounts for over 60% of all Chinese stays in the UK, and Auckland receives a similar proportion of total Chinese travel to New Zealand, while Sao Paolo attracts over 70% of Chinese visitors to Brazil.9
The comparison of top global city destinations by arrival numbers provides some important insights about the behaviour of Chinese travellers. For instance, the fact that several Italian cities – namely Milan, Florence, and Venice – appear on the top for arrivals while other popular European cities – such as London and Paris – are absent does not necessarily mean that these destinations are more popular among Chinese tourists.10
2. Global destinations for Chinese travel
Over 85% of Chinese international travel is to major city destinations
16 17
8 Arrivals at all cities within a country can exceed the country total due to visits to multiple cities within the same trip.
10 The country-level arrivals data for Italy represent the sum of all arrivals at hotels at the city level – rather than arrivals at borders, as is the case with most European countries. Since Chinese visitors tend to stay in more than five Italian cities per country visit, their length of stay in a given Italian city is far lower than that in London or Paris – where visitors spend the bulk of their nights per country visit.
9 Arrivals are measured within this study as travel involving at least one overnight in a hotel establishment or other paid accommodation. Visits to friends and relatives are not included in these trends.
18 19
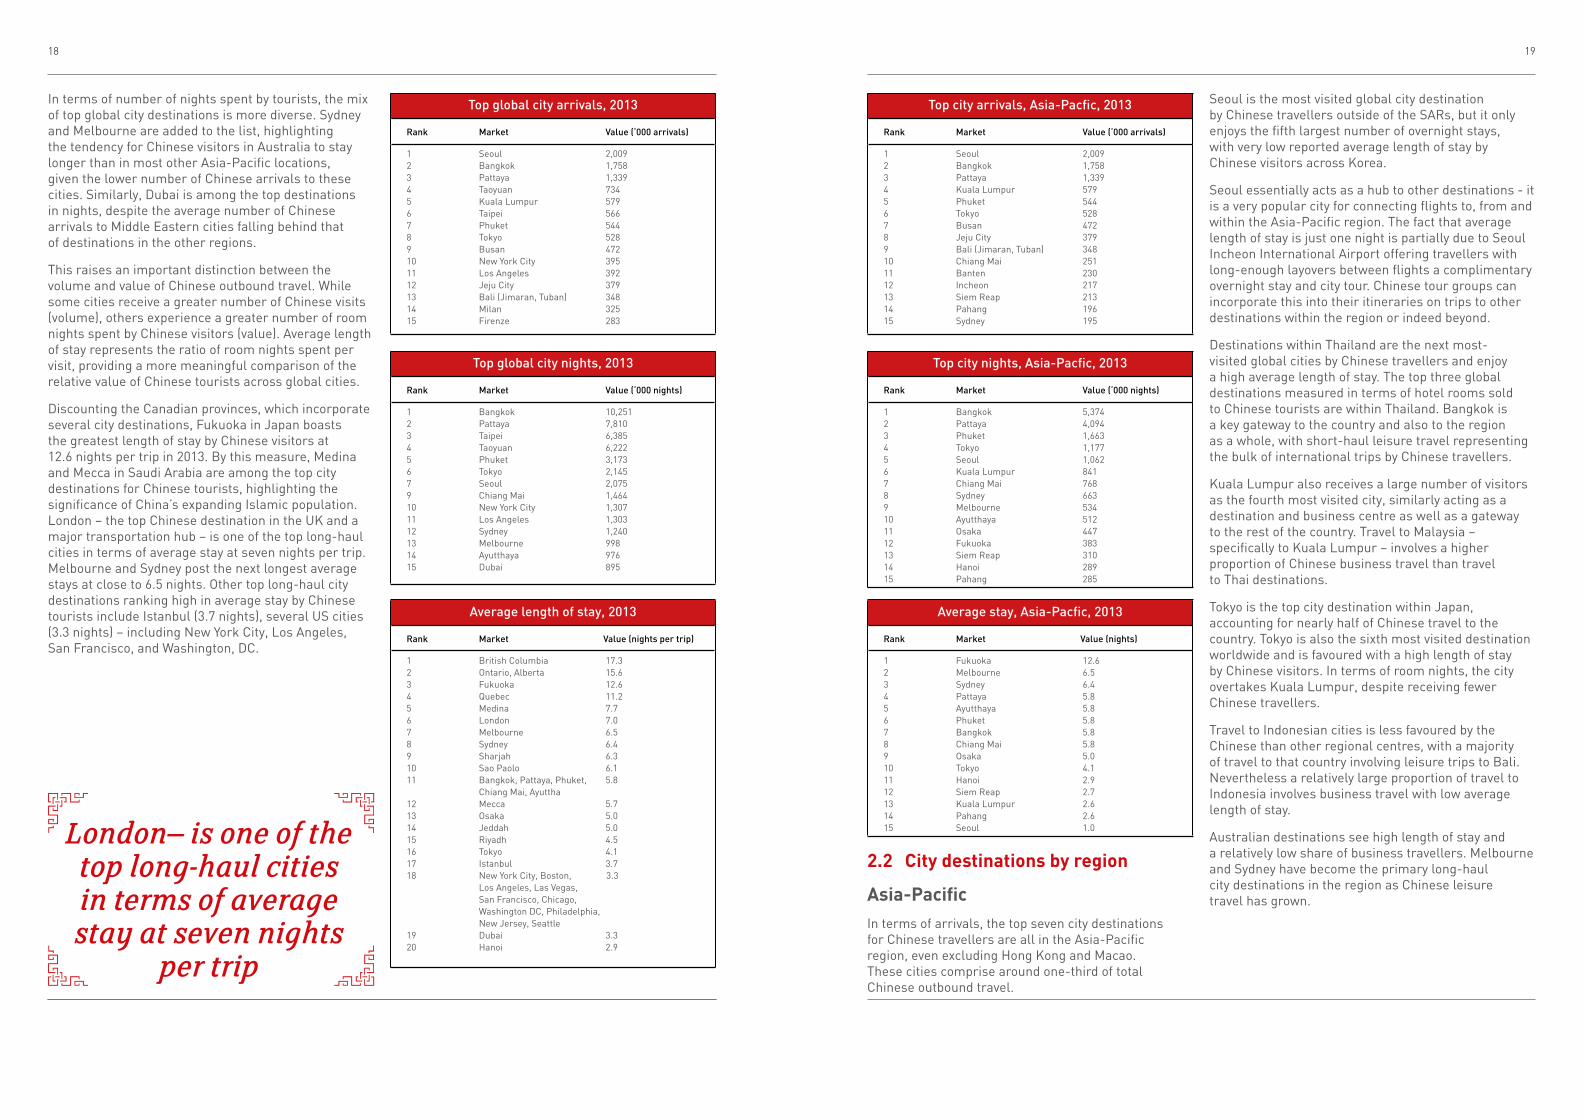
In terms of number of nights spent by tourists, the mix of top global city destinations is more diverse. Sydney and Melbourne are added to the list, highlighting the tendency for Chinese visitors in Australia to stay longer than in most other Asia-Pacific locations, given the lower number of Chinese arrivals to these cities. Similarly, Dubai is among the top destinations in nights, despite the average number of Chinese arrivals to Middle Eastern cities falling behind that of destinations in the other regions.
This raises an important distinction between the volume and value of Chinese outbound travel. While some cities receive a greater number of Chinese visits (volume), others experience a greater number of room nights spent by Chinese visitors (value). Average length of stay represents the ratio of room nights spent per visit, providing a more meaningful comparison of the relative value of Chinese tourists across global cities.
Discounting the Canadian provinces, which incorporate several city destinations, Fukuoka in Japan boasts the greatest length of stay by Chinese visitors at 12.6 nights per trip in 2013. By this measure, Medina and Mecca in Saudi Arabia are among the top city destinations for Chinese tourists, highlighting the significance of China’s expanding Islamic population. London – the top Chinese destination in the UK and a major transportation hub – is one of the top long-haul cities in terms of average stay at seven nights per trip. Melbourne and Sydney post the next longest average stays at close to 6.5 nights. Other top long-haul city destinations ranking high in average stay by Chinese tourists include Istanbul (3.7 nights), several US cities (3.3 nights) – including New York City, Los Angeles, San Francisco, and Washington, DC.
London– is one of the top long-haul cities in terms of average stay at seven nights
per trip
2.2 Citydestinationsbyregion
Asia-PacificIn terms of arrivals, the top seven city destinations for Chinese travellers are all in the Asia-Pacific region, even excluding Hong Kong and Macao. These cities comprise around one-third of total Chinese outbound travel.
Top global city arrivals, 2013
Rank Market Value (‘000 arrivals)
1 Seoul 2,009 2 Bangkok 1,758 3 Pattaya 1,339 4 Taoyuan 734 5 Kuala Lumpur 579 6 Taipei 566 7 Phuket 544 8 Tokyo 528 9 Busan 472 10 New York City 395 11 Los Angeles 392 12 Jeju City 379 13 Bali (Jimaran, Tuban) 348 14 Milan 325 15 Firenze 283
Top city arrivals, Asia-Pacfic, 2013
Rank Market Value (‘000 arrivals)
1 Seoul 2,009 2 Bangkok 1,758 3 Pattaya 1,339 4 Kuala Lumpur 579 5 Phuket 544 6 Tokyo 528 7 Busan 472 8 Jeju City 379 9 Bali (Jimaran, Tuban) 348 10 Chiang Mai 251 11 Banten 230 12 Incheon 217 13 Siem Reap 213 14 Pahang 196 15 Sydney 195
Top global city nights, 2013
Rank Market Value (‘000 nights)
1 Bangkok 10,251 2 Pattaya 7,810 3 Taipei 6,385 4 Taoyuan 6,222 5 Phuket 3,173 6 Tokyo 2,1457 Seoul 2,0759 Chiang Mai 1,464 10 New York City 1,307 11 Los Angeles 1,303 12 Sydney 1,240 13 Melbourne 998 14 Ayutthaya 976 15 Dubai 895
Top city nights, Asia-Pacfic, 2013
Rank Market Value (‘000 nights)
1 Bangkok 5,374 2 Pattaya 4,094 3 Phuket 1,663 4 Tokyo 1,177 5 Seoul 1,062 6 Kuala Lumpur 841 7 Chiang Mai 768 8 Sydney 663 9 Melbourne 534 10 Ayutthaya 512 11 Osaka 447 12 Fukuoka 383 13 Siem Reap 310 14 Hanoi 289 15 Pahang 285
Average length of stay, 2013
Rank Market Value (nights per trip)
1 British Columbia 17.3 2 Ontario, Alberta 15.6 3 Fukuoka 12.6 4 Quebec 11.2 5 Medina 7.7 6 London 7.0 7 Melbourne 6.5 8 Sydney 6.4 9 Sharjah 6.3 10 Sao Paolo 6.1 11 Bangkok, Pattaya, Phuket, 5.8
Chiang Mai, Ayuttha12 Mecca 5.7 13 Osaka 5.0 14 Jeddah 5.0 15 Riyadh 4.5 16 Tokyo 4.1 17 Istanbul 3.7 18 New York City, Boston, 3.3 Los Angeles, Las Vegas, San Francisco, Chicago, Washington DC, Philadelphia, New Jersey, Seattle19 Dubai 3.3 20 Hanoi 2.9
Average stay, Asia-Pacfic, 2013
Rank Market Value (nights)
1 Fukuoka 12.6 2 Melbourne 6.5 3 Sydney 6.4 4 Pattaya 5.8 5 Ayutthaya 5.8 6 Phuket 5.8 7 Bangkok 5.8 8 Chiang Mai 5.8 9 Osaka 5.0 10 Tokyo 4.1 11 Hanoi 2.9 12 Siem Reap 2.7 13 Kuala Lumpur 2.6 14 Pahang 2.6 15 Seoul 1.0
Seoul is the most visited global city destination by Chinese travellers outside of the SARs, but it only enjoys the fifth largest number of overnight stays, with very low reported average length of stay by Chinese visitors across Korea.
Seoul essentially acts as a hub to other destinations - it is a very popular city for connecting flights to, from and within the Asia-Pacific region. The fact that average length of stay is just one night is partially due to Seoul Incheon International Airport offering travellers with long-enough layovers between flights a complimentary overnight stay and city tour. Chinese tour groups can incorporate this into their itineraries on trips to other destinations within the region or indeed beyond.
Destinations within Thailand are the next most-visited global cities by Chinese travellers and enjoy a high average length of stay. The top three global destinations measured in terms of hotel rooms sold to Chinese tourists are within Thailand. Bangkok is a key gateway to the country and also to the region as a whole, with short-haul leisure travel representing the bulk of international trips by Chinese travellers.
Kuala Lumpur also receives a large number of visitors as the fourth most visited city, similarly acting as a destination and business centre as well as a gateway to the rest of the country. Travel to Malaysia – specifically to Kuala Lumpur – involves a higher proportion of Chinese business travel than travel to Thai destinations.
Tokyo is the top city destination within Japan, accounting for nearly half of Chinese travel to the country. Tokyo is also the sixth most visited destination worldwide and is favoured with a high length of stay by Chinese visitors. In terms of room nights, the city overtakes Kuala Lumpur, despite receiving fewer Chinese travellers.
Travel to Indonesian cities is less favoured by the Chinese than other regional centres, with a majority of travel to that country involving leisure trips to Bali. Nevertheless a relatively large proportion of travel to Indonesia involves business travel with low average length of stay.
Australian destinations see high length of stay and a relatively low share of business travellers. Melbourne and Sydney have become the primary long-haul city destinations in the region as Chinese leisure travel has grown.
20 21
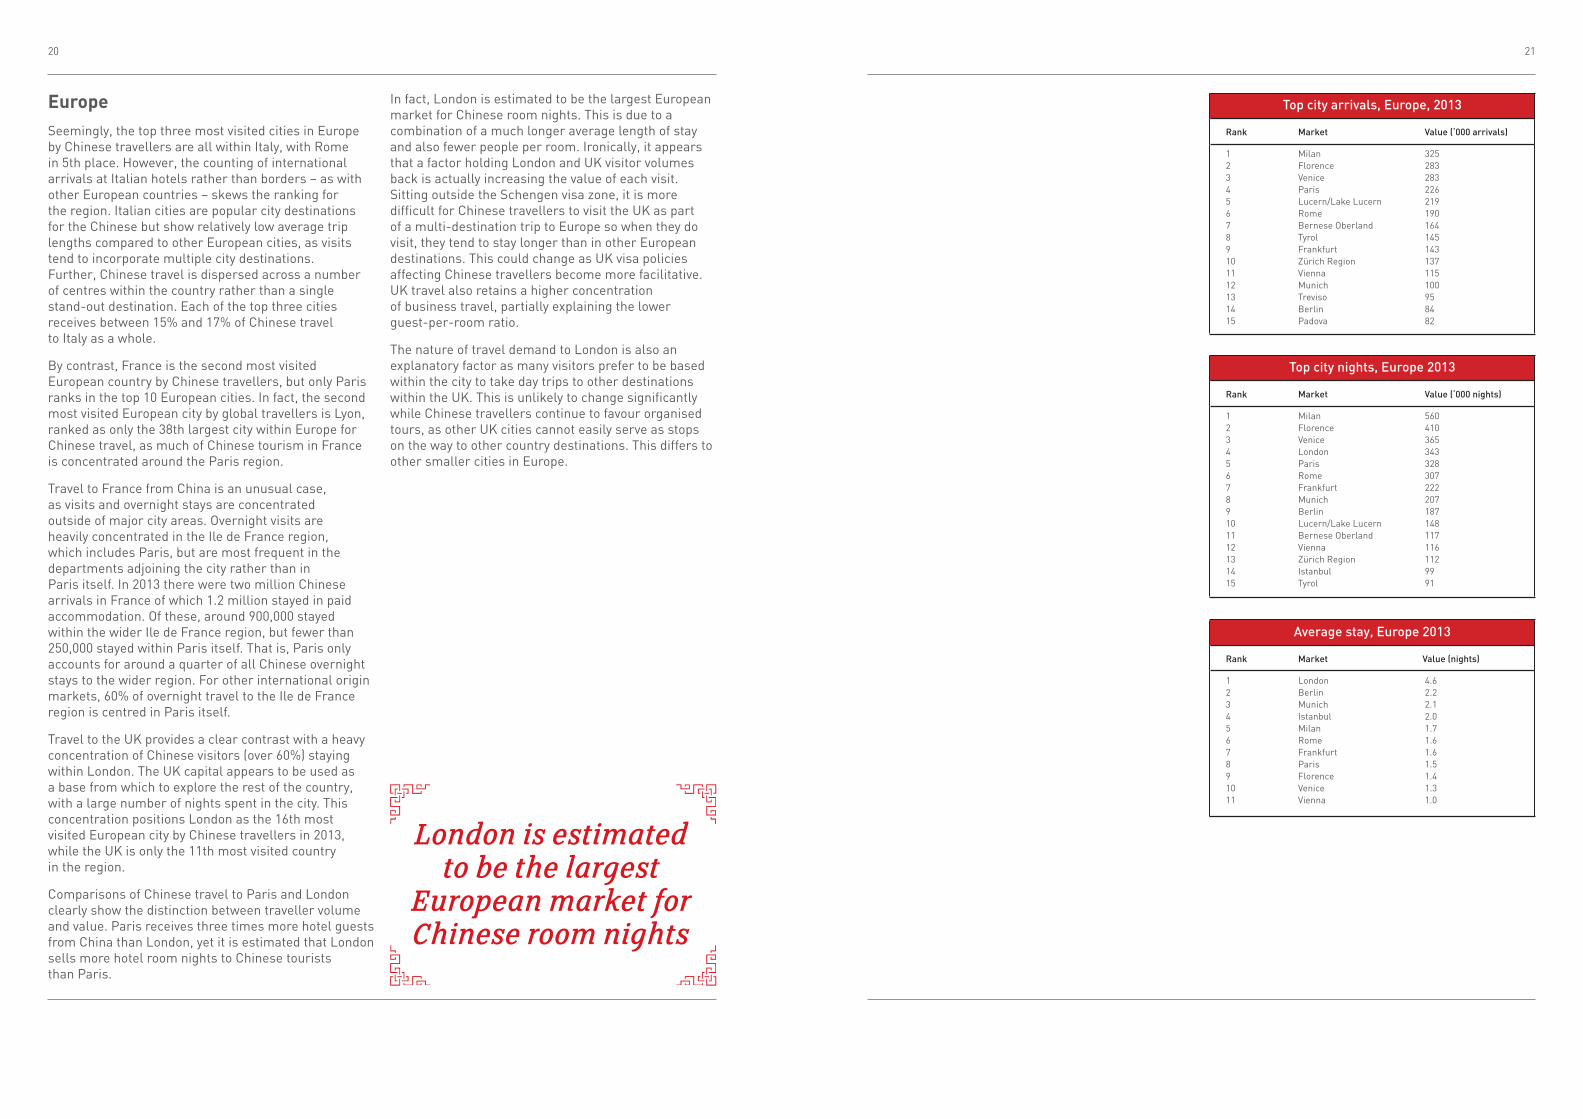
EuropeSeemingly, the top three most visited cities in Europe by Chinese travellers are all within Italy, with Rome in 5th place. However, the counting of international arrivals at Italian hotels rather than borders – as with other European countries – skews the ranking for the region. Italian cities are popular city destinations for the Chinese but show relatively low average trip lengths compared to other European cities, as visits tend to incorporate multiple city destinations. Further, Chinese travel is dispersed across a number of centres within the country rather than a single stand-out destination. Each of the top three cities receives between 15% and 17% of Chinese travel to Italy as a whole.
By contrast, France is the second most visited European country by Chinese travellers, but only Paris ranks in the top 10 European cities. In fact, the second most visited European city by global travellers is Lyon, ranked as only the 38th largest city within Europe for Chinese travel, as much of Chinese tourism in France is concentrated around the Paris region.
Travel to France from China is an unusual case, as visits and overnight stays are concentrated outside of major city areas. Overnight visits are heavily concentrated in the Ile de France region, which includes Paris, but are most frequent in the departments adjoining the city rather than in Paris itself. In 2013 there were two million Chinese arrivals in France of which 1.2 million stayed in paid accommodation. Of these, around 900,000 stayed within the wider Ile de France region, but fewer than 250,000 stayed within Paris itself. That is, Paris only accounts for around a quarter of all Chinese overnight stays to the wider region. For other international origin markets, 60% of overnight travel to the Ile de France region is centred in Paris itself.
Travel to the UK provides a clear contrast with a heavy concentration of Chinese visitors (over 60%) staying within London. The UK capital appears to be used as a base from which to explore the rest of the country, with a large number of nights spent in the city. This concentration positions London as the 16th most visited European city by Chinese travellers in 2013, while the UK is only the 11th most visited country in the region.
Comparisons of Chinese travel to Paris and London clearly show the distinction between traveller volume and value. Paris receives three times more hotel guests from China than London, yet it is estimated that London sells more hotel room nights to Chinese tourists than Paris.
In fact, London is estimated to be the largest European market for Chinese room nights. This is due to a combination of a much longer average length of stay and also fewer people per room. Ironically, it appears that a factor holding London and UK visitor volumes back is actually increasing the value of each visit. Sitting outside the Schengen visa zone, it is more difficult for Chinese travellers to visit the UK as part of a multi-destination trip to Europe so when they do visit, they tend to stay longer than in other European destinations. This could change as UK visa policies affecting Chinese travellers become more facilitative. UK travel also retains a higher concentration of business travel, partially explaining the lower guest-per-room ratio.
The nature of travel demand to London is also an explanatory factor as many visitors prefer to be based within the city to take day trips to other destinations within the UK. This is unlikely to change significantly while Chinese travellers continue to favour organised tours, as other UK cities cannot easily serve as stops on the way to other country destinations. This differs to other smaller cities in Europe.
London is estimated to be the largest
European market for Chinese room nights
Top city arrivals, Europe, 2013
Rank Market Value (‘000 arrivals)
1 Milan 325 2 Florence 283 3 Venice 283 4 Paris 226 5 Lucern/Lake Lucern 219 6 Rome 190 7 Bernese Oberland 164 8 Tyrol 145 9 Frankfurt 143 10 Zürich Region 137 11 Vienna 115 12 Munich 100 13 Treviso 95 14 Berlin 84 15 Padova 82
Top city nights, Europe 2013
Rank Market Value (‘000 nights)
1 Milan 560 2 Florence 410 3 Venice 365 4 London 343 5 Paris 328 6 Rome 307 7 Frankfurt 222 8 Munich 207 9 Berlin 187 10 Lucern/Lake Lucern 148 11 Bernese Oberland 117 12 Vienna 116 13 Zürich Region 112 14 Istanbul 99 15 Tyrol 91
Average stay, Europe 2013
Rank Market Value (nights)
1 London 4.6 2 Berlin 2.2 3 Munich 2.1 4 Istanbul 2.0 5 Milan 1.7 6 Rome 1.6 7 Frankfurt 1.6 8 Paris 1.5 9 Florence 1.4 10 Venice 1.3 11 Vienna 1.0

22 23
AmericasTravel to the US from China dwarves other destinations within the American continent – the top 12 city destinations for travel in terms of arrival numbers within the region are in the US. Yet, the average length of stay by Chinese hotel guests in US cities is notably shorter than the average stay for the country as a whole. This is largely due to the extensive US air travel network and universal visa access throughout the country, which increase the ease of inter-city travel. This makes it more appealing for Chinese travellers to visit multiple cities while in the US, especially as part of a tour group package. On average, Chinese travel to the US tends to involve visits to two or more cities per trip.
The US also has a more diverse city offering than many other countries and lacks a single dominant city in terms of arrivals. Three cities stand out as receiving a notably larger than average proportion of Chinese travel however: New York City, Los Angeles and San Francisco. Together these cities account for around half of the nights spent by Chinese travellers in the US. All three cities are ranked among the top 15 global markets in terms of Chinese arrivals and room nights and are expected to remain the most visited within the wider region over the next ten years.
Some cities in Canada, and to a lesser extent, Brazil, see a relatively higher benefit measured in terms of overnight stays and rooms sold. These cities all enjoy a higher average length of stay than US cities. Sao Paulo – the largest city in the Americas – is favoured by a relatively high length of stay, given the presence of the most heavily-used airport in Latin America with regional service to key destinations in Brazil and much of South America. Similarly, Chinese travel to Canada tends to revolve around urban centres (e.g. Vancouver in British Columbia and Toronto in Ontario) with day trips throughout the rest of the province.
Outside of Brazil, travel from China to Latin America is relatively low compared to the rest of the region, with business taking up a greater proportion of trips than leisure. Mexico is the next largest country destination for Chinese travellers, though Mexico City – the country’s top city destination – received fewer than 10,000 Chinese visitors in 2013.
Middle EastMiddle East city destinations receive far fewer Chinese travellers on average relative to locations in other regions of the world. The tendency for longer-than-average lengths of stay raises the value of Chinese visitors to the region however.
A rising Muslim population in China has contributed to an increase in family and religious related trips to the region. According to Pew Research11, the Muslim population in China comprised 1.8% of the nation’s total population in 2010, a 38.4% increase from two decades prior. The rapid expansion of China’s Muslim population has resulted in inflated demand for travel from China to centres of the Islamic faith.
Medina and Mecca have largely benefited from this trend. The travel, retail and entertainment centres of Dubai and Abu Dhabi have led the region, attracting an increasing number of Chinese tourists on leisure trips and cruises.
Chinese visitors to the Middle East tend to stay longer than in the average long-haul destination for two main reasons. First, religious visits tend to last longer than other leisure trips. For instance, a trip to the Islamic centres of the Middle East might incorporate sight-seeing and participation in religious observations or events which can last for several days, as opposed to sporting or entertainment events which might take place on a single day. Second, cruises in the Middle East – popular among Chinese leisure visitors – often involve one major coastal city as a base for overnight lodging and departures for day excursions to other destinations in the region.
A rising Muslim population in China has contributed to
an increase in family and religious related
trips to the region
11 Pew Research Center’s Forum on Religion & Public Life (2011), The Future of the Global Muslim Population (Online), available at: http://www.pewforum.org/2011/01/27/future-of-the-global-muslim-population-regional-asia/#ftn1
Top city arrivals, Americas, 2013
Rank Market Value (‘000 arrivals)
1 New York City 395 2 Los Angeles 392 3 San Francisco 253 4 Washington, DC 202 5 Las Vegas 195 6 Chicago 121 7 Boston 117 8 Philadelphia 47 9 New Jersey 47 10 Seattle 46 11 San Diego 41 12 Buffalo 40 13 British Columbia 37 14 Orlando 37 15 Atlanta 35
Top city nights, Americas, 2013
Rank Market Value(‘000 nights)
1 New York City 817 2 Los Angeles 814 3 San Francisco 525 4 British Columbia 456 5 Washington, DC 418 6 Las Vegas 404 7 Ontario 374 8 Chicago 251 9 Sao Paulo 246 10 Boston 243 11 Quebec 179 12 Alberta 110 13 Philadelphia 98 14 New Jersey 98 15 Seattle 97
Average length of stay, 2013
Rank Market Value (nights)
1 British Columbia 17.3 2 Alberta 15.6 3 Ontario 15.6 4 Quebec 11.2 5 Sao Paulo 6.1 6 New York City 3.3 7 Los Angeles 3.3 8 San Francisco 3.3 9 Washington, DC 3.3 10 Las Vegas 3.3 11 Chicago 3.3 12 Boston 3.3 13 Philadelphia 3.3 14 New Jersey 3.3 15 Seattle 3.3
Top city arrivals, Middle East, 2013
Rank Market Value (‘000 arrivals)
1 Dubai 276 2 Abu Dhabi 44 3 Doha 15 4 Riyadh 7 5 Mecca 4 6 Jeddah 2 7 Medina 1 8 Sharjah 0.04
Top city nights, Middle East, 2013
Rank Market Value (‘000 nights)
1 Dubai 895 2 Abu Dhabi 83 3 Riyadh 32 4 Doha 27 5 Mecca 23 6 Medina 11 7 Jeddah 8 8 Sharjah 0.27
Average stay, Middle East, 2013
Rank Market Value (nights)
1 Medina 7.7 2 Sharjah 6.3 3 Mecca 5.7 4 Jeddah 5.0 5 Riyadh 4.5 6 Dubai 3.2 7 Abu Dhabi 1.9 8 Doha 1.8
24 25
2.3 Growth opportunities for global citiesGiven observed travel preferences of Chinese tourists, growth to key city destinations will come at a premium over growth to countryside, beach, mountain, and other non-urban destinations. The incremental growth in number of visitors or room nights sold is a more instructive measure than percentage growth. A small percentage growth from a large base still implies a large increase in relative volumes and value. Some very small city destinations will top the rankings of growth in percentage terms, though their market shares will remain very small relative to the current top city destinations.
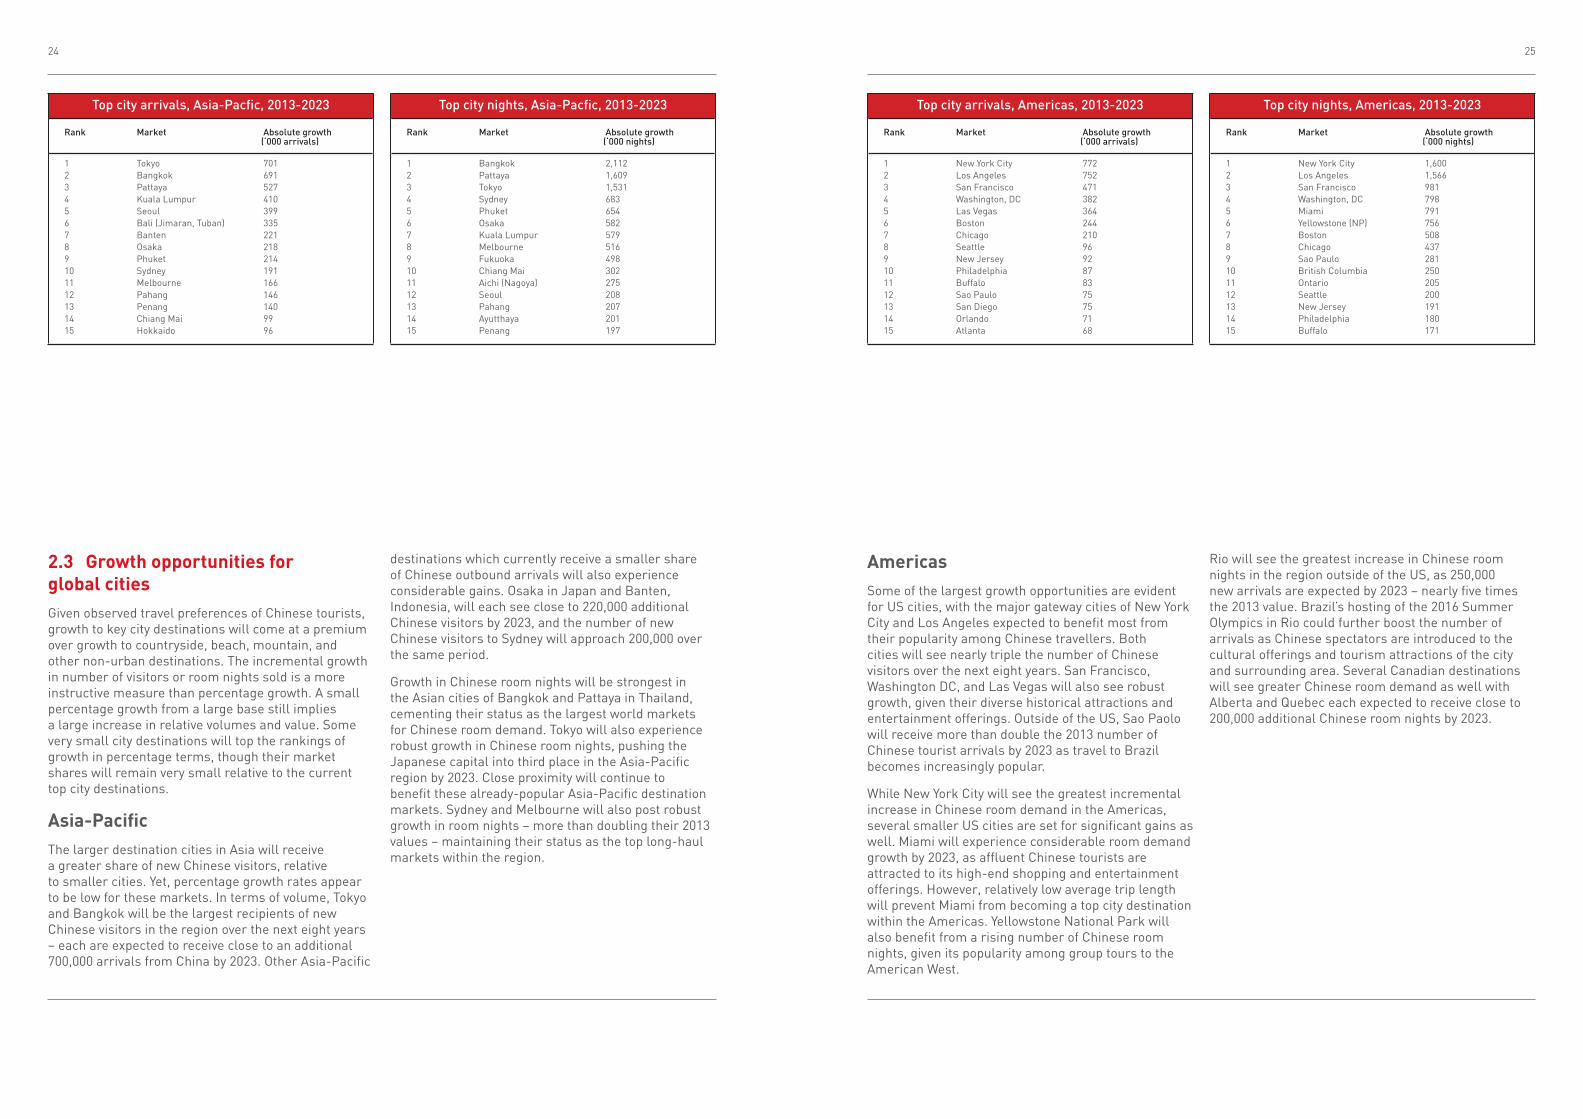
Asia-PacificThe larger destination cities in Asia will receive a greater share of new Chinese visitors, relative to smaller cities. Yet, percentage growth rates appear to be low for these markets. In terms of volume, Tokyo and Bangkok will be the largest recipients of new Chinese visitors in the region over the next eight years – each are expected to receive close to an additional 700,000 arrivals from China by 2023. Other Asia-Pacific
destinations which currently receive a smaller share of Chinese outbound arrivals will also experience considerable gains. Osaka in Japan and Banten, Indonesia, will each see close to 220,000 additional Chinese visitors by 2023, and the number of new Chinese visitors to Sydney will approach 200,000 over the same period.
Growth in Chinese room nights will be strongest in the Asian cities of Bangkok and Pattaya in Thailand, cementing their status as the largest world markets for Chinese room demand. Tokyo will also experience robust growth in Chinese room nights, pushing the Japanese capital into third place in the Asia-Pacific region by 2023. Close proximity will continue to benefit these already-popular Asia-Pacific destination markets. Sydney and Melbourne will also post robust growth in room nights – more than doubling their 2013 values – maintaining their status as the top long-haul markets within the region.
AmericasSome of the largest growth opportunities are evident for US cities, with the major gateway cities of New York City and Los Angeles expected to benefit most from their popularity among Chinese travellers. Both cities will see nearly triple the number of Chinese visitors over the next eight years. San Francisco, Washington DC, and Las Vegas will also see robust growth, given their diverse historical attractions and entertainment offerings. Outside of the US, Sao Paolo will receive more than double the 2013 number of Chinese tourist arrivals by 2023 as travel to Brazil becomes increasingly popular.
While New York City will see the greatest incremental increase in Chinese room demand in the Americas, several smaller US cities are set for significant gains as well. Miami will experience considerable room demand growth by 2023, as affluent Chinese tourists are attracted to its high-end shopping and entertainment offerings. However, relatively low average trip length will prevent Miami from becoming a top city destination within the Americas. Yellowstone National Park will also benefit from a rising number of Chinese room nights, given its popularity among group tours to the American West.
Rio will see the greatest increase in Chinese room nights in the region outside of the US, as 250,000 new arrivals are expected by 2023 – nearly five times the 2013 value. Brazil’s hosting of the 2016 Summer Olympics in Rio could further boost the number of arrivals as Chinese spectators are introduced to the cultural offerings and tourism attractions of the city and surrounding area. Several Canadian destinations will see greater Chinese room demand as well with Alberta and Quebec each expected to receive close to 200,000 additional Chinese room nights by 2023.
Top city arrivals, Asia-Pacfic, 2013-2023
Rank Market Absolute growth (‘000 arrivals)
1 Tokyo 701 2 Bangkok 691 3 Pattaya 527 4 Kuala Lumpur 410 5 Seoul 399 6 Bali (Jimaran, Tuban) 335 7 Banten 221 8 Osaka 218 9 Phuket 214 10 Sydney 191 11 Melbourne 166 12 Pahang 146 13 Penang 140 14 Chiang Mai 99 15 Hokkaido 96
Top city arrivals, Americas, 2013-2023
Rank Market Absolute growth (‘000 arrivals)
1 New York City 772 2 Los Angeles 752 3 San Francisco 471 4 Washington, DC 382 5 Las Vegas 364 6 Boston 244 7 Chicago 210 8 Seattle 96 9 New Jersey 92 10 Philadelphia 87 11 Buffalo 83 12 Sao Paulo 75 13 San Diego 75 14 Orlando 71 15 Atlanta 68
Top city nights, Asia-Pacfic, 2013-2023
Rank Market Absolute growth (‘000 nights)
1 Bangkok 2,112 2 Pattaya 1,609 3 Tokyo 1,531 4 Sydney 683 5 Phuket 654 6 Osaka 582 7 Kuala Lumpur 579 8 Melbourne 516 9 Fukuoka 498 10 Chiang Mai 302 11 Aichi (Nagoya) 275 12 Seoul 208 13 Pahang 207 14 Ayutthaya 201 15 Penang 197
Top city nights, Americas, 2013-2023
Rank Market Absolute growth (‘000 nights)
1 New York City 1,600 2 Los Angeles 1,566 3 San Francisco 981 4 Washington, DC 798 5 Miami 791 6 Yellowstone (NP) 756 7 Boston 508 8 Chicago 437 9 Sao Paulo 281 10 British Columbia 250 11 Ontario 205 12 Seattle 200 13 New Jersey 191 14 Philadelphia 180 15 Buffalo 171
26 27
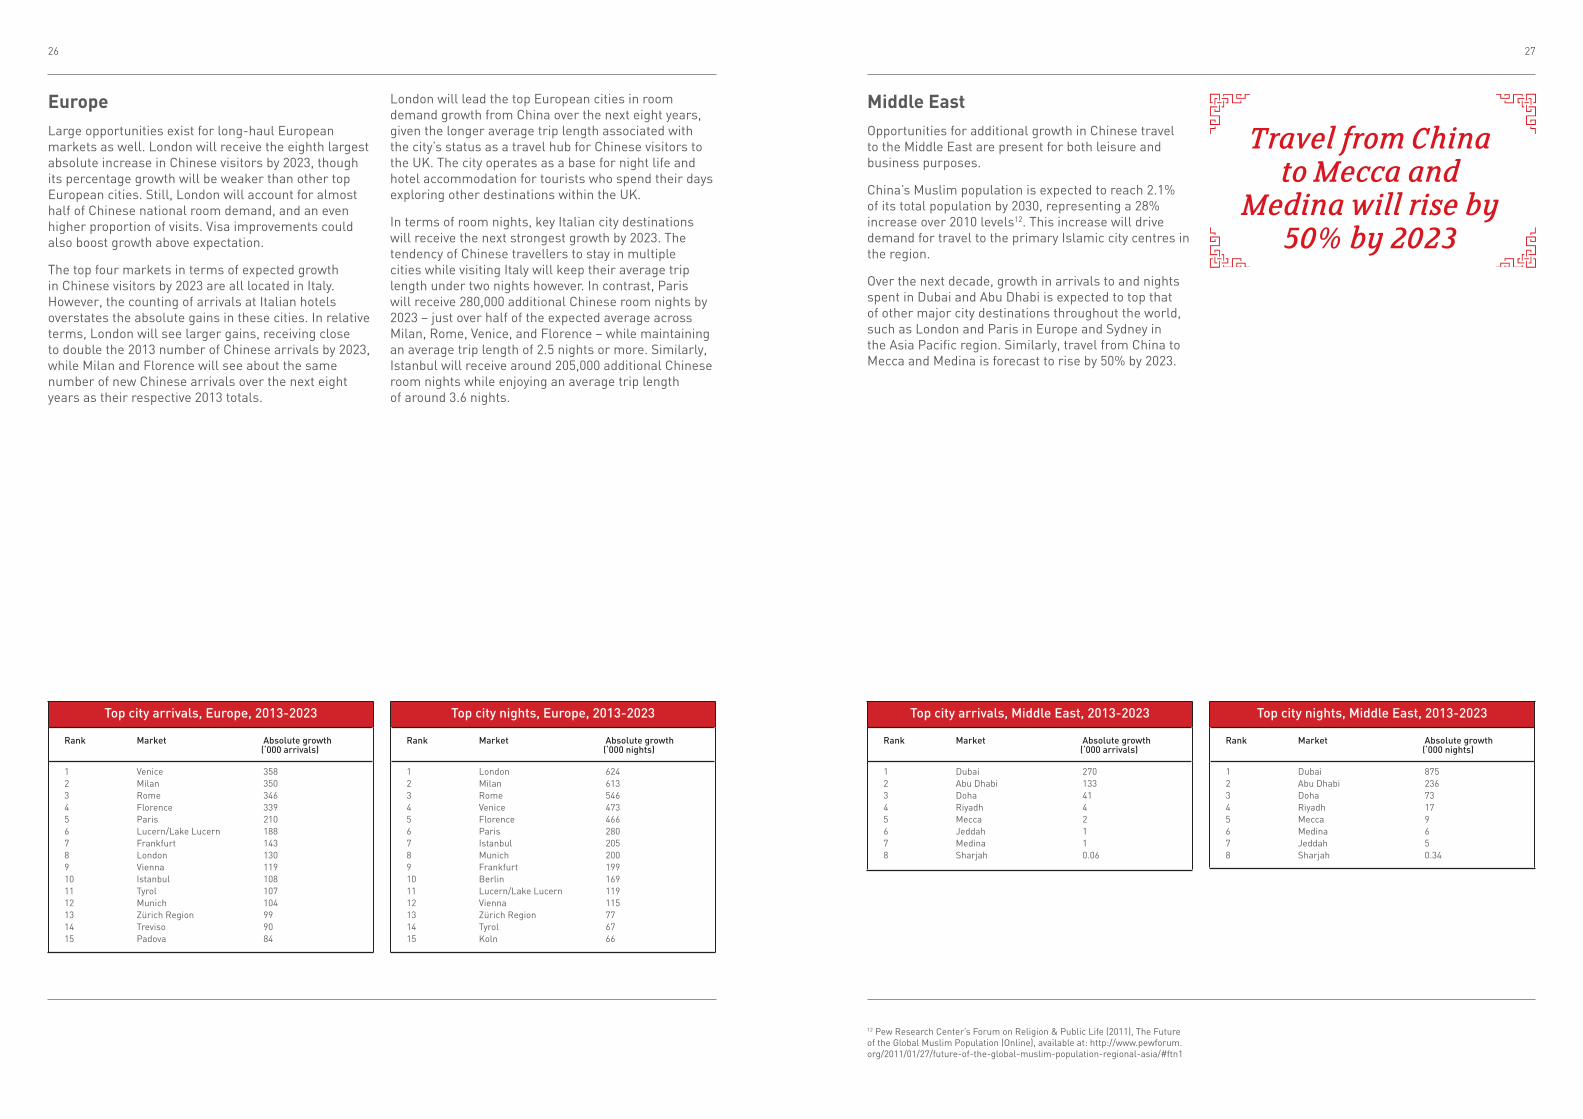
EuropeLarge opportunities exist for long-haul European markets as well. London will receive the eighth largest absolute increase in Chinese visitors by 2023, though its percentage growth will be weaker than other top European cities. Still, London will account for almost half of Chinese national room demand, and an even higher proportion of visits. Visa improvements could also boost growth above expectation.
The top four markets in terms of expected growth in Chinese visitors by 2023 are all located in Italy. However, the counting of arrivals at Italian hotels overstates the absolute gains in these cities. In relative terms, London will see larger gains, receiving close to double the 2013 number of Chinese arrivals by 2023, while Milan and Florence will see about the same number of new Chinese arrivals over the next eight years as their respective 2013 totals.
Middle EastOpportunities for additional growth in Chinese travel to the Middle East are present for both leisure and business purposes.
China’s Muslim population is expected to reach 2.1% of its total population by 2030, representing a 28% increase over 2010 levels12. This increase will drive demand for travel to the primary Islamic city centres in the region.
Over the next decade, growth in arrivals to and nights spent in Dubai and Abu Dhabi is expected to top that of other major city destinations throughout the world, such as London and Paris in Europe and Sydney in the Asia Pacific region. Similarly, travel from China to Mecca and Medina is forecast to rise by 50% by 2023.
London will lead the top European cities in room demand growth from China over the next eight years, given the longer average trip length associated with the city’s status as a travel hub for Chinese visitors to the UK. The city operates as a base for night life and hotel accommodation for tourists who spend their days exploring other destinations within the UK.
In terms of room nights, key Italian city destinations will receive the next strongest growth by 2023. The tendency of Chinese travellers to stay in multiple cities while visiting Italy will keep their average trip length under two nights however. In contrast, Paris will receive 280,000 additional Chinese room nights by 2023 – just over half of the expected average across Milan, Rome, Venice, and Florence – while maintaining an average trip length of 2.5 nights or more. Similarly, Istanbul will receive around 205,000 additional Chinese room nights while enjoying an average trip length of around 3.6 nights.
Travel from China to Mecca and
Medina will rise by 50% by 2023
12 Pew Research Center’s Forum on Religion & Public Life (2011), The Future of the Global Muslim Population (Online), available at: http://www.pewforum.org/2011/01/27/future-of-the-global-muslim-population-regional-asia/#ftn1
Top city arrivals, Europe, 2013-2023
Rank Market Absolute growth (‘000 arrivals)
1 Venice 358 2 Milan 350 3 Rome 346 4 Florence 339 5 Paris 210 6 Lucern/Lake Lucern 188 7 Frankfurt 143 8 London 130 9 Vienna 119 10 Istanbul 108 11 Tyrol 107 12 Munich 104 13 Zürich Region 99 14 Treviso 90 15 Padova 84
Top city arrivals, Middle East, 2013-2023
Rank Market Absolute growth (‘000 arrivals)
1 Dubai 270 2 Abu Dhabi 133 3 Doha 41 4 Riyadh 4 5 Mecca 2 6 Jeddah 1 7 Medina 1 8 Sharjah 0.06
Top city nights, Europe, 2013-2023
Rank Market Absolute growth (‘000 nights)
1 London 624 2 Milan 613 3 Rome 546 4 Venice 473 5 Florence 466 6 Paris 280 7 Istanbul 205 8 Munich 200 9 Frankfurt 199 10 Berlin 169 11 Lucern/Lake Lucern 119 12 Vienna 115 13 Zürich Region 77 14 Tyrol 67 15 Koln 66
Top city nights, Middle East, 2013-2023
Rank Market Absolute growth (‘000 nights)
1 Dubai 875 2 Abu Dhabi 236 3 Doha 73 4 Riyadh 17 5 Mecca 9 6 Medina 6 7 Jeddah 5 8 Sharjah 0.34

28 29
3. Chinese Traveller Spending
3.1 Chinese traveller yieldWhile assuming the role of the largest outbound travel market in the world in terms of volume, China has also caught up with other major origin markets in terms of per-trip spending. Avoiding much of the drag from the global recession experienced in other outbound markets, China exhibited rapid growth in both outbound visits and spending over the past few years.
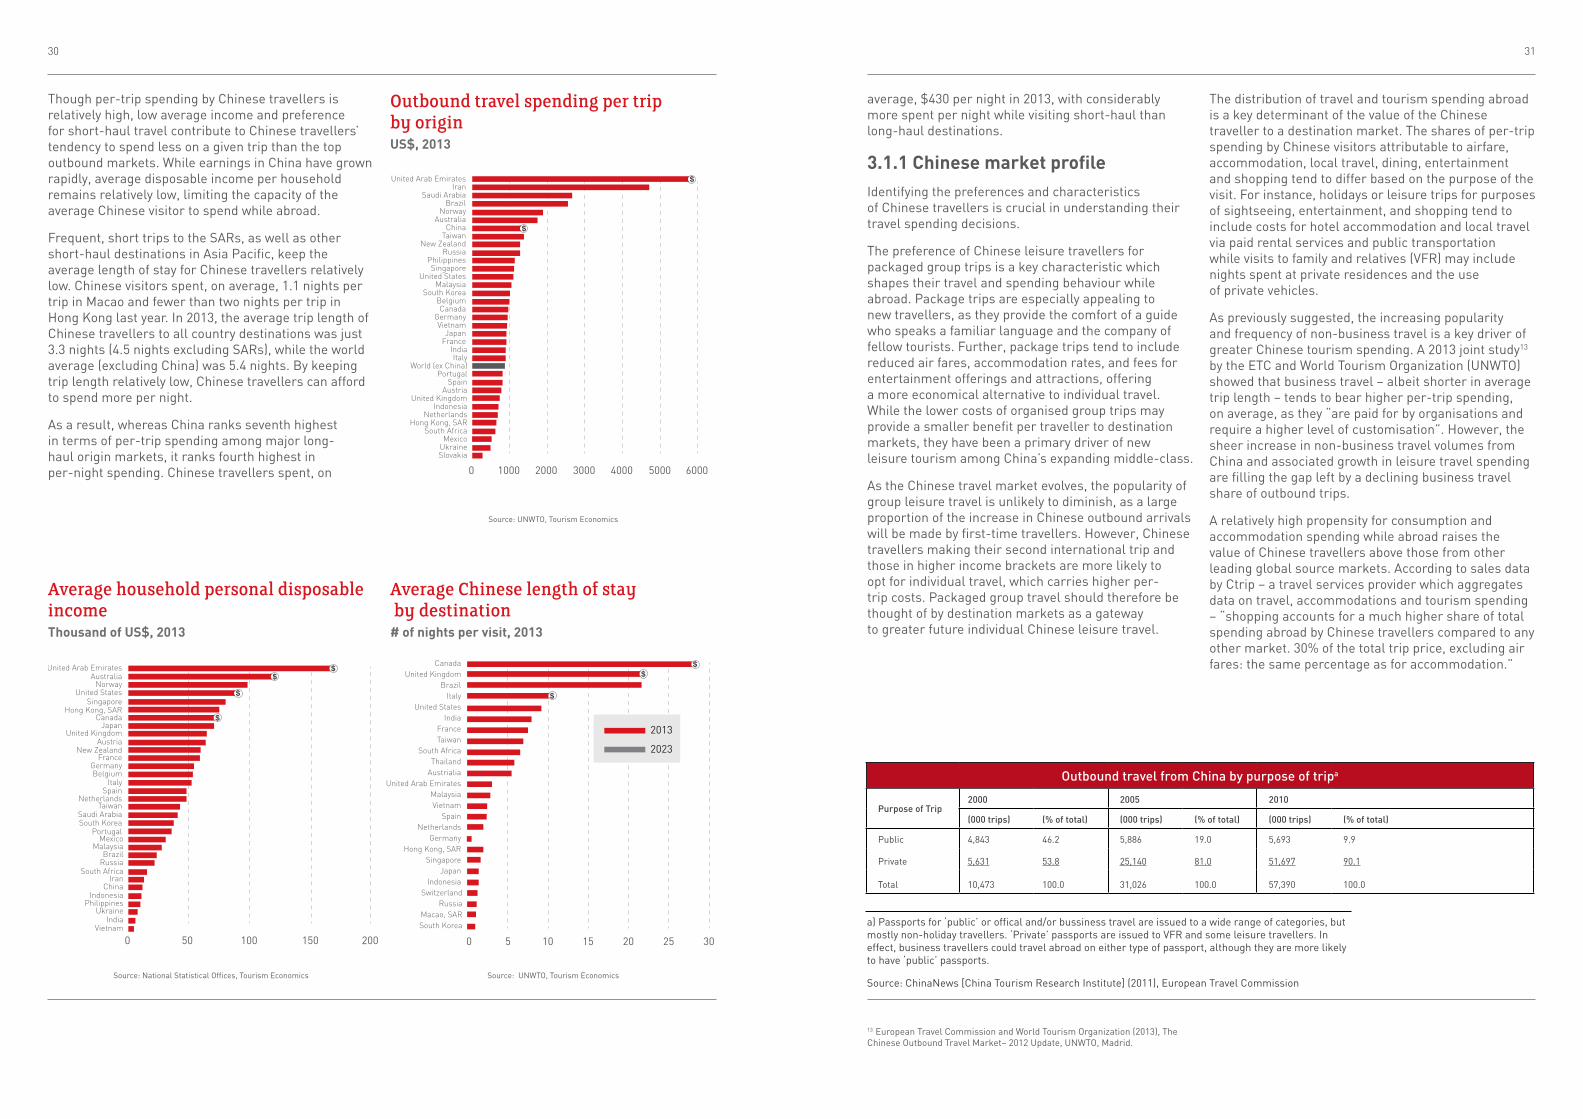
Between 2007 and 2013, Chinese per-trip spending growth averaged 15% – compared to 7.5% over the previous ten years. In 2013, travellers from China spent just over $1,400 per visit on average falling just behind those from the UAE, Iran, Saudi Arabia, Brazil, Norway, and Australia – the top origin markets for per-trip spending.
Between 2007 and 2013, Chinese per-
trip spending growth averaged 15%
30 31
Though per-trip spending by Chinese travellers is relatively high, low average income and preference for short-haul travel contribute to Chinese travellers’ tendency to spend less on a given trip than the top outbound markets. While earnings in China have grown rapidly, average disposable income per household remains relatively low, limiting the capacity of the average Chinese visitor to spend while abroad.
Frequent, short trips to the SARs, as well as other short-haul destinations in Asia Pacific, keep the average length of stay for Chinese travellers relatively low. Chinese visitors spent, on average, 1.1 nights per trip in Macao and fewer than two nights per trip in Hong Kong last year. In 2013, the average trip length of Chinese travellers to all country destinations was just 3.3 nights (4.5 nights excluding SARs), while the world average (excluding China) was 5.4 nights. By keeping trip length relatively low, Chinese travellers can afford to spend more per night.
As a result, whereas China ranks seventh highest in terms of per-trip spending among major long- haul origin markets, it ranks fourth highest in per-night spending. Chinese travellers spent, on
average, $430 per night in 2013, with considerably more spent per night while visiting short-haul than long-haul destinations.
3.1.1 Chinese market profileIdentifying the preferences and characteristics of Chinese travellers is crucial in understanding their travel spending decisions.
The preference of Chinese leisure travellers for packaged group trips is a key characteristic which shapes their travel and spending behaviour while abroad. Package trips are especially appealing to new travellers, as they provide the comfort of a guide who speaks a familiar language and the company of fellow tourists. Further, package trips tend to include reduced air fares, accommodation rates, and fees for entertainment offerings and attractions, offering a more economical alternative to individual travel. While the lower costs of organised group trips may provide a smaller benefit per traveller to destination markets, they have been a primary driver of new leisure tourism among China’s expanding middle-class.
As the Chinese travel market evolves, the popularity of group leisure travel is unlikely to diminish, as a large proportion of the increase in Chinese outbound arrivals will be made by first-time travellers. However, Chinese travellers making their second international trip and those in higher income brackets are more likely to opt for individual travel, which carries higher per-trip costs. Packaged group travel should therefore be thought of by destination markets as a gateway to greater future individual Chinese leisure travel.
The distribution of travel and tourism spending abroad is a key determinant of the value of the Chinese traveller to a destination market. The shares of per-trip spending by Chinese visitors attributable to airfare, accommodation, local travel, dining, entertainment and shopping tend to differ based on the purpose of the visit. For instance, holidays or leisure trips for purposes of sightseeing, entertainment, and shopping tend to include costs for hotel accommodation and local travel via paid rental services and public transportation while visits to family and relatives (VFR) may include nights spent at private residences and the use of private vehicles.
As previously suggested, the increasing popularity and frequency of non-business travel is a key driver of greater Chinese tourism spending. A 2013 joint study13 by the ETC and World Tourism Organization (UNWTO) showed that business travel – albeit shorter in average trip length – tends to bear higher per-trip spending, on average, as they “are paid for by organisations and require a higher level of customisation”. However, the sheer increase in non-business travel volumes from China and associated growth in leisure travel spending are filling the gap left by a declining business travel share of outbound trips.
A relatively high propensity for consumption and accommodation spending while abroad raises the value of Chinese travellers above those from other leading global source markets. According to sales data by Ctrip – a travel services provider which aggregates data on travel, accommodations and tourism spending – “shopping accounts for a much higher share of total spending abroad by Chinese travellers compared to any other market. 30% of the total trip price, excluding air fares: the same percentage as for accommodation.”
10000 2000 3000 4000 5000 6000
United Arab EmiratesIran
Saudi ArabiaBrazil
NorwayAustralia
ChinaTaiwan
New ZealandRussia
PhilippinesSingapore
United StatesMalaysia
South KoreaBelgiumCanada
GermanyVietnam
JapanFrance
IndiaItaly
World (ex China)Portugal
SpainAustria
United KingdomIndonesia
NetherlandsHong Kong, SAR
South AfricaMexico
UkraineSlovakia
50 100 150 2000
United Arab EmiratesAustralia
NorwayUnited States
SingaporeHong Kong, SAR
CanadaJapan
United KingdomAustria
New ZealandFrance
GermanyBelgium
ItalySpain
NetherlandsTaiwan
Saudi ArabiaSouth Korea
PortugalMexico
MalaysiaBrazil
RussiaSouth Africa
IranChina
IndonesiaPhilippines
UkraineIndia
Vietnam
Average Chinese length of stay by destination
Average household personal disposable income
Outbound travel spending per trip by origin
# of nights per visit, 2013Thousand of US$, 2013
US$, 2013
Source: UNWTO, Tourism Economics
Source: UNWTO, Tourism EconomicsSource: National Statistical Offices, Tourism Economics
0 5 10 15 20 25 30
2013
2023
CanadaUnited Kingdom
BrazilItaly
United StatesIndia
FranceTaiwan
South AfricaThailand
AustrialiaUnited Arab Emirates
MalaysiaVietnam
SpainNetherlands
GermanyHong Kong, SAR
SingaporeJapan
IndonesiaSwitzerland
RussiaMacao, SARSouth Korea
Outbound travel from China by purpose of tripa
Purpose of Trip2000 2005 2010
(000 trips) (% of total) (000 trips) (% of total) (000 trips) (% of total)
Public 4,843 46.2 5,886 19.0 5,693 9.9
Private 5,631 53.8 25,140 81.0 51,697 90.1
Total 10,473 100.0 31,026 100.0 57,390 100.0
a) Passports for ‘public’ or offical and/or bussiness travel are issued to a wide range of categories, but mostly non-holiday travellers. ‘Private’ passports are issued to VFR and some leisure travellers. In effect, business travellers could travel abroad on either type of passport, although they are more likely to have ‘public’ passports.
Source: ChinaNews [China Tourism Research Institute] (2011), European Travel Commission
13 European Travel Commission and World Tourism Organization (2013), The Chinese Outbound Travel Market– 2012 Update, UNWTO, Madrid.
32 33
This compares to 21.8% of total non-resident tourism consumption on accommodation in the US while 21.4% went toward personal consumption expenditures.14 In 2011, inbound tourists in the UK spent 22.7% of their total tourism expenditures on accommodation, and 40.6% on consumption products (not including travel or entertainment services).15 Between 2012 and 2013, 14.2% of total tourism consumption by international visitors to Australia went toward accommodation services, while 12% went toward shopping, gifts, and souvenirs.16
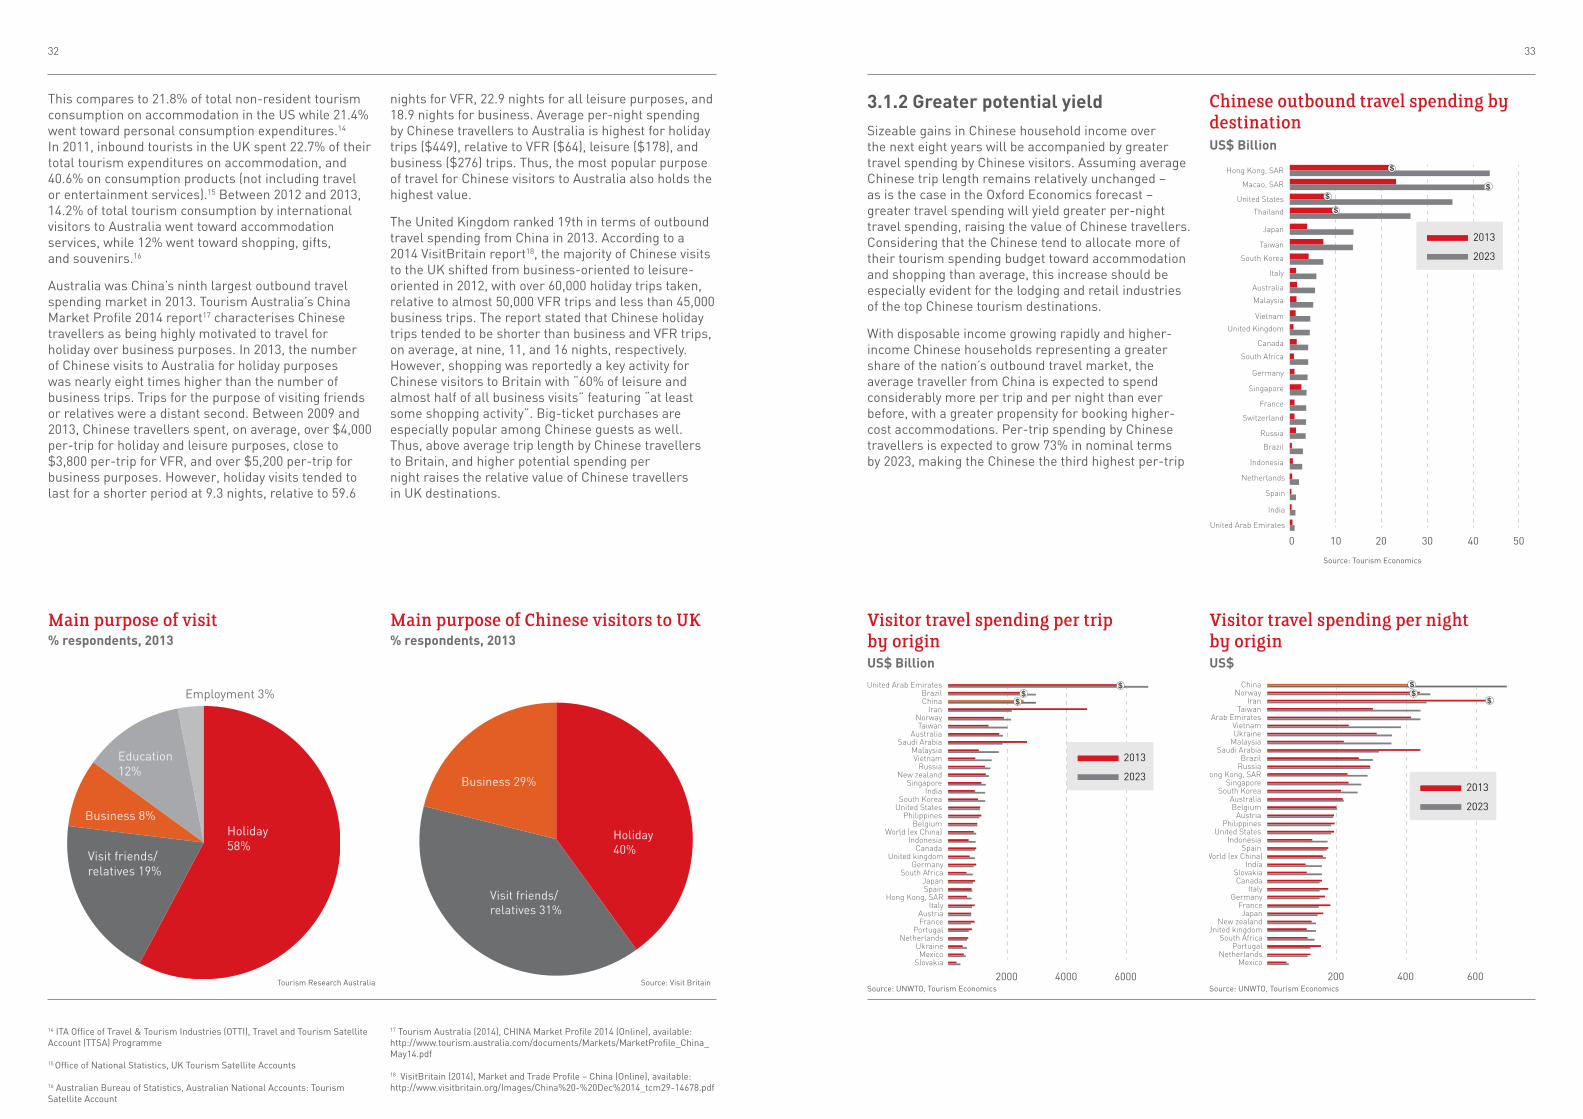
Australia was China’s ninth largest outbound travel spending market in 2013. Tourism Australia’s China Market Profile 2014 report17 characterises Chinese travellers as being highly motivated to travel for holiday over business purposes. In 2013, the number of Chinese visits to Australia for holiday purposes was nearly eight times higher than the number of business trips. Trips for the purpose of visiting friends or relatives were a distant second. Between 2009 and 2013, Chinese travellers spent, on average, over $4,000 per-trip for holiday and leisure purposes, close to $3,800 per-trip for VFR, and over $5,200 per-trip for business purposes. However, holiday visits tended to last for a shorter period at 9.3 nights, relative to 59.6
nights for VFR, 22.9 nights for all leisure purposes, and 18.9 nights for business. Average per-night spending by Chinese travellers to Australia is highest for holiday trips ($449), relative to VFR ($64), leisure ($178), and business ($276) trips. Thus, the most popular purpose of travel for Chinese visitors to Australia also holds the highest value.
The United Kingdom ranked 19th in terms of outbound travel spending from China in 2013. According to a 2014 VisitBritain report18, the majority of Chinese visits to the UK shifted from business-oriented to leisure-oriented in 2012, with over 60,000 holiday trips taken, relative to almost 50,000 VFR trips and less than 45,000 business trips. The report stated that Chinese holiday trips tended to be shorter than business and VFR trips, on average, at nine, 11, and 16 nights, respectively. However, shopping was reportedly a key activity for Chinese visitors to Britain with “60% of leisure and almost half of all business visits” featuring “at least some shopping activity”. Big-ticket purchases are especially popular among Chinese guests as well. Thus, above average trip length by Chinese travellers to Britain, and higher potential spending per night raises the relative value of Chinese travellers in UK destinations.
3.1.2 Greater potential yieldSizeable gains in Chinese household income over the next eight years will be accompanied by greater travel spending by Chinese visitors. Assuming average Chinese trip length remains relatively unchanged – as is the case in the Oxford Economics forecast – greater travel spending will yield greater per-night travel spending, raising the value of Chinese travellers. Considering that the Chinese tend to allocate more of their tourism spending budget toward accommodation and shopping than average, this increase should be especially evident for the lodging and retail industries of the top Chinese tourism destinations.
With disposable income growing rapidly and higher-income Chinese households representing a greater share of the nation’s outbound travel market, the average traveller from China is expected to spend considerably more per trip and per night than ever before, with a greater propensity for booking higher-cost accommodations. Per-trip spending by Chinese travellers is expected to grow 73% in nominal terms by 2023, making the Chinese the third highest per-trip
14 ITA Office of Travel & Tourism Industries (OTTI), Travel and Tourism Satellite Account (TTSA) Programme
15 Office of National Statistics, UK Tourism Satellite Accounts
16 Australian Bureau of Statistics, Australian National Accounts: Tourism Satellite Account
17 Tourism Australia (2014), CHINA Market Profile 2014 (Online), available: http://www.tourism.australia.com/documents/Markets/MarketProfile_China_May14.pdf
18 VisitBritain (2014), Market and Trade Profile – China (Online), available: http://www.visitbritain.org/Images/China%20-%20Dec%2014_tcm29-14678.pdf
0 10 20 30 40 50
2013
2023
Hong Kong, SAR
Macao, SAR
United States
Thailand
Japan
Taiwan
South Korea
Italy
Australia
Malaysia
Vietnam
United Kingdom
Canada
South Africa
Germany
Singapore
France
Switzerland
Russia
Brazil
Indonesia
Netherlands
Spain
India
United Arab Emirates
Chinese outbound travel spending by destinationUS$ Billion
Source: Tourism Economics
Source: Visit BritainTourism Research Australia
Holiday 58%
Visit friends/relatives 19%
Business 8%
Education 12%
Employment 3%
Holiday 40%
Visit friends/relatives 31%
Business 29%
Main purpose of visit Main purpose of Chinese visitors to UK% respondents, 2013 % respondents, 2013
Source: UNWTO, Tourism EconomicsSource: UNWTO, Tourism Economics2000 4000 6000
2013
2023
United Arab EmiratesBrazilChina
IranNorwayTaiwan
AustraliaSaudi Arabia
MalaysiaVietnam
RussiaNew zealand
SingaporeIndia
South KoreaUnited States
PhilippinesBelgium
World (ex China)Indonesia
CanadaUnited kingdom
GermanySouth Africa
JapanSpain
Hong Kong, SARItaly
AustriaFrance
PortugalNetherlands
UkraineMexico
Slovakia
200 400 600 800
2013
2023
ChinaNorway
IranTaiwan
United Arab EmiratesVietnamUkraine
MalaysiaSaudi Arabia
BrazilRussia
Hong Kong, SARSingapore
South KoreaAustraliaBelgium
AustriaPhilippines
United StatesIndonesia
SpainWorld (ex China)
IndiaSlovakiaCanada
ItalyGermany
FranceJapan
New zealandUnited kingdom
South AfricaPortugal
NetherlandsMexico
Visitor travel spending per night by origin
Visitor travel spending per trip by origin
US$US$ Billion
34 35
spenders among major long-haul origin markets. The average traveller from China will likely spend more per-night than those from any other major long-haul origin by 2023, as per-night expenditures are expected to grow by 61% in nominal terms.
While the SARs will continue to represent the largest outbound travel destination markets for Chinese travellers, seven of the top ten destinations in per-trip spending terms will be long-haul destinations – with the Americas region topping the list. While long-haul destinations are unlikely to move ahead of lower-cost, short-haul destinations in terms of per-night spending, outbound travel expenditures will increase dramatically on a per-night basis for nearly all long-haul destinations.
Over the next eight years, growth in Chinese outbound spending in key destination markets will expand markedly. In absolute terms, the United States will see the greatest increase in Chinese travel spending, more than quadrupling by 2023. Thailand will see Chinese travel spending more than double by 2023, and Taiwan is poised for similar gains. Several smaller long-haul destination markets, including Italy, the UK, South Africa, and Brazil, will also see dramatic increases in spending by Chinese tourists by 2023.
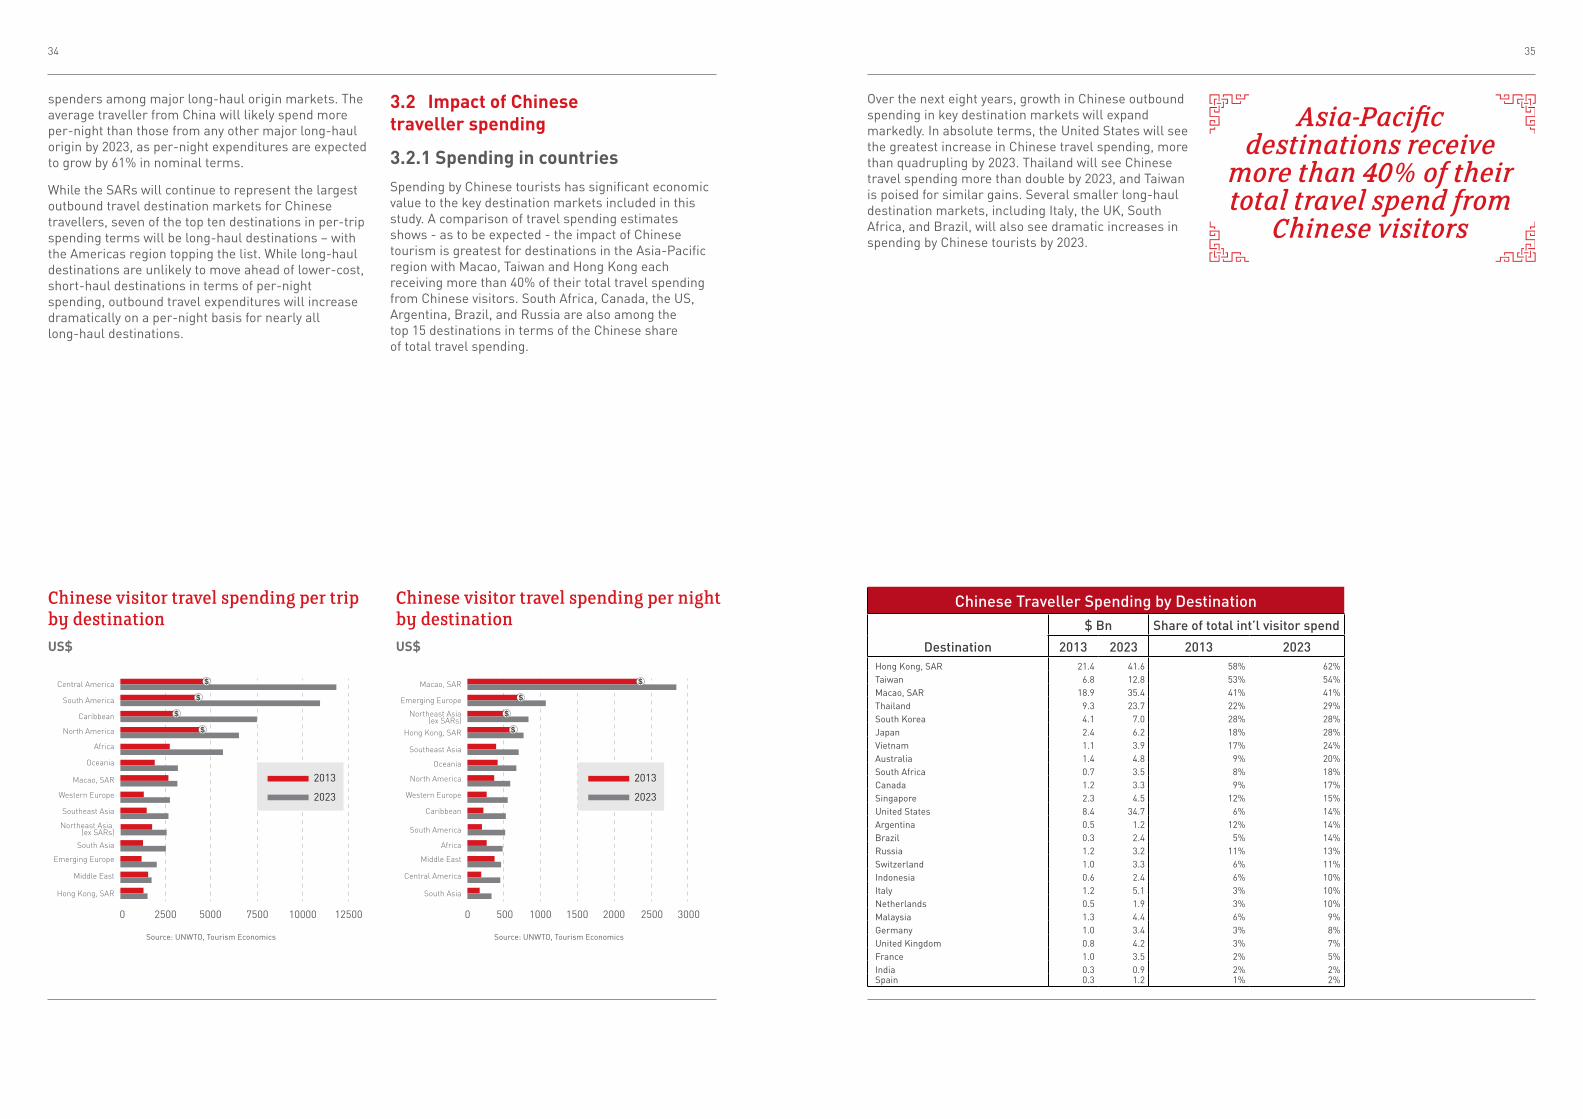
3.2 Impact of Chinese traveller spending
3.2.1 Spending in countriesSpending by Chinese tourists has significant economic value to the key destination markets included in this study. A comparison of travel spending estimates shows - as to be expected - the impact of Chinese tourism is greatest for destinations in the Asia-Pacific region with Macao, Taiwan and Hong Kong each receiving more than 40% of their total travel spending from Chinese visitors. South Africa, Canada, the US, Argentina, Brazil, and Russia are also among the top 15 destinations in terms of the Chinese share of total travel spending.
Asia-Pacific destinations receive
more than 40% of their total travel spend from
Chinese visitors
0 2500 5000 7500 10000 12500
2013
2023
Central America
South America
Caribbean
North America
Africa
Oceania
Macao, SAR
Western Europe
Southeast Asia
Northeast Asia (ex SARs)
South Asia
Emerging Europe
Middle East
Hong Kong, SAR
0 500 1000 1500 2000 2500 3000
2013
2023
Macao, SAR
Emerging Europe
Northeast Asia(ex SARs)
Hong Kong, SAR
Southeast Asia
Oceania
North America
Western Europe
Caribbean
South America
Africa
Middle East
Central America
South Asia
Chinese visitor travel spending per trip by destinationUS$
Source: UNWTO, Tourism Economics Source: UNWTO, Tourism Economics
Chinese visitor travel spending per night by destinationUS$
Chinese Traveller Spending by Destination
Destination
$ Bn Share of total int’l visitor spend
2013 2023 2013 2023Hong Kong, SAR 21.4 41.6 58% 62%Taiwan 6.8 12.8 53% 54%Macao, SAR 18.9 35.4 41% 41%Thailand 9.3 23.7 22% 29%South Korea 4.1 7.0 28% 28%Japan 2.4 6.2 18% 28%Vietnam 1.1 3.9 17% 24%Australia 1.4 4.8 9% 20%South Africa 0.7 3.5 8% 18%Canada 1.2 3.3 9% 17%Singapore 2.3 4.5 12% 15%United States 8.4 34.7 6% 14%Argentina 0.5 1.2 12% 14%Brazil 0.3 2.4 5% 14%Russia 1.2 3.2 11% 13%Switzerland 1.0 3.3 6% 11%Indonesia 0.6 2.4 6% 10%Italy 1.2 5.1 3% 10%Netherlands 0.5 1.9 3% 10%Malaysia 1.3 4.4 6% 9%Germany 1.0 3.4 3% 8%United Kingdom 0.8 4.2 3% 7%France 1.0 3.5 2% 5%India 0.3 0.9 2% 2%Spain 0.3 1.2 1% 2%

36 37
While the current top destination countries will maintain their lead, several longer-haul destinations will see the Chinese proportion of total travel spending increase dramatically over the next eight years. In the US and UK, Chinese travel spending will more than double as a share of total inbound travel spending. Most European destinations will experience similar gains, while the Chinese shares in Italy and the Netherlands will likely more than triple.
3.2.2 Spending in citiesGiven the preference of Chinese travellers for visiting major global cities, it is important to understand the spending impacts of Chinese visitors within urban centres. The top 25 global city destinations outside of Greater China receive more than a quarter of total Chinese outbound travel spending - 27.6%.
Outside of Greater China, Thailand and the United States have been the recent frontrunners in terms of travel expenditures received by Chinese tourists. It is no surprise that four of the top five cities for Chinese travel spending are located in these two countries. At $3.8 billion, Chinese travel spending in Bangkok accounted for 4.6% of total outbound travel expenditures from China in 2013. Pattaya was a distant second at 3.5% and Seoul accounted for 2.3%. Meanwhile, New York City and Los Angeles represented a combined 3.4% of the total, each receiving $1.4 billion in Chinese travel spending.
Though the mix of top city destination markets for Chinese travel spending will remain relatively unchanged over the next decade, long-haul cities are slated for more robust gains in Chinese travel spending than many urban centres in the Asia-Pacific region. For instance, London – a considerably smaller recipient
of Chinese travel spending at present – is slated for average annual growth of 18.5% by 2023, moving it from the 24th largest Chinese travel spending market to the tenth largest. As Chinese travel to the UK ramps up, London will realise a greater share of incremental growth in Chinese travel spending due to its status as the nucleus of travel within the UK for Chinese visitors. Similarly, Chinese travel spending growth in the top US cities will average between 13.7% and 15% over the next eight years. The fastest growing short-haul city destination for Chinese travel spending, aside from those in Hong Kong or Macao, will be Kuala Lumpur with an average annual rate of 12.6%.
At $3.8 billion, Chinese travel
spending in Bangkok accounted for 4.6% of total outbound
travel expenditures from China
50 10 15 20 25 30 35
2013
2023
United States
Thailand
Taiwan
South Korea
Japan
Italy
Australia
Singapore
Malaysia
United Kingdom
Vietnam
France
South Africa
Germany
Switzerland
Canada
Russia
Brazil
Indonesia
Netherlands
Argentina
Spain
India
0 10% 20% 30% 40% 50% 60%
2013
2023
Hong Kong, SAR
Taiwan
Macao, SAR
Thailand
South Korea
Japan
Vietnam
Australia
South Africa
Canada
Singapore
United States
Argentina
Brazil
Russia
Switzerland
Indonesia
Italy
Netherlands
Malaysia
Germany
United Kingdon
France
India
Spain
Chinese Traveller spending by destination
Chinese Traveller spending by destination
US$ billion Share of total inbound spending
Source: Tourism Economics Source: Tourism Economics
Top Cities for Chinese Traveller Spending
$ Bn CAGR
Destination 2013 2023 2013 - 2023
Bangkok 3.83 8.89 8.8%Pattaya 2.92 6.77 8.8%Seoul 1.96 3.34 5.5%New York City 1.41 5.48 14.5%Los Angeles 1.41 5.40 14.4%Tokyo 1.21 1.47 1.9%Phuket 1.19 2.75 8.8%San Francisco 0.91 3.42 14.2%Washington, DC 0.72 2.74 14.3%Las Vegas 0.70 2.63 14.2%Sydney 0.60 0.75 2.2%British Columbia 0.56 0.68 2.0%Chiang Mai 0.55 1.27 8.8%Kuala Lumpur 0.51 1.65 12.6%Melbourne 0.48 0.58 1.9%Osaka 0.46 0.56 1.9%Ontario 0.46 0.56 2.0%Busan 0.46 0.78 5.5%Chicago 0.43 1.56 13.7%Boston 0.42 1.70 15.0%Fukuoka 0.39 0.48 1.9%Jeju City 0.37 0.63 5.5%Ayutthaya 0.37 0.85 8.8%London 0.34 1.85 18.5%Bali (Jimaran, Tuban) 0.33 0.41 2.4%

38 39
4. Additional Opportunities
Improving access for Chinese travellers presents significant opportunities for travel growth to destination countries and cities. As it stands, visa regulations inhibit, or at least complicate, travel for Chinese nationals to many international destinations. Eliminating these barriers to entry, whether through visa reforms or non-visa facilitation measures, has the potential to increase the flow of Chinese outbound tourism to international destinations beyond expected gains resulting from GDP and income growth over the forecast horizon.
Improving access for Chinese travellers presents significant opportunities for travel growth to destination countries and cities

40 41
4.1 Visa facilitation scenario
4.1.1 Visa case studiesThe benefits of travel facilitation reforms can be historically observed through increases in tourism arrivals after more open policies were implemented (and conversely, declines in arrivals after more restrictive policies were put in place). A series of 20 case studies was conducted analysing tourism arrivals to key destination countries which have implemented visa policy reforms affecting Chinese nationals since 1998. The observable growth premium in Chinese arrivals after each reform was used to develop a model of the potential impacts which could be realised by host nations of Chinese tourists if certain reforms were enacted.
Observed travel facilitation reforms included both visa policy changes and non-visa measures, ranging from the removal of inbound travel quotas, introduction of an individual travel visa scheme, government-sponsored tourism promotion programmes, visa-free travel exceptions for various classes of passport holders, introduction of electronic visa applications (eVisa), visa waiver programmes, visa on arrival programmes (VoA), and the addition of the destination country to China’s Approved Destination Status (ADS) policy. Growth in Chinese outbound tourism to the 20 observed destination countries varied considerably following each reform but was largely positive. The post-reform three-year compound annual growth rate (CAGR) in Chinese arrivals ranged from -2% (Russia) to 61% (Vietnam). Excluding these outliers, the average CAGR in the three years after a reform was 25%.
Approved Destination StatusSeveral case studies included in this report refer to a nation’s addition to China’s Approved Destination Status (ADS) programme. In contrast to the other types of visa reforms studied, ADS is an outbound reform extended by China to destination countries. The primary intention of the programme is to make it easier for Chinese nationals to travel as a part of an organised group trip to approved destinations. Modest gains in Chinese arrivals have been observed following a nation’s addition to the ADS programme, while shares of total Chinese outbound travel have fluctuated. Examples of ADS adoption have been incorporated to account for the benefits gained by the initial surge in arrivals that accompanies increased group leisure travel from China. The destination markets which have seen the most robust gains in Chinese visits since their addition to ADS have also implemented
travel facilitation reforms for Chinese visitors, ensuring that individual leisure travellers can just as easily gain access.
Visa on ArrivalIn June 2006, Indonesia made visas on arrival (VoA) available to Chinese nationals for the first time, eliminating the need for the completion of traditional visa applications in advance of travel. In the six years leading up to the policy change, Chinese arrivals to Indonesia grew at a CAGR of 15%, and Indonesia received roughly 0.3% of total outbound Chinese travel per annum, on average. Since the introduction of VoA, Indonesia’s average share of total Chinese outbound travel more than quadrupled to 1.3% per year, while CAGR in arrivals rose to 40%, suggesting the greater ease of travel to Indonesia considerably improved its popularity among Chinese tourists.
Visa WaiversSingapore and the Philippines provide examples of the graduated effects of various types of visa waiver programmes. The former made visa-free travel available to travellers with official or diplomatic passports in April 2011, while still requiring traditional travel visas for all other Chinese nationals. Growth in Chinese arrivals to Singapore increased from a six-year CAGR of 5% before the reform to a three-year CAGR of 15% following the change, though the nation’s share of total Chinese outbound travel was relatively unchanged. As previously suggested, carriers of official or diplomatic passports are more likely to visit an international destination for business purposes than for leisure. Chinese outbound leisure travel growth is now outpacing business travel growth, so it is likely that continuing to require traditional visas of Chinese tourists is preventing Singapore from capturing a larger share of total Chinese outbound travel.
Similarly, the Philippines reached a mutual visa waiver agreement with China in February 2005 affecting travellers with diplomatic or official passports from both markets. At first Chinese travel to the Philippines increased dramatically, as business travel was still growing at a premium over leisure in 2005. The CAGR for total Chinese arrivals to the Philippines topped 15% in the three years following the change. Meanwhile, the share of total Chinese outbound travel received by the Philippines rose from 0.2% to around 0.6%. Yet, a more significant reform came in 2010 when Chinese travellers holding valid visas from Australia, Japan, Canada, the US, or any of the Schengen countries were granted visa-free access to the Philippines for up to seven days. In the three years following the reform,
CAGR in Chinese visitor arrivals rose to 40% in Indonesia
since the introduction of a visa on arrival
Travel Facilitation Policy Effects on Chinese Outbound Tourism Arrivals
Destination Country Year of Policy Change Policy Change Type CAGRb (pre-reform, 6-yr)
CAGRc (post-reform, 3-yr)
Indonesia 2006 VoA 15% 40%
Singapore 2011 visa-free exceptions 5% 15%
Philippines 2005 visa waiver 9% 15%
Hong Kong, SAR 2002 mainland quota removed 7% 19%
Macao, SAR 2003 individual visa scheme 22% 26%
Malaysia 2007 gov tourism promotion 1% 18%
Thailand 2010 gov tourism promotion 4% 59%
Cambodia 2006 eVisa 14% 17%
South Korea 1998 ADS 10% 32%
Australia 1999 ADS 18% 27%
Japan 2000 ADS 8% 8%
Vietnam 2000 ADS -37% 61%
Germany 2003 ADS 13% 18%
France 2004 ADS -1% 22%
Switzerland 2004 ADS 6% 21%
Austria 2004 ADS 3% -0%
Laos 2004 ADS -42% 59%
Russia 2005 ADS 10% -2%
Taiwan 2008 ADS 6% 36%
Canada 2010 ADS 13% 22%
AVERAGEa 4% 25%
a Average CAGR calculations exclude outliers (Russia, Vietnam)
b Due to historical data limitations, pre-policy CAGRs for the following countries were calculated over fewer than 6 years: Republic of Korea (2-yr); Japan (4-yr); Vietnam (4-yr); Australia (3-yr)
c Due to the lateness of the visa reform, post-policy CAGRs for the following countries were calculated using partial forecast periods: Thailand (2013); Canada (2013); Singapore (2013 and 2014)
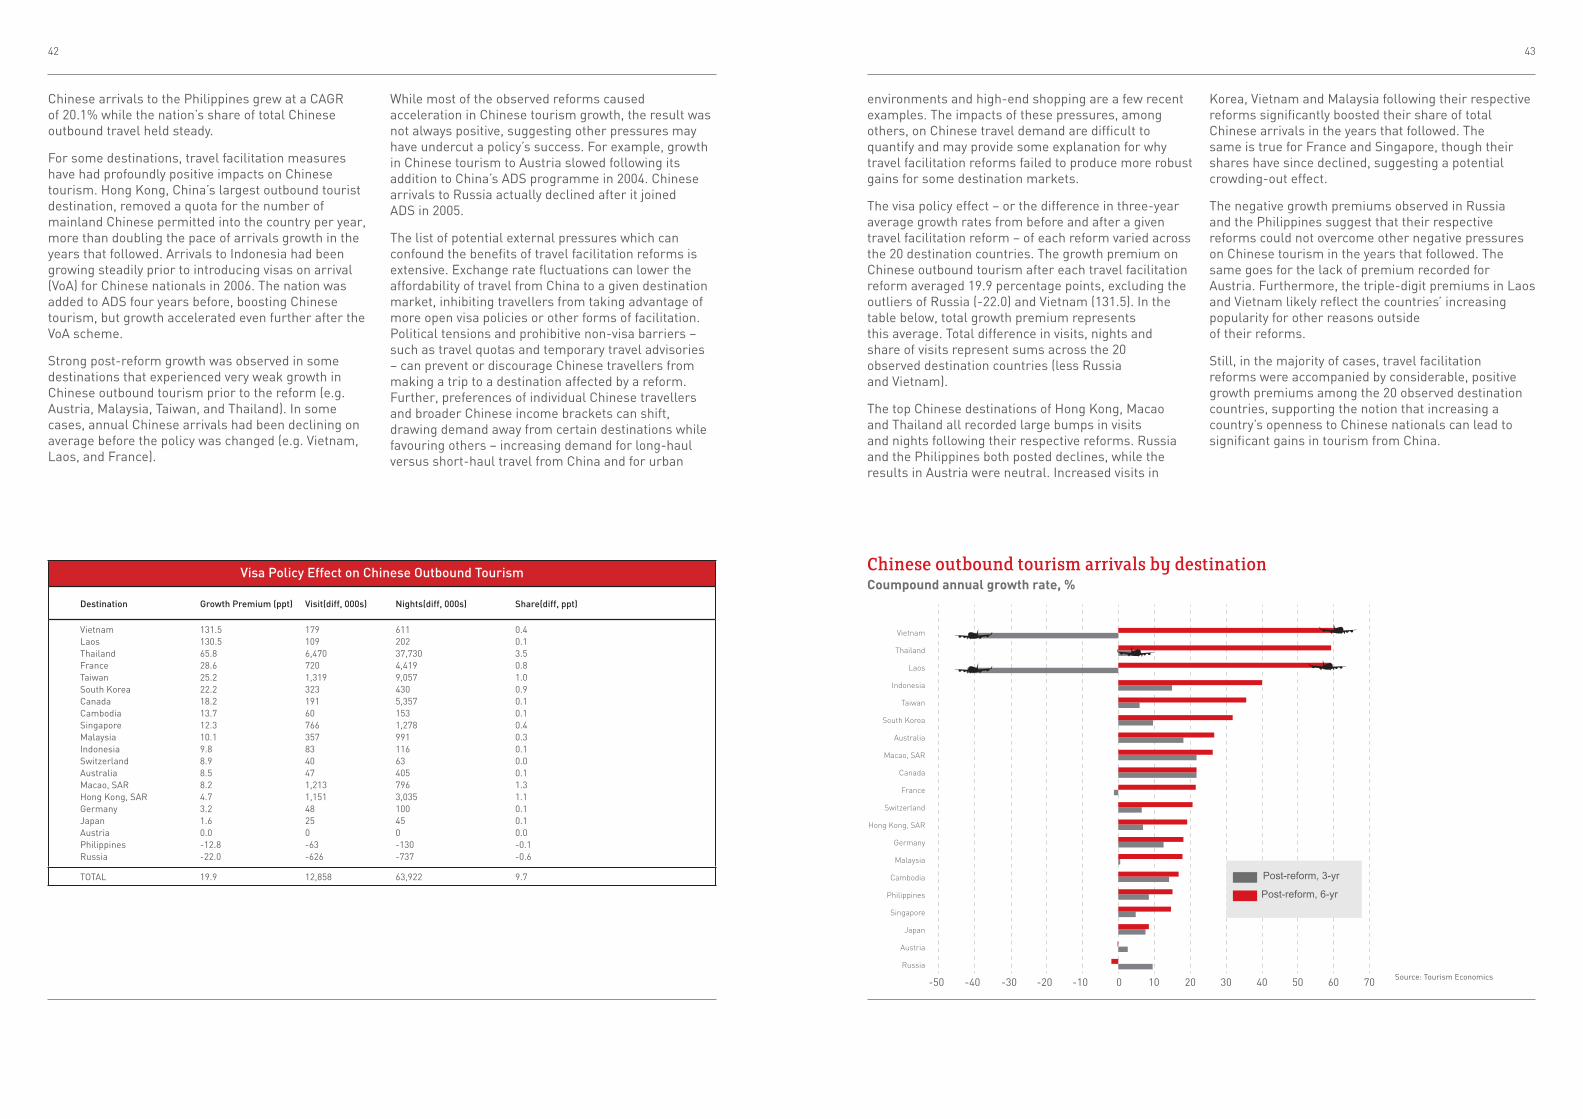
42 43
Chinese arrivals to the Philippines grew at a CAGR of 20.1% while the nation’s share of total Chinese outbound travel held steady.
For some destinations, travel facilitation measures have had profoundly positive impacts on Chinese tourism. Hong Kong, China’s largest outbound tourist destination, removed a quota for the number of mainland Chinese permitted into the country per year, more than doubling the pace of arrivals growth in the years that followed. Arrivals to Indonesia had been growing steadily prior to introducing visas on arrival (VoA) for Chinese nationals in 2006. The nation was added to ADS four years before, boosting Chinese tourism, but growth accelerated even further after the VoA scheme.
Strong post-reform growth was observed in some destinations that experienced very weak growth in Chinese outbound tourism prior to the reform (e.g. Austria, Malaysia, Taiwan, and Thailand). In some cases, annual Chinese arrivals had been declining on average before the policy was changed (e.g. Vietnam, Laos, and France).
While most of the observed reforms caused acceleration in Chinese tourism growth, the result was not always positive, suggesting other pressures may have undercut a policy’s success. For example, growth in Chinese tourism to Austria slowed following its addition to China’s ADS programme in 2004. Chinese arrivals to Russia actually declined after it joined ADS in 2005.
The list of potential external pressures which can confound the benefits of travel facilitation reforms is extensive. Exchange rate fluctuations can lower the affordability of travel from China to a given destination market, inhibiting travellers from taking advantage of more open visa policies or other forms of facilitation. Political tensions and prohibitive non-visa barriers – such as travel quotas and temporary travel advisories – can prevent or discourage Chinese travellers from making a trip to a destination affected by a reform. Further, preferences of individual Chinese travellers and broader Chinese income brackets can shift, drawing demand away from certain destinations while favouring others – increasing demand for long-haul versus short-haul travel from China and for urban
environments and high-end shopping are a few recent examples. The impacts of these pressures, among others, on Chinese travel demand are difficult to quantify and may provide some explanation for why travel facilitation reforms failed to produce more robust gains for some destination markets.
The visa policy effect – or the difference in three-year average growth rates from before and after a given travel facilitation reform – of each reform varied across the 20 destination countries. The growth premium on Chinese outbound tourism after each travel facilitation reform averaged 19.9 percentage points, excluding the outliers of Russia (-22.0) and Vietnam (131.5). In the table below, total growth premium represents this average. Total difference in visits, nights and share of visits represent sums across the 20 observed destination countries (less Russia and Vietnam).
The top Chinese destinations of Hong Kong, Macao and Thailand all recorded large bumps in visits and nights following their respective reforms. Russia and the Philippines both posted declines, while the results in Austria were neutral. Increased visits in
Korea, Vietnam and Malaysia following their respective reforms significantly boosted their share of total Chinese arrivals in the years that followed. The same is true for France and Singapore, though their shares have since declined, suggesting a potential crowding-out effect.
The negative growth premiums observed in Russia and the Philippines suggest that their respective reforms could not overcome other negative pressures on Chinese tourism in the years that followed. The same goes for the lack of premium recorded for Austria. Furthermore, the triple-digit premiums in Laos and Vietnam likely reflect the countries’ increasing popularity for other reasons outside of their reforms.
Still, in the majority of cases, travel facilitation reforms were accompanied by considerable, positive growth premiums among the 20 observed destination countries, supporting the notion that increasing a country’s openness to Chinese nationals can lead to significant gains in tourism from China.
10-10-20-30-40-50 20 30 40 50 60 700
Vietnam
Thailand
Laos
Indonesia
Taiwan
South Korea
Australia
Macao, SAR
Canada
France
Switzerland
Hong Kong, SAR
Germany
Malaysia
Cambodia
Philippines
Singapore
Japan
Austria
Russia
Post-reform, 3-yr
Post-reform, 6-yr
Chinese outbound tourism arrivals by destinationCoumpound annual growth rate, %
Source: Tourism Economics
Visa Policy Effect on Chinese Outbound Tourism
Destination Growth Premium (ppt) Visit(diff, 000s) Nights(diff, 000s) Share(diff, ppt)
Vietnam 131.5 179 611 0.4Laos 130.5 109 202 0.1Thailand 65.8 6,470 37,730 3.5France 28.6 720 4,419 0.8Taiwan 25.2 1,319 9,057 1.0South Korea 22.2 323 430 0.9Canada 18.2 191 5,357 0.1Cambodia 13.7 60 153 0.1Singapore 12.3 766 1,278 0.4Malaysia 10.1 357 991 0.3Indonesia 9.8 83 116 0.1Switzerland 8.9 40 63 0.0Australia 8.5 47 405 0.1Macao, SAR 8.2 1,213 796 1.3Hong Kong, SAR 4.7 1,151 3,035 1.1Germany 3.2 48 100 0.1Japan 1.6 25 45 0.1Austria 0.0 0 0 0.0Philippines -12.8 -63 -130 -0.1Russia -22.0 -626 -737 -0.6
TOTAL 19.9 12,858 63,922 9.7

44 45
4.1.2 Travel facilitation opportunity Using the same methodology developed for previous Oxford Economics studies with the WTTC and UNWTO19, 20, the results of case study analysis were extrapolated to produce an alternative scenario forecast for key Chinese outbound travel destination markets in order to determine the potential benefits of travel facilitation. By applying the average growth premium of 19.9 percentage points from the aforementioned visa policy analysis, Tourism Economics calculated the potential economic impact of travel facilitation reforms by 23 international destination countries in the near term. Growth in Chinese travel spending was estimated over a three-year forecast horizon. Assuming each destination implements travel facilitation reforms by the end of 2014, the impact of each policy change would be realised by 2017.
For comparison, the Chinese share of each destination’s international visitor spending total under the baseline and policy scenarios is shown on the next page. Note that each destination country was treated separately when calculating growth in the Chinese share of total international visitor spending, with forecasted travel spending from other origin markets held constant.
In many cases, the growth premium in Chinese spending would have significant impacts on the Chinese share of total travel spending by 2017. While policy reforms by any destination would facilitate travel from China, that impact will likely be larger in destinations that are already heavily travelled by Chinese visitors. Thus, the impacts for short-haul destinations, which Chinese travellers tend to prefer, would likely be larger than those felt in long-haul destinations. That said, as average income increases in China and its middle class expands, expected growth in the long-haul share of total outbound travel from China would likely be amplified if more facilitative visa policies were enacted by these destinations.
Recent reforms by the US and UK will greatly facilitate Chinese travel, though their impacts have yet to be observed in the available Chinese outbound arrivals and spending data. In November 2014, the US and China reached a mutual agreement to extend the terms of their tourist visa from one year to ten years. That is, Chinese nationals will be able to acquire US short-term multiple-entry visas for both business and leisure travel valid for up to ten years, and vice versa. The reform extends the same level of access to Chinese nationals as that enjoyed by nationals of countries with close ties to the US and is expected to boost Chinese tourism to the US over the next several years.
Likewise, the UK is in the process of improving visa facilitation and processing for Chinese travellers. Super Priority Visas, which are processed within 24 hours, have been extended to travellers from Beijing, Shanghai, and Guangzhou. And Chinese travellers may soon be able to apply for UK and Schengen visas simultaneously. Other reforms include lower wait times for visa processing and reduced personal identification documentation for visa applications.
These recent policy changes and process improvements, along with those highlighted in the case study analysis, provide examples of best practices in improving travel facilitation for Chinese visitors. Adopting similar measures would provide opportunities for destination markets to improve their attractiveness to Chinese travellers, increasing the likelihood of achieving the estimated growth premiums in Chinese outbound arrivals and spending described in this analysis.
Recent reforms by the US and UK will greatly facilitate
Chinese travel
19 Tourism Economics, World Travel & Tourism Council (WTTC), and World Tourism Organization (UNWTO) (2014), The Impact of Visa Facilitation in ASEAN Member States (Online), available: file:///C:/Users/Anthony/Downloads/Impact_ASEAN.pdf
20 Tourism Economics, World Travel & Tourism Council (WTTC), and World Tourism Organization (UNWTO) (2013), Tourism Visa Openness Report: Updated for the 5th T.20 Ministers’ Meeting (Online), available: http://dtxtq4w60xqpw.cloudfront.net/sites/all/files/docpdf/2013tourismvisaopennessreportt20november2013lowres_0.pdf
1513108530
United States
France
Italy
United Kingdom
Thailand
Malaysia
Singapore
Spain
Australia
Switzerland
Canada
India
Russia
Netherlands
Southh Africa
Indonesia
Vietnam
Brazil
Japan
South Korea
Taiwan
Argentina
Germany
Growth premium from travel facilitationGrowth in Chinese traveller spending above baseline, 2014-2017, %
Source: Tourism Economics
Chinese Traveller Spending by Destination
$ Bn Share of total international visitor spend
Destination 2017 Baseline 2017 Policy Scenario 2017 Baseline 2017 Policy Scenario
Taiwan 8.2 9.9 52% 57%South Korea 4.8 5.8 28% 31%Japan 4.3 5.2 27% 30%Thailand 11.5 13.8 25% 29%Vietnam 2.1 2.5 21% 24%Argentina 0.7 0.9 14% 16%Australia 2.4 2.9 14% 16%Canada 2.1 2.6 13% 16%South Africa 1.5 1.8 12% 14%Russia 1.7 2.0 12% 14%Singapore 2.6 3.1 11% 13%United States 16.6 20.0 9% 11%Switzerland 1.7 2.1 8% 10%Indonesia 1.1 1.3 8% 10%Brazil 0.8 1.0 8% 10%Malaysia 2.3 2.8 8% 9%Netherlands 0.9 1.0 6% 7%Italy 2.3 2.8 5% 6%Germany 1.8 2.2 5% 5%United Kingdom 1.6 1.9 4% 5%France 1.8 2.1 3% 4%India 0.5 0.6 2% 2%Spain 0.6 0.7 1% 1%

46 47
5. Conclusion And Recommendations
Despite the expected gradual slowing of economic growth in China from the breakneck pace exhibited over the past decade, the Chinese economy will remain a leading emerging market with considerable impacts on international tourism.
Millions of Chinese nationals will make their first international leisure trips over the next eight years as the growing middle class and increasing affordability means international travel is more accessible for Chinese households.
As the number of high-earning Chinese grows, their preferences will alter to include more long-haul destinations and higher-cost accommodation. At the same time we can expect to see an increase in the amount of per-trip and per-night travel and tourism spending by Chinese visitors.

48 49
The increase in outbound travel demand from China will be most evident in global city destinations, as a greater share of Chinese travellers originate from urban centres over the forecast horizon. Those cities which are well connected via regional and global air routes, as well as those with diverse shopping, entertainment, and sight-seeing offerings stand to benefit most from rising demand.
In order to benefit most from increasing Chinese outbound tourism, global destination markets should facilitate travel for Chinese nationals where possible. The following is a list of recommendations to help global destination markets work towards this.
Improve the communication of visas requirements to travellersCommunicating visa requirements to travellers is the first step in making travel easier. Information on visa applications and travel procedures should be easily searchable and available online, provided in languages and dialects familiar to Chinese nationals from target provinces and regions, and updated daily. Live support should be available to travellers applying for entry visas through electronic communication or by phone. Visa policies should be enforced consistently across ports of entry, and any discrepancies between ports should be clearly communicated to travellers before they start their journey.
Increase the efficiency of visa application processes The visa application process should be streamlined and simplified as much as possible, removing the possibility for administrative errors or delays. Travellers should be permitted to apply for visas online. Visa processing capacity should be optimised online and at ports of entry. Waiting periods for visa approval should be reduced. Visa application fees should be lowered or removed entirely.
Facilitate travel for tourists who currently require traditional visasWhere some form of visa is required, officials should prioritise the implementation of visa on arrival and electronic visas (eVisa). Travel visas should be made valid for an extended period of time, limiting the need for reapplication, as exemplified by the recent agreement between the US and China to mutually increase the validity period of short-term travel visas from one year to 10 years. Governments could consider visa-free travel where possible during holidays, peak travel seasons, and special events. Officials should extend visa-free travel opportunities to tourists currently requiring a traditional visa, either universally or selectively by classification of traveller type.
Promote reciprocally open visa policies Non-facilitative visa policies put in place to achieve restrictive reciprocity with China should be eliminated and replaced with visa-free travel. Being the first-mover in relaxing visa policies in non-open pairs encourages other nations to implement more facilitative policies as well, mutually benefiting both the origin and destination markets.
Grant visa-free travel cooperatively Further opportunities for cooperation between economic and political blocs should consider extending common visas for Chinese nationals. Mutual visa-free travel arrangements – similar to Europe’s Schengen visa – should be expanded to incorporate travel from China to more participating markets, eliminating individual visa requirements for each destination.
Create new air routes and increase airline capacity Developing aviation connections with China is critical. Partnerships between tourism stakeholders and major airlines should be developed for the purpose of increasing the frequency of flights, number of connections, and access to Chinese origin markets. To accommodate greater visitor demand, airport
Communicating visa requirements to travellers is the
first step in making travel easier
Developing aviation connections with China is critical to
achieving increasing travel destination
markets
capacity should be increased wherever possible, whether through the expansion of existing facilities or construction of new ones. Regional air connections should also be established to increase the ease of local travel for Chinese visitors.
Businesses and destinations need to do moreBusinesses and city destinations alike need to understand the needs and specific requirements of Chinese travellers. As visitors’ travel preferences move away from packaged tours, language facilities and better guidance and signposting will be key. Attracting Chinese visitors is more than just improving the experience once they have arrived, the entire booking procedure needs to be considered and adapted to improve access. Governments in turn should do all they can to ensure businesses large and small are aware of the opportunity and can access tools to help reach the Chinese market.

50 51
Annex: Global City Travel Data Tables – breakdown by country
Americas
Top American cities for Chinese arrivals, 2013-2023
Rank Market1000s %
CAGR2013 2023 changeUnited States
1 New York City 395 1,166 196% 11.4%2 Los Angeles 392 1,144 192% 11.3%
3 San Francisco 253 724 186% 11.1%4 Washington, DC 202 584 189% 11.2%
5 Las Vegas 195 559 187% 11.1%
6 Chicago 121 332 174% 10.6%
7 Boston 117 361 209% 11.9%
8 Philadelphia 47 134 183% 11.0%
9 New Jersey 47 139 196% 11.4%10 Seattle 46 142 208% 11.9%
Canada
1 British Columbia 37 59 59% 4.8%
2 Ontario 34 54 59% 4.8%
3 Quebec 23 36 59% 4.8%4 Alberta 10 16 59% 4.8%
Mexico
1 Mexico City 9 20 118% 8.1%
2 Cancún 3 7 128% 8.6%
3 Tijuana 2 4 118% 8.1%4 Monterrey 1 2 129% 8.6%
5 Guadalajara 1 1 136% 9.0%
6 Acapulco 0 1 122% 8.3%
Top American cities for Chinese average stay, 2013-2023
Rank MarketAverage stay2013 2023
United States
1 Dallas/Ft. Worth 3.4 3.4
2 Los Angeles 3.4 3.4
3 Newark 3.3 3.3
4 Virginia 3.3 3.3
5 New Orleans 3.3 3.3
6 New Jersey 3.3 3.3
7 Boston 3.3 3.3
8 San Diego 3.3 3.3
9 San Jose 3.3 3.3
10 San Francisco 3.3 3.3
Canada
1 British Columbia 17.3 17.2
2 Alberta 15.6 15.6
3 Ontario 15.6 15.5
4 Quebec 11.2 11.1
Mexico
1 Cancún 11.1 11.1
2 Acapulco 5.1 5.1
3 Mexico City 4.6 4.7
4 Monterrey 4.6 4.5
5 Guadalajara 4.4 4.6
6 Tijuana 3.5 3.6
Top American cities for Chinese roomnights, 2013-2023
Market1000s %
CAGR2013 2023 changeUnited States
1 New York City 817 2,417 196% 11.5%
2 Los Angeles 814 2,380 192% 11.3%
3 San Francisco 525 1,507 187% 11.1%
4 Washington, DC 418 1,209 189% 11.2%
5 Las Vegas 404 1,161 187% 11.1%
6 Chicago 251 688 174% 10.6%
7 Boston 243 751 209% 11.9%
8 Philadelphia 98 278 184% 11.0%
9 New Jersey 98 289 196% 11.4%
10 Seattle 97 296 207% 11.9%
Canada
1 British Columbia 456 706 55% 4.5%
2 Ontario 374 579 55% 4.5%
3 Quebec 179 278 55% 4.5%
4 Alberta 110 171 55% 4.5%
Mexico
1 Mexico City 27 59 120% 8.2%
2 Cancún 22 49 122% 8.3%
3 Tijuana 4 9 116% 8.0%
4 Monterrey 2 4 119% 8.2%
5 Guadalajara 1 4 142% 9.2%
6 Acapulco 1 3 117% 8.1%
Top American cities for Chinese traveller spending, 2013-2023
Market 2013 2023
%
CAGRUnited States
1 New York City $1,410,292,179 $5,483,009,609 289% 14.5%2 Los Angeles $1,406,122,848 $5,398,459,545 284% 14.4%3 San Francisco $907,269,316 $3,417,870,244 277% 14.2%4 Washington, DC $721,017,505 $2,742,149,144 280% 14.3%5 Las Vegas $698,318,092 $2,632,555,514 277% 14.2%6 Chicago $433,330,629 $1,561,417,144 260% 13.7%7 Boston $419,673,294 $1,702,944,740 306% 15.0%8 Philadelphia $168,651,028 $630,300,982 274% 14.1%9 New Jersey $168,571,347 $654,592,272 288% 14.5%
10 Seattle $166,854,958 $672,326,236 303% 15.0%Canada
1 British Columbia $561,131,581 $681,292,371 21% 2.0%2 Ontario $459,692,841 $558,131,525 21% 2.0%3 Quebec $220,763,337 $268,037,627 21% 2.0%
4 Alberta $135,464,420 $164,472,789 21% 2.0%
Mexico
1 Mexico City $21,099,871 $44,431,583 111% 7.7%
2 Cancún $17,526,969 $37,201,553 112% 7.8%3 Tijuana $3,392,435 $7,005,092 106% 7.5%
4 Monterrey $1,515,830 $3,177,967 110% 7.7%
5 Guadalajara $1,182,071 $2,731,878 131% 8.7%
6 Acapulco $993,898 $2,062,003 107% 7.6%

52 53
Top European cities for Chinese arrivals, 2013-2023
Rank Market1000s %
CAGR2013 2023 changeUnited Kingdom
1 London 75 205 174% 10.6%
2 Edinburgh 13 27 106% 7.5%
3 Manchester 9 18 93% 6.8%
4 Birmingham 6 12 86% 6.4%
5 Glasgow 4 9 127% 8.5%
6 Brighton 4 3 -12% -1.3%
7 Cardiff 3 4 32% 2.8%
8 Portsmouth-Southampton 2 4 78% 5.9%
9 Leeds-Bradford 2 7 274% 14.1%
10 Liverpool 2 4 105% 7.5%
France
1 Paris 226 436 93% 6.8%
2 Lyon 19 18 -3% -0.3%
3 Strasbourg 7 15 118% 8.1%
4 Nice-Cannes 6 11 68% 5.3%
5 Bordeaux 6 12 102% 7.3%
6 Toulouse 2 6 167% 10.3%
7 Lille 2 5 128% 8.6%
8 Marseille 2 4 116% 8.0%
Germany
1 Frankfurt 143 286 100% 7.2%
2 Munich 100 204 105% 7.4%
3 Berlin 84 164 95% 6.9%
4 Koln 30 63 109% 7.7%
5 Dusseldorf 26 52 100% 7.2%
6 Fussen 24 52 122% 8.3%
7 Hamburg 22 49 122% 8.3%
8 Nurnberg 15 30 99% 7.1%
9 Mainz 15 39 166% 10.3%
10 Heidelberg 14 22 58% 4.7%
Russia
1 Moscow 27 43 58% 4.7%
2 St. Petersburg 5 7 38% 3.3%
Italy
1 Milan 325 675 108% 7.6%
2 Florence 283 622 120% 8.2%
3 Venice 283 640 127% 8.5%
4 Rome 190 536 181% 10.9%
5 Treviso 95 186 95% 6.9%
6 Padova 82 166 102% 7.3%
7 Prato 62 136 119% 8.2%
8 Pistoia 55 133 141% 9.2%
9 Bologna 50 116 133% 8.8%
10 Verona 41 97 136% 9.0%
Top European cities for Chinese arrivals, 2013-2023
Rank Market1000s %
CAGR2013 2023 changeSwitzerland
1 Lucern/Lake Lucern 219 407 86% 6.4%
2 Bernese Oberland 164 234 43% 3.6%
3 Zürich Region 137 236 72% 5.6%
4 Geneva 54 96 78% 5.9%
5 Lake Genva Region (Vaud) 48 76 60% 4.8%
6 Bern Region 26 45 72% 5.6%
7 Ticino 23 32 37% 3.2%
8 Valais 17 27 62% 5.0%
9 Basel Region 12 18 54% 4.4%
10 Jura & Three Lakes 7 14 82% 6.1%
Netherlands
1 Amsterdam 94 206 119% 8.2%
2 The Hague 4 11 179% 10.8%
3 Rotterdam 2 7 182% 10.9%
Poland
1 Warsaw 8 19 123% 8.4%
Europe
Continued on next table
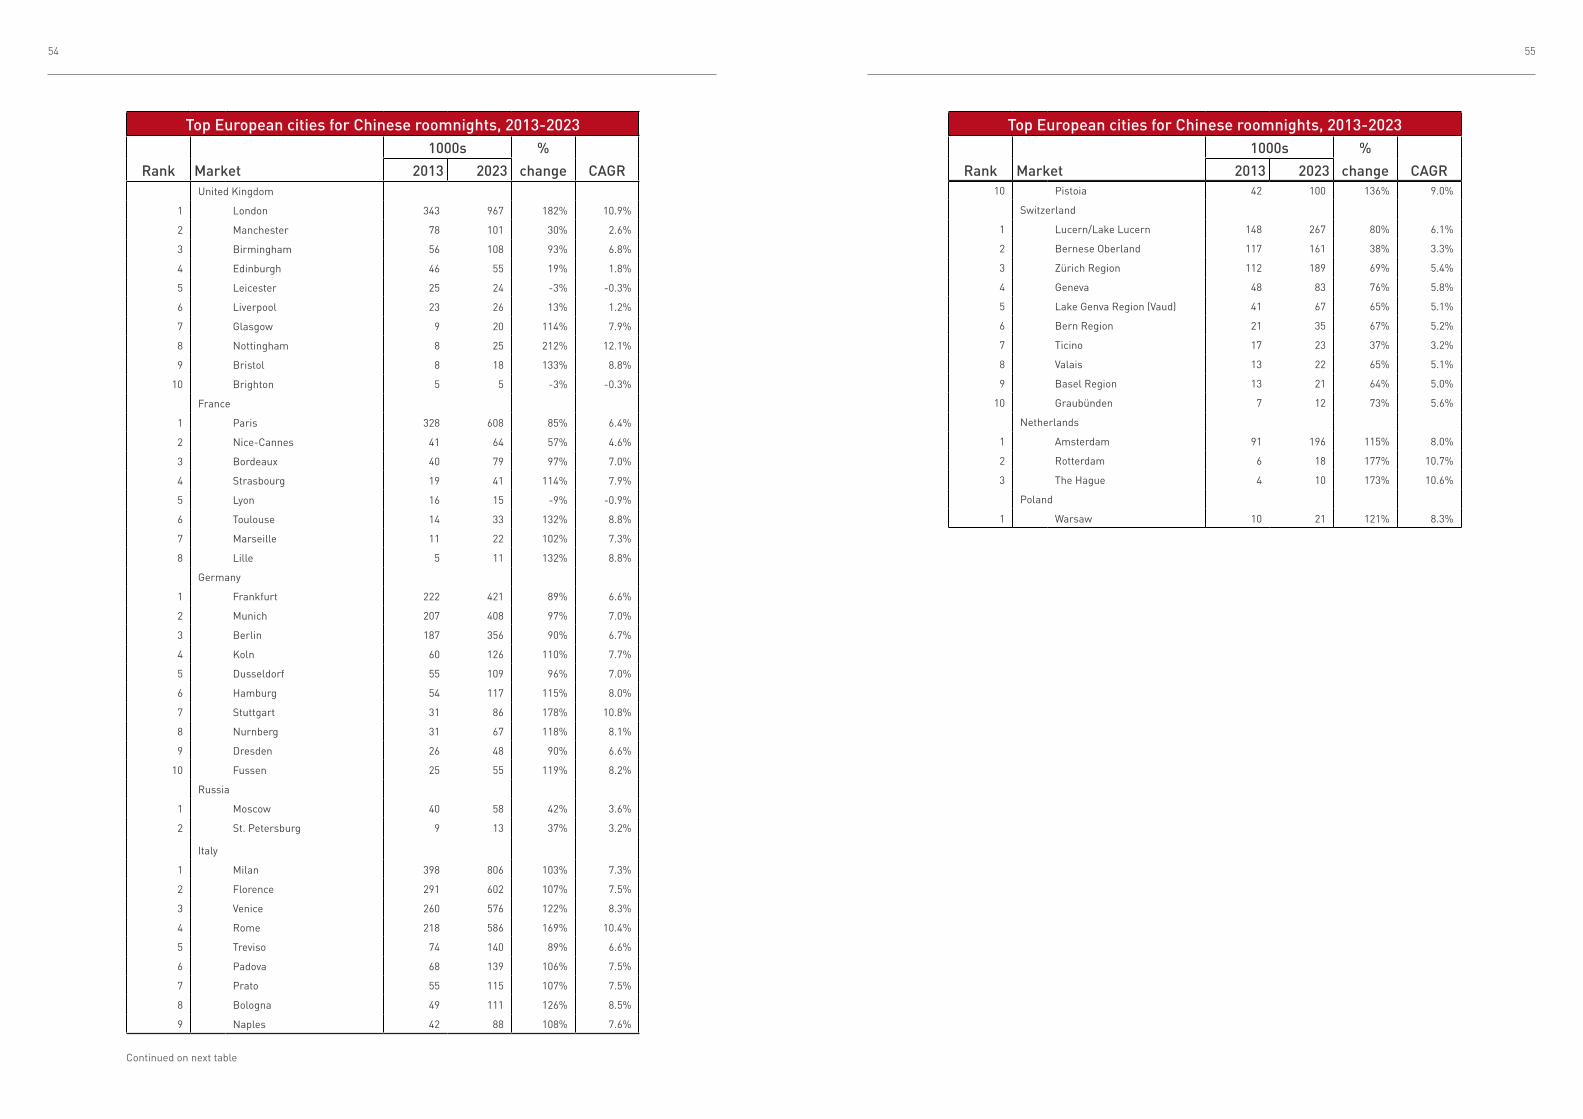
54 55
Top European cities for Chinese roomnights, 2013-2023
Rank Market
1000s %
CAGR2013 2023 changeUnited Kingdom
1 London 343 967 182% 10.9%
2 Manchester 78 101 30% 2.6%
3 Birmingham 56 108 93% 6.8%
4 Edinburgh 46 55 19% 1.8%
5 Leicester 25 24 -3% -0.3%
6 Liverpool 23 26 13% 1.2%
7 Glasgow 9 20 114% 7.9%
8 Nottingham 8 25 212% 12.1%
9 Bristol 8 18 133% 8.8%
10 Brighton 5 5 -3% -0.3%
France
1 Paris 328 608 85% 6.4%
2 Nice-Cannes 41 64 57% 4.6%
3 Bordeaux 40 79 97% 7.0%
4 Strasbourg 19 41 114% 7.9%
5 Lyon 16 15 -9% -0.9%
6 Toulouse 14 33 132% 8.8%
7 Marseille 11 22 102% 7.3%
8 Lille 5 11 132% 8.8%
Germany
1 Frankfurt 222 421 89% 6.6%
2 Munich 207 408 97% 7.0%
3 Berlin 187 356 90% 6.7%
4 Koln 60 126 110% 7.7%
5 Dusseldorf 55 109 96% 7.0%
6 Hamburg 54 117 115% 8.0%
7 Stuttgart 31 86 178% 10.8%
8 Nurnberg 31 67 118% 8.1%
9 Dresden 26 48 90% 6.6%
10 Fussen 25 55 119% 8.2%
Russia
1 Moscow 40 58 42% 3.6%
2 St. Petersburg 9 13 37% 3.2%
Italy
1 Milan 398 806 103% 7.3%
2 Florence 291 602 107% 7.5%
3 Venice 260 576 122% 8.3%
4 Rome 218 586 169% 10.4%
5 Treviso 74 140 89% 6.6%
6 Padova 68 139 106% 7.5%
7 Prato 55 115 107% 7.5%
8 Bologna 49 111 126% 8.5%
9 Naples 42 88 108% 7.6%
Continued on next table
Top European cities for Chinese roomnights, 2013-2023
Rank Market
1000s %
CAGR2013 2023 change10 Pistoia 42 100 136% 9.0%
Switzerland
1 Lucern/Lake Lucern 148 267 80% 6.1%
2 Bernese Oberland 117 161 38% 3.3%
3 Zürich Region 112 189 69% 5.4%
4 Geneva 48 83 76% 5.8%
5 Lake Genva Region (Vaud) 41 67 65% 5.1%
6 Bern Region 21 35 67% 5.2%
7 Ticino 17 23 37% 3.2%
8 Valais 13 22 65% 5.1%
9 Basel Region 13 21 64% 5.0%
10 Graubünden 7 12 73% 5.6%
Netherlands
1 Amsterdam 91 196 115% 8.0%
2 Rotterdam 6 18 177% 10.7%
3 The Hague 4 10 173% 10.6%
Poland
1 Warsaw 10 21 121% 8.3%

56 57
Top European cities for Chinese average stay, 2013-2023
Rank Market
Average stay
2013 2023United Kingdom
1 Leicester 19.4 13.1
2 Liverpool 18.1 10.0
3 Birmingham 13.4 13.8
4 Manchester 12.6 8.5
5 Nottingham 7.5 9.0
6 London 7.0 7.2
7 Bristol 6.9 8.1
8 Edinburgh 5.3 3.1
9 Aberdeen 4.4 4.7
10 Glasgow 3.6 3.4
France
1 Bordeaux 11.9 11.6
2 Toulouse 11.8 10.3
3 Nice-Cannes 11.5 10.8
4 Marseille 11.4 10.8
5 Strasbourg 5.0 4.9
6 Lille 4.1 4.2
7 Paris 2.6 2.5
8 Lyon 1.5 1.5
Germany
1 Magdeburg 6.0 5.2
2 Erlangen 4.3 4.0
3 Darmstadt 3.3 3.6
4 Hannover 3.1 2.5
5 Bonn 3.1 2.9
6 Essen 2.8 2.8
7 Regensburg 2.5 2.6
8 Mannheim 2.5 2.8
9 Hamburg 2.5 2.4
10 Offenbach 2.5 2.4
Russia
1 Moscow 1.6 1.6
2 St. Petersburg 1.6 1.6
Italy
1 Turin 2.7 2.6
2 Naples 1.8 1.7
3 Milan 1.7 1.7
4 Rome 1.6 1.6
5 Varese 1.5 1.5
6 Florence 1.4 1.4
Top European cities for Chinese average stay, 2013-2023
Rank Market
Average stay
2013 20237 Bologna 1.4 1.4
8 Verona 1.3 1.4
9 Venice 1.3 1.3
10 Prato 1.3 1.2
Switzerland
1 Eastern Switzerland 2.2 2.5
2 Basel Region 1.8 1.9
3 Graubünden 1.6 1.5
4 Jura & Three Lakes 1.5 1.5
5 Geneva 1.5 1.5
6Lake Genva Region (Vaud) 1.4 1.5
7 Zürich Region 1.4 1.3
8 Bern Region 1.3 1.3
9 Valais 1.3 1.4
10 Fribourg Region 1.3 1.4
Netherlands
1 Rotterdam 4.4 4.4
2 Amsterdam 1.5 1.5
3 The Hague 1.5 1.5
Poland
1 Cracow 3.1 3.1
Continued on next table
Top European cities for Chinese traveller spending, 2013-2023
Rank Market 2013 2023
%
CAGRchangeUnited Kingdom
1 London $338,279,348 $1,850,220,013 447% 18.5%
2 Manchester $76,951,423 $193,632,004 152% 9.7%
3 Birmingham $55,432,579 $207,487,552 274% 14.1%
4 Edinburgh $45,460,166 $105,189,039 131% 8.8%
5 Leicester $24,227,617 $45,491,985 88% 6.5%
6 Liverpool $22,592,104 $49,575,635 119% 8.2%
7 Glasgow $9,204,846 $38,216,176 315% 15.3%
8 Nottingham $7,985,102 $48,318,561 505% 19.7%
9 Bristol $7,434,108 $33,537,737 351% 16.3%
10 Brighton $5,087,367 $9,585,346 88% 6.5%
France
1 Paris $254,535,692 $369,865,344 45% 3.8%
2 Nice-Cannes $31,787,027 $39,149,389 23% 2.1%
3 Bordeaux $30,954,893 $47,811,958 54% 4.4%
4 Strasbourg $14,812,515 $24,903,919 68% 5.3%
5 Lyon $12,626,724 $9,049,377 -28% -3.3%
6 Toulouse $10,894,133 $19,797,506 82% 6.2%
7 Marseille $8,571,967 $13,576,564 58% 4.7%
8 Lille $3,570,360 $6,493,052 82% 6.2%
Germany
1 Frankfurt $142,018,792 $170,218,194 20% 1.8%
2 Munich $132,336,483 $164,670,817 24% 2.2%
3 Berlin $119,278,335 $143,764,995 21% 1.9%
4 Koln $38,489,424 $51,094,544 33% 2.9%
5 Dusseldorf $35,419,923 $44,004,070 24% 2.2%
6 Hamburg $34,751,502 $47,264,798 36% 3.1%
7 Stuttgart $19,790,876 $34,830,491 76% 5.8%
8 Nurnberg $19,667,024 $27,177,930 38% 3.3%
9 Dresden $16,313,428 $19,591,711 20% 1.8%
10 Fussen $15,900,450 $22,084,648 39% 3.3%
Russia
1 Moscow $121,495,173 $292,629,761 141% 9.2%
2 St. Petersburg $22,971,746 $48,758,491 112% 7.8%
Italy
1 Milan $270,859,062 $318,350,073 18% 1.6%
2 Florence $198,241,009 $237,668,713 20% 1.8%
3 Venice $176,718,089 $227,612,040 29% 2.6%
4 Rome $148,386,995 $231,371,006 56% 4.5%
5 Treviso $50,459,366 $55,282,899 10% 0.9%
6 Padova $45,982,427 $54,832,264 19% 1.8%
Continued on next table

58 59
7 Prato $37,750,296 $45,324,891 20% 1.8%
8 Bologna $33,511,236 $43,986,086 31% 2.8%
9 Naples $28,883,783 $34,822,244 21% 1.9%
10 Pistoia $28,774,642 $39,370,720 37% 3.2%
Switzerland
1 Lucern/Lake Lucern $270,272,206 $954,130,496 253% 13.4%
2 Bernese Oberland $212,944,162 $575,699,340 170% 10.5%
3 Zürich Region $203,745,397 $673,547,038 231% 12.7%
4 Geneva $86,862,584 $298,189,368 243% 13.1%
5 Lake Genva Region (Vaud) $74,671,937 $240,826,146 223% 12.4%
6 Bern Region $38,078,586 $124,190,791 226% 12.5%
7 Ticino $30,605,082 $81,944,390 168% 10.4%
8 Valais $24,225,783 $78,136,682 223% 12.4%
9 Basel Region $23,412,172 $74,904,234 220% 12.3%
10 Graubünden $12,963,690 $43,763,888 238% 12.9%
Continued from previous table
Top European cities for Chinese traveller spending, 2013-2023
Rank Market 2013 2023
%
CAGRchange
Top Asia-Pacific cities for Chinese arrivals, 2013-2023
Rank Market
1000s %
CAGR2013 2023 changeJapan
1 Tokyo 528 1,229 133% 8.8%
2 Osaka 164 382 133% 8.8%
3 Hokkaido (Kushiro, Sapporo, Wakkanai, Chitose) 72 169 133% 8.8%
4 Aichi (Nagoya) 62 145 133% 8.8%
5 Fukuoka 56 129 133% 8.8%
6 Chiba (Narita) 47 110 133% 8.8%
7 Kanagawa (Yokohama) 45 105 133% 8.8%
8 Kyoto 22 50 133% 8.8%
9 Okinawa (Ginowan, Naha, Ishigaki, Onna) 19 44 133% 8.8%
10 Hyogo (Kobe) 15 35 133% 8.8%
Indonesia
1 Bali (Jimaran, Tuban) 348 683 96% 7.0%
2 Banten 230 452 96% 7.0%
3 Riau (Batam) 78 152 96% 7.0%
4 Kalimantan 3 6 96% 7.0%
5 Sulawesi 1 2 96% 7.0%
Continued on next table
6 West Java (Bandung) 1 1 96% 7.0%
7 Central Java (Semarang) 0 0 96% 7.0%
8 Jakarta 0 0 96% 7.0%
India
1 New Delhi 11 13 17% 1.6%
2 Bangalore 7 11 56% 4.5%
3 Kanpur 7 9 31% 2.8%
4 Kolkata 5 6 11% 1.0%
5 Jaipur 5 6 32% 2.8%
6 Mumbai 4 5 23% 2.1%
7 Manali 2 2 32% 2.8%
8 Channai 2 2 21% 1.9%
9 Cavelossim 2 2 33% 2.9%
Singapore
1 Singapore 1,789 1,584 -11% -1.2%
Thailand
1 Bangkok 1,758 2,449 39% 3.4%
2 Pattaya 1,339 1,866 39% 3.4%
3 Phuket 544 758 39% 3.4%
4 Chiang Mai 251 350 39% 3.4%
5 Ayutthaya 167 233 39% 3.4%
Australia
1 Sydney 195 386 98% 7.1%
2 Melbourne 153 318 109% 7.6%
3 Gold Coast 93 172 86% 6.4%
4 Brisbane 65 124 90% 6.6%
5 Perth 17 31 79% 6.0%
6 Adelaide 14 25 76% 5.8%
7 Canberra 12 26 110% 7.7%
8 Hobart 6 11 78% 5.9%
9 Darwin 1 2 64% 5.1%
10 Alice Springs 0 1 45% 3.8%
Top Asia-Pacific cities for Chinese arrivals, 2013-2023
Rank Market
1000s %
CAGR2013 2023 change
Asia-Pacific
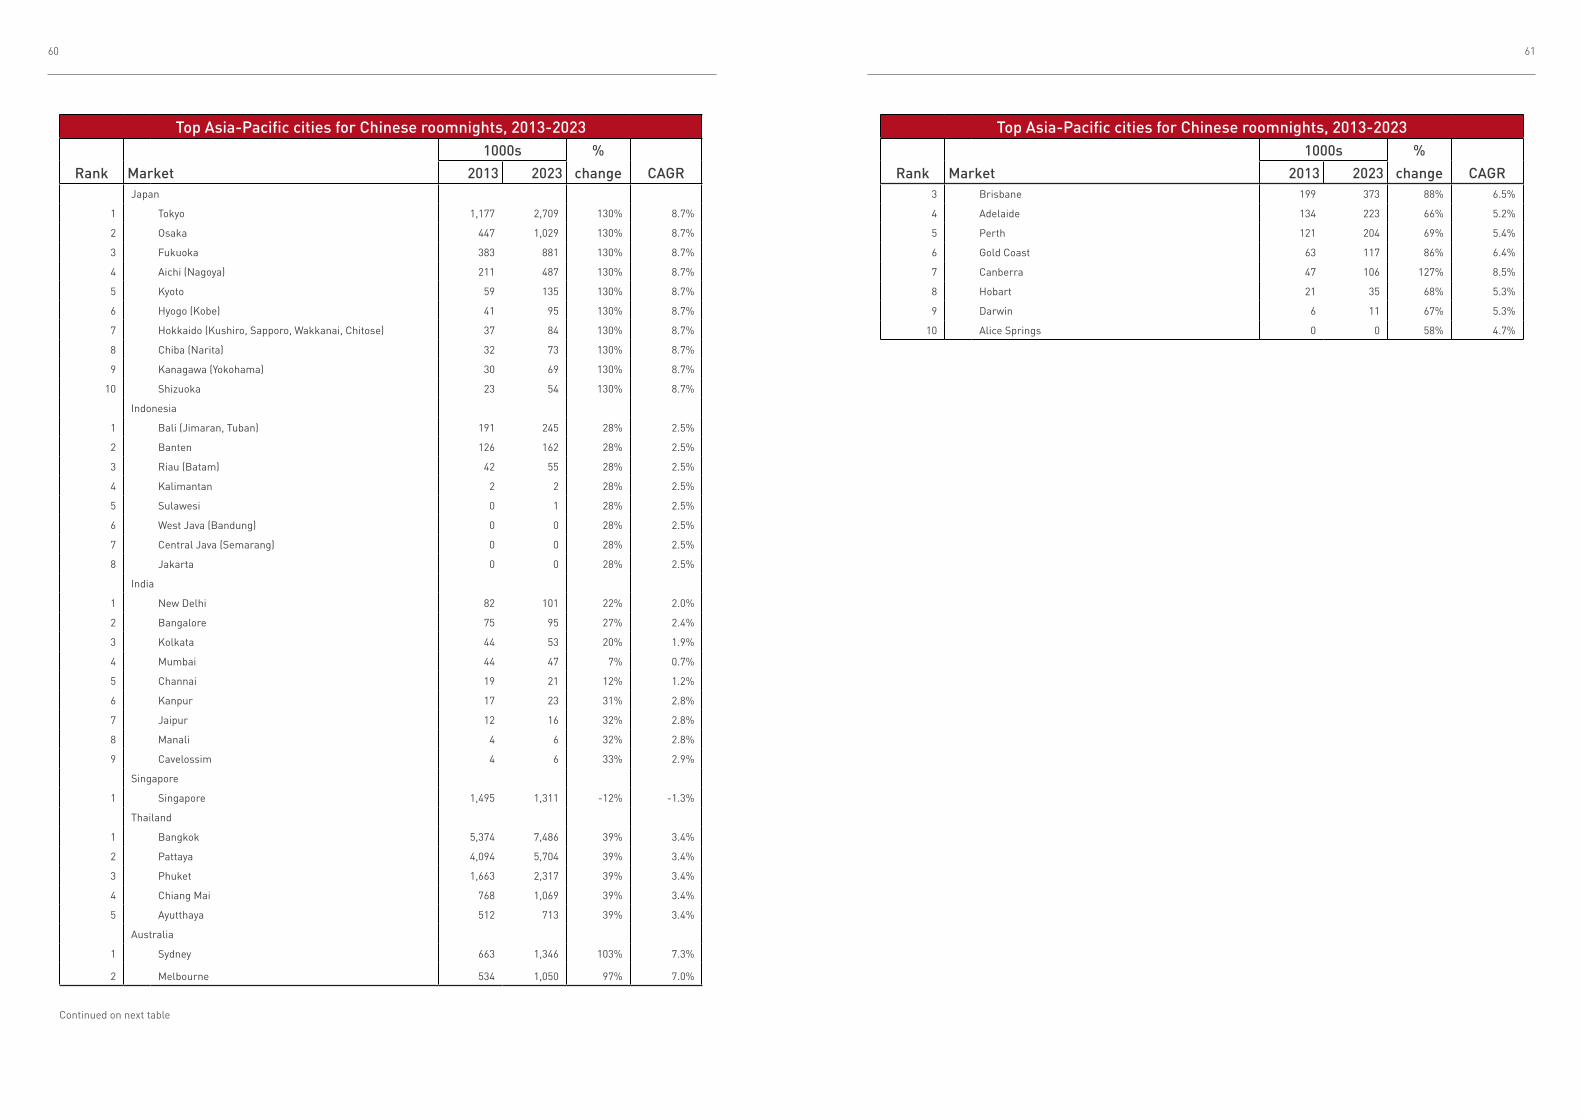
60 61
Top Asia-Pacific cities for Chinese roomnights, 2013-2023
Rank Market
1000s %
CAGR2013 2023 changeJapan
1 Tokyo 1,177 2,709 130% 8.7%
2 Osaka 447 1,029 130% 8.7%
3 Fukuoka 383 881 130% 8.7%
4 Aichi (Nagoya) 211 487 130% 8.7%
5 Kyoto 59 135 130% 8.7%
6 Hyogo (Kobe) 41 95 130% 8.7%
7 Hokkaido (Kushiro, Sapporo, Wakkanai, Chitose) 37 84 130% 8.7%
8 Chiba (Narita) 32 73 130% 8.7%
9 Kanagawa (Yokohama) 30 69 130% 8.7%
10 Shizuoka 23 54 130% 8.7%
Indonesia
1 Bali (Jimaran, Tuban) 191 245 28% 2.5%
2 Banten 126 162 28% 2.5%
3 Riau (Batam) 42 55 28% 2.5%
4 Kalimantan 2 2 28% 2.5%
5 Sulawesi 0 1 28% 2.5%
6 West Java (Bandung) 0 0 28% 2.5%
7 Central Java (Semarang) 0 0 28% 2.5%
8 Jakarta 0 0 28% 2.5%
India
1 New Delhi 82 101 22% 2.0%
2 Bangalore 75 95 27% 2.4%
3 Kolkata 44 53 20% 1.9%
4 Mumbai 44 47 7% 0.7%
5 Channai 19 21 12% 1.2%
6 Kanpur 17 23 31% 2.8%
7 Jaipur 12 16 32% 2.8%
8 Manali 4 6 32% 2.8%
9 Cavelossim 4 6 33% 2.9%
Singapore
1 Singapore 1,495 1,311 -12% -1.3%
Thailand
1 Bangkok 5,374 7,486 39% 3.4%
2 Pattaya 4,094 5,704 39% 3.4%
3 Phuket 1,663 2,317 39% 3.4%
4 Chiang Mai 768 1,069 39% 3.4%
5 Ayutthaya 512 713 39% 3.4%
Australia
1 Sydney 663 1,346 103% 7.3%
2 Melbourne 534 1,050 97% 7.0%
Continued on next table
Top Asia-Pacific cities for Chinese roomnights, 2013-2023
Rank Market
1000s %
CAGR2013 2023 change3 Brisbane 199 373 88% 6.5%
4 Adelaide 134 223 66% 5.2%
5 Perth 121 204 69% 5.4%
6 Gold Coast 63 117 86% 6.4%
7 Canberra 47 106 127% 8.5%
8 Hobart 21 35 68% 5.3%
9 Darwin 6 11 67% 5.3%
10 Alice Springs 0 0 58% 4.7%
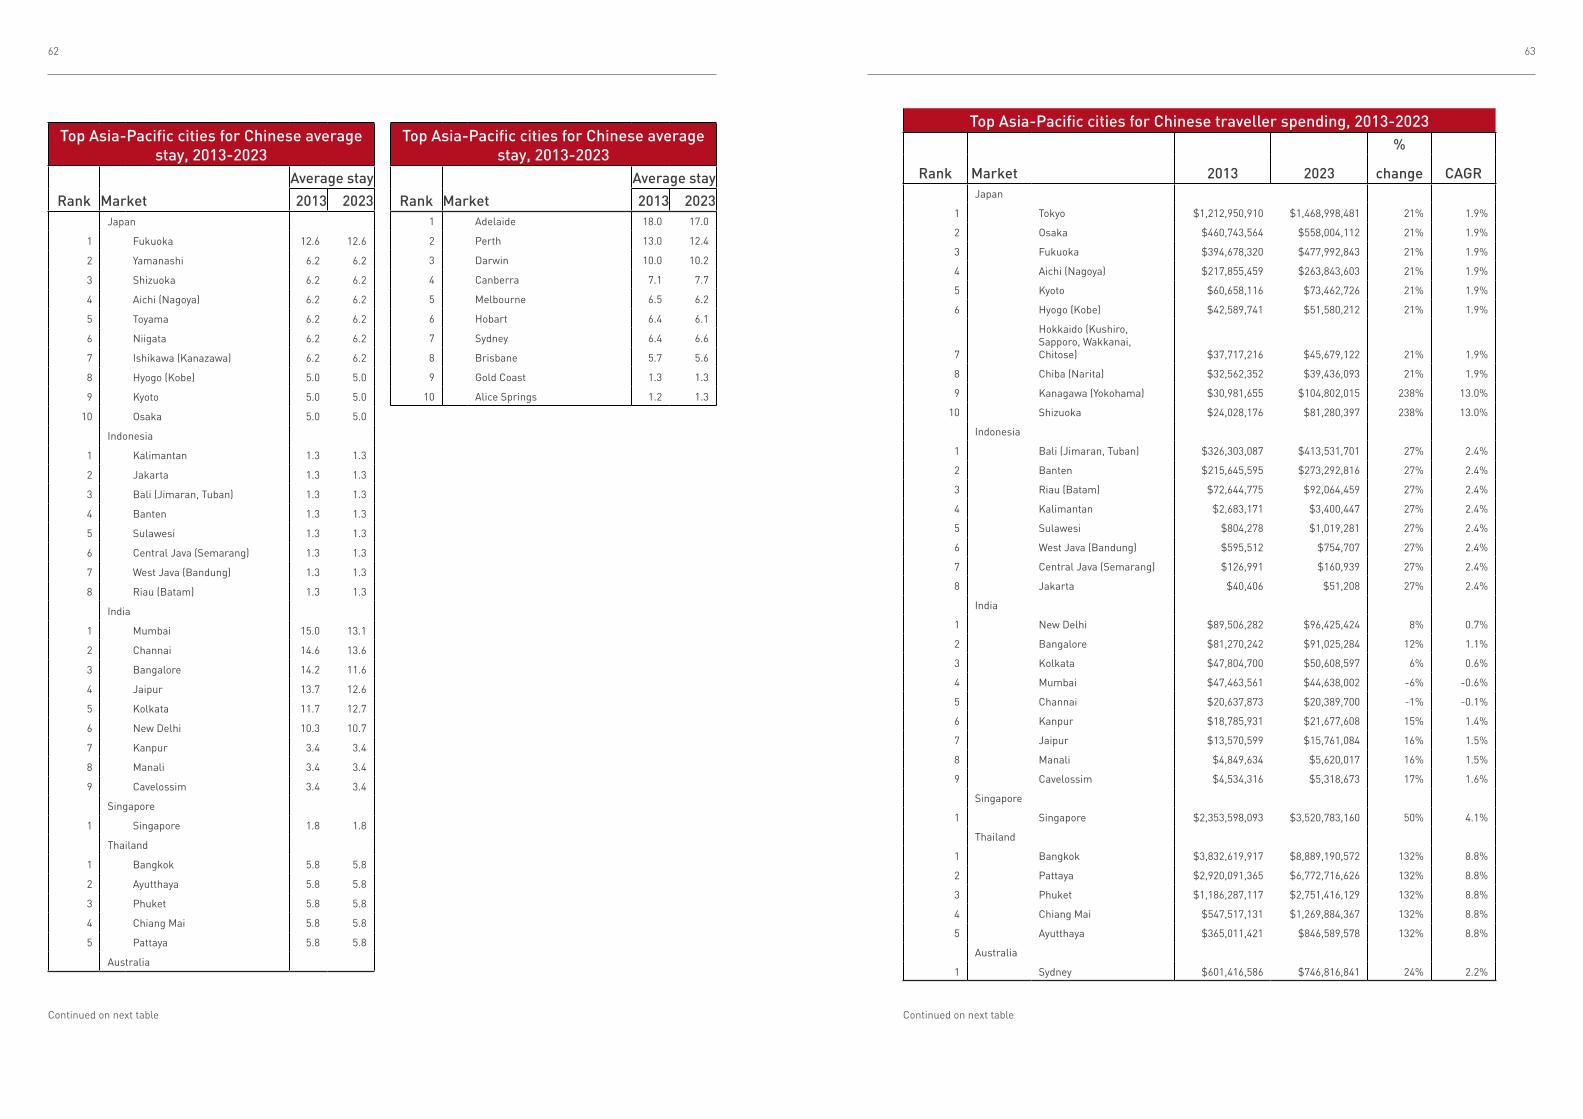
62 63
Top Asia-Pacific cities for Chinese average stay, 2013-2023
Rank Market
Average stay
2013 2023Japan
1 Fukuoka 12.6 12.6
2 Yamanashi 6.2 6.2
3 Shizuoka 6.2 6.2
4 Aichi (Nagoya) 6.2 6.2
5 Toyama 6.2 6.2
6 Niigata 6.2 6.2
7 Ishikawa (Kanazawa) 6.2 6.2
8 Hyogo (Kobe) 5.0 5.0
9 Kyoto 5.0 5.0
10 Osaka 5.0 5.0
Indonesia
1 Kalimantan 1.3 1.3
2 Jakarta 1.3 1.3
3 Bali (Jimaran, Tuban) 1.3 1.3
4 Banten 1.3 1.3
5 Sulawesi 1.3 1.3
6 Central Java (Semarang) 1.3 1.3
7 West Java (Bandung) 1.3 1.3
8 Riau (Batam) 1.3 1.3
India
1 Mumbai 15.0 13.1
2 Channai 14.6 13.6
3 Bangalore 14.2 11.6
4 Jaipur 13.7 12.6
5 Kolkata 11.7 12.7
6 New Delhi 10.3 10.7
7 Kanpur 3.4 3.4
8 Manali 3.4 3.4
9 Cavelossim 3.4 3.4
Singapore
1 Singapore 1.8 1.8
Thailand
1 Bangkok 5.8 5.8
2 Ayutthaya 5.8 5.8
3 Phuket 5.8 5.8
4 Chiang Mai 5.8 5.8
5 Pattaya 5.8 5.8
Australia
Top Asia-Pacific cities for Chinese average stay, 2013-2023
Rank Market
Average stay
2013 20231 Adelaide 18.0 17.0
2 Perth 13.0 12.4
3 Darwin 10.0 10.2
4 Canberra 7.1 7.7
5 Melbourne 6.5 6.2
6 Hobart 6.4 6.1
7 Sydney 6.4 6.6
8 Brisbane 5.7 5.6
9 Gold Coast 1.3 1.3
10 Alice Springs 1.2 1.3
Continued on next table Continued on next table
Top Asia-Pacific cities for Chinese traveller spending, 2013-2023
Rank Market 2013 2023
%
CAGRchangeJapan
1 Tokyo $1,212,950,910 $1,468,998,481 21% 1.9%
2 Osaka $460,743,564 $558,004,112 21% 1.9%
3 Fukuoka $394,678,320 $477,992,843 21% 1.9%
4 Aichi (Nagoya) $217,855,459 $263,843,603 21% 1.9%
5 Kyoto $60,658,116 $73,462,726 21% 1.9%
6 Hyogo (Kobe) $42,589,741 $51,580,212 21% 1.9%
7
Hokkaido (Kushiro, Sapporo, Wakkanai, Chitose) $37,717,216 $45,679,122 21% 1.9%
8 Chiba (Narita) $32,562,352 $39,436,093 21% 1.9%
9 Kanagawa (Yokohama) $30,981,655 $104,802,015 238% 13.0%
10 Shizuoka $24,028,176 $81,280,397 238% 13.0%
Indonesia
1 Bali (Jimaran, Tuban) $326,303,087 $413,531,701 27% 2.4%
2 Banten $215,645,595 $273,292,816 27% 2.4%
3 Riau (Batam) $72,644,775 $92,064,459 27% 2.4%
4 Kalimantan $2,683,171 $3,400,447 27% 2.4%
5 Sulawesi $804,278 $1,019,281 27% 2.4%
6 West Java (Bandung) $595,512 $754,707 27% 2.4%
7 Central Java (Semarang) $126,991 $160,939 27% 2.4%
8 Jakarta $40,406 $51,208 27% 2.4%
India
1 New Delhi $89,506,282 $96,425,424 8% 0.7%
2 Bangalore $81,270,242 $91,025,284 12% 1.1%
3 Kolkata $47,804,700 $50,608,597 6% 0.6%
4 Mumbai $47,463,561 $44,638,002 -6% -0.6%
5 Channai $20,637,873 $20,389,700 -1% -0.1%
6 Kanpur $18,785,931 $21,677,608 15% 1.4%
7 Jaipur $13,570,599 $15,761,084 16% 1.5%
8 Manali $4,849,634 $5,620,017 16% 1.5%
9 Cavelossim $4,534,316 $5,318,673 17% 1.6%
Singapore
1 Singapore $2,353,598,093 $3,520,783,160 50% 4.1%
Thailand
1 Bangkok $3,832,619,917 $8,889,190,572 132% 8.8%
2 Pattaya $2,920,091,365 $6,772,716,626 132% 8.8%
3 Phuket $1,186,287,117 $2,751,416,129 132% 8.8%
4 Chiang Mai $547,517,131 $1,269,884,367 132% 8.8%
5 Ayutthaya $365,011,421 $846,589,578 132% 8.8%
Australia
1 Sydney $601,416,586 $746,816,841 24% 2.2%

64 65
2 Melbourne $484,231,600 $582,642,502 20% 1.9%
3 Brisbane $180,325,219 $207,108,224 15% 1.4%
4 Adelaide $121,882,445 $123,607,566 1% 0.1%
5 Perth $109,444,065 $113,152,380 3% 0.3%
6 Gold Coast $56,920,098 $64,884,659 14% 1.3%
7 Canberra $42,242,377 $58,677,378 39% 3.3%
8 Hobart $18,659,158 $19,177,085 3% 0.3%
9 Darwin $5,777,276 $5,896,948 2% 0.2%
10 Alice Springs $267,436 $258,956 -3% -0.3%
Top Asia-Pacific cities for Chinese traveller spending, 2013-2023
Rank Market 2013 2023
%
CAGRchange
Continued on previous table
Top Middle Eastern cities for Chinese arrivals, 2013-2023
Rank Market
1000s %
CAGR2013 2023 changeUnited Arab Emirates
1 Dubai 276 545 98% 7.1%
2 Abu Dhabi 44 177 301% 14.9%
3 Sharjah 0 0 136% 9.0%
Saudi Arabia
1 Riyadh 7 11 56% 4.5%
2 Mecca 4 6 40% 3.4%
3 Jeddah 2 3 63% 5.0%
4 Medina 1 2 61% 4.9%
Qatar
1 Doha 15 56 268% 13.9%
Top Middle Eastern cities for Chinese average stay, 2013-2023
Rank Market
Average stay
2013 2023United Arab Emirates
1 Sharjah 6.3 5.9
2 Dubai 3.2 3.2
3 Abu Dhabi 1.9 1.8
Saudi Arabia
1 Medina 7.7 7.5
2 Mecca 5.7 5.6
3 Jeddah 5.0 4.9
4 Riyadh 4.5 4.5
Qatar
1 Doha 1.8 1.8
Top Middle Eastern cities for Chinese roomnights, 2013-2023
Rank Market
1000s %
CAGR2013 2023 changeUnited Arab Emirates
1 Dubai 473 627 33% 2.9%
2 Abu Dhabi 44 113 158% 9.9%
3 Sharjah 0 0 50% 4.1%
Saudi Arabia
1 Riyadh 19 28 50% 4.2%
2 Mecca 14 19 36% 3.1%
3 Medina 6 10 55% 4.5%
4 Jeddah 5 8 58% 4.7%
Qatar
1 Doha 15 34 135% 8.9%
Middle East

Annex: City Calculation Methodology
Data used in this report have been compiled from a variety of official national data sources, as well as available industry data including hotel and aviation data. Data have been compiled to give the most complete and comprehensive view available of which cities Chinese travellers visit. Forecasts have been derived consistent with Tourism Economics’ existing global tourism outlook.
Chinese city data For China, raw arrivals data are derived from the following sources:
• China Statistical Yearbook reports domestic arrivals in paid accommodation by Province
• Shanghai city arrivals data are reported by Shanghai government statistics department, consistent with the official Province data
• Beijing city arrivals data are reported by Beijing government statistics department, consistent with the official Province data
• All other cities historic data sourced from China Tour Online. This data source is consistent with the provincial data reported in the China Statistical Yearbook but gives city detail.
The China Tour Online data source provides the comprehensive data on sizing of both domestic and inbound tourism for all cities for earlier years, but it is not as up to date as the other data sources.
A combination of the provincial level data as well as STR data and air passenger data are used to grow the city level data forward for the more recent years to be consistent with the other raw data sources. The city share of the region is projected forward for total
overnight arrivals (inbound and domestic) in line with STR data for the city relative to the wider region. Next the share of total overnight arrivals attributable to domestic and inbound is estimated according to the evolution of air passenger arrivals.
No data are available for domestic room nights in Chinese cities and the country total has to be shared down to cities. This is according to STR global data by city as the best indicator of total room nights by Chinese city.
Domestic and inbound room nights by city are then adjusted where necessary according to the implied average length of stay from a simple approach of sharing the country down to the city values. Maximum and minimum length of stay is imposed by city according to the distribution by origin market. Extreme high or low length of stay is overwritten by the average value plus or minus one standard deviation across cities. Total room nights are then scaled across cities to ensure they do indeed sum to the country total.
The one exception to this methodology is for Tianjin where reported arrivals appear to be very low in historic data looking at city as a share of the province. This is especially so compared to the implied number of room nights according to STR data which suggests an average length of stay of over 100 nights. In this instance the hotel and aviation data point to comparable and more accurate figure than the historic arrivals data. As such we take the number of room nights implied by the industry data and then apply an average length of stay assumption to derive the arrivals figure. As a final sense check this was still consistent with the province level total.
Chinese travel to global cities – historic dataNational statistical sources are used wherever available, typically from national statistical agencies, while additional data are also sourced form city marketing agencies.
Some manipulation of data is required to ensure consistent definitions are used to allow comparison between countries and cities. Raw data can differ across countries and cities in terms of whether data relate to all tourist arrivals, or those in paid accommodation or just in hotel establishments.
Arrivals in paid accommodation are reported most frequently and we adjust all data to be on this basis. Ratios of paid/unpaid accommodation use and all paid accommodation/hotel arrivals are derived from data and estimates at the national level where necessary.
In the instances that reported data are only available for room nights, scaling is applied to ensure that the sum of room nights across cities and regions is equal to the reported national total. Average length of stay is estimated according to the characteristics of Chinese travellers to the country. The difference in length of stay for comparable travel to the city relative to the country is taken into account.
In this way data are also fully consistent with county level data reported by national data sources via UNWTO as used within TDM. However, it should be noted that although room nights have to sum to reported country totals it can often be the case that the sum of arrivals in cities exceeds the reported number of tourism arrivals in that country. This can be explained by visits
to multiple destinations within the same trip. In these instances it is often the case that average length of stay for cities is lower than for the country as a whole.
Available industry data are used to fill any gaps in the dataset or to add necessary detail. Notably data sources are STR data on the number of rooms sold as well as air arrivals data. Such data are also used as a sense check on reported data and can be used to make informed judgement in the case of any conflicting data sources for example, if city agencies report different values to national sources.
STR data are of particular use to help understand the total size of the city overnight travel market. In some cases the only available data at the sub-nation level are for states, regions or provinces rather than cities. The relative size of the hotel market in the city compared to the wider region is an important element in calculation of Chinese travel to the smaller geography.
Air arrivals data to city airports provides a further source of data for any required estimation. This source also provides information on arrivals by country of origin and can help to identify the share of Chinese travellers as well as the overall size of the city market.
Finally, average party size and number of people per room are estimated, as a function of purpose of travel, to derive an estimate of hotel room nights sold to Chinese travellers. Data are consistent with reported STR data for the city.
66 67
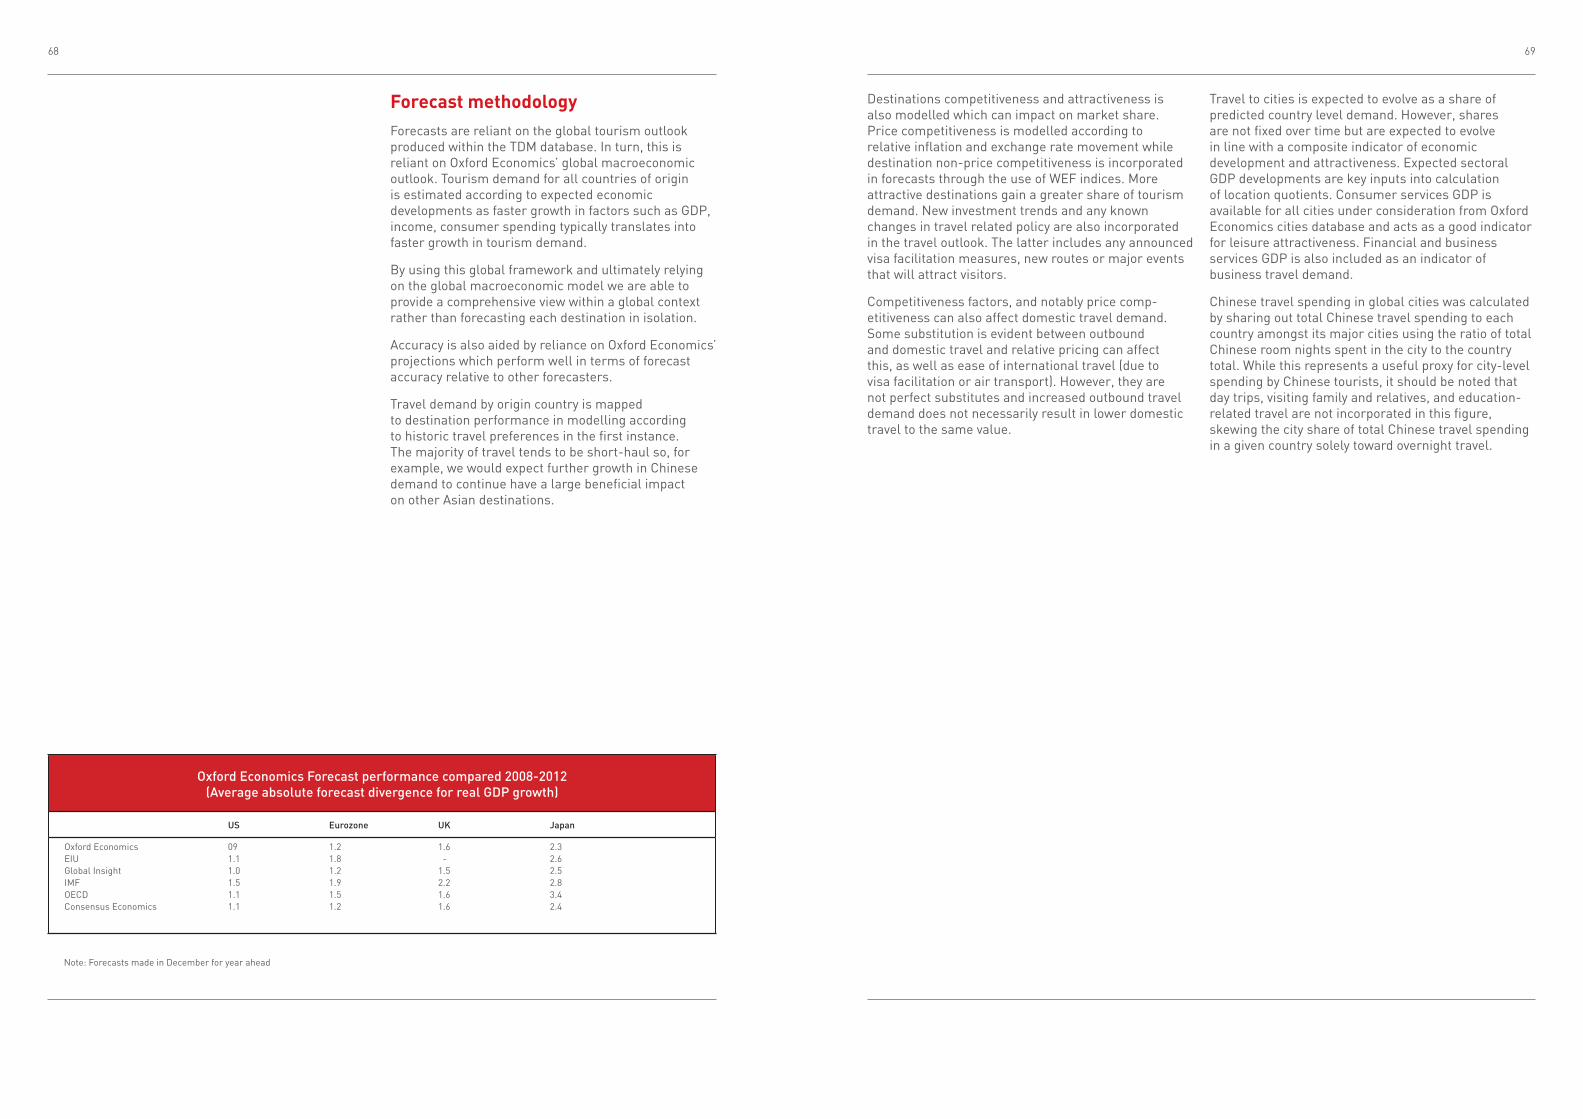
Forecast methodologyForecasts are reliant on the global tourism outlook produced within the TDM database. In turn, this is reliant on Oxford Economics’ global macroeconomic outlook. Tourism demand for all countries of origin is estimated according to expected economic developments as faster growth in factors such as GDP, income, consumer spending typically translates into faster growth in tourism demand.
By using this global framework and ultimately relying on the global macroeconomic model we are able to provide a comprehensive view within a global context rather than forecasting each destination in isolation.
Accuracy is also aided by reliance on Oxford Economics’ projections which perform well in terms of forecast accuracy relative to other forecasters.
Travel demand by origin country is mapped to destination performance in modelling according to historic travel preferences in the first instance. The majority of travel tends to be short-haul so, for example, we would expect further growth in Chinese demand to continue have a large beneficial impact on other Asian destinations.
Destinations competitiveness and attractiveness is also modelled which can impact on market share. Price competitiveness is modelled according to relative inflation and exchange rate movement while destination non-price competitiveness is incorporated in forecasts through the use of WEF indices. More attractive destinations gain a greater share of tourism demand. New investment trends and any known changes in travel related policy are also incorporated in the travel outlook. The latter includes any announced visa facilitation measures, new routes or major events that will attract visitors.
Competitiveness factors, and notably price comp-etitiveness can also affect domestic travel demand. Some substitution is evident between outbound and domestic travel and relative pricing can affect this, as well as ease of international travel (due to visa facilitation or air transport). However, they are not perfect substitutes and increased outbound travel demand does not necessarily result in lower domestic travel to the same value.
Travel to cities is expected to evolve as a share of predicted country level demand. However, shares are not fixed over time but are expected to evolve in line with a composite indicator of economic development and attractiveness. Expected sectoral GDP developments are key inputs into calculation of location quotients. Consumer services GDP is available for all cities under consideration from Oxford Economics cities database and acts as a good indicator for leisure attractiveness. Financial and business services GDP is also included as an indicator of business travel demand.
Chinese travel spending in global cities was calculated by sharing out total Chinese travel spending to each country amongst its major cities using the ratio of total Chinese room nights spent in the city to the country total. While this represents a useful proxy for city-level spending by Chinese tourists, it should be noted that day trips, visiting family and relatives, and education-related travel are not incorporated in this figure, skewing the city share of total Chinese travel spending in a given country solely toward overnight travel.
68 69
Oxford Economics Forecast performance compared 2008-2012 (Average absolute forecast divergence for real GDP growth)
US Eurozone UK Japan
Oxford Economics 09 1.2 1.6 2.3EIU 1.1 1.8 - 2.6Global Insight 1.0 1.2 1.5 2.5IMF 1.5 1.9 2.2 2.8OECD 1.1 1.5 1.6 3.4Consensus Economics 1.1 1.2 1.6 2.4
Note: Forecasts made in December for year ahead

76 77

Tourism EconomicsTourism Economics is an Oxford Economics company with a singular objective: combine an understanding of tourism dynamics with rigorous economics in order to answer the most important questions facing destinations, investors, and strategic planners. By combining quantitative methods with industry knowledge, Tourism Economics designs custom market strategies, travel forecasting models, destination policy analysis, and economic impact studies.
Oxford Economics Oxford Economics was founded in 1981 as a commercial venture with Oxford University’s business college to provide economic forecasting and modelling to UK companies and financial institutions expanding abroad. Since then, we have become one of the world’s foremost independent global advisory firms, providing reports, forecasts and analytical tools on 200 countries, 100 industrial sectors and over 3,000 cities. Our best-of-class global economic and industry models and analytical tools give us an unparalleled ability to forecast external market trends and assess their economic, social and business impact.
Headquartered in Oxford, England, with regional centres in London, New York, and Singapore, Oxford Economics has offices across the globe in Belfast, Chicago, Dubai, Miami, Milan, Paris, Philadelphia, San Francisco, and Washington DC. We employ over 130 full-time people, including more than 90 professional economists, industry experts and business editors—one of the largest teams of macroeconomists and thought leadership specialists. Our global team is highly skilled in a full range of research techniques and thought leadership capabilities, from econometric modelling, scenario framing, and economic impact analysis to market surveys, case studies, expert panels, and web analytics. Underpinning our in-house expertise is a contributor network of over 500 economists, analysts and journalists around the world and our heritage with Oxford University and the academic community.
Oxford Economics is a key adviser to corporate, financial and government decision-makers and thought leaders. Our worldwide client base now comprises over 850 international organisations, including leading multinational companies and financial institutions; key government bodies and trade associations; and top universities, consultancies, and think tanks.