Embed Size (px)
Citation preview
THE FUTURE OF NATURAL GAS IN CHINA: EFFECTS OFPRICING REFORM AND CLIMATE POLICY
DANWEI ZHANG and SERGEY PALTSEV*
MIT Joint Program on the Science and Policy of Global ChangeMassachusetts Institute of Technology, Cambridge, MA, USA
Accepted 31 August 2016Published 10 November 2016
China is currently attempting to reduce greenhouse gas emissions and increase natural gasconsumption as a part of broader national strategies to reduce the air pollution impacts of thenation’s energy system. To assess the scenarios of natural gas development up to 2050, weemploy a global energy-economic model — the MIT Economic Projection and Policy Analysis(EPPA) model. The results show that a cap-and-trade policy will enable China to achieve itsclimate mitigation goals, but will also reduce natural gas consumption. An integrated policy thatuses a part of the carbon revenue obtained from the cap-and-trade system to subsidize naturalgas use promotes natural gas consumption, resulting in a further reduction in coal use relative tothe cap-and-trade policy case. The integrated policy has a very moderate welfare cost; however,it reduces air pollution and allows China to achieve both the climate objective and the naturalgas promotion objective.
Keywords: Natural gas; China; climate policy; pricing reform; economic modeling.
1. Introduction
China’s energy supply has long been dominated by coal. China has already become theworld’s largest CO2 emitter and suffers enormously from air pollution (He et al., 2002;Matus et al., 2012; Kan et al., 2012). Over the past three decades, about two-thirds ofChina’s primary energy consumption has come from coal, causing significant local,regional and global environmental pollution. Natural gas use generates much lesspollution than coal (EPA, 1995; EIA, 1999; Cai et al., 2012), and natural gas is oftenregarded as a cleaner energy. Thus, substitution of natural gas for coal has been listedby the Chinese government as an important part of China’s sustainable energy systemtransformation strategy. At present, natural gas accounts for approximately 6% ofChina’s primary energy supply, which is substantially below the global average of 24%(BP, 2015). According to China’s national energy strategy action plan, the share of
This is an Open Access article published by World Scientific Publishing Company. It is distributed under the terms ofthe Creative Commons Attribution 4.0 (CC-BY) License. Further distribution of this work is permitted, provided theoriginal work is properly cited.
Climate Change Economics, Vol. 7, No. 4 (2016) 1650012 (32 pages)© The Author(s)DOI: 10.1142/S2010007816500123
1650012-1
Clim
. Cha
nge
Eco
n. 2
016.
07. D
ownl
oade
d fr
om w
ww
.wor
ldsc
ient
ific
.com
by M
ASS
AC
HU
SET
S IN
STIT
UT
E O
F T
EC
HN
OL
OG
Y (
MIT
) on
11/
21/1
6. F
or p
erso
nal u
se o
nly.
natural gas in primary energy supply should reach 10% by 2020 (State Council ofChina, 2014). Natural gas has a great potential for expansion in China’s future energymarket, and natural gas use is widely encouraged in Chinese cities as an importantoption to address deteriorated air quality and improve living standards. However, thereare still significant economic and institutional barriers to expansion of natural gasconsumption. The natural gas future in China is quite uncertain without innovativeapproaches to address these barriers.
Pricing is one of the most important mechanisms in the future of natural gasdevelopment. Per unit of energy, natural gas price is substantially higher than the coalprice in China, and the large-scale substitution of natural gas for coal requires a policysupport. Natural gas prices in China have long been determined by governmentagencies, predominately by the National Development and Reform Commission(NDRC), with limited flexibility, predictability and transparency (Paltsev and Zhang,2015a). There is also a significant research literature that finds that public interventionswill be needed to enable China’s transition to a low carbon energy economy (Chai andZhang, 2010; Zhou et al., 2014; Wang and Cheng, 2015; Zhang et al., 2016). Of theproposed public policies, a carbon tax or carbon dioxide emissions cap-and-tradescheme are commonly considered as a cost effective approach in mitigation (Paltsevet al., 2012; Zhang et al., 2016). China recently announced its plans to build a nationalcarbon emission cap-and-trade system (The White House, 2015), and in its intendednationally determined contribution (INDC) submitted to the United Nations in De-cember 2015 (NDRC, 2015), China also pledged to peak its CO2 emissions around2030 by introducing a number of policy measures highlighting the cap-and-tradesystem. Some studies have analyzed the level of the carbon price needed for China toachieve its climate pledge (Zhang et al., 2016). However, as natural gas containscarbon, the natural gas use could be penalized by the carbon price. The existing studiesdo not address the issue to what extent such a carbon price will affect China’s naturalgas consumption. Such investigation, however, is important as climate policy mightlead to a substantial deviation from the natural gas promotion objective.
Our goal is to examine the consistency of China’s climate policy with the naturalgas promotion objective, and to assess an integrated policy approach which combines anatural gas subsidy scheme with a cap-and-trade policy. We investigate a policy in-strument and quantify a magnitude of the required policy support that allows achievingboth the climate mitigation objective and natural gas promotion objective, establishingconditions where both objectives can be simultaneously achieved. We simulate naturalgas price trajectories under both oil-linked and market-determined pricing schemes toexamine the difference between the two pricing mechanisms. We also evaluate thechanges in sectoral use of natural gas and costs to the economy from alternative policyinstruments.
These projections are based on the energy-economic model developed at the MITJoint Program on the Science and Policy of Global Change: the MIT EconomicProjection and Policy Analysis (EPPA) model (Paltsev et al., 2005; Chen et al., 2015).
D. Zhang & S. Paltsev
1650012-2
Clim
. Cha
nge
Eco
n. 2
016.
07. D
ownl
oade
d fr
om w
ww
.wor
ldsc
ient
ific
.com
by M
ASS
AC
HU
SET
S IN
STIT
UT
E O
F T
EC
HN
OL
OG
Y (
MIT
) on
11/
21/1
6. F
or p
erso
nal u
se o
nly.
An advantage of this modeling framework is that both the commodities’ quantities andprices are endogenously determined. For this study, we enhanced the EPPA model witha representation of China’s latest policy objectives and updated the technology costs inChina’s power generation sector.
2. Policies Affecting Natural Gas Supply and Demand
2.1. Natural gas pricing policy
Natural gas pricing reform has played a vital role in promoting natural gas supply fromboth domestic and overseas sources (Paltsev and Zhang, 2015a). China’s natural gaspricing used to favor consumers. The highly regulated pricing regime resulted in a lowgas price and failed to provide enough incentives for natural gas suppliers. A new gaspricing reform was first put into trial in Guangdong and Guangxi provinces inDecember 2011, and was introduced nationwide in July 2013. The pricing reform aimsto create a more market-based pricing mechanism to encourage natural gas supply. Tominimize potential political opposition during the initial stages of the reform, thegovernment adopted a two-tier pricing approach for the period of transition. Thetransitional process lasted until April 2015. During the transitional process, the pricingfor the incremental volume of natural gas supply was linked to international oil productprices, while the prices for the existing volume was gradually increased to the levels ofthe incremental volume. Now, China’s wholesale natural gas price is connected to aweighted price of international fuel oil and liquid petroleum gas (LPG) prices. The oil-linked pricing regime is more predictable and transparent compared to the old highlyregulated pricing system where prices were established arbitrarily and changedunpredictably.
2.2. Other natural gas promotion policy
In addition to the pricing reform, the Chinese government implements a set of naturalgas promotion policies. The primary objective of China’s natural gas promotion policyis to facilitate the substitution of natural gas for coal to address the air pollutionproblems and improve the household quality of life in Chinese cities. Burning coalemits air pollutants such as SO2, NOx, black carbon and fine particles such as PM2:5
and others. China’s air pollution is largely attributed to the massive use of coal and alack of clean coal technologies.
According to a study based on hourly data for China (Rohde and Muller, 2015),airborne particulate matter (PM) with a size less than 2.5 microns (PM2:5) has thehighest levels (52�g/m3) above the “healthy” standards for air pollution (12�g/m3)established by US EPA (EPA, 2014). Geographically, the highest intensity is in thearea between Beijing and Shanghai. Patterns for PM with a size less than 10 microns(PM10), sulfur dioxide (SO2) and nitrogen dioxide (NO2) are similar but less severe.The major source of air pollution is attributed to fossil fuel burning in power plants,
The Future of Natural Gas in China
1650012-3
Clim
. Cha
nge
Eco
n. 2
016.
07. D
ownl
oade
d fr
om w
ww
.wor
ldsc
ient
ific
.com
by M
ASS
AC
HU
SET
S IN
STIT
UT
E O
F T
EC
HN
OL
OG
Y (
MIT
) on
11/
21/1
6. F
or p
erso
nal u
se o
nly.

especially in coal power plants. Industrial facilities and transportation fuels alsocontribute to air pollution (Rohde and Muller, 2015). It is estimated that air pollution iskilling about 4400 people in China every single day (or 1.6 million a year) (Rohde andMuller, 2015). Another study estimates that air pollution contributes to 1.2 million ofdeaths per year in China (Yang et al., 2013). Natural gas is regarded as cleaner thancoal fossil fuel because it creates less air pollution than coal during the combustionprocess. Compared to coal, natural gas produces 150 to 400 times less PM for the sameenergy delivered (EIA, 1999; Cai et al., 2012). In this regard the Chinese centralgovernment and local governments often attach a great value to an increase in a shareof natural gas in the energy supply mix.
China’s natural gas promotion policies include national and urban targets for naturalgas use; regulations on natural utilizations; natural gas pricing; and subsidies, tax reliefand feed-in tariffs for natural gas fired electricity generations. China’s NationalEnergyDevelopment Strategy Action Plan (2014–2020) emphasizes the role of natural gas inChina’s energy system transformation and sets a goal for the share of natural gas inChina’s primary energy supply to exceed 10% by 2020 (State Council of China, 2014).Chinese government has also set restrictions for natural gas use. According to theRevised Natural Gas Utilization Policy (NDRC, 2012), natural gas is encouraged forconsumption as fuel in residential, manufacturing, electricity and transportation sec-tors, but is discouraged as a feedstock in producing chemicals.
In China, one policy instrument for promoting natural gas use is the import value-added tax refund to encourage natural gas imports (MOF, 2011). Others include thefeed-in tariffs for gas-fired power plants to encourage substitution of natural gas forcoal in the electricity sector (NDRC, 2014). Since 2007, coal-bed methane producersreceive a subsidy of 0.2 yuan (¥) per cubic meter if the gas is delivered to residentialand industrial users (MOF, 2007). While these instruments promote natural gas use,they can create economic distortions. In the modeling exercise described later, ageneral subsidy is used as a proxy for these policy instruments.
2.3. Climate-related policy
In 2015, the Chinese government submitted to the United Nations its climate actionplan (NDRC, 2015). According to the plan, China is pledged to peak its CO2 emissionsaround 2030 and decrease carbon intensity (CO2 emissions per unit of GDP) by60–65% below 2005 levels by the same year. The new carbon intensity target builds onChina’s existing target, from the Copenhagen climate talks in 2009 — to reduce itsCO2 intensity by 40–45% in 2020, relative to 2005 levels (NRDC, 2015). As a majorpolicy instrument to honor the pledges listed in its INDC, China has recently decidedto establish a nationwide carbon dioxide emissions cap-and-trade system, or emissiontrading scheme (ETS). Chinese President Xi Jinping officially announced that a na-tionwide ETS will be launched in 2017 (The White House, 2015).
D. Zhang & S. Paltsev
1650012-4
Clim
. Cha
nge
Eco
n. 2
016.
07. D
ownl
oade
d fr
om w
ww
.wor
ldsc
ient
ific
.com
by M
ASS
AC
HU
SET
S IN
STIT
UT
E O
F T
EC
HN
OL
OG
Y (
MIT
) on
11/
21/1
6. F
or p
erso
nal u
se o
nly.
3. The EPPA Model and Its Modification
3.1. Brief introduction to the EPPA model
To assess China’s natural gas development scenarios, we use the MIT EPPA model(Paltsev et al., 2005; Chen et al., 2015), which is a multi-region, multi-sector dynamicmodel of the global economy. It has been widely applied to the impact evaluation ofclimate and energy policies on economic and energy systems for global and regionalstudies. As a computable general equilibrium model, the EPPA model projects theinteractions among production sectors and between the producers and consumersinfluenced by commodity and resource prices. The EPPA model can provide an ex-amination of the economy-wide effects of different policies, and incorporates numer-ous technologies to provide details about the resulting technology mix for differentpolicy approaches. As a global framework, the EPPA model can also be used to assesspolicy effects on international trade and on global emissions mitigation.
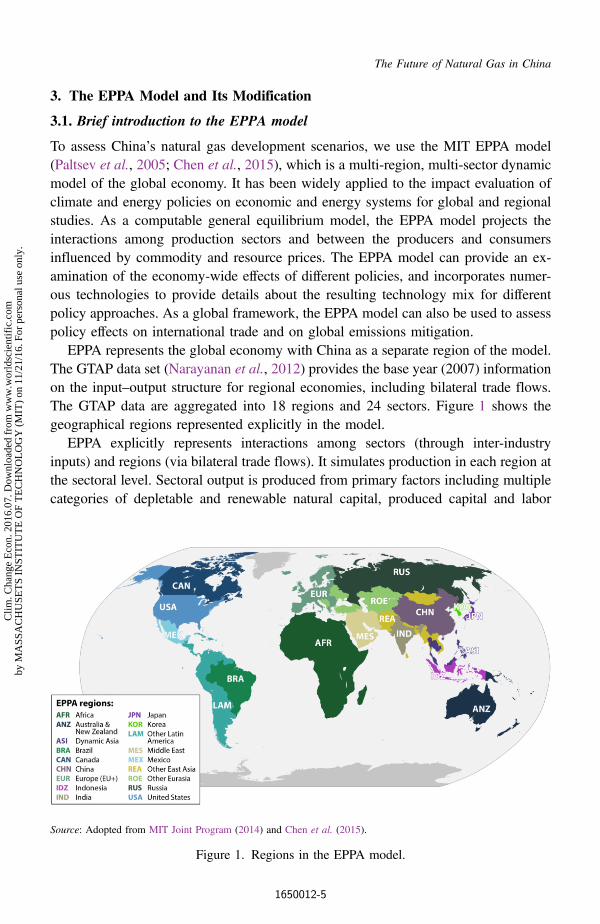
EPPA represents the global economy with China as a separate region of the model.The GTAP data set (Narayanan et al., 2012) provides the base year (2007) informationon the input–output structure for regional economies, including bilateral trade flows.The GTAP data are aggregated into 18 regions and 24 sectors. Figure 1 shows thegeographical regions represented explicitly in the model.
EPPA explicitly represents interactions among sectors (through inter-industryinputs) and regions (via bilateral trade flows). It simulates production in each region atthe sectoral level. Sectoral output is produced from primary factors including multiplecategories of depletable and renewable natural capital, produced capital and labor
Source: Adopted from MIT Joint Program (2014) and Chen et al. (2015).
Figure 1. Regions in the EPPA model.
The Future of Natural Gas in China
1650012-5
Clim
. Cha
nge
Eco
n. 2
016.
07. D
ownl
oade
d fr
om w
ww
.wor
ldsc
ient
ific
.com
by M
ASS
AC
HU
SET
S IN
STIT
UT
E O
F T
EC
HN
OL
OG
Y (
MIT
) on
11/
21/1
6. F
or p
erso
nal u
se o
nly.

(Table 1). Intermediate inputs to sectoral production are represented through a com-plete input-output structure.
The EPPA model projects CO2 emissions and other greenhouse gases (GHGs) suchas methane, nitrous oxide, hydrofluorocarbons, perfluorocarbons and sulfur hexa-fluoride. The model also projects pollution emissions from sulfates, nitrogen oxides,black carbon, organic carbon, carbon monoxide, ammonia and nonmethane volatileorganic compounds. The data on air pollutants are based on the HTAP2.1 database(HTAP, 2013). Mitigation options are also reprensented in the model.
The dynamics in the EPPA model are driven by endogenously determined capitalaccumulation resulting from savings and investments as well as exogenously deter-mined factors including labor force growth, resource availability and the rate oftechnological change (e.g., explicit advanced technologies and productivity improve-ment in labor, land and energy) (Chen et al., 2015). GDP and income growth drives updemand for goods produced from each sector (Octaviano et al., 2016). Fossil fuelproduction costs increase as fossil fuel resources deplete. Increasing the use of
Table 1. Sectors and factor inputs in the EPPA model.
Sector Primary factor inputs
Production sectors Depletable natural capital
Agriculture — Crops CROP Conventional Oil ResourcesAgriculture — Livestock LIVE Shale OilAgriculture — Forestry FORS Conventional Gas ResourcesFood Products FOOD Unconventional Gas ResourcesCoal COAL Uranium ResourcesCrude Oil OIL Coal ResourcesRefined Oil ROIL Renewable Natural CapitalNatural Gasa GAS Solar ResourcesElectricityb ELEC Wind ResourcesEnergy-Intensive Industries EINT Hydro ResourcesOther Industries OTHR LandServices SERV Produced CapitalTransport TRAN Conventional Capital (Bldgs & Mach.)Household Sectors Labor
Household Transport HHTRANOwnership of Dwellings DWEOther Household Consumptionc HHOTHR
aNatural Gas production includes production from conventional resources, shale gas, tightgas, coal-bed methane and coal gasification.bElectricity production technologies include coal, natural gas, oil, advanced natural gas,advanced coal, hydro, nuclear, biomass, wind, solar, wind with natural gas backup, wind withbiomass backup, advanced coal with carbon capture and storage, advanced natural gas withcarbon capture and storage and advanced nuclear.cOther Household Consumption is resolved at the production sectors level.Source: Adopted from Chen et al. (2015).
D. Zhang & S. Paltsev
1650012-6
Clim
. Cha
nge
Eco
n. 2
016.
07. D
ownl
oade
d fr
om w
ww
.wor
ldsc
ient
ific
.com
by M
ASS
AC
HU
SET
S IN
STIT
UT
E O
F T
EC
HN
OL
OG
Y (
MIT
) on
11/
21/1
6. F
or p
erso
nal u
se o
nly.

advanced technologies (including energy from renewable sources) leads to learning-by-doing and a reduction in scarcity rents (associated with shortages in skilled laborand monopoly rents). With increasing prices of fossil fuel and reduced costs of ad-vanced technologies, the new technologies can become competitive with the existingtechnologies relying on fossil fuels (Morris et al., 2014). These features enable theEPPA model to simulate a dynamic evolution of technology mixes for different energyand climate-related policies.
Based on engineering data, EPPA includes advanced technologies that are notwidely deployed but have a large application potential in the future, namely “backstoptechnologies” as shown in Table 2 (Chen et al., 2015). These technologies are usuallymore expensive than the conventional technologies in the base year, but they maybecome cost efficient with technology improvement and favorable policies. The modelhas calibrated the output of these backstop technologies for historical years (2007 and2010) based on the information from the World Energy Outlook from the InternationalEnergy Agency (IEA, 2012).
3.2. Representing characteristics of China’s energy sector in the EPPA model
Like production for other commodities, advanced technologies in the EPPA model arerepresented by nested constant elasticity of substitution (CES) production functions.Key features of advanced technology representation include resource inputs and thedepiction of transition costs for scaling up production, which is expressed as a markuprelative to the price of pulverized coal technology in 2010. Based on a detailed surveyof local information from the latest publications, including government statistics oncapital cost, government announcements on fuel cost, and project-based peer-reviewed
Table 2. Backstop technologies.
Backstop technology EPPA6
First generation biofuels bio-fgSecond generation biofuels bio-oilOil shale synf-oilSynthetic gas from coal synf-gasHydrogen h2Advanced nuclear adv-nuclIntegrated Gasification Combined Cycle with CCS IgcapNatural Gas Combined Cycle NgccNatural Gas Combined Cycle with CCS NgcapWind generation WindBio-electricity BioelecWind power combined with bio-electricity WindbioWind power combined with gas-fired power WindgasSolar generation Solar
Source: Chen et al. (2015).
The Future of Natural Gas in China
1650012-7
Clim
. Cha
nge
Eco
n. 2
016.
07. D
ownl
oade
d fr
om w
ww
.wor
ldsc
ient
ific
.com
by M
ASS
AC
HU
SET
S IN
STIT
UT
E O
F T
EC
HN
OL
OG
Y (
MIT
) on
11/
21/1
6. F
or p
erso
nal u
se o
nly.
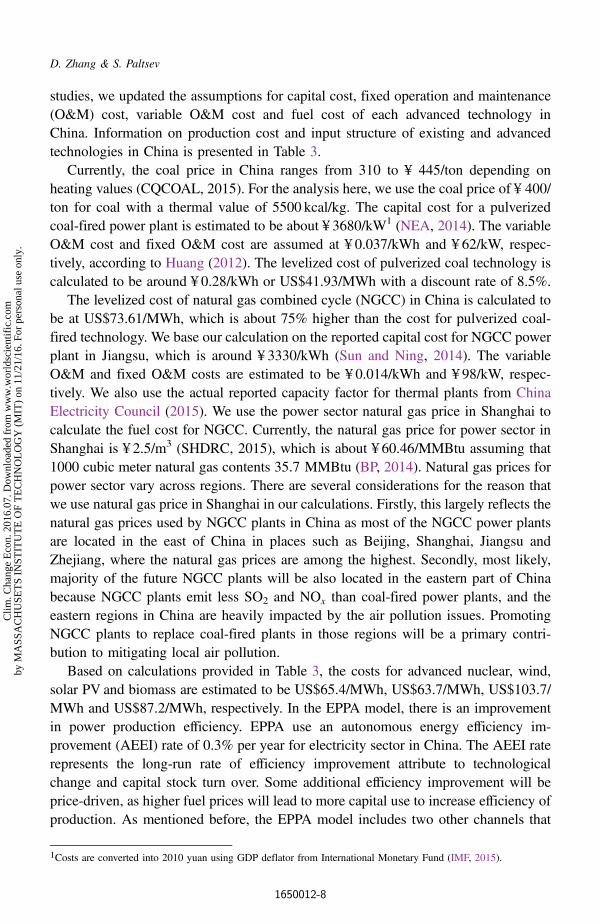
studies, we updated the assumptions for capital cost, fixed operation and maintenance(O&M) cost, variable O&M cost and fuel cost of each advanced technology inChina. Information on production cost and input structure of existing and advancedtechnologies in China is presented in Table 3.
Currently, the coal price in China ranges from 310 to ¥ 445/ton depending onheating values (CQCOAL, 2015). For the analysis here, we use the coal price of ¥ 400/ton for coal with a thermal value of 5500 kcal/kg. The capital cost for a pulverizedcoal-fired power plant is estimated to be about ¥ 3680/kW1 (NEA, 2014). The variableO&M cost and fixed O&M cost are assumed at ¥ 0.037/kWh and ¥ 62/kW, respec-tively, according to Huang (2012). The levelized cost of pulverized coal technology iscalculated to be around ¥ 0.28/kWh or US$41.93/MWh with a discount rate of 8.5%.
The levelized cost of natural gas combined cycle (NGCC) in China is calculated tobe at US$73.61/MWh, which is about 75% higher than the cost for pulverized coal-fired technology. We base our calculation on the reported capital cost for NGCC powerplant in Jiangsu, which is around ¥ 3330/kWh (Sun and Ning, 2014). The variableO&M and fixed O&M costs are estimated to be ¥ 0.014/kWh and ¥ 98/kW, respec-tively. We also use the actual reported capacity factor for thermal plants from ChinaElectricity Council (2015). We use the power sector natural gas price in Shanghai tocalculate the fuel cost for NGCC. Currently, the natural gas price for power sector inShanghai is ¥ 2.5/m3 (SHDRC, 2015), which is about ¥ 60.46/MMBtu assuming that1000 cubic meter natural gas contents 35.7 MMBtu (BP, 2014). Natural gas prices forpower sector vary across regions. There are several considerations for the reason thatwe use natural gas price in Shanghai in our calculations. Firstly, this largely reflects thenatural gas prices used by NGCC plants in China as most of the NGCC power plantsare located in the east of China in places such as Beijing, Shanghai, Jiangsu andZhejiang, where the natural gas prices are among the highest. Secondly, most likely,majority of the future NGCC plants will be also located in the eastern part of Chinabecause NGCC plants emit less SO2 and NOx than coal-fired power plants, and theeastern regions in China are heavily impacted by the air pollution issues. PromotingNGCC plants to replace coal-fired plants in those regions will be a primary contri-bution to mitigating local air pollution.
Based on calculations provided in Table 3, the costs for advanced nuclear, wind,solar PV and biomass are estimated to be US$65.4/MWh, US$63.7/MWh, US$103.7/MWh and US$87.2/MWh, respectively. In the EPPA model, there is an improvementin power production efficiency. EPPA use an autonomous energy efficiency im-provement (AEEI) rate of 0.3% per year for electricity sector in China. The AEEI raterepresents the long-run rate of efficiency improvement attribute to technologicalchange and capital stock turn over. Some additional efficiency improvement will beprice-driven, as higher fuel prices will lead to more capital use to increase efficiency ofproduction. As mentioned before, the EPPA model includes two other channels that
1Costs are converted into 2010 yuan using GDP deflator from International Monetary Fund (IMF, 2015).
D. Zhang & S. Paltsev
1650012-8
Clim
. Cha
nge
Eco
n. 2
016.
07. D
ownl
oade
d fr
om w
ww
.wor
ldsc
ient
ific
.com
by M
ASS
AC
HU
SET
S IN
STIT
UT
E O
F T
EC
HN
OL
OG
Y (
MIT
) on
11/
21/1
6. F
or p
erso
nal u
se o
nly.

Table3.
Levelized
costsof
electricity
inChina.
Units
(201
0¥/201
0US$)
Pulverized
coal
NGCC
NGCC
w/CCS
IGCC
IGCC
w/CCS
Advanced
nuclear
Wind
Biomass
Solar
PV
[0]
Con
structiontim
eyears
42
35
52
42
[1]
“Overnight”capitalcost
¥/kW
3680
3330
4065
7777
9161
11,911
7192
8886
8325
[2]
Totalcapitalrequ
irem
ent
¥/kW
4269
3596
4552
9332
10,993
1667
577
6710
,307
8991
[3]
Capitalrecovery
charge
rate
%10
.6%
10.6%
10.6%
10.6%
10.6%
10.6%
10.6%
10.6%
10.6%
[4]
Fixed
O&M
¥/kW
62.0
98.0
280.4
396.0
478.0
—16
0.4
108.3
52.6
[5]
VariableO&M
¥/kW
h0.03
70.01
40.14
60.00
90.02
00.13
0—
——
[6]
Project
life
years
2020
2020
2020
2020
20[7]
Capacity
factor
%54
%54
%54
%54
%54
%85
%26
%54
%16
%[8]
Operatin
gho
urs
hours
4706
4706
4706
4706
4706
7489
2274
4706
1428
[9]
Capitalrecovery
requ
ired
¥/kW
h0.09
60.08
10.10
20.21
00.24
70.23
50.36
10.23
10.66
5[10]
Fixed
O&M
recovery
requ
ired
¥/kW
h0.01
30.02
10.06
00.08
40.10
20.00
00.07
10.02
30.03
7[11]
Heatrate
BTU/kWh
8740
6333
7493
7450
8307
1047
9—
1350
0—
[12]
Fuelcost
¥/MMBTU
15.77
60.46
60.46
15.77
15.77
7.40
—24
.89
—
The Future of Natural Gas in China
1650012-9
Clim
. Cha
nge
Eco
n. 2
016.
07. D
ownl
oade
d fr
om w
ww
.wor
ldsc
ient
ific
.com
by M
ASS
AC
HU
SET
S IN
STIT
UT
E O
F T
EC
HN
OL
OG
Y (
MIT
) on
11/
21/1
6. F
or p
erso
nal u
se o
nly.
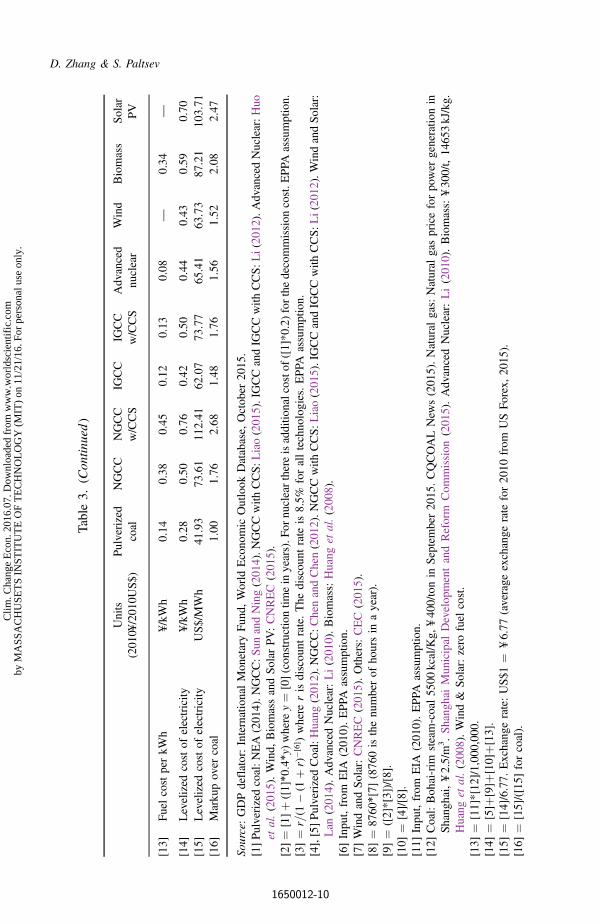
Table3.
(Contin
ued)
Units
(201
0¥/201
0US$)
Pulverized
coal
NGCC
NGCC
w/CCS
IGCC
IGCC
w/CCS
Advanced
nuclear
Wind
Biomass
Solar
PV
[13]
FuelcostperkW
h¥/kW
h0.14
0.38
0.45
0.12
0.13
0.08
—0.34
—
[14]
Levelized
costof
electricity
¥/kW
h0.28
0.50
0.76
0.42
0.50
0.44
0.43
0.59
0.70
[15]
Levelized
costof
electricity
US$/MWh
41.93
73.61
112.41
62.07
73.77
65.41
63.73
87.21
103.71
[16]
Marku
pover
coal
1.00
1.76
2.68
1.48
1.76
1.56
1.52
2.08
2.47
Source:GDPdeflator:InternationalMon
etaryFun
d,World
Econo
mic
Outlook
Database,
Octob
er20
15.
[1]Pulverizedcoal:N
EA(201
4).N
GCC:S
unandNing(201
4).N
GCCwith
CCS:L
iao(201
5).IGCCandIG
CCwith
CCS:L
i(20
12).AdvancedNuclear:H
uoet
al.(201
5).Wind,
BiomassandSolar
PV:CNREC(201
5).
[2]¼
[1]þ
([1]*0:4*y)where
y¼
[0](con
structiontim
ein
years).F
ornu
clearthereisadditio
nalcosto
f([1]*0
.2)forthedecommission
cost.E
PPA
assumption.
[3]¼
r=(1
�(1
þr)
�[6])where
risdiscou
ntrate.The
discou
ntrate
is8.5%
foralltechno
logies.EPPA
assumption.
[4],[5]PulverizedCoal:Huang
(201
2).N
GCC:C
henandChen(201
2).N
GCCwith
CCS:L
iao(201
5).IGCCandIG
CCwith
CCS:L
i(20
12).WindandSolar:
Lan
(201
4).AdvancedNuclear:Li(201
0).Biomass:Huang
etal.(200
8).
[6]Inpu
t,from
EIA
(201
0).EPPA
assumption.
[7]WindandSolar:CNREC(201
5).Others:CEC(201
5).
[8]¼
8760*[7]
(876
0isthenu
mberof
hoursin
ayear).
[9]¼
([2]*[3])/[8].
[10]
¼[4]/[8].
[11]
Inpu
t,from
EIA
(201
0).EPPA
assumption.
[12]
Coal:Boh
ai-rim
steam-coal55
00kcal/Kg,
¥40
0/tonin
September20
15.CQCOALNew
s(201
5).Natural
gas:Natural
gaspriceforpower
generatio
nin
Shang
hai,¥2.5/m
3.Shang
haiMun
icipal
Develop
mentandReform
Com
mission
(201
5).AdvancedNuclear:Li(201
0).Biomass:
¥30
0/t,14
653kJ/kg.
Huang
etal.(200
8).Wind&
Solar:zero
fuel
cost.
[13]
¼[11]*[12]/1,000,000.
[14]
¼[5]þ
[9]þ
[10]þ[
13].
[15]
¼[14]/6.77.
Exchang
erate:US$1
¼¥6.77
(average
exchange
rate
for20
10from
USFo
rex,
2015
).[16]
¼[15]/([15]
forcoal).
D. Zhang & S. Paltsev
1650012-10
Clim
. Cha
nge
Eco
n. 2
016.
07. D
ownl
oade
d fr
om w
ww
.wor
ldsc
ient
ific
.com
by M
ASS
AC
HU
SET
S IN
STIT
UT
E O
F T
EC
HN
OL
OG
Y (
MIT
) on
11/
21/1
6. F
or p
erso
nal u
se o
nly.

also affect efficiency of power plants: exogenous factor-augmented productivity growthand a technology specific factor that is parameterized to capture key observations oftechnology penetration such as gradual penetration, falling costs from the first-of-the-kind plant to nth plant, etc. (Morris et al., 2014).
The EPPA model has a simplified representation of the electricity dispatch decisions.In China there is a large fraction of must-run combined heat and power coal-fired plants,as well as institutional factors such as inflexible pricing and grid operation norms andprocedures that affect the dispatch decisions. Capturing this level of detail requires anelectricity dispatch model that can resolve hourly profiles of the load, calculate rampingand reserve costs, and reflect the policies for the must-run baseload units. Changes inelectricity system design, pricing and operations would provide greater flexibility andmay affect the results for generation profiles in China (Davidson et al., 2016). While inthis study we reflect the current dispatch practices in China, there is a need for a greatertemporal and spatial representation to refine the deployment decisions.
In the current version of EPPA (Chen et al., 2015), natural gas is treated as a fuelwhich will be fully combusted in all intermediate and final consumption sectors.However, in China around 30% of the natural gas input in industry is used as feedstockto produce chemicals such as acetylene and chloromethane (NBS, 2014). The differ-ence between feedstock input and fuel input is important for the resulting emissions.Feedstock inputs are not combusted and they emit little GHG. Assuming that allnatural gas is being used as a fuel will overestimate the amount of greenhouseemissions in the manufacturing sector.
In order to disaggregate the gas consumption into fuel input and feedstock inputbased on their actual usage, we introduce a new commodity titled “feedstock gas” intothe production function in the energy-intensive (EINT) sector (see Fig. 2) of the EPPAmodel. The feedstock gas comes from a combination of both domestic gas andimported gas. Since feedstock gas is a non-energy commodity, it is aggregated in thesame layer with other non-energy inputs. We adjust accordingly the amount of naturalgas that is used as fuel.
Energy consumption (both fossil and nonfossil) in 2010 in the standard EPPAmodel (Chen et al., 2015) is calibrated to match the IEA data (IEA, 2012). In Sep-tember 2015, the National Bureau of Statistics of China (NBS) released the officialrevision of energy consumption data from 2000 to 2013 (IMF, 2015). The revisedstatistics suggest that coal consumption has been underreported up to 17% each yearcompared to the data previously released by the (NBS, 2014, 2015a). Figure 3 presentsChina’s primary energy consumption from 2005 to 2014 based on the revised statistics.China’s energy mix is dominated by coal: in 2014, approximately 66% energy con-sumption came from coal. Natural gas contributed 242.8 Mtce, or 5.7% of China’sprimary energy consumption, which is much lower than the global average of 23.7% in2014 (BP, 2015). During the 2005–2014 time frame, China’s natural gas consumptiongrows at a 16.2% annual rate, while its total energy consumption grows by 5.6% peryear.
The Future of Natural Gas in China
1650012-11
Clim
. Cha
nge
Eco
n. 2
016.
07. D
ownl
oade
d fr
om w
ww
.wor
ldsc
ient
ific
.com
by M
ASS
AC
HU
SET
S IN
STIT
UT
E O
F T
EC
HN
OL
OG
Y (
MIT
) on
11/
21/1
6. F
or p
erso
nal u
se o
nly.

We calibrated the energy consumption of China in 2010 according to the latestofficial data. Starting from 2010, EPPA runs in five-year intervals. Although the officialstatistics for annual energy consumption in 2015 are not available yet, we use the 2014energy consumption as a base to calibrate the 2015 energy consumption. The NationalEnergy Agency (NEA) of China estimates that the energy consumption in the first half
Figure 2. Production structure for energy-intensive sector (EINT) in EPPA.
Data source: NNBS (2015b).
Figure 3. Natural gas in China’s total energy supply (Mtce).
D. Zhang & S. Paltsev
1650012-12
Clim
. Cha
nge
Eco
n. 2
016.
07. D
ownl
oade
d fr
om w
ww
.wor
ldsc
ient
ific
.com
by M
ASS
AC
HU
SET
S IN
STIT
UT
E O
F T
EC
HN
OL
OG
Y (
MIT
) on
11/
21/1
6. F
or p
erso
nal u
se o
nly.
of 2015 is 0.7% higher than the first half of 2014. The NEA also estimates that energyconsumption in the second half of 2015 will grow more than 0.7% from that in thesecond half year of 2014 (NEA, 2015). The total energy consumption in 2014 is 4260Mtce (124.85 EJ), with an energy mix of 66% coal, 17.1% oil, 5.7% natural gas and11.2% nonfossil energies (NNBS, 2015b).
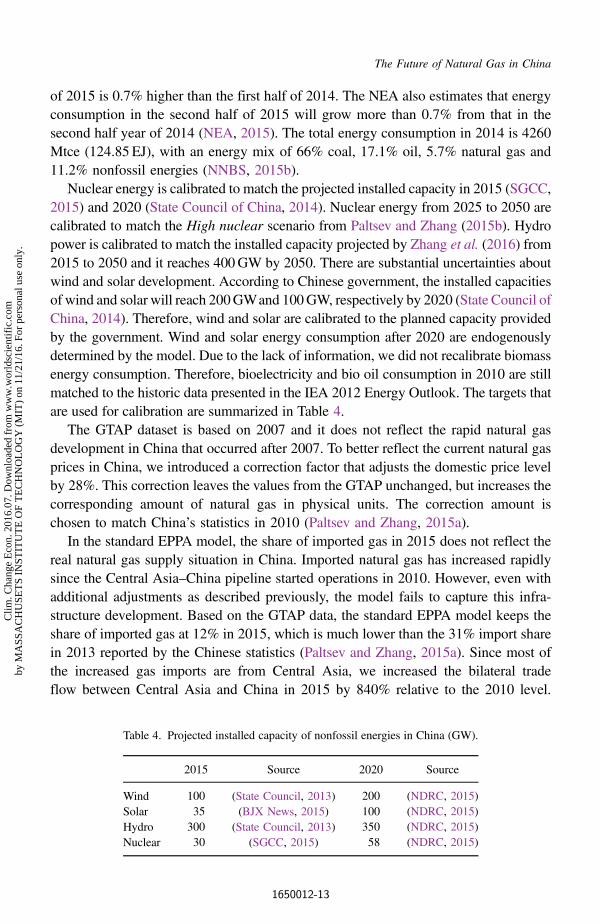
Nuclear energy is calibrated to match the projected installed capacity in 2015 (SGCC,2015) and 2020 (State Council of China, 2014). Nuclear energy from 2025 to 2050 arecalibrated to match the High nuclear scenario from Paltsev and Zhang (2015b). Hydropower is calibrated to match the installed capacity projected by Zhang et al. (2016) from2015 to 2050 and it reaches 400GW by 2050. There are substantial uncertainties aboutwind and solar development. According to Chinese government, the installed capacitiesof wind and solar will reach 200GWand 100GW, respectively by 2020 (State Council ofChina, 2014). Therefore, wind and solar are calibrated to the planned capacity providedby the government. Wind and solar energy consumption after 2020 are endogenouslydetermined by the model. Due to the lack of information, we did not recalibrate biomassenergy consumption. Therefore, bioelectricity and bio oil consumption in 2010 are stillmatched to the historic data presented in the IEA 2012 Energy Outlook. The targets thatare used for calibration are summarized in Table 4.
The GTAP dataset is based on 2007 and it does not reflect the rapid natural gasdevelopment in China that occurred after 2007. To better reflect the current natural gasprices in China, we introduced a correction factor that adjusts the domestic price levelby 28%. This correction leaves the values from the GTAP unchanged, but increases thecorresponding amount of natural gas in physical units. The correction amount ischosen to match China’s statistics in 2010 (Paltsev and Zhang, 2015a).
In the standard EPPA model, the share of imported gas in 2015 does not reflect thereal natural gas supply situation in China. Imported natural gas has increased rapidlysince the Central Asia–China pipeline started operations in 2010. However, even withadditional adjustments as described previously, the model fails to capture this infra-structure development. Based on the GTAP data, the standard EPPA model keeps theshare of imported gas at 12% in 2015, which is much lower than the 31% import sharein 2013 reported by the Chinese statistics (Paltsev and Zhang, 2015a). Since most ofthe increased gas imports are from Central Asia, we increased the bilateral tradeflow between Central Asia and China in 2015 by 840% relative to the 2010 level.
Table 4. Projected installed capacity of nonfossil energies in China (GW).
2015 Source 2020 Source
Wind 100 (State Council, 2013) 200 (NDRC, 2015)Solar 35 (BJX News, 2015) 100 (NDRC, 2015)Hydro 300 (State Council, 2013) 350 (NDRC, 2015)Nuclear 30 (SGCC, 2015) 58 (NDRC, 2015)
The Future of Natural Gas in China
1650012-13
Clim
. Cha
nge
Eco
n. 2
016.
07. D
ownl
oade
d fr
om w
ww
.wor
ldsc
ient
ific
.com
by M
ASS
AC
HU
SET
S IN
STIT
UT
E O
F T
EC
HN
OL
OG
Y (
MIT
) on
11/
21/1
6. F
or p
erso
nal u
se o
nly.

This number is justified by the fact that, during the first 10 months in 2010, Chinaimported a total value of US$0.75 billion (Urumqi Customs, 2011) from Central Asia.In 2015, the number has grown by 840%, reaching US$7 billion (Urumqi Customs,2015). Even after increasing the value for the imported gas from Central Asia based onthe custom statistics, the share of total gas imports in 2015 was still less than 31%.Hence, another adjustment was made to reflect the growth in LNG imports.
4. China’s Natural Gas Future: Alternative Policy Scenarios
4.1. Description of scenarios
We focus on the following three main scenarios which indicate three representativepaths of China’s future natural gas development: Reference, CapOnly (also referred asclimate policy), and CapþSubsidy (also referred as integrated policy). Table 5 sum-marizes the description of three scenarios.
4.1.1. Reference scenario
Under the Reference scenario, the natural gas pricing will be based on the oil-linkedapproach during 2015–2020, and completely market-determined afterwards. No
Table 5. Assumptions and highlights of the three typical policy scenarios.
Reference CapOnly CapþSubsidy
[1] Oil-linked gas price from2015 to 2020, market-determined gas priceafter 2020
The same as in Reference The same as in Reference
[2] No carbon cap Carbon cap-and-tradescheme introduced toachieve a 4% CO2 in-tensity reduction peryear after 2020
The same as in CapOnly
[3] No gas subsidy No gas subsidy Allocate a part of carbonrevenue to subsidizenatural gas use toachieve a 10% of nat-ural gas contribution inprimary energy con-sumption since 2020
ScenarioRemarks
Represents the currentnatural gas pricingapproach and futuredirections for pricing.
Introduces a cap-and-tradescheme to achieveChina’s pledge —
peaking its CO2 emis-sion around 2030.
Integrated climate mitiga-tion and natural gaspromotion policy isintroduced to achievethe objective of climatemitigation and naturalgas promotion simul-taneously.
D. Zhang & S. Paltsev
1650012-14
Clim
. Cha
nge
Eco
n. 2
016.
07. D
ownl
oade
d fr
om w
ww
.wor
ldsc
ient
ific
.com
by M
ASS
AC
HU
SET
S IN
STIT
UT
E O
F T
EC
HN
OL
OG
Y (
MIT
) on
11/
21/1
6. F
or p
erso
nal u
se o
nly.
policies are introduced — the Reference scenario is used as a base case to assess theeffects of the CO2 cap and natural gas consumption subsidies. Most of the results inthis paper will be presented as deviations from the Reference.
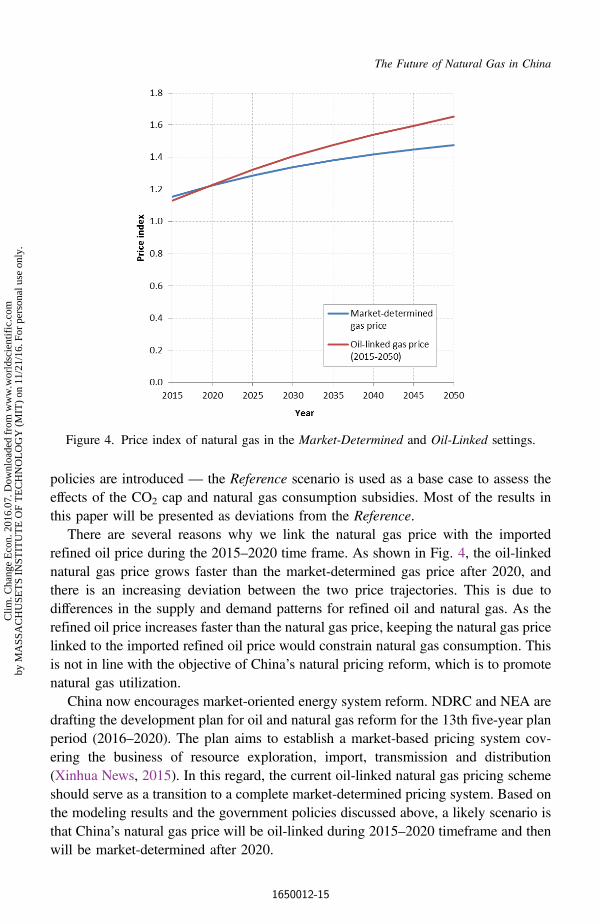
There are several reasons why we link the natural gas price with the importedrefined oil price during the 2015–2020 time frame. As shown in Fig. 4, the oil-linkednatural gas price grows faster than the market-determined gas price after 2020, andthere is an increasing deviation between the two price trajectories. This is due todifferences in the supply and demand patterns for refined oil and natural gas. As therefined oil price increases faster than the natural gas price, keeping the natural gas pricelinked to the imported refined oil price would constrain natural gas consumption. Thisis not in line with the objective of China’s natural pricing reform, which is to promotenatural gas utilization.
China now encourages market-oriented energy system reform. NDRC and NEA aredrafting the development plan for oil and natural gas reform for the 13th five-year planperiod (2016–2020). The plan aims to establish a market-based pricing system cov-ering the business of resource exploration, import, transmission and distribution(Xinhua News, 2015). In this regard, the current oil-linked natural gas pricing schemeshould serve as a transition to a complete market-determined pricing system. Based onthe modeling results and the government policies discussed above, a likely scenario isthat China’s natural gas price will be oil-linked during 2015–2020 timeframe and thenwill be market-determined after 2020.
Figure 4. Price index of natural gas in the Market-Determined and Oil-Linked settings.
The Future of Natural Gas in China
1650012-15
Clim
. Cha
nge
Eco
n. 2
016.
07. D
ownl
oade
d fr
om w
ww
.wor
ldsc
ient
ific
.com
by M
ASS
AC
HU
SET
S IN
STIT
UT
E O
F T
EC
HN
OL
OG
Y (
MIT
) on
11/
21/1
6. F
or p
erso
nal u
se o
nly.
4.1.2. Climate policy scenario (CapOnly)
China’s INDC lists its major actions to address climate change. According to theINDC, China will decrease its carbon intensity by 60–65% from 2005 levels by 2030,and peak its CO2 emissions around 2030. The INDC also cites establishing a na-tionwide emissions trading system (ETS) as a critical tool to enable China to achieveits INDC pledges (NDRC, 2015). The ETS will launch in 2017, according to the US–China Joint Presidential Statement on Climate Change (The White House, 2015).
By 2014, China achieved a CO2 intensity reduction of 33.8% compared to the 2005levels (NDRC, 2015). If China achieves a carbon intensity reduction of about 4% peryear during the period from 2015 to 2030, then it will accomplish a carbon intensityreduction of approximately 65.5% from 2005 to 2030 — very close to the range of itsINDC CO2 intensity reduction pledge. Therefore, in the CapOnly scenario we use a4% CO2 intensity reduction rate as a constraint to generate CO2 cap in EPPA tosimulate China’s INDC starting in 2020.
4.1.3. Integrated carbon cap-and-trade and natural gas subsidy policyscenario (CapþSubisdy)
The CapþSubsidy scenario is designed to investigate the magnitude of support neededto meet China’s natural gas target while implementing a nationwide ETS to achieve theINDC targets. The ETS caps CO2 emissions by generating a CO2 penalty. Fossil fuelconsumption is expected to be substantially reduced with the implementation of ETS.Although natural gas has less carbon content than coal, it is still a carbon-emittingfossil fuel and is also expected to be reduced by a sizeable amount due to the CO2
penalty. As a result, China’s climate policy might counteract its natural gas promotionpolicy, which aims to reach a 10% share of natural gas in the primary energy supply.
If the government intends to reduce CO2 emissions and increase natural gas con-sumption at the same time, it may need to subsidize natural gas consumption. Naturalgas subsidy plays an important role in promoting natural gas utilization under climatepolicy. Burning coal generates more SO2 and particulates than natural gas. Therefore,natural gas subsidy is justified by the fact that it internalizes the air pollution exter-nalities of coal.
In this scenario, in addition to the CO2 cap, we implement subsidies to natural gasconsumption in all sectors except for the chemical manufacturing sector. This setting isintended to be in line with the government’s natural use guidelines which haverestrictions on gas use for chemical production (NDRC, 2012). In this scenario, theresidential, energy intensive, electricity, transport, services and other sectors are sub-sidized for their natural gas consumption as fuel starting in 2020. We set the subsidylevels on different gas users until the total natural gas supply accounts for 10% of thetotal energy supply in each period after 2020. We also calculate the amount of sub-sidies as a share of CO2 tax revenue in each period. The results might be informativefor policy makers to illustrate the amount of CO2 tax revenue (or CO2 permit revenue)
D. Zhang & S. Paltsev
1650012-16
Clim
. Cha
nge
Eco
n. 2
016.
07. D
ownl
oade
d fr
om w
ww
.wor
ldsc
ient
ific
.com
by M
ASS
AC
HU
SET
S IN
STIT
UT
E O
F T
EC
HN
OL
OG
Y (
MIT
) on
11/
21/1
6. F
or p
erso
nal u
se o
nly.
which should be allocated to subsidize natural gas consumers and reach natural gasconsumption targets. The results will be discussed in the next section.
In all scenarios, energy consumption in 2010 is calibrated to match the Chinesestatistics released by National Bureau of Statistics (NNBS, 2015b). China’s natural gasconsumption in 2015 is calibrated to match projections based on the 2014 data. Whilein the Reference scenario we assume no climate policy, in both scenarios with CO2
policy we also implement the CO2 cap on the rest of the world to reflect the UNagreement in Paris in December of 2015. The emission caps on the other EPPA modelregions are based on the MIT Energy and Climate Outlook 2015 (Reilly et al., 2015).In the regions that impose carbon policy, CO2 revenue is distributed in a lump summanner.
Air pollution objectives can also be achieved by imposing taxes or regulations on airpollutants. In one previous application of the EPPA model, we explored SO2 and NOx
emission targets in China and their impacts on CO2 emissions (Nam et al., 2013) andfound out that air pollution targets have substantial climate co-benefits, but the cost ofachieving these targets can be quite high. In addition, these policies may result in alock-in effect for the existing technology rather than in a promotion of alternative low-carbon energy sources. Another application of the EPPA model (Nam et al., 2014)explored cross-elasticities of pollution and climate control with small (10%) and morestringent (75%) reduction targets. For China it illustrated the availability of pollutioncontrol technologies to target individual pollutants for smaller reduction but the needfor wholesale change toward nonfossil technologies when large reductions are re-quired. In this paper, we do not consider taxes on conventional air pollutants and ratherfocus on the policies and targets proposed by China regarding its CO2 emissions andnatural gas promotion objectives.
4.2. Results and discussion
4.2.1. CO2 emissions and carbon price
As shown in Fig. 5, the CO2 cap-and-trade policy can substantially reduce CO2
emissions from the Reference case after 2020. This is because the policy creates a CO2
price which reflects the marginal cost of CO2 emission abatement. Under this policyscenario, the (explicit or implicit) CO2 price is added to all fossil energy used as a fuel.As a result, the energy price increases and consumers need to pay more when pur-chasing fossil energy. Subsidies encourage consumers to use more natural gas bycreating an incentive for consumers to use less fossil fuel and cleaner types of energysuch as wind, solar, nuclear and hydro. As the demand for fossil energy decreases, sodo CO2 emissions.
The stringency of the CO2 mitigation policy in terms of a carbon intensity reductionrate is the same in the CapOnly scenario and the CapþSubsidy scenario. Therefore, thetrajectories for the CO2 emissions in both scenarios are also the same. However, theCO2 prices to achieve the CO2 emissions policy targets are somewhat different. In
The Future of Natural Gas in China
1650012-17
Clim
. Cha
nge
Eco
n. 2
016.
07. D
ownl
oade
d fr
om w
ww
.wor
ldsc
ient
ific
.com
by M
ASS
AC
HU
SET
S IN
STIT
UT
E O
F T
EC
HN
OL
OG
Y (
MIT
) on
11/
21/1
6. F
or p
erso
nal u
se o
nly.

2030, the CO2 price to peak CO2 emissions is about $11.5/tCO2 in the CapOnlyscenario, but it is $16.7/tCO2 in the Capþsubsidy scenario (see Fig. 5). Though nat-ural gas is cleaner than coal, burning of natural gas still emits CO2. Under the sameCO2 emissions constraint, the increased CO2 emission from the increased use ofnatural gas should be offset by the decreased emissions from the reduced use of otherfuels, such as coal, which needs a higher CO2 price.
4.2.2. Energy consumption
Figure 6 compares energy consumption and total natural gas consumption in the threescenarios. As can be seen, the total energy consumption under the two policy scenariosis lower than under the Reference scenario. The difference in total energy consumptionbetween the CapOnly scenario and the CapþSubsidy scenario is not large. The energyconsumption structure in the CapOnly scenario, however, is different from in theCap+Subsidy scenario.
In the CapOnly scenario, in 2030 coal consumption decreases by 12% (from110.8 EJ to 97.9 EJ) and natural gas consumption by 40% (from 12.4 EJ to 7.4 EJ),compared with the Reference. The share of natural gas in the primary energy supplydeclines from 6.5% to 4.2%, which is much below the 10% natural gas target. Non-fossil energy use in 2030 climbs from 34.9 EJ to 36.4 EJ, accounting for 20.8% of theprimary energy supply, which is slightly above the 20% share target.2
The CapþSubsidy scenario suggests that natural gas can reach the 10% natural gastarget in 2020 under substantial subsidies. The total subsidy amount accounts for about10% of CO2 revenue in 2020 (we discuss the amount of subsidies later in moredetail). With subsidy, natural gas consumption can climb to 18.9 EJ in 2030 in theCapþSubsidy scenario, which is 52.5% higher than in the Reference scenario and155.6% higher than in the CapOnly scenario. The coal consumption in theCapþSubsidy scenario is reduced by 19.3 EJ relative to the Reference scenario and by
2INDC sets the goal to increase the share of non-fossil fuels in primary energy consumption to around 20% by 2030(NDRC, 2015).
Figure 5. CO2 emissions and implicit CO2 price.
D. Zhang & S. Paltsev
1650012-18
Clim
. Cha
nge
Eco
n. 2
016.
07. D
ownl
oade
d fr
om w
ww
.wor
ldsc
ient
ific
.com
by M
ASS
AC
HU
SET
S IN
STIT
UT
E O
F T
EC
HN
OL
OG
Y (
MIT
) on
11/
21/1
6. F
or p
erso
nal u
se o
nly.

6.4 EJ relative to the CapOnly scenario in 2030, indicating that gas subsidy plays avital role in promoting natural gas substitution for coal. The nonfossil energy supply inthe CapþSubsidy scenario increases by 2.1 EJ and by 0.7 EJ compared with in theReference scenario and the CapOnly scenario in 2030, respectively. This demonstratesthat natural gas subsidy plus a higher carbon tax results in a coal consumption re-duction as well as an increase of nonfossil energy supply.
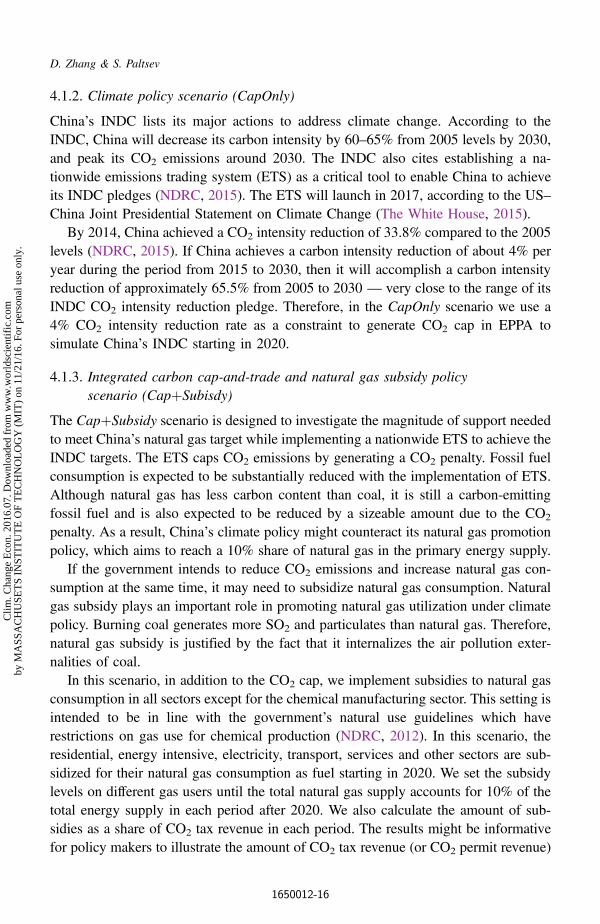
4.2.3. Changes in coal and natural gas use
In the CapOnly scenario, an introduction of a CO2 price improves a competiveness ofnatural gas with coal due to a lower carbon content of natural gas. But the resultingcarbon price level is still not high enough to offset the large initial price differencebetween natural gas and coal. As shown in Fig. 7(a), a CO2 price reduces both coal andnatural gas consumption. One sector where carbon pricing may introduce a switchfrom coal to natural gas is electricity. In China, the NGCC generation cost almost twiceas pulverized coal-fired electricity generation technology. Since the natural gas-firedelectricity is much more expensive than coal-fired electricity, a relatively low CO2
price is not able to induce the coal-to-gas switching in the power sector. Comparedwith the CapOnly scenario, natural gas consumption rises while coal consumptiondeclines in the integrated policy scenario, as shown in Fig. 7(b).
(a) (b)
(c) (d)
Figure 6. Energy consumption by fuel under different scenarios. (a) Energy consumption bytype, Reference, (b) Energy consumption by type, CapOnly, (c) Energy consumption by type,Cap+Subsidy and (d) Total gas use.
The Future of Natural Gas in China
1650012-19
Clim
. Cha
nge
Eco
n. 2
016.
07. D
ownl
oade
d fr
om w
ww
.wor
ldsc
ient
ific
.com
by M
ASS
AC
HU
SET
S IN
STIT
UT
E O
F T
EC
HN
OL
OG
Y (
MIT
) on
11/
21/1
6. F
or p
erso
nal u
se o
nly.
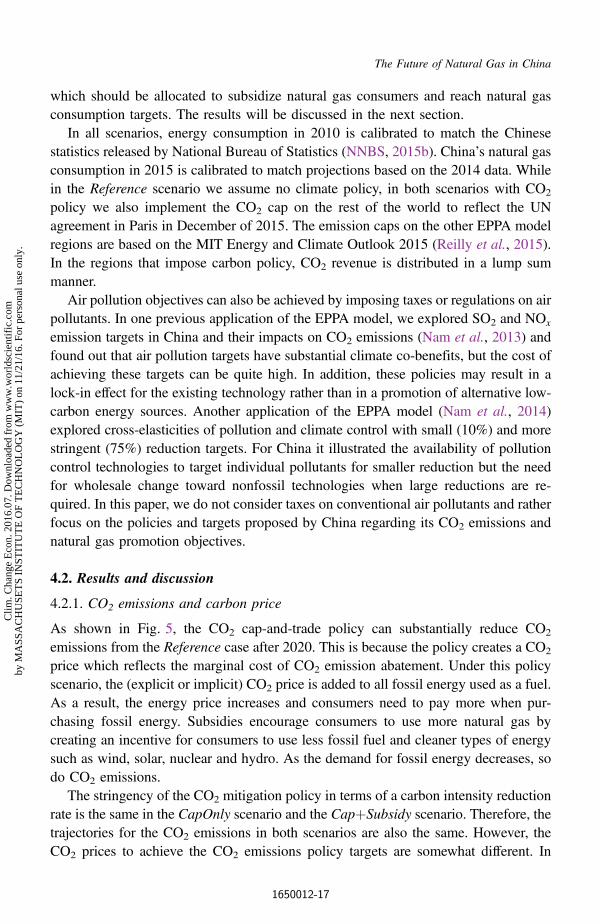
4.2.4. Natural gas consumption by sector
Natural gas consumption patterns are significantly different among the three scenarios.As represented in Fig. 8, natural gas use declines substantially in the CapOnly scenariowith the introduction of climate policy without gas subsidies, from 12.4 EJ to 7.36 EJin 2030. Natural gas use in the household sector is reduced the most, from 2.5 EJ in theReference scenario to 0.5 EJ in the CapOnly scenario in 2030. The residential sectorappears to be the most sensitive to natural gas price changes, while natural gas use inchemical manufacturing sector is hardly affected by the CO2 price. That is because thenatural gas used as feedstock does not emit CO2 and is not a subject to carbon penalty.Change in natural gas use in the electricity generation sector is relatively small becausewhile CO2 price imposes penalty on both natural gas and coal, natural gas is lessaffected as it has lower carbon content than coal.
In the integrated policy case, the CO2 penalty for natural gas users is offset by thegas subsidy, which makes natural gas more competitive than coal for consumers. As aresult, a substitution of natural gas for coal happens, especially as a fuel in the energy-intensive sector and in the household sector. Compared with the CapOnly scenario,natural gas consumption under the CapþSubsidy scenario increases by 11.5 EJ in 2030and by 19.5 EJ in 2050. Table 6 shows the amount of increased natural gas con-sumption by sector in the integrated policy case relative to the climate policy scenario.A large amount of the increased natural gas use takes place in the residential sector,power generation and industrial sector.
4.2.5. Natural gas supply by source
Domestic production and imports of natural gas are substantially affected by a choiceof the policy instrument, as shown in Fig. 9. In the CapOnly scenario, both importedand domestic natural gas use are substantially decreased due to the reduced demand(Fig. 9(b)), because both the imported natural gas and domestic natural gas are subjectto a carbon price penalty. Imports of natural gas decrease more than a decline in
(a) (b)
Figure 7. Change in coal and natural gas consumption in different scenarios. (a) Differencebetween CapOnly & Reference and (b) Difference between Cap+Subsidy & CapOnly.
D. Zhang & S. Paltsev
1650012-20
Clim
. Cha
nge
Eco
n. 2
016.
07. D
ownl
oade
d fr
om w
ww
.wor
ldsc
ient
ific
.com
by M
ASS
AC
HU
SET
S IN
STIT
UT
E O
F T
EC
HN
OL
OG
Y (
MIT
) on
11/
21/1
6. F
or p
erso
nal u
se o
nly.

domestic production. While in this scenario some imports remain, international naturalgas trading flows re-allocate from China to the destinations without (or with lessstringent) carbon policies (ASI and IDZ regions of the EPPA model).
3The OTHER category includes the following sectors: TRAN, CROP, LIVE, FORS, FOOD, ROIL, OTHR and SERV.EINT-FEED reports natural gas used as feedstock. EINT-FUEL represents energy intensive sectors that use natural gasas fuel. HH represents household sector (HHTRAN, DWE, HHOTHR). See Table 1 for sectoral definition.
(a) (b)
(c) (d)
(e) (f)
Figure 8. Natural gas consumption by sector in different scenarios.3 (a) Natural gas con-sumption by sector, Reference, (b) Natural gas consumption by sector (%), Reference, (c)Natural gas consumption by sector, CapOnly, (d) Natural gas consumption by sector (%),CapOnly, (e) Natural gas consumption by sector, CapþSubsidy and (f) Natural gas con-sumption by sector (%), CapþSubsidy.
The Future of Natural Gas in China
1650012-21
Clim
. Cha
nge
Eco
n. 2
016.
07. D
ownl
oade
d fr
om w
ww
.wor
ldsc
ient
ific
.com
by M
ASS
AC
HU
SET
S IN
STIT
UT
E O
F T
EC
HN
OL
OG
Y (
MIT
) on
11/
21/1
6. F
or p
erso
nal u
se o
nly.

Under the integrated scenario, the gas subsidy scheme boosts both domestic andimported supply (Fig. 9(c)). The subsidy scheme lowers the price that consumers payfor gas, increasing the competitiveness of natural gas relative to coal and oil. As aresult, demand for natural gas grows, where a large part of the increased demand is metby imported gas because of domestic supply capacity constraints. With a limitedincrease in domestic production, gas suppliers need to increase the imported volumesto meet the surging demand. In 2050, domestic production is 9.0 EJ and imports are
Table 6. Increase in gas consumption in CapþSubsidy compared to CapOnly (EJ).
(EJ) 2020 2025 2030 2035 2040 2045 2050
EINT-FUEL 2.2 2.7 3.3 4.3 4.9 5.6 6.3OTHER 1.2 1.3 1.5 1.7 1.9 2.3 2.5ELEC 1.6 2.5 2.7 3.4 4.2 4.9 5.1HH 2.6 3.3 4.0 4.5 5.1 5.3 5.7
(a) (b)
(c)
Figure 9. Domestic and imported natural as supply in different scenarios. (a) Natural gassupply by source, Reference, (b) Natural gas supply by source, CapOnly and (c) Natural gassupply by source, Cap+Subsidy.
D. Zhang & S. Paltsev
1650012-22
Clim
. Cha
nge
Eco
n. 2
016.
07. D
ownl
oade
d fr
om w
ww
.wor
ldsc
ient
ific
.com
by M
ASS
AC
HU
SET
S IN
STIT
UT
E O
F T
EC
HN
OL
OG
Y (
MIT
) on
11/
21/1
6. F
or p
erso
nal u
se o
nly.
8.9 EJ in the Reference scenario. They are 5.0 EJ and 1.7 EJ in the CapOnly scenario,and 7.1 EJ and 19.2 EJ in the CapþSubsidy scenario.
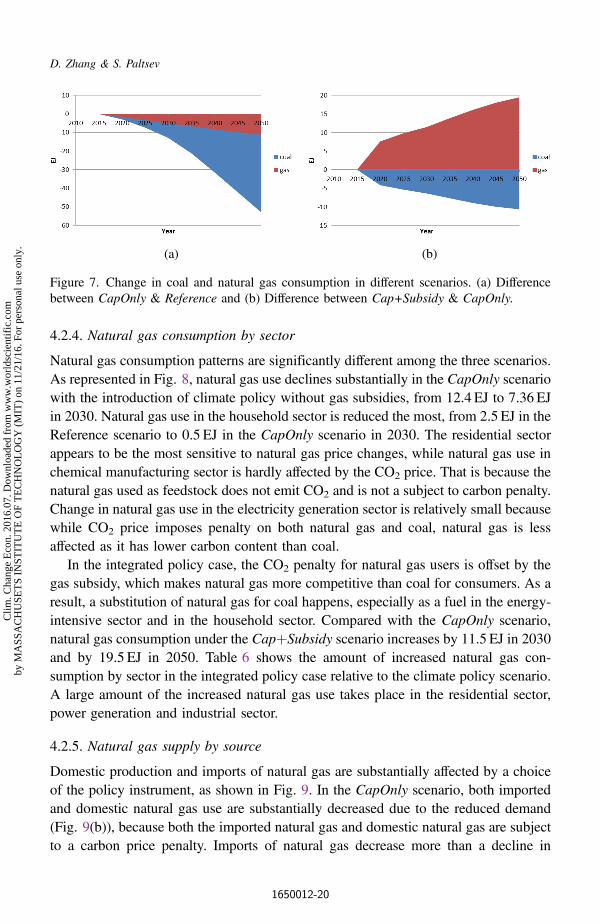
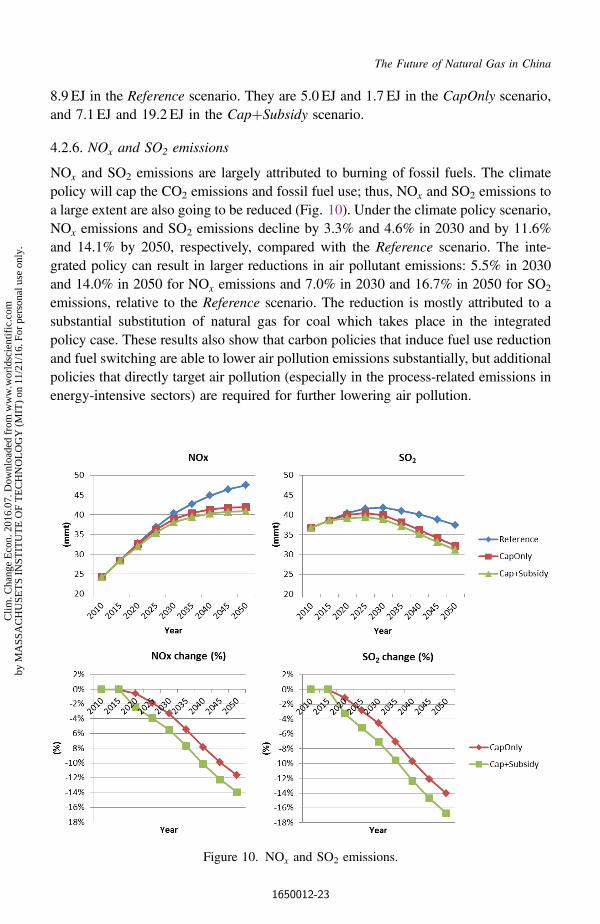
4.2.6. NOx and SO2 emissions
NOx and SO2 emissions are largely attributed to burning of fossil fuels. The climatepolicy will cap the CO2 emissions and fossil fuel use; thus, NOx and SO2 emissions toa large extent are also going to be reduced (Fig. 10). Under the climate policy scenario,NOx emissions and SO2 emissions decline by 3.3% and 4.6% in 2030 and by 11.6%and 14.1% by 2050, respectively, compared with the Reference scenario. The inte-grated policy can result in larger reductions in air pollutant emissions: 5.5% in 2030and 14.0% in 2050 for NOx emissions and 7.0% in 2030 and 16.7% in 2050 for SO2
emissions, relative to the Reference scenario. The reduction is mostly attributed to asubstantial substitution of natural gas for coal which takes place in the integratedpolicy case. These results also show that carbon policies that induce fuel use reductionand fuel switching are able to lower air pollution emissions substantially, but additionalpolicies that directly target air pollution (especially in the process-related emissions inenergy-intensive sectors) are required for further lowering air pollution.
Figure 10. NOx and SO2 emissions.
The Future of Natural Gas in China
1650012-23
Clim
. Cha
nge
Eco
n. 2
016.
07. D
ownl
oade
d fr
om w
ww
.wor
ldsc
ient
ific
.com
by M
ASS
AC
HU
SET
S IN
STIT
UT
E O
F T
EC
HN
OL
OG
Y (
MIT
) on
11/
21/1
6. F
or p
erso
nal u
se o
nly.

4.2.7. Policy cost
Welfare change is a measure of climate policy cost (Paltsev and Capros, 2013). Fol-lowing standard economic theory, we calculate and report the overall economic cost ofthe policy scenarios using a dollar-based measure of the change in welfare for therepresentative agent in China. In technical terms, welfare is measured as equivalentvariation and it reflects a change in aggregate market consumption activity. Introducingcarbon constraints brings the increases in the fossil energy prices because their con-sumer prices include carbon charges. Energy users pay more for energy, and additionalinvestment in low-carbon technologies lead to reallocation of resources in China’seconomy, which ultimately leads to welfare losses in the CapOnly and CapþSubsidyscenarios relative to the Reference scenario (Fig. 11). The model simulations result in a0.27% welfare loss in 2030 and a 0.38% welfare loss in 2050 in the CapOnly scenario.The welfare loss is higher in the CapþSubsidy case: 0.31% in 2030 and 0.57% in 2050relative to the Reference scenario. The integrated policy creates a mechanism thatsubsidizes relatively expensive natural gas and reduces further the use of relativelycheaper coal, which results in an additional welfare cost. Our welfare results do not
Figure 11. Welfare (consumption) change.
D. Zhang & S. Paltsev
1650012-24
Clim
. Cha
nge
Eco
n. 2
016.
07. D
ownl
oade
d fr
om w
ww
.wor
ldsc
ient
ific
.com
by M
ASS
AC
HU
SET
S IN
STIT
UT
E O
F T
EC
HN
OL
OG
Y (
MIT
) on
11/
21/1
6. F
or p
erso
nal u
se o
nly.

account for health benefits associated with air pollution, which can be substantial. Thewelfare loss numbers presented here can be reduced or compensated if the environ-mental benefits associated with lower air pollution are taken into account. Valuingthese benefits is a challenging task (Matus et al., 2012) which is beyond the scope ofthis study.
There is a growing body of literature that focuses on the impacts of air pollution inChina. The studies agree on large welfare costs for the society. As mentioned, somestudies estimate that air pollution in China contributes to 1.2 million (Yang et al.,2013) to 1.6 million (Rohde and Muller, 2015) deaths per year. Other researchers(Chen et al., 2013) used the quasi-experimental empirical approach that is based onChina’s Huai River policy, which provided free winter heating via the provision of coalfor boilers in cities north of the Huai River but denied heat to the south. They con-cluded that the 500 million Chinese who live north of the Huai River are set to lose anaggregate 2.5 billion years of life expectancy due to the extensive use of coal. Matuset al. (2012) attempts to assess the economic losses from air pollution and finds thatPM and ozone have substantially impacted the Chinese economy. Quantifying costsfrom lost labor and the increased need for health care, the study finds that this airpollution cost the Chinese economy $112 billion in 2005, compared to $22 billion insuch damages in 1975.
Researchers also try to quantify the economic damages associated with CO2
emissions. US EPA uses the social cost of carbon estimate (EPA, 2015) that rangesfrom $11 to $56 per ton of CO2 in 2015 to $26 to $95/tCO2 in 2050 (recall that carbonprices reported in Fig. 4 grow to about $50–60/tCO2 in 2050). Similarly to estimatingthe damages from air pollution, the social cost of carbon estimate suffers from thecurrent modeling and data limitations. The current assessments do not include all of theimportant physical, ecological and economic impacts of climate change recognized inthe climate change literature because of a lack of precise information on the nature ofdamages and because the science incorporated into these models naturally lags behindthe most recent research (EPA, 2015).
4.2.8. Level of subsidy
Based on the modeling results, the subsidy amount required to achieve the 10% naturalgas goal is $5.0 billion in 2020, $12.2 billion in 2030 and $51.3 billion in 2050,respectively (Fig. 12). To finance such amount of subsidy, the Chinese governmentmay need to secure new income sources. The CO2 tax revenue (or proceeds from thesales of CO2 emission permits) can be used for such a new source of governmentrevenue. In the policy scenarios, China’s government earns about $66 billion from theemission permit sales in 2020, $200 billion in 2030, and $618 billion in 2050.Therefore, the Chinese government would need to allocate 6% to 9% of its CO2 permitsrevenue to subsidize natural gas consumers to achieve its natural gas promotion goal.
Based on the EPPA model simulation, the total natural gas subsidy would accountfor approximately 0.4%, 0.6% and 1.1% of the government’s total government
The Future of Natural Gas in China
1650012-25
Clim
. Cha
nge
Eco
n. 2
016.
07. D
ownl
oade
d fr
om w
ww
.wor
ldsc
ient
ific
.com
by M
ASS
AC
HU
SET
S IN
STIT
UT
E O
F T
EC
HN
OL
OG
Y (
MIT
) on
11/
21/1
6. F
or p
erso
nal u
se o
nly.
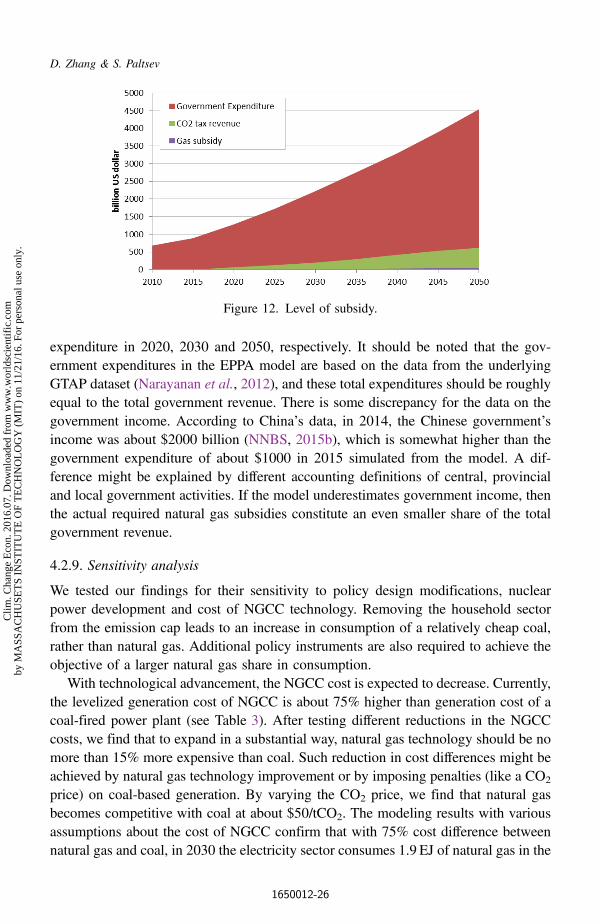
expenditure in 2020, 2030 and 2050, respectively. It should be noted that the gov-ernment expenditures in the EPPA model are based on the data from the underlyingGTAP dataset (Narayanan et al., 2012), and these total expenditures should be roughlyequal to the total government revenue. There is some discrepancy for the data on thegovernment income. According to China’s data, in 2014, the Chinese government’sincome was about $2000 billion (NNBS, 2015b), which is somewhat higher than thegovernment expenditure of about $1000 in 2015 simulated from the model. A dif-ference might be explained by different accounting definitions of central, provincialand local government activities. If the model underestimates government income, thenthe actual required natural gas subsidies constitute an even smaller share of the totalgovernment revenue.
4.2.9. Sensitivity analysis
We tested our findings for their sensitivity to policy design modifications, nuclearpower development and cost of NGCC technology. Removing the household sectorfrom the emission cap leads to an increase in consumption of a relatively cheap coal,rather than natural gas. Additional policy instruments are also required to achieve theobjective of a larger natural gas share in consumption.
With technological advancement, the NGCC cost is expected to decrease. Currently,the levelized generation cost of NGCC is about 75% higher than generation cost of acoal-fired power plant (see Table 3). After testing different reductions in the NGCCcosts, we find that to expand in a substantial way, natural gas technology should be nomore than 15% more expensive than coal. Such reduction in cost differences might beachieved by natural gas technology improvement or by imposing penalties (like a CO2
price) on coal-based generation. By varying the CO2 price, we find that natural gasbecomes competitive with coal at about $50/tCO2. The modeling results with variousassumptions about the cost of NGCC confirm that with 75% cost difference betweennatural gas and coal, in 2030 the electricity sector consumes 1.9 EJ of natural gas in the
Figure 12. Level of subsidy.
D. Zhang & S. Paltsev
1650012-26
Clim
. Cha
nge
Eco
n. 2
016.
07. D
ownl
oade
d fr
om w
ww
.wor
ldsc
ient
ific
.com
by M
ASS
AC
HU
SET
S IN
STIT
UT
E O
F T
EC
HN
OL
OG
Y (
MIT
) on
11/
21/1
6. F
or p
erso
nal u
se o
nly.
Reference scenario and 1.6 EJ in 2030 in the CapOnly scenario. With a cost differenceof 5%, in 2030 the electricity sector consumes 8.4 EJ in the Reference case and 15.3 EJin the CapOnly case.
We also assessed the effects of different nuclear penetration rates on natural gas usein China. The results show that with a lower nuclear penetration rate, China needs ahigher CO2 price to meet its CO2 intensity mitigation targets and the higher CO2 pricediscourages natural gas use. This sensitivity analysis illustrates a need for substantialflexibility and periodic assessments of the government targets depending on the re-alization of fuel prices and technological costs in the future. While a cap-and-tradesystem would put an absolute ceiling on the emission levels, some additional policyinstruments may be introduced to lower the cost of reaching the targets.
5. Conclusions
China has pledged to mitigate its CO2 emissions by introducing a number of policyinstruments including a national cap-and-trade system. Our analysis demonstrates thatthe introduction of the CO2 cap-and-trade scheme can be used to achieve China’sINDC. However, it may also substantially reduce natural gas consumption as itimposes a penalty on all fossil fuels including natural gas. There are two main channelsthat affect the relative prices and the use of natural gas and coal. Carbon penalty makescoal and natural gas more expensive. As the prices for coal and natural gas increase,their use decreases. At the same time, the carbon penalty on natural gas is relativelysmaller than on coal because of the lower carbon content of natural gas. Under certainrelative prices, in the sectors where coal and natural gas can be used as a fuel inter-changeably (e.g., in electricity generation) this can lead to a substitution from coal tonatural gas use. However, in the case of China the relative fuel prices and carbon pricesresulting from the cap-and-trade scheme do not lead to an increase in natural gas use.Without additional adjustments, this policy would create a substantive deviation fromChina’s natural gas promotion objective.
The substitution of natural gas for coal has been treated as an important way toreduce local and regional air pollutions and to improve living standards in China. Asthe price of natural gas is higher than that of coal, a widespread switch from coal to gasmay require a subsidy. Given China’s primary energy consumption, a $5 billionsubsidy would be needed to achieve a 10% of natural gas contribution in 2020. Thismay not be viable unless the government has a new revenue source. Carbon taxes orrevenue from the sale of emission permits may provide such a source.
In the integrated policy scheme proposed and simulated in this study, part of thecarbon revenue from the CO2 cap is used to subsidize natural gas consumption. In thisway, both the climate objective and the natural gas promotion objective can beachieved. The integrated policy reduces the relative price of natural gas use for con-sumers and increases the cost of coal use, promoting the substitution of natural gas forcoal while still meeting the climate policy objective. Compared to the cap-and-trade
The Future of Natural Gas in China
1650012-27
Clim
. Cha
nge
Eco
n. 2
016.
07. D
ownl
oade
d fr
om w
ww
.wor
ldsc
ient
ific
.com
by M
ASS
AC
HU
SET
S IN
STIT
UT
E O
F T
EC
HN
OL
OG
Y (
MIT
) on
11/
21/1
6. F
or p
erso
nal u
se o
nly.

only case, there is a modest (0.5%) welfare loss in 2030 associated with the integratedpolicy approach; however, it leads to a further reduction in NOx emissions by 2.3% andSO2 emissions by 2.6% in 2030.
As the integrated policy scheme results in a substantial increase in a use of naturalgas in power and heat generation, and these generation units are mostly located in themost-populated Eastern areas of China, then, most likely, the effects of air pollutionreduction would be more substantial in these areas. An assessment of the geographicdistribution of air pollution and the resulting health impacts requires more spatiallyresolved tools. Further research calls for a broader integrated assessment frameworkconsisting of an atmospheric chemistry model and an energy and economic model withhealth effects. The economy-wide model used in our study is a useful tool, as pol-icymakers should be aware of the challenges in meeting the stated (and sometimescontradictory) objectives and inter-linkages of the actions towards the energy sector.
Acknowledgments
The authors are thankful to Jamie Bartholomay, Elena Kalinina and two anonymousreviewers for their valuable contributions. The Joint Program on the Science andPolicy of Global Change is funded by a consortium of Federal awards and industrialand foundation sponsors (for the complete list see: http://globalchange.mit.edu/spon-sors/all). Support from the U.S. Federal Government in the past three years wasreceived from the U.S. Department of Energy, Office of Science under grants DE-FG02-94ER61937, DE-SC0007114, DE-FG02-08ER64597; the U.S. Department ofEnergy, Oak Ridge National Laboratory under subcontract 4000109855; the U.S.Department of Agriculture under grant 58-6000-2-0099; the U.S. Energy InformationAdministration under grant DE-EI0001908; the U.S. Environmental ProtectionAgency under grants XA-83505101-0, XA-83600001-1, and RD-83427901-0; theU.S. Federal Aviation Administration under agreement 09-C-NE-MIT; the U.S.National Aeronautics and Space Administration under grants NNX13AH91A,NNX11AN72G, and sub-awards 4103-60255 and 4103-30368; the U.S. NationalRenewable Energy Laboratory under grant UGA-0-41029-15; the U.S. NationalScience Foundation under grants OCE-1434007, IIS-1028163, EF-1137306, AGS-1216707, ARC-1203526, AGS-1339264, AGS-0944121, and sub-awards UTA08.950and 1211086Z1; the U.S. Department of Transportation under grant DTRT57-10-C-10015; and the U.S. Department of Commerce, National Oceanic and AtmosphericAdministration under grant NA13OAR4310084.
References
BJX News (2015). Grid-connected solar capacity operated by State Grid Corporation of Chinareaches 32.8GW by October 2015. BJX.com. Available at: http://guangfu.bjx.com.cn/news/20151124/684447.shtml.
BP (2014). Statistical Review of world Energy 2014. BP plc, London, UK.
D. Zhang & S. Paltsev
1650012-28
Clim
. Cha
nge
Eco
n. 2
016.
07. D
ownl
oade
d fr
om w
ww
.wor
ldsc
ient
ific
.com
by M
ASS
AC
HU
SET
S IN
STIT
UT
E O
F T
EC
HN
OL
OG
Y (
MIT
) on
11/
21/1
6. F
or p
erso
nal u
se o
nly.
BP (2015). Statistical Review of world Energy 2015. BP plc, London, UK.Cai, H, M Wang, A Elgowainy and J Han (2012). Updated greenhouse gas and criteria air
pollutant emission factors and their probability distribution functions for electric generatingunits. Argonne National Laboratory ANL/ESD/12-2.
China Electricity Council (CEC) (2015). Power industry profiles of China in 2014. CECwebsite. Available at: http://www.cec.org.cn/guihuayutongji/gongxufenxi/dianliyunxing-jiankuang/2015-12-17/146909.html.
Chai, Q and X Zhang (2010). Technologies and policies for the transition to a sustainableenergy system in China. Energy, 35(10), 3995–4002.
Chen, H, S Paltsev, J Reilly, J Morris and M Babiker (2015). The MIT EPPA6 model: Eco-nomic growth, energy use, and food consumption. MIT Joint Program on the Science andPolicy of Global Change Report 278. Available at: http://globalchange.mit.edu/files/docu-ment/MITJPSPGC Rpt278.pdf.
Chen, J and G Chen (2012). Analysis on operation cost of 9F gas–steam combined cycle powerplants in power plants in Jiangsu province. Electric Power Construction, 33(8), 99–102.
Chen, Y, A Ebenstein, M Greenstone and H Li (2013). Evidence on the impact of sustainedexposure to air pollution on life expectancy from China’s Huai River Policy. Proceedings ofthe National Academy of Sciences United States of America, 110(32), 12936–12941.
China National Renewable Energy Centre (CNREC) (2015). Renewable Energy 2015.Available at: http://www.cnrec.org.cn/cbw/zh/2015-10-23-488.html.
CQCOAL News (2015). Bohai-rim steam-coal price drops to lowest point. CQCOAL.COM.Available at: http://news.cqcoal.com:9080/a/xinwenzixun/benwangkuaixun/2015/0930/58335.html.
Davidson, M, D Zhang, W Xiong, X Zhang and V Karplus (2016). Modelling the potential forwind energy integration on China’s coal-heavy electricity grid. Nature Energy, 1, 16086.
U.S. Energy Information Administration (EIA) (1999). Natural gas 1998: Issues andtrends. Available at: http://www.eia.gov/pub/oil gas/natural gas/analysis publications/nat-ural gas 1998 issues trends/pdf/it98.pdf.
U.S. Energy Information Administration (EIA) (2010). Annual energy outlook 2010 earlyrelease.
Environmental Protection Agency (EPA) (1995). Compilation of air pollutant emission factors.Available at: https://www3.epa.gov/ttn/chief/ap42/index.html.
Environmental Protection Agency (EPA) (2014). Air quality index: A guide to air quality andyour health. U.S. EPA Report EPA-456/F-14-002.
Environmental Protection Agency (EPA) (2015). The social cost of carbon. EPA fact sheet.Available at: https://www3.epa.gov/climatechange/Downloads/EPAactivities/social-cost-carbon.pdf.
He, K, H Huo and Q Zhang (2002). Urban air pollution in China: Current status, character-istics, and progress. Annual Review of Energy and the Environment, 27, 397–431.
HTAP (2013). Hemispheric Transport Air Pollution version 2 dataset, Joint Research Centre,European Commission. Available at: http://edgar.jrc.ec.europa.eu/htap v2/index.php?SECURE¼123.
Huang, J, X Wang and T Xu (2008). Economic evaluation and influence factors analysis onbiomass combustion for power generation. Renewable Energy Resources, 26(2), 95–99.
Huang, W (2012). Feasibility analysis of DB power plant. Master’s thesis, South China Uni-versity of Technology, China, Guangzhou.
Huo, Q, T Zhou, X Yang, J Li and Z Xiao (2015). Association analysis of economy andsecurity of AP1000 nuclear power technology. Huadian Technology, 37(5), 1–3.
The Future of Natural Gas in China
1650012-29
Clim
. Cha
nge
Eco
n. 2
016.
07. D
ownl
oade
d fr
om w
ww
.wor
ldsc
ient
ific
.com
by M
ASS
AC
HU
SET
S IN
STIT
UT
E O
F T
EC
HN
OL
OG
Y (
MIT
) on
11/
21/1
6. F
or p
erso
nal u
se o
nly.
International Energy Agency (IEA) (2012). World energy outlook. IEA/OECD, Paris, France.International Energy Agency (IEA) (2015). Special data release with revisions for People’s
Republic of China, IEA official website Available at: http://www.iea.org/publications/free-publications/publication/SpecialdatareleasewithrevisionsforPeoplesRepublicofChina04.11.2015.pdf.
International Monetary Fund (IMF) (2015). World economic outlook database.Kan, H, R Chen and S Tong (2012). Ambient air pollution, climate change, and population
health in China. Environment International, 42, 10–19.Lan, L (2014). Analysis of characteristics and economic for new energy power generation. PhD
thesis, North China Electric Power University, China, Beijing.Li, P (2012). The CO2 emission control based on IGCC system and economic evaluation
research. Master’s thesis, North China Electric Power University, China, Beijing.Li, Y (2010). Analysis of economy characteristics and improvement ways for Chinese nuclear
power. Nuclear Power Engineering, 31(3), 132–135.Liao, J (2015). Energy consumption analysis and economic benefit evaluation of CO2 capture
system of NGCC power plant. Master’s thesis, Beijing Jiaotong University, China, Beijing.Matus, K, K Nam, N Selin, L Lamsal, J Reilly and S Paltsev (2012). Health damages from air
pollution in China. Global Environmental Change, 2, 55–66.MIT Joint Program (2014). 2014 Energy and Climate Outlook. MIT Joint Program on the
Science and Policy of Global Change, Cambridge, MA. Available at: http://globalchange.mit.edu/Outlook2014.
Ministry of Finance (MOF) (2007). Opinions on Subsidizing the Development and Utilizationof Coal-Bed Methane, Ministry of Finance. Available at: http://jjs.mof.gov.cn/zhengwux-inxi/zhengcefagui/201110/t20111026 602044.html.
Ministry of Finance (MOF), General Administration of Customs of China (GACC) and Ad-ministration of Taxation (AOT) (2011). Notice on the Adjustment of the Import Value-AddedTax on Imported Natural Gas (2011–2020). Available at: http://www.chinatax.gov.cn/n810341/n810765/n812156/n812474/c1186477/content.html.
Morris, J, J Reilly and H Chen (2014). Advanced technologies in energy-economy models forclimate change assessment. MIT Joint Program on the Science and Policy of Global ChangeReport 272. Available at: http://globalchange.mit.edu/files/document/MITJPSPGC Rpt272.pdf.
Nam, K-M, C Waugh, S Paltsev, J Reilly and V Karplus (2013). Carbon co-benefits of tighterSO2 and NOx regulations in China. Global Environmental Change, 23(6), 1648–1661.
Nam, K-M, C Waugh, S Paltsev, J Reilly and V Karplus (2014). Synergy between pollution andcarbon emissions control: Comparing China and the United States. Energy Economics, 46,186–201.
Narayanan, B, A Aguiar and R McDougall (2012). Global Trade, Assistance, and Production:The GTAP 8 Data Base. Purdue University: Center for Global Trade Analysis.
National Bureau of Statistics of the People’s Republic of China (NBS) (2014). China EnergyStatistical Yearbook 2013. Beijing: NBS.
National Bureau of Statistics of the People’s Republic of China (NBS) (2015a). China EnergyStatistical Yearbook 2014. Beijing: NBS.
National Bureau of Statistics of the People’s Republic of China (NBS) (2015b). OnlineDatabase. Available at: http://data.stats.gov.cn/easyquery.htm?cn¼C01.
National Development and Reform Commission of China (NDRC) (2012). Revised natural gasutilization policy. Available at: http://www.sdpc.gov.cn/zcfb/zcfbl/201210/t20121031511891.html.
D. Zhang & S. Paltsev
1650012-30
Clim
. Cha
nge
Eco
n. 2
016.
07. D
ownl
oade
d fr
om w
ww
.wor
ldsc
ient
ific
.com
by M
ASS
AC
HU
SET
S IN
STIT
UT
E O
F T
EC
HN
OL
OG
Y (
MIT
) on
11/
21/1
6. F
or p
erso
nal u
se o
nly.
National Development and Reform Commission of China (NDRC) (2014). Notice of thenational development and reform commission on regulating on-grid tariffs of natural gas-fired power plants. Available at: http://www.sdpc.gov.cn/gzdt/201501/t20150114 660178.html.
National Development and Reform Commission of China (NDRC) (2015). Enhanced actionson climate change: China’s intended nationally determined contributions. UNFCCC web-site. Available at: http://www4.unfccc.int/submissions/INDC/Published Documents/China/1/China’s INDC — on 30 June 2015.pdf.
National Energy Agency of China (NEA) (2014). Costs of electricity generation project 2011–2012. Available at: http://www.nea.gov.cn/2014-05/30/c 133372232.htm.
National Energy Agency of China (NEA) (2015). National energy agency: Reviews of China’senergy market for the first half of year 2015. NEAwebsite. Available at: http://www.nea.gov.cn/2015-07/27/c 134450600.htm.
Natural Resources Defense Council (NRDC) (2015). From Copenhagen accord to climateaction: Tracking national commitments to curb global warming. NRDC website. Availableat: http://www.nrdc.org/international/copenhagenaccords/.
Octaviano, C, S Paltsev and A Gurgel (2016). Climate change policy in Brazil and Mexico:Results from the MIT EPPA model. Energy Economics, 56, 600–614.
Paltsev, S, J Reilly, H Jacoby, R Eckaus, J McFarland and M Babiker (2005). The MITemissions prediction and policy analysis (EPPA) model: Version 4. MIT Joint Program onthe Science and Policy of Global Change Report 125, p. 72. Available at: http://glo-balchange.mit.edu/files/document/MITJPSPGC Rpt125.pdf.
Paltsev, S and D Zhang (2015a). Natural gas pricing reform in China: Getting closer to a marketsystem? Energy Policy, 86, 43–56.
Paltsev, S and D Zhang (2015b). The future of nuclear power in China: Long-term scenarios,global 2015. 21st International Conference: Nuclear Fuel Cycle for a Low-Carbon Future,Paris, France, Available at: https://www.conftool.pro/global2015papers/index.php?page=b-rowse Sessions&form session=1.
Paltsev, S and P Capros (2013). Cost concepts for climate change mitigation. Climate ChangeEconomics, 4, 1340003–1340028.
Paltsev, S, J Morris, Y Cai, VJ Karplus and H Jacoby (2012). The role of China in mitigatingclimate change. Energy Economics, 34, S444–S450.
Reilly, J, S Paltsev, E Monier, H Chen, A Sokolov, J Huang, Q Ejaz, J Scott, J Morris andA Schlosser (2015). Energy & Climate Outlook: Perspective from 2015. MIT Joint Programon the Science and Policy of Global Change. Available at: http://globalchange.mit.edu/Outlook2015.
Rohde, R and M Muller (2015). Air pollution in China: Mapping of concentration and sources.PLoS ONE, 10(8), e0135749.
State Grid Corporation of China (SGCC) (2015). China’s installed nuclear capacity will reach30GW by the end of 2015. SGCC website. Available at: http://www.sgcc.com.cn/xwzx/nyzx/2015/05/325945.shtml.
Shanghai Municipal Development and Reform Commission (SHDRC) (2015). Notice of theShang municipal development and reform commission on adjusting natural gas price fornon-residential users. Available at: http://www.shdrc.gov.cn/searchresult detail.jsp?mainartid¼26845&keyword¼%CC%EC% C8%BB%C6%F8.
State Council of China (2013). 12th five-year plan for energy development. Available at: http://www.nea.gov.cn/2013-01/28/c 132132808.htm.
The Future of Natural Gas in China
1650012-31
Clim
. Cha
nge
Eco
n. 2
016.
07. D
ownl
oade
d fr
om w
ww
.wor
ldsc
ient
ific
.com
by M
ASS
AC
HU
SET
S IN
STIT
UT
E O
F T
EC
HN
OL
OG
Y (
MIT
) on
11/
21/1
6. F
or p
erso
nal u
se o
nly.

State Council of China (2014). Energy development strategy action plan (2014–2020).Available at: http://www.gov.cn/zhengce/content/2014-11/19/content 9222.htm.
Sun, H and F Ning (2014). Introduction to gas–steam combined cycle. Urban ConstructionTheory Research, 22(4), 2014A4686 (in Mandarin).
The White House (2015). US-China joint presidential statement on climate change. Availableat: https://www.whitehouse.gov/the-press-office/2015/09/25/us-china-joint-presidential-sta-tement-climate-change.
Urumqi Customs District of China (2011). Gas import increases in volume and price at Xin-jiang port during the first ten months of 2011. Urumqi Customs Website. Available at: http://www.customs.gov.cn/publish/portal166/tab61950/info342624.htm.
Urumqi Customs District of China (2015). Gas import increases in volume but decreases inprice at Xinjiang port during the first ten months of 2015. Urumqi Customs Website.Available at: http://www.customs.gov.cn/publish/portal166/tab61950/info778969.htm.
US Forex (2015). Historical exchange rates. Available at: http://www.usforex.com/forex-tools/historical-rate-tools/yearly-average-rates.
Wang, Q and X Cheng (2015). Energy policies for managing China’s carbon emission.Renewable and Sustainable Energy Reviews, 20, 470–479.
Xinhua News (2015). Energy officials say China is undertaking energy market reform duringthe 13th five-year plan period. Xinhuanet.com. Available at: http://news.xinhuanet.com/fortune/2015-10/27/c 128364246.htm.
Yang, G, Y Wang, Y Zeng, G Gao, X Liang et al. (2013). Rapid health transition in China,990–2010: Findings from the Global Burden of Disease Study 2010. Lancet, 381, 1987–2015.
Zhang, X, V Karplus, T Qi, D Zhang and J He (2016). Carbon emissions in China: How far cannew efforts bend the curve? Energy Economics, 54, 388–395.
Zhou, Y, F Hao, W Meng and J Fu (2014). Scenario analysis of energy-based low-carbondevelopment in China. Journal of Environmental Science, 26, 1631–1640.
D. Zhang & S. Paltsev
1650012-32
Clim
. Cha
nge
Eco
n. 2
016.
07. D
ownl
oade
d fr
om w
ww
.wor
ldsc
ient
ific
.com
by M
ASS
AC
HU
SET
S IN
STIT
UT
E O
F T
EC
HN
OL
OG
Y (
MIT
) on
11/
21/1
6. F
or p
erso
nal u
se o
nly.