Embed Size (px)
Citation preview
Institute for Higher Education Policy
DECEMBER 2006
The Future of Private Loans: Who Is Borrowing, and Why?
The Institute for Higher Education Policy is an independent, nonprofi t organization that is dedicated to access and success in postsecondary education around the world. Established in 1993, the Washington, D.C.-based organization uses unique research andinnovative programs to inform key decision makers who shape public policy and support economic and social development. The Institute’s Web site, www.ihep.org, features an expansive collection of higher education information available free of charge and provides access to some of the most respected professionals in the fi elds of public policy and research.
Institute for Higher Education Policy
1320 19th Street, NW, Suite 400, Washington, DC 20036Phone: (202) 861-8223 • Facsimile: (202) 861-9307 • Internet: www.ihep.org
The Future of Private Loans: Who Is Borrowing, and Why?
A REPORT BY:The Institute for Higher Education Policy
SUPPORTED BY:The Pew Charitable Trusts
DECEMBER 2006


The Future of Private Loans: Who Is Borrowing, and Why? i
Acknowledgments
The primary author of this report is Courtney McSwain, with the assistance of Derek Price and Alisa Cunningham. In addition, many members of the Institute staff contributed advice, editorial comment, and data support, including Tom Parker, Jodie Clark, Lan Gao, Ryan
Hahn, Tia T. Gordon, and Jamie Merisotis. In addition, Tobi Walker and Pauline Abernathy of The Pew Charitable Trusts, Bob Shireman of The Institute for College Access and Success, and Sandy Baum of the College Board provided valuable input. The Institute would like to thank the various members of the student loan, fi nancial aid, and policy communities who were willing to be interviewed for this report.
The Institute also would like to thank The Pew Charitable Trusts for its generous funding of this project. The Pew Charitable Trusts (www.pewtrusts.org) serves the public interest by providing information, advancing policy solutions and supporting civic life. Based in Philadelphia, with an offi ce in Washington, D.C., the Trusts will invest $248 million in fi scal year 2007 to provide organizations and citizens with fact-based research and practical solutions for challenging issues.
The opinions expressed in this report are those of the author(s) and do not necessarily refl ect the views of The Pew Charitable Trusts.

The Future of Private Loans: Who Is Borrowing, and Why? iii
Private loans are those that exist outside of the federal student loan system and are not guaranteed by the federal government. These loans may be provided by banks, nonprofi t agencies, or other fi nancial institutions. The increasing signifi cance of private loans can be seen in their vast growth: currently the yearly growth rate of private loans is outpacing that of federal loans. In 2005–06, federal loan volume equaled nearly $69 billion, and private loan volume was slightly more than $16 billion. However, looking at the growth rate of student loans from 2003 through 2008, some project that annually, federal Stafford loans will grow by only 8 percent, whereas private loans will grow by 25 percent. Further, some speculate that in the right economic conditions, private loan volume could exceed federal subsidized Stafford loans by the end of the decade. Predictions such as these rely on many assumptions about future economic conditions, interest rates, and policy environments. Changes to these environments could substantially change the use of private loans.
The growth in the use of private loans has not developed without expressed concern, especially over the marketing of these funds to students who may not have full knowledge about their distinctions from federal aid. Recently a complaint was fi led by a student advocacy group against a leading private loan lender for what the group called “false and deceptive” advertising. Further, the economic hardships of students who did not fully understand the impact that private loans would have on their overall debt have been highlighted in the media. These accounts have underscored the tension that exists between the growing use of private loans and concerns over the impact their growth is having on students.
With the many perspectives on the importance and appropriateness of private loan borrowing, this report aims to inform the current debate on private loan borrowing by examining who is using these funds as well as why students may turn to private borrowing to pay for college. This report draws on fi nancial aid data from the U.S. Department of Education’s 2004 National Postsecondary Student Aid Study (NPSAS) and information gathered through in-depth interviews with loan executives, aid administrators, and other
Executive Summary
The student fi nancial aid landscape today includes many options for fi nancing postsecondary education, including government grants and loans, institutional aid, private scholarships, and private loans. For many students facing high education prices, loans have become an essential part of fi nancing postsecondary education. Although student lending is by far
dominated by federal loans, private loans are becoming increasingly important.
Not everyone receives perfect information about fi nancial aid and low-income stu-dents are among those most misinformed about the fi nancial aid process overall.
The Future of Private Loans: Who Is Borrowing, and Why?iv
loan policy experts. Further, expert insights enhance the discussion of the growth of the private loan industry and developing trends.
Predictions about the future of private loans are diffi cult to make. While there are some exceptions, it is clear that students using private loans are largely doing so to supplement other fi nancial aid. Further, most experts agree that a signifi cant proportion of students will continue to turn to the private market as long as there is a continuing gap between what students are able to secure through traditional aid programs and the education costs they face. Whether the record growth that private loans have experienced will be sustained in the coming years depends on a variety of factors, including possible legislative changes made to federal student loan policies, general economic and interest rate environments, the conditions of the student loan securitization market, and the development of changing marketing strategies and competition.
Understanding the demographics of private loan borrowers and the developing trends within the private loan industry is important for the broader policy debate on student fi nancing in higher education. Given that the private loan industry is expected to become more dominated by direct-to-consumer marketing, students will be faced with increasingly complex decisions about funding their postsecondary education and how to fi ll any remaining need. Not everyone receives perfect information about fi nancial aid, and low-income students are among those most misinformed about the fi nancial aid process overall. Thus the need for targeted outreach to these students to ensure they are receiving comprehensive information about the pros and cons of private loan borrowing is critical. Further, the implication of relying on private funding to fi ll remaining need for these students constitutes an important point of discussion for education leaders and policymakers alike.
The Future of Private Loans: Who Is Borrowing, and Why? v
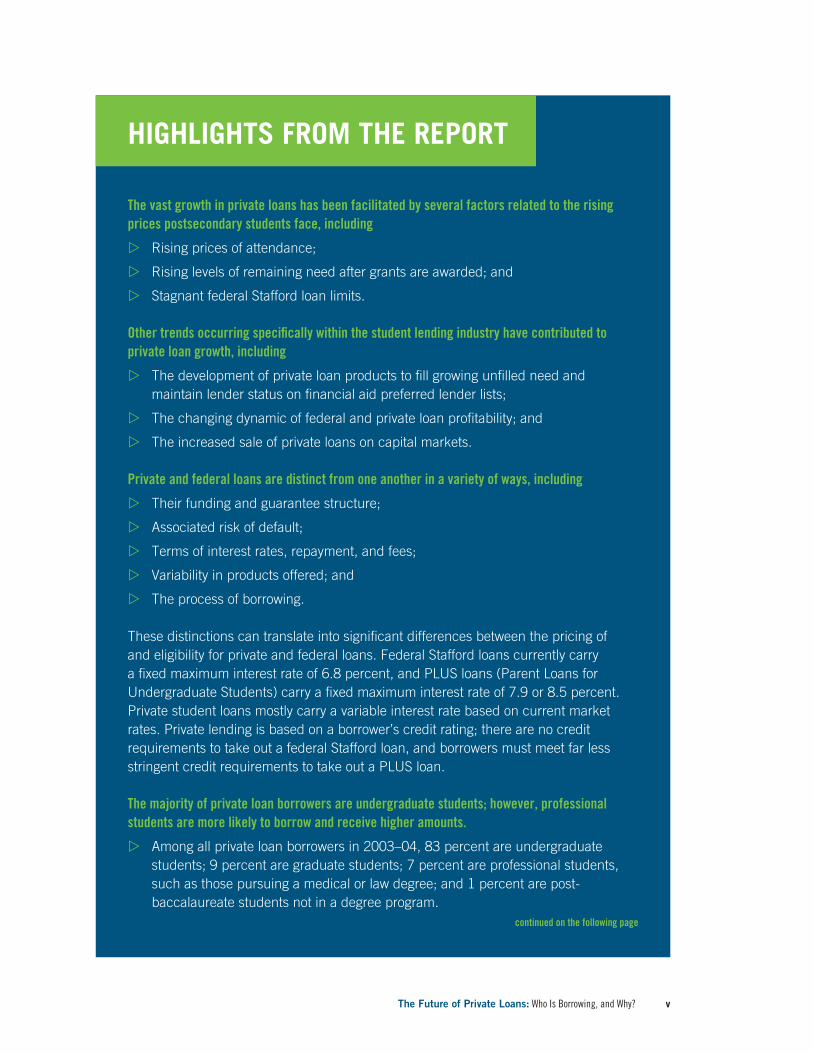
The vast growth in private loans has been facilitated by several factors related to the rising prices postsecondary students face, including
� Rising prices of attendance;
� Rising levels of remaining need after grants are awarded; and
� Stagnant federal Stafford loan limits.
Other trends occurring specifi cally within the student lending industry have contributed to private loan growth, including
� The development of private loan products to fi ll growing unfi lled need and maintain lender status on fi nancial aid preferred lender lists;
� The changing dynamic of federal and private loan profi tability; and
� The increased sale of private loans on capital markets.
Private and federal loans are distinct from one another in a variety of ways, including
� Their funding and guarantee structure;
� Associated risk of default;
� Terms of interest rates, repayment, and fees;
� Variability in products offered; and
� The process of borrowing.
These distinctions can translate into signifi cant differences between the pricing of and eligibility for private and federal loans. Federal Stafford loans currently carry a fi xed maximum interest rate of 6.8 percent, and PLUS loans (Parent Loans for Undergraduate Students) carry a fi xed maximum interest rate of 7.9 or 8.5 percent. Private student loans mostly carry a variable interest rate based on current market rates. Private lending is based on a borrower’s credit rating; there are no credit requirements to take out a federal Stafford loan, and borrowers must meet far less stringent credit requirements to take out a PLUS loan.
The majority of private loan borrowers are undergraduate students; however, professional students are more likely to borrow and receive higher amounts.
� Among all private loan borrowers in 2003–04, 83 percent are undergraduate students; 9 percent are graduate students; 7 percent are professional students, such as those pursuing a medical or law degree; and 1 percent are post-baccalaureate students not in a degree program.
HIGHLIGHTS FROM THE REPORT
continued on the following page
The Future of Private Loans: Who Is Borrowing, and Why?vi
� However, professional students are much more likely than undergraduate or graduate students to take out a private loan. Nearly a quarter of all professional students take out a private loan, compared with 5 percent each of all undergraduate and all graduate students.
� Private loan borrowing among undergraduates varies between dependent and independent students. Seven percent of dependent students, typically those under 24, took out private loans with an average amount of $6,350. Three percent of independent students, those who are 24 and older or meet other criteria for fi nancial independence, took out private loans with an average amount of $5,054.
Reasons students may turn to private loans include
� To meet higher prices and fi ll gaps of remaining need. At all student levels, private loan borrowers in 2003–04 faced greater prices and net prices (the price of attendance after grants and all federal need-based aid were awarded) and were left with greater levels of remaining need on average than were nonborrowers.
� To afford enrollment at private institutions. The relatively higher prices borrowers faced on average were likely driven by the greater proportions of borrowers who attended private institutions. A greater percentage of dependent undergraduates and post-baccalaureate borrowers attended private not-for-profi t institutions, while a greater proportion of independent undergraduate borrowers attended private for-profi t institutions than their nonborrowing counterparts.
� To attend more classes throughout the year and work less while enrolled. Among dependent and independent undergraduates, as well as graduate students, more private loan borrowers attended classes full-time and throughout the year than did nonborrowers. Further, for independent undergraduate and graduate students, fewer borrowers worked full-time while enrolled compared with their nonborrowing counterparts, suggesting some trade-offs between borrowing more and working less.
Students who borrow private loans are mostly doing so in conjunction with federal Stafford loans; however, some students do not take out the maximum Stafford or receive a Stafford at all.
� Eighty percent of dependent undergraduate private borrowers and 76 percent of independent undergraduate private borrowers in 2003–04 also received a federal Stafford loan. Further, of those who received a Stafford loan, 82 percent of dependent private borrowers and 53 percent of independent private borrowers received the maximum Stafford loan.
� Ninety percent of professional private borrowers received a federal Stafford loan in 2003–04, as did nearly three-quarters of graduate students. Further, of those who did received a Stafford loan, 90 percent of professional students and 63 percent of graduate students received the maximum amount.
HIGHLIGHTS FROM THE REPORT (continued)
continued on the following page
The Future of Private Loans: Who Is Borrowing, and Why? vii
� Still, it is troubling that a substantial proportion of private borrowers had not obtained or maximized federal loans.
Students who borrow privately but do not take out federal loans may do so because
� Private loans may offer those with the best credit histories or a cosigner an initially low interest rate. However, because most private loan interest rates are variable, an initially low interest rate may increase over the life of a student’s loan.
� Private loans are available for those who may not qualify for federal Stafford loans, either because they have exhausted cumulative loan limits or are studying less than half-time (fewer than six credit hours per semester).
� Students may perceive private loans to be more convenient because of the ability to apply for private loans on-line without fi lling out a Free Application for Federal Student Aid (FAFSA) or using one source for all borrowing. This perception could also refl ect a lack of awareness some students have about federal loan options.
It is important for students to be aware of the trade-offs or potential costs of taking out a private loan, and for those who are independent or low income, these costs may be particularly severe.
� Private loan lenders base pricing and eligibility on the credit ratings and the possible risk that a student will default, or not pay back a loan. If eligible for a private loan, a student with a low credit rating will be considered a higher risk, and thus will likely be charged a substantially higher interest rate than would a student with a high credit rating or one who can obtain a cosigner.
� Private loans come with limited options for repayment relief. Private consolidation products are available; however, there are myriad requirements to receive the best prices.
� Consumer education is key to helping students determine if the benefi ts outweigh the costs in private borrowing.
HIGHLIGHTS FROM THE REPORT (continued)

Table of Contents List of fi gures ...........................................................................................................x
Introduction ............................................................................................................ 1
What are private loans? ............................................................................................ 5
What has facilitated the growth in private loans? ....................................................... 13
Why do students use private loans? ......................................................................... 15
What is the future of private loans within the student lending industry? ...................... 31
Conclusion ............................................................................................................ 33
References ............................................................................................................ 35

The Future of Private Loans: Who Is Borrowing, and Why?x
List of FiguresFigure 1: Private and federal student loan volume, 1995–96 and 2005–06
Figure 2: Comparison of federal Stafford, federal PLUS, and private loans
Figure 3: Annual and aggregate limits for subsidized and unsubsidized federal Stafford loans
Figure 4: Percentage of students borrowing private loans in 1999–2000 and 2003–04, by student level
Figure 5: Average private loan amount borrowed by undergraduate students in 1999–2000 and 2003–04 in constant (2003–04) dollars
Figure 6: Selected characteristics of dependent undergraduate private loan borrowers and nonborrowers in 2003–04
Figure 7: Selected characteristics of independent undergraduate private loan borrowers and nonborrowers in 2003–04
Figure 8: Average price of attendance for undergraduate students in 2003–04, by private loan borrower status and dependency
Figure 9: Average net price for undergraduate students in 2003–04, by private loan borrower status and dependency
Figure 10: Percentage of dependent undergraduate students borrowing private loans in 2003–04, by net price
Figure 11: Percentage of independent undergraduate students borrowing private loans in 2003–04, by net price
Figure 12: Average remaining need for undergraduate students in 2003–04, by private loan borrower status and dependency
Figure 13: Percentage of dependent undergraduate students borrowing private loans in 2003–04, by remaining need
Figure 14: Percentage of independent undergraduate students borrowing private loans in 2003–04, by remaining need
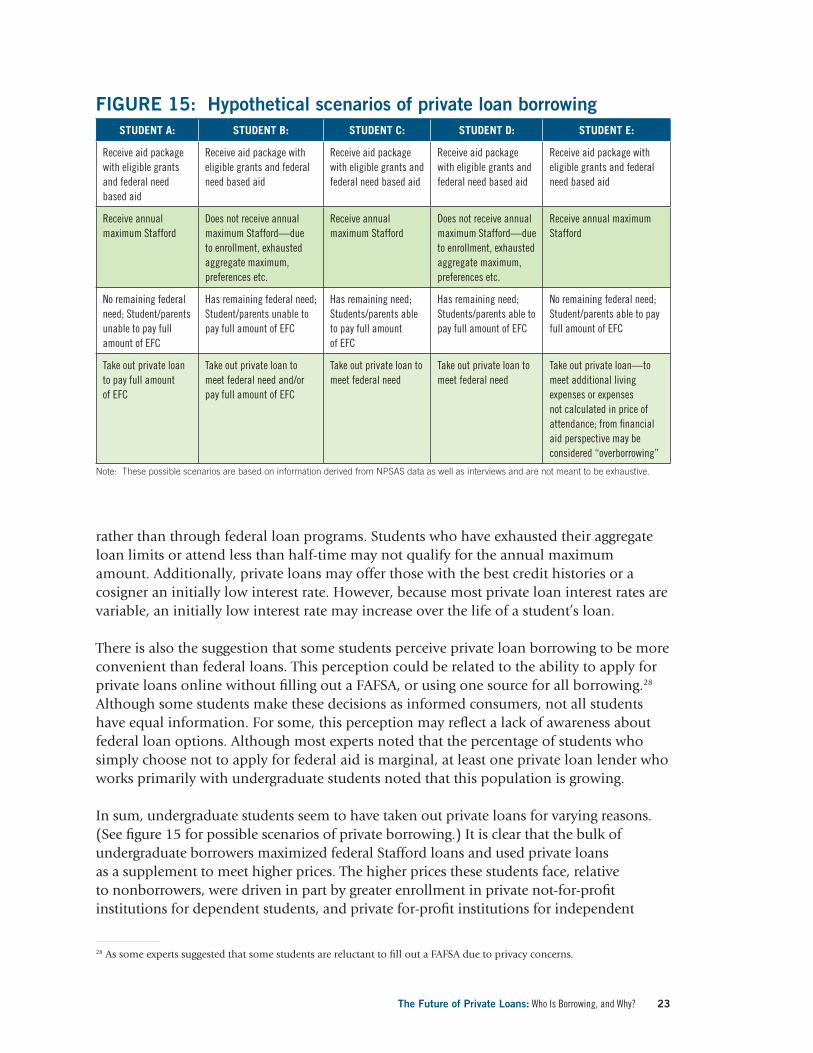
Figure 15: Hypothetical scenarios of private loan borrowing
Figure 16: Selected characteristics of professional degree private loan borrowers and nonborrowers in 2003–04
Figure 17: Selected characteristics of graduate degree private loan borrowers and nonborrowers 2003–04
Figure 18: Average price of attendance for graduate and professional degree students in 2003–04, by private loan borrower status
Figure 19: Average net price for graduate and professional degree students in 2003–04, by private loan borrower status
Figure 20: Average remaining need for graduate and professional degree students in 2003–04, by private loan borrower status
The Future of Private Loans: Who Is Borrowing, and Why? 1
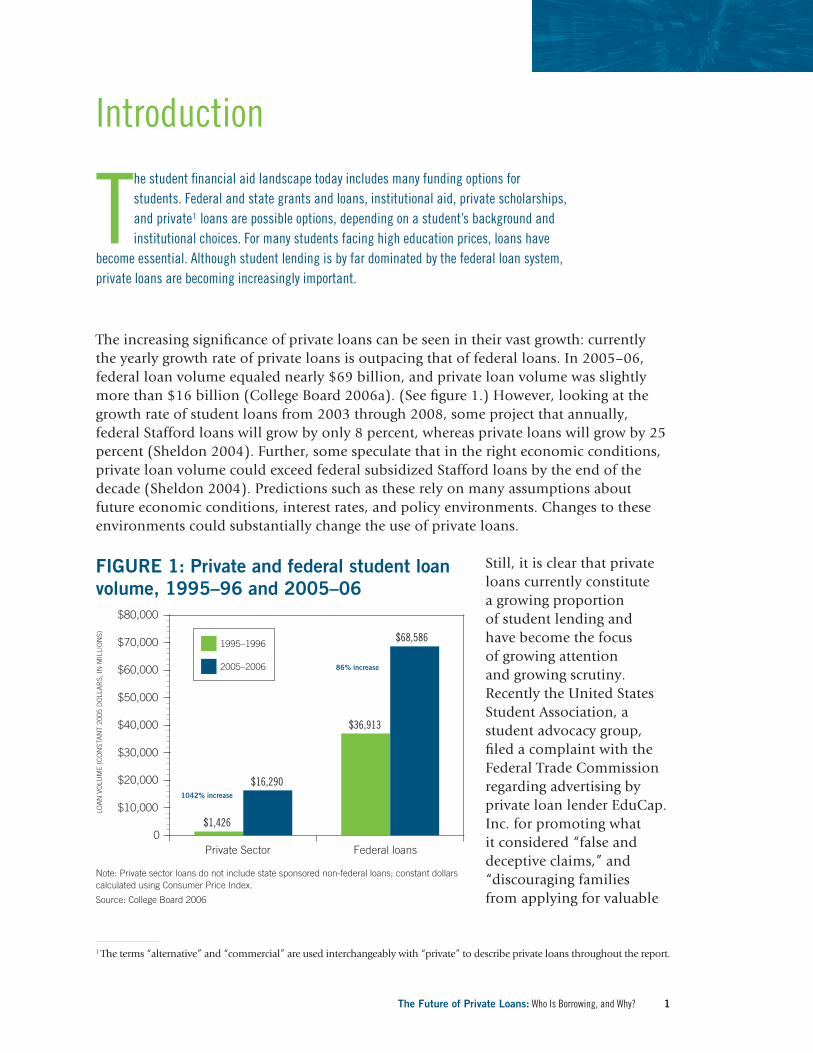
The increasing signifi cance of private loans can be seen in their vast growth: currently the yearly growth rate of private loans is outpacing that of federal loans. In 2005–06, federal loan volume equaled nearly $69 billion, and private loan volume was slightly more than $16 billion (College Board 2006a). (See fi gure 1.) However, looking at the growth rate of student loans from 2003 through 2008, some project that annually, federal Stafford loans will grow by only 8 percent, whereas private loans will grow by 25 percent (Sheldon 2004). Further, some speculate that in the right economic conditions, private loan volume could exceed federal subsidized Stafford loans by the end of the decade (Sheldon 2004). Predictions such as these rely on many assumptions about future economic conditions, interest rates, and policy environments. Changes to these environments could substantially change the use of private loans.
Still, it is clear that private loans currently constitute a growing proportion of student lending and have become the focus of growing attention and growing scrutiny. Recently the United States Student Association, a student advocacy group, fi led a complaint with the Federal Trade Commission regarding advertising by private loan lender EduCap. Inc. for promoting what it considered “false and deceptive claims,” and “discouraging families from applying for valuable
Introduction
The student fi nancial aid landscape today includes many funding options for students. Federal and state grants and loans, institutional aid, private scholarships, and private1 loans are possible options, depending on a student’s background and institutional choices. For many students facing high education prices, loans have
become essential. Although student lending is by far dominated by the federal loan system, private loans are becoming increasingly important.
Private Sector Federal loans0
$10,000
$20,000
$30,000
$40,000
$50,000
$60,000
$70,000
$80,000
$1,426
$16,290
$36,913
$68,5861995–1996
2005–2006
LOA
N V
OLU
ME
(CO
NST
AN
T 20
05 D
OLL
AR
S, IN
MIL
LIO
NS)
86% increase
1042% increase
FIGURE 1: Private and federal student loan volume, 1995–96 and 2005–06
Note: Private sector loans do not include state sponsored non-federal loans; constant dollars calculated using Consumer Price Index.
Source: College Board 2006
1 The terms “alternative” and “commercial” are used interchangeably with “private” to describe private loans throughout the report.
The Future of Private Loans: Who Is Borrowing, and Why?2
fi nancial aid options,” while “encouraging students and parents to take out high-interest private loans of up to $50,000 per year” (United States Student Association 2006). Additionally, media articles have recently highlighted the signifi cant hardship that has burdened some private loan borrowers who were unaware of the differences between private and federal loans, especially the impact that private loans’ variable interest rates would have on a student’s overall debt (Block 2006; Sturrock 2006). These accounts and others underscore the tension that exists between the growing use of private loans and concerns over the impact their growth is having on students.
With the many perspectives on the importance and appropriateness of private loan borrowing, this report aims to inform the current debate on private loan borrowing by examining who is using these funds as well as why students turn to private borrowing to pay for college. Currently, we know that 83 percent of private loan borrowers are undergraduate students, 9 percent are graduate students, 7 percent are professional students, 2 and 1 percent are post-baccalaureate students not in a degree program. This is largely because undergraduates make up the bulk of the student population overall. However, those most likely to borrow private loans are those seeking a professional degree. Of all professional students, nearly a quarter borrow private loans, compared with 5 percent each of all undergraduate and all graduate students. Professional students also borrow more on average, nearly $11,000 a year, compared with undergraduates, who borrow about $6,000, and graduate students, who borrow more than $8,000.
Generally, much of the literature written about private loans points to rising higher education costs and low federal loan limits as the main drivers of private loan usage—for example, as students attending high-priced institutions are left with remaining need after receiving grants and loans, they must turn to alternative sources of funding to fi ll that gap. However, other trends occurring within the student lending industry have also facilitated the growth of private loans. To understand some of the reasons for the extensive development that has taken place, this report explores the private loan industry and specifi c groups of students who borrow private loans (see box 1 for sources and methodology).
In the sections that follow, the private loan industry and characteristics of private loan borrowers are explored. The second section identifi es distinctions between private and federal loans, and the subsequent section looks closely at the factors that have facilitated the vast growth in private loan volume. In the next section, selected characteristics of private borrowers are discussed, and some of the possible reasons driving students’ borrowing decisions are explored. Finally, a concluding section discusses the future of the private loan market in light of some currently developing trends.
2 “First-professional” and “professional” are used interchangeably throughout the report to refer to students in medical, law, dental, or other schools granting professional degrees.
This report draws on qualitative data gathered during in-depth interviews with industry experts as well as fi nancial aid data collected by the U.S. Department of Education.
Interviews were conducted with industry experts in varying positions, including those who work in lending agencies, directly with lenders, and fi nancial aid offi ces; policy institutions; and other organizations dealing with student lending. Questions asked of each interviewee varied based on his or her individual expertise; however all interviewees were asked questions about the characteristics of private loan borrowers; how private loans operate and developed as an industry; current trends, such as changing marketing strategies; and their opinions on the future of private lending. Although defi nitive conclusions cannot be drawn from these interviews, the discussion in this report identifi es several observations and opinions that were repeated, suggesting areas of agreement.
In addition, data from the U.S. Department of Education’s National Postsecondary Student Aid Study (NPSAS) were analyzed using the online Data Analysis System (DAS).3 The NPSAS survey contains a rich array of data on the use of fi nancial aid and other enrollment characteristics of undergraduate, graduate, and fi rst-professional students. Contained in the survey is a variable on the use of private (alternative) loans that “Indicates the amount of alternative commercial or private loans received by students in 2003–2004” (National Center for Education Statistics [NCES] 2004). The calculated loan amount does not include loans from family or friends. The variable is based mostly on student interviews and therefore may be subject to some estimation error. The most recent survey, completed in 2004, contains information from the 2003–04 academic year. The previous NPSAS survey was completed in 2000, containing information from the 1999–2000 academic year. Some comparisons on growth in borrowing and average amounts borrowed since the previous NPSAS survey are presented.
In presenting data from the NPSAS survey, undergraduate students were analyzed by dependency, and post-baccalaureate students were analyzed by degree program. All analyses were limited to United States citizens and permanent residents. Differences between private loan borrowers and nonborrowers presented in the report are statistically signifi cant at the .05 level unless otherwise noted.
The other main source used for estimates of private loan volume is the College Board’s Trends in Student Aid report. The most recent edition is available for the 2005–06 academic year. The College Board’s Trends in Student Aid series offers data on the volume of fi nancial aid sources including private loans, which were fi rst counted in the academic year 1995–96.
BOX 1: Sources and methodology
3 For further information, see http://nces.ed.gov.
The Future of Private Loans: Who Is Borrowing, and Why? 3
continued on the following page
The Future of Private Loans: Who Is Borrowing, and Why?4
SOURCES AND METHODOLOGY (continued)
Several sources were used to gather supplemental industry information on private loans. Three important sources to note are The Greentree Gazette, Finaid.org, and the annual 10-K reports from select lending agencies.
� The Greentree Gazette is a business magazine for higher education and features interviews, editorials, and historical articles on the student lending market, both federal and private. In addition, each issue offers a directory of lenders and products in its Student Loan Buying Guide.
� Finaid.org is a Web site that offers detailed descriptions of college fi nancing options and advice for students on the use of loans and grants from a variety of sources.
� 10-K forms are fi led annually with the U.S. Securities and Exchange Commission by publicly traded companies. Forms fi led by select student lending companies were reviewed to gather information on company holdings of private loans, profi ts, perceptions of the future of the private loan industry, and other topics.
The Future of Private Loans: Who Is Borrowing, and Why? 5
Private student loans can be broadly defi ned as those funded by commercial fi nancial institutions, offered outside of the federal loan programs, and not guaranteed against default by the federal government. Although private funding of higher education is not new, the private loan market as it exists now, with numerous lenders and myriad products, is still in its infancy. Private loans are offered by a variety of lending institutions, including agencies focused specifi cally on student lending, banks, nonprofi t loan companies, and some state entities that offer their own non-federally guaranteed loan product.5 The SLM Corporation, also known as Sallie Mae, is widely acknowledged as the market leader in student lending, including private loans (SLM Corporation 2005; Thanks to the Banks 2006).
Private loans have been modeled somewhat after federal loans—for example, in the way that they are processed and repaid—and thus share similar characteristics. (See fi gure 2 for a comparison of federal Stafford loans, federal loans under the Parent Loan for Undergraduate Students [PLUS] program, and private loans.) Borrowers of private loans are typically required to provide proof of enrollment; however, this requirement varies among specifi c loan products, and some lenders offer loans for nontraditional education programs (Fitch Ratings 2006a). In most cases borrowers are verifi ed for a certain amount, which may be the lesser of a set dollar amount or the price of attendance minus all aid (Finaid.org 2006a; Fitch Ratings 2006a). Students repaying private and federal loans may be offered comparable incentives for consecutive on-time or electronic payments (Fitch Ratings 2006a). Also, as with federal unsubsidized loans, borrowers may pay the interest that accrues on private loans while they are enrolled, or defer these payments until after graduation.6
What are private loans?
The use of private loans predates the federal student loan program. One of the earliest examples of private student lending was the United States Aid Funds, which made commercial sources available for student borrowing in 1960. Federal student loan programs were established in 1965, and as they expanded through the 1970s,
commercial loans were soon overshadowed. Private loans became more popular in the mid-1980s, particularly among graduate and fi rst-professional students, who presented lower risks of default to lenders. Further, in the mid-1990s, the use of private loans began to increase signifi cantly as college costs continued to rise and interest rates on private loans became more comparable to those on federal student loans.4
4 See Wegmann, Cunningham, and Merisotis (2003) for a detailed history of federal and private loan development.5 The Greentree Gazette provides a comprehensive list of lending agencies offering Federal Family Education Loans (FFEL) and private loans in its Student Loan Buying Guide featured in each issue. For the purposes of this report, nonfederal loans offered by state governments were not included in private loan volume or tabulations.6 When students defer interest payments until after graduation, the interest that has accrued on the loan during enrollment is capitalized, or added to the original loan amount. The total equals a new loan amount, and interest is charged on this new amount during repayment (Finaid.org 2006c). Industry leaders interviewed note that 90 percent or more of borrowers do not pay the interest while enrolled, which signifi cantly increases the amount of principal and interest borrowers pay after fi nishing college.
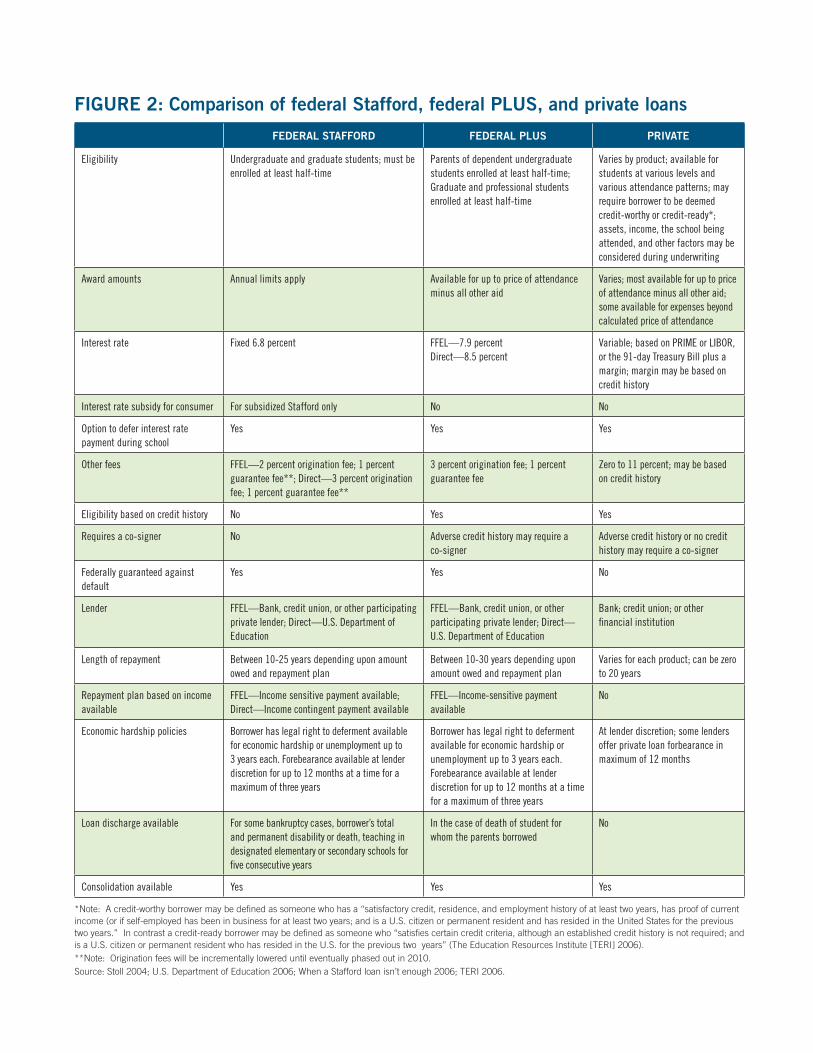
FIGURE 2: Comparison of federal Stafford, federal PLUS, and private loans
FEDERAL STAFFORD FEDERAL PLUS PRIVATE
Eligibility Undergraduate and graduate students; must be enrolled at least half-time
Parents of dependent undergraduate students enrolled at least half-time; Graduate and professional students enrolled at least half-time
Varies by product; available for students at various levels and various attendance patterns; may require borrower to be deemed credit-worthy or credit-ready*; assets, income, the school being attended, and other factors may be considered during underwriting
Award amounts Annual limits apply Available for up to price of attendance minus all other aid
Varies; most available for up to price of attendance minus all other aid; some available for expenses beyond calculated price of attendance
Interest rate Fixed 6.8 percent FFEL—7.9 percentDirect—8.5 percent
Variable; based on PRIME or LIBOR, or the 91-day Treasury Bill plus a margin; margin may be based on credit history
Interest rate subsidy for consumer For subsidized Stafford only No No
Option to defer interest rate payment during school
Yes Yes Yes
Other fees FFEL—2 percent origination fee; 1 percent guarantee fee**; Direct—3 percent origination fee; 1 percent guarantee fee**
3 percent origination fee; 1 percent guarantee fee
Zero to 11 percent; may be based on credit history
Eligibility based on credit history No Yes Yes
Requires a co-signer No Adverse credit history may require a co-signer
Adverse credit history or no credit history may require a co-signer
Federally guaranteed against default
Yes Yes No
Lender FFEL—Bank, credit union, or other participating private lender; Direct—U.S. Department of Education
FFEL—Bank, credit union, or other participating private lender; Direct—U.S. Department of Education
Bank; credit union; or other fi nancial institution
Length of repayment Between 10-25 years depending upon amount owed and repayment plan
Between 10-30 years depending upon amount owed and repayment plan
Varies for each product; can be zero to 20 years
Repayment plan based on income available
FFEL—Income sensitive payment available; Direct—Income contingent payment available
FFEL—Income-sensitive payment available
No
Economic hardship policies Borrower has legal right to deferment available for economic hardship or unemployment up to 3 years each. Forebearance available at lender discretion for up to 12 months at a time for a maximum of three years
Borrower has legal right to deferment available for economic hardship or unemployment up to 3 years each. Forebearance available at lender discretion for up to 12 months at a time for a maximum of three years
At lender discretion; some lenders offer private loan forbearance in maximum of 12 months
Loan discharge available For some bankruptcy cases, borrower’s total and permanent disability or death, teaching in designated elementary or secondary schools for fi ve consecutive years
In the case of death of student for whom the parents borrowed
No
Consolidation available Yes Yes Yes
*Note: A credit-worthy borrower may be defi ned as someone who has a “satisfactory credit, residence, and employment history of at least two years, has proof of current income (or if self-employed has been in business for at least two years; and is a U.S. citizen or permanent resident and has resided in the United States for the previous two years.” In contrast a credit-ready borrower may be defi ned as someone who “satisfi es certain credit criteria, although an established credit history is not required; and is a U.S. citizen or permanent resident who has resided in the U.S. for the previous two years” (The Education Resources Institute [TERI] 2006). **Note: Origination fees will be incrementally lowered until eventually phased out in 2010.Source: Stoll 2004; U.S. Department of Education 2006; When a Stafford loan isn’t enough 2006; TERI 2006.

The Future of Private Loans: Who Is Borrowing, and Why? 7
It is important to note, however, that while some private loan products may look similar to federal loans, others may vary considerably. Further, because private loans exist outside of the federal guarantee system, mandates on federal loans do not apply to private loans. For example, the process by which enrollment is verifi ed may vary among private loan lenders depending upon if they work through fi nancial aid offi cers or directly with consumers. In addition, unlike for federal loans, borrower counseling is not mandated for private loans. Further, lenders are not required to ensure that a student has applied for federal aid before taking out a private loan as with federal loans. These requirements are often imposed with private loans that are processed through school fi nancial aid offi ces, but it is not known to what extent this happens for those loans marketed to consumers outside of a school’s fi nancial aid offi ce.
Other major distinctions between private and federal student loans lie in their terms and conditions:
� Their funding guarantee structure and associated risk of default;
� The terms of interest rates, repayment, and fees;
� The variability in products offered; and
� The process of borrowing.
Private loans are not guaranteed against default by the federal government and borrower eligibility typically depends on a credit history (Finaid.org 2006a; Fitch Ratings 2006a). This distinction is important, as private lenders must assess the risk of default associated with lending to a particular student. This associated risk has implications for the interest rate applied to these loans, as students with low credit ratings are likely to face higher interest rates or need a cosigner (Finaid.org 2006a).7 Further, most private loans carry a variable interest rate based on commonly used market rates.8 This can result in varying and sometimes higher prices for students during the lifetime of a loan. In contrast, the maximum interest rate on federally guaranteed loans are determined by law, which currently mandates a fi xed rate of 6.8 percent, and some lenders offer discounts to lower this rate.
Another major difference between private and federal loans is the branding of private loan products for students of varying degree programs and fi elds of study.9 For example, specifi c private loan products exist for undergraduate, graduate, and fi rst-professional students, all with varying interest rates and fees. Further, some professional students may
7 Similar to other consumer lending products, interest rates are often applied to private loans based on tier pricing. A lender may create different tiers with established thresholds for applicants with various credit ratings. Those with the highest credit rating and least likelihood of default are charged the lowest interest rate, and those with the lowest credit rating and highest risk of default are charged higher interest rates. The number of tiers and thresholds are distinct for each lender, and not all applicants have credit ratings high enough to qualify for a private loan.8 Commonly used market rates include the PRIME rate that banks charge their most creditworthy customers (see note in fi gure 2 for defi nition of creditworthiness); the LIBOR or average interest rate paid on U.S. dollars deposited in the London Market (Finaid.org 2006a); and the rate associated with interest-bearing securities issued by the U.S. Treasury to be redeemed in 91 days (TeachMefi nance.com 2006).9 See Finaid.org or The Greentree Gazette Student Loan Buying Guide for a list of private loan products varying by student level and fi eld of study.

The Future of Private Loans: Who Is Borrowing, and Why?8
Students may borrow money for college through the federal government in several ways. The two main programs offering loans are the Federal Family Education Loan program (FFEL) and the William D. Ford Federal Direct Student Loan program, referred to as Direct
Loans.10 These programs differ in terms of which party acts as the lender of the loan and to which party the student makes repayments. Under the FFEL program, money is borrowed from private lenders and the federal government guarantees these funds against default. These lenders offer Stafford, Parent Loan for Undergraduate Students (PLUS), and consolidation loans. Repayments made on loans in the FFEL program are made to the private lender.11
Students may also borrow from the Direct Loan program if the institution they attend is a participating school. Under this system, students borrow directly from and make repayments to the federal government. The same loans available through the FFEL program are available through the Direct Loan program: Stafford, PLUS, and consolidation loans.
Stafford loans can be subsidized, which means that the federal government pays the interest that accrues while a student is in school at least half-time, for the fi rst six months after a student leaves school, and during periods of deferment. Students must demonstrate fi nancial need to qualify for a subsidized Stafford loan. Unsubsidized Stafford loans are also available to all students, regardless of demonstrated fi nancial need, and the student is responsible for paying the interest that accrues during enrollment and deferment. Students cannot borrow an unlimited amount in Stafford loans; rather, there are total Stafford loan limits for subsidized and unsubsidized loans together, based on the student’s level and/or dependency status (U.S. Department of Education 2006).
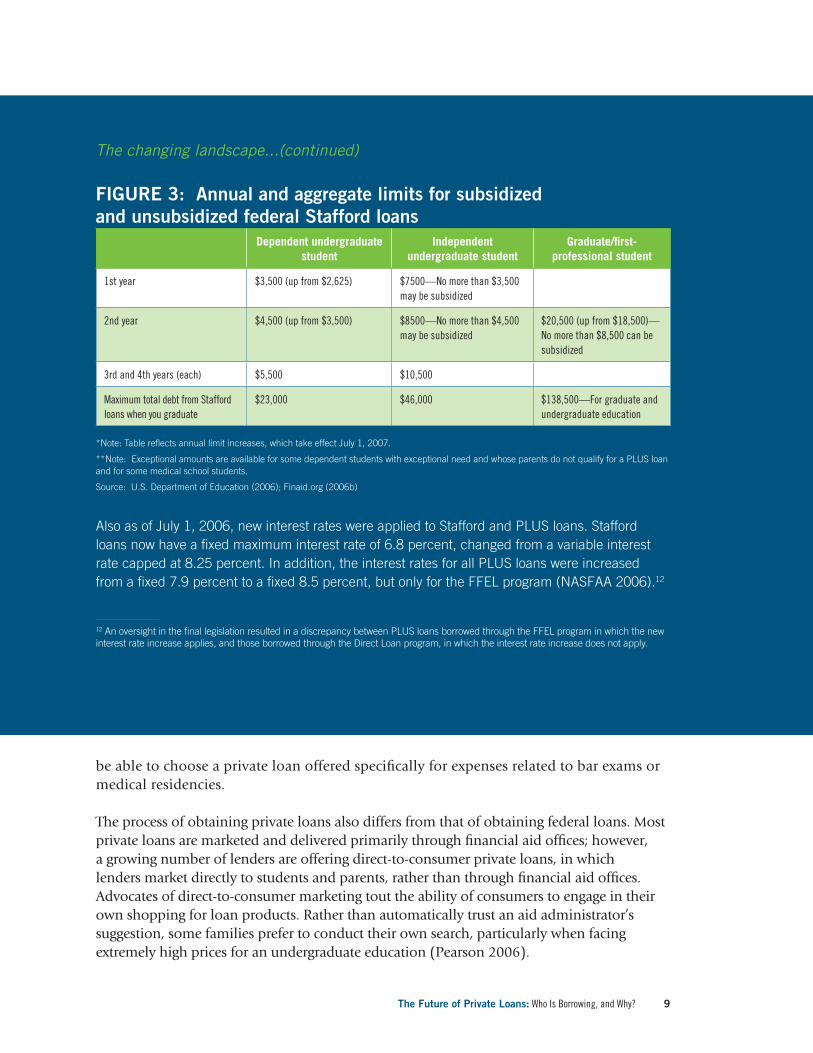
In February 2006, the Defi cit Reduction Act of 2005 legislated several changes to the federal student loan system. Stafford annual limits for fi rst- and second-year undergraduate students were raised, as were yearly unsubsidized limits for graduate and fi rst-professional students. These loan limits will take effect on July 1, 2007 (see fi gure 3). Additionally, in July of 2006, graduate and professional students became eligible to borrow PLUS loans, which were previously available only for parents of dependent undergraduates (National Association of Student Financial Aid Administrators [NASFAA] 2006).
The Future of Private Loans: Who Is Borrowing, and Why?8
10 Students can also borrow funds directly from their school through the Federal Perkins Loan program. An established amount of Perkins funds are given to participating institutions each year and students can apply for up to $4,000 a year for undergraduate studies and $6,000 a year for graduate studies. Amounts received depend on demonstrated fi nancial need, amount of other aid, and availability of funds at the school.11 Private lenders may include banks, credit unions, savings and loan associations, and other nonfederal entities. Although the student makes repayments to a private lender, these loans are not considered private loans because they are guaranteed against default by the federal government.
BOX 2: The changing landscape of federal student loans
The Future of Private Loans: Who Is Borrowing, and Why? 9
be able to choose a private loan offered specifi cally for expenses related to bar exams or medical residencies.
The process of obtaining private loans also differs from that of obtaining federal loans. Most private loans are marketed and delivered primarily through fi nancial aid offi ces; however, a growing number of lenders are offering direct-to-consumer private loans, in which lenders market directly to students and parents, rather than through fi nancial aid offi ces. Advocates of direct-to-consumer marketing tout the ability of consumers to engage in their own shopping for loan products. Rather than automatically trust an aid administrator’s suggestion, some families prefer to conduct their own search, particularly when facing extremely high prices for an undergraduate education (Pearson 2006).
The changing landscape...(continued)
FIGURE 3: Annual and aggregate limits for subsidized and unsubsidized federal Stafford loans
Dependent undergraduate student
Independent undergraduate student
Graduate/fi rst-professional student
1st year $3,500 (up from $2,625) $7500—No more than $3,500 may be subsidized
2nd year $4,500 (up from $3,500) $8500—No more than $4,500 may be subsidized
$20,500 (up from $18,500)—No more than $8,500 can be subsidized
3rd and 4th years (each) $5,500 $10,500
Maximum total debt from Stafford loans when you graduate
$23,000 $46,000 $138,500—For graduate and undergraduate education
*Note: Table refl ects annual limit increases, which take effect July 1, 2007.
**Note: Exceptional amounts are available for some dependent students with exceptional need and whose parents do not qualify for a PLUS loan and for some medical school students.
Source: U.S. Department of Education (2006); Finaid.org (2006b)
Also as of July 1, 2006, new interest rates were applied to Stafford and PLUS loans. Stafford loans now have a fi xed maximum interest rate of 6.8 percent, changed from a variable interest rate capped at 8.25 percent. In addition, the interest rates for all PLUS loans were increased from a fi xed 7.9 percent to a fi xed 8.5 percent, but only for the FFEL program (NASFAA 2006).12
12 An oversight in the fi nal legislation resulted in a discrepancy between PLUS loans borrowed through the FFEL program in which the new interest rate increase applies, and those borrowed through the Direct Loan program, in which the interest rate increase does not apply.

The Future of Private Loans: Who Is Borrowing, and Why?10
Although the growth in direct-to-consumer marketing allows some consumers to engage in their own shopping, the lack of consistent and widespread information about private loans—and unequal fi nancial literacy among potential borrowers—is an area of serious concern. As one loan expert commented, some students are receiving offers for private loans prior to completing the FAFSA or receiving a fi nancial aid package offer from the institutions they want to attend. Students who borrow private loans directly from lenders without the help of a fi nancial aid administrator may not be aware of the distinctions between federal and private loans, or may not fully understand the protections provided with federal loans, such as the in-school interest subsidy or caps on interest rates.
It is also important for students to consider their options if they fi nd themselves with unmanageable debt. In addition to choosing a standard repayment plan, students
who take out a federal loan also have the option of choosing an extended plan, which lengthens the repayment period but results in lower monthly payments, or a graduated plan in which payments are initially low and gradually increase over the repayment period. Income- contingent repayment plans are also available for Direct Loan borrowers, and income-sensitive plans are available for borrowers in the FFEL program.13 Federal borrowers may also consolidate multiple loans into one payment, which, depending on the plan chosen, may lower their monthly payments but lengthen the total repayment period (Stoll 2004; U.S. Department of Education 2006).
Federal loan borrowers also have a legal right to a loan deferment, in which payments are temporarily stopped for economic hardship or unemployment up to three years. While in deferment, interest that accrues on subsidized Stafford loans is also paid by the government, but the borrower is responsible for interest that accrues on unsubsidized Stafford or PLUS loans during deferment. Lenders, at their discretion, may also grant borrowers forbearance—usually a temporary stop in repayment—or the borrower can choose to make smaller repayments during that period (Stoll 2004). Unlike with deferments, borrowers are responsible for the interest that accrues on all loans during forbearance, including subsidized Stafford loans. Federal loans also may be discharged under limited circumstances, such as if a student dies or becomes permanently disabled, and there are federal loan forgiveness programs for individuals occupied in certain areas of need, such as teachers in designated low-income areas (U.S. Department of Education 2006).
13 Income-contingent and income-sensitive plans are distinct in several ways. For example, with income-contingent repayment the monthly payments are calculated annually based on the total amount owed, the borrower’s adjusted gross income, and family size. The maximum payment period under this plan is twenty-fi ve years, after which the remaining amount owed is discharged and the borrower is responsible for paying taxes on the amount discharged. Income-sensitive plans are also annually adjusted for changes in a borrower’s income; however the loan must be repaid within ten years. Lenders are given discretion to offer an income-sensitive plan for an extended repayment of fi fteen years (Stoll 2004).
Students who borrow private loans directly from lenders may not be aware of the distinctions between federal and private loans, or fully understand the protections provided with federal loans.
The Future of Private Loans: Who Is Borrowing, and Why? 11
With private loans, options for handling overwhelming debt burden are more limited in comparison to federal loans, and lenders are not mandated to offer any particular relief. Some private loan lenders do offer extended or graduated repayment plans and may, at their discretion, grant forbearance in repayments, many for up to twelve months. There are private lenders that will refi nance or consolidate other private loans, but the terms can vary greatly, and there generally are eligibility requirements for students to take advantage of the lowest possible rates and fees.14 Understanding the impact of the availability of economic hardship relief is particularly important for students with the lowest incomes or independent students paying for their own college expenses, a group to which the private loan industry is increasingly reaching out (Thanks to the Banks 2006).
In light of the differences between private and federal loans, students who must borrow for their education should be fully informed about the options available to them. Consumer education is a key component in helping students sort through the many options available, particularly for some groups that typically have the least information about the fi nancial aid process, such as students who are low-income, fi rst in their families to go to college, or students of color (Vargas 2004). Further, the impact that variable interest rates and a consumer’s credit history will have on the total cost of private loans for different borrowers should be well understood. As one administrator who works for a large state university noted, because of its size, the university has the resources to spend added time helping students sort through various funding options. Students attending institutions with fi nancial aid offi ces that are less well staffed or trained may be at a greater disadvantage for making favorable decisions about their college fi nancing.
14 A few private consolidation eligibility requirements are being a credit-ready or credit-worthy borrower, or having a creditworthy cosigner (see note in Figure 2 for defi nitions of credit-ready borrower and credit-worthy borrower); immediately beginning repayment; and attending a specifi c institution (Private Consolidation Loans 2006).

The Future of Private Loans: Who Is Borrowing, and Why? 13
� The rising price of attending college. Tuition and price of attendance have been steadily increasing higher than the rate of infl ation in the past two decades.15
� The rising levels of remaining fi nancial need. These rising levels have been felt particularly for groups who have been facing an increasing net price of attendance—that is, the difference between the price of attendance (tuition plus nontuition costs) and grants received.16
� Stagnant federal loan limits. Until recently, annual Stafford loan limits for dependent fi rst- and second-year undergraduate students remained fl at at $2,625 and $3,500, respectively.17
Other trends taking place specifi cally within the student lending market have also contributed to the growth in private loans:
� The development of private loan products by lenders to remain on preferred lending lists. With the increase in attendance prices and growing gaps in aid, many lenders began working with fi nancial aid offi ces to provide supplemental private loans to students who borrowed the annual maximum in federal loans. In doing so, lenders sought to increase their available products and remain on schools’ preferred lender lists.18 This move was signifi cant because, historically, the profi tability of originating private loans
What has facilitated the growth in private loans?
Clearly, trends point to the fact that private loans are increasing in volume and the industry is adapting to a changing market. When asked about the elements contributing to the growth in private loans, industry leaders pointed to often-cited factors related to the rising costs of higher education. These factors include
15 The General Accounting Offi ce (GAO 1996) found that in the fi fteen academic years from 1980–81 through 1994–95, the average tuition at public four-year universities rose by 234 percent, while the consumer price index (a general measure of infl ation) rose by 74 percent and median household income rose by 82 percent. Horn, Wei, and Berker (2002) also found that price of attendance, which includes tuition and nontuition expenses, signifi cantly increased across public four-year, public two-year, and private not-for-profi t four-year institutions after adjusting for infl ation. 16 Horn, Wei, and Berker (2002) found that between 1992–93 and 1999–2000, the net price of attendance (after all grants) for full-time, full-year undergraduate students attending public and private not-for-profi t research and doctoral institutions and public two-year institutions signifi cantly increased, after adjusting for infl ation. In contrast, when net price was calculated as price minus all grants and loans, there was no observable difference, pointing to these students’ increased reliance on loans.17 The annual limit for fi rst-year and second-year students was set during the Higher Education Act reauthorizations of 1986 and 1992 respectively. Recent legislation will raise these limits in July 2007. See box 2. 18 Financial aid offi ces maintain lists of recommended or preferred lenders for students to choose from when taking out a student loan. Administrators often consider the terms, processing, customer service, and other characteristics when choosing lenders best suited for their students.
The Future of Private Loans: Who Is Borrowing, and Why?14
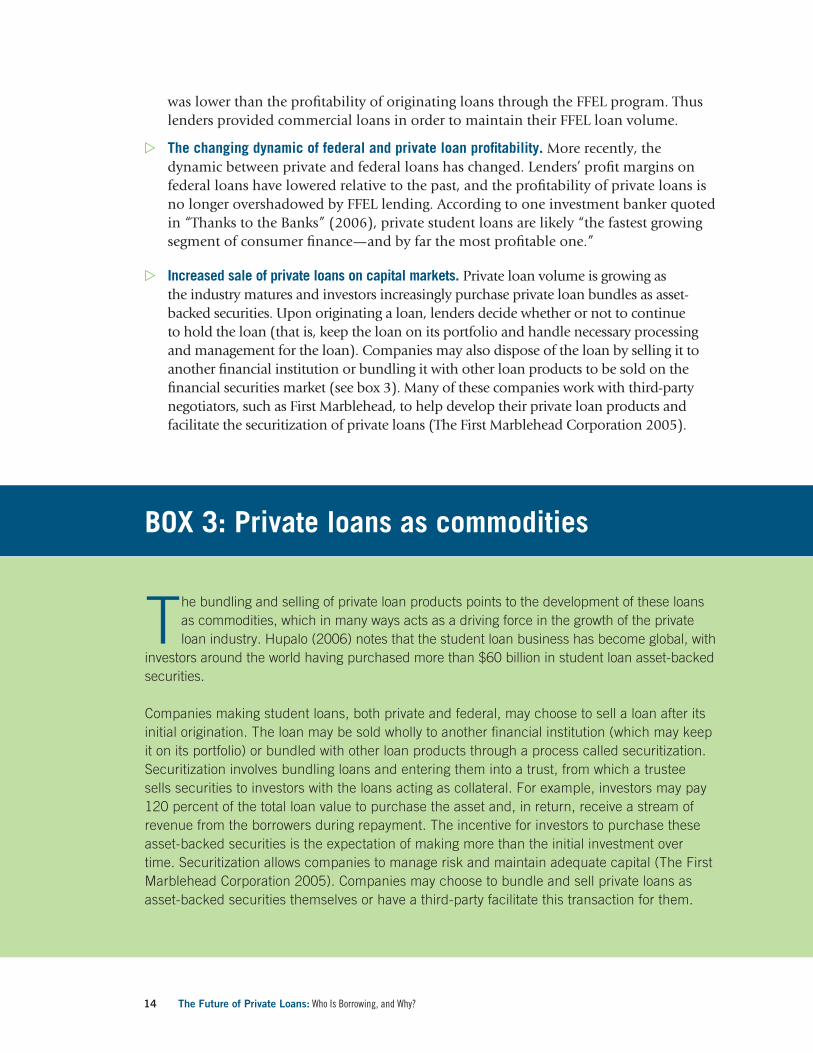
The bundling and selling of private loan products points to the development of these loans as commodities, which in many ways acts as a driving force in the growth of the private loan industry. Hupalo (2006) notes that the student loan business has become global, with
investors around the world having purchased more than $60 billion in student loan asset-backed securities.
Companies making student loans, both private and federal, may choose to sell a loan after its initial origination. The loan may be sold wholly to another fi nancial institution (which may keep it on its portfolio) or bundled with other loan products through a process called securitization. Securitization involves bundling loans and entering them into a trust, from which a trustee sells securities to investors with the loans acting as collateral. For example, investors may pay 120 percent of the total loan value to purchase the asset and, in return, receive a stream of revenue from the borrowers during repayment. The incentive for investors to purchase these asset-backed securities is the expectation of making more than the initial investment over time. Securitization allows companies to manage risk and maintain adequate capital (The First Marblehead Corporation 2005). Companies may choose to bundle and sell private loans as asset-backed securities themselves or have a third-party facilitate this transaction for them.
BOX 3: Private loans as commodities
was lower than the profi tability of originating loans through the FFEL program. Thus lenders provided commercial loans in order to maintain their FFEL loan volume.
� The changing dynamic of federal and private loan profi tability. More recently, the dynamic between private and federal loans has changed. Lenders’ profi t margins on federal loans have lowered relative to the past, and the profi tability of private loans is no longer overshadowed by FFEL lending. According to one investment banker quoted in “Thanks to the Banks” (2006), private student loans are likely “the fastest growing segment of consumer fi nance—and by far the most profi table one.”
� Increased sale of private loans on capital markets. Private loan volume is growing as the industry matures and investors increasingly purchase private loan bundles as asset-backed securities. Upon originating a loan, lenders decide whether or not to continue to hold the loan (that is, keep the loan on its portfolio and handle necessary processing and management for the loan). Companies may also dispose of the loan by selling it to another fi nancial institution or bundling it with other loan products to be sold on the fi nancial securities market (see box 3). Many of these companies work with third-party negotiators, such as First Marblehead, to help develop their private loan products and facilitate the securitization of private loans (The First Marblehead Corporation 2005).
The Future of Private Loans: Who Is Borrowing, and Why? 15
This section uses 2003-04 NPSAS data to look specifi cally at the breakdown of private loan borrowers by a variety of characteristics, including demographic, institutional, and attendance, as well as fi nancial aid and need characteristics.
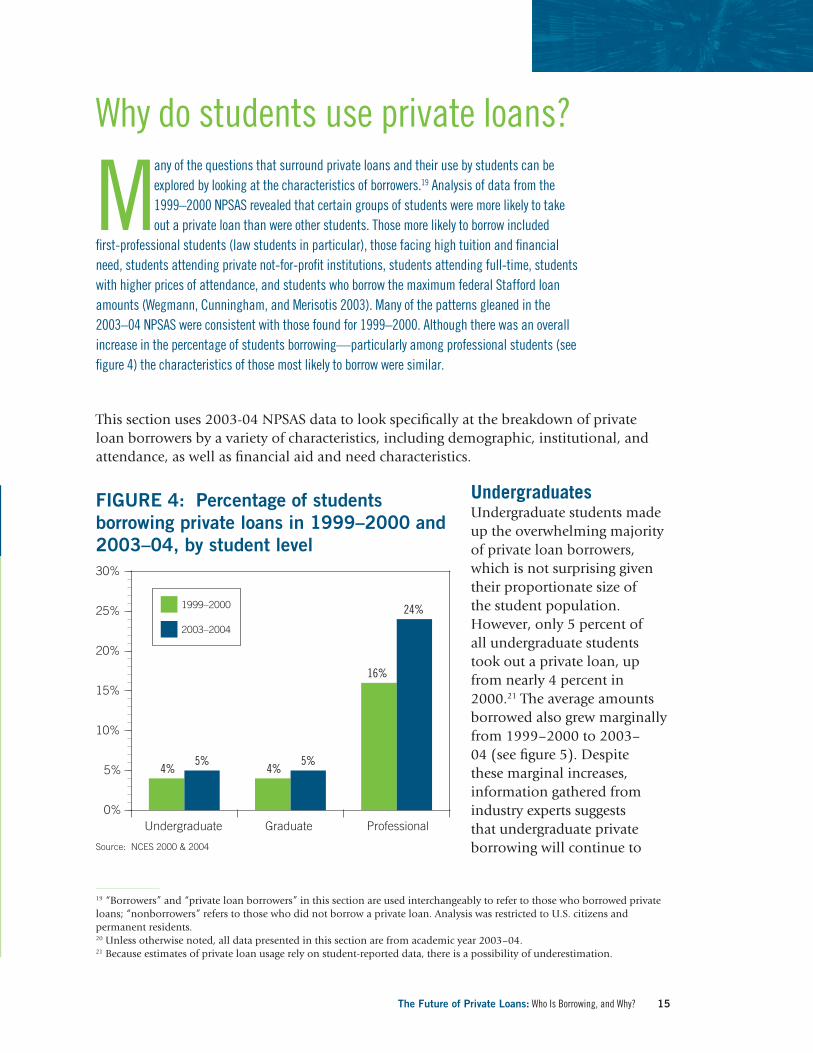
UndergraduatesUndergraduate students made up the overwhelming majority of private loan borrowers, which is not surprising given their proportionate size of the student population. However, only 5 percent of all undergraduate students took out a private loan, up from nearly 4 percent in 2000.21 The average amounts borrowed also grew marginally from 1999–2000 to 2003–04 (see fi gure 5). Despite these marginal increases, information gathered from industry experts suggests that undergraduate private borrowing will continue to
Why do students use private loans?
Many of the questions that surround private loans and their use by students can be explored by looking at the characteristics of borrowers.19 Analysis of data from the 1999 –2000 NPSAS revealed that certain groups of students were more likely to take out a private loan than were other students. Those more likely to borrow included
fi rst-professional students (law students in particular), those facing high tuition and fi nancial need, students attending private not-for-profi t institutions, students attending full-time, students with higher prices of attendance, and students who borrow the maximum federal Stafford loan amounts (Wegmann, Cunningham, and Merisotis 2003). Many of the patterns gleaned in the 2003–04 NPSAS were consistent with those found for 1999–2000. Although there was an overall increase in the percentage of students borrowing—particularly among professional students (see fi gure 4) the characteristics of those most likely to borrow were similar.
19 “Borrowers” and “private loan borrowers” in this section are used interchangeably to refer to those who borrowed private loans; “nonborrowers” refers to those who did not borrow a private loan. Analysis was restricted to U.S. citizens and permanent residents.20 Unless otherwise noted, all data presented in this section are from academic year 2003–04.21 Because estimates of private loan usage rely on student-reported data, there is a possibility of underestimation.
Undergraduate Graduate Professional0%
5%
10%
15%
20%
25%
30%
4%5%
4%5%
16%
24%1999–2000
2003–2004
FIGURE 4: Percentage of students borrowing private loans in 1999–2000 and 2003–04, by student level
Source: NCES 2000 & 2004

The Future of Private Loans: Who Is Borrowing, and Why?16
grow substantially because of the increasing price of undergraduate education.
Private loan borrowing among undergraduates varies between dependent and independent students. Dependent students were slightly more likely to take out a private loan than were independent students (7 percent versus 3 percent) and to receive slightly greater average amounts ($6,350 versus $5,054).22 At the same time, 33 percent of all private loan borrowers were independent. It is important to explore the borrowing patterns of dependent and independent students
separately, as these groups differ greatly in their income, work intensity, attendance status, and institutional choices. Further, NPSAS data suggest that the reasons for seeking alternative loans varied for dependent and independent students.
By income, the distribution of dependent borrowers and nonborrowers did not vary greatly. Half of both groups of students had family incomes of $60,000 or greater. However, independent students tended to have lower family incomes than dependent students. Still, there were signifi cantly more borrowers than nonborrowers with incomes below $20,000. What’s more, independent nonborrowers more often worked full-time while enrolled, compared with borrowers who more often worked part-time. Thus, for independent students, those who choose to take out a private loan may be making a trade-off between working full-time while enrolled and private borrowing (see fi gures 6 and 7).
For both dependent and independent students, there were stark differences between the attendance patterns and institutional choices of borrowers of private loans and nonborrowers. Substantially more dependent and independent borrowers attended full-time exclusively and for a full year compared with their nonborrowing counterparts, suggesting that the decision to take out a private loan is related to attending more classes and throughout the year. Further, a greater proportion of students who took out private loans
22 The greater likelihood of dependent students borrowing a private loan and in greater amounts may refl ect the fact that these students have parental cosigners.
CO
NST
AN
T 20
03–0
4 D
OLL
AR
S
Average borrowed1999-2000
Average borrowed 2003-04
$5,675$5,918
$0
$1,000
$2,000
$3,000
$4,000
$5,000
$6,000
FIGURE 5: Average private loan amount borrowed by undergraduate students in 1999–2000 and 2003–04 in constant (2003-04) dollars
Note: Constant dollar conversion to 2003-04 dollars calculated using academic year Consumer Price Index table presented in College Board Trends in Student Pricing 2004.
Source: College Board 2004; NCES 2000 & 2004
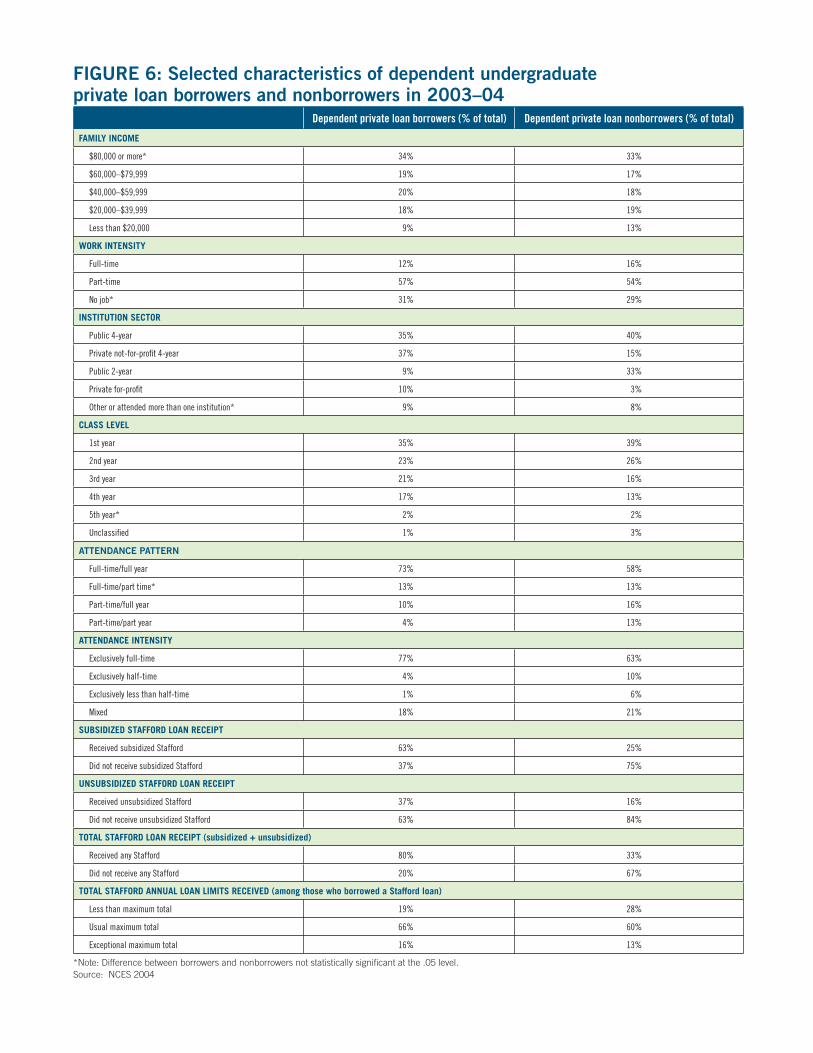
FIGURE 6: Selected characteristics of dependent undergraduate private loan borrowers and nonborrowers in 2003–04
Dependent private loan borrowers (% of total) Dependent private loan nonborrowers (% of total)
FAMILY INCOME
$80,000 or more* 34% 33%
$60,000–$79,999 19% 17%
$40,000–$59,999 20% 18%
$20,000–$39,999 18% 19%
Less than $20,000 9% 13%
WORK INTENSITY
Full-time 12% 16%
Part-time 57% 54%
No job* 31% 29%
INSTITUTION SECTOR
Public 4-year 35% 40%
Private not-for-profi t 4-year 37% 15%
Public 2-year 9% 33%
Private for-profi t 10% 3%
Other or attended more than one institution* 9% 8%
CLASS LEVEL
1st year 35% 39%
2nd year 23% 26%
3rd year 21% 16%
4th year 17% 13%
5th year* 2% 2%
Unclassifi ed 1% 3%
ATTENDANCE PATTERN
Full-time/full year 73% 58%
Full-time/part time* 13% 13%
Part-time/full year 10% 16%
Part-time/part year 4% 13%
ATTENDANCE INTENSITY
Exclusively full-time 77% 63%
Exclusively half-time 4% 10%
Exclusively less than half-time 1% 6%
Mixed 18% 21%
SUBSIDIZED STAFFORD LOAN RECEIPT
Received subsidized Stafford 63% 25%
Did not receive subsidized Stafford 37% 75%
UNSUBSIDIZED STAFFORD LOAN RECEIPT
Received unsubsidized Stafford 37% 16%
Did not receive unsubsidized Stafford 63% 84%
TOTAL STAFFORD LOAN RECEIPT (subsidized + unsubsidized)
Received any Stafford 80% 33%
Did not receive any Stafford 20% 67%
TOTAL STAFFORD ANNUAL LOAN LIMITS RECEIVED (among those who borrowed a Stafford loan)
Less than maximum total 19% 28%
Usual maximum total 66% 60%
Exceptional maximum total 16% 13%
*Note: Difference between borrowers and nonborrowers not statistically signifi cant at the .05 level . Source: NCES 2004
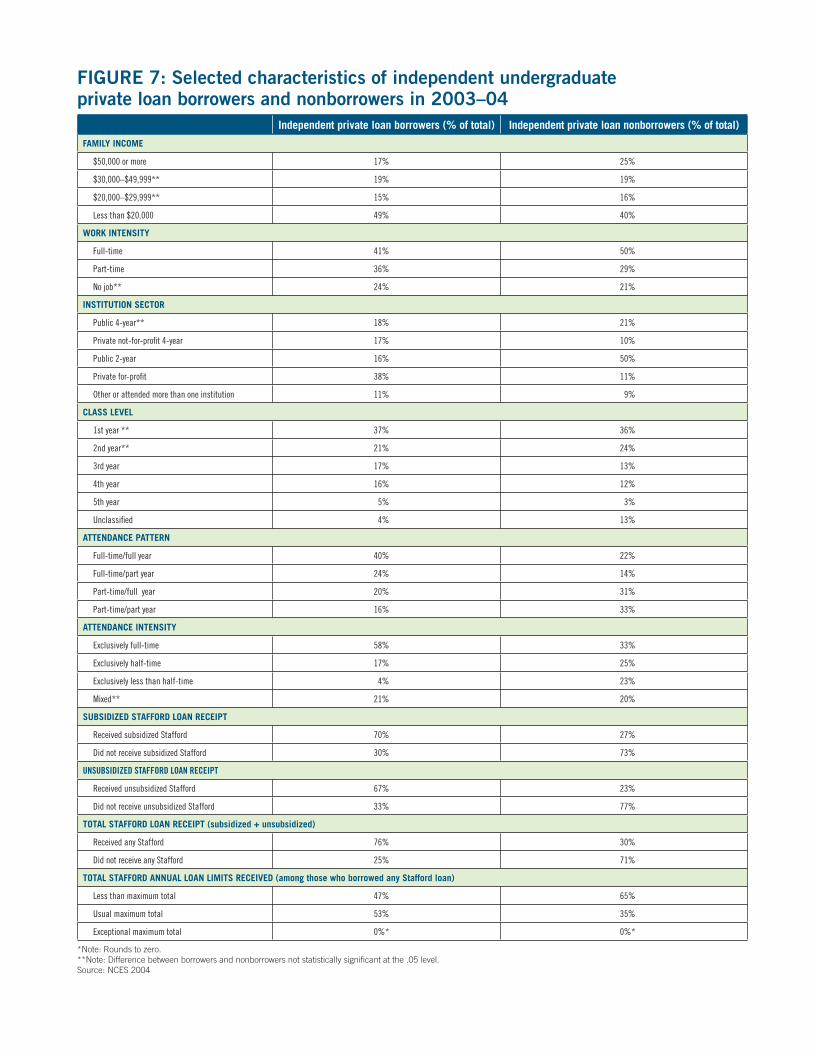
FIGURE 7: Selected characteristics of independent undergraduate private loan borrowers and nonborrowers in 2003–04
Independent private loan borrowers (% of total) Independent private loan nonborrowers (% of total)
FAMILY INCOME
$50,000 or more 17% 25%
$30,000–$49,999** 19% 19%
$20,000–$29,999** 15% 16%
Less than $20,000 49% 40%
WORK INTENSITY
Full-time 41% 50%
Part-time 36% 29%
No job** 24% 21%
INSTITUTION SECTOR
Public 4-year** 18% 21%
Private not-for-profi t 4-year 17% 10%
Public 2-year 16% 50%
Private for-profi t 38% 11%
Other or attended more than one institution 11% 9%
CLASS LEVEL
1st year ** 37% 36%
2nd year** 21% 24%
3rd year 17% 13%
4th year 16% 12%
5th year 5% 3%
Unclassifi ed 4% 13%
ATTENDANCE PATTERN
Full-time/full year 40% 22%
Full-time/part year 24% 14%
Part-time/full year 20% 31%
Part-time/part year 16% 33%
ATTENDANCE INTENSITY
Exclusively full-time 58% 33%
Exclusively half-time 17% 25%
Exclusively less than half-time 4% 23%
Mixed** 21% 20%
SUBSIDIZED STAFFORD LOAN RECEIPT
Received subsidized Stafford 70% 27%
Did not receive subsidized Stafford 30% 73%
UNSUBSIDIZED STAFFORD LOAN RECEIPT
Received unsubsidized Stafford 67% 23%
Did not receive unsubsidized Stafford 33% 77%
TOTAL STAFFORD LOAN RECEIPT (subsidized + unsubsidized)
Received any Stafford 76% 30%
Did not receive any Stafford 25% 71%
TOTAL STAFFORD ANNUAL LOAN LIMITS RECEIVED (among those who borrowed any Stafford loan)
Less than maximum total 47% 65%
Usual maximum total 53% 35%
Exceptional maximum total 0%* 0%*
*Note: Rounds to zero.**Note: Difference between borrowers and nonborrowers not statistically signifi cant at the .05 level.Source: NCES 2004
The Future of Private Loans: Who Is Borrowing, and Why? 19
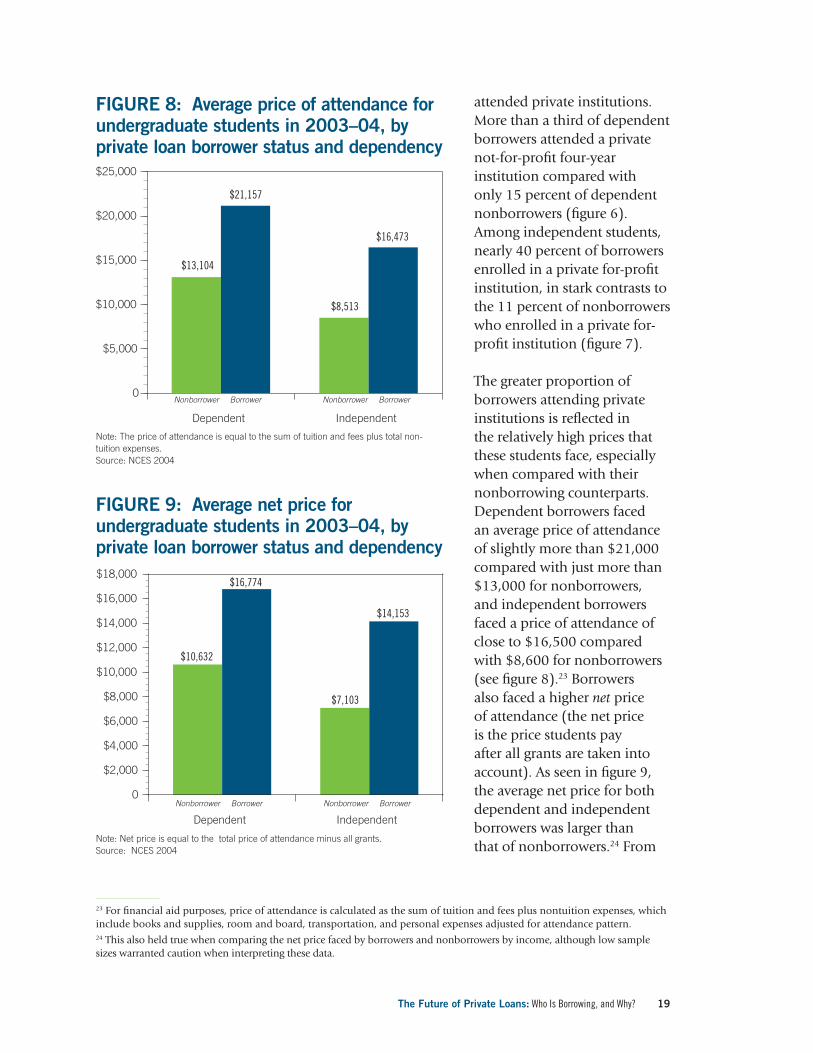
attended private institutions. More than a third of dependent borrowers attended a private not-for-profi t four-year institution compared with only 15 percent of dependent nonborrowers (fi gure 6). Among independent students, nearly 40 percent of borrowers enrolled in a private for-profi t institution, in stark contrasts to the 11 percent of nonborrowers who enrolled in a private for-profi t institution (fi gure 7).
The greater proportion of borrowers attending private institutions is refl ected in the relatively high prices that these students face, especially when compared with their nonborrowing counterparts. Dependent borrowers faced an average price of attendance of slightly more than $21,000 compared with just more than $13,000 for nonborrowers, and independent borrowers faced a price of attendance of close to $16,500 compared with $8,600 for nonborrowers (see fi gure 8).23 Borrowers also faced a higher net price of attendance (the net price is the price students pay after all grants are taken into account). As seen in fi gure 9, the average net price for both dependent and independent borrowers was larger than that of nonborrowers.24 From
0
$5,000
$10,000
$15,000
$20,000
$25,000
$13,104
$21,157
$8,513
$16,473
Dependent
Nonborrower Borrower Nonborrower Borrower
Independent
FIGURE 8: Average price of attendance for undergraduate students in 2003–04, by private loan borrower status and dependency
Note: The price of attendance is equal to the sum of tuition and fees plus total non-tuition expenses.Source: NCES 2004
0
$2,000
$4,000
$6,000
$8,000
$10,000
$12,000
$14,000
$16,000
$18,000
$10,632
$16,774
$7,103
$14,153
Dependent
Nonborrower Borrower Nonborrower Borrower
Independent
FIGURE 9: Average net price for undergraduate students in 2003–04, by private loan borrower status and dependency
Note: Net price is equal to the total price of attendance minus all grants.Source: NCES 2004
23 For fi nancial aid purposes, price of attendance is calculated as the sum of tuition and fees plus nontuition expenses, which include books and supplies, room and board, transportation, and personal expenses adjusted for attendance pattern. 24 This also held true when comparing the net price faced by borrowers and nonborrowers by income, although low sample sizes warranted caution when interpreting these data.
The Future of Private Loans: Who Is Borrowing, and Why?20
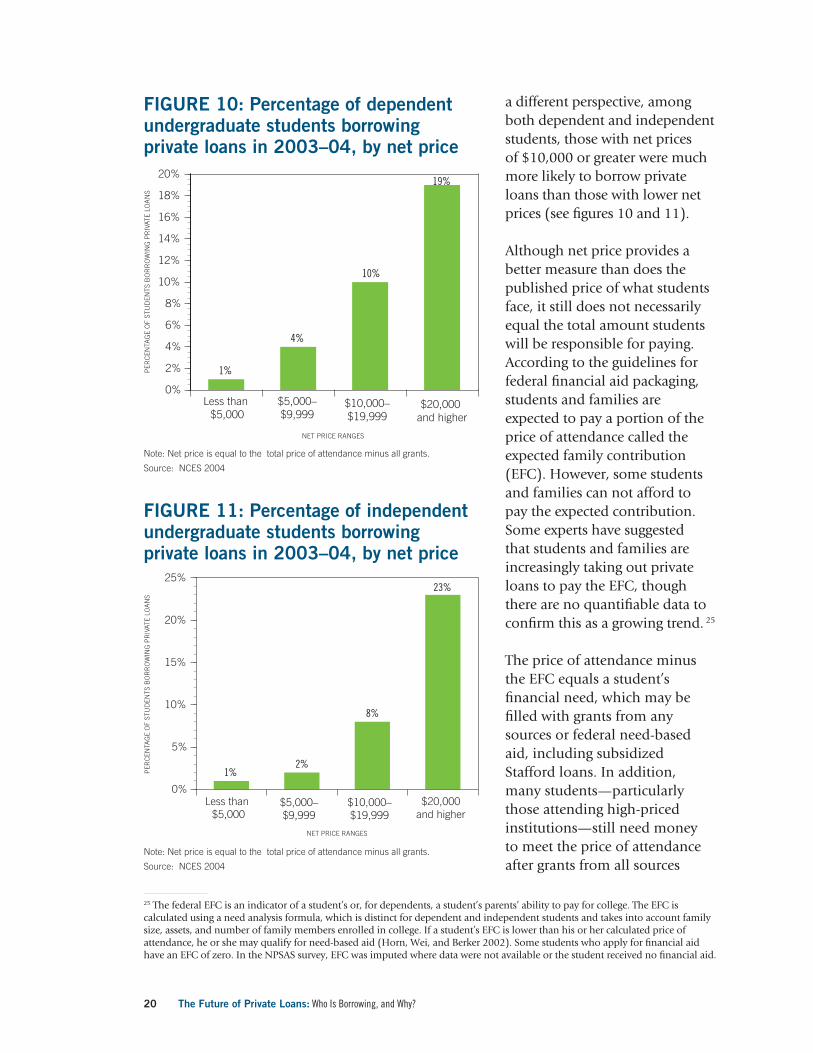
a different perspective, among both dependent and independent students, those with net prices of $10,000 or greater were much more likely to borrow private loans than those with lower net prices (see fi gures 10 and 11).
Although net price provides a better measure than does the published price of what students face, it still does not necessarily equal the total amount students will be responsible for paying. According to the guidelines for federal fi nancial aid packaging, students and families are expected to pay a portion of the price of attendance called the expected family contribution (EFC). However, some students and families can not afford to pay the expected contribution. Some experts have suggested that students and families are increasingly taking out private loans to pay the EFC, though there are no quantifi able data to confi rm this as a growing trend. 25
The price of attendance minus the EFC equals a student’s fi nancial need, which may be fi lled with grants from any sources or federal need-based aid, including subsidized Stafford loans. In addition, many students—particularly those attending high-priced institutions—still need money to meet the price of attendance after grants from all sources
Less than $5,000
$5,000–$9,999
$10,000–$19,999
$20,000 and higher
0%
2%
4%
6%
8%
10%
NET PRICE RANGES
12%
14%
16%
18%
20%
1%
4%
10%
19%
PER
CEN
TAG
E O
F ST
UD
ENTS
BO
RR
OW
ING
PR
IVAT
E LO
AN
S
FIGURE 10: Percentage of dependent undergraduate students borrowing private loans in 2003–04, by net price
Note: Net price is equal to the total price of attendance minus all grants.
Source: NCES 2004
Less than $5,000
$5,000–$9,999
$10,000–$19,999
$20,000and higher
0%
5%
10%
15%
20%
25%
1%2%
8%
23%
NET PRICE RANGES
PER
CEN
TAG
E O
F ST
UD
ENTS
BO
RR
OW
ING
PR
IVAT
E LO
AN
S
FIGURE 11: Percentage of independent undergraduate students borrowing private loans in 2003–04, by net price
Note: Net price is equal to the total price of attendance minus all grants.
Source: NCES 2004
25 The federal EFC is an indicator of a student’s or, for dependents, a student’s parents’ ability to pay for college. The EFC is calculated using a need analysis formula, which is distinct for dependent and independent students and takes into account family size, assets, and number of family members enrolled in college. If a student’s EFC is lower than his or her calculated price of attendance, he or she may qualify for need-based aid (Horn, Wei, and Berker 2002). Some students who apply for fi nancial aid have an EFC of zero. In the NPSAS survey, EFC was imputed where data were not available or the student received no fi nancial aid.
The Future of Private Loans: Who Is Borrowing, and Why? 21
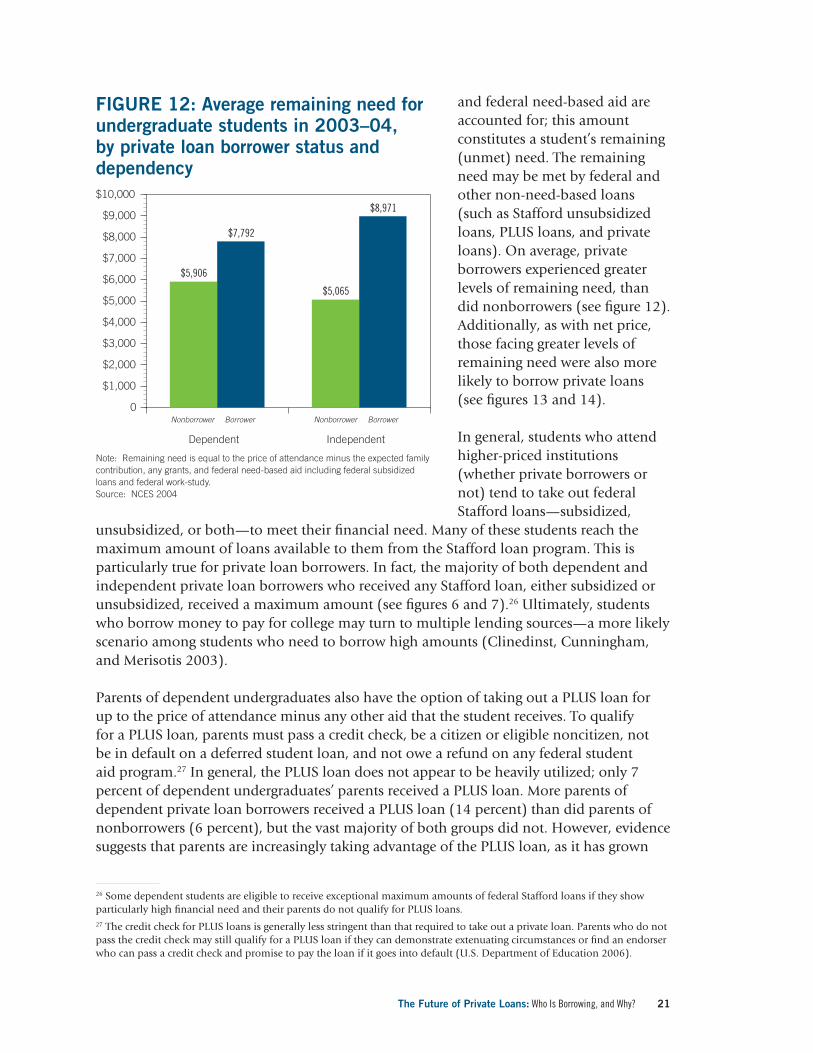
and federal need-based aid are accounted for; this amount constitutes a student’s remaining (unmet) need. The remaining need may be met by federal and other non-need-based loans (such as Stafford unsubsidized loans, PLUS loans, and private loans). On average, private borrowers experienced greater levels of remaining need, than did nonborrowers (see fi gure 12). Additionally, as with net price, those facing greater levels of remaining need were also more likely to borrow private loans (see fi gures 13 and 14).
In general, students who attend higher-priced institutions (whether private borrowers or not) tend to take out federal Stafford loans—subsidized,
unsubsidized, or both—to meet their fi nancial need. Many of these students reach the maximum amount of loans available to them from the Stafford loan program. This is particularly true for private loan borrowers. In fact, the majority of both dependent and independent private loan borrowers who received any Stafford loan, either subsidized or unsubsidized, received a maximum amount (see fi gures 6 and 7).26 Ultimately, students who borrow money to pay for college may turn to multiple lending sources—a more likely scenario among students who need to borrow high amounts (Clinedinst, Cunningham, and Merisotis 2003).
Parents of dependent undergraduates also have the option of taking out a PLUS loan for up to the price of attendance minus any other aid that the student receives. To qualify for a PLUS loan, parents must pass a credit check, be a citizen or eligible noncitizen, not be in default on a deferred student loan, and not owe a refund on any federal student aid program.27 In general, the PLUS loan does not appear to be heavily utilized; only 7 percent of dependent undergraduates’ parents received a PLUS loan. More parents of dependent private loan borrowers received a PLUS loan (14 percent) than did parents of nonborrowers (6 percent), but the vast majority of both groups did not. However, evidence suggests that parents are increasingly taking advantage of the PLUS loan, as it has grown
Dependent
Nonborrower Borrower Nonborrower Borrower
Independent
0
$1,000
$2,000
$3,000
$4,000
$5,000
$6,000
$7,000
$8,000
$9,000
$10,000
$5,906
$7,792
$5,065
$8,971
FIGURE 12: Average remaining need for undergraduate students in 2003–04, by private loan borrower status and dependency
Note: Remaining need is equal to the price of attendance minus the expected family contribution, any grants, and federal need-based aid including federal subsidized loans and federal work-study.Source: NCES 2004
26 Some dependent students are eligible to receive exceptional maximum amounts of federal Stafford loans if they show particularly high fi nancial need and their parents do not qualify for PLUS loans.27 The credit check for PLUS loans is generally less stringent than that required to take out a private loan. Parents who do not pass the credit check may still qualify for a PLUS loan if they can demonstrate extenuating circumstances or fi nd an endorser who can pass a credit check and promise to pay the loan if it goes into default (U.S. Department of Education 2006).
The Future of Private Loans: Who Is Borrowing, and Why?22
at a faster rate over the past ten years than either subsidized or unsubsidized Stafford loans (College Board 2006b).
The evidence is not conclusive as to why some students do not use PLUS or Stafford loans instead of private loans; however, anecdotal evidence offers some possibilities. In discussing the use of PLUS loans, some lenders interviewed for this report noted that parents are increasingly reluctant to take on debt solely in their names to pay for their child’s postsecondary education. This apparent unwillingness may be related to the parents having an increased awareness of their own retirement needs. Aid administrators have also observed this reluctance, although it is not clear among which types of students this is most prevalent (In a Gazette Minute with Patricia McWade 2006). Further, the marketing of private loans may also overshadow PLUS loans (Sheldon 2004).
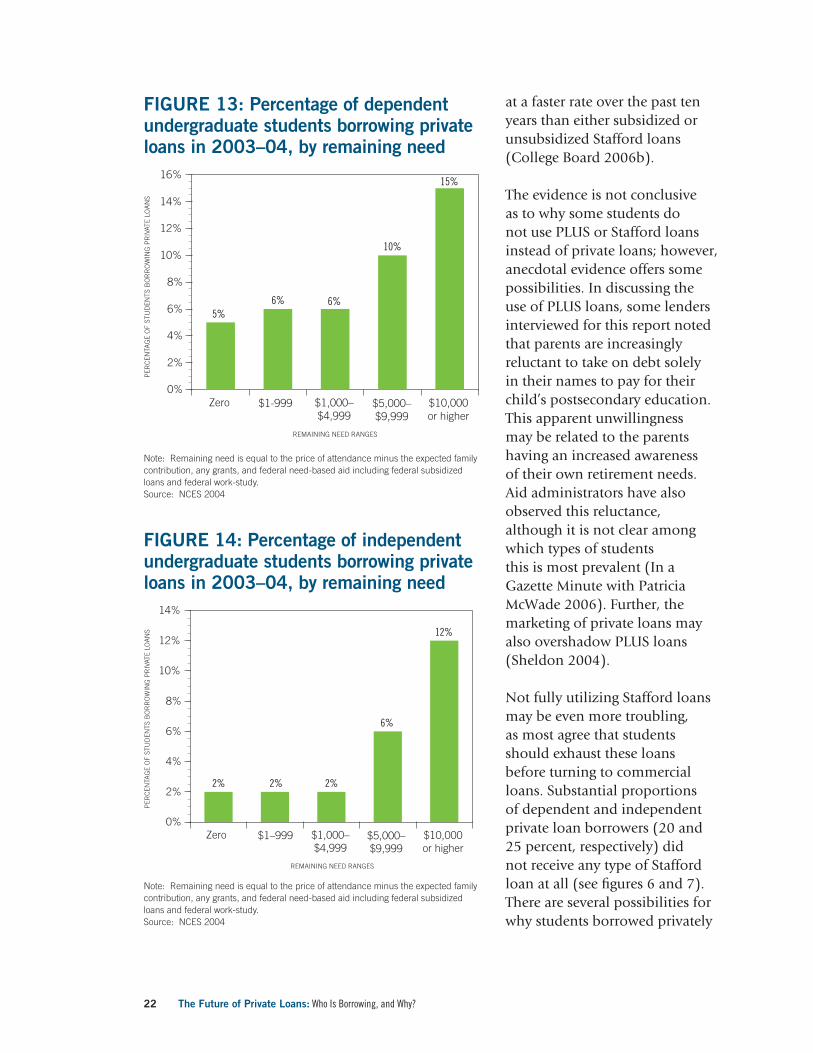
Not fully utilizing Stafford loans may be even more troubling, as most agree that students should exhaust these loans before turning to commercial loans. Substantial proportions of dependent and independent private loan borrowers (20 and 25 percent, respectively) did not receive any type of Stafford loan at all (see fi gures 6 and 7). There are several possibilities for why students borrowed privately
Zero $1-999 $1,000–$4,999
$5,000–$9,999
$10,000or higher
0%
2%
4%
6%
8%
10%
12%
14%
16%
5%6% 6%
10%
15%
REMAINING NEED RANGES
PER
CEN
TAG
E O
F ST
UD
ENTS
BO
RR
OW
ING
PR
IVAT
E LO
AN
S
FIGURE 13: Percentage of dependent undergraduate students borrowing private loans in 2003–04, by remaining need
Note: Remaining need is equal to the price of attendance minus the expected family contribution, any grants, and federal need-based aid including federal subsidized loans and federal work-study.Source: NCES 2004
Zero $1–999 $1,000–$4,999
$5,000–$9,999
$10,000or higher
0%
2%
4%
6%
8%
10%
12%
14%
2% 2% 2%
6%
12%
REMAINING NEED RANGES
PER
CEN
TAG
E O
F ST
UD
ENTS
BO
RR
OW
ING
PR
IVAT
E LO
AN
S
FIGURE 14: Percentage of independent undergraduate students borrowing private loans in 2003–04, by remaining need
Note: Remaining need is equal to the price of attendance minus the expected family contribution, any grants, and federal need-based aid including federal subsidized loans and federal work-study.Source: NCES 2004
The Future of Private Loans: Who Is Borrowing, and Why? 23
rather than through federal loan programs. Students who have exhausted their aggregate loan limits or attend less than half-time may not qualify for the annual maximum amount. Additionally, private loans may offer those with the best credit histories or a cosigner an initially low interest rate. However, because most private loan interest rates are variable, an initially low interest rate may increase over the life of a student’s loan.
There is also the suggestion that some students perceive private loan borrowing to be more convenient than federal loans. This perception could be related to the ability to apply for private loans online without fi lling out a FAFSA, or using one source for all borrowing.28 Although some students make these decisions as informed consumers, not all students have equal information. For some, this perception may refl ect a lack of awareness about federal loan options. Although most experts noted that the percentage of students who simply choose not to apply for federal aid is marginal, at least one private loan lender who works primarily with undergraduate students noted that this population is growing.
In sum, undergraduate students seem to have taken out private loans for varying reasons. (See fi gure 15 for possible scenarios of private borrowing.) It is clear that the bulk of undergraduate borrowers maximized federal Stafford loans and used private loans as a supplement to meet higher prices. The higher prices these students face, relative to nonborrowers, were driven in part by greater enrollment in private not-for-profi t institutions for dependent students, and private for-profi t institutions for independent
FIGURE 15: Hypothetical scenarios of private loan borrowing STUDENT A: STUDENT B: STUDENT C: STUDENT D: STUDENT E:
Receive aid package with eligible grants and federal need based aid
Receive aid package with eligible grants and federal need based aid
Receive aid package with eligible grants and federal need based aid
Receive aid package with eligible grants and federal need based aid
Receive aid package with eligible grants and federal need based aid
Receive annual maximum Stafford
Does not receive annual maximum Stafford—due to enrollment, exhausted aggregate maximum, preferences etc.
Receive annual maximum Stafford
Does not receive annual maximum Stafford—due to enrollment, exhausted aggregate maximum, preferences etc.
Receive annual maximum Stafford
No remaining federal need; Student/parents unable to pay full amount of EFC
Has remaining federal need; Student/parents unable to pay full amount of EFC
Has remaining need; Students/parents able to pay full amount of EFC
Has remaining need; Students/parents able to pay full amount of EFC
No remaining federal need; Student/parents able to pay full amount of EFC
Take out private loan to pay full amount of EFC
Take out private loan to meet federal need and/or pay full amount of EFC
Take out private loan to meet federal need
Take out private loan to meet federal need
Take out private loan—to meet additional living expenses or expenses not calculated in price of attendance; from fi nancial aid perspective may be considered “overborrowing”
Note: These possible scenarios are based on information derived from NPSAS data as well as interviews and are not meant to be exhaustive.
28 As some experts suggested that some students are reluctant to fi ll out a FAFSA due to privacy concerns.

Figure 16: Selected characteristics of professional degree private loan borrowers and nonborrowers in 2003–04
Professional degree private loan borrowers (% of total)
Professional degree private loan nonborrowers (% of total)
FAMILY INCOME
$50,000 or higher 8% 14%
$30,000–$49,999** 13% 11%
$20,000–$29,999** 10% 10%
Less than $20,000** 69% 66%
WORK INTENSITY
Full-time 5% 12%
Part-time** 31% 30%
No job** 64% 58%
DEGREE FIELD OF STUDY
Law (LLB or JD) 63% 35%
Medicine (MD)** 22% 26%
Other health science degree 14% 28%
Theology (MDiv, MHL, BD) 1% 11%
INSTITUTION SECTOR
Public 25% 47%
Private not-for-profi t 75% 54%
Private for-profi t 0%* 0%*
ATTENDANCE PATTERN
Full-time/full year 88% 79%
Full-time/part year** 4% 5%
Part-time/full year** 8% 13%
Part-time/part year 0%* 3%
ATTENDANCE INTENSITY
Exclusively full-time** 86% 79%
Exclusively half-time** 4% 6%
Exclusively less than half-time 0%* 2%
Mixed** 11% 13%
SUBSIDIZED STAFFORD LOAN RECEIPT
Received subsidized Stafford 90% 69%
Did not receive subsidized Stafford 10% 31%
UNSUBSIDIZED STAFFORD LOAN RECEIPT
Received unsubsidized Stafford 90% 63%
Did not receive unsubsidized Stafford 10% 37%
TOTAL STAFFORD LOAN RECEIPT (subsidized + unsubsidized)
Received Stafford 92% 71%
Did not receive Stafford 8% 29%
TOTAL STAFFORD ANNUAL LOAN LIMITS RECEIVED (among those who borrowed a Stafford loan)
Less than maximum total 10% 30%
Usual maximum total 55% 24%
Exceptional maximum total 36% 46%
*Note: Rounds to zero. **Note: Difference between borrowers and nonborrowers not statistically signifi cant at the .05 level.Source: NCES 2004
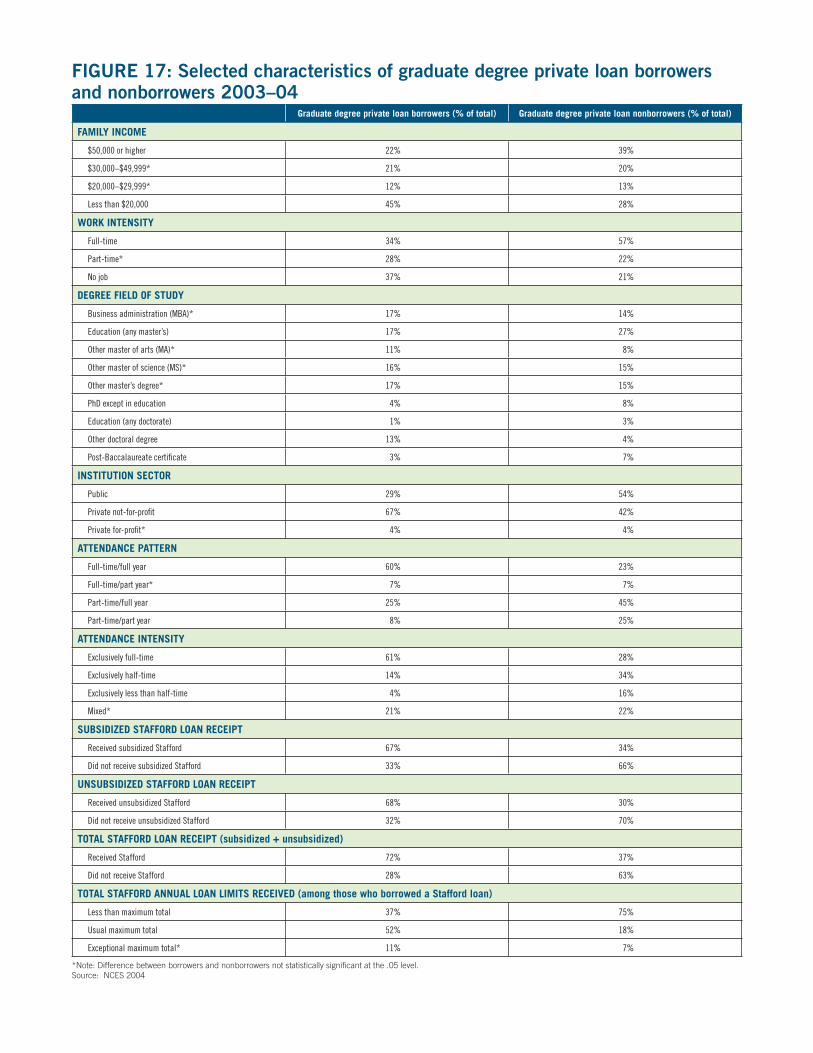
FIGURE 17: Selected characteristics of graduate degree private loan borrowers and nonborrowers 2003–04
Graduate degree private loan borrowers (% of total) Graduate degree private loan nonborrowers (% of total)
FAMILY INCOME
$50,000 or higher 22% 39%
$30,000–$49,999* 21% 20%
$20,000–$29,999* 12% 13%
Less than $20,000 45% 28%
WORK INTENSITY
Full-time 34% 57%
Part-time* 28% 22%
No job 37% 21%
DEGREE FIELD OF STUDY
Business administration (MBA)* 17% 14%
Education (any master’s) 17% 27%
Other master of arts (MA)* 11% 8%
Other master of science (MS)* 16% 15%
Other master’s degree* 17% 15%
PhD except in education 4% 8%
Education (any doctorate) 1% 3%
Other doctoral degree 13% 4%
Post-Baccalaureate certifi cate 3% 7%
INSTITUTION SECTOR
Public 29% 54%
Private not-for-profi t 67% 42%
Private for-profi t* 4% 4%
ATTENDANCE PATTERN
Full-time/full year 60% 23%
Full-time/part year* 7% 7%
Part-time/full year 25% 45%
Part-time/part year 8% 25%
ATTENDANCE INTENSITY
Exclusively full-time 61% 28%
Exclusively half-time 14% 34%
Exclusively less than half-time 4% 16%
Mixed* 21% 22%
SUBSIDIZED STAFFORD LOAN RECEIPT
Received subsidized Stafford 67% 34%
Did not receive subsidized Stafford 33% 66%
UNSUBSIDIZED STAFFORD LOAN RECEIPT
Received unsubsidized Stafford 68% 30%
Did not receive unsubsidized Stafford 32% 70%
TOTAL STAFFORD LOAN RECEIPT (subsidized + unsubsidized)
Received Stafford 72% 37%
Did not receive Stafford 28% 63%
TOTAL STAFFORD ANNUAL LOAN LIMITS RECEIVED (among those who borrowed a Stafford loan)
Less than maximum total 37% 75%
Usual maximum total 52% 18%
Exceptional maximum total* 11% 7%
*Note: Difference between borrowers and nonborrowers not statistically signifi cant at the .05 level.Source: NCES 2004

The Future of Private Loans: Who Is Borrowing, and Why?26
students, which tend to be more expensive. Similarly, private loan borrowers had higher levels of remaining need after grants and federal need-based aid were accounted for. Although students in general continue to see rising prices and levels of remaining need, those who take out private loans may choose alternative borrowing instead of taking fewer classes or in the case of independent students working more hours while enrolled.
Professional and graduate degree studentsStudents in post-baccalaureate studies are distinguished by degree program, either as a professional degree student, graduate degree student, or
post-baccalaureate student not in a degree program.29 Professional students are defi ned as those enrolled in one of ten fi elds of study: dentistry, medicine, optometry, osteopathic medicine, pharmacy, podiatric medicine, veterinary medicine, chiropractic, law, and theological professions (NCES 2004). During 2003–04, 24 percent of professional degree students borrowed private loans with an average amount of $10,727. Graduate degree students are those enrolled in master’s or doctoral degree programs in other fi elds. Five percent of graduate degree students in the same year borrowed private loans with an average amount of $8,329.
Like undergraduates, professional and graduate students tend to take out private loans to meet high prices and remaining need; however, these students show substantially different work, income, and borrowing characteristics than do the majority of undergraduate, and especially dependent undergraduate, students. By defi nition, students in post-baccalaureate programs are independent, many living on their own as a family of one and attending school full-time. Further, professional students tend to have notably lower incomes, perhaps because most do not participate full-time in the workforce (see fi gures 16 and 17).
Among post-baccalaureate students, some differences between borrowers and nonborrowers may point to reasons why they turned to private loans. For example, among both professional and graduate students, signifi cantly greater proportions of borrowers than nonborrowers attended a private not-for-profi t institution. For graduate students, signifi cantly more
0
$5,000
$10,000
$15,000
$20,000
$25,000
$30,000
$35,000
$40,000
$45,000
$31,290
$41,676
$16,153
$29,440
Professional
Nonborrower Borrower Nonborrower Borrower
Graduate
FIGURE 18: Average price of attendance for graduate and professional degree students in 2003–04, by private loan borrower status
Note: The price of attendance is equal to the sum of tuition and fees plus total non-tuition expenses.
Source: NCES 2004
29 Due to data limitations, this report discusses only those in professional or graduate degree programs.
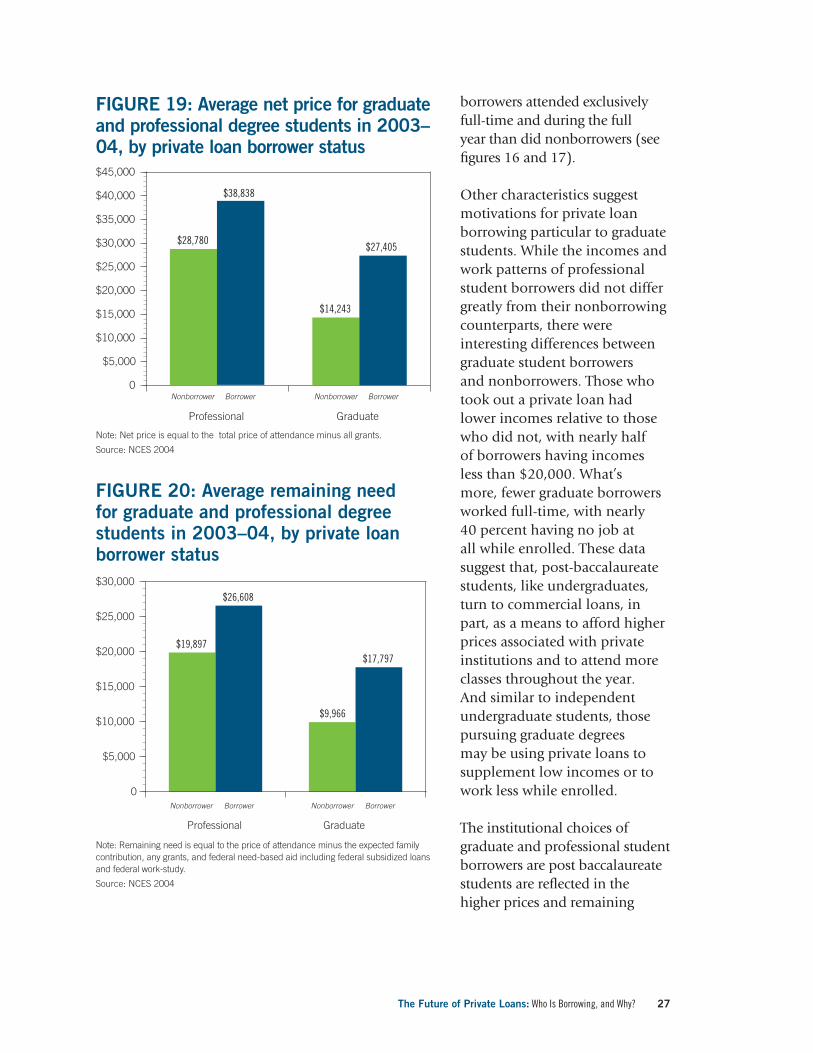
The Future of Private Loans: Who Is Borrowing, and Why? 27
borrowers attended exclusively full-time and during the full year than did nonborrowers (see fi gures 16 and 17).
Other characteristics suggest motivations for private loan borrowing particular to graduate students. While the incomes and work patterns of professional student borrowers did not differ greatly from their nonborrowing counterparts, there were interesting differences between graduate student borrowers and nonborrowers. Those who took out a private loan had lower incomes relative to those who did not, with nearly half of borrowers having incomes less than $20,000. What’s more, fewer graduate borrowers worked full-time, with nearly 40 percent having no job at all while enrolled. These data suggest that, post-baccalaureate students, like undergraduates, turn to commercial loans, in part, as a means to afford higher prices associated with private institutions and to attend more classes throughout the year. And similar to independent undergraduate students, those pursuing graduate degrees may be using private loans to supplement low incomes or to work less while enrolled.
The institutional choices of graduate and professional student borrowers are post baccalaureate students are refl ected in the higher prices and remaining
0
$5,000
$10,000
$15,000
$20,000
$25,000
$30,000
$35,000
$40,000
$45,000
$28,780
$14,243
$38,838
$27,405
Professional
Nonborrower Borrower Nonborrower Borrower
Graduate
Note: Net price is equal to the total price of attendance minus all grants.
Source: NCES 2004
0
$5,000
$10,000
$15,000
$20,000
$25,000
$30,000
$19,897
$26,608
$9,966
$17,797
Professional
Nonborrower Borrower Nonborrower Borrower
Graduate
FIGURE 20: Average remaining need for graduate and professional degree students in 2003–04, by private loan borrower status
Note: Remaining need is equal to the price of attendance minus the expected family contribution, any grants, and federal need-based aid including federal subsidized loans and federal work-study.
Source: NCES 2004
FIGURE 19: Average net price for graduate and professional degree students in 2003–04, by private loan borrower status
The Future of Private Loans: Who Is Borrowing, and Why?28
need faced by these students relative to nonborrowers (see fi gures 18, 19, and 20).30 At the same time, professional and graduate students face distinct needs that often differ by fi eld of study. For example, 63 percent of professional private borrowers were law students—almost two times the proportion of law students in the nonborrowing population. Among nonborrowers, 22 percent were medical students. 31 Among graduate students, MBA and other master’s degree students made up substantial proportions of borrowers, although this distribution did not differ greatly from that of nonborrowers. Because students in different degree programs face varying needs, private loans targeted to graduate and professional students are often packaged distinctly by program. Lending agencies catering to graduate and professional students offer a variety of loans distinctly for business, medical, dental, law, health, and other graduate degree programs to be used to meet the price of attendance. Loans are also available for bar exams and relocation costs for medical and dental residencies, which are calculated expenses in students’ price of attendance.
Because of the limited receipt of other forms of aid, professional and graduate students rely heavily on federal Stafford loans and largely at the maximum levels. Of those advanced-degree students who had private loans and received any Stafford loan, 91 percent of professional students and 63 percent of graduate students received a maximum
BOX 4: Graduate and Professional PLUS loans
The new Graduate and Professional PLUS loan program offers graduate and professional students the opportunity to borrow federal loans up to their price of attendance minus all other aid sources. To apply for a PLUS loan, graduate and professional students must
have passed a credit check, similar to that required of parents applying for a PLUS loan; fi lled out the federal FAFSA; and applied for the maximum Stafford loan for which they qualify. The interest rate for Graduate and Professional PLUS loans is fi xed at 7.9 percent for the Direct Loan program and 8.5 percent for the FFEL program. PLUS loans may be used for tuition, housing, food, books, and some transportation expenses, although expenses outside of the price of attendance (such as bar exams and medical residency expenses) are not covered. Therefore, professional and graduate students may still borrow private loans to cover these expenses outside of the student budget (EdFund 2006; Finaid.org 2006b; NASFAA 2006).
30 NPSAS data show that graduate and professional borrowers with net prices and remaining need of $10,000 or higher were also more likely to borrow than those facing lower net prices and remaining need. However, low sample sizes warrant caution in interpreting these data. 31 Some medical students are awarded exceptional maximum amounts of Stafford loans, which may point to one reason why these students constitute a smaller proportion of professional private loan borrowers than those in law degree programs.
The Future of Private Loans: Who Is Borrowing, and Why? 29
amount for all Stafford loans (see fi gures 16 and 17). As with undergraduate students, some post-baccalaureate students do not receive Stafford loans, particularly among graduate students. Many of the reasons undergraduate borrowers do not use Stafford loans may apply to graduate and professional students, including privacy concerns, varying levels of eligibility, or exhausted federal loan limits. Because of the data limitations, however, it is not possible to draw defi nitive conclusions about why some private loan borrowers forgo the Stafford loan program.
In sum, the high prices and high unmet need faced by post-baccalaureate borrowers on average, especially relative to nonborrowers, are just two reasons why these students turned to alternative loans. These higher prices and levels of need likely refl ect that more of these students attended private institutions compared with nonborrowers. Other reasons for private borrowing among graduate students include possibly making a trade between borrowing more and reducing work while enrolled.
Now, graduate and professional students have the option of taking out a PLUS loan to cover the price of attendance, after all other aid is subtracted (see box 4). Experts interviewed for this report all agreed that Graduate and Professional PLUS loans will most likely slow private borrowing among post-baccalaureate students, at least during the short term. However, lenders believed that limits on how students are able to use PLUS loans mean a proportion of these students will still turn to private loans. For instance, graduate and professional students may still have expenses not covered by the price of attendance.
It will be important to watch the implementation of Graduate and Professional PLUS loans, particularly how administrators use the funds to develop students’ fi nancial aid packages. At least one administrator noted that, for his institution, Graduate and Professional PLUS loans will not be made a part of the initial fi nancial aid package, but when students have exhausted all other forms of aid they will be presented with the pros and cons of PLUS and private loans. One reason fi nancial aid administrators may be unlikely to offer these products to students until they have exhausted other forms of federal, state, and institutional aid is because the interest on these loans is not subsidized while a student is enrolled. However, PLUS loans offer more competitive interest rates to graduate and professional students than they would typically receive from private loan providers. Moreover, PLUS loans are guaranteed against default, which makes them a lower-risk option for lenders and investors than private loans. Some lenders and aid administrators have put information on their Web sites specifi cally to help graduate and professional students decide between private and PLUS loans.

The Future of Private Loans: Who Is Borrowing, and Why? 31
Legislative changes: Loan agencies acknowledge the growth of private loans could be affected by regulatory changes made to the federal student loan program, specifi cally substantial increases in annual and aggregate loan limits. As discussed in previous sections, students who borrow private loans do so largely as a supplement to federal borrowing. Loan agencies note that if federal loan limits were increased substantially, the demand for private loans might be signifi cantly reduced (The First Marblehead Corporation 2005). However, the most recently legislated annual Stafford limit increases were not seen as substantial enough to cause a dramatic change to private borrowing among undergraduate borrowers. If anything, there may be a decline in private borrowing among fi rst- and second-year undergraduates and a commensurate increase in borrowing among third- and fourth-year undergraduates. Most lenders and administrators interviewed agreed that the nominal increase in yearly limits for Stafford loans does not come close to meeting the increased fi nancial needs of students to pay for college.
There was an expectation that the new Graduate and Professional PLUS loan program will have a large impact on private borrowing among these students, but only in the short term. Graduate and Professional PLUS loans, which carry a maximum fi xed rate of 7.9 or 8.5 percent, will act as strong competition for private loans, which can carry a variable interest rate between 8.5 and 10 percent in today’s environment (Fitch Ratings 2006b). Yet, it is the expectation of lenders at least that post-baccalaureate students will likely continue to turn to private loans for expenses not covered by PLUS loans. The implementation of this program will have to be watched closely to see if professional and graduate students continue to rely on private loans for some of their fi nancing.
Economic conditions and changing interest rates: Statements by lenders in their 10-K forms note that the demand for student loans in general could be reduced in a higher interest rate environment or an economic downturn; students may delay postsecondary education, enroll
What is the future of private loans within the student lending industry?
Because the private loan industry is in its infancy, predicting the volume growth and future profi tability to loan agencies is diffi cult. It is acknowledged that private loans have experienced record growth. Whether that growth will be sustained in the coming years depends on a variety of factors, including possible legislative changes made to
federal student loan policies, general economic and interest rate environments, the conditions of the student loan securitization market, the development of changing marketing strategies, and competition, to name a few. It is impossible to make defi nitive statements about the future mix of student loans and the role that private loans will play, but the following section discusses areas that may affect alternative loan growth taking into account statements made by loan agencies in their annual 10-K reports as well as information gathered from interviewees.
The Future of Private Loans: Who Is Borrowing, and Why?32
in lower cost institutions, or change their attendance patterns (Student Loan Corporation 2005; SLM Corporation 2005). This scenario particularly impacts private student loan volume because, as the fi nancial aid data suggest, students turn to alternative loans largely to afford high priced institutions and attend more classes throughout the year. On the other hand, if interest rates fall, private loans could be more appealing, especially to those who qualify for the best rates. Nonetheless, the role that economic conditions and interest rates play in the demand for private loans is important to consider as they affect a student’s ability to repay all student loans, including private loans (Student Loan Corporation 2005; SLM Corporation 2005). And even though private loans may be guaranteed or insured by third-party agencies, because there is no federal guarantee, losses that companies may incur from increasing default rates could impact the profi tability and future growth of this market.
Student loan securitization: The profi tability of private loans is also affected by secondary markets. As discussed earlier, student loan agencies often bundle and sell loan products through capital markets, as asset-backed securities. Many agencies use the cash received from this process to fund new lending. Changes in the securities market or decreased interest from investors may result in reduced funds for future lending and reduced profi tability of student loans, including private loans (The First Marblehead Corporation 2005; Student Loan Corporation 2005; SLM Corporation 2005).
Changing marketing strategies and increased competition: As the private loan industry continues to mature, major lenders expect competition to increase and the currently growing trend of direct-to-consumer marketing to become the dominant marketing strategy. This is just one area in which increasing competition is seen as lenders are seeking to reach students early and build relationships for future fi nancial services. Further, some students are increasingly conducting their own research for education fi nancing options.
The increased competition expected within the private loan industry could be one factor leading to lower interest rates for borrowers, in particular those who qualify for the best interest rates. However it is unclear if those who do not have favorable credit histories or a cosigner would benefi t from increasing competition. Further, there are concerns about the consistency of practices among the many lenders entering the market. Industry leaders acknowledged the fact that direct-to-consumer loans are the most likely area in which undesirable lending practices could emerge; however, lenders did not seem to believe that such practices are becoming widespread.
Other policy and loan experts were less optimistic. As one state policy executive noted, those who may be most vulnerable to unfavorable lending practices, such as low-income families, would be least likely to come forward and speak out. Further, there was an expressed need for all lenders, regardless of their marketing venue, to exhibit more transparency about the minimum, maximum, and average interest rates students face to allow for better comparison-shopping. 32
32 Many lenders advertise only the lowest interest rate available for borrowers with the most favorable credit history and do not give details on borrowing terms until an application is submitted. This information is often withheld to prevent cost-based comparisons (Finaid.org 2006a).
The Future of Private Loans: Who Is Borrowing, and Why? 33
This growing trend will make an educated consumer base that can sort through the various loan products even more critical. In particular, consumers of private loans need transparency about the variability that accompanies private loan eligibility requirements, terms, and conditions for individual customers. Those not likely to qualify for the lowest interest rates and fees must be equipped with the tools to make favorable decisions. Providing information is especially important in light of the demographics of private loan borrowers: although most undergraduate dependent students come from middle- to upper-middle-income families and may have greater access to a creditworthy cosigner, most independent borrowers are lower income. For these students, the impact of high
interest rates and fees may be particularly acute. Likewise, many professional and graduate students are low income; and although many may enter high-paying fi elds, those entering low-paying fi elds will need to understand the impact that borrowing privately will have on other debt that has been incurred.
Overall, there are varied expectations and predictions about the future of private loans. Considering the demographics of private loan borrowers and the developing trends within the private loan industry is important for the broader policy debate on student fi nancing in higher education. Given that private loan industry is expected to become dominated by direct-to-consumer marketing, students will be faced with increasingly complex decisions about funding their postsecondary education and how to fi ll any remaining need. Further, not everyone receives perfect information about fi nancial aid and studies have found that students with the least information are often those from low- and modest-income backgrounds. Thus the need for targeted outreach to these students
Conclusion
As decision makers consider the issue of fi nancial aid and rising higher education costs, many are struggling to gain a clear understanding of just how students and families are paying for postsecondary education. Federal, state, and institutional sources of fi nancial aid are insuffi cient in meeting the total fi nancial need of
many students attending college and the reliance on private loans by many students to fi ll remaining need is steadily being acknowledged. Most experts agree that barring major reform in the federal Stafford loan program—such as uncapping cumulative loan limits or raising annual limits to the total price of attendance less grants—a substantial proportion of students will continue to turn to the private market to fi ll some of their fi nancial need.
Not everyone receives perfect information about fi nancial aid and studies have found that students with the least information are often those from low- and mod-est-income backgrounds.

The Future of Private Loans: Who Is Borrowing, and Why?34
to ensure they are receiving comprehensive information about the pros and cons of private loan borrowing will become increasingly critical. What’s more, the implications of relying at all on private funding to fi ll the remaining need for these students constitute an important point of discussion among education leaders and policymakers alike.
The Future of Private Loans: Who Is Borrowing, and Why? 35
ReferencesBlock, Sandra. 2006. Private Student Loans
Pose Greater Risk. USA Today, October 25.
Clinedinst, Melissa, Alisa Cunningham, and Jamie Merisotis. 2003. Characteristics of Undergraduate Borrowers: 1999–2000. NCES 2003–155. Washington, DC: U.S. Department of Education, National Center for Education Statistics.
College Board. 2004. Trends in Student Pricing. Washington, DC: College Board.
___________. 2006a. Trends in Student Aid. Additional Data Tables and Charts. Available at: http://www.collegeboard.com/press/releases/150634.html
__________. 2006b. Trends in Student Aid. Washington, DC: College Board
EdFund. 2006. Federal PLUS Loans: A New Option for Graduate and Professional Students. Focus: A Journal of Ideas about Financial Aid and Higher Education, 2, (2): 15.
The Education Resources Institute. 2006. Frequently Asked Questions. Available at: http://www.teri.org/loan-center/students-parents/faqs.asp (accessed October 17, 2006).
Finaid.org. 2006a. Private Education Loans. Available at: http://fi naid.org/loans/privateloan.phtml (accessed June 19, 2006).
_________. 2006b. Student Loans. Available at: http://www.fi naid.org/loans/. (accessed June 19, 2006).
_________. 2006c. Financial aid glossary. Available at: http://www.fi naid.org/questions/glossary.phtml#c (accessed June 19, 2006).
The First Marblehead Corporation. 2005. Form 10-K. United States Securities and
Exchange Commission. FY ending June 30, 2005. Available at: http://secfi lings.nasdaq.com/edgar_conv_html%2f2005%2f09%2f07%2f0001104659-05-043131.html#FIS_BUSINESS (accessed April 27, 2006).
Fitch Ratings. 2006a. Private Student Loan ABS Tutorial. Available at: http://www.fi tchratings.com/corporate/sectors/criteria_rpt.cfm?sector_fl ag=1&marketsector=2&detail=&body_content=crit_rpt (accessed June 19, 2006).
__________. 2006b. Do Recent Legislative Changes Make the Grade for U.S. Student Loan ABS? http://www.fi tchratings.com/corporate/sectors/special_reports.cfm?sector_fl ag=1&marketsector=2&detail=&body_content=spl_rpt (accessed June 19, 2006)
Horn, Laura, Christina Chang Wei, and Ali Berker. 2002. What Students Pay for College: Changes in Net Price of College Attendance Between 1992–93 and 1999–2000. NCES 2002-174. Washington, DC: U.S. Department of Education, National Center for Education Statistics.
Hupalo, John. 2006. Comparing Student Loans to… The Greentree Gazette, January.
In a Gazette Minute with Patricia McWade, Dean Student Financial Services Georgetown University. 2006. The Greentree Gazette, May.
NASFAA. See: National Association of Student Financial Aid Administrators.
National Association of Student Financial Aid Administrators (NASFAA). 2006. Summary of The Defi cit Reduction Act of 2005. Available at: http://www.nasfaa.org/publications/2006/greconciliationsummary020206.html (accessed June 19, 2006).
The Future of Private Loans: Who Is Borrowing, and Why?36
NCES (See U.S. Department of Education)
Pearson, John. 2006. Are Home Equity Loans Without Peer? Why the Ever-Popular Home Equity Line of Credit Should be Reconsidered as an Education Financing Option. The Greentree Gazette, March.
Private Consolidation Loans. 2006. The Greentree Gazette, July.
Sheldon, Paul. 2004. PLUS Loans Versus Private Loans: Why the Differential Growth. The Greentree Gazette, September. Available at: http://www.tgslc.org/pdf/privateloan.pdf (accessed June 19, 2006).
SLM Corporation. 2005. Form 10-K. United States Securities and Exchange Commission. December 31, 2005. Available at: http://www2.salliemae.com/NR/rdonlyres/A0450B59-A4A0-4586-9B4C-253FF335008B/4373/200510K.pdf (accessed April 27, 2006).
Stoll, Adam. 2004. Federal Student Loans: Terms and Conditions for Borrowers. Washington, DC: Congressional Research Service.
The Student Loan Buying Guide. 2006. The Greentree Gazette, July.
The Student Loan Corporation. 2005. Form 10K. United States Securities and Exchange Commission. December 31, 2005. Available at: http://www.sec.gov/Archives/edgar/data/893955/000120012906000007/form10k123105.htm (accessed May 17, 2006).
Sturrock, Carrie. 2006. Students Resort to Private Loans, Staggering Debt. San Francisco Chronicle, October 25.
TeachMeFinance.com. 2006. Explain the Three-Month Treasury Bill. Available at: http://www.teachmefi nance.com/Financial_Terms/three-month_Treasury_bill.html (accessed August 10, 2006).
TERI. See The Education Resources Institute.
Thanks to the Banks. 2006. The Economist. February 18.
U.S. Department of Education. 2006. Funding Education Beyond High School: The Guide to Federal Student Aid. Washington, DC: U.S. Government Printing Offi ce.
___________. National Center for Education Statistics (NCES). 2000. National Postsecondary Student Aid Study 1999–2000 (NPSAS:2000). Data Analysis System. <nces.ed.gov/das/>.
___________. National Center for Education Statistics (NCES) 2004. National Postsecondary Student Aid Study 2003–2004 (NPSAS: 2004). Data Analysis System. <nces.ed.gov/das/>
U.S. General Accounting Offi ce (GAO). 1996. Higher Education: Tuition Increasing Faster than Household Income and Public Colleges’ Costs. GAO/HEHS-96-154. Washington, DC.
United States Student Association. 2006. Letter to Consumer Complaint Bureau, September 18. Available at: http://www.newamerica.net/fi les/FTC%20Complaint.pdf (accessed on October 30, 2006).
Vargas, Joel H. 2004. College Knowledge: Addressing Information Barriers to College. Boston: The Education Resources Institute.
Wegmann, Catherine A., Alisa F. Cunningham, and Jamie P. Merisotis. 2003. Private Loans and Choice in Financing Higher Education. Washington, DC: Institute for Higher Education Policy.
When a Stafford Loan Isn’t Enough: Comparing PLUS Loans, Private Student Loans, and HELOCs. 2006. The Greentree Gazette, March.

www.ihep.org