Embed Size (px)
Citation preview

THE FUTURE OF PRODUCTIVITY: WHAT CAN POLICY DO?
Giuseppe NicolettiStructural Policy Analysis Division, Economics Department, OECD
Joint IOBE– Bank of Greece Seminar
Solving the Productivity Conundrum
Athens, 25 April 2016

The OECD report
Available at:
http://www.oecd.org/economy/the
-future-of-productivity.htm
Book + 5 page policy note +
technical papers + videos and ppt
Authors:
Müge Adalet McGowan
Dan Andrews
Chiara Criscuolo
Giuseppe Nicoletti

1. "Productivity spillovers from the global frontier and public policy: Industry-level evidence", by Saia, A., D. Andrews and S. Albrizio (2015)
2. Frontier firms, technology diffusion and public policy: Micro evidence from OECD countries, by Dan Andrews, Chiara Criscuolo and Peter N. Gal (2015)
3. "Labour market mismatch and labourproductivity: Evidence from PIAAC Data", by Adalet McGowan, M. and D. Andrews (2015)
4. "Skill mismatch and public policy in OECD countries", by Adalet McGowan, M. and D. Andrews (2015)
The four OECD papers I will mainly summarise
here (and later developments)

• Why bother about productivity?
– Slowdown seems structural and is driven by MFP
• Where is the problem?
– The debate and our approach
– Broken diffusion machine
– Resource misallocation
• What is role of structural reform?
• Conjectures and work ahead
• Take aways
Roadmap

Differences in GDP per capita mostly reflect labour productivity gaps
Percentage differences compared with the upper half of OECD countries, 2013
Source: OECD Going for Growth Database.
Productivity: why bother?

Productivity is likely to be the key driver of future growth
6
Productivity: why bother?
GDP per capita, 2000-2060
Source: Policy Challenges for the Next 50 Years, H. Braconier, G. Nicoletti and B. Westmore (2013) .

But aggregate labour productivity growth
slowed, even before the crisis…
Labour productivity growth since 1990
GDP per hour worked (China and India refer to GDP per worker)
Productivity: why bother?
OECD calculations based on The Conference Board (2015)
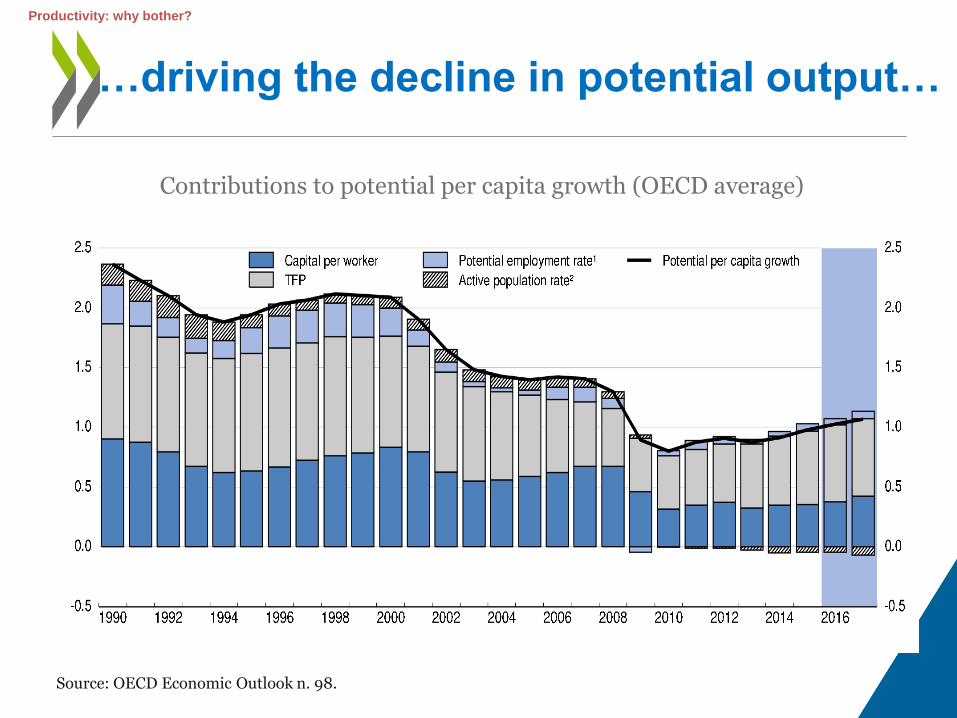
…driving the decline in potential output…
Source: OECD Economic Outlook n. 98.
Contributions to potential per capita growth (OECD average)
Productivity: why bother?

0
0.5
1
1.5
2
2000 2002 2004 2006 2008 2010 2012 2014
Capital per worker TFP
Productivity: why bother?
… with MFP declining pre-crisis and capital
deepening weakening post-crisis…
Contributions to trend labour productivity growth in percentage points

• Decline in capital deepening is worrying but at least partly cyclical– Gap between current and steady state levels of
investment ratios around 2.5 points of GDP in a third of OECD countries (7 points in Greece)
• Moreover:– Capital has diminishing returns, ideas do not
– The very extent of steady state capital deepening depends on developments in MFP
– It is not only the sheer amount of capital and labour that matters for growth but the way it is allocated, which affects MFP
• There are signs that the decline in MFP growth may be structural
Why focus on decline in MFP growth?
Productivity: why bother?

There are signs that the slowdown is structural
Start-up rates have been declining
Investment in KBC has slowed down
significantly
Average annual growth
Source: OECD calculations based on Corrado et al., (2012).
Source: C. Criscuolo, P. N. Gal and C. Menon (2014), “The Dynamics of Employment Growth: New Evidence from 18 Countries”, OECD Science, Technology and Industry Policy Papers, No. 14.
Productivity: why bother?

Optimists:
Brynjolffson/McAfee
Mokyr
Jovanovic
…
The debate is not settled…
Pessimists:
Gordon
Fernald
Cowen (?)
…
Productivity: where is the problem?
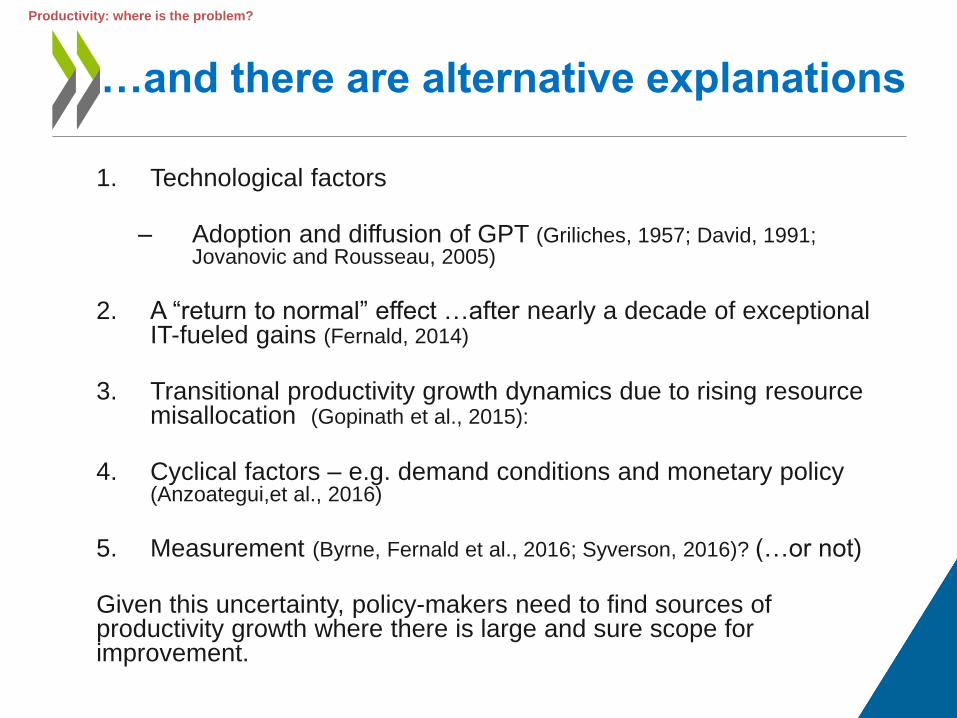
1. Technological factors
– Adoption and diffusion of GPT (Griliches, 1957; David, 1991; Jovanovic and Rousseau, 2005)
2. A “return to normal” effect …after nearly a decade of exceptional IT-fueled gains (Fernald, 2014)
3. Transitional productivity growth dynamics due to rising resource misallocation (Gopinath et al., 2015):
4. Cyclical factors – e.g. demand conditions and monetary policy (Anzoategui,et al., 2016)
5. Measurement (Byrne, Fernald et al., 2016; Syverson, 2016)? (…or not)
Given this uncertainty, policy-makers need to find sources of productivity growth where there is large and sure scope for improvement.
…and there are alternative explanations
Productivity: where is the problem?

• Three key sources of aggregate productivity growth:
1. Innovation
2. Diffusion (spillovers from frontier and catch up)
3. Resource reallocation (capital, labour and skills)
• Effective diffusion and reallocation are also key for encouraging innovation
• Within-firm gains in productivity are magnified in the aggregate by effective resource reallocation towards high-productivity firms
• All these factors are strongly influenced by policy
The sources of MFP growth
Productivity: where is the problem?

A simplified framework
Aggregateproductivity growth
Innovation spillovers
from frontier
Catch up to the frontiervia adoption
Structural factors
Policies and institutions
Within-firm or sector gains
Across-firm or sector
reallocation
Entry and exit
Within-firm or sector gains
Across-firm or sector
reallocation
Entry and exit Diffusion
Innovation
Productivity: where is the problem?

• Using the framework, did aggregate productivity slow because:
1. Slowing growth at the global productivity frontier?
2. Stalling diffusion: slowing productivity convergence to the global frontier?
3. Rising resource misallocation? (ongoing work)
• We are focusing on obstacles to diffusion and reallocation because:
– They are closely related to widespread observed heterogeneity in firm performance
– They offer the largest scope for improving aggregate productivity
– They are most influenced by domestic policies
– If improved they also give incentives for innovation
– They have a link with inclusion (evidence of rising cross-firm wage inequality)
The issues
Productivity: where is the problem?

Work-horse models to investigate
diffusion and reallocation issues
1. A spillovers from and catch-up to frontier specification
Regressing MFP growth on growth at the frontier and the distance from frontier
(Griffith et al 2004; Nicoletti and Scarpetta, 2003; Bourles et al 2013; Andrews et al. 2015)
tcsitcsti
Glo
tcsi
GloNat
tcsi
Nat
NatGlo
tcs
GloNat
tcsi
Nat
tcsi
X
MFPMFP
GapGapMFP
,,,,1,
1,,,1,,,
1,,1,,,,,,
The gap terms capture the distance from the frontier:
Policy effects are captured by adding interaction and Rajan-Zingales termscsicsFcsi MFPMFPGap ,,,,,,
2. Using an Olley-Pakes decomposition of aggregate productivity
Regressing the gaps in O-P terms on interaction between policies and exposure
Rajan-Zingales terms)
3. Using the Haltiwanger dynamic approach to the efficiency of reallocation
Regressing changes in firm size on their initial level of MFP (ongoing work)
Productivity: where is the problem?
i i
iii
i
ii PppNPP ))(()/1(__

Innovation is implemented by a special kind of
firm but we know little about global frontier firms
What are the characteristics of firms at the
global productivity frontier?
How has the productivity performance of global
frontier firms evolved over time?
Have characteristics of global frontier firms
changed over time?
First issue: what’s happening at the
global frontier?
The global frontier

The globally most productive firms – who are they?
Source: Andrews, D. C. Criscuolo and P. Gal (2015), “Frontier firms, technology diffusion and public policy: micro evidence from OECD countries”, OECD.
Mean Std Dev Number Mean Std Dev Number
Productivity 4.06 1.04 3657 2.51 0.91 294031 1.5 ***
Employment 309 3770 3657 229 4119 294031 81
Capital stock (€m) 31 355 3657 19 343 294031 12 **
Turnover (€m) 250 1731 3657 59 754 294031 191 ***
Profit rate 0.57 0.33 3657 0.13 6.33 294031 0.45 ***
Age 21.5 20.3 3657 23.2 18.6 294031 -1.7 ***
MNE status*
Probability 0.47 0.50 3450 0.28 0.45 310765 0.19 ***
Patenting status
Depreciated patent stock 3.71 45.15 3657 0.90 56.17 294031 2.8 ***
Multi Factor Productivity (Solow)
Selected OECD Countries, 2005 (unless otherwise noted)
Global Frontier Firms Non-Frontier FirmsDifference
in means
Mean firm characteristics: frontier firms and non-frontier firms
“Frontier firms” corresponds to the average of the 100 globally most productive (Solow MFP) firms in each 2-digit sector. “Non-frontier firms” is the average of all other firms.
The global frontier
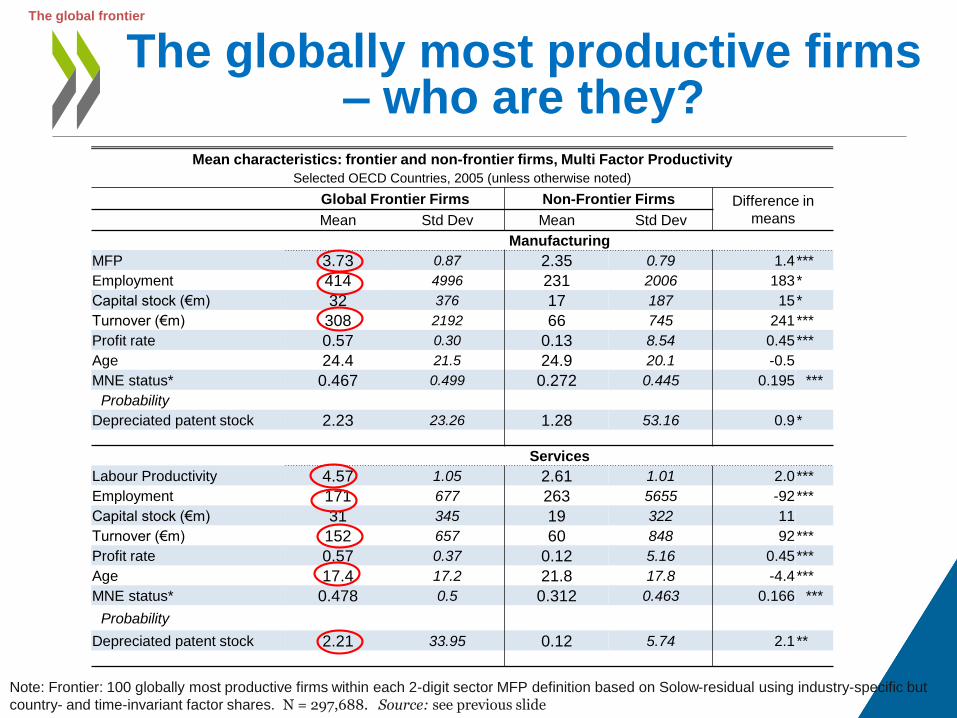
Note: Frontier: 100 globally most productive firms within each 2-digit sector MFP definition based on Solow-residual using industry-specific but
country- and time-invariant factor shares. N = 297,688. Source: see previous slide
Mean characteristics: frontier and non-frontier firms, Multi Factor Productivity
Selected OECD Countries, 2005 (unless otherwise noted)
Global Frontier Firms Non-Frontier Firms Difference in
meansMean Std Dev Mean Std Dev
Manufacturing
MFP 3.73 0.87 2.35 0.79 1.4***
Employment 414 4996 231 2006 183*
Capital stock (€m) 32 376 17 187 15*
Turnover (€m) 308 2192 66 745 241***
Profit rate 0.57 0.30 0.13 8.54 0.45***
Age 24.4 21.5 24.9 20.1 -0.5
MNE status* 0.467 0.499 0.272 0.445 0.195 ***
Probability
Depreciated patent stock 2.23 23.26 1.28 53.16 0.9*
Services
Labour Productivity 4.57 1.05 2.61 1.01 2.0***
Employment 171 677 263 5655 -92***
Capital stock (€m) 31 345 19 322 11
Turnover (€m) 152 657 60 848 92***
Profit rate 0.57 0.37 0.12 5.16 0.45***
Age 17.4 17.2 21.8 17.8 -4.4***
MNE status* 0.478 0.5 0.312 0.463 0.166 ***
Probability
Depreciated patent stock 2.21 33.95 0.12 5.74 2.1**
The global frontier
The globally most productive firms – who are they?

The globally most productive firms
-- coming from various countries
Source: Andrews, D. C. Criscuolo and P. Gal (2015), “Frontier firms, technology diffusion and public policy: micro
evidence from OECD countries”, OECD Productivity Working Paper No. 2.
The global frontier
The globally most productive firms
-- other characteristics
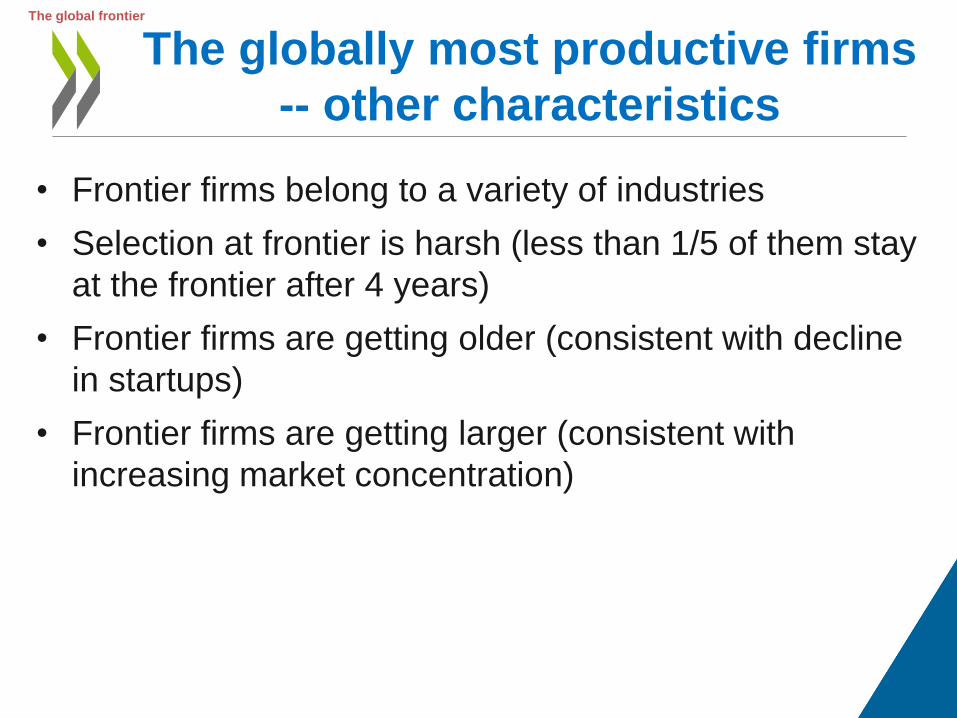
• Frontier firms belong to a variety of industries
• Selection at frontier is harsh (less than 1/5 of them stay
at the frontier after 4 years)
• Frontier firms are getting older (consistent with decline
in startups)
• Frontier firms are getting larger (consistent with
increasing market concentration)
The global frontier

Productivity research emphasizes widespread heterogeneity within narrowly-defined sectors (Syverson, 2004).
How do frontier productivity gains spread out?
Have non-frontier firms kept pace with the global frontier?
What factors might explain productivity divergence over time? (ongoing work)
Second issue: Is the diffusion machine
sputtering?
Diffusion of frontier productivity gains

Learning from the frontier is a more important
source of growth closer to the frontier
Average contribution of catch-up and learning to average annual growth in labour productivity, 1950-2013
Notes: The figure shows how the average contribution from catch-up and learning from the frontier varies with an economy’s distance from the frontier. Close to the frontier is defined as those country*year observations in the bottom quartile of the distance from the frontier distribution, while Far from the frontier refers to all other country*year observations. The estimates are calculated from a regression of growth in labour productivity on frontier growth and lagged distance from the frontier, where the United States is the frontier economy and is thus excluded from the regression. The data are averages over 5-year intervals and the regression also controls for country fixed effects and 5-year time fixed effects. The estimation is based on an unbalanced panel of 60 countries over the period 1950-2013.
Source: Saia, A., D. Andrews and S. Albrizio (2015)
Diffusion of frontier productivity gains

The pull of the global frontier is
less than that of the national one
(1) (2)
Explanatory variables Top 5% Top 10%
0.289*** 0.311***
(0.001) (0.002)
0.086*** 0.054***
(0.002) (0.002)
0.270*** 0.399***
(0.003) (0.005)
0.279*** 0.296***
(0.008) (0.009)
Control variables Yes Yes
Country * year fixed effects Yes Yes
Industry fixed effects Yes Yes
Observations 2,325,842 2,325,787
R-squared 0.144 0.148
*** p<0.01, ** p<0.05, * p<0.1
Growth at the global frontier
Distance between national and
global frontier (t-1)
Distance from national frontier (t-1)
Growth at the national frontier
Regressing MFP growth on the distance from the national and global frontier
Diffusion of productivity gains
Source: Andrews, D. C. Criscuolo and P. Gal (2015), “Frontier firms, technology diffusion and public policy: micro
evidence from OECD countries”, OECD Productivity Working Paper No. 2.
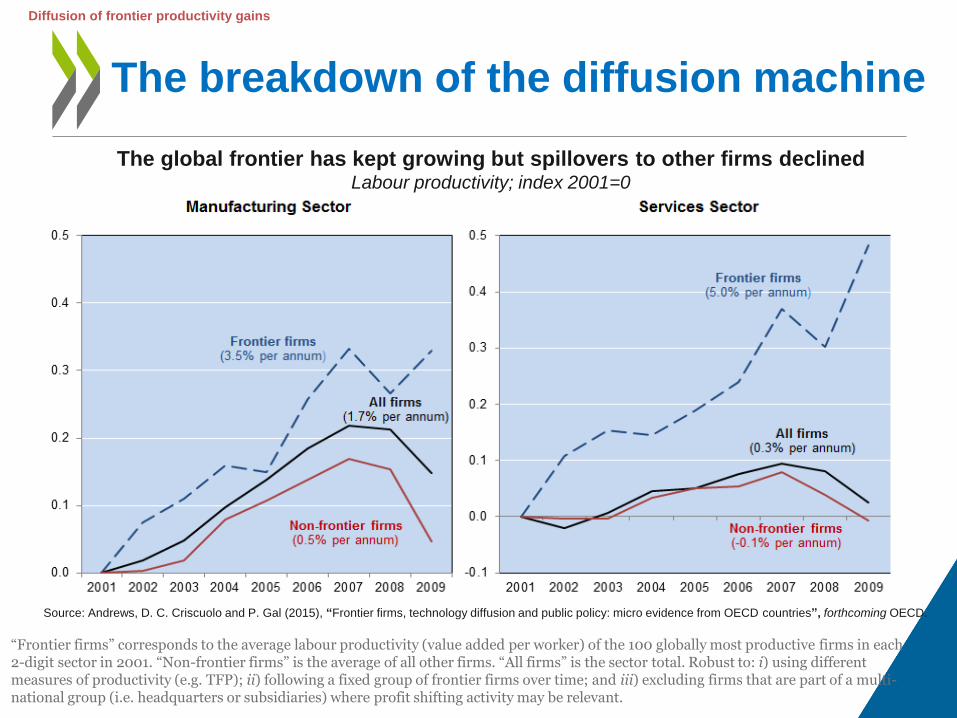
The breakdown of the diffusion machine
The global frontier has kept growing but spillovers to other firms declinedLabour productivity; index 2001=0
Source: Andrews, D. C. Criscuolo and P. Gal (2015), “Frontier firms, technology diffusion and public policy: micro evidence from OECD countries”, forthcoming OECD.
“Frontier firms” corresponds to the average labour productivity (value added per worker) of the 100 globally most productive firms in each 2-digit sector in 2001. “Non-frontier firms” is the average of all other firms. “All firms” is the sector total. Robust to: i) using different measures of productivity (e.g. TFP); ii) following a fixed group of frontier firms over time; and iii) excluding firms that are part of a multi-national group (i.e. headquarters or subsidiaries) where profit shifting activity may be relevant.
Diffusion of frontier productivity gains

Industry-level data also show
divergence from early 2000sUnweighted average of TFP in the non-farm business sector; index 1985=0
Source: OECD calculations based on Bourles et al (2013) dataset.
Diffusion of frontier productivity gains

• Three major structural factors were identified by OECD research:
– Connectedness to markets where frontier firms operate, via trade
– Efficiency of the reallocation mechanism
– Quantity and quality of the knowledge-based capital stock (e.g. managerial capital, R&D stock)
• Each of these factors increases significantly the ability to benefit from frontier growth
Diffusion comes easier to some
economies than others
Diffusion: the role of structural reform
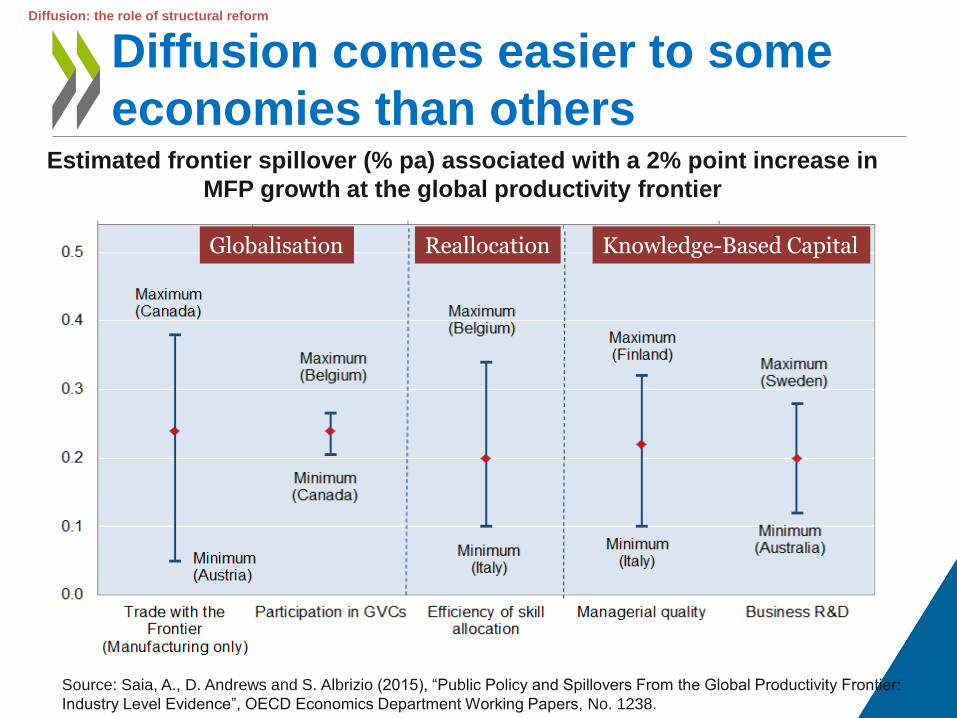
Diffusion comes easier to some
economies than othersEstimated frontier spillover (% pa) associated with a 2% point increase in
MFP growth at the global productivity frontier
Source: Saia, A., D. Andrews and S. Albrizio (2015), “Public Policy and Spillovers From the Global Productivity Frontier:
Industry Level Evidence”, OECD Economics Department Working Papers, No. 1238.
Globalisation Reallocation Knowledge-Based Capital
Diffusion: the role of structural reform

…and policies help explain why
Estimated frontier spillover (% pa) associated with a 2% point increase in MFP
growth at the global productivity frontier
Source: Saia, A., D. Andrews and S. Albrizio (2015), “Public Policy and Spillovers From the Global Productivity Frontier:
Industry Level Evidence”, OECD Economics Department Working Papers, No. 1238.
Entry and Exit Innovation policies
Diffusion: the role of structural reform

• Catch-up to the national frontier is easier in countries with less stringent
product market regulations (PMR) and higher business-university collaboration.
Much scope for national policies to
influence catch-up
Impact of policy reforms on the MFP growth of laggard firms, 2005
Reducing PMR from high level in Greece to the OECD average
% difference between industries with high and low firm churning
Diffusion: the role of structural reform
Source: Andrews, D. C. Criscuolo and P. Gal (2015), “Frontier firms, technology diffusion and public policy: micro evidence from OECD countries”,
OECD Productivity Working Paper No. 2.

Source: Andrews, D. and F. Cingano (2014), “Public Policy and Resource Allocation: Evidence from Firms in OECD
Countries”, Economic Policy, No. 29(78), pp. 253-296.
Contribution of the allocation of employment across firms
to the level of labour productivity; per cent
Europe does a poor job at channelling resources to more productive firms, esp. in market services
Productivity: the role of reallocation
Third issue: What is the role of
misallocation?

Resource misallocation is widespread in
Southern Europe
Source: Andrews and Cingano (2014), “Public Policy and Resource Allocation”, Economic Policy 29(78), pp. 253-296.
Static allocative efficiency: contribution of the allocation of employment
across firms to labour productivity; log points
Productivity: the role of reallocation

• Preliminary evidence from OECD and other sources suggests that the efficiency of reallocation has declined in some countries before and during the recent crisis, e.g.:– The ability of directing investment towards the most
productive firms appears to have decreased in Southern Europe (e.g. Spain, Italy)
– The “creative destruction” process has become less effective, with startups declining (see above) and the share of “zombie firms” in many OECD economies increasing over time
– The “cleansing” effect of the Great Recession has been more limited than in past recessions (e.g. US)
Misallocation of resources may have
increased since the early 2000s
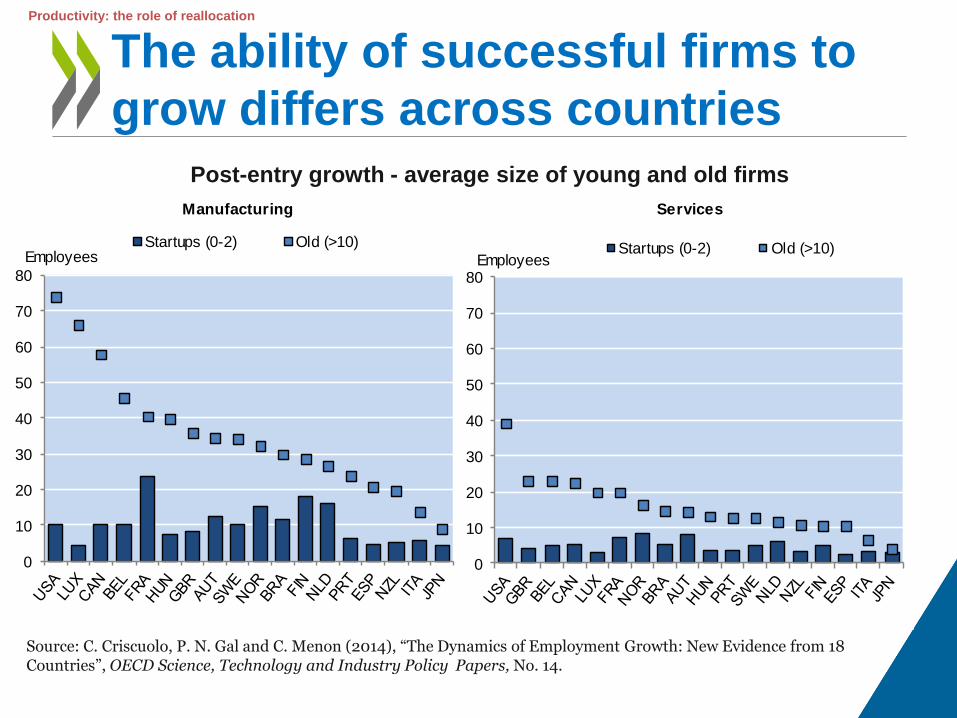
The ability of successful firms to
grow differs across countries
Post-entry growth - average size of young and old firms
Source: C. Criscuolo, P. N. Gal and C. Menon (2014), “The Dynamics of Employment Growth: New Evidence from 18 Countries”, OECD Science, Technology and Industry Policy Papers, No. 14.
Manufacturing Services
0
10
20
30
40
50
60
70
80
Startups (0-2) Old (>10)Employees
0
10
20
30
40
50
60
70
80
Startups (0-2) Old (>10)Employees
Productivity: the role of reallocation

Allowing frontier firms to grow can have a
strong impact on aggregate productivity
Source: Andrews, Criscuolo and Gal (2015), “Frontier firms, technology diffusion and public policy: micro
evidence from OECD countries ” OECD Mimeo.
How much higher would overall manufacturing sector labour productivity
be if national frontier firms were as productive and large as GF firms?
NF firms in Italy have productivity levels close to the GF but they are relatively small
… partly because scarce resources are trapped in many small and old firms
Productivity: the role of reallocation

Skill mismatch constrains labour productivity
Source: Adalet McGowan, M and D. Andrews (2015), “Labour market mismatch and labour productivity: evidence from PIAAC
data ” OECD Economics Department Working Paper, No. 1209.
Skill mismatch, particularly over-skilling, is harmful for productivity because it constrains the ability of innovative firms to attract skilled workers and grow
Productivity: the role of reallocation
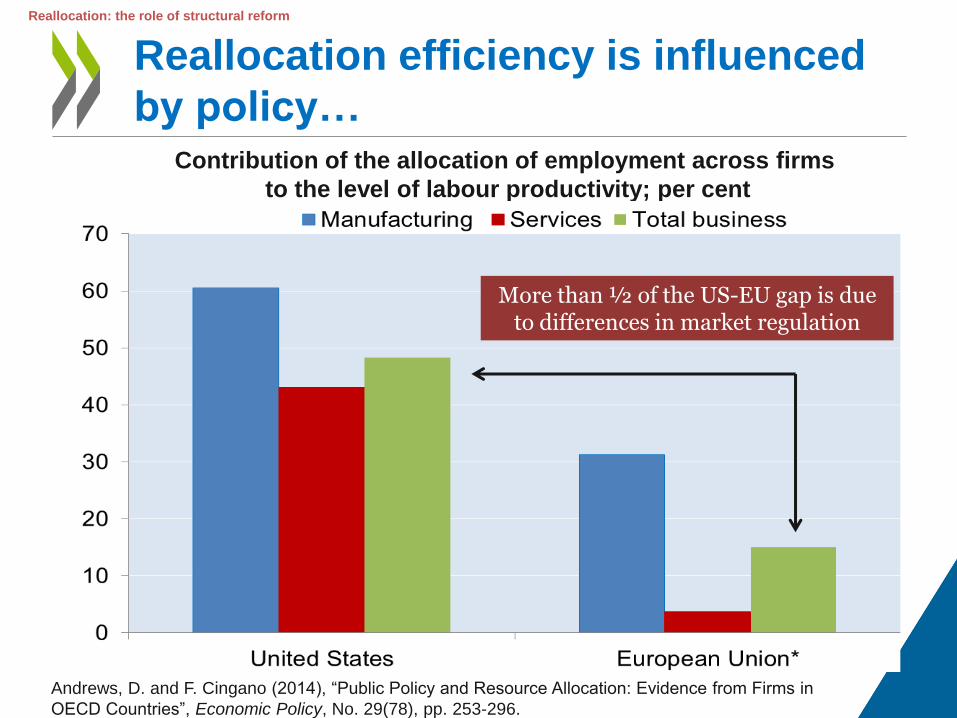
Reallocation efficiency is influenced
by policy…
Andrews, D. and F. Cingano (2014), “Public Policy and Resource Allocation: Evidence from Firms in
OECD Countries”, Economic Policy, No. 29(78), pp. 253-296.
Contribution of the allocation of employment across firms
to the level of labour productivity; per cent
More than ½ of the US-EU gap is dueto differences in market regulation
Reallocation: the role of structural reform

… as is the degree of skill mismatch
The probability of skill mismatch and public policies
Source: Adalet McGowan, M and D. Andrews (2015), “Skill mismatch and public policy in OECD countries”
OECD Economics Department Working Paper, No. 1210.
Entry and Exit Labour mobility Education
Reallocation: the role of structural reform

Policy reforms that facilitate the
growth of national frontier firmsImpact of policy reform to best practice on level of industry productivity
% difference between industries with high and low exposure to the policy
Source: Andrews, Criscuolo and Gal (2015), “Frontier firms, technology diffusion and public policy: micro
evidence from OECD countries ” OECD Mimeo.
Reallocation: the role of structural reform

• More accurate data and more work is needed to explore the evolutionof diffusion and reallocation and the role of structural and policy factors
• Why would productivity spillovers and the efficiency of resource reallocation decline over the past decade or so?
– Technology-related factors?
• “Winner takes all”
• Replication and diffusion of the “magic bundle” (tech+skills) more difficult
– Incentives and opportunities thwarted by inadequate institutions?
• Inappropriate design of IPRs
• Obsolete regulations and barriers to entry, especially in services, especially in Europe
• Market size a limiting factor in some areas, e.g. EU internal market for services
– Vested interests and lobbies resisted the penetration of new business models using new technologies, especially in services
– Easy credit, bank forbearance (linked to NPLs) and inappropriate insolvency regimes contributed to capital misallocation and the survival of zombie firms
– Declining competitive pressures in the most dynamic sectors
Work ahead and some conjectures
Productivity: the remaining issues

• The productivity slowdown is a serious structural issue that deserves the attention of researchers and policy-makers
• There are signs that slowing diffusion and rising misallocation of resources have played a role and may have been aggravated by the crisis
• As the causes and drivers of the slowdown are multifaceted, a panoply of structural (and perhaps macro) policies are needed
• There is evidence that a number of structural policies can help reverse the slowdown, independent of its precise causes
• But better understanding the nature and sources of the slowdown as well as the specific weaknesses in each country via a granular approach is essential to identify the most effective mix of policies
Take aways
Productivity: the remaining issues

• "Public policy and resource allocation: Evidence from firms in OECD countries" by Andrews, D. and F. Cingano (2012)
• "Do resources flow to patenting firms? Cross-country evidence from firm level data" by Andrews, D., C. Criscuolo and C. Menon (2014)
• “Cross-country Evidence on Start-Up Dynamics” by Calvino, F., C. Criscuolo and C. Menon (2015)
• “The Dynamics of Employment Growth: New Evidence from 18 Countries” by Criscuolo, C., P. Gal and C. Menon (2014)
• "Knowledge-based capital, innovation and resource allocation" by Andrews, D. and C. Criscuolo (2013)
Other related and relevant OECD
papers

Spares

45
Current investment-GDP ratios are below what is
needed to resume pre-crisis potential growth
Current and required steady-state levels of investment ratios
Source: OECD Economic Outlook 97 database; Lewis et al. (2014); and OECD calculations
Non-residential investment as a percentage of potential GDP
The gap is more than 2.5 points of GDP in a third of OECD countries
The rising role of fast-depreciating intangibles would require even stronger investment ratios
And so would do raising potential growth above pre-crisis rates

Data (I)Cross-country firm-level data Orbis
• The only source with a wide coverage
• 23 OECD countries, 2001-2009
• Both manufacturing and services, large and small firms
• Balance sheets and income statements
• Matched with patenting data and ownership linkages
• Limitation: coverage varies across countries and over time
• Developed EU countries generally more complete
20+ employees subsample to alleviate this
Extensive robustness checks
(sample, measurement, etc.)
• Ongoing work using updated data from circa 1997-2014
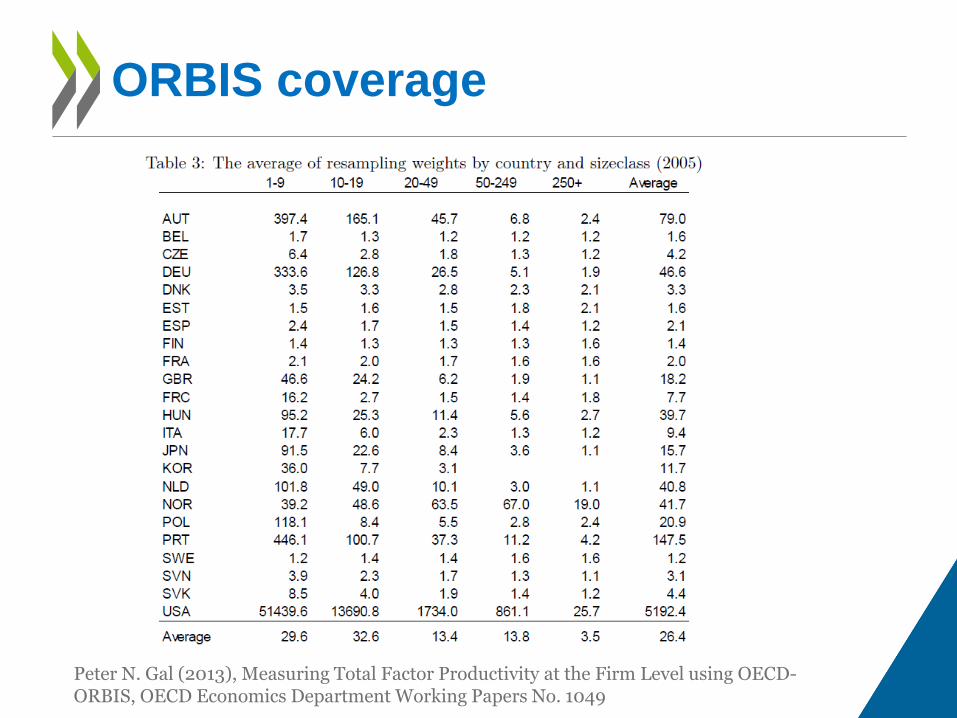
ORBIS coverage
Peter N. Gal (2013), Measuring Total Factor Productivity at the Firm Level using OECD-ORBIS, OECD Economics Department Working Papers No. 1049
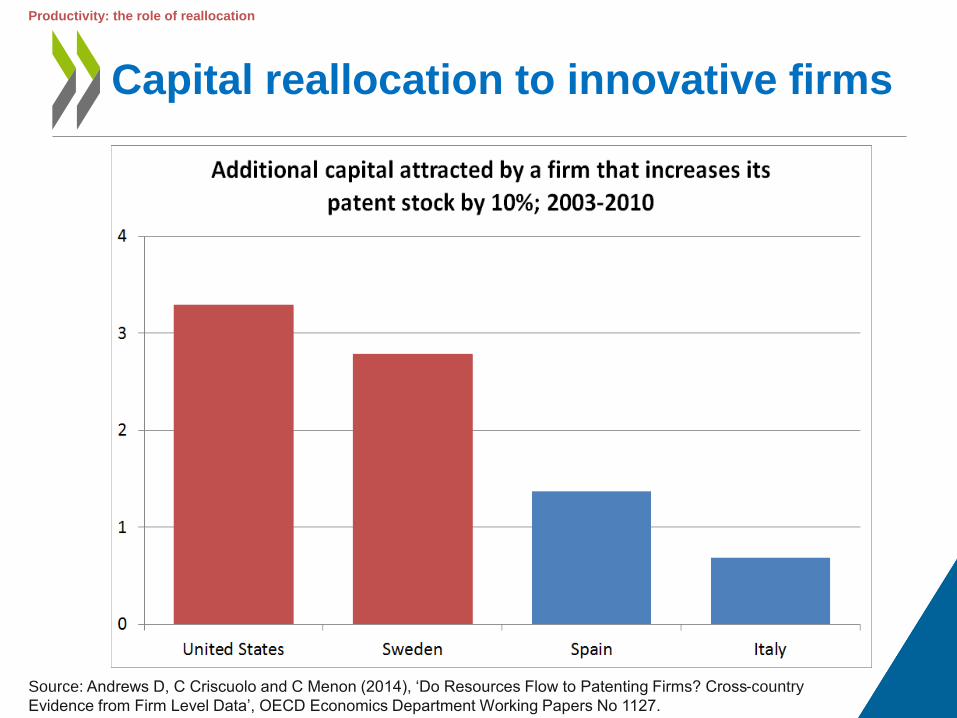
Capital reallocation to innovative firms
Source: Andrews D, C Criscuolo and C Menon (2014), ‘Do Resources Flow to Patenting Firms? Cross-country
Evidence from Firm Level Data’, OECD Economics Department Working Papers No 1127.
Productivity: the role of reallocation
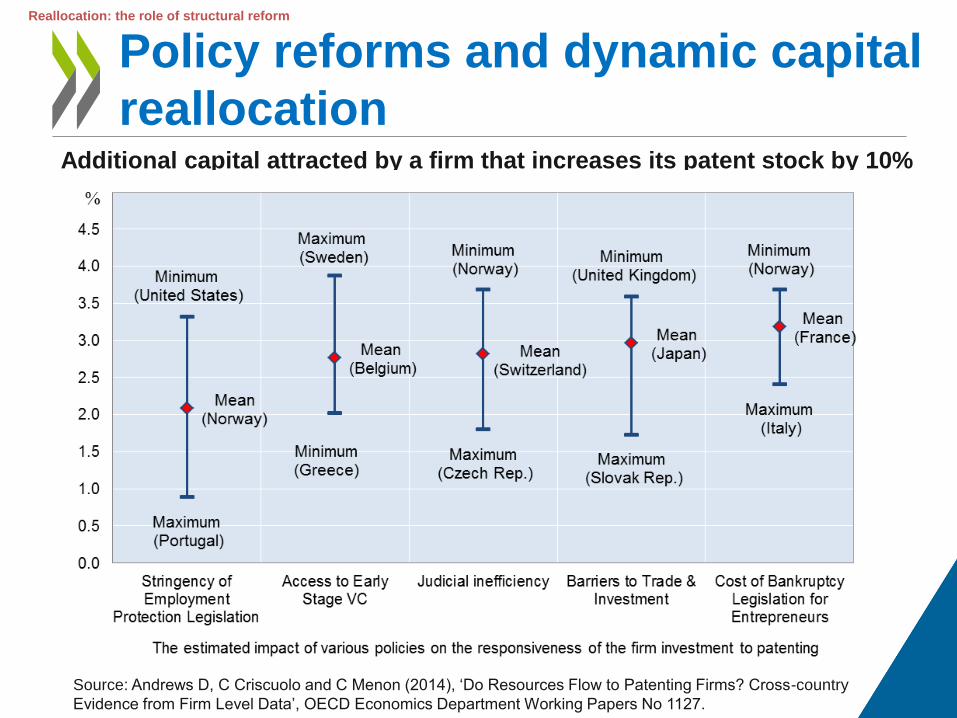
Policy reforms and dynamic capital
reallocation
Source: Andrews D, C Criscuolo and C Menon (2014), ‘Do Resources Flow to Patenting Firms? Cross-country
Evidence from Firm Level Data’, OECD Economics Department Working Papers No 1127.
Additional capital attracted by a firm that increases its patent stock by 10%
Reallocation: the role of structural reform