Embed Size (px)
Citation preview
Intereconomics 2015 | 4176
Forum
The Future of the European Power MarketThe European power market is undergoing signifi cant changes. The EU has set an ambitious goal of reducing its greenhouse gas emissions by 40 per cent by 2030. This will require signifi cant investment in renewable energy sources such as wind and photovoltaics as well as measured policies to deal with the fl uctuating capacity offered by these renewables. The integration of national power systems into a single European system would provide huge benefi ts in smoothing such fl uctuations, enabling the EU power market to further increase its reliance on renewables. Current power generators and government regulators will inevitably face challenges adapting to the new market environment, but experience from other countries and regions could provide useful guidance.
DOI: 10.1007/s10272-015-0541-3
Fabio Genoese and Christian Egenhofer
Designing a Market for Low-Carbon Electricity
Causes
This development is the result of (i) decreasing coal prices;2 (ii) an oversupply of carbon allowances, resulting in a decrease of carbon allowance prices;3 and (iii) over-capacity of power production plants, which puts down-ward pressure on wholesale prices. Overcapacity was, in turn, caused by lower-than-expected electricity demand, overinvestments, the injection of new capacity through dedicated policy instruments,4 e.g. for renewable energy, and continuing improvements in the fi eld of coupling na-tional electricity markets.5 While there is general consen-sus on these three causes, it is more diffi cult to assess which of them has had the strongest impact on the de-cline of wholesale prices.
Lower prices for coal and carbon allowances reduce the (variable) production costs of coal-fi red power stations. Whether this has an impact on the market price depends on whether coal is the price-setting technology in the market, i.e. whether it is the last unit needed to satisfy de-mand. The national energy mix has a signifi cant impact on the structure of wholesale prices. Given the signifi cant
2 The German import border price for hard coal can be used as an in-dicator for this decline. From 2008 to 2014, it decreased by 35 per cent (from €14 per megawatt hour thermal to €9 per megawatt hour thermal). A major cause of this price drop is the reduced demand for coal in the US power sector, where coal was mostly replaced with less expensive unconventional gas.
3 The average price for carbon allowances was €6 per tonne in 2014, down from roughly €23 per tonne in 2008 (-73 per cent).
4 This is sometimes referred to as “merit-order effect”.5 Market coupling leads to the more effi cient use of cross-border resources.
Provided that there is suffi cient interconnection and that demand peaks do not occur simultaneously, this can put downward pressure on prices.
The EU has set out plans to move to an entirely carbon-free power sector by 2050. Such a technological trans-formation will require considerable new investment. Part of the existing capacity will have to be replaced with less carbon-intensive and with more “fl exible” capacity. This transition is at the heart of ongoing EU discussions on market design, on the reform of the EU Emissions Trading System (ETS) and on the 2030 climate and energy frame-work. As a result, the market will have to address these policy priorities. Some argue that this will require a regula-tory overhaul of the EU’s electricity (and gas) market(s).
This article will test this argument. It will discuss possible shortcomings of the existing market design and examine multiple proposals to reform the market. In particular, the article will draw a distinction between market failures, which need to be tackled through potential policy inter-ventions, and normal market results, which should be ac-cepted even if undesirable for some market participants. For a more detailed analysis, see Genoese and Egen-hofer.1
Causes and consequences of recent price declines
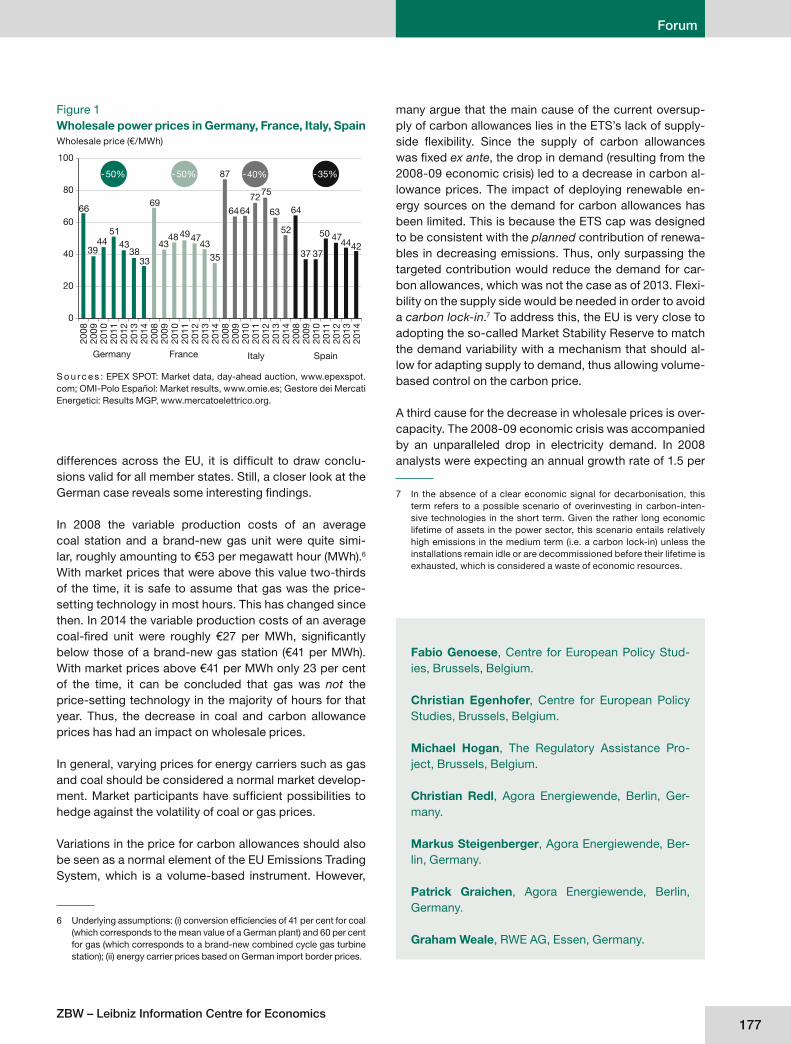
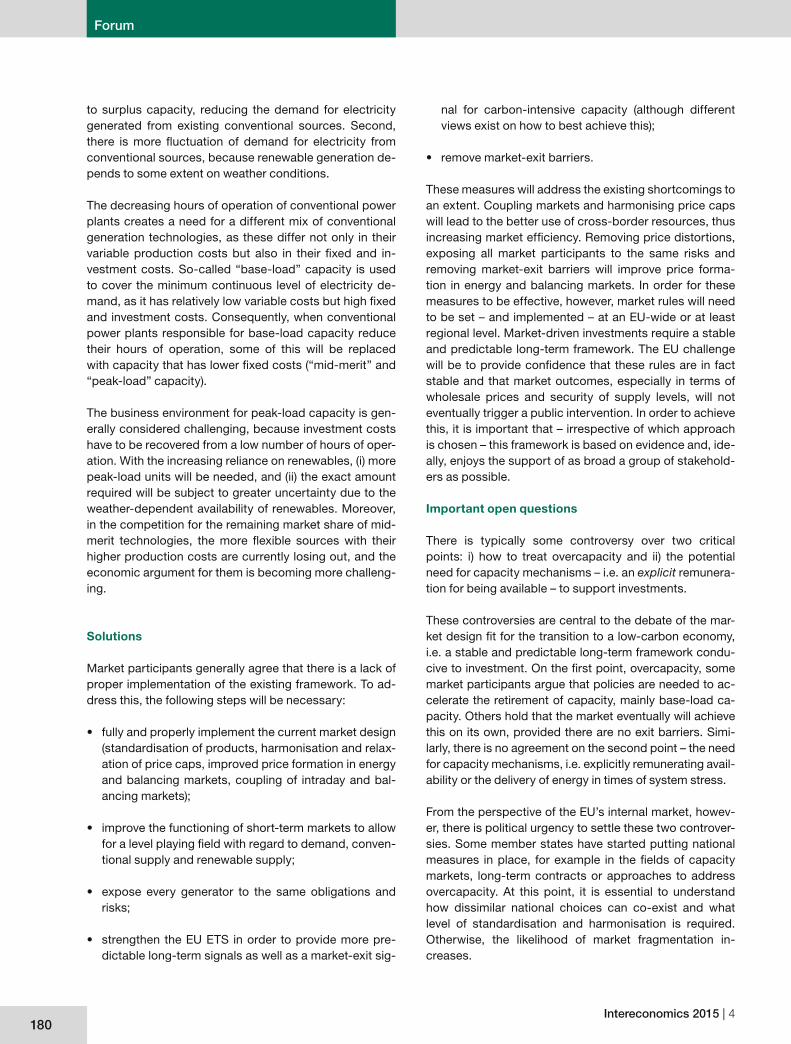
From 2008 to 2014, a strong decline in market prices for electricity was observed in many EU member states. Wholesale prices, i.e. the price at power exchanges, dropped by 50 per cent in France and Germany, by 40 per cent in Italy and by 35 per cent in Spain (see Figure 1).
1 F. G e n o e s e , C. E g e n h o f e r : Reforming the market design of EU electricity markets – addressing the challenges of a low-carbon pow-er sector, CEPS Task Force Report, July 2015.
ZBW – Leibniz Information Centre for Economics177
Forum
many argue that the main cause of the current oversup-ply of carbon allowances lies in the ETS’s lack of supply-side fl exibility. Since the supply of carbon allowances was fi xed ex ante, the drop in demand (resulting from the 2008-09 economic crisis) led to a decrease in carbon al-lowance prices. The impact of deploying renewable en-ergy sources on the demand for carbon allowances has been limited. This is because the ETS cap was designed to be consistent with the planned contribution of renewa-bles in decreasing emissions. Thus, only surpassing the targeted contribution would reduce the demand for car-bon allowances, which was not the case as of 2013. Flexi-bility on the supply side would be needed in order to avoid a carbon lock-in.7 To address this, the EU is very close to adopting the so-called Market Stability Reserve to match the demand variability with a mechanism that should al-low for adapting supply to demand, thus allowing volume-based control on the carbon price.
A third cause for the decrease in wholesale prices is over-capacity. The 2008-09 economic crisis was accompanied by an unparalleled drop in electricity demand. In 2008 analysts were expecting an annual growth rate of 1.5 per
7 In the absence of a clear economic signal for decarbonisation, this term refers to a possible scenario of overinvesting in carbon-inten-sive technologies in the short term. Given the rather long economic lifetime of assets in the power sector, this scenario entails relatively high emissions in the medium term (i.e. a carbon lock-in) unless the installations remain idle or are decommissioned before their lifetime is exhausted, which is considered a waste of economic resources.
differences across the EU, it is diffi cult to draw conclu-sions valid for all member states. Still, a closer look at the German case reveals some interesting fi ndings.
In 2008 the variable production costs of an average coal station and a brand-new gas unit were quite simi-lar, roughly amounting to €53 per megawatt hour (MWh).6 With market prices that were above this value two-thirds of the time, it is safe to assume that gas was the price-setting technology in most hours. This has changed since then. In 2014 the variable production costs of an average coal-fi red unit were roughly €27 per MWh, signifi cantly below those of a brand-new gas station (€41 per MWh). With market prices above €41 per MWh only 23 per cent of the time, it can be concluded that gas was not the price-setting technology in the majority of hours for that year. Thus, the decrease in coal and carbon allowance prices has had an impact on wholesale prices.
In general, varying prices for energy carriers such as gas and coal should be considered a normal market develop-ment. Market participants have suffi cient possibilities to hedge against the volatility of coal or gas prices.
Variations in the price for carbon allowances should also be seen as a normal element of the EU Emissions Trading System, which is a volume-based instrument. However,
6 Underlying assumptions: (i) conversion effi ciencies of 41 per cent for coal (which corresponds to the mean value of a German plant) and 60 per cent for gas (which corresponds to a brand-new combined cycle gas turbine station); (ii) energy carrier prices based on German import border prices.
Figure 1Wholesale power prices in Germany, France, Italy, SpainWholesale price (€/MWh)
S o u rc e s : EPEX SPOT: Market data, day-ahead auction, www.epexspot.com; OMI-Polo Español: Market results, www.omie.es; Gestore dei Mercati Energetici: Results MGP, www.mercatoelettrico.org.
0
20
40
60
80
100
2008
2009
2010
2011
2012
2013
2014
2008
2009
2010
2011
2012
2013
2014
2008
2009
2010
2011
2012
2013
2014
2008
2009
2010
2011
2012
2013
2014
Germany France Italy Spain
50%- 50%- 40%- 35%-
66
3944
5143
3833
69
43484947
4335
87
6464
7275
63
52
64
37 37
50 474442
Fabio Genoese, Centre for European Policy Stud-ies, Brussels, Belgium.
Christian Egenhofer, Centre for European Policy Studies, Brussels, Belgium.
Michael Hogan, The Regulatory Assistance Pro-ject, Brussels, Belgium.
Christian Redl, Agora Energiewende, Berlin, Ger-many.
Markus Steigenberger, Agora Energiewende, Ber-lin, Germany.
Patrick Graichen, Agora Energiewende, Berlin, Germany.
Graham Weale, RWE AG, Essen, Germany.
Intereconomics 2015 | 4178
Forum
smaller profi t margins.10 As outlined in the previous sec-tion, lower prices for coal or gas are one possible cause for lower wholesale prices. In this case, lower wholesale prices are accompanied by lower production costs for some generation technologies. The exact impact on a generator’s profi ts depends on the generator’s individual fuel mix; this should be considered as a normal market risk and consequently does not justify a policy interven-tion. The situation is different with regard to the price of carbon, however, as the lower price is to a great extent a result of an ETS design that is not fi t for its purpose.
A consequence of dedicated support policies for renewa-bles is that these effectively reduce the demand for other sources of power generation. Therefore, the impact on a conventional generator’s profi t margin is always negative in the short term. Moreover, some power plants become unprofi table to run and are consequently mothballed or decommissioned, especially where no barriers to market exit exist.11 However, in order for overcapacity to be tem-porary, excess conventional capacity must be allowed to be retired.
The relevant design question for the short term is whether the current market rules ensure that (1) capacity can be re-tired, (2) the “right” capacity is retired12 and (3) suffi cient capacity stays online. Following the market mechanics and given the current spread between coal and gas prices, as well as present carbon allowance prices, gas-fi red power stations are more affected by this development than coal-fi red plants. This is a result of the fact that the variable pro-duction costs of gas-based stations are higher – despite being less carbon-intensive – than coal. Some market par-ticipants consider this an undesirable development, since a thermal generating mix dominated by carbon-intensive fuels is inconsistent with the goal of meeting established policy objectives that extend through 2030 and beyond.
The current blueprint for EU market design: the target model
The “target model” serves as the blueprint for the integra-tion of electricity markets in the EU. At the heart of the cur-rent framework is an energy-only market, explicitly remu-
10 We use the term “profi t margin” as a synonym for “gross margin”, which is defi ned as the differential between the market price and the variable production costs of a power plant. Thus, it is used to cover fi xed maintenance costs and recover investment costs.
11 In some EU member states, regulators need to approve the closure (and even mothballing) of power plants. These market-exit restrictions are usually justifi ed on the grounds of these power plants being need-ed for system stability or for security reasons.
12 In order to restore market equilibrium, it is essential that there is a proper mix of base-load, mid-merit and peak-load capacity. These technologies differ in their ratios between fi xed and variable costs.
cent.8 However, at the end of 2012, electricity demand in the EU27 was actually three per cent lower than in 2008. Thus, the divergence between projected and realised val-ues amounted to nine to ten per cent. In absolute terms, this “gap” roughly corresponds to the entire electricity consumption of the United Kingdom in the year 2013. De-spite the fact that the EU economy has started to recover (in terms of GDP growth), electricity demand has been rather stagnant over the last three years. Thus, part of the decline appears to be structural, for example as a result of the low economic growth and aggressive energy effi -ciency policies. A short-term effect of the lower-than-ex-pected demand for electricity is that units with relatively high (variable) production costs are no longer needed to cover demand, thus lowering wholesale prices.
At the same time, we have also observed a massive de-ployment of renewables, as mandated by the Renewa-bles Directive (2009/28/EC), which set targets for the use of renewable energy in each EU member state. National governments subsequently implemented subsidy sys-tems for renewables in order to ensure that their domestic targets are met. Unless other plants are retired, such an injection of new capacity through dedicated policy instru-ments has a similar impact on conventional generators as a decline in electricity demand.9 On the one hand, one can argue that the impact of this deployment was largely to be anticipated, at the latest since the adoption of the 2020 climate and energy package in 2009. On the other hand, the power sector is, as of 2013, contributing to the overall 20 per cent target to a greater extent than anticipated in 2010 – counterbalancing the lower-than-expected contri-bution of renewables in heating, cooling and transport.
Consequences for generators
As a result, compared to 2008, conventional generators sold electricity at a lower price and sold less electricity in 2014. The latter is caused by the contraction in market share. Electricity generated from conventional sources has either been replaced by electricity from renewable sources or is simply not needed anymore because of low-er electricity demand.
For generators, selling electricity at a lower wholesale price can – but does not necessarily always – lead to
8 P. C a p ro s , L. M a n t z o s , V. P a p a n d re o u , N. Ta s i o s : EU-27 En-ergy Baseline Scenario to 2030. Update 2007, report for the Directorate-General for Energy and Transport of the European Commission, 2008.
9 The same considerations can be applied to the UK announcement of fi nancing the deployment of nuclear power using a dedicated policy instrument.
ZBW – Leibniz Information Centre for Economics179
Forum
rect reliance on price signals from energy and balancing markets. Indirect reliance refers to market participants entering into commercial arrangements with each other in order to hedge their exposure to the price and volume risk.13 Historically, unexpected policy interventions, mis-taken demand expectations, and long lead times for plan-ning and constructing new capacity have led to boom and bust cycles, i.e. times of overcapacity alternating with times of scarce capacity.
Critical challenges
Today, the full costs of low-carbon technologies are above wholesale market prices. This raises two ques-tions. The fi rst question is how low-carbon investments are going to be triggered in the future. Secondly, even if this gap between full costs and market prices is closed – as a result of a further decrease of technology costs or an increase in carbon, coal and gas prices – the ques-tion of effi cient fi nancing remains. Some argue that the cost structure of some low-carbon technologies requires a different investment trigger than the wholesale price. Technologies such as wind and solar have high upfront costs and close-to-zero variable production costs. This means that capital costs have a stronger impact on the total costs of such technologies than they have on coal or gas. At the same time, there are two side effects of using dedicated support policies. First, when the market is al-ready well supplied and demand is not growing, they add
13 See also P. J o s k o w : Competitive Electricity Markets and Invest-ments in New Generating Capacity, in: D. H e l m (ed.): The New En-ergy Paradigm, Oxford 2007, Oxford University Press.
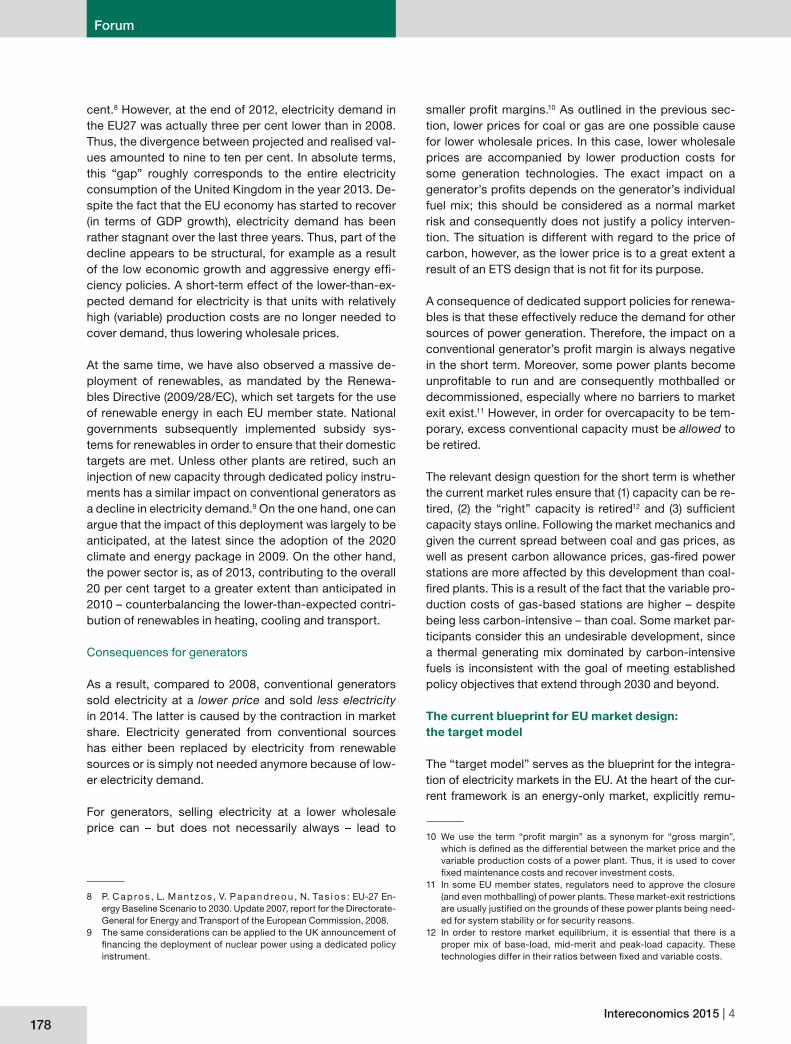
nerating the energy delivered. It is sometimes critically ob-served that there is no explicit remuneration for being avail-able (or, speaking in economic terms, to cover fi xed costs). However, as will be shown later, there is an implicit remu-neration for availability through the pricing mechanism.
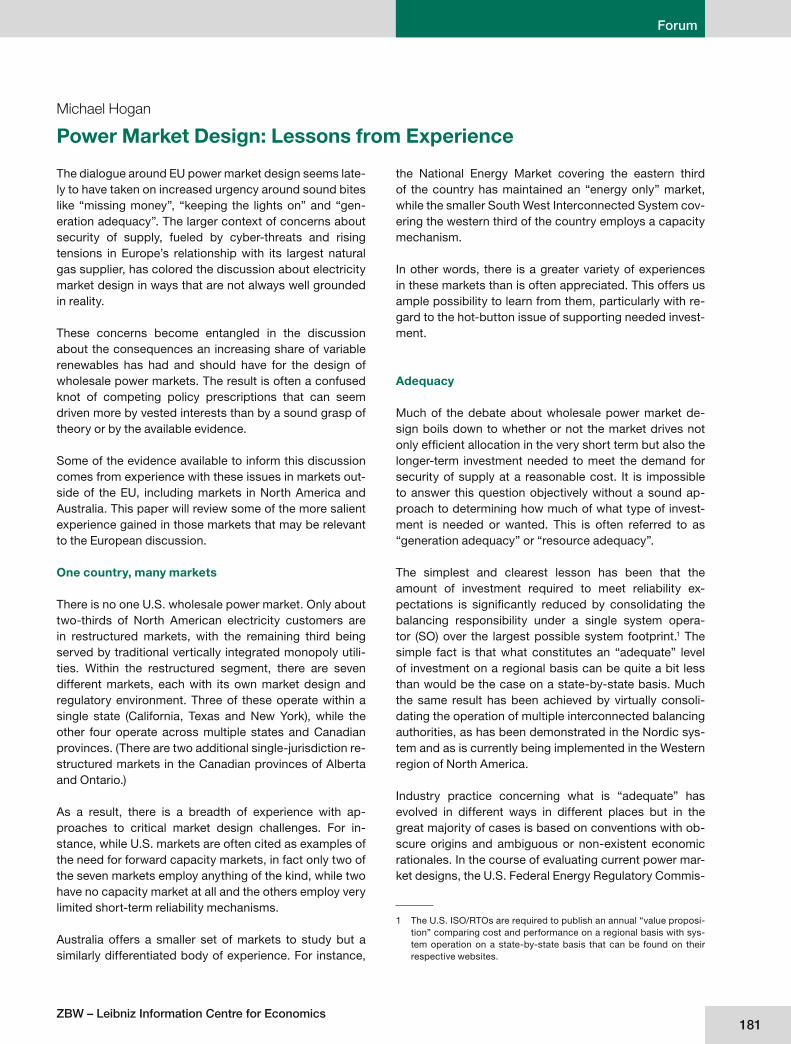
A central example of such an energy-only market in a lib-eralised power system is the so-called day-ahead market, an auction which is held the day before physical delivery. In this auction, the intersection of demand bids and sup-ply offers reveals a uniform market clearing price, mean-ing that each successful supply offer is rewarded with the same price, irrespective of its offering price. In a competi-tive market, this offering price is linked to the unit’s vari-able production costs and therefore differs from technol-ogy to technology due to different fuel costs, carbon in-tensities and fuel conversion effi ciencies. Consequently, availability is remunerated implicitly in those cases where a unit’s variable production costs are below the market clearing price. This differential is typically referred to as gross margin (see Figure 2). In economic terms, it is needed to cover fi xed operation and maintenance (O&M) costs, as well as to recover investment costs.
When this margin is not suffi cient to cover fi xed O&M costs, production units are likely to be retired, either tem-porarily (i.e. mothballed) or permanently, from the market. Retiring a plant before the end of its economic lifetime or, more generally, before it can generate the expected re-turn on investment makes it a stranded asset.
The current EU framework foresees various other markets to be implemented by member states, namely (i) an intra-day market, (ii) a balancing power market and (iii) a forward market. The fi rst two represent short-term marketplaces used to balance consumption and generation closer to re-al time, which is crucial for an electricity system, because an imbalance can lead to a blackout. Forward markets of-fer the possibility to trade long-term contracts for physical delivery or fi nancial hedging against the prices of short-term markets. Currently, the commitment periods avail-able for such contracts seldom go far beyond one year, and the liquidity of forward contracts with a delivery date of more than three years in the future is negligible.
The framework also foresees that national markets will gradually be coupled. This remains an ongoing process for the intra-day and balancing market but has mostly been completed for the day-ahead market.
Investments in energy-only markets
Energy-only markets attract investments in new capac-ity in a number of ways, both through the direct and indi-
Figure 2Simplifi ed cost-production curve
demand
mar
gina
l p
rod
uctio
n un
it
mar
ket
pric
e/p
rod
uctio
n co
st (€
/MW
h)
(variable)
prod
uction costs
volume (MWh)
price
infra-marginal rent
gross margin infra-marginal rent=
S o u rc e : Authors’ illustration.
Intereconomics 2015 | 4180
Forum
nal for carbon-intensive capacity (although different views exist on how to best achieve this);
• remove market-exit barriers.
These measures will address the existing shortcomings to an extent. Coupling markets and harmonising price caps will lead to the better use of cross-border resources, thus increasing market effi ciency. Removing price distortions, exposing all market participants to the same risks and removing market-exit barriers will improve price forma-tion in energy and balancing markets. In order for these measures to be effective, however, market rules will need to be set – and implemented – at an EU-wide or at least regional level. Market-driven investments require a stable and predictable long-term framework. The EU challenge will be to provide confi dence that these rules are in fact stable and that market outcomes, especially in terms of wholesale prices and security of supply levels, will not eventually trigger a public intervention. In order to achieve this, it is important that – irrespective of which approach is chosen – this framework is based on evidence and, ide-ally, enjoys the support of as broad a group of stakehold-ers as possible.
Important open questions
There is typically some controversy over two critical points: i) how to treat overcapacity and ii) the potential need for capacity mechanisms – i.e. an explicit remunera-tion for being available – to support investments.
These controversies are central to the debate of the mar-ket design fi t for the transition to a low-carbon economy, i.e. a stable and predictable long-term framework condu-cive to investment. On the fi rst point, overcapacity, some market participants argue that policies are needed to ac-celerate the retirement of capacity, mainly base-load ca-pacity. Others hold that the market eventually will achieve this on its own, provided there are no exit barriers. Simi-larly, there is no agreement on the second point – the need for capacity mechanisms, i.e. explicitly remunerating avail-ability or the delivery of energy in times of system stress.
From the perspective of the EU’s internal market, howev-er, there is political urgency to settle these two controver-sies. Some member states have started putting national measures in place, for example in the fi elds of capacity markets, long-term contracts or approaches to address overcapacity. At this point, it is essential to understand how dissimilar national choices can co-exist and what level of standardisation and harmonisation is required. Otherwise, the likelihood of market fragmentation in-creases.
to surplus capacity, reducing the demand for electricity generated from existing conventional sources. Second, there is more fl uctuation of demand for electricity from conventional sources, because renewable generation de-pends to some extent on weather conditions.
The decreasing hours of operation of conventional power plants creates a need for a different mix of conventional generation technologies, as these differ not only in their variable production costs but also in their fi xed and in-vestment costs. So-called “base-load” capacity is used to cover the minimum continuous level of electricity de-mand, as it has relatively low variable costs but high fi xed and investment costs. Consequently, when conventional power plants responsible for base-load capacity reduce their hours of operation, some of this will be replaced with capacity that has lower fi xed costs (“mid-merit” and “peak-load” capacity).
The business environment for peak-load capacity is gen-erally considered challenging, because investment costs have to be recovered from a low number of hours of oper-ation. With the increasing reliance on renewables, (i) more peak-load units will be needed, and (ii) the exact amount required will be subject to greater uncertainty due to the weather-dependent availability of renewables. Moreover, in the competition for the remaining market share of mid-merit technologies, the more fl exible sources with their higher production costs are currently losing out, and the economic argument for them is becoming more challeng-ing.
Solutions
Market participants generally agree that there is a lack of proper implementation of the existing framework. To ad-dress this, the following steps will be necessary:
• fully and properly implement the current market design (standardisation of products, harmonisation and relax-ation of price caps, improved price formation in energy and balancing markets, coupling of intraday and bal-ancing markets);
• improve the functioning of short-term markets to allow for a level playing fi eld with regard to demand, conven-tional supply and renewable supply;
• expose every generator to the same obligations and risks;
• strengthen the EU ETS in order to provide more pre-dictable long-term signals as well as a market-exit sig-
ZBW – Leibniz Information Centre for Economics181
Forum
Michael Hogan
Power Market Design: Lessons from Experience
The dialogue around EU power market design seems late-ly to have taken on increased urgency around sound bites like “missing money”, “keeping the lights on” and “gen-eration adequacy”. The larger context of concerns about security of supply, fueled by cyber-threats and rising tensions in Europe’s relationship with its largest natural gas supplier, has colored the discussion about electricity market design in ways that are not always well grounded in reality.
These concerns become entangled in the discussion about the consequences an increasing share of variable renewables has had and should have for the design of wholesale power markets. The result is often a confused knot of competing policy prescriptions that can seem driven more by vested interests than by a sound grasp of theory or by the available evidence.
Some of the evidence available to inform this discussion comes from experience with these issues in markets out-side of the EU, including markets in North America and Australia. This paper will review some of the more salient experience gained in those markets that may be relevant to the European discussion.
One country, many markets
There is no one U.S. wholesale power market. Only about two-thirds of North American electricity customers are in restructured markets, with the remaining third being served by traditional vertically integrated monopoly utili-ties. Within the restructured segment, there are seven different markets, each with its own market design and regulatory environment. Three of these operate within a single state (California, Texas and New York), while the other four operate across multiple states and Canadian provinces. (There are two additional single-jurisdiction re-structured markets in the Canadian provinces of Alberta and Ontario.)
As a result, there is a breadth of experience with ap-proaches to critical market design challenges. For in-stance, while U.S. markets are often cited as examples of the need for forward capacity markets, in fact only two of the seven markets employ anything of the kind, while two have no capacity market at all and the others employ very limited short-term reliability mechanisms.
Australia offers a smaller set of markets to study but a similarly differentiated body of experience. For instance,
the National Energy Market covering the eastern third of the country has maintained an “energy only” market, while the smaller South West Interconnected System cov-ering the western third of the country employs a capacity mechanism.
In other words, there is a greater variety of experiences in these markets than is often appreciated. This offers us ample possibility to learn from them, particularly with re-gard to the hot-button issue of supporting needed invest-ment.
Adequacy
Much of the debate about wholesale power market de-sign boils down to whether or not the market drives not only effi cient allocation in the very short term but also the longer-term investment needed to meet the demand for security of supply at a reasonable cost. It is impossible to answer this question objectively without a sound ap-proach to determining how much of what type of invest-ment is needed or wanted. This is often referred to as “generation adequacy” or “resource adequacy”.
The simplest and clearest lesson has been that the amount of investment required to meet reliability ex-pectations is signifi cantly reduced by consolidating the balancing responsibility under a single system opera-tor (SO) over the largest possible system footprint.1 The simple fact is that what constitutes an “adequate” level of investment on a regional basis can be quite a bit less than would be the case on a state-by-state basis. Much the same result has been achieved by virtually consoli-dating the operation of multiple interconnected balancing authorities, as has been demonstrated in the Nordic sys-tem and as is currently being implemented in the Western region of North America.
Industry practice concerning what is “adequate” has evolved in different ways in different places but in the great majority of cases is based on conventions with ob-scure origins and ambiguous or non-existent economic rationales. In the course of evaluating current power mar-ket designs, the U.S. Federal Energy Regulatory Commis-
1 The U.S. ISO/RTOs are required to publish an annual “value proposi-tion” comparing cost and performance on a regional basis with sys-tem operation on a state-by-state basis that can be found on their respective websites.
Intereconomics 2015 | 4182
Forum
sion (FERC) and several of the individual market operators have recently engaged outside experts in detailed reviews of the current state of practice.2 One conclusion reached is that the marginal cost of prevailing resource adequacy standards as currently applied exceeds, in some cases by orders of magnitude, the economic value custom-ers place on avoiding interruptions of service. In Texas, for example, a reasonable interpretation of the standard is that a consumer should expect about 20 seconds of service interruptions in an average year due to resource adequacy issues, as compared to historical rates of 100-300 minutes in an average year from transmission and distribution system failures. Where adequacy standards have been adopted in Europe, they turn out to be very similar in the metrics chosen and the level of performance mandated.
Leaving aside the question of whether or not such strin-gent resource adequacy standards are useful or appro-priate, one consequence of retaining them in a restruc-tured market environment is that an effi cient “simple” energy market – one that excludes the value implications of balancing services demanded by the system operator – would not produce the level of investment required to meet them. This is true even if the energy market were to accurately refl ect the value consumers place on uninter-rupted service for each of their energy needs, since the marginal cost of maintaining the level of resource invest-ment required to meet these standards often far exceeds its value to consumers.3 I will come back shortly to a brief discussion of how U.S. SOs have experimented with a combination of different approaches to solving this prob-lem.
Resource capabilities
North American markets that utilize capacity markets have learned from experience that adequacy cannot be established at lowest cost simply on the basis of the quantity of capacity investment, even if capacity is meas-ured on a de-rated basis.4 ISO New England in particular
2 See e.g. J.P. P f e i f e n b e rg e r, K. S p e e s , K. C a rd e n , N. W i n t e r m -a n t e l : Resource Adequacy Requirements: Reliability and Economic Implications, prepared for FERC, September 2013; and S. N e w e l l , K. S p e e s , J.P. P f e i f e n b e rg e r, R. M u d g e , M. D e L u c i a , R. C a r l -t o n : ERCOT Investment Incentives and Resource Adequacy, pre-pared for ERCOT, June 2012.
3 See Resource Adequacy in Wholesale Electricity Markets: Princi-ples and Lessons Learned, testimony of D. Patton, NYISO Inde-pendent Market Monitor, to FERC Technical Conference, 25 Sep-tember 2013.
4 The capacity of a system resource is de-rated by different system operators in different ways but generally involves discounting its contribution to resource adequacy by the likelihood, based on past performance of that resource or similar resources, that it will not be available when needed to meet peak demand on the system.
has seen an increase in system stress events in recent years, despite operating the most robust of the U.S. ca-pacity markets and carrying a reserve margin substan-tially above the reference level. All three of the Eastern independent system operators (ISOs) were tested by two severe winter storm events in the winter of 2013-2014, even though all of them had ample capacity relative to their reference reserve margins. How much capacity is “adequate” depends on the operational capabilities of ca-pacity resources during the full range of expected system conditions.
Each of the markets has taken a somewhat different ap-proach to driving more value to the more fl exible and re-sponsive resources in their portfolios. ISO New England has focused on their capacity market for now, introducing a bonus-penalty mechanism that applies to performance during designated system stress events regardless of the season. While this is expected to improve readiness to continue operating under peak demand events, it does not necessarily reward fl exibility – it simply rewards avail-ability. ISO New England has identifi ed greater fl exibility as an issue to be dealt with in the future.
PJM Interconnection, a regional transmission organiza-tion (RTO) in the eastern U.S., initially proposed separat-ing bidders in its capacity market into sub-categories, with more fl exible resources being given preferential consideration. After encountering resistance from stake-holders, PJM adopted a bonus-penalty structure similar to that adopted by ISO New England, intended to deal specifi cally with the widespread fossil plant failures expe-rienced during the winter events. PJM, more so than ISO New England, has also adopted a number of measures in recent years to improve the way the energy and ancillary services markets reward more fl exible resources, includ-ing improved participation by demand-side resources in setting energy market prices.
NYISO has taken a different tack, leaving their capacity mechanism intact for the moment and focusing on meas-ures to improve the transparency of shortage pricing in the energy and services markets. NYISO has generally taken the approach of maximizing reliance on energy and services market pricing and minimizing the importance of the capacity mechanism in recognition of the need to bet-ter differentiate the value of the capacity resources in its portfolio.
Remunerating investment
One thing needs to be made clear before delving into ex-perience with different approaches to the way power mar-kets remunerate investment: “Energy only” power markets
ZBW – Leibniz Information Centre for Economics183
Forum
do not assume that long-term investments will be made and sustained solely on the basis of selling kilowatt-hours of energy into the short-term energy and balancing ser-vices markets, as is often asserted. Nor do they assume that the market price for electricity is or should always be equal to the production cost of the marginal generator on the system, as is also often asserted. As with any other commodity market, they assume that the market price will refl ect the balance between supply and demand, dipping below the marginal cost of production during periods of surplus and rising above the marginal cost of production during periods of scarcity. Market participants (genera-tors and suppliers) exposed to market price and volume risk will hedge that exposure by entering into a variety of short- and long-term undertakings, and it is these market undertakings that, in an energy-only market, provide the basis for long-term resource investments.
With that in mind, North American and Australian markets have accumulated experience with two basic alternatives for delivering investment, in many but not all cases com-bining aspects of both approaches in their market designs (so-called “hybrid markets”). The fi rst approach is to drive energy market prices to better refl ect surplus and scarcity in supply, thus sharpening the exposure of market par-ticipants to price and volume risk. The second approach is to supplement the energy market with some form of non-energy-based mechanism for being paid to main-tain the capacity to produce energy (or reduce demand) as needed (often referred to as a “capacity mechanism”). Approaches differ on how far forward in time these com-mitments begin and for how long they last.
Within the restructured U.S. markets, the range of ap-proaches is bounded by ISO New England at one end – with a centralized, mandatory forward capacity market that has until recently offered new resource commitment periods of up to fi ve years5 – and the Electric Reliability Council of Texas (ERCOT) at the other end, which has no forward capacity market. ISO New England leans most strongly of all the U.S. markets on its forward capacity auctions to ensure suffi cient investment, while ERCOT re-lies on the effectiveness of energy and services market pricing. The Southwest Power Pool also has no capacity market.
PJM, the largest and arguably most frequently cited of the U.S. markets, operates a capacity market that offers only one-year commitment periods three years in advance of the delivery year. PJM has also moved in recent years to strengthen the pricing signals in its energy and services
5 ISO New England recently agreed to offer commitment periods of up to seven years to new resources.
markets and tends to rely in more or less equal measure on its forward capacity market and on price signals in its energy and ancillary service markets to sustain needed investment.
The New York ISO operates a type of short-term reliability obligations scheme requiring suppliers to have secured suffi cient capacity for each of the winter and summer six-month “capability periods” for the next year through a combination of bilateral contracting, voluntary capabil-ity period auctions conducted by NYISO just prior to the start of each capability period, and subsequent monthly “spot” auctions. NYISO has moved strongly in recent years to improve the pricing signals in its energy and ser-vices markets, tending toward a greater reliance on en-ergy and services markets pricing to sustain investment than either PJM or ISO New England.
The Midcontinent ISO conducts voluntary capacity auc-tions. California ISO operates three separate and some-what confl icting capacity-related procurement process-es, including a short-term reliability obligations scheme similar to NYISO and an ad hoc state-backed long-term contracting mechanism.
While there has been some convergence over time, the seven markets still diverge signifi cantly in important de-sign features, and there is not enough space here to delve into each of them in detail.6 It is possible, however, to gain insight into the relative performance of the different ap-proaches by looking at the level of investment sustained in each of them, both in absolute terms and relative to their target reserve margins.
Surveying performance in four representative U.S. mar-kets reveals the following:
• ISO New England, with its centralized mandatory for-ward auctions three years in advance and one-to-fi ve-year commitment periods for new resources, has seen new generation investment of approximately 5,100 MW and another 2,100 MW of new demand-side resources since its inception, in a system with peak demand of about 29,000 MW. Reserve margin in 2014 was about 28 percent against a target of about 15 percent.
• PJM, with centralized mandatory forward auctions three years in advance and one-year commitment periods for all resources (existing and new), has seen
6 A good summary of the design features of the various markets is pro-vided in Federal Energy Regulatory Commission: Centralized Capac-ity Market Design Elements, Commission Staff Report, 23 August 2013.
Intereconomics 2015 | 4184
Forum
new generation investment of approximately 16,000 MW and another 10,000 MW of new demand-side re-sources since its inception in 2007, in a system with peak demand of approximately 155,000 MW. Reserve margin in 2014 was approximately 27 percent against a target of 16 percent.
• NYISO, with its short-term (six-month) reliability obliga-tions scheme, has seen 10,411 MW of new generation investment and another 1,189 MW of new demand-side resources since 2000, with the fi rst capability period auction occurring in 2005, in a system with peak de-mand of approximately 34,000 MW. Reserve margin in 2014 was about 25 percent against a target of about 17 percent.
• ERCOT, with its energy-only market, has a reserve margin of 15.6 percent in a system with peak demand of about 67,000 MW, with approximately 4,000 MW of fi rm net capacity additions in the pipeline through 2017; ERCOT forecasts that with known capacity additions and expected load growth they will meet or exceed their target reserve margin of 13.75 percent through at least 2018.
Looking at the two Australian markets from the same per-spective:
• The NEM in Eastern Australia, with its energy-only market, has seen approximately 6,500 MW of new gen-eration investment since 2007 in a system with peak demand of about 36,000 MW. Reserve margin in 2014 was approximately 38 percent.
• The South West Interconnected System operates a re-liability obligations scheme similar to the NYISO, with suppliers obligated to secure suffi cient capacity an-nually to meet peak demand in the coming year. The SWIS has seen new generation investment of approxi-mately 1,500 MW in a system with peak demand of 3,700 MW. Reserve margin in 2014 was approximately 62 percent.
It would be a mistake to read too much into these data given the multitude of contributing factors, but they suggest that markets relying more strongly on capacity mechanisms are not noticeably more successful at driv-ing new investment than markets that rely more strongly, or entirely, on effective energy and ancillary services mar-ket pricing.
Some differentiation can be seen in the pattern of re-serve margins, where markets with a strong reliance on mandatory forward capacity mechanisms appear to have
a tendency to over-procure capacity relative to their es-tablished targets, whereas markets relying more strongly on energy and ancillary services pricing appear to attract new investment at a rate closer to that required to main-tain their target reserve margins. Other observers have noted this pattern of over-procurement in markets with forward capacity mechanisms, for instance Harvey et al. in their recent analysis of the NYISO capacity mecha-nism.7
These data suggest the conclusion that driving the right level of investment in wholesale markets is not strongly tied to whether or not the market incorporates a capacity-based mechanism and may be driven much more by how well a given market design philosophy is implemented. Furthermore, the observed pattern of over-procurement in markets with mandatory forward capacity mechanisms suggests that whatever economic effi ciency benefi ts there may be from capacity mechanisms in reducing the cost of capital are negated by the cost to consumers of over-procurement.
North American and Australian markets offer little experi-ence of competitive markets with large fractions of very low marginal cost of production resources, but experi-ence in the Nordic market belies the notion that energy price formation is necesssarily undermined in such mar-kets. In 2013, for example, the Nordic system derived 59 percent if its energy from zero-marginal-cost resources and 82 percent from resources with marginal costs be-low €10/MWh, yet the average day-ahead wholesale price was €38,10/MWh, actually slightly higher than the aver-age day-ahead wholesale price in Germany, where fossil plants set clearing prices in virtually every hour.
Adapting ancillary services markets and their rela-tionship to energy markets
Ancillary (or balancing) services play an important role in the principle of effective energy market price formation. Several markets are gaining experience with approaches to improving the performance of services markets in driv-ing effective market pricing.
The expression of the value of reliability in energy mar-kets is, or should be, inextricably tied to the role the SO plays in factoring security of supply constraints into the provision of various categories of reserves and other criti-cal services. As demand grows relative to supply (or as
7 S. H a r v e y, W. H o g a n , S. P o p e : Evaluation of the New York Ca-pacity Market, March 2013, which noted at page xii a pattern of “for-ward planning process-driven infl ation of capacity requirements and costs” at PJM and ISO New England since implementation of their forward capacity markets.
ZBW – Leibniz Information Centre for Economics185
Forum
supply drops relative to demand), a larger share of the available generation is called upon to produce, eventually competing with the demand for capacity needed by the SO in reserve to satisfy security of supply constraints. To the extent this demand for reserves and other services is satisfi ed by the SO in ways that obscure their real-time value, energy market prices cannot accurately express shortage conditions.
Several U.S. markets, both those with capacity mecha-nisms (NYISO, PJM) and without (ERCOT), have in recent years adopted a practice known as co-optimization of ancillary services and energy markets. This ensures that the value of reserves required by the SO to satisfy secu-rity constraints is adequately refl ected in day-ahead and intra-day energy prices. The system operator determines the level of reserves available relative to requirements and establishes a shadow price or price adder using an administrative price curve. This price curve gradually ap-proaches the full value of lost load as the level of reserves approaches the point at which selective involuntary ser-vice interruptions would be required. This can be con-sidered a capacity mechanism, but it is one that tops up rather than substitutes for the expression of full shortage value in the energy market.
As noted above, even as consumers gradually acquire the capability to respond directly or through intermedi-aries to real-time pricing signals (mitigating the oft-cited “demand-side” market failure), system operators will still play an important role, since most established reliability standards place a higher value on lost load than do con-sumers. Traditional fi xed capacity mechanisms can help to address this extra layer of “generation adequacy”, but because they generally ignore operational capabilities, they are a poor substitute for fully functional energy mar-kets in meeting the underlying consumer demand for re-liability. Conversely, a suffi ciently robust energy market, in which the SOs apply the higher reliability standard into their balancing services procurement, can address both the consumer demand for reliability and the extra layer of security embedded in many generation adequacy stand-ards. Hybrid markets such as NYISO have been suc-cessful in addressing the gap between theory and prac-tice. Based on the available evidence, however, practice should favor increasing reliance on effective energy and ancillary services market pricing, a conclusion that can be deduced from the actions taken by SOs in many of the existing markets.
Locational pricing
Experience in North America has led all of the markets there to evolve toward more granular pricing based on lo-
cation relative to signifi cant grid constraints, with all now operating nodal markets. In the Nordic market, a similar methodology referred to as “market splitting” has been employed for many years to create pricing zones. Both Australian markets also operate pricing zones, though dispatch is on a nodal basis. Experience with locational marginal pricing in these markets has demonstrated marked improvement, both in the investment incentives for generators and for increased investment in transmis-sion, both of which are becoming signifi cant constraints in the European grid. There is now general agreement that pricing at least based on grid-constrained zones, and ideally based on system nodes, is an important contribu-tor to the accuracy of investment price signals. The same zonal/nodal methodology has also been adopted for all North American capacity mechanisms.
Demand-side resources
A full discussion of experience with demand-side re-sources in markets is beyond the scope of this paper. It is often noted, however, that a number of North Ameri-can markets have been successful in promoting the role demand can play in balancing the wholesale market. In the markets with capacity mechanisms, the investment in demand-side resources has overwhelmingly been in traditional forms of demand response, with a limit to the number of calls, the length of operation and the season in which it is called.
As the quantity of demand-side resources has grown, the trend has been to amend markets to favor more fl ex-ible and non-seasonal demand resources, something that will become even more important as the fraction of variable renewables in systems grows. As the value of dif-ferent types of demand response shifts, the importance of participation in energy and ancillary services markets will increase. Since the 2011 PJM auction, when it fi rst began differentiating bids, traditional limited demand response has declined from 90 percent to 25 percent of bids cleared. ERCOT now gets over half of its ten-minute reserves from demand response, and in PJM’s daily auc-tions for ten-minute reserves, demand response resourc-es constitute nearly a third of what clears.
Conclusion
Years of experience with multiple different approaches to a number of critical market design challenges, particularly in the liberalized markets of North America and Australia, offer a rich pool of information for those considering how
Intereconomics 2015 | 4186
Forum
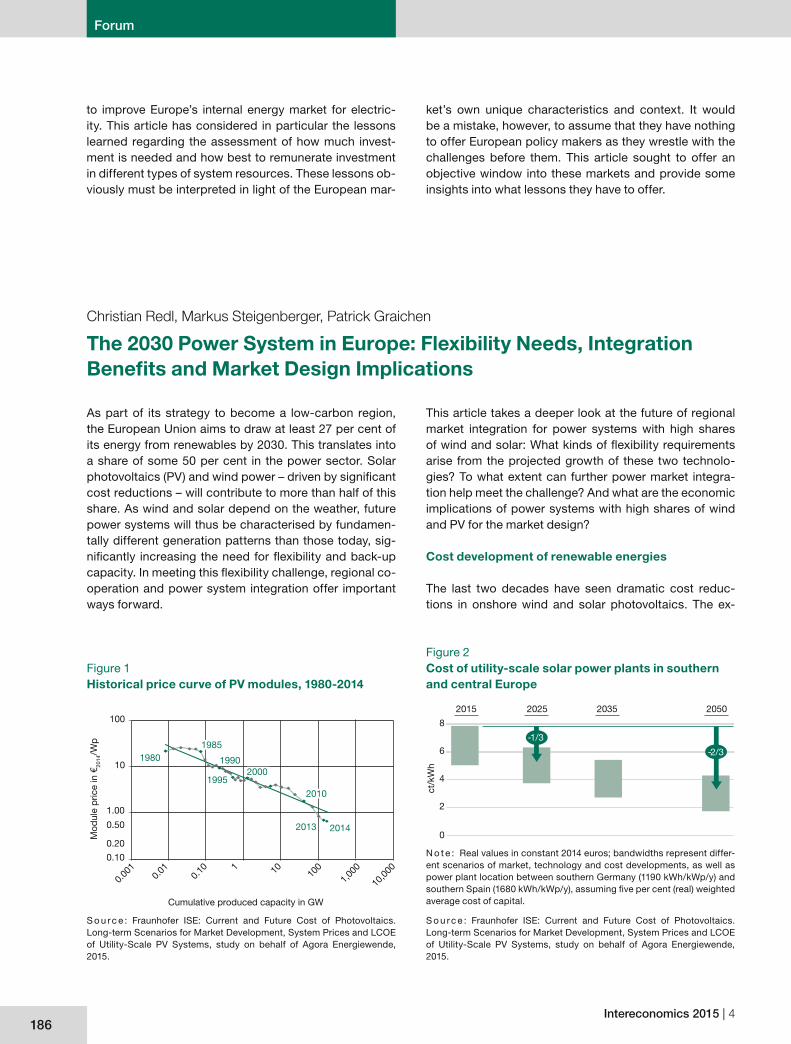
As part of its strategy to become a low-carbon region, the European Union aims to draw at least 27 per cent of its energy from renewables by 2030. This translates into a share of some 50 per cent in the power sector. Solar photovoltaics (PV) and wind power – driven by signifi cant cost reductions – will contribute to more than half of this share. As wind and solar depend on the weather, future power systems will thus be characterised by fundamen-tally different generation patterns than those today, sig-nifi cantly increasing the need for fl exibility and back-up capacity. In meeting this fl exibility challenge, regional co-operation and power system integration offer important ways forward.
F igure 1Historical price curve of PV modules, 1980-2014
S o u rc e : Fraunhofer ISE: Current and Future Cost of Photovoltaics. Long-term Scenarios for Market Development, System Prices and LCOE of Utility-Scale PV Systems, study on behalf of Agora Energiewende, 2015.
Cumulative produced capacity in GW
Mod
ule
pric
e in
€20
14/W
p
0.00
10.
010.
10 1 10 100
1,00
0
10,0
00
100
10
1.00
0.50
0.20
0.10
1980
20142013
2010
1985
1995
19902000
F igure 2Cost of utility-scale solar power plants in southern and central Europe
N o t e : Real values in constant 2014 euros; bandwidths represent differ-ent scenarios of market, technology and cost developments, as well as power plant location between southern Germany (1190 kWh/kWp/y) and southern Spain (1680 kWh/kWp/y), assuming fi ve per cent (real) weighted average cost of capital.
S o u rc e : Fraunhofer ISE: Current and Future Cost of Photovoltaics. Long-term Scenarios for Market Development, System Prices and LCOE of Utility-Scale PV Systems, study on behalf of Agora Energiewende, 2015.
8
6
4
2
2015 2025 2035 2050
ct/k
Wh
- 1/3
- 2/3
0
Christian Redl, Markus Steigenberger, Patrick Graichen
The 2030 Power System in Europe: Flexibility Needs, Integration Benefi ts and Market Design Implications
This article takes a deeper look at the future of regional market integration for power systems with high shares of wind and solar: What kinds of fl exibility requirements arise from the projected growth of these two technolo-gies? To what extent can further power market integra-tion help meet the challenge? And what are the economic implications of power systems with high shares of wind and PV for the market design?
Cost development of renewable energies
The last two decades have seen dramatic cost reduc-tions in onshore wind and solar photovoltaics. The ex-
to improve Europe’s internal energy market for electric-ity. This article has considered in particular the lessons learned regarding the assessment of how much invest-ment is needed and how best to remunerate investment in different types of system resources. These lessons ob-viously must be interpreted in light of the European mar-
ket’s own unique characteristics and context. It would be a mistake, however, to assume that they have nothing to offer European policy makers as they wrestle with the challenges before them. This article sought to offer an objective window into these markets and provide some insights into what lessons they have to offer.
ZBW – Leibniz Information Centre for Economics187
Forum
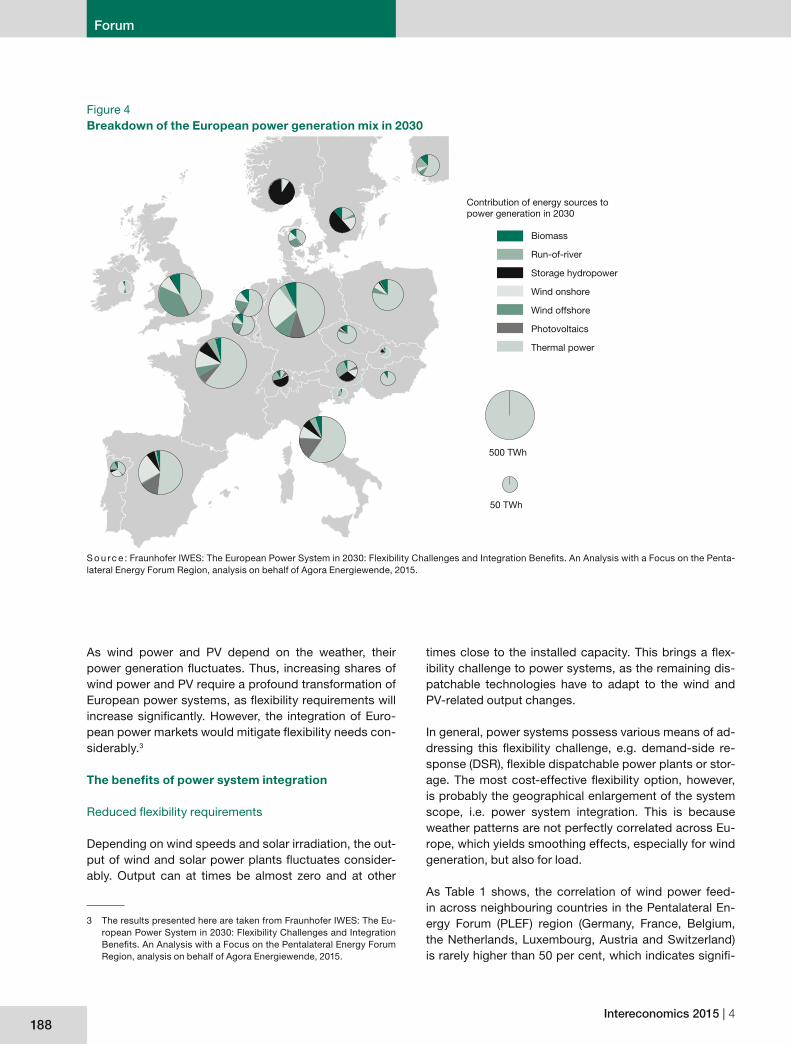
targets imply that wind power and PV will be the main sources of renewable generation in Europe by 2030. This is also refl ected in national energy strategies and offi cial scenarios in line with the 2030 climate and energy tar-gets. The renewables share of the European power sys-tem will be some 50 per cent,1 with wind power and PV amounting to some 30 per cent of total generation (see Figure 4).2
1 European Commission: Impact assessment accompanying the com-munication: A policy framework for climate and energy in the period from 2020 up to 2030, 2014.
2 Note also that this trend is already taking place: in 2014 almost 74 per cent of all investments in generation capacities in Europe were for wind power and PV. See EWEA: Wind in power, 2014 European statis-tics, February 2015.
ample of solar PV is especially illustrative. Since 1980 the module price for PV dropped on average by 20.9 per cent for every doubling of cumulative produced capacity (see Figure 1). This has led to a continuous reduction in the specifi c generation costs of PV plants.
Robust evidence indicates that these cost reductions will continue in the future. Even conservative scenarios that assume business-as-usual technological progress, i.e. without any major technological breakthroughs, pre-dict total electricity generation costs for utility-scale PV of four to six ct/kWh by 2025 and two to four ct/kWh by 2050 (see Figure 2), making PV the cheapest power gen-eration source in many regions across the globe.
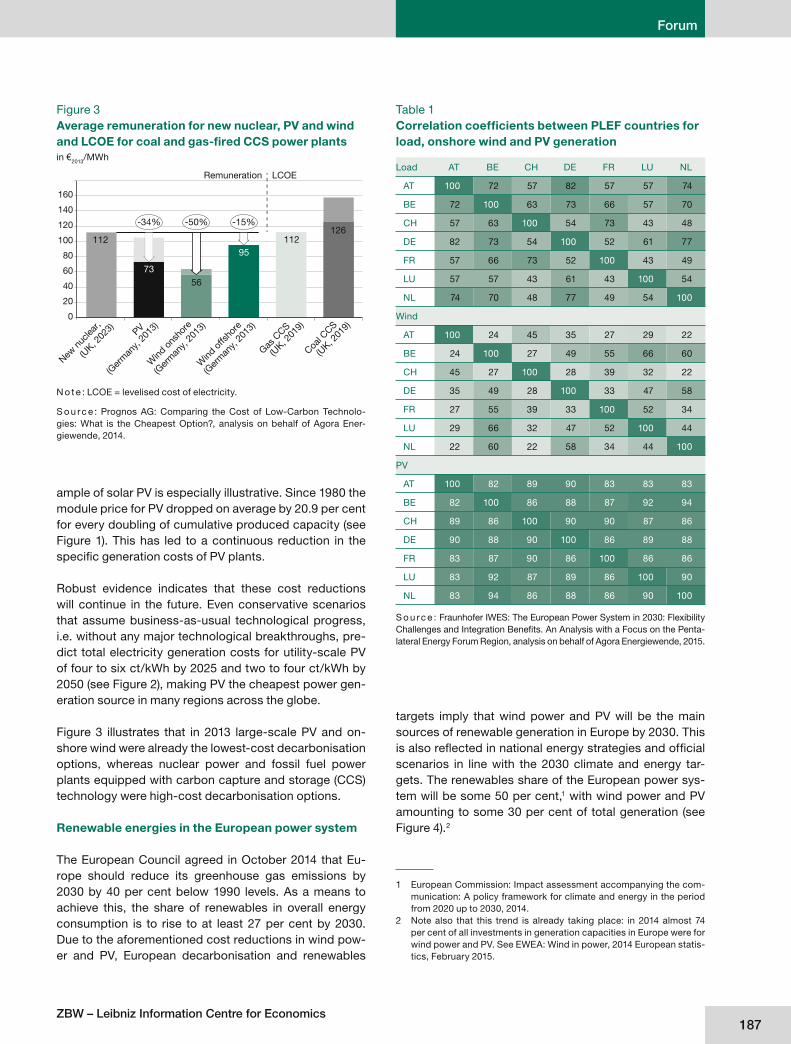
Figure 3 illustrates that in 2013 large-scale PV and on-shore wind were already the lowest-cost decarbonisation options, whereas nuclear power and fossil fuel power plants equipped with carbon capture and storage (CCS) technology were high-cost decarbonisation options.
Renewable energies in the European power system
The European Council agreed in October 2014 that Eu-rope should reduce its greenhouse gas emissions by 2030 by 40 per cent below 1990 levels. As a means to achieve this, the share of renewables in overall energy consumption is to rise to at least 27 per cent by 2030. Due to the aforementioned cost reductions in wind pow-er and PV, European decarbonisation and renewables
F igure 3Average remuneration for new nuclear, PV and wind and LCOE for coal and gas-fi red CCS power plantsin €2013/MWh
N o t e : LCOE = levelised cost of electricity.
S o u rc e : Prognos AG: Comparing the Cost of Low-Carbon Technolo-gies: What is the Cheapest Option?, analysis on behalf of Agora Ener-giewende, 2014.
0
20
80
60
40
100
120
140
160
LCOERemuneration
New n
uclea
r,
(UK, 2
023) PV
(Ger
man
y, 20
13)
Wind
ons
hore
(Ger
man
y, 20
13)
Coal C
CS
(UK, 2
019)
112
7356
126
Gas C
CS
(UK, 2
019)
112
(Ger
man
y, 20
13)
95
Wind
offs
hore
-34% -50% -15%
S o u rc e : Fraunhofer IWES: The European Power System in 2030: Flexibility Challenges and Integration Benefi ts. An Analysis with a Focus on the Penta-lateral Energy Forum Region, analysis on behalf of Agora Energiewende, 2015.
Table 1Correlation coeffi cients between PLEF countries for load, onshore wind and PV generation
Load AT BE CH DE FR LU NL
AT 100 72 57 82 57 57 74
BE 72 100 63 73 66 57 70
CH 57 63 100 54 73 43 48
DE 82 73 54 100 52 61 77
FR 57 66 73 52 100 43 49
LU 57 57 43 61 43 100 54
NL 74 70 48 77 49 54 100
Wind
AT 100 24 45 35 27 29 22
BE 24 100 27 49 55 66 60
CH 45 27 100 28 39 32 22
DE 35 49 28 100 33 47 58
FR 27 55 39 33 100 52 34
LU 29 66 32 47 52 100 44
NL 22 60 22 58 34 44 100
PV
AT 100 82 89 90 83 83 83
BE 82 100 86 88 87 92 94
CH 89 86 100 90 90 87 86
DE 90 88 90 100 86 89 88
FR 83 87 90 86 100 86 86
LU 83 92 87 89 86 100 90
NL 83 94 86 88 86 90 100
Intereconomics 2015 | 4188
Forum
times close to the installed capacity. This brings a fl ex-ibility challenge to power systems, as the remaining dis-patchable technologies have to adapt to the wind and PV-related output changes.
In general, power systems possess various means of ad-dressing this fl exibility challenge, e.g. demand-side re-sponse (DSR), fl exible dispatchable power plants or stor-age. The most cost-effective fl exibility option, however, is probably the geographical enlargement of the system scope, i.e. power system integration. This is because weather patterns are not perfectly correlated across Eu-rope, which yields smoothing effects, especially for wind generation, but also for load.
As Table 1 shows, the correlation of wind power feed-in across neighbouring countries in the Pentalateral En-ergy Forum (PLEF) region (Germany, France, Belgium, the Netherlands, Luxembourg, Austria and Switzerland) is rarely higher than 50 per cent, which indicates signifi -
As wind power and PV depend on the weather, their power generation fl uctuates. Thus, increasing shares of wind power and PV require a profound transformation of European power systems, as fl exibility requirements will increase signifi cantly. However, the integration of Euro-pean power markets would mitigate fl exibility needs con-siderably.3
The benefi ts of power system integration
Reduced fl exibility requirements
Depending on wind speeds and solar irradiation, the out-put of wind and solar power plants fl uctuates consider-ably. Output can at times be almost zero and at other
3 The results presented here are taken from Fraunhofer IWES: The Eu-ropean Power System in 2030: Flexibility Challenges and Integration Benefi ts. An Analysis with a Focus on the Pentalateral Energy Forum Region, analysis on behalf of Agora Energiewende, 2015.
F igure 4Breakdown of the European power generation mix in 2030
500 TWh
50 TWh
Contribution of energy sources to power generation in 2030
Wind onshore
Biomass
Run-of-river
Storage hydropower
Wind offshore
Photovoltaics
Thermal power
S o u rc e : Fraunhofer IWES: The European Power System in 2030: Flexibility Challenges and Integration Benefi ts. An Analysis with a Focus on the Penta-lateral Energy Forum Region, analysis on behalf of Agora Energiewende, 2015.
ZBW – Leibniz Information Centre for Economics189
Forum
the autarchy scenario would be about ten times higher than in an integrated European power system.7
To summarise, market integration reduces fl exibility re-quirements arising from wind and PV deployment through geographical smoothing and minimises the storage needs (or the curtailment of renewable energy sources). Thus, European market integration increases the value of wind and PV. Clearly, market integration cannot eliminate all fl exibility requirements. We therefore now address how conventional power plants will have to adapt to a power system with higher shares of wind and PV.
Consequences for the conventional power generation system
The deployment of wind and PV has consequences for the power plants that cover the remainder of the electric-ity demand, the so-called “residual power plant park”. Specifi cally, its structure and operation will have to change in order to react during both shorter and longer time periods.
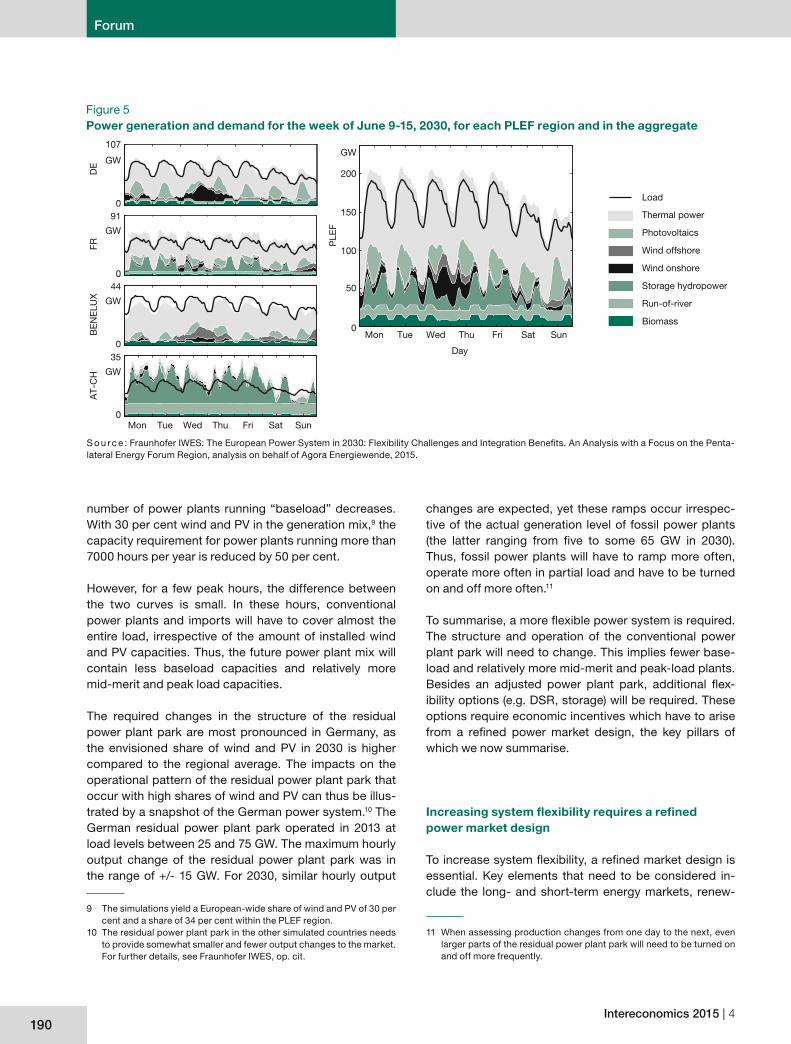
To illustrate the dynamics in the system, Figure 5 depicts power generation in the PLEF power systems for a sum-mer week with high PV generation in the year 2030. Here, PV production matches the higher power demand during the day. Conversely, when PV generation changes quick-ly in the morning and evening hours, stored hydropower (in Austria, France and Switzerland) provides the primary compensation for the difference in electricity load and PV output. Conventional thermal and fl exible biomass plants in the PLEF region also increase their generation during these hours.
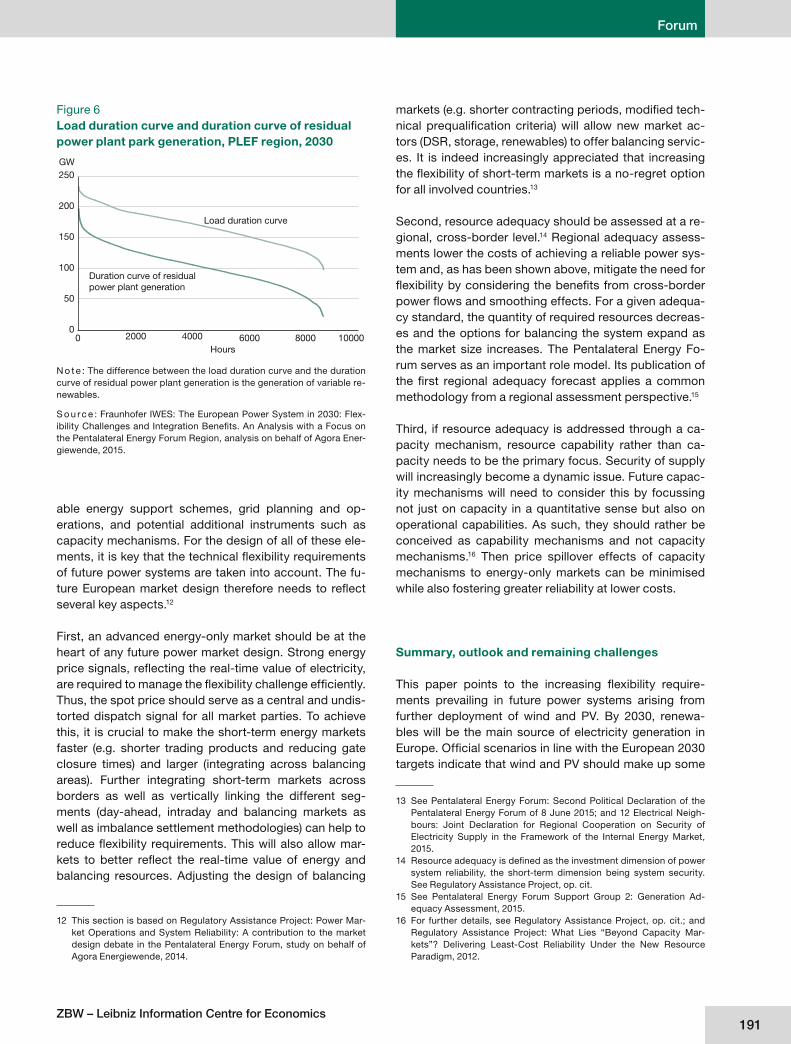
To assess the consequences of wind and PV deploy-ment for residual power plant parks, we look at the dura-tion curves for load and residual generation.8 These two curves are shown in Figure 6. Duration curves yield the number of hours per year a specifi c load or generation level is exceeded. The residual generation curve is both steeper and lower than the load curve. Thus, the required
7 This is because of a lack of exchange options with other regions. In the integration scenario, European-wide curtailment (or additional storage needs) amounts to some fi ve TWh, whereas the cumulative national curtailment in the autarchy scenario is some 45 TWh.
8 A duration curve is derived by sorting hourly values for one year from the highest to the lowest value. The generation of the residual power plant park is derived by subtracting variable renewables generation from the load and adding net exports. We subtract variable renewa-bles generation because their short-run generation costs are essen-tially zero. Thus, in power markets they are dispatched before (residu-al) thermal generation.
cant potential for maximising the utilisation of wind pow-er when coupling national power systems. Furthermore, load patterns are also not correlated perfectly across countries, though these correlations are typically higher than 50 per cent. In contrast, solar PV feed-ins, unsur-prisingly, correlate highly, as PV generation is driven by the daily path of the sun, which obviously affects neigh-bouring countries in a similar manner.
Compared to individual wind turbine generation patterns, European-wide aggregation yields a more stable output with smaller and fewer ramps (i.e. changes in output from one hour to the next). For example, simulations based on the weather patterns observed in 2011 yield a maximum hourly ramp for onshore wind of minus ten per cent of installed capacity in Europe.4 However, if the simulation is based solely on France, for example, it yields a maxi-mum hourly ramp of 21 per cent. Thus, through European power system integration, the residual power plant park in Europe will have to provide a maximum ramp of just ten per cent of installed wind capacity to compensate the largest wind fl uctuations, while in a national autarchy case, the French power plant park would have to provide a ramp of 21 per cent of installed wind capacity. Interest-ingly, in this simulation, European-wide ramps of onshore wind are larger than plus or minus fi ve per cent of the installed wind capacity in only 23 hours of the year.5
In addition to the smoothing effects arising from uncorre-lated weather conditions, seasonal weather patterns also yield a more stable total monthly generation of wind pow-er and PV. The reason is straightforward: wind generation is higher in winter months while PV generation is higher in summer months. Thus, the total generation of wind pow-er and PV is rather stable throughout the year. Of course, to benefi t from these smoothing effects, strong electric-ity grids are required – both within and across countries and regions.
Minimised renewables curtailment
Due to geographical smoothing effects, less electric-ity from fl uctuating renewables has to be curtailed or stored when high feed-in situations occur,6 because it can instead be traded among countries. According to the aforementioned simulation, the curtailment occurring in
4 The largest ramp based on the weather data for the year 2011 yields a ten per cent output reduction.
5 Weather data from 2011.6 Curtailment of wind and PV occurs when their feed-in is higher than
the prevailing domestic load and cross-border interconnectors are fully utilised. See Fraunhofer IWES, op. cit.
Intereconomics 2015 | 4190
Forum
changes are expected, yet these ramps occur irrespec-tive of the actual generation level of fossil power plants (the latter ranging from fi ve to some 65 GW in 2030). Thus, fossil power plants will have to ramp more often, operate more often in partial load and have to be turned on and off more often.11
To summarise, a more fl exible power system is required. The structure and operation of the conventional power plant park will need to change. This implies fewer base-load and relatively more mid-merit and peak-load plants. Besides an adjusted power plant park, additional fl ex-ibility options (e.g. DSR, storage) will be required. These options require economic incentives which have to arise from a refi ned power market design, the key pillars of which we now summarise.
Increasing system fl exibility requires a refi ned power market design
To increase system fl exibility, a refi ned market design is essential. Key elements that need to be considered in-clude the long- and short-term energy markets, renew-
11 When assessing production changes from one day to the next, even larger parts of the residual power plant park will need to be turned on and off more frequently.
number of power plants running “baseload” decreases. With 30 per cent wind and PV in the generation mix,9 the capacity requirement for power plants running more than 7000 hours per year is reduced by 50 per cent.
However, for a few peak hours, the difference between the two curves is small. In these hours, conventional power plants and imports will have to cover almost the entire load, irrespective of the amount of installed wind and PV capacities. Thus, the future power plant mix will contain less baseload capacities and relatively more mid-merit and peak load capacities.
The required changes in the structure of the residual power plant park are most pronounced in Germany, as the envisioned share of wind and PV in 2030 is higher compared to the regional average. The impacts on the operational pattern of the residual power plant park that occur with high shares of wind and PV can thus be illus-trated by a snapshot of the German power system.10 The German residual power plant park operated in 2013 at load levels between 25 and 75 GW. The maximum hourly output change of the residual power plant park was in the range of +/- 15 GW. For 2030, similar hourly output
9 The simulations yield a European-wide share of wind and PV of 30 per cent and a share of 34 per cent within the PLEF region.
10 The residual power plant park in the other simulated countries needs to provide somewhat smaller and fewer output changes to the market. For further details, see Fraunhofer IWES, op. cit.
F igure 5Power generation and demand for the week of June 9-15, 2030, for each PLEF region and in the aggregate
DE
GW
GW
GW
GW
35
0
44
0
91
0
0
Load
Thermal power
Photovoltaics
Wind offshore
Wind onshore
Storage hydropower
Run-of-river
Biomass
GW
200
150
100
50
0P
LEF
Mon Tue Wed Thu Fri Sat Sun
Day
FRB
EN
ELU
XA
T-C
H
107
Mon Tue Wed Thu Fri Sat Sun
S o u rc e : Fraunhofer IWES: The European Power System in 2030: Flexibility Challenges and Integration Benefi ts. An Analysis with a Focus on the Penta-lateral Energy Forum Region, analysis on behalf of Agora Energiewende, 2015.
ZBW – Leibniz Information Centre for Economics191
Forum
markets (e.g. shorter contracting periods, modifi ed tech-nical prequalifi cation criteria) will allow new market ac-tors (DSR, storage, renewables) to offer balancing servic-es. It is indeed increasingly appreciated that increasing the fl exibility of short-term markets is a no-regret option for all involved countries.13
Second, resource adequacy should be assessed at a re-gional, cross-border level.14 Regional adequacy assess-ments lower the costs of achieving a reliable power sys-tem and, as has been shown above, mitigate the need for fl exibility by considering the benefi ts from cross-border power fl ows and smoothing effects. For a given adequa-cy standard, the quantity of required resources decreas-es and the options for balancing the system expand as the market size increases. The Pentalateral Energy Fo-rum serves as an important role model. Its publication of the fi rst regional adequacy forecast applies a common methodology from a regional assessment perspective.15
Third, if resource adequacy is addressed through a ca-pacity mechanism, resource capability rather than ca-pacity needs to be the primary focus. Security of supply will increasingly become a dynamic issue. Future capac-ity mechanisms will need to consider this by focussing not just on capacity in a quantitative sense but also on operational capabilities. As such, they should rather be conceived as capability mechanisms and not capacity mechanisms.16 Then price spillover effects of capacity mechanisms to energy-only markets can be minimised while also fostering greater reliability at lower costs.
Summary, outlook and remaining challenges
This paper points to the increasing fl exibility require-ments prevailing in future power systems arising from further deployment of wind and PV. By 2030, renewa-bles will be the main source of electricity generation in Europe. Offi cial scenarios in line with the European 2030 targets indicate that wind and PV should make up some
13 See Pentalateral Energy Forum: Second Political Declaration of the Pentalateral Energy Forum of 8 June 2015; and 12 Electrical Neigh-bours: Joint Declaration for Regional Cooperation on Security of Electricity Supply in the Framework of the Internal Energy Market, 2015.
14 Resource adequacy is defi ned as the investment dimension of power system reliability, the short-term dimension being system security. See Regulatory Assistance Project, op. cit.
15 See Pentalateral Energy Forum Support Group 2: Generation Ad-equacy Assessment, 2015.
16 For further details, see Regulatory Assistance Project, op. cit.; and Regulatory Assistance Project: What Lies “Beyond Capacity Mar-kets”? Delivering Least-Cost Reliability Under the New Resource Paradigm, 2012.
able energy support schemes, grid planning and op-erations, and potential additional instruments such as capacity mechanisms. For the design of all of these ele-ments, it is key that the technical fl exibility requirements of future power systems are taken into account. The fu-ture European market design therefore needs to refl ect several key aspects.12
First, an advanced energy-only market should be at the heart of any future power market design. Strong energy price signals, refl ecting the real-time value of electricity, are required to manage the fl exibility challenge effi ciently. Thus, the spot price should serve as a central and undis-torted dispatch signal for all market parties. To achieve this, it is crucial to make the short-term energy markets faster (e.g. shorter trading products and reducing gate closure times) and larger (integrating across balancing areas). Further integrating short-term markets across borders as well as vertically linking the different seg-ments (day-ahead, intraday and balancing markets as well as imbalance settlement methodologies) can help to reduce fl exibility requirements. This will also allow mar-kets to better refl ect the real-time value of energy and balancing resources. Adjusting the design of balancing
12 This section is based on Regulatory Assistance Project: Power Mar-ket Operations and System Reliability: A contribution to the market design debate in the Pentalateral Energy Forum, study on behalf of Agora Energiewende, 2014.
F igure 6Load duration curve and duration curve of residual power plant park generation, PLEF region, 2030
N o t e : The difference between the load duration curve and the duration curve of residual power plant generation is the generation of variable re-newables.
S o u rc e : Fraunhofer IWES: The European Power System in 2030: Flex-ibility Challenges and Integration Benefi ts. An Analysis with a Focus on the Pentalateral Energy Forum Region, analysis on behalf of Agora Ener-giewende, 2015.
Load duration curve
Duration curve of residualpower plant generation
250
200
150
100
50
00 2000 4000 6000 8000 10000
Hours
GW
Intereconomics 2015 | 4192
Forum
ket design and regulatory framework needs to be in place to facilitate the evolution towards a power system with fl exibility at its core.
We have pointed out that a strong, undistorted spot price refl ecting the real-time value of electricity is required to manage the complexity effi ciently. Such a price signal can serve as an undistorted dispatch signal for all market par-ticipants. It requires faster and larger energy and balanc-ing markets; linking day-ahead, intraday and balancing energy markets; and minimising fossil must-run capaci-ties by adjusting balancing energy products and their pro-curement.
A reformed energy-only market, regionally embedded and integrated, is certainly a no-regret way forward for all involved countries. Yet, it might not be the solution for all challenges. For example, this paper has not touched upon the issue of how to best structure grid tariffs and other surcharges to incentivise market actors to behave in a “system-friendly” manner. The complexity will certainly increase as we move to a more decentralised energy sys-tem, with potentially millions of actors. Furthermore, the organisation of cross-border, regional system operation, the cooperation of grid operators and the creation of a regional governance structure are all important and unre-solved questions.
When moving into a world of power systems that rely on renewables for half of their power, another key issue aris-es – how to handle the fi nancing issue in a power system based on capital expenditures (CAPEX). We are certainly moving into a world where investment costs and capital expenditures will dominate the economics of the power system. This concerns CAPEX-intensive renewables, where wind power and PV have essentially zero short-term generation costs, implying low wholesale prices when wind and PV produce, which creates a refi nancing challenge. But it also concerns back-up power plants, which will become more CAPEX-intensive as well. As their running hours decrease alongside wind and PV deploy-ment, CAPEX will become more important and, in an en-ergy-only market setting, will have to be earned back in fewer hours as well.
Prospective issues in a CAPEX-intensive power system thus concern questions regarding remuneration and (re-)fi nancing, but also the facilitation of consistency among different technologies in the market design. Long-term contracts, capacity remuneration mechanisms and a new kind of investment market are just some examples of how this could be facilitated, all of which bring about fascinat-ing and important questions for how to best structure the economics of new, renewables-based power systems.
30 per cent of the share in meeting European power de-mand.
Owing to the natural variability of wind and PV genera-tion, fl exibility requirements in the power systems will increase. Importantly, power system and market inte-gration, facilitated by strong domestic and cross-bor-der grids, can mitigate fl exibility requirements through smoothing effects and maximise the utilisation of wind and PV.
Yet market integration alone will not completely resolve the fl exibility challenge. Thus, a more fl exible power sys-tem is required. There is a large portfolio of fl exibility op-tions:
• Demand-side management/response: This comprises the modifi cation of consumption patterns (e.g. load re-duction in critical hours or load-shifting from peak to off-peak hours).
• Flexible conventional power generation: Flexible ther-mal power plants are characterised by short start-up times, high ramping rates and low minimum load lev-els.
• Flexible renewable generation: Renewables (including wind and PV) can contribute to ancillary services such as providing balancing energy.
• Grids, interconnection and market integration: Linking neighbouring power systems enables fl exibility through access to a larger resource portfolio and geographical smoothing effects.
• Storage: Allows surplus power generation (e.g. in times of high output from renewables and low demand) to be stored and subsequently released in times of scarcity.
• Power-to-heat, power-to-X, renewables curtailment: Once higher shares of renewables have been achieved, moderate curtailment can reduce the fl exibility chal-lenge (e.g. compared to expanding the grid to take up renewables generation at all times). Also, surplus gen-eration can be utilised effectively if the electricity sec-tor is more closely linked with the heating sector (pow-er-to-heat) or other sectors (mobility, chemicals, etc.).
An important aspect of the new fl exible power system is an adjusted power plant park with less baseload capacity and relatively more mid-merit and peak load capacities and active demand-side participation. The power market design has to provide the incentives for fl exibility options to be in position to offer fl exibility. Thus, an enabling mar-
ZBW – Leibniz Information Centre for Economics193
Forum
Graham Weale*
Future Changes and Challenges for the European Power Market
the 50 per cent level. In addition, the generating fl eet is becoming even more capital-intensive, partly because by their nature renewable energy power stations only produce with relatively low load factors.
• There will be a rise in the share of renewable energy production, with three important consequences: the system will be even more driven by meteorological conditions than previously; a rising proportion of pow-er will be generated at the distribution system operator level for all renewable energy except large hydro and offshore wind; and new players (including households) rather than the incumbents will be generating a pro-gressively larger share.
• There will be a phase-down of nuclear power, whether due to ideological reasons or simply through the ag-ing of existing stations and their consequent declin-ing profi tability. Conversely, there are attempts being made to build new capacity, although these are strug-gling at present.
An additional factor with which the industry may have to reckon is declining demand due to strong effi ciency initiatives and industrial restructuring, even though these may be partly offset by new applications, e.g. e-mobility and heat pumps.
Challenges for regulators
This section examines several challenges not so fre-quently discussed and briefl y reviews issues of supply security and the integration of intermittent renewable en-ergy, which have been much more widely covered else-where.3
Enabling power to play its correct role in the energy transition
One of the fi rst challenges for the regulators looking at the entire canvas of the energy transition is to ensure
3 E u re l e c t r i c : Integrating intermittent renewables sources into the EU electricity system by 2020: challenges and solutions, May 2010; G e r m a n E n e rg y A g e n c y ( D E N A ) : Effi cient integration of re-newable energy into future energy systems: Development of Eu-ropean energy infrastructures in the period 2030 to 2050, October 2011.
This paper addresses the changes taking place in the European power sector and the resulting challenges for both regulators and operators. In particular, it aims to draw attention to several important issues which have not been widely discussed, such as (i) allowing power to play its economically correct role in the wider energy transition, and (ii) appropriately allocating risk among dif-ferent stakeholders and generally keeping risks low to avoid the cost of capital from rising excessively.
The changes taking place
In the over 15 years since the European power markets were liberalised, they have been subject to both the greatest and fastest changes in their history. One politi-cal requirement has been layered upon another, with the result that the market scarcely had a chance to catch its breath after one major policy decision before the next one arrived.
The changes expected to take place at the European level have been widely discussed, but it is worthwhile to briefl y summarise them here and outline their main im-plications.1 Figure 1 shows the change in fuel shares of electricity generation between 2012 and 2030 under two alternative scenarios – the International Energy Agency’s “New Policies Scenario” and the more ambitious “450 Scenario”.2
Three main points emerge from the chart:
• There will be an increase in the share of power with almost zero variable costs for all generation types ex-cept fossil fuels. Even in 2012 this share was already at
* The views expressed here are the author’s alone and do not neces-sarily represent those of RWE AG.
1 E u ro p e a n C o m m i s s i o n : 2011 Energy Roadmap, COM/2011/885; Eurelectric: Energy Roadmap 2050: Empowering Europe, Febru-ary 2012.
2 The International Energy Agency uses several different potential scenarios to run its projections. The “New Policies Scenario” takes account of broad policy commitments that have been announced by countries, including pledges to reduce greenhouse gas emis-sions and phase out fossil fuel subsidies, even if the implementing measures have yet to be identifi ed. The “450 Scenario” limits the concentration of greenhouse gases in the atmosphere to around 450 parts per million of CO2, which is consistent with the goal of limit-ing the global temperature increase to 2°C. For more information, see www.iea.org.
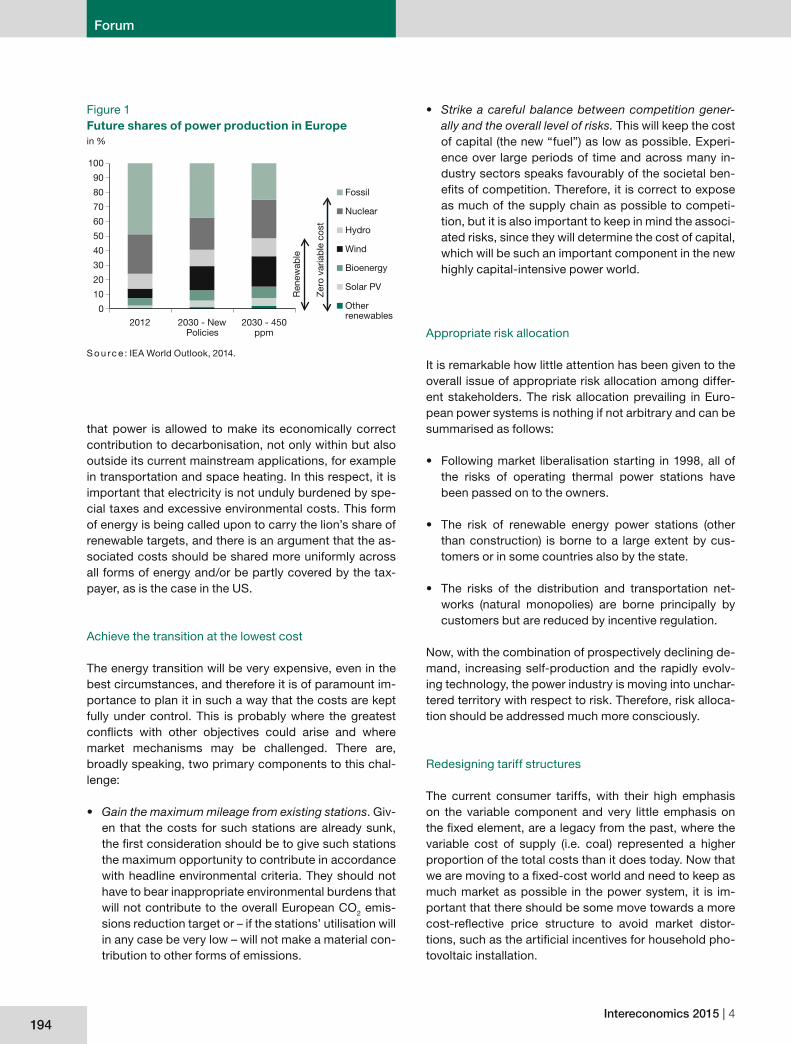
Intereconomics 2015 | 4194
Forum
that power is allowed to make its economically correct contribution to decarbonisation, not only within but also outside its current mainstream applications, for example in transportation and space heating. In this respect, it is important that electricity is not unduly burdened by spe-cial taxes and excessive environmental costs. This form of energy is being called upon to carry the lion’s share of renewable targets, and there is an argument that the as-sociated costs should be shared more uniformly across all forms of energy and/or be partly covered by the tax-payer, as is the case in the US.
Achieve the transition at the lowest cost
The energy transition will be very expensive, even in the best circumstances, and therefore it is of paramount im-portance to plan it in such a way that the costs are kept fully under control. This is probably where the greatest confl icts with other objectives could arise and where market mechanisms may be challenged. There are, broadly speaking, two primary components to this chal-lenge:
• Gain the maximum mileage from existing stations. Giv-en that the costs for such stations are already sunk, the fi rst consideration should be to give such stations the maximum opportunity to contribute in accordance with headline environmental criteria. They should not have to bear inappropriate environmental burdens that will not contribute to the overall European CO2 emis-sions reduction target or – if the stations’ utilisation will in any case be very low – will not make a material con-tribution to other forms of emissions.
• Strike a careful balance between competition gener-ally and the overall level of risks. This will keep the cost of capital (the new “fuel”) as low as possible. Experi-ence over large periods of time and across many in-dustry sectors speaks favourably of the societal ben-efi ts of competition. Therefore, it is correct to expose as much of the supply chain as possible to competi-tion, but it is also important to keep in mind the associ-ated risks, since they will determine the cost of capital, which will be such an important component in the new highly capital-intensive power world.
Appropriate risk allocation
It is remarkable how little attention has been given to the overall issue of appropriate risk allocation among differ-ent stakeholders. The risk allocation prevailing in Euro-pean power systems is nothing if not arbitrary and can be summarised as follows:
• Following market liberalisation starting in 1998, all of the risks of operating thermal power stations have been passed on to the owners.
• The risk of renewable energy power stations (other than construction) is borne to a large extent by cus-tomers or in some countries also by the state.
• The risks of the distribution and transportation net-works (natural monopolies) are borne principally by customers but are reduced by incentive regulation.
Now, with the combination of prospectively declining de-mand, increasing self-production and the rapidly evolv-ing technology, the power industry is moving into unchar-tered territory with respect to risk. Therefore, risk alloca-tion should be addressed much more consciously.
Redesigning tariff structures
The current consumer tariffs, with their high emphasis on the variable component and very little emphasis on the fi xed element, are a legacy from the past, where the variable cost of supply (i.e. coal) represented a higher proportion of the total costs than it does today. Now that we are moving to a fi xed-cost world and need to keep as much market as possible in the power system, it is im-portant that there should be some move towards a more cost-refl ective price structure to avoid market distor-tions, such as the artifi cial incentives for household pho-tovoltaic installation.
Figure 1Future shares of power production in Europein %
S o u rc e : IEA World Outlook, 2014.
0
10
20
30
40
50
60
70
80
90
100
2012 2030 - NewPolicies
2030 - 450ppm
Fossil
Nuclear
Hydro
Wind
Bioenergy
Solar PV
OtherR
enew
able
Zer
o va
riab
le c
ost
renewables
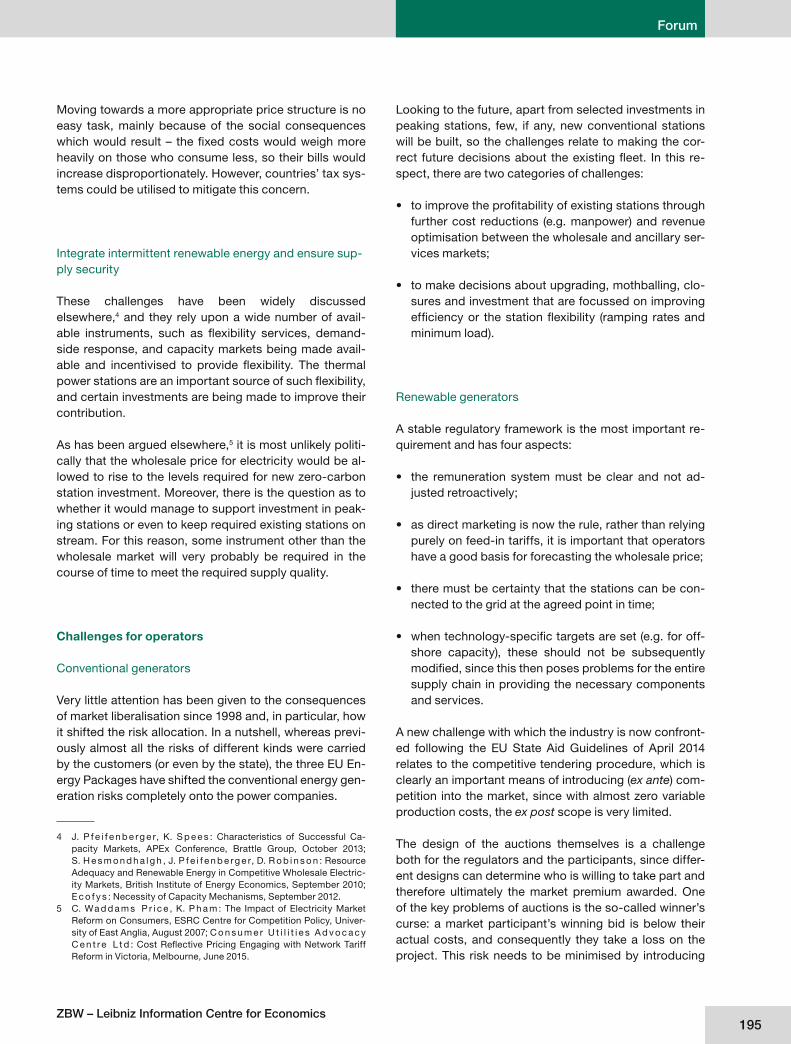
ZBW – Leibniz Information Centre for Economics195
Forum
Looking to the future, apart from selected investments in peaking stations, few, if any, new conventional stations will be built, so the challenges relate to making the cor-rect future decisions about the existing fl eet. In this re-spect, there are two categories of challenges:
• to improve the profi tability of existing stations through further cost reductions (e.g. manpower) and revenue optimisation between the wholesale and ancillary ser-vices markets;
• to make decisions about upgrading, mothballing, clo-sures and investment that are focussed on improving effi ciency or the station fl exibility (ramping rates and minimum load).
Renewable generators
A stable regulatory framework is the most important re-quirement and has four aspects:
• the remuneration system must be clear and not ad-justed retroactively;
• as direct marketing is now the rule, rather than relying purely on feed-in tariffs, it is important that operators have a good basis for forecasting the wholesale price;
• there must be certainty that the stations can be con-nected to the grid at the agreed point in time;
• when technology-specifi c targets are set (e.g. for off-shore capacity), these should not be subsequently modifi ed, since this then poses problems for the entire supply chain in providing the necessary components and services.
A new challenge with which the industry is now confront-ed following the EU State Aid Guidelines of April 2014 relates to the competitive tendering procedure, which is clearly an important means of introducing (ex ante) com-petition into the market, since with almost zero variable production costs, the ex post scope is very limited.
The design of the auctions themselves is a challenge both for the regulators and the participants, since differ-ent designs can determine who is willing to take part and therefore ultimately the market premium awarded. One of the key problems of auctions is the so-called winner’s curse: a market participant’s winning bid is below their actual costs, and consequently they take a loss on the project. This risk needs to be minimised by introducing
Moving towards a more appropriate price structure is no easy task, mainly because of the social consequences which would result – the fi xed costs would weigh more heavily on those who consume less, so their bills would increase disproportionately. However, countries’ tax sys-tems could be utilised to mitigate this concern.
Integrate intermittent renewable energy and ensure sup-ply security
These challenges have been widely discussed elsewhere,4 and they rely upon a wide number of avail-able instruments, such as fl exibility services, demand-side response, and capacity markets being made avail-able and incentivised to provide fl exibility. The thermal power stations are an important source of such fl exibility, and certain investments are being made to improve their contribution.
As has been argued elsewhere,5 it is most unlikely politi-cally that the wholesale price for electricity would be al-lowed to rise to the levels required for new zero-carbon station investment. Moreover, there is the question as to whether it would manage to support investment in peak-ing stations or even to keep required existing stations on stream. For this reason, some instrument other than the wholesale market will very probably be required in the course of time to meet the required supply quality.
Challenges for operators
Conventional generators
Very little attention has been given to the consequences of market liberalisation since 1998 and, in particular, how it shifted the risk allocation. In a nutshell, whereas previ-ously almost all the risks of different kinds were carried by the customers (or even by the state), the three EU En-ergy Packages have shifted the conventional energy gen-eration risks completely onto the power companies.
4 J. P f e i f e n b e rg e r, K. S p e e s : Characteristics of Successful Ca-pacity Markets, APEx Conference, Brattle Group, October 2013; S. H e s m o n d h a l g h , J. P f e i f e n b e rg e r, D. R o b i n s o n : Resource Adequacy and Renewable Energy in Competitive Wholesale Electric-ity Markets, British Institute of Energy Economics, September 2010; E c o f y s : Necessity of Capacity Mechanisms, September 2012.
5 C. Wa d d a m s P r i c e , K. P h a m : The Impact of Electricity Market Reform on Consumers, ESRC Centre for Competition Policy, Univer-sity of East Anglia, August 2007; C o n s u m e r U t i l i t i e s A d v o c a c y C e n t re L t d : Cost Refl ective Pricing Engaging with Network Tariff Reform in Victoria, Melbourne, June 2015.
Intereconomics 2015 | 4196
Forum
Germany, where new highways have to be built to carry wind power from the north to replace nuclear power in the south. Local resistance reached such heights that the only solution will be to locate some of the capacity under-ground at much higher costs.
Next, as a direct result of the need for decarbonisation and the general preference for renewable rather than nu-clear power generation, the trend is that energy produc-tion is moving away from the transmission system opera-tor to the distribution system operator domain. The result is that networks which were originally designed to deliver power at lower voltage levels from the transmission net-work to consumers are increasingly being required to host power generation and to allow for fl ows in a reverse direction.
With incentive regulation being increasingly applied, grid operators start with the challenge of reducing their costs (and in some cases improving the overall service provided) in order to maximise their earnings. But on top of this may come the challenge of potentially declining demand as a result of both effi ciency measures and self-consumption.
Retailers
After generation and transportation, retailers are the third area of the power business to be facing major chal-lenges, though of different sorts. These include the fact that the business is already extremely competitive; there is the prospect of non-power retailers (e.g. telecommuni-cations, security companies or social media) moving into the retailing space; customers want to generate some of their own power; and retailers must determine how to deal with their scope to offer new fl exibility services, partly driven off of consumers’ appliances.
While the entry of non-utilities into the energy retail-ing area has been slow (although certain supermarkets have now managed to achieve established positions), the prospect of a big game-changer remains, and this is be-ing made easier every day through the development of communications and the accumulation of data. Energy purchasing is unfortunately (for the retailers) a low-en-gagement activity, and the risk is high that retailing could be subsumed by another platform (e.g. Facebook) with which customers have a much stronger engagement.
The trend to self-generation need not be totally negative for retailers if, instead of fi ghting it, they support it and look to earn a margin on the equipment needed and also
an intelligent combination of prequalifi cation rules and fi -nancial securities and penalties.
The further growth of renewable energy also needs to address problems with local resistance to large projects in their communities. In order to overcome resistance on renewable energy projects, information must be given, and locals should ideally be allowed to participate in the economic benefi ts of renewable energy, e.g. by including a measure of local content.
With the growing market share of renewable energy, the market integration and minimisation of system costs be-comes more important: renewable energy needs to be integrated into the spot and intraday markets and might also participate in the ancillary services markets. In case of zero hourly spot prices, renewable energy should be incentivised through a suitable compensation system to be shut down to reduce the amount of negative prices, which otherwise increase risks for future renewable in-vestments. The more renewable energy is exposed to market risk, the more it becomes necessary to limit such risks so that risk premia for investment do not rise.
Grid constraints could also endanger the optimal use of renewable energy; hence, grid access needs to be pro-vided as soon as possible. Grid constraints at all voltage levels need to be reduced to an optimal level to achieve the right balance between their costs and renewable en-ergy curtailment. Also, stronger interconnection between regions or countries can reduce the wind integration cost, as there is less correlation among wind power gen-eration sites when these sites are located further away from each other.
With increasing pressure from auctioning and market price risks, renewable energy operators have to seek competitive advantages from economies of scope and scale in operating suffi ciently large portfolios, negotiating optimal supply contracts with original equipment manu-facturers, optimising their operation and maintenance strategies, and their asset management. Furthermore, in the auctioning process, gaining access to the best sites is crucial, which is helped by land lease agreements and local partnerships.
Financing is potentially a challenge, but the experience so far has been that funds are always forthcoming for good projects within stable regulatory environments.
Grid operators
A perennial and growing challenge is that of obtain-ing acceptability for new overhead cables, as is seen in
ZBW – Leibniz Information Centre for Economics197
Forum
to supply new services, such as those to help custom-ers optimise their own energy systems. The retailers have the advantage of a very large customer base, and thus they ought to be more in tune with their wishes than other prospective market entrants, but they need to be nimble.
Offering new fl exibility services (e.g. demand-side re-sponse, and potentially more services, when some cus-tomers will have batteries installed in a few years) also represents an additional revenue opportunity. But again, there could be challenges from non-utility operators. In the US, for example, a telecommunications company of-fers households a $100 Walmart voucher if they allow their refrigerator to be cycled within a certain tempera-ture band according to the power supply-demand bal-ance.
Conclusion
The above set of challenges shows how the operating en-vironment is continuing to become more diffi cult for the power sector. Society has placed so many different and changing requirements on it that it is diffi cult to provide the necessary consistency and stability for the industry to function effi ciently and be fi nancially positioned to make the investments required. The imperative of de-carbonisation is clear, and now that the main guidelines have been set, along with the ambitious intermediate tar-get to achieve 40 per cent decarbonisation in 2030 vs. 1990 levels (i.e. which entails a 20 per cent reduction in a decade, as compared with the same reduction over three decades through 2020 – and that was with the benefi t of the closures of ineffi cient factories in Eastern Europe), it is now important to provide the maximum stability to the industry and to avoid the temptation for further political interventions. Only then does it stand a chance of pro-viding this vital “oxygen” to society under conditions ac-ceptable to all the stakeholders.