Embed Size (px)
Citation preview
The Future Trends in The Future Trends in Molecular ImagingMolecular Imagingg gg g
Dr Juri Gelovani MD PhDDr. Juri Gelovani, MD, PhD.Professor of Radiology and Neurology
Chairman, Dept. ExperimentalChairman, Dept. Experimental Diagnostic Imaging
Director, Center for Advanced Biomedical Imaging Research (CABIR)(CABIR)

E l & A t Di iE l & A t Di i
Molecular And Genetic Imaging of CancerMolecular And Genetic Imaging of Cancer
Early & Accurate DiagnosisEarly & Accurate Diagnosis•• To follow Biomarker Screening (blood genomics and proteomics)To follow Biomarker Screening (blood genomics and proteomics)•• Develop Imaging of Biomarkers (tumor localization, sensitivity)Develop Imaging of Biomarkers (tumor localization, sensitivity)
Tumor PhenotypingTumor Phenotyping•• Tumor Profiling (receptors & signal transduction, invasiveness, Tumor Profiling (receptors & signal transduction, invasiveness,
metabolism, proliferation, apoptosis, etc.)metabolism, proliferation, apoptosis, etc.)metabolism, proliferation, apoptosis, etc.)metabolism, proliferation, apoptosis, etc.)•• Stroma Profiling (angiogenesis, tissue reStroma Profiling (angiogenesis, tissue re--organization, etc.)organization, etc.)
Imaging for Selection & Monitoring of Therapy Imaging for Selection & Monitoring of Therapy •• Drug Target Expression & ActivityDrug Target Expression & Activity•• Dose OptimizationDose Optimization•• Early Response Evaluation (Rx adjustment)Early Response Evaluation (Rx adjustment)
Sh tSh t t & L T P it & L T P i•• ShortShort--term & Long Term Prognosisterm & Long Term Prognosis•• Monitoring Contained/Chronic Disease statusMonitoring Contained/Chronic Disease status•• Early Detection of RelapseEarly Detection of Relapse

Image GuidedImage-Guided Biopsy
Image-Guided Biopsy, Surgery and Radiotherapy
Image-Guided Radiotherapy

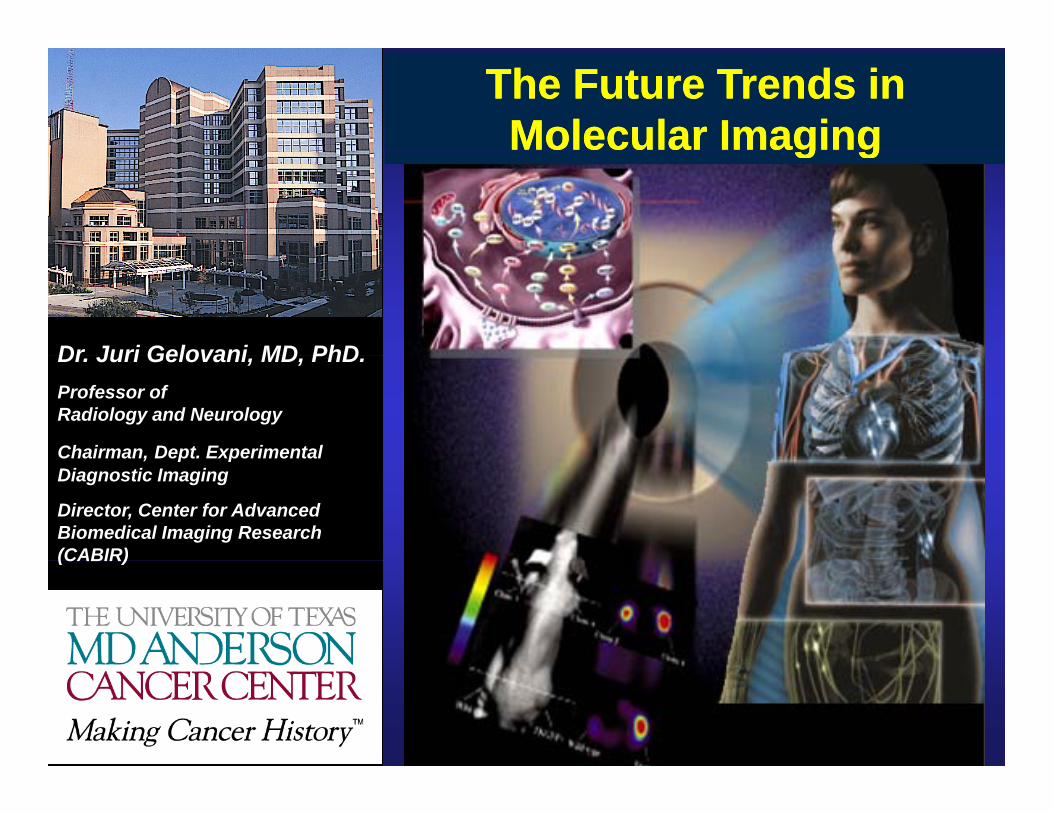
Sentinel lymph node mapping in breast carcinoma patientsSentinel lymph node mapping in breast carcinoma patients
Sentinel lymph node mapping in breast carcinoma patientsSentinel lymph node mapping in breast carcinoma patients

Imaging of angiogenesis in breast tumor
SPECT imaging after injection of 99mTc-RGD peptide
Potential for earlier assessment of response to chemotherapy• Avoid unnecessary cost and toxicity • Switch to alternative treatment soonerSwitch to alternative treatment sooner

C ( G f ) C
Approaches to Optical Imaging of Integrins in Neo-Angiogenesis
Our pipeline:
NN
SO 3H
HO 3S
SO 3H
SO 3H
Cyclo(RGDfK)-Cy5.5 Our pipeline:• MMP9• EGFR• PDGFR• IL11Rα
OLys phe
AspGly
Arg
RGD C 5 5RGD + RGD-Cy5.5 Cy5 5
• IL11Rα
RGD-Cy5.5 1 hr interval Cy5.5
6 l/ 600 l + 6 l 30 l6 nmol/mouse 600 nmol + 6 nmol 30 nmol

Structure of 111In-DTPA-K(IRDye800)-c(KRGDf).
NH
AspGly
ArgOIRdye800
NH
O
HN
O
HN
NH
HN
HN
O
O
NN NCOOH
COOHHOOC
HOOC
O
COOH

Gamma and near-infrared imaging of 111In-DTPA-K(IRDye800)-c(KRGDf) in nude mice bearing s.c. human melanoma.
M21 tumor is positive in integrin αVβ3 expression, while M21-L p g β p ,tumor is negative in αVβ3 expression.

Selective accumulation of 111In-DTPA-K(IRDye800)-c(KRGDf) in M21 melanoma tumors that express integrin αVβ3.
3 P=0.0082
2
Non-blocked P=0 54
1
Non-blockedBlocked
P=0.54
0M21 M21-L
Accumulation of the radiotracer in M21 tumor can be blocked by the parent RGD peptide. On the other hand, preinjection of the parent RGD peptide do not cause significant reduction in the uptake of 111In-DTPA-K(IRDye800)-c(KRGDf) in αvβ3-negative M21-L tumors.DTPA K(IRDye800) c(KRGDf) in αvβ3 negative M21 L tumors.

Development of NIR Imaging Probe for Clinical Applications: RGD Conjugates with TS-ICG DyesApplications: RGD Conjugates with TS ICG Dyes
SO3-
SO3
N N
SO3-
SO3-
+
TS-ICG -c(KRGDf)
Et
CONH-c(KRGDf)
(CH2)5
SO3-
SO3-
N N
SO3-
SO3-
+TS-ICG-c(KRGDf)2
CONH-c(KRGDf)
(CH2)5CONH-c(KRGDf)
(CH2)5
Structures of conjugates of TS-ICG containing one and twomolecules of c(KRGDf) peptide. Ex/Em: 765/796 nm

NIR Imaging using Monomeric and Dimeric RGD Conj gatesRGD Conjugates
TS-ICG-(KRGDf)2

Chemical structure of L-PG-NIR813 or D-PG-NIR813. L- and D-PG-NIR813 differ in their stereoisomeric carbon center (*).
Michaelis-Menten constant s (Km) of the reaction of CB on L-PG-NIR813 ( )with L-PG molecular weight of 17 KD (A) and 56 KD (B).
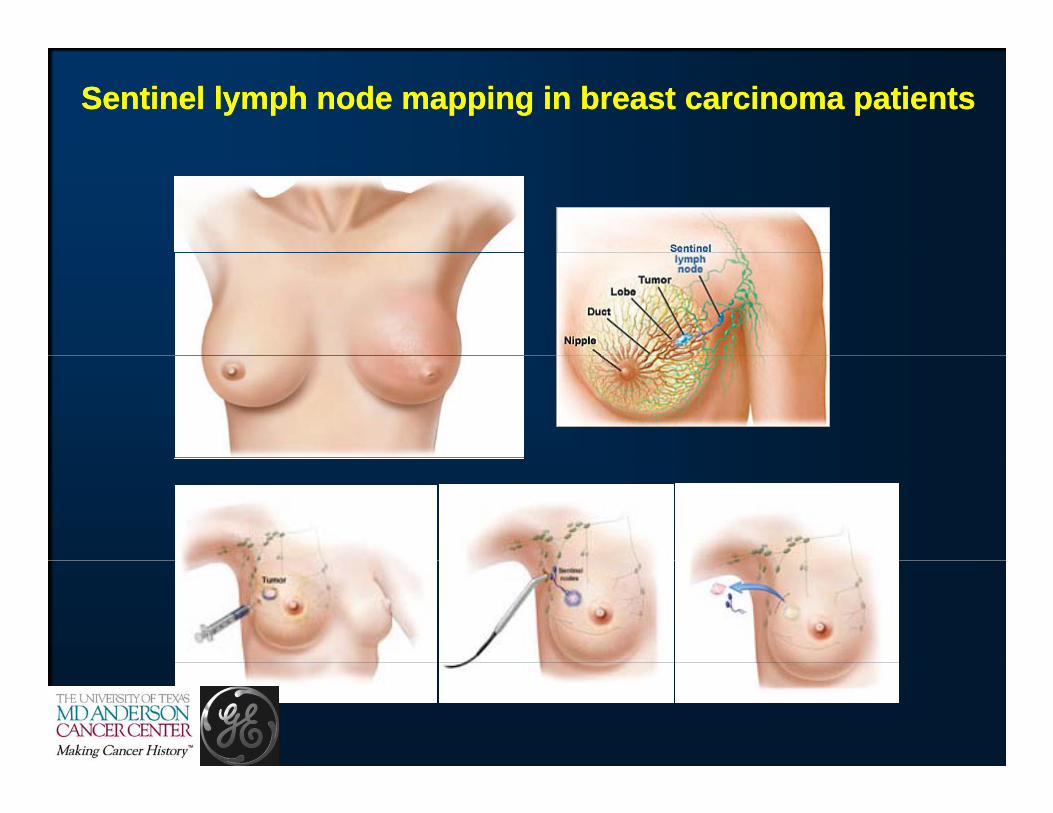
Dose-dependent inhibition of CB-mediated degradation of L-PG-NIR813 by specific CB inhibitor (Inhibitor II).
D d ti f PG NIR813Degradation of PG-NIR813(8.3% loading) by U87 cellsculture for 24 hr (1) and 0 hr(2). Culture medium withoutcells was used as a control (3).

In vivo imaging after intravenous injection of L-PG-NIR813 into U87(TGL) nude mice.
NIRF Images were acquired at 24 hr after i.v. injection of PG-NIR813(50 nmol/mouse, 17 KD, 8.3 % loading). Note the mouse injectionwith L-PG-NIR813, but not the mouse injected with D-PG-NIR813,exhibits strong NIRF signal.

Co-localization of PG-GdDTPA-NIR813 with isosulfan blue (A-D).
Microphotographs of representative resected lymph node confirming the uptake ofPG-GdDTPA-NIR813 in the LN (E-H). E: H&E stained tissue section. F: DIC image.G NIRF i H O l f th DIC d NIRF i NIRF i l iG: NIRF image. H: Overlay of the DIC and NIRF images. NIRF signal ispseudocolored green, and DIC pseudocolored red. Original magnification: 50x.

Dual MR/optical imaging of the axial and branchial lymph nodes in normal athymic nude mice.
(A) Pre-contrast overlay of white light and NIRF images. (B) Overlay of white light and NIRF images 1 hr after injectionof PG-GdDTPA-NIR813 (0.002 mM/L Gd/kg). (C) NIRF image of the same mouse without skin. (D) Resected lymphnodes showed bright fluorescence signal. E-F: Representative T1-weighted axial MR images at different times. PG-GdDTPA-NIR813 was injected at a dose of 0.02 mmol Gd/kg (E) and 0.002 mmol Gd/kg (F). The arrows indicate SLN.

Visualization of cervical lymph nodes after interstitial injection of PG-GdDTPA-NIR813
PG-GdDTPA-NIR813 (0.02 mmol Gd/kg) was injected into the tongue of a normal mouse (A-D) and a mouse with ahuman DM14 oral squamous carcinoma tumor grown in the tongue (E-H). H&E stained lymph node sections (I-K)indicating the presence of micrometastases (J) and presumably in-transit metastases in lymphatic duct (K). Notethe difference in the pattern of lymph node enhancement between normal (A) and metastatic (E) nodes in T1-weighted MRI.

Detection of Tumors by fMolecular Imaging of
Metabolic Shifts

Comparative PET Imaging of Prostate Carcinomas with Comparative PET Imaging of Prostate Carcinomas with 1818FF--FDG and FDG and 1111CC--AcAc
PET images of prostate, lymph node, and bone metastases obtained using 18F-FDG and 11C-Ac from 73-y-old man with poorly differentiated (Gleason sum 7)adenocarcinoma of prostate.adenocarcinoma of prostate.
(A) 18F-FDG PET shows low uptake in prostate, with SUV of 2.87.
(B and C) 18F-FDG uptake in left iliac lymph node metastatic lesion (B) and rightpubic bone metastatic lesion (C).
(D–F) 11C-Acetate PET shows high uptake in prostate (D), with SUV of 5.45; in leftiliac lymph node metastatic lesion (E); and in right pubic bone metastaticlesion (F). bn = bone; ly = lymph node; pr = prostate.
Oyama, et al. J Nucl Med (2002)

Metabolism of Fluoro-Acetate
Aconitase
GlycolysisFDG
Fatty Acid SynthesisF-Acetate

In vitro In vitro 33HH--Acetate and Acetate and 1414CC--Fluoroacetate DualFluoroacetate Dual--Label Radiotracer Label Radiotracer Accumulation Studies in Breast Carcinoma Cell LinesAccumulation Studies in Breast Carcinoma Cell Lines
SKBr3
6.0
MB231
6.0
2 0
3.0
4.0
5.0
ell/M
ediu
m
3H-Acetic Acid
14C-F-Acetic Acid
Linear (3H-AceticAcid) 2.0
3.0
4.0
5.0
C/M
Rat
io
3H-Acetic Acid
14C-F-Acetic Acid
Linear (3H-AceticAcid)
0.0
1.0
2.0
0 50 100 150 200
Tim e
C
Linear (14C-F-Acetic Acid)
0.0
1.0
2.0
0 50 100 150 200
Tim e
Linear (14C-F-Acetic Acid)
Tim e e
SKOV3
5.0
6.03H-Acetic Acid
1.0
2.0
3.0
4.0
C/M
/Rat
io 14C-F-Acetic Acid
Linear (3H-AceticAcid)
Linear (14C-F-Acetic Acid)
0.00 50 100 150 200
Tim e
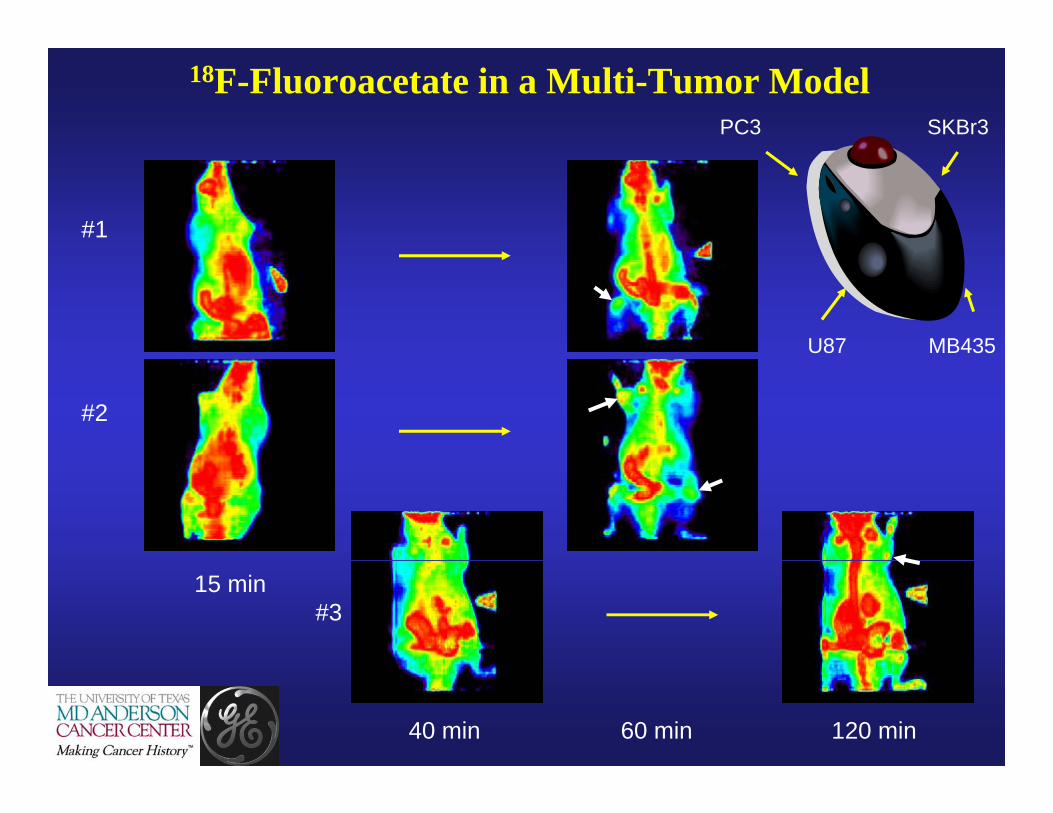
18F-Fluoroacetate in a Multi-Tumor ModelSKBr3PC3
#1
MB435U87
#2
#315 min
40 min 60 min 120 min

Kinetics of [18F]-FAc derived radioactivity accumulation (tumor/muscle ratio) in different tumors
10
Accumulation of F-18 fluoroacetatein mice bearing human carcinoma xenografts
PC3PC3SKBr3U87MB435
Log
(Rat
ios)
L
15 40 60 1201
Time (min)

STAGES OF IMAGING AGENT DEVELOPMENTSTAGES OF IMAGING AGENT DEVELOPMENT

Dynamic PET/CT Imaging of [18F]-FA
Mouse Macaque

Kinetics of Biodistribution of 18F-FAc in Monkeys
1.000%
BloodLiver
0.100%
LiverKidneyLungBone
%ID
/g
BoneMuscle
0.010%
0.001%0 20 40 60 80 100 120 140 160 180 200
Time (min)

Analysis of Blood Plasma MetabolitesAnalysis of Blood Plasma Metabolites
0.100%
1.000%
D/g
Whole BloodF 18 FA
0 001%
0.010%
%ID F-18 FA
F-
0.000%
0.001%
0 50 100 150 2000.050%
0.060%
%ID
/g
Whole BloodF-18 FA
Time (min)
0.020%
0.030%
0.040% F-
0.000%
0.010%
0 50 100 150 200
Ti ( i )Time (min)

Pharmacological Dose Estimates for [18F]Fluoroacetate
Calculated Specific Activity and Mass. The total mass per dose and specific activity of 18F-fluoroacetate prepared via no-carrier added synthesis were calculated as follows:
Avogadro's Number 6.02E+231Ci in Bq 3 70E+101Ci in Bq 3.70E+10Lambda (decay constant) 0.000105022 Molecular weight of the compound 78Isotope T1/2 (sec) 6600Dose in mCi 10Dose in mCi 10 N of atoms per dose 3.52306E+12Moles per dose 5.85E-12Total weight per dose (g) 4.56E-10 Calculated Sp.Act. (Ci/mol) 1.71E+09p ( )
The fluoroacetate used for imaging may have a mass of 0.456 ng which is about 1/1000 of fluoroacetate that may be present in a cup of tea.

Phase I study using PET/CT with 18FPhase I study using PET/CT with 18F--FAcetate in FAcetate in Tumors that don’t avidly accumulate FDGTumors that don’t avidly accumulate FDGTumors that don t avidly accumulate FDG Tumors that don t avidly accumulate FDG
• Prostate carconoma, lymph node metsBreast carcinoma lobular lymph node mets• Breast carcinoma, lobular, lymph node mets
• Brain tumors, GBM
30 patients (10 patients per tumor type)30 patients (10 patients per tumor type)30 patients (10 patients per tumor type)30 patients (10 patients per tumor type)
Primary objectives:PharmacokineticsRadiolabeled metabolitesBiodistributionRadiation dosimetryDose optimizationDose optimization
Secondary objectives:Feasibility of tumor detectionFeasibility of tumor detection as compared to CT and MRI or biopsy
TUMOR DETECTION:TUMOR DETECTION:
NEW IMAGING AGENTS NEW IMAGING AGENTS
FORFOR
STROMAL BIOMARKERSSTROMAL BIOMARKERS

Pancreatic Carcinoma: Problems in Diagnosis & Therapy
•• PancreaticPancreatic cancercancer patientspatients seldomseldom exhibitexhibit diseasedisease--specificspecificsymptomssymptoms untiluntil latelate inin thethe coursecourse ofof thethe diseasedisease processprocess
•• DespiteDespite significantsignificant advancesadvances inin thethe treatmenttreatment ofof manymany otherother humanhumantumors,tumors, thethe 55--yearyear survivalsurvival raterate inin pancreaticpancreatic cancercancer remainsremains <<55%%..
•• AtAt present,present, nono imagingimaging modalitymodality isis sensitivesensitive forfor visualizationvisualization ofof earlyearlystagestage pancreaticpancreatic carcinomascarcinomas oror smallsmall metastasesmetastases inin thethe lymphlymph nodes,nodes,peritoneum,peritoneum, andand onon thethe surfacesurface oror withinwithin thethe liverliver..
•• NovelNovel biomarkerbiomarker screeningscreening andand diagnosticdiagnostic imagingimaging methodsmethods forforpotentialpotential earlierearlier detectiondetection andand localizationlocalization ofof pancreaticpancreatic carcinomascarcinomasmustmust bebe developeddeveloped inin conjunctionconjunction withwith newnew imageimage guidedguided therapiestherapies thatthatmustmust bebe developeddeveloped inin conjunctionconjunction withwith newnew imageimage--guidedguided therapiestherapies thatthatwouldwould eradicateeradicate earlyearly neoplasticneoplastic lesionslesions ifif survivalsurvival fromfrom thisthis diseasedisease isistoto bebe improvedimproved..
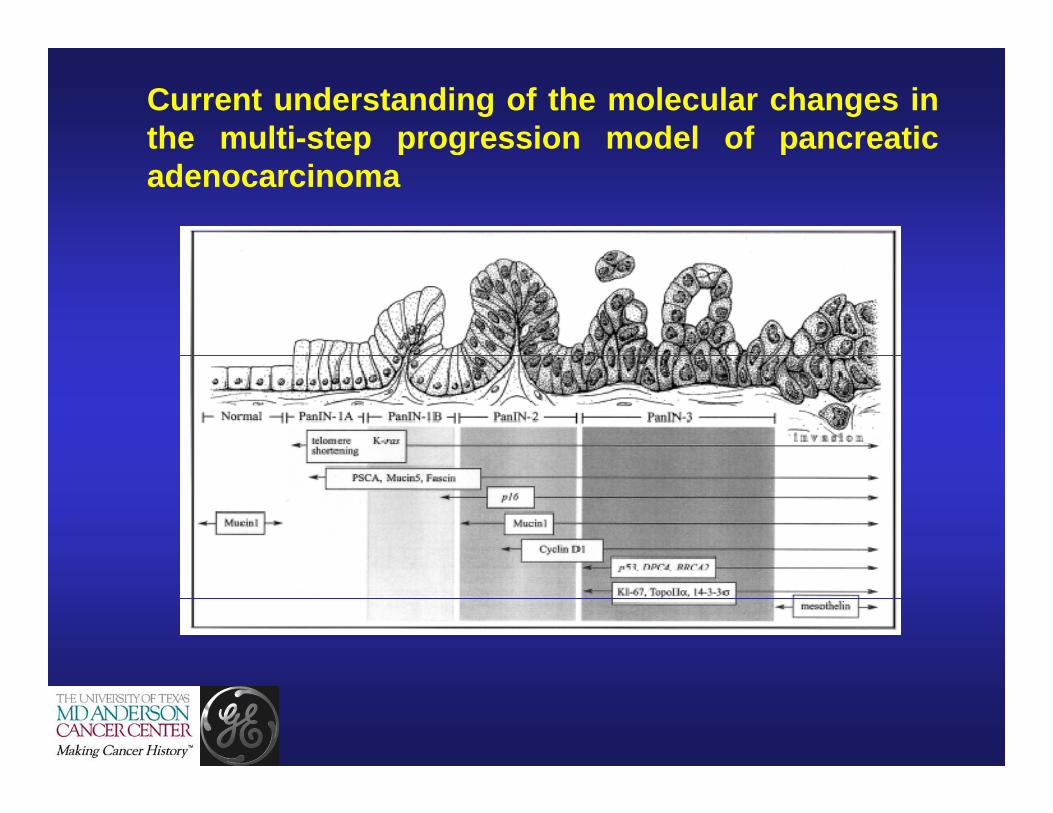
Current understanding of the molecular changes inthe multi-step progression model of pancreaticp p g padenocarcinoma

Molecular Imaging of Stromal Biomarkers: Volume Amplification Approach
1 mm 5 mm
Volume Amplification Approach
Intraepithelial NeoplasiaPeritumoral TissueNormal Tissue

Gene Expression in parenchyma adjacent to infiltrating pancreatic ductal adenocarcinoma and chronic pancreatitis
(Fukushima, et al. Mod Pathol 18, 779-787, 2005)

HO OA
Synthesis of a precursor Radiolabeling of [18F]-Lactose
Synthesis of [18F]-Lactose
OHO
HO OH
HO
OH
OOH
HO
SPh
OO
PMPOAcO
AcO OAc
AcO
SPh
1) Ac2O, NaOAc 120 deg, 2h
2) PhSH, BF3-Et2O rt, 5 h
1) NH3, MeOH rt, overnight
2) 4-MeO-PhCH(OMe)2
p-TsOH, 60 deg, 3h
nBu2SnOOH
1 2 3
OOBn
OPMPNaH BnBr
BSP, TTBP
OAcO
OAc
OAcAcO
OOTf
BzO
BzOO
OEtBu4N18F O
AcOOAc
OAcAcO
OBzO
BzOO
OEt18F
OHHO
80¡ãC, 15m
13 16
reflux, 3h
Bu4NI, PMBClreflux 2h
OOH
PMBO
SPh
OO
PMP
4
OPMBO
SPh
ONaH, BnBr
reflux, 2h
5
3 A MS, -60 deg
Tf2O, EtOH
OOBn
OO
PMP
OEt OOBn
HOHO
Ac2O, 1hnBu2SnOreflux, 3h O
OBnPMBO
HOOEt
NaOMeO
HOOH
OHHO
OHO
HOO
OEt18F80¡ãC, 5m
17
ADC1 A ADC1 CHANNEL A (LG\LG000009 D)
Co-injection of purified 16 with cold version of 14PMBO OEt O
PMBOHO
OEt Bu4NI, PMBClreflux 2h6 7
PMBO OEt
8
OAcO
OAc
OAcAcO
SEt9
OAcO
OAcAcO
OOBn
PMBO
PMBOO
OEt1) DDQ, rt, 1h O
AcO
OAcAcO
OOBn
B O
BzOO
OEt
min2 4 6 8 10 12 14 16
mAU
0
200
400
600
800
1000
1200
1400
1600
ADC1 A, ADC1 CHANNEL A (LG\LG000009.D)
6.0
72
11.
206
mAU
-8.5
-8
DAD1 A, Sig=254,4 Ref=360,100 (LG\LG000009.D)
10.
988
NIS, TfOHAcO
OAcPMBO OEt
10
2) BzCl, Py, 5h AcOOAc BzO OEt
11
H2, 10% Pd/C OAcO
OAc
OAcAcO
OOH
BzO
BzOO
OEtTf2O, Py O
AcOOAc
OAcAcO
OOTf
BzO
BzOO
OEtrt, 3hrt, 12 h
min2 4 6 8 10 12 14 16
-10.5
-10
-9.5
-9
mAU
ADC1 A, ADC1 CHANNEL A (LG\LG000009.D)
QC Chromatogram of compound 17
12OAc
13
rt, 3h
Bu4NFO
AcOOAc
OAcAcO
OBzO
BzOO
OEt
14F
NaOMeO
HOOH
OHHO
OHO
HOO
OEtF
80¡ãC, 15mReflux, 20m
min2 4 6 8 10 12 14 16
0
200
400
600
800
1000
1200
1400
1600
6.0
72
11.
206
mAU
1200
1400
1600
DAD1 A, Sig=254,4 Ref=360,100 (LG\LG000009.D)
14 15
min2 4 6 8 10 12 14 16
0
200
400
600
800
1000
1200
10.
988

PET imaging of pancreatic carcinoma
Axial Coronal Saggittal
TumorBloodMuscle
PET imaging of mice bearing orthotopicMPanc96 human pancreatic cacinoma
ft d t t d hi h t tixenografts demonstrated higher retentionof [18F]FDL (100 uCi i.v.) in the tumor-invaded pancreas, which correspondedwith high levels of HIP/PAP proteinexpression in the peritumoral pancreatictissue as evidenced by comparative
Time-activity curvesPAP immunostain provided by Dr. Craig Logsdon, MDACC
tissue, as evidenced by comparativeimmunohistochemical analysis in situ.The [18F]FDL was eliminated via the renalclearance.
Dr. Craig Logsdon, MDACC

Molecular Imaging of Drug Target Expression-Activity: Selection of Therapy

Current Diagnostic – Therapeutic Paradigm
24 - 48 hours2 monthsPET/CT
XTherapy “A”
FDG, FLTFDG, FLT
Therapy “B”

Mechanisms of selectivity of EGFR kinase imaging agent
Inactive Enzyme Active EnzymeInactive Enzyme Active Enzyme
PO4Cys773Cys773Cys773Cys773

Molecular Imaging Agent for Imaging EGFR kinase expression/activity


NonNon--invasive molecular imaging of EGFR expressioninvasive molecular imaging of EGFR expression--activity with activity with 124124II--mIPQAmIPQA PET/CTPET/CT in orthotopic U87 glioma xenografts in micein orthotopic U87 glioma xenografts in mice
uPET/uCT uPET
uCTU87 gliomaBrainHeart (blood)

Non-invasive molecular imaging of EGFR expression-activity with 124I-mIPQA PET/CT in intracerebral U87 glioma xenografts in mice
Wild-type EGFR + EGFRvIII mutant
U87EGFRvIII gliomaBrainHeart (blood)
U87 gliomaBrainHeart (blood)
Tumor EGFR Tumor EGFRk1
k2
k3
k4Blood
Tumor EGFRk1
k2
k3
k4Blood
Tumor EGFR

NSCLC GL ith INSCLCs - GL with Iressa
3PC 14GL
2
PC-14GLH-441GLH 3255GLH-1975GLT-
1
1
WST
-2 -1 0 1 2 30
Iressa μM (log scale)
EC50
PC-14GL45.84
H-441GL46.19
H 3255GL1.598
H-1975GL25.09
Iressa μM (log scale)
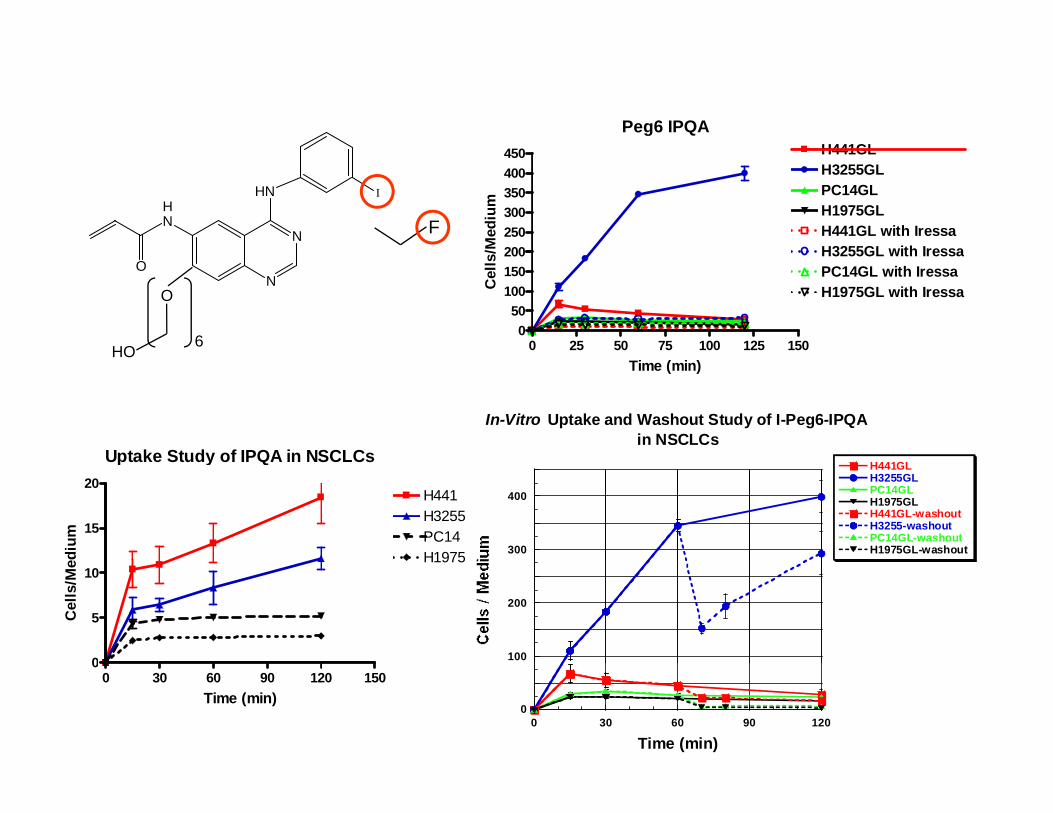
Peg6 IPQA450 H441GL
200250300350400450 H441GL
H3255GLPC14GLH1975GLH441GL with IressaH3255GL with Iressa/M
ediu
m
FN
HNHN
I
0 25 50 75 100 125 1500
50100150200 H3255GL with Iressa
PC14GL with IressaH1975GL with IressaC
ells
/
NO
O
HO 6
In-Vitro Uptake and Washout Study of I-Peg6-IPQAin NSCLCs
Time (min)HO
Uptake Study of IPQA in NSCLCs
300
400
H441GLH3255GLPC14GLH1975GLH441GL-washoutH3255-washoutPC14GL-washoutH1975GL-washout
Uptake Study of IPQA in NSCLCs
15
20H441H3255
H1975PC14
ediu
m
100
200
0
5
10H1975
Cel
ls/M
e
00 30 60 90 120
Time (min)
0 30 60 90 120 1500
Time (min)

H3255GL%ID/g
5.0
%ID/g5.0
H441GL
%ID/g
0
Axial
1.0
0
C l0
%ID/g5.0
BaselineCoronal
%ID/g5.0
Axial
0
%ID/g1.0
3h
0
With InhibitorInhibitor: gefitinib, 100mg/kg,i.p.
1h prior to the radiotracer
0
Coronal

H441GLH3255GL
%ID/g1.0
%ID/g1.0
%ID/g5.0
Axial Axial
%ID/g
0
C lC l
1.0
0
CoronalCoronal
%ID/g1.0
00
%ID/g5.0
Baseline
AxialAxial
%ID/g1.0
%ID/g1.0
0
3h 24h
Coronal Coronal0
00
With InhibitorInhibitor: gefitinib, 100mg/kg,i.p.
1h prior to the radiotracer

A Paradigm for Therapy Selection and Monitoring by Imaging (Part II)A Paradigm for Therapy Selection and Monitoring by Imaging (Part II)
After 1 cycleAfter 1 cycleAfter 1 cycle After 1 cycle (or @ 24(or @ 24--72h)72h)
ChemoChemo-- ChemoChemo--FDGFDGFDGFDG
PET/CT
RadiationRadiation
kk--Ras Ras inhibitorinhibitor
RadiationRadiation
kk--Ras Ras inhibitorinhibitor
FDGFDGFLTFLTEGFREGFR
kk--Ras mutantRas mutant
FDGFDGFLTFLTEGFREGFR
PET/CT
Key Imaging Targets:Key Imaging Targets:EGFR, DNA synth.EGFR, DNA synth.
EGFR InhibitorEGFR Inhibitor EGFR InhibitorEGFR InhibitorFDGFDGGGEGFR mutantEGFR mutant
EGFR InhibitorEGFR Inhibitor EGFR InhibitorEGFR InhibitorFDGFDGFLTFLTEGFREGFR
FDGFDGFLTFLTEGFREGFR

Integration of Molecular Imaging, Interventional Radiology, and Tumor BiomarkersIntegration of Molecular Imaging, Interventional Radiology, and Tumor Biomarkers
HISTOPATHOLOGYHISTOPATHOLOGYImmunohistochemistryImmunohistochemistry
PET/CT ImagingPET/CT ImagingTumor LysateTumor LysateArraysArraysPK/PD ModelingPK/PD Modeling
Parametric ImagingParametric ImagingParametric ImageParametric Image--GuidedGuidedBiopsy (or Intraoperative)Biopsy (or Intraoperative)
microPET/CT ImagingmicroPET/CT ImagingDrug TargetDrug Target
GENOMICSGENOMICS
microPET/CT ImagingmicroPET/CT Imaging
Structural Structural BiochemistryBiochemistry
RadiolabelingRadiolabeling
In Silico In Silico ModelingModelingCyclotronCyclotron
RadionuclidesRadionuclides
New ChemistryNew ChemistryRadiotracerRadiotracerPrecursorsPrecursors HT/HC ScreningHT/HC Screning